Supplemental Data A Complete Neandertal Mitochondrial Genome Sequence Determined by High-Throughput...
27
1 Cell, Volume 134 Supplemental Data A Complete Neandertal Mitochondrial Genome Sequence Determined by High-Throughput Sequencing Richard E. Green, Anna-Sapfo Malaspinas, Johannes Krause, Adrian W. Briggs, Philip L.F. Johnson, Caroline Uhler, Matthias Meyer, Jeffrey M. Good, Tomislav Maricic, Udo Stenzel, Kay Prüfer, Michael Siebauer, Hernán A. Burbano, Michael Ronan, Jonathan M. Rothberg, Michael Egholm, Pavao Rudan, Dejana Brajković, Željko Kućan, Ivan Gušić, Mårten Wikström, Liisa Laakkonen, Janet Kelso, Montgomery Slatkin, and Svante Pääbo Supplemental Experimental Procedures Assembly of the mtDNA sequence Mitochondrial DNA sequences were identified amongst all sequence reads using the following criteria: First, each sequence was required to be > 30 nucleotides long and show > 90% identity to the reference human mtDNA sequence (GI:17981852) or against a version of this sequence where the HVRI had been substituted for the Vindija-80 HVRI when compared by megablast (-b10 –v 10 –U F –I T –e 0.001 –F F –a 1 -D 2 –W 16). Second, alignment bit scores were required to be at least as high as the best scoring alignment against the human nuclear genome. All such mtDNA fragment were then semi-globally aligned to the reference human mtDNA sequence and merged using the human mtDNA to order and orient each mtDNA fragment. Recent insertions into the nuclear genome of mtDNA fragments may in these analyses be mistaken as being of organellar origin. However, given that 10.5 kb of the 3.2 Gb human nuclear genome are mtDNA insertions that occurred on the human lineage since the divergence from the chimpanzee lineage (Hazkani-Covo and Graur, 2007) and that the ratio of nuclear to mtDNA sequences among our reads is 171 to 1,
-
Upload
uni-tuebingen -
Category
Documents
-
view
3 -
download
0
Transcript of Supplemental Data A Complete Neandertal Mitochondrial Genome Sequence Determined by High-Throughput...
1
Cell, Volume 134
Supplemental Data
A Complete Neandertal Mitochondrial
Genome Sequence Determined
by High-Throughput Sequencing Richard E. Green, Anna-Sapfo Malaspinas, Johannes Krause, Adrian W. Briggs, Philip L.F. Johnson, Caroline Uhler, Matthias Meyer, Jeffrey M. Good, Tomislav Maricic, Udo Stenzel, Kay Prüfer, Michael Siebauer, Hernán A. Burbano, Michael Ronan, Jonathan M. Rothberg, Michael Egholm, Pavao Rudan, Dejana Brajković, Željko Kućan, Ivan Gušić, Mårten Wikström, Liisa Laakkonen, Janet Kelso, Montgomery Slatkin, and Svante Pääbo
Supplemental Experimental Procedures
Assembly of the mtDNA sequence
Mitochondrial DNA sequences were identified amongst all sequence reads using the
following criteria: First, each sequence was required to be >30 nucleotides long and
show >90% identity to the reference human mtDNA sequence (GI:17981852) or
against a version of this sequence where the HVRI had been substituted for the
Vindija-80 HVRI when compared by megablast (-b10 –v 10 –U F –I T –e 0.001 –F F
–a 1 -D 2 –W 16). Second, alignment bit scores were required to be at least as high
as the best scoring alignment against the human nuclear genome. All such mtDNA
fragment were then semi-globally aligned to the reference human mtDNA sequence
and merged using the human mtDNA to order and orient each mtDNA fragment.
Recent insertions into the nuclear genome of mtDNA fragments may in these
analyses be mistaken as being of organellar origin. However, given that 10.5 kb of the
3.2 Gb human nuclear genome are mtDNA insertions that occurred on the human
lineage since the divergence from the chimpanzee lineage (Hazkani-Covo and Graur,
2007) and that the ratio of nuclear to mtDNA sequences among our reads is 171 to 1,

2
the ratio of mitochondrial DNA insertions to real mtDNA in our assembly will be 171
x 10.5e3 / 3.2e9 = 0.00056. Thus, only about 5 of 8,341 sequences are expected be
both of nuclear origin and of recent enough origin to be mistaken for a bona fide
mtDNA fragment. An even smaller amount is expected to have occurred on the
Neandertal lineage. Consequently, nuclear mtDNA insertions of recent origin are not
expected to confuse the assembly where the coverage is on average 34.9-fold.
Furthermore, in total, the human genome (hg18) harbors 584,469 nt of sequence that
aligns to the human mtDNA at e-value cutoff of 0.01 and is therefore likely nuclear
mtDNA insertion. However, when this sequence is fragmented to a length of 69 nt to
match our average fragment length, >99% of these fragments are distinguishable as
nuclear mtDNA insertions by our selection criteria as they have more similarity to the
human nuclear genome than to either the Neandertal mtDNA genome or the human
mtDNA genome. Therefore, nearly all nuclear mtDNA insertions within the human
genome occurred long enough ago to have acquired sequence differences that
distinguish them from mtDNA.
Finally, each of the 87 lowest coverage bases of the assembly, i.e., between 9-
fold (the minimum observed) and 12-fold coverage, has unanimous support except 14
positions. For each of these positions, the consensus base is C or G where T and A,
respectively, are also seen among the reads. The most equivocal site among these
lowest coverage positions is 5,476 of the assembly where 8 reads indicate C and 3
reads indicate T. Of the three reads indicating a T (ET3T7CE02FJQ1D,
ET5PHBM02JBEPI, ES5TZGK01CATHR) each had a better-scoring alignment
overall against the Neandertal mtDNA assembly than the best scoring nuclear
genome alignment, indicating that each was likely due to deamination-associated
misincorporations instead of a nuclear mtDNA insertion. Therefore, because of the

3
high coverage and internal consistency of the assembly, nuclear mtDNA insertions
are not expected to affect the assembled sequence.
For each position in the multiple-sequence alignment at which coverage is >2-
fold, the majority base is called as the Neandertal base, if a majority exists. In this
way, each Neandertal mtDNA sequence position is supported by at least two
independent reads. Initially, there were 8 contiguous regions for which coverage was
0- or 1-fold. PCR primers flanking these regions were designed and used to generate
more sequence coverage (see DNA Amplification, below). Similarly, all positions for
which no majority initially existed within the 454 reads were directly amplified.
Because of the difficulty in determining the correct length of long
homopolymers (runs of the same base) by pyrosequencing, where each homopolymer
generates a single signal whose intensity is proportional to the length of the
homopolymer, we analyzed each mtDNA homopolymer. The “flow value” signals are
scaled and normalized for each run by the 454 base-calling software so that flow
values can be compared across runs. For each homopolymer of each base of length
four or greater (in the human reference mtDNA) we analyzed the distribution of flow
values for Neandertal mtDNA reads that covered the corresponding position. At
length five or greater, the flow value distribution was observed to be subtly but
consistently lower than expected. Therefore, we calculated an odds-ratio that each
homopolymer length was actually 5 or 6 nucleotides long by computing the following
log-odds ratios:
log(P(length>=5) / P(length<=4))
log(P(length<=5) / P(length>=6))
log(P(length<=6) / P(length>=7))

4
The probability of a homopolymer being greater-than or equal to a given length was
determined by finding the fraction of the distribution of observed signal intensities for
the length under consideration that is greater than the signal intensity under
consideration. The overall probability for a given homopolymer position was found
by taking the product of the probability of each read that overlapped that
homopolymer.
If this odds-ratio indicates that a specific length was at least 100 times more
likely than being one greater or one less than the length under consideration then that
length was called. If not, we designed primers for direct amplification and Sanger
sequencing. In many cases, these positions were within or near regions that initially
had single coverage. In total, 33 regions were amplified and sequenced.
DNA amplification
For gap closing and resolving ambiguous positions, we performed two-step multiplex
PCRs (Krause et al., 2006) from 5 µl of bone extract in a total volume of 20 µl. In the
first step, 35, and in the second step, 30, cycles of PCR were carried out. Four
multiplex primer sets were designed comprising between 6 and 15 primer pairs that
amplify between 57 and 72 bp long fragments (see Supplemental Table 1). Annealing
temperatures varied between 52°C and 58°C for the different multiplex primer sets.
Three primer pairs that span positions diagnostic for Neandertal mtDNA were
included in each multiplex PCR in order to monitor the level of contaminating extant
human DNA in each reaction. Amplification products from each of the Neandertal-
informative products from all four multiplex mixes were cloned using the TOPO TA
cloning Kit (Invitrogen) and a minimum of 100 clones from each product sequenced.
The percent of modern human sequences varied between 8% and 16%. Higher levels

5
of contamination are often seen when large numbers of primers are pooled. Each of
the 33 target regions was amplified at least twice, cloned and at least 5 clones from
each product sequenced on an ABI3730 capillary sequencer (Applied Biosystems).
Given a maximum contamination level of 16%, the majority among 5 are expected to
be endogenous to the specimen (P<0.05). We did not find any difference in the
consensus sequences from the two amplifications of each target replicate, making the
risk that both replicates of a target region represents a contaminant small (P<0.01).
The 33 consensus sequences were assembled with the mtDNA fragments determined
by 454 sequencing and using the assembly, we identified a total of 8,341 mtDNA
sequences in the 454 data. They cover each assembly position at least 9 times. There
was complete agreement in the final assembly between the targeted PCR-determined
positions and those determined solely by the 454 reads.
Tree reconstruction.
To estimate phylogenetic trees, we first aligned the complete mtDNA of Neandertal
(EMBL: AM948965), 53 human mtDNAs (GI:AF346963-AF347015), the human
rCRS (GI:AC_000021.2), and chimpanzee (Pan troglodytes, GI:NC_001643.1) and
bonobo mtDNAs (Pan paniscus, GI:NC_001644.1) as outgroups, using MUSCLE
v3.6 (Edgar, 2004) with default parameters. We used neighbor-joining (NJ) and
maximum parsimony (MP) as implemented in PAUP* (Swofford, 2003), maximum
likelihood (ML) as implemented in RAxML 7.0.0 (Stamatakis, 2006), and a Bayesian
approach using MrBayes 3.1.2 (Ronquist and Huelsenbeck, 2003). Support for nodes
was assessed using 10,000 bootstrap pseudoreplicates for NJ and ML and 100 for
MP.

6
For the NJ tree (54 humans, one chimpanzee, one bonobo and the Neandertal
whole genomes) we used GTR distances and gamma distributed rates across sites
with alpha parameter 0.2 (set criterion=distance; dset distance=GTR rates=gamma
shape=0.2;). For the MP tree we used default parameters. For the ML trees we used
the “GAMMA” model for estimation of the phylogeny and the “CAT” model for
rapid bootstrapping (-m GTRGAMMA -x 1245 -f a -#10000). Finally, for the
Bayesian method we used a GTR model of substitution and a gamma distribution of
rates across sites (lset nst=6 rates=gamma) for all trees. We ran 4 chains for 4 million
generations sampling every 100 generations and discarded 10,000 samples as a burn-
in (mcmc ngen=4000000; sumt burnin=10000; sump burnin=10000;).
Second, we estimated trees with a ML and a Bayesian approach partitioning
the data in the following subsets: non-coding (including the control region), tRNAs,
rRNAs, 1st, 2nd, and 3rd codon positions of the heavy and light strands. Finally, we
built a tree for three subsets of the data separately: all tRNAs, all rRNAs and all
proteins, again by ML or a Bayesian approach. We used a GTR model of substitution
and a gamma distribution of rates across sites for all data sets. For this approach, we
unlinked the partitions and we ran 6 chains for 20 million generations discarding
50,000 samples as burn-in (prset ratepr=variable; unlink shape=(all) revmat=(all);
mcmc Ngen=20000000 Nchains=6; sumt burnin=50000; sump burnin=50000;). To
ascertain convergence we looked at the standard deviation of split frequencies (below
0.01 in all cases) and the potential scale reduction factor (close to 1 in all cases).
Divergence times.
To estimate mtDNA divergence times, we pruned our sampling of modern
humans to 10 genomes, selected so that the internal nodes had a 1.00 posterior

7
probability on the Bayesian whole genome tree. This sampling allows an estimate of
the mtDNA TMRCA for modern humans as well as the TMRCA for modern humans
and Neandertal. We selected a best-fit substitution model using the Akaike’s
information criterion on all models available in the baseml program of PAML 4
(Yang, 2007). The best fitting models were found to be GTR+Γ5 for the whole
genome and TN93+Γ5 for the partitioned data. We used the program baseml (Yang
2007) to test if the data were consistent with a molecular clock using a likelihood
ratio test (LRT). We failed to reject the molecular clock hypothesis for both the
unpartitioned (2∆l=9.27 and p-value=0.507) and the partitioned data (2∆l=8.67 and p-
value=0.564).
We then used the program mcmctree (Yang and Rannala, 2006) to estimate
the posterior distribution of the divergence times, assuming that the chimpanzee-
bonobo clade diverged from humans and Neanderthals 6-8 million years ago (gamma
distributed prior; >0.6=0.7 <0.8 in the tree file). We computed the posterior
distribution for both the whole genome (unpartitioned) and a partitioned dataset (see
Supplemental Table 5). Since the best-fit models GTR and TN93 are not
implemented in mcmctree, we used the closest, most complex model HKY85 (model
= 4). We assumed a molecular clock (clock = 1) and a gamma distribution of rates
across sites with 5 categories (alpha = 0.2; ncatG = 5). We explored a range of
speciation scenarios and found that the specified prior distribution of the birth death
process had a slight impact on our estimates of divergence times (e.g., less than 10%
for the Neandertal divergence time estimate). Given that the underlying speciation
model is not known, we chose to present divergence time estimates based on an
uninformative (flat) prior distribution for the birth death process (BDparas = 2 2
.001). For the prior distribution of the evolutionary parameters we assumed a gamma

8
distribution centered at 0.2 for alpha (alpha_gamma = 1 5), at 5 for kappa
(kappa_gamma = 0.05 0.01) and 0.01 for the rate of substitution (rgene_gamma =
0.01 1). We generated three Markov chains with a length of 1 million for the
iterations for the unpartitioned case (respectively 100 millions for the partitioned
case) with different starting values and assessed convergence of the chains following
Gilks et al. (1996). This included plotting the running mean of multiple sequences
with over-dispersed starting points, analyzing the Gelman-Rubin statistic and the
autocorrelations. After discarding an initial burn-in of 500,000 iterations for both
cases only every 30th sample (respectively 100th for the partitioned cases) of each
chain was saved due to high autocorrelations. These samples of the two chains were
then combined for the summary statistics. All control files are available by request.
Analysis of Neandertal branch length.
We used an LRT to test if the Neanderthal branch was significantly shorter than the
extant human branch. We performed 54 tests with baseml (Yang, 2007) using whole
mtDNA genomes for one human, the Neandertal, one chimpanzee, and one bonobo.
We assumed as a null hypothesis that the rates of all clades were equal and as an
alternative that the Neandertal had a rate different than the chimpanzee or human.
Using a Bonferroni correction on 54 tests, we could not reject the null hypothesis for
any of these tests (p-values ranging from 0.0095 to 0.29).
Analysis of protein-coding regions.
We aligned Neandertal, human rCRS, chimpanzee, bonobo, gorilla (Gorilla gorilla,
GI:NC_001645.1), orangutan (Papio hamadryas, GI:NC_001992.1), and baboon
(Pongo pygmaeus, GI:NC_001646.1) mtDNA sequences using MUSCLE v3.6
(Edgar, 2004) with default parameters and constructed a concatenated alignment of

9
12 genes, excluding ND6 (Yang et al., 1998) and regions with overlapping reading
frames and codons with insertions and deletions. Using the codeml program of
PAML 4.0 (Yang, 1997; Yang, 2007), we tested for heterogeneity in dN/dS across
lineages, comparing a model that assumed one dN/dS ratio across the phylogeny with a
model that allowed for a different dN/dS ratio for each branch of the unrooted
phylogeny as well as five two-ratio models that allowed for different dN/dS values for
the modern human, Neandertal, chimpanzee, bonobo, and gorilla lineages,
respectively (Yang, 1998). We also examined the influence of different codon
substitution models as well as the number of lineages considered (see Supplemental
Figure 6 and Supplemental Table 3).
For each of the 13 protein-coding genes, we performed McDonald-Kreitman
tests (McDonald and Kreitman, 1991) to contrast patterns of polymorphism at
synonymous and nonsynonymous sites among 54 humans to divergence to the
Neandertal using Fischer’s exact tests as implemented with DnaSP 4.20.2 (Rozas et
al., 2003).
10
Supplemental Figures
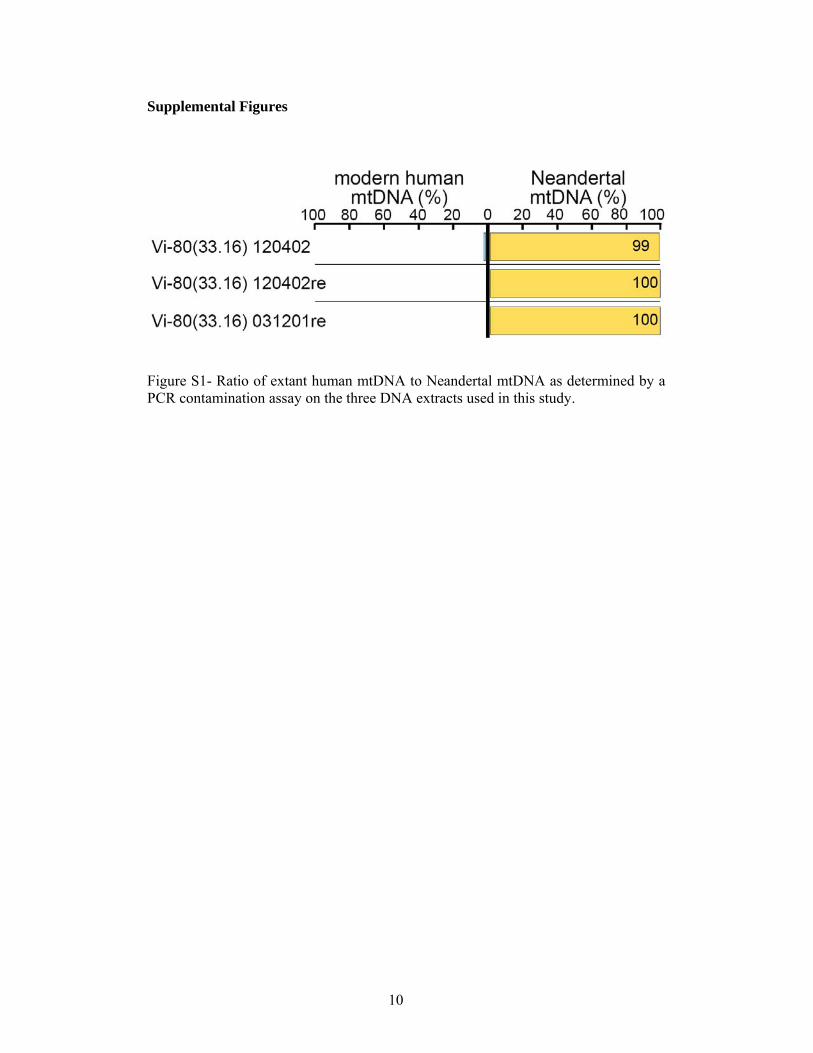
Figure S1- Ratio of extant human mtDNA to Neandertal mtDNA as determined by a PCR contamination assay on the three DNA extracts used in this study.

11
Figure S2- Contamination estimate from sequence fragments covering transversions used as diagnostic for Neandertal versus extant human mtDNA. Each of the four columns shows the human reference mtDNA sequence and the Neandertal mtDNA sequence in a region around a diagnostic transversion. Below are 192 sequences that cover one of these positions. The full alignment of the single read that differs from the Neandertal base and agrees with the human base at one of these positions is shown below.
12
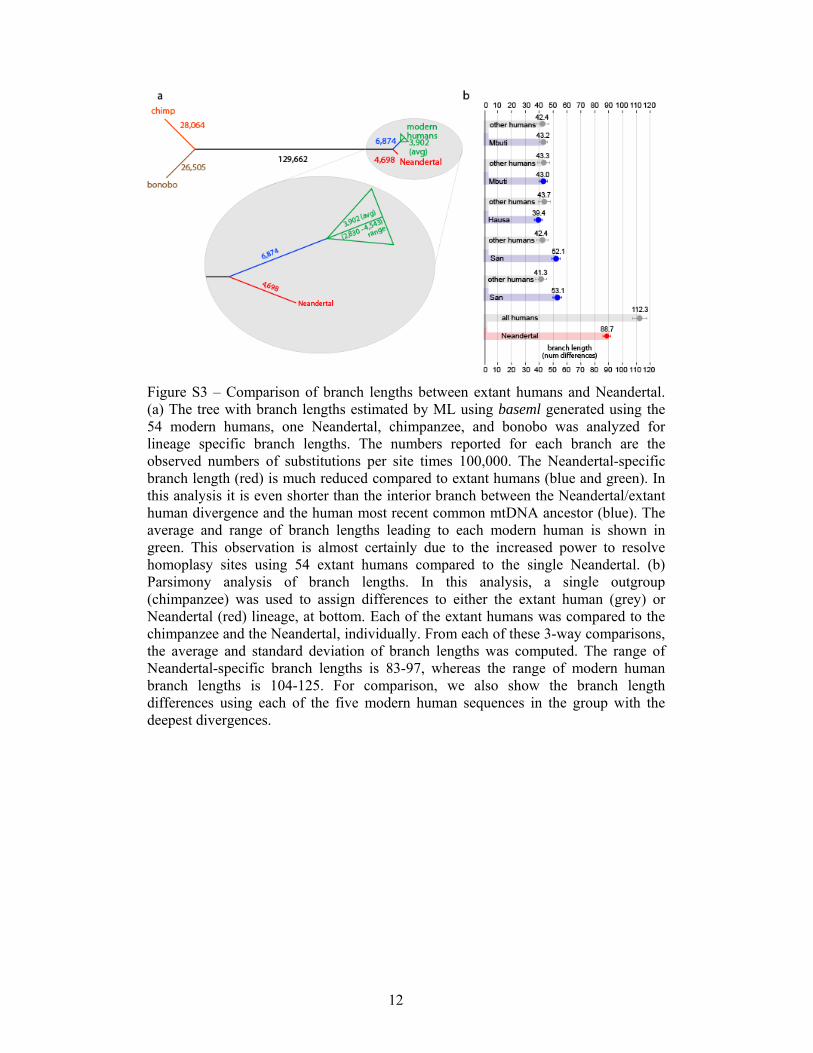
Figure S3 – Comparison of branch lengths between extant humans and Neandertal. (a) The tree with branch lengths estimated by ML using baseml generated using the 54 modern humans, one Neandertal, chimpanzee, and bonobo was analyzed for lineage specific branch lengths. The numbers reported for each branch are the observed numbers of substitutions per site times 100,000. The Neandertal-specific branch length (red) is much reduced compared to extant humans (blue and green). In this analysis it is even shorter than the interior branch between the Neandertal/extant human divergence and the human most recent common mtDNA ancestor (blue). The average and range of branch lengths leading to each modern human is shown in green. This observation is almost certainly due to the increased power to resolve homoplasy sites using 54 extant humans compared to the single Neandertal. (b) Parsimony analysis of branch lengths. In this analysis, a single outgroup (chimpanzee) was used to assign differences to either the extant human (grey) or Neandertal (red) lineage, at bottom. Each of the extant humans was compared to the chimpanzee and the Neandertal, individually. From each of these 3-way comparisons, the average and standard deviation of branch lengths was computed. The range of Neandertal-specific branch lengths is 83-97, whereas the range of modern human branch lengths is 104-125. For comparison, we also show the branch length differences using each of the five modern human sequences in the group with the deepest divergences.

13
Figure S4 – Inferred substitutions on mtDNA lineages. (a) Above, substitutions between the human and Neandertal sequences are shown with respect to their positions in the mtDNA. Colors indicate if they are inferred to have occurred on the human (purple, H) or the Neandertal lineage (blue, N) by parsimony using the chimpanzee as an outgroup. Below, bonobo (green, B) and chimpanzee (red, C) differences are similarly shown using the human mtDNA as an outgroup. (b-e) Frequency spectra of substitutions inferred to have occurred on the (b) human (c) Neandertal, (d) bonobo and (e) chimpanzee lineages.

14
Figure S5 – The widths of the posterior 95% CIs plotted against the posterior means of the divergence times for the analysis of the whole mitochondrial genome. The regression coefficient is 0.29, meaning that every million years of species divergence adds 0.29 Myr to the 95% width. The nearly perfect linear (R-squared=0.9894) relationship suggests that the amount of sequence data is nearly saturated and that more sequence would be unlikely to improve the precision of the posterior time estimation. The partitioned analysis (not shown) yields a very similar graph with a regression coefficient of 0.29.
15
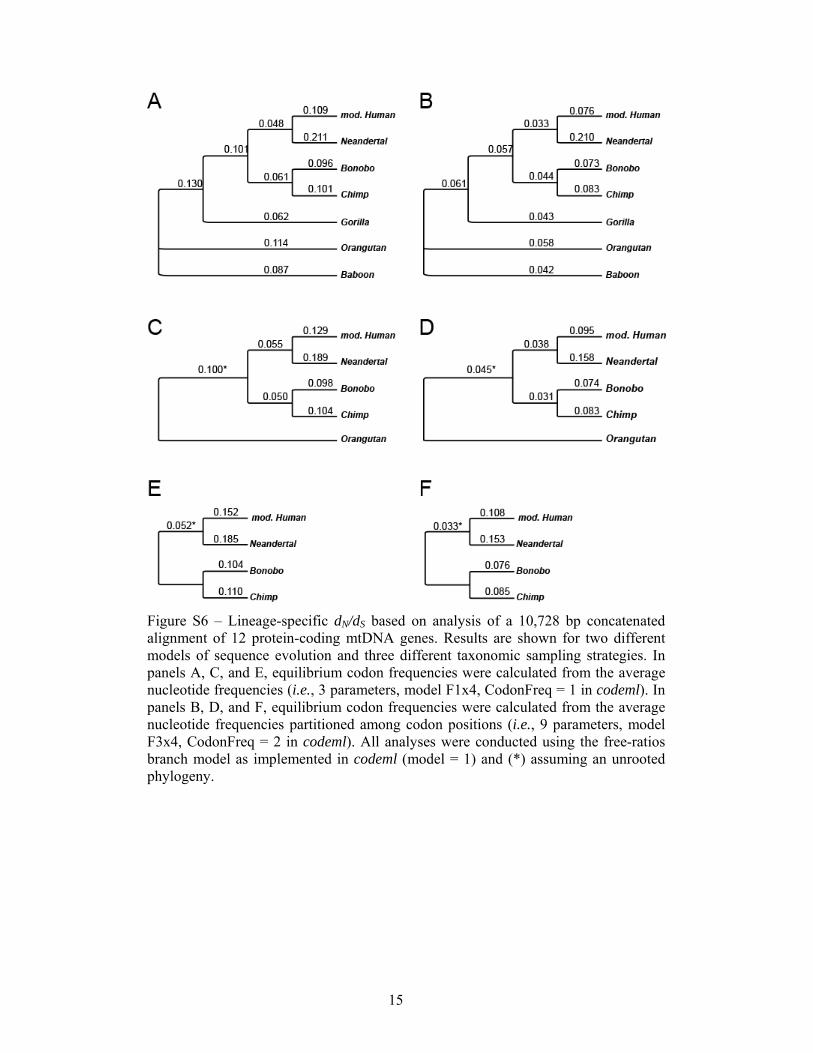
Figure S6 – Lineage-specific dN/dS based on analysis of a 10,728 bp concatenated alignment of 12 protein-coding mtDNA genes. Results are shown for two different models of sequence evolution and three different taxonomic sampling strategies. In panels A, C, and E, equilibrium codon frequencies were calculated from the average nucleotide frequencies (i.e., 3 parameters, model F1x4, CodonFreq = 1 in codeml). In panels B, D, and F, equilibrium codon frequencies were calculated from the average nucleotide frequencies partitioned among codon positions (i.e., 9 parameters, model F3x4, CodonFreq = 2 in codeml). All analyses were conducted using the free-ratios branch model as implemented in codeml (model = 1) and (*) assuming an unrooted phylogeny.
16
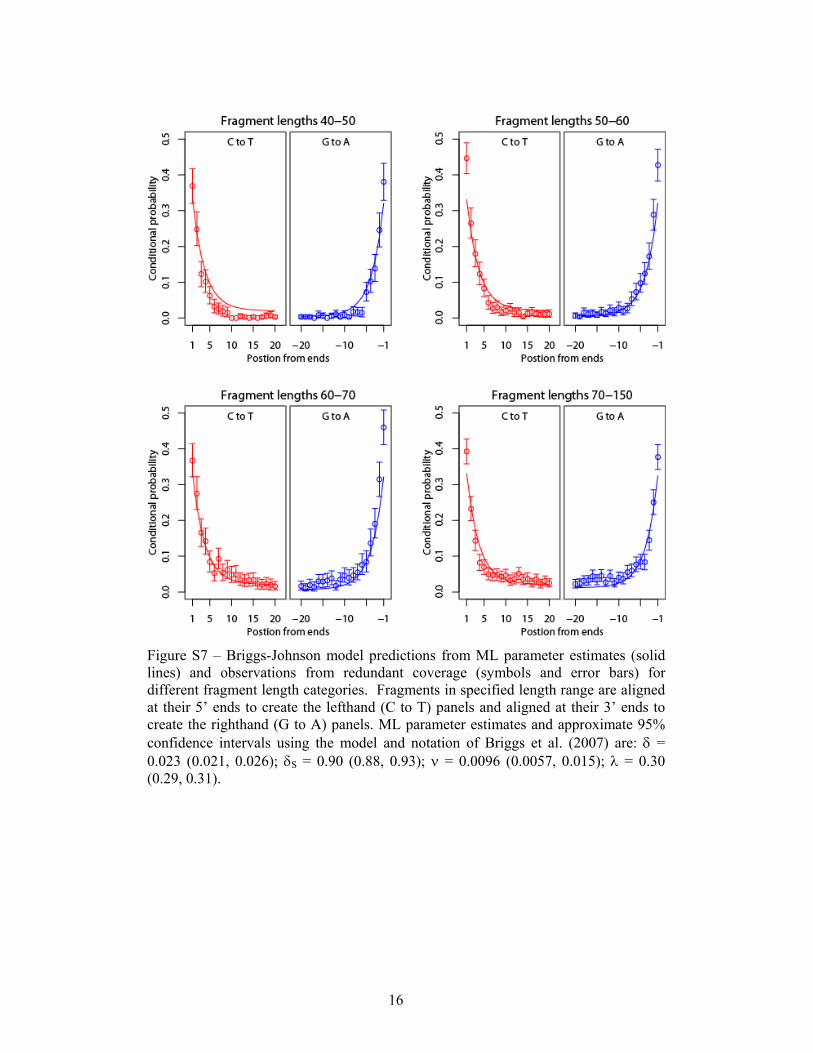
Figure S7 – Briggs-Johnson model predictions from ML parameter estimates (solid lines) and observations from redundant coverage (symbols and error bars) for different fragment length categories. Fragments in specified length range are aligned at their 5’ ends to create the lefthand (C to T) panels and aligned at their 3’ ends to create the righthand (G to A) panels. ML parameter estimates and approximate 95% confidence intervals using the model and notation of Briggs et al. (2007) are: δ = 0.023 (0.021, 0.026); δS = 0.90 (0.88, 0.93); ν = 0.0096 (0.0057, 0.015); λ = 0.30 (0.29, 0.31).

17
Figure S8 – Observed rate of mismatches within the Neandertal mtDNA assembly. Each of the 16,565 positions within the Neandertal mtDNA assembly was categorized by base. Each sequence overlapping each position was counted as a match if it agreed with the assembly or a mismatch if it differed. Each mismatch was classified by what other base was seen. The rate of each mismatch type is the number of times a non-assembly base was seen in a sequence divided by the total number of observations. Error bars show the 95% interval for the means among 1,000 bootstrap re-sampling replicates of the sequences of the assembly. All mismatch rates are below 0.001 except C->T and G->A.
18
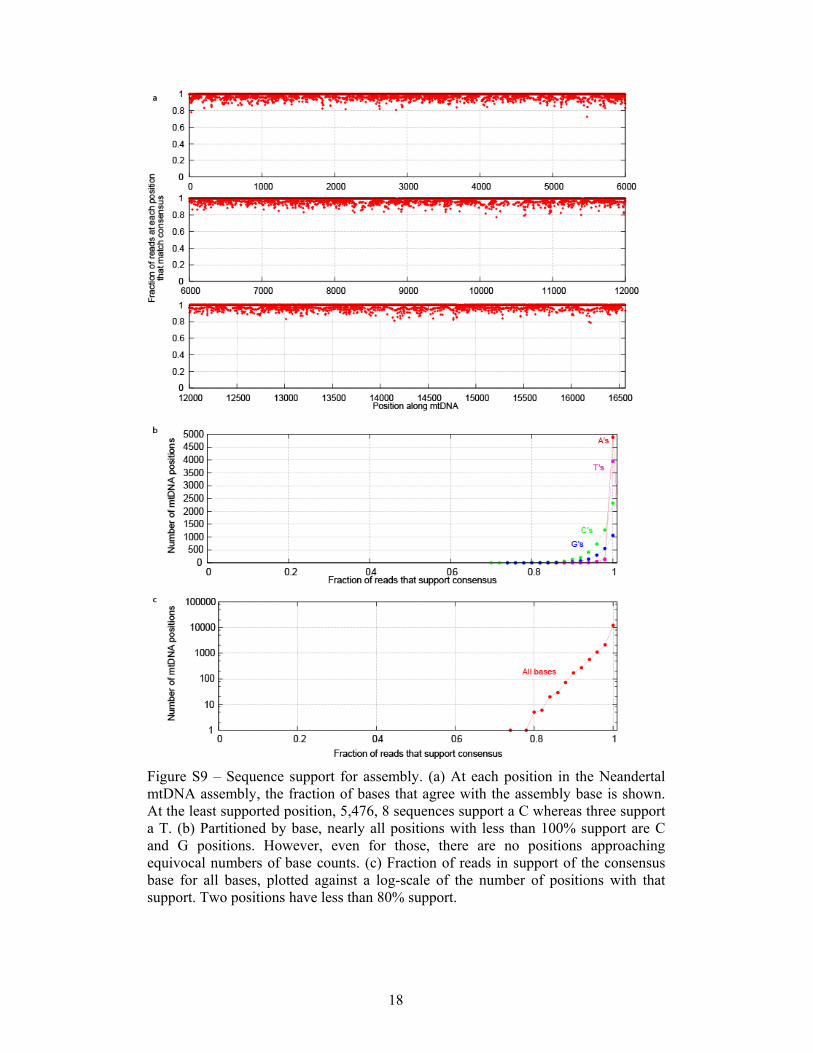
Figure S9 – Sequence support for assembly. (a) At each position in the Neandertal mtDNA assembly, the fraction of bases that agree with the assembly base is shown. At the least supported position, 5,476, 8 sequences support a C whereas three support a T. (b) Partitioned by base, nearly all positions with less than 100% support are C and G positions. However, even for those, there are no positions approaching equivocal numbers of base counts. (c) Fraction of reads in support of the consensus base for all bases, plotted against a log-scale of the number of positions with that support. Two positions have less than 80% support.

19
Figure S10 – Coverage and error rate at increasing sequence depth of the Neandertal mtDNA. We sampled at increasing depths (1, 2, 4, 8, 9, 10, 11, 12, 16, and 32-fold) from the 35-fold coverage available. Ten random samples were made at each depth and a new assembly of the Neandertal mtDNA constructed for each. (a) The number of positions lacking any coverage in each sample is shown as red points. The blue line shows the expected number of unsampled positions under the model of completely random sampling at increasing coverage. As the mtDNA sequences have a GC bias, the number of unsampled sites remains higher than the expectation. (b) The number of positions with no majority base is shown at increasing coverage. (c) The number of positions whose majority base call differs from the finished mtDNA assembly is shown. From this analysis, 12-fold coverage is required to reduce the error rate below 1 in 10,000.

20
Table S1- Primer sequences and consensus sequence for 33 Neandertal mtDNA fragments amplified with PCR and Sanger sequenced. AmpliconID LeftPrSeq RightPrSeq length 2ReplConsSeq(incl. primer)
Vi80.302 GCTGCTTTCCACACAGACATCATAA CTGTGGCCAGAAGCGGGG 70 GCTGCTTTCCACACAGACATCATAACAAAAAATTTCCACCAAACCCCCCCTCCCCCGCTTCTGGCCACAG Vi80.434 TCTTTTGGCGGTATACACTTTT GGAGTGGGAGGGGAAAATAA 66 TCTTTTGGCGGTATACACTTTTAACAGTCACCCCCTAACTAACACATTATTTTCCCCTCCCACTCC Vi80.569 CAACCAAACCCCAAAGACAC TCAGTGTATTGCTTTGAGGAGG 64 CAACCAAACCCCAAAGACACCCCCCACAGTTTATGTAGCTTACCTCCTCAAAGCAATACACTGA Vi80.2458 GGCATGCTCATAAGGAAAGG AAACAGGCGGGGTAAGATTT 65 GGCATGCTCATAAGGAAAGGTTAAAAAAAGTAAAAGGAACTCGGCAAATCTTACCCCGCCTGTT Vi80.3566 GCTCTCACCATCGCTCTTCT GTTGAGGTTAACCAGGGGGT 66 GCTCTCACCATCGCTCTTCTACTATGAACCCCCCTCCCCATACCCAACCCCCTGGTTAACCTCAAC Vi80.4164 GATTCCGCTACGACCAACTCAT AGTGCTAGGGTGAGTGGTAGGAA 64 GATTCCGCTACGACCAACTCATACACCTCCTATGAAAAAACTTCCTACCACTCACCCTAGCACT Vi80.4605 CATGCTAGCTTTTATTCCAGTTCT GATGGCAGCTTCTGTGGAAC 64 CATGCTAGCTTTTATTCCAGTTCTAACCAAAAAAATAAACCCTCGTTCCACAGAAGCT Vi80.5820 TTGCAATTCAATATGAAAATCACC CAGGGGTTAGGCCTCTTTTT 55 TTGCAATTCAATATGAAAATCACCTCAGAGCTGGTAAAAAGAGGCCTAAC Vi80.5836 TGAAAATCACCTCGGAGC GTGAAGCATTGGACTGTAAATCT 70 TGAAAATCACCTCGGAGCTGGTAAAAAGAGGCTTAACCCCTGTCTTTAGATTTACAGTCCAATGCTTCACA Vi80.6023 GGCACAGCTCTAAGCCTCCT CGTTACCTAGAAGGTTGCCTG 64 GGCACAGCTCTAAGCCTCCTTATTCGAGCCGAACTGGGCCAGCCAGGCAACCTTCTAGGTAACG Vi80.6692 TCCCATATTGTAACTTACTACTCCG AGACCATACCTATGTATCCAAATGG 65 TCCCATATTGTAACTTACTACTCCGGAAAAAAAGAACCATTTGGATACATAGGTATGGTCTGAGC Vi80.6856 TAATCATCGCTATCCCCACC TATTGCTTCCGTGGAGTGTG 66 TAATCATCGCTATCCCCACCGGCGTCAAAGTATTTAGCTGACTCGCCACACTCCACGGAAGCAATA Vi80.7397 GAACCCTCCATAAACCTGGA TACGGGCTCTTCGAATGTGT 69 GAACCCTCCATAAACCTGGAGTGACTATATGGATGCCCCCCACCCTACCACACATTCGAAGAG Vi80.7466 AAGGAAGGAATCGAACCCC TGAAAAAGTCATGGAGGCCA 65 AAGGAATCGAACCCCCCAAAGCTGGTTTCAAGCCAACCCCATGGCCTCCATGACTTTTTCA Vi80.7517 TGGCCTCCATGACTTTTTC GCCTATAATTTAACTTTGACAA 72 TGGCCTCCATGACTTTTTCAAAAAGATATTAGAAAAACCATTTCATAACTTTGTCAAAGTTAAATTATAGGC Vi80.7892 GACCCCTCCTTTACCATCAA GCCGTAGTCGGTGTACTCGT 69 GACCCCTCCTTTACCATCAAATCAATTGGCCATCAATGGTACTGAACCTACGAGTACACCGACTACGGC Vi80.8020 TGACAATCGAGTAGTACTCC GAGTGTAAGACGTCTTGTGATG 66 TGACAATCGAGTAGTACTCCCGGTTGAAGCCCCCATTCGTATAATAATTACATCACAAGACGTCTTACA Vi80.8046 TGAAGCCCCCATTCGTATAA CCTAATGTGGGGACAGCTCA 69 TGAAGCCCCCATTCGTATAATAATTACATCACAAGACGTCTTACACTCATGAGCTGTCCCCACATTAGG Vi80.8462 CTATTCCTCATCACCCAACTAAA TATGGGCTTTGGTGAGGGAG 69 CTATTCCTCATCACCCAACTAAAAATATTAAATACAAATTACCACTTACCTCCCTCACCAAAG Vi80.8883 GGCGCAGTGATTATAGGCTT TGCCTTGTGGTAAGAAGTGG 67 GGCGCAGTGATTATAGGCTTTCGCTCTAAGATTAAAAATGCCCTAGCCCACTTCTTACCACAAGGCA Vi80.8905 GCTCTAAGATTAAAAATGCCCT ATAGGGATAAGGGGTGTAGG 67 GCTCTAAGATTAAAAATGCCCTAGCCCACTTCTTACCACAAGGCACACCTACACCCCTTATCCCTAT Vi80.9324 GTGATTTCACTTCCACTCCA TGGTTAGTGTGTTGGTTAGTA 79 GTGATTTCACTTCCACTCCACAACCCTCCTCATACTAGGCTTACTAACCAACACACTAACCATATACCAATG Vi80.9478 CGGGATAGTCCTATTTATTACCTCA GGAGTGGTAAAAGGCTCAGAAA 72 CGGGATAGTCCTATTTATTACCTCAGAAGTTTTTTTCTTCGCAGGATTTTTCTGAGCCTTTTACCACTCC Vi80.9532 CACTCCAGCCTAGCCCCTAC ATTTAGCGGGGTGATGCCT 69 CACTCCAGCCTAGCCCCTACCCCCCAACTAGGAGGGCACTGGCCCCCAACAGGCATCACCCCGCTAAAT Vi80.10880 AATTATTAGCATCATCCCCCTAC TTGGGGAGCAGCTAAATAGG 68 AATTATTAGCATCATCCCCCTACTATTTTTTAACCAAATCAACAACAACCTATTTAGCTGCTCCCCA Vi80.10947 TCCGACCCCCTAACAACC TGTGAGGGGTAGGAGTCAGG 57 TCCGACCCCCTAACAACCCCCCTCCTAATACTAACTACCTGACTCCTACCCCTCACA Vi80.11032 CAACGCCACTTATCCAGTGAAC GGGAGATTAGTATAGAGAGGTAG 69 TCCAGTGAACCACTATCACGAAAAAAACTCTACCTCTCTATACTAATCTCCCTACAAATCTCCTTAAT Vi80.11867 AGCAAGCCTCGCTAACCTC CTAGCACAGAGAGTTCTCCCA 65 AGCAAGCCTCGCTAACCTCGCCTTACCCCCCACTATTAACCTACTGGGAGAACTCTCTGTGCTAG Vi80.12385 AACCACCCTGACCCTGACTT TTAGGGTTAATGAGGGTGGTAA 60 CCCTGACTTCCCTAATTCCCCCCATCCTTACCACCCTCATTAACCCTAACAAAA Vi80.12418 CCACCCTCATTAACCCTAACAA GTGGATGCGACAATGGATTT 67 CCACCCTCATTAACCCTAACAAAAAAAACTCATACCCCCATTATGTAAAATCCATTGTCGCATCCACA Vi80.13231 CGCCCTTACACAAAATGACA GCCCTAGTTGACTTGAAGTGG 62 TACACAAAATGACATCAAAAAAATCGTAGCCTTCTCCACTTCAAGTCAACTAGGGC Vi80.14504 TCCAAAGACAACCATCATTCC GGGGAGGTTATATGGGTTTAAT 62 TCCAAAGACAACCATCATTCCCCCTAAATAAATTAAAAAAACTATTAAACCCATATAACCTCCCC Vi80.15356 GCAGCACTCCACCTCCTATT GGTGATTCCTAGGGGGTTGT 60 GCAGCACTCCACCTCCTATTCTTGCACGAAACAGGATCAAACAACCCCCTAGGAATCACCA

21
Table S2. Lineage differences in tRNA and rRNA genes.
Gene Neandertal lineage changes extant human lineage changes
tRNA Phe 1 0 0 tRNA Val 1 0 0 tRNA Ile 1 0 1
tRNA Met 1 0 0 tRNA Trp 1 0 0 tRNA Asp 1 0 1 tRNA Lys 1 1 0 tRNA Gly 1 0 0 tRNA Arg 1 0 0 tRNA His 1 0 1 tRNA Leu 1 0 0 tRNA Thr 1 0 0 tRNA Ser 2 0 0 tRNA Leu 2 0 0 tRNA Gln 1 0 0 tRNA Ala 1 0 0 tRNA Asn 1 1 0 tRNA Cys 1 0 1 tRNA Tyr 1 0 1 tRNA Ser 1 0 0 tRNA Glu 1 0 0 tRNA Pro 1 0 0 12S rRNA 5 3 16S rRNA 3 5
22
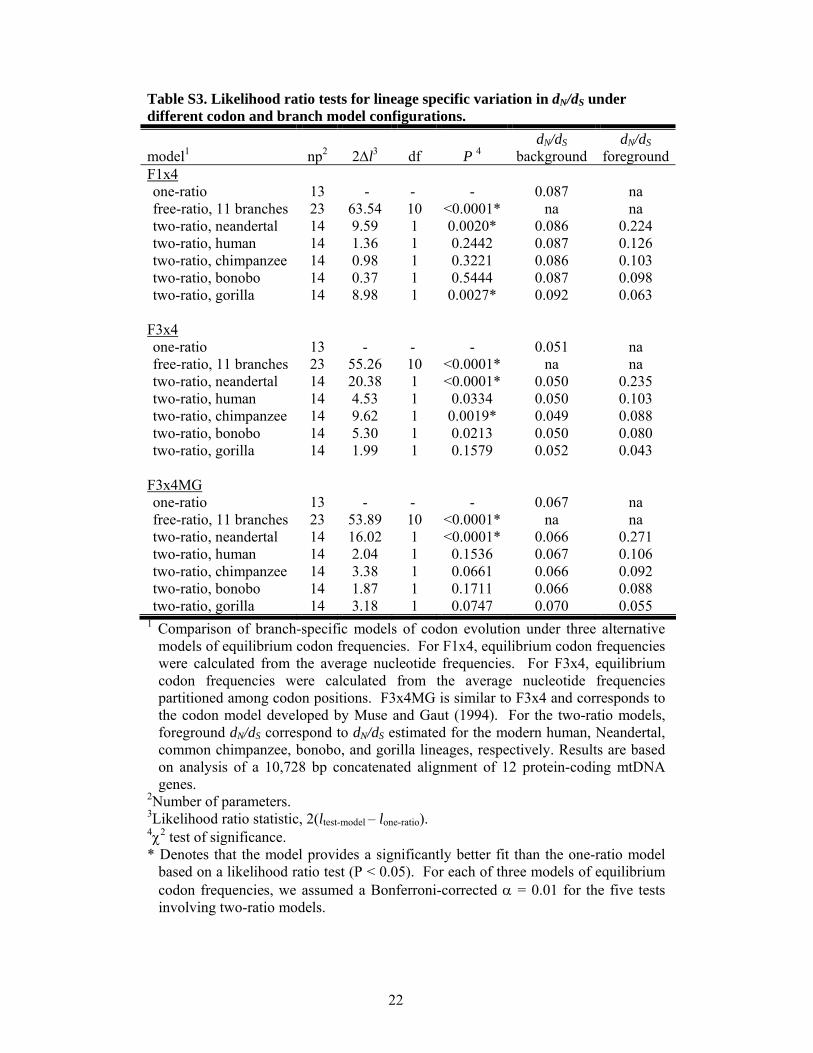
Table S3. Likelihood ratio tests for lineage specific variation in dN/dS under different codon and branch model configurations.
model1 np2 2∆l3 df P 4 dN/dS
background dN/dS
foregroundF1x4 one-ratio 13 - - - 0.087 na free-ratio, 11 branches 23 63.54 10 <0.0001* na na two-ratio, neandertal 14 9.59 1 0.0020* 0.086 0.224 two-ratio, human 14 1.36 1 0.2442 0.087 0.126 two-ratio, chimpanzee 14 0.98 1 0.3221 0.086 0.103 two-ratio, bonobo 14 0.37 1 0.5444 0.087 0.098 two-ratio, gorilla 14 8.98 1 0.0027* 0.092 0.063
F3x4 one-ratio 13 - - - 0.051 na free-ratio, 11 branches 23 55.26 10 <0.0001* na na two-ratio, neandertal 14 20.38 1 <0.0001* 0.050 0.235 two-ratio, human 14 4.53 1 0.0334 0.050 0.103 two-ratio, chimpanzee 14 9.62 1 0.0019* 0.049 0.088 two-ratio, bonobo 14 5.30 1 0.0213 0.050 0.080 two-ratio, gorilla 14 1.99 1 0.1579 0.052 0.043
F3x4MG one-ratio 13 - - - 0.067 na free-ratio, 11 branches 23 53.89 10 <0.0001* na na two-ratio, neandertal 14 16.02 1 <0.0001* 0.066 0.271 two-ratio, human 14 2.04 1 0.1536 0.067 0.106 two-ratio, chimpanzee 14 3.38 1 0.0661 0.066 0.092 two-ratio, bonobo 14 1.87 1 0.1711 0.066 0.088 two-ratio, gorilla 14 3.18 1 0.0747 0.070 0.055
1 Comparison of branch-specific models of codon evolution under three alternative models of equilibrium codon frequencies. For F1x4, equilibrium codon frequencies were calculated from the average nucleotide frequencies. For F3x4, equilibrium codon frequencies were calculated from the average nucleotide frequencies partitioned among codon positions. F3x4MG is similar to F3x4 and corresponds to the codon model developed by Muse and Gaut (1994). For the two-ratio models, foreground dN/dS correspond to dN/dS estimated for the modern human, Neandertal, common chimpanzee, bonobo, and gorilla lineages, respectively. Results are based on analysis of a 10,728 bp concatenated alignment of 12 protein-coding mtDNA genes.
2Number of parameters. 3Likelihood ratio statistic, 2(ltest-model – lone-ratio). 4χ2 test of significance. * Denotes that the model provides a significantly better fit than the one-ratio model
based on a likelihood ratio test (P < 0.05). For each of three models of equilibrium codon frequencies, we assumed a Bonferroni-corrected α = 0.01 for the five tests involving two-ratio models.

23
Table S4 - Dinucleotide context of breakpoints relative to their occurrence in Neandertal mtDNA. The value in each cell is the observed fold enrichment of each fragmentation point relative random fragmentation given the dinucleotide composition in the Neandertal mtDNA.
First base inside fragment
A C G T
A 0.81 1.66 0.91 1.3 1.14
C 0.57 0.9 0.47 0.9 0.75
G 1.31 2.01 1.25 2.89 1.84
T 0.43 0.45 0.26 0.39 0.38
First base outside
fragment
0.74 1.2 0.78 1.27

24
Table S5 - Posterior mean and 95% confidence interval of divergence times and evolutionary parameters for the whole genome (unpartitioned) and various partitions.
Unpartitioned Quantiles Mean 2.5% 97.5% Chimp divergence 0.704 0.607 0.807 Neanderthal divergence 0.066 0.053 0.08 "Human_MRCA" 0.03 0.024 0.037 Chimp-Bonobo 0.238 0.197 0.283
Mutation rate (10-7 subst/site/year) Whole genome (16587bp) 0.11 0.09 0.13 Kappa (trans/transv) Whole genome (16587bp) 34.2 28.9 40.4 Alpha Whole genome (16587bp) 0.11 0.09 0.14
Partitioned Quantiles Mean 2.5% 97.5% Chimp divergence 0.708 0.611 0.811 Neanderthal divergence 0.061 0.049 0.074 "Human_MRCA" 0.027 0.021 0.033 Chimp-Bonobo 0.234 0.196 0.277
Mutation rates (10-7 subst/site/year) Noncoding (Dloop) (1232bp) 0.45 0.34 0.59 ND6_1 (174 bp) 0.05 0.02 0.12 Proteins+_1 (3612bp) 0.06 0.05 0.07 ND6_2 (174 bp) 0.02 0.01 0.04 Proteins+_2 (3612 bp) 0.02 0.01 0.02 ND6_3 (174 bp) 0.34 0.22 0.51 Proteins+_3 (3612 bp) 0.27 0.23 0.33 rRNA (2516 bp) 0.05 0.04 0.07 tRNA- (556 bp) 0.02 0.01 0.04 tRNA+ (956 bp) 0.04 0.03 0.06 Kappas (trans/transv) Noncoding (Dloop) (1232bp) 28.6 20 40.1 ND6_1 (174 bp) 78.6 9.9 274.7 Proteins+_1 (3612bp) 36.1 22.8 56.3 ND6_2 (174 bp) 8.4 0.9 35.7 Proteins+_2 (3612 bp) 14.9 7.7 27.6 ND6_3 (174 bp) 120.1 40.2 291.5 Proteins+_3 (3612 bp) 69.9 54.2 89.6 rRNA (2516 bp) 24.3 14.8 39.1 tRNA- (556 bp) 32.3 7.3 105.3 tRNA+ (956 bp) 58.2 19.2 149.8 Alphas Noncoding (Dloop) (1232bp) 0.11 0.09 0.14 ND6_1 (174 bp) 0.12 0 0.49 Proteins+_1 (3612bp) 0.03 0 0.09 ND6_2 (174 bp) 0.22 0.01 0.77 Proteins+_2 (3612 bp) 0.06 0 0.21 ND6_3 (174 bp) 0.83 0.41 1.51 Proteins+_3 (3612 bp) 1.93 1.35 2.73 rRNA (2516 bp) 0.04 0 0.1 tRNA- (556 bp) 0.19 0 0.72 tRNA+ (956 bp) 0.11 0 0.44

25
In parenthesis are shown the number of base pairs in the alignment for each partition. Note that the estimates differ between the two approaches. In the text, values are given for the unpartitioned data unless otherwise noted.

26
Supplemental References
Edgar, R. C. (2004). MUSCLE: a multiple sequence alignment method with reduced
time and space complexity. BMC Bioinformatics 5, 113.
Gilks, W. R., Richardson, S., and Spiegelhalter, D. (1996). Markov Chain Monte
Carlo in Practice (Interdisciplinary Statistics), First edn (Boca Raton: CRC Press
LLC).
Hazkani-Covo, E., and Graur, D. (2007). A comparative analysis of numt evolution in
human and chimpanzee. Mol Biol Evol 24, 13-18.
Krause, J., Dear, P. H., Pollack, J. L., Slatkin, M., Spriggs, H., Barnes, I., Lister, A.
M., Ebersberger, I., Pääbo, S., and Hofreiter, M. (2006). Multiplex amplification of
the mammoth mitochondrial genome and the evolution of Elephantidae. Nature 439,
724-727.
McDonald, J. H., and Kreitman, M. (1991). Adaptive protein evolution at the Adh
locus in Drosophila. Nature 351, 652-654.
Ronquist, F., and Huelsenbeck, J. P. (2003). MrBayes 3: Bayesian phylogenetic
inference under mixed models. Bioinformatics 19, 1572-1574.
Rozas, J., Sanchez-DelBarrio, J. C., Messeguer, X., and Rozas, R. (2003). DnaSP,
DNA polymorphism analyses by the coalescent and other methods. Bioinformatics
19, 2496-2497.
Stamatakis, A. (2006). RAxML-VI-HPC: maximum likelihood-based phylogenetic
analyses with thousands of taxa and mixed models. Bioinformatics 22, 2688-2690.
Swofford, D. L. (2003). PAUP*. Phylogenetic Analysis Using Parsimony (*and
Other Methods). Version 4, S. Associates, ed. (Sunderland, MA: Sinauer Associates).

27
Yang, Z. (1997). PAML: a program package for phylogenetic analysis by maximum
likelihood. Comput Appl Biosci 13, 555-556.
Yang, Z. (1998). Likelihood ratio tests for detecting positive selection and application
to primate lysozyme evolution. Mol Biol Evol 15, 568-573.
Yang, Z. (2007). PAML 4: phylogenetic analysis by maximum likelihood. Mol Biol
Evol 24, 1586-1591.
Yang, Z., Nielsen, R., and Hasegawa, M. (1998). Models of amino acid substitution
and applications to mitochondrial protein evolution. Mol Biol Evol 15, 1600-1611.
Yang, Z., and Rannala, B. (2006). Bayesian estimation of species divergence times
under a molecular clock using multiple fossil calibrations with soft bounds. Mol Biol
Evol 23, 212-226.