High-throughput sequencing of ancient plant and mammal DNA preserved in herbivore middens
Upload
khangminh22Category
view
5download
0
HAL Id: hal-01214682https://hal.inria.fr/hal-01214682
Submitted on 13 Oct 2015
HAL is a multi-disciplinary open accessarchive for the deposit and dissemination of sci-entific research documents, whether they are pub-lished or not. The documents may come fromteaching and research institutions in France orabroad, or from public or private research centers.
L’archive ouverte pluridisciplinaire HAL, estdestinée au dépôt et à la diffusion de documentsscientifiques de niveau recherche, publiés ou non,émanant des établissements d’enseignement et derecherche français ou étrangers, des laboratoirespublics ou privés.
Reference-free compression of high throughputsequencing data with a probabilistic de Bruijn graph
Gaëtan Benoit, Claire Lemaitre, Dominique Lavenier, Erwan Drezen,Thibault Dayris, Raluca Uricaru, Guillaume Rizk
To cite this version:Gaëtan Benoit, Claire Lemaitre, Dominique Lavenier, Erwan Drezen, Thibault Dayris, et al..Reference-free compression of high throughput sequencing data with a probabilistic de Bruijn graph.BMC Bioinformatics, BioMed Central, 2015, 16 (1), �10.1186/s12859-015-0709-7�. �hal-01214682�
Benoit et al. BMC Bioinformatics (2015) 16:288 DOI 10.1186/s12859-015-0709-7
RESEARCH ARTICLE Open Access
Reference-free compression of highthroughput sequencing data with aprobabilistic de Bruijn graphGaëtan Benoit1, Claire Lemaitre1, Dominique Lavenier1, Erwan Drezen1, Thibault Dayris2, Raluca Uricaru2,3
and Guillaume Rizk1*
Abstract
Background: Data volumes generated by next-generation sequencing (NGS) technologies is now a major concernfor both data storage and transmission. This triggered the need for more efficient methods than general purposecompression tools, such as the widely used gzip method.
Results: Wepresent a novel reference-freemethodmeant to compress data issued from high throughput sequencingtechnologies. Our approach, implemented in the software LEON, employs techniques derived from existing assemblyprinciples. The method is based on a reference probabilistic de Bruijn Graph, built de novo from the set of reads andstored in a Bloom filter. Each read is encoded as a path in this graph, by memorizing an anchoring kmer and a list ofbifurcations. The same probabilistic de Bruijn Graph is used to perform a lossy transformation of the quality scores,which allows to obtain higher compression rates without losing pertinent information for downstream analyses.
Conclusions: LEON was run on various real sequencing datasets (whole genome, exome, RNA-seq ormetagenomics). In all cases, LEON showed higher overall compression ratios than state-of-the-art compressionsoftware. On a C. elegans whole genome sequencing dataset, LEON divided the original file size by more than 20.LEON is an open source software, distributed under GNU affero GPL License, available for download at http://gatb.inria.fr/software/leon/.
Keywords: Compression, de Bruijn Graph, NGS, Bloom filter
BackgroundIt is well known that data volumes produced by next-generation sequencing are a major issue. The size ofthe Sequence Read Archive, hosting a major part of thesequence data generated world wide, is growing very fastand now contains 3.5 petabases (http://www.ncbi.nlm.nih.gov/Traces/sra/) of DNA and RNA [1]. This is an issue forboth data storage and transmission, hampering collabora-tion between teams and long-term storage of data neededfor the reproducibility of published results. Raw reads arestored in ASCII-based text files, in FASTA or FASTQ for-mats, containing for each read entry a read ID, a stringfor the sequence itself and, for the FASTQ files, a string ofquality scores encoding a per base estimation of accuracy.
*Correspondence: [email protected]/IRISA/GenScale, Campus de Beaulieu, 35042 Rennes, FranceFull list of author information is available at the end of the article
Such files are usually compressed with the general pur-pose compression tool GZIP (www.gzip.org, Jean-LoupGailly and Mark Adler), which is fast and largely acceptedbut does not exploit specificities of sequencing dataCompression of sequencing data can be divided into
three distinct problems: compression of read IDs, of basesequence and of quality scores. For the compression ofread IDs, standardmethods are perfectly suited, since readIDs are usually highly similar from one read to another.Compression of DNA sequences and quality scores onthe other hand, are two very different problems. The for-mer displays high redundancy across reads when depthof sequencing is high, but spread over the whole file, andmust be lossless, whereas the latter displays a highly noisysignal on a larger alphabet size, and lossy compressionmay be appropriate. Here we present a software for the
© 2015 Benoit et al. Open Access This article is distributed under the terms of the Creative Commons Attribution 4.0International License (http://creativecommons.org/licenses/by/4.0/), which permits unrestricted use, distribution, andreproduction in any medium, provided you give appropriate credit to the original author(s) and the source, provide a link to theCreative Commons license, and indicate if changes were made. The Creative Commons Public Domain Dedication waiver(http://creativecommons.org/publicdomain/zero/1.0/) applies to the data made available in this article, unless otherwise stated.
Benoit et al. BMC Bioinformatics (2015) 16:288 Page 2 of 14
compression of FASTA and FASTQ files, including readIDs, DNA sequences and quality scores.Sequence compression techniques fall into two cate-
gories: reference-based methods, such as QUIP, CRAM,PATHENC and FASTQZ, exploit similarities between readsand a reference genome [2–5], whereas de novo com-pression schemes in FQZCOMP, SCALCE, FASTQZ, DSRC,ORCOM, BEETL, MINCE exploit similarities between readsthemselves [5–10]. Reference based methods usually mapreads to the genome and then only store informationneeded to rebuild reads: genome position and differences.While efficient, such methods require a time-consumingmapping phase to the genome, and are not applicablewhen no close reference is known. Moreover, the refer-ence genome is also needed for de-compressing the data,which could lead to data loss if the reference has beenlost or modified.Most de novo methods either (i) use acontext-model to predict bases according to their context,followed by an arithmetic encoder (FASTQZ, FQZCOMP,DSRC), or (ii) re-order reads to maximize similaritiesbetween consecutive reads and therefore boost compres-sion of generic compression methods (SCALCE, ORCOM,MINCE).
FASTQZ and FQZCOMP are improvements of generictext-compression methods. For simple genomes, the con-text model is able to learn the underlying genome andproduces good results. DSRC uses similar techniques, butis additionally tailored for high-speed compression anddecompression. PATHENC also uses a context model fol-lowed by arithmetic coding, with two refinements [4].First, the context-model is initialized with a referencegenome. Secondly, the starts of the reads are encoded sep-arately, as a set of kmers compactly encoded with a bittree, which also requires to reorder reads.While they con-ceptually make a connection with paths in a graph, theirmethod does not use a de Bruijn graph.As far as we know, tools that achieve the best sequence
compression ratios are currently read re-orderingmethods.BEETL and BEETL-FASTQ use the Burrows-Wheeler transform of the read set to achieve compression[9, 11]. However, the method seems to be more suitableas a searchable compressed archive than a full compres-sion/decompression tool of fastq files (see BEETL-FASTQReadme). ORCOM uses minimizers, an increasingly usedmethod in various NGS algorithms, to quickly re-orderthe read set into bins of reads of high similarity [8]. This isa very efficient method regarding sequence compressionratio and execution speed. Their method is currently lim-ited to sequence compression, header and quality streamsare discarded. MINCE exploits the same paradigm, it alsore-order reads into buckets of similar reads based on min-imizers. Reads are then transformed to avoid redundantcoding of the minimizer among a bucket, and compressedby a general-purpose compressor. Header and quality
streams are discarded. However, when reordering reads,one should pay special attention to keeping read pairinginformation. Indeed losing such information would makeit impossible to use down-stream NGS analysis requiringpaired-reads. In this sense, methods that reorder readswithout dealing with the pairing information cannot beconsidered as lossless, and cannot be directly comparedto other methods. MINCE addresses this issue by con-catenating paired reads together before compression, andsplitting them after decompression. SCALCE also has anoption to handle paired-reads correctly, but activatingthis option significantly degrades the compression ratio.Lastly, QUIP (in its reference-free mode) uses a dif-
ferent approach, based on methods tailored for NGSanalysis. Sequence assembly algorithms building a refer-ence genome as a set of contigs are used, followed bya reference-based approach [2]. This method is highlydependent on the quality of the generated contigs, and isout-performed in a recent compression competition [5].Quality score compression techniques are divided
between lossless methods, where decompressed datais guaranteed to match the original values, and lossyapproaches, trading loss in fidelity of reproduction forhigher compression rates.It has been observed that quality values are generally
correlated to their position in the read and to the nearbyquality values. Many losslessmethods exploit this throughthe use of context-models followed by arithmetic coding(DSRC, FASTQZ, FQZCOMP). Other lossless approachestransform quality scores to values that can be coded usingfewer bits, i.e. gap translating, min shifting and frequencyordering [12].Classic lossy approaches consist in reducing the range of
possible values, making further compression easier. Thegeneral idea is to divide the initial spectrum of scores intoa lower number of bins. FASTQZ and Wan et al. presentvariations on this scheme [5, 12]. FQZCOMP and LIBC-SAM methods smooth qualities within a block, ensuringthat the difference from the original value is no more thana given threshold [5, 13].Other lossy quality scores compression approaches use
the information contained in the DNA sequence to makesmart modifications of the quality scores by smooth-ing unimportant quality values, in order to reduce theentropy of the quality set. Janin et al. assume that ifa given nucleotide can be completely predicted by itscontext, then its corresponding quality value becomesunimportant and can even be discarded [14]. Thisis achieved through a time and memory-consumingBurrows-Wheeler transform (BWT) of the read set anda longest common prefix (LCP) array. The methodRQS [15] exploits a similar idea but, instead of computingthe BWT, compute a dictionary of frequently occurringkmers and then identify kmers within small Hamming
Benoit et al. BMC Bioinformatics (2015) 16:288 Page 3 of 14
distance of frequent ones. Positions corresponding to dif-ferences from such frequent kmers are assumed to beSNPs or sequencing errors and their quality values arepreserved, while the other quality scores are smoothed.Surprisingly, RQS improves SNP-calling accuracy on agold-standard dataset. However, their method scales tolarge read sets only if the dictionary is constructed overa sample of the original data set, and the effect of suchsampling is not clearly measured.In this paper, we introduce LEON, a novel de novo
method for lossless sequence compression and lossy qual-ity compression using methods derived from assemblyprinciples. However, instead of building a reference as aset of sequences, the reference is represented as a prob-abilistic de Bruijn Graph. Read order is preserved andeach read is represented by a kmer anchor and a list ofbifurcation choices, enough to re-build it from the graph.The same data structure is used for quality compres-sion. Nucleotides covered by a sufficient number of highlyfrequent kmers are assumed to be error-free and havetheir quality smoothed to an arbitrarily chosen value. Thequality stream is then compressed with the zlib library.LEON was run on various real sequencing datasets to
evaluate the impact on compression ratio of numerousdataset features, such as the size and complexity of thetarget genome, the sequencing depth, the sequencingtechnology. In all cases, LEON showed higher overall com-pression ratios than state-of-the-art compression softwareand was at least 2 times faster than the generic toolGZIP, with at least 5 times better compression ratios.For instance, on a C. elegans whole genome sequencingdataset,the original file size is divided by more than 20,and in a large human dataset case, the file size was reducedfrom 733 GB to 47 GB. Several types of sequenced sam-ples (whole genome, exome, RNA-seq or metagenomics)were also tested, demonstrating the robustness of LEON.Finally, the effects of the lossy transformation of qualityscores was evaluated on a SNP calling analysis and showedan improvement in the prediction accuracy.
MethodsOverviewAlthough our compression approach does not rely ona reference genome, it bears some similarities withreference-based approaches. As we do not dispose of anyexternal data, the first step of our approach is to buildde novo a reference from the reads and then, similarly toreference-based approaches, to record each read as a posi-tion and a list of differences with respect to this reference.However, the major difference lies in the data structurehosting the reference: instead of a sequence or a set ofsequences, a de Bruijn Graph is built, whose basic piecesof information are kmers, i.e. words of size k. This datastructure, commonly used for de novo assembly of short
reads, has the advantage of representing most of the DNAinformation contained in the reads while dumping theredundancy due to sequencing coverage.Since the de Bruijn Graph must be stored in the com-
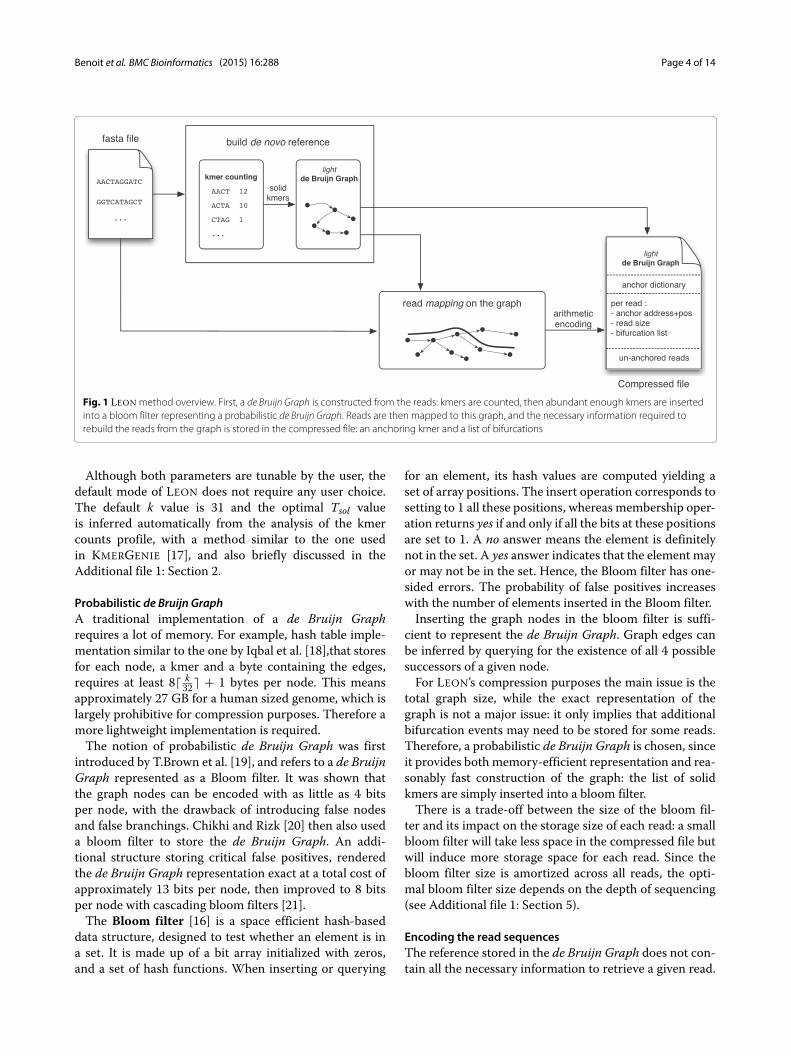
pressed file to reconstruct the reads, one important issueis its size. To tackle this issue, our method relies firston a good parameterization of the de Bruijn Graph andsecondly on its implementation as a probabilistic datastructure. The parameters are set so that the structurestores most of the important information, that is the mostredundant one, while discarding the small differences,such as sequencing errors. Our implementation of the deBruijn Graph is based on bloom filters [16]. Although notexact, this is very efficient to store such large data struc-tures in the main memory and then in the compressedfiles.Figure 1 shows an overview of the method implemented
in the LEON software. First, kmers are counted and onlythose abundant enough are inserted into a bloom filterrepresenting the de Bruijn Graph. Each read is encoded byfirst finding its best anchoring kmer, then a walk throughthe graph starting from this anchor node is performed toconstruct the list of bifurcations followed when mappingthe read to the graph. Finally, the compressed file con-tains the de Bruijn Graph and, for each read, its anchoringkmer and a list of bifurcations encoded with an order 0arithmetic encoder.
Building the reference as a de Bruijn GraphA de Bruijn Graph is a directed graph where each node isa word of length k, called a kmer. An edge is present fromnode a to node b if the k − 1 suffix of node a is exactly thek−1 prefix of node b. A de Bruijn Graph can be built froma set of reads by cutting each read in overlapping kmers.Each read of size l is then a path of l − k + 1 nodes in thegraph. In this case, the de Bruijn Graph contains as manynodes as there are distinct kmers in the read dataset.Sequencing errors can generate numerous novel distinct
kmers that are present in only one or very few reads. Thisincreases drastically the number of nodes in the graph. Toavoid this, only kmers that are sufficiently covered in thedataset are represented in the graph, that is kmers havingmore than Tsol (solidity threshold) occurrences in the readdataset, hereafter called solid kmers.The number of nodes, the number of edge per node, and
the graph topology, have a strong impact on the size of thedata structure. A given node is said to be branching if ithas more than one in-going edges or more than one out-going edges. A simple path is then a path of nodes withoutany branching node. In order to efficiently store most ofthe reads, the graph should contain long simple paths suchthat the majority of reads will follow a simple path (with-out needing to store any bifurcation or difference). This isgoverned by two parameters, k and Tsol.
Benoit et al. BMC Bioinformatics (2015) 16:288 Page 4 of 14
Fig. 1 LEON method overview. First, a de Bruijn Graph is constructed from the reads: kmers are counted, then abundant enough kmers are insertedinto a bloom filter representing a probabilistic de Bruijn Graph. Reads are then mapped to this graph, and the necessary information required torebuild the reads from the graph is stored in the compressed file: an anchoring kmer and a list of bifurcations
Although both parameters are tunable by the user, thedefault mode of LEON does not require any user choice.The default k value is 31 and the optimal Tsol valueis inferred automatically from the analysis of the kmercounts profile, with a method similar to the one usedin KMERGENIE [17], and also briefly discussed in theAdditional file 1: Section 2.
Probabilistic de Bruijn GraphA traditional implementation of a de Bruijn Graphrequires a lot of memory. For example, hash table imple-mentation similar to the one by Iqbal et al. [18],that storesfor each node, a kmer and a byte containing the edges,requires at least 8� k
32� + 1 bytes per node. This meansapproximately 27 GB for a human sized genome, which islargely prohibitive for compression purposes. Therefore amore lightweight implementation is required.The notion of probabilistic de Bruijn Graph was first
introduced by T.Brown et al. [19], and refers to a de BruijnGraph represented as a Bloom filter. It was shown thatthe graph nodes can be encoded with as little as 4 bitsper node, with the drawback of introducing false nodesand false branchings. Chikhi and Rizk [20] then also useda bloom filter to store the de Bruijn Graph. An addi-tional structure storing critical false positives, renderedthe de Bruijn Graph representation exact at a total cost ofapproximately 13 bits per node, then improved to 8 bitsper node with cascading bloom filters [21].The Bloom filter [16] is a space efficient hash-based
data structure, designed to test whether an element is ina set. It is made up of a bit array initialized with zeros,and a set of hash functions. When inserting or querying
for an element, its hash values are computed yielding aset of array positions. The insert operation corresponds tosetting to 1 all these positions, whereas membership oper-ation returns yes if and only if all the bits at these positionsare set to 1. A no answer means the element is definitelynot in the set. A yes answer indicates that the element mayor may not be in the set. Hence, the Bloom filter has one-sided errors. The probability of false positives increaseswith the number of elements inserted in the Bloom filter.Inserting the graph nodes in the bloom filter is suffi-
cient to represent the de Bruijn Graph. Graph edges canbe inferred by querying for the existence of all 4 possiblesuccessors of a given node.For LEON’s compression purposes the main issue is the
total graph size, while the exact representation of thegraph is not a major issue: it only implies that additionalbifurcation events may need to be stored for some reads.Therefore, a probabilistic de Bruijn Graph is chosen, sinceit provides both memory-efficient representation and rea-sonably fast construction of the graph: the list of solidkmers are simply inserted into a bloom filter.There is a trade-off between the size of the bloom fil-
ter and its impact on the storage size of each read: a smallbloom filter will take less space in the compressed file butwill induce more storage space for each read. Since thebloom filter size is amortized across all reads, the opti-mal bloom filter size depends on the depth of sequencing(see Additional file 1: Section 5).
Encoding the read sequencesThe reference stored in the de Bruijn Graph does not con-tain all the necessary information to retrieve a given read.

Benoit et al. BMC Bioinformatics (2015) 16:288 Page 5 of 14
The idea is to store the minimum information requiredto reconstruct a read from the graph when decompress-ing. The data needed is an anchor kmer to indicate whereto begin the reconstruction in the graph, a list of bifurca-tions to tell which path to follow, and the read size to knowwhen to stop read reconstruction.
Dictionary of anchorsAn anchor kmer is required to reconstruct a read fromthe graph. It is equivalent of read position in a referencegenome for reference-based compression methods.This is an important issue. A naive solution storing the
raw kmer for each read would require to store, for exam-ple, k out of the total l nucleotides of a read, representingk/l = 30/100 in a typical situation. This would severelylimit the overall compression ratio.LEON tackles this problem by reusing several times the
same anchor kmer for different reads. Common anchorkmers are stored in a dictionary of kmers saved in thecompressed file. Thus, an index in this dictionary is suffi-cient to encode a kmer anchor, requiring much less spacethan a kmer.The selection procedure for the anchor kmer is as fol-
lows: each kmer of a read is considered as a putativeanchor and queried in the dictionary of anchors. Whenone is found, the procedure stops and the anchor kmer isencoded as its index in the dictionary. If none is found,one suitable anchor kmer is selected in the read, theninserted in the dictionary. A suitable kmer is a solid kmer,i.e. a kmer that is also guaranteed by design to be a graphnode. When no suitable kmers are found, the read cannotbe mapped to the graph, it is encoded as a read withoutanchor.
Bifurcation listThe bifurcation list tells how the read is mapped to thegraph, i.e. which path it follows whenever a bifurcationoccurs. Since the anchoring kmer can be in the middleof the read, two bifurcation lists are needed, along withthe sizes of the two paths. In practice, only read lengthand anchor position are encoded, from which the twopaths sizes can be inferred. In the following, only the pathat the right of the anchor is described, the other beingsymmetrical.Starting from the anchor, the four possible kmer suc-
cessors are queried in the de Bruijn Graph, and comparedto the following kmer in the read. If only one succes-sor exists and is the same as the kmer in the read, thisis a simple path, nothing needs to be encoded. On thecontrary, whenever an ambiguity occurs, such as severalneighbors in the graph, the real nucleotide is added tothe bifurcation list. It should be noted that, in general,the bifurcation position in the read is not required, sinceit is contained in the graph. However, in the special case
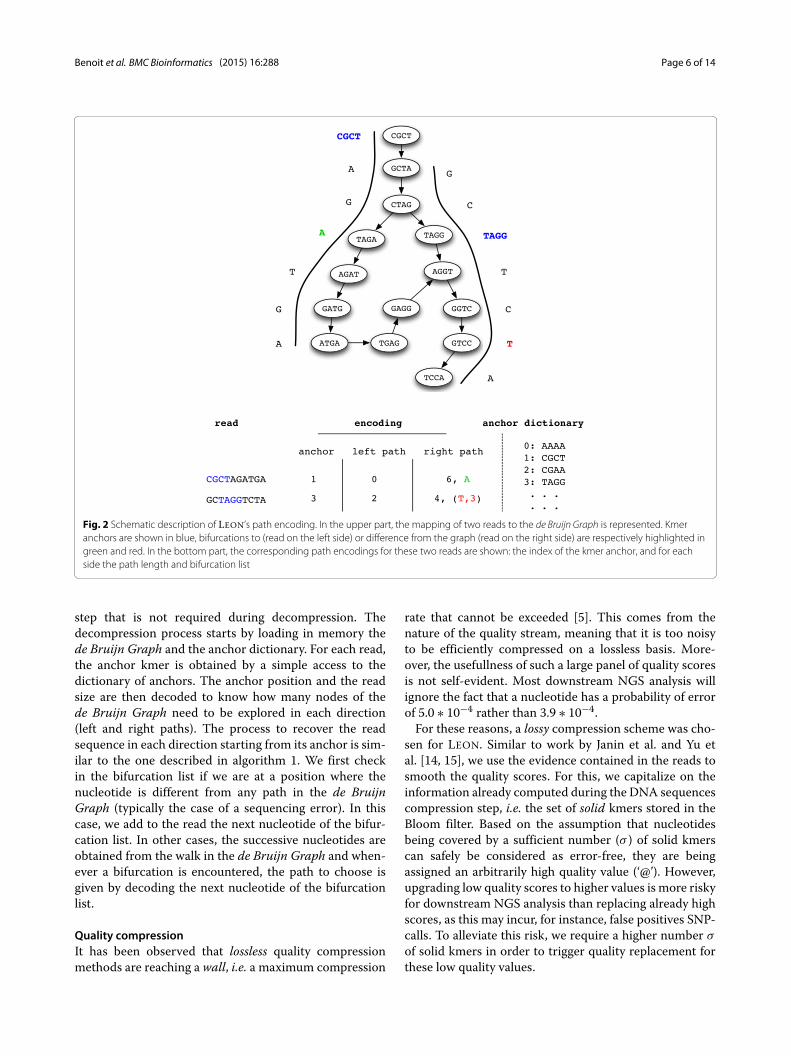
of a simple path that is different from the read, bothnucleotide and read position needs to be added. This isthe case for instance for a sequencing error in the read.In this case, when decompressing, the error position can-not be inferred from the graph. The detailed constructionmechanism is explained in Algorithm 1, and an encodingexample is shown in Fig. 2.
Algorithm 1: Right side bifurcation list construction.Input: read R, anchor position Pa, de Bruijn Graph GOutput: bifurcation list Lb
1 Lb ←− ∅2 Kmer K ←− R[Pa . . Pa + k − 1]3 for i ← Pa to |R| − k − 1 do4 Nt = R[ i + k]5 Knext = Suffix(K , k − 1) + Nt6 Lsucc = Successors_in_graph(K ,G)7 if size of Lsucc = 1 then8 if Knext ∈ Lsucc then
// nothing to do
9 else// probable sequencing error
10 Lb ← (Nt, i + k)11 K = Lsucc[ 0]12 else13 Lb ← Nt14 K = Knext
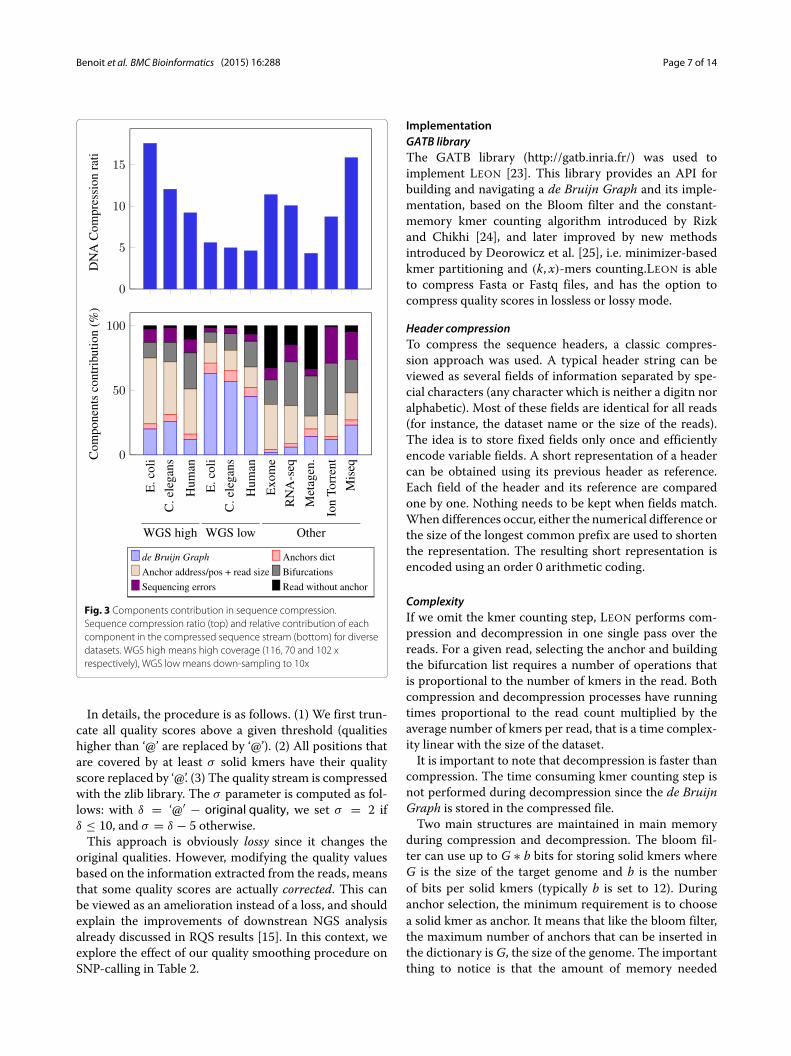
Reads without anchorReads that cannot be mapped to the graph are simplyencoded in the file with their raw sequence of nucleotides.This only happens if no kmer of the read is solid,i.e. if there is at least one sequencing error every knucleotides or if the read is from a low covered region.Therefore, this is a rare event, it does not impact sig-nificantly the compression ratio (verified experimentally,see Fig. 3).
Arithmetic codingAll elements inserted in the compressed file (except forthe bloom filter) are encoded with order 0 arithmeticcoding [22]. LEON uses an individual model for each com-ponent (read size, anchor position, bifurcation list, rawnucleotides for un-anchored reads, dictionary of anchors),registering symbol frequencies and assigning fewer bits tofrequent symbols.
DecompressionThe main difference between the decompression andthe compression processes is the reference building
Benoit et al. BMC Bioinformatics (2015) 16:288 Page 6 of 14
Fig. 2 Schematic description of LEON’s path encoding. In the upper part, the mapping of two reads to the de Bruijn Graph is represented. Kmeranchors are shown in blue, bifurcations to (read on the left side) or difference from the graph (read on the right side) are respectively highlighted ingreen and red. In the bottom part, the corresponding path encodings for these two reads are shown: the index of the kmer anchor, and for eachside the path length and bifurcation list
step that is not required during decompression. Thedecompression process starts by loading in memory thede Bruijn Graph and the anchor dictionary. For each read,the anchor kmer is obtained by a simple access to thedictionary of anchors. The anchor position and the readsize are then decoded to know how many nodes of thede Bruijn Graph need to be explored in each direction(left and right paths). The process to recover the readsequence in each direction starting from its anchor is sim-ilar to the one described in algorithm 1. We first checkin the bifurcation list if we are at a position where thenucleotide is different from any path in the de BruijnGraph (typically the case of a sequencing error). In thiscase, we add to the read the next nucleotide of the bifur-cation list. In other cases, the successive nucleotides areobtained from the walk in the de Bruijn Graph and when-ever a bifurcation is encountered, the path to choose isgiven by decoding the next nucleotide of the bifurcationlist.
Quality compressionIt has been observed that lossless quality compressionmethods are reaching a wall, i.e. a maximum compression
rate that cannot be exceeded [5]. This comes from thenature of the quality stream, meaning that it is too noisyto be efficiently compressed on a lossless basis. More-over, the usefullness of such a large panel of quality scoresis not self-evident. Most downstream NGS analysis willignore the fact that a nucleotide has a probability of errorof 5.0 ∗ 10−4 rather than 3.9 ∗ 10−4.For these reasons, a lossy compression scheme was cho-
sen for LEON. Similar to work by Janin et al. and Yu etal. [14, 15], we use the evidence contained in the reads tosmooth the quality scores. For this, we capitalize on theinformation already computed during the DNA sequencescompression step, i.e. the set of solid kmers stored in theBloom filter. Based on the assumption that nucleotidesbeing covered by a sufficient number (σ ) of solid kmerscan safely be considered as error-free, they are beingassigned an arbitrarily high quality value (‘@’). However,upgrading low quality scores to higher values is more riskyfor downstream NGS analysis than replacing already highscores, as this may incur, for instance, false positives SNP-calls. To alleviate this risk, we require a higher number σ
of solid kmers in order to trigger quality replacement forthese low quality values.
Benoit et al. BMC Bioinformatics (2015) 16:288 Page 7 of 14
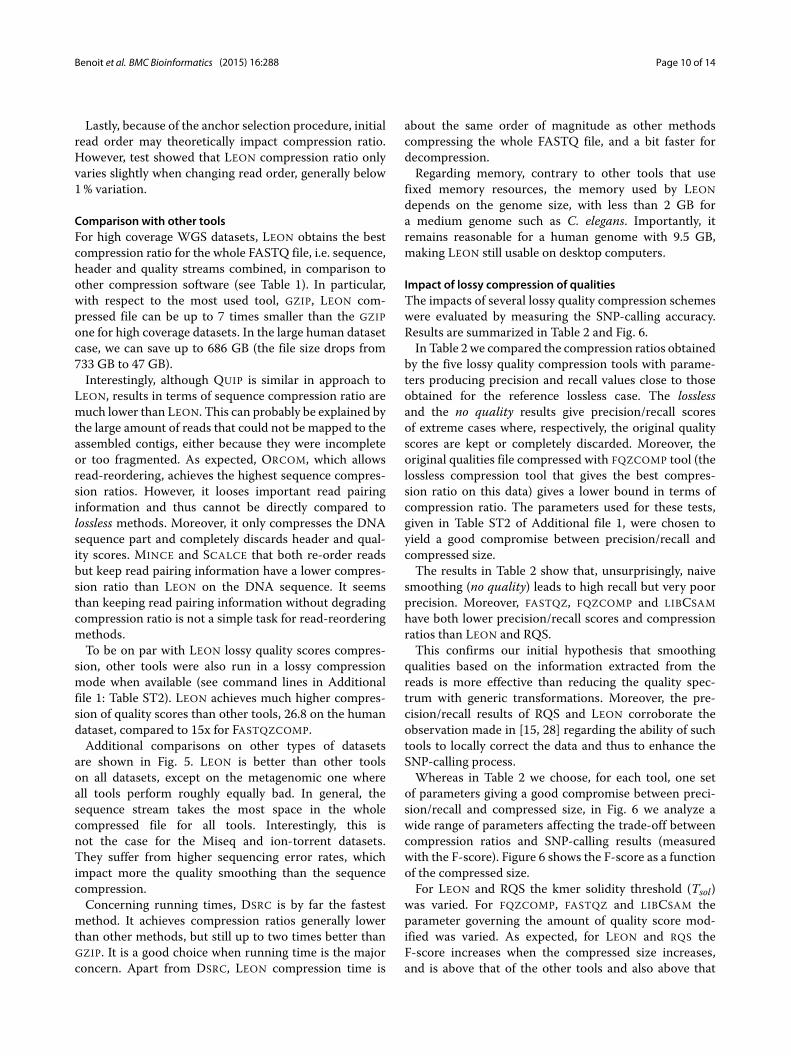
Fig. 3 Components contribution in sequence compression.Sequence compression ratio (top) and relative contribution of eachcomponent in the compressed sequence stream (bottom) for diversedatasets. WGS high means high coverage (116, 70 and 102 xrespectively), WGS low means down-sampling to 10x
In details, the procedure is as follows. (1) We first trun-cate all quality scores above a given threshold (qualitieshigher than ‘@’ are replaced by ‘@’). (2) All positions thatare covered by at least σ solid kmers have their qualityscore replaced by ‘@’. (3) The quality stream is compressedwith the zlib library. The σ parameter is computed as fol-lows: with δ = ‘@′ − original quality, we set σ = 2 ifδ ≤ 10, and σ = δ − 5 otherwise.This approach is obviously lossy since it changes the
original qualities. However, modifying the quality valuesbased on the information extracted from the reads, meansthat some quality scores are actually corrected. This canbe viewed as an amelioration instead of a loss, and shouldexplain the improvements of downstrean NGS analysisalready discussed in RQS results [15]. In this context, weexplore the effect of our quality smoothing procedure onSNP-calling in Table 2.
ImplementationGATB libraryThe GATB library (http://gatb.inria.fr/) was used toimplement LEON [23]. This library provides an API forbuilding and navigating a de Bruijn Graph and its imple-mentation, based on the Bloom filter and the constant-memory kmer counting algorithm introduced by Rizkand Chikhi [24], and later improved by new methodsintroduced by Deorowicz et al. [25], i.e. minimizer-basedkmer partitioning and (k, x)-mers counting.LEON is ableto compress Fasta or Fastq files, and has the option tocompress quality scores in lossless or lossy mode.
Header compressionTo compress the sequence headers, a classic compres-sion approach was used. A typical header string can beviewed as several fields of information separated by spe-cial characters (any character which is neither a digitn noralphabetic). Most of these fields are identical for all reads(for instance, the dataset name or the size of the reads).The idea is to store fixed fields only once and efficientlyencode variable fields. A short representation of a headercan be obtained using its previous header as reference.Each field of the header and its reference are comparedone by one. Nothing needs to be kept when fields match.When differences occur, either the numerical difference orthe size of the longest common prefix are used to shortenthe representation. The resulting short representation isencoded using an order 0 arithmetic coding.
ComplexityIf we omit the kmer counting step, LEON performs com-pression and decompression in one single pass over thereads. For a given read, selecting the anchor and buildingthe bifurcation list requires a number of operations thatis proportional to the number of kmers in the read. Bothcompression and decompression processes have runningtimes proportional to the read count multiplied by theaverage number of kmers per read, that is a time complex-ity linear with the size of the dataset.It is important to note that decompression is faster than
compression. The time consuming kmer counting step isnot performed during decompression since the de BruijnGraph is stored in the compressed file.Two main structures are maintained in main memory
during compression and decompression. The bloom fil-ter can use up to G ∗ b bits for storing solid kmers whereG is the size of the target genome and b is the numberof bits per solid kmers (typically b is set to 12). Duringanchor selection, the minimum requirement is to choosea solid kmer as anchor. It means that like the bloom filter,the maximum number of anchors that can be inserted inthe dictionary is G, the size of the genome. The importantthing to notice is that the amount of memory needed
Benoit et al. BMC Bioinformatics (2015) 16:288 Page 8 of 14
by LEON is not related to the size of the input file butproportional to the size of the target genome.
ParallelizationTo allow our method to fully benefit from multi-threading, reads of the input file are split in blocks of nreads. Each block is then processed independently of theothers by a given thread.Parallelization speed-up is shown in Additional file 1:
Figure S3.
Datasets and toolsNGS datasetsLEON’s performance was evaluated on several publiclyavailable read datasets. Main tests and comparisons wereperformed on whole genome sequencing (WGS) Illuminadatasets with high coverage (more than 70x), from threeorganisms showing a large range of genome sizes andcomplexities: a bacteria E. coli (G=5 Mbp), a nematodeC. elegans (G=100 Mbp) and a human individual (G=3Gbp). The largest file tested is the WGS human one with102x coverage resulting in an uncompressed fastq file sizeof 733 GB. To evaluate the impact of sequencing depth,these datasets were then randomly down-sampled. Addi-tionally, other types of sequencing protocols and tech-nologies were tested, such as RNA-seq, metagenomics,exome sequencing or Ion Torrent technology. Detailedfeatures and accession numbers of each dataset are givenin Additional file 1: Table ST1.
Other tools and evaluation criteriaSeveral compression software were run on these datasetsto compare with LEON, from best state-of-the-art tools tothe general purpose compressor GZIP (Additional file 1:Table ST2). Tools that are able to compress the whole fastqfiles and that allow to properly handle paired reads werepreferentially chosen. SCALCE and MINCE that re-orderreads were run with their option to keep paired readstogether. Additionally, being the best read-reordering tool,Orcom was kept for reference. However, it cannot bedirectly compared to other tools as it loses the read pairinginformation. Manually concatenating paired reads beforecompression is possible for ORCOM, however this leadsto poor compression ratio. Hence we decided to showORCOM results only in the mode that lose paired readinformation.LEON and concurrent tools were compared on the fol-
lowing main criteria: (i) compression ratio, expressed asthe original file size divided by the compressed file size,(ii) compression time, (iii) de-compression time and (iv)main memory used during compression.Since the maincompared feature is compression ratio, concurrent toolswere tuned for maximum compression when possible.LEON was always used with default parameters.Moreover,since LEON’s default mode for quality score compression
is lossy, other tools were also run in a lossy configurationfor quality scores (see Additional file 1: Section 4.1 foradditional details and used command lines).All tools were run on a machine equipped with a 2.50
GHz Intel E5-2640 CPU with 12 cores, 192 GB of mem-ory.All tools were set to use 8 threads.
Lossy quality compression evaluationLossy quality compression ratios cannot be comparedwithout also taking into account the impact of the lossytransformation of the quality stream on downstream anal-ysis, for instance SNP-calling accuracy. An experiment ona read dataset from the “1000 genomes project” (phase1 release) was performed. More specifically, SNPs werecalled before and after several lossy quality transforma-tions on a low coverage Illumina read sequences dataset,corresponding to the human chromosome 20 (HG00096individual, SRR062634).Five reference-free, lossy quality compression tools were
tested together with LEON, each of them being represen-tative for a particular category of methods: FASTQZ thatlowers the number of bins of the quality spectrum, LIBC-SAM and FQZCOMP that smooth qualities within a block,and RQS as a tool that, similarly to LEON, uses informa-tion extracted from the DNA sequences. The SNP-callingresults obtained for the original qualities were comparedwith those for the transformed qualities, and with thoseobtained for a naive quality transformation where all qual-ities are replaced by an arbitrarily chosen high score value,’H’ (this corresponds to the extreme case where all qual-ities are discarded). Reads were mapped with BWA, thensamtools mpileup followed by bcftools procedure wasused to call SNPs and to generate the VCF files [26, 27].To assess the number of SNPs that were lost in each qual-ity transformation process, as well as the ones that werepotentially found in addition to those detected with theoriginal qualities, each VCF file was compared to whatwe consider to be the reference SNP set, i.e. the VCF filethat was produced by the “1000 genomes project” on thesame sequencing data. The precision and recall measureswere computed with respect to the VCF reference file,with the same procedure detailed by the authors of LIBC-SAM [13]. For RQS that only transforms qualities, and forLEON (that compresses the header and the sequence butonly transforms the quality part), the quality streams werecompressed with the general purpose compression toolGZIP.
ResultsImpact of the parameters and de Bruijn Graph falsepositivesThe compression ratio of LEON crucially depends on thequality of the reference that is built de novo from the reads,the probabilistic de Bruijn Graph.
Benoit et al. BMC Bioinformatics (2015) 16:288 Page 9 of 14
In order to evaluate the impact of using an approxi-mate de Bruijn Graph compared to an exact representa-tion, the compression ratio of LEON was computed forseveral sizes of bloom filters expressed as a number ofbits per node. The larger the bloom filter, the fewer thefalse positives but the more space is needed to storeit. Figure S4 in Additional file 1 shows that the opti-mal trade-off lies around 10 bits per solid kmer, for the70x C. elegans dataset. It also demonstrates that correct-ness of de Bruijn Graph is not essential for compressionpurposes.The kmer size and the minimal abundance thresh-
old (parameters k and Tsol respectively) also impact thecompression ratio, as they control the number of nodesand the topology of the exact de Bruijn Graph. In factLEON compression ratio proves to be robust to variationsof these parameters around the optimal values (see theresults on varying these parameters in Additional file 1:Figures S1 and S2). Therefore, LEON can safely be usedwith its default parameters.
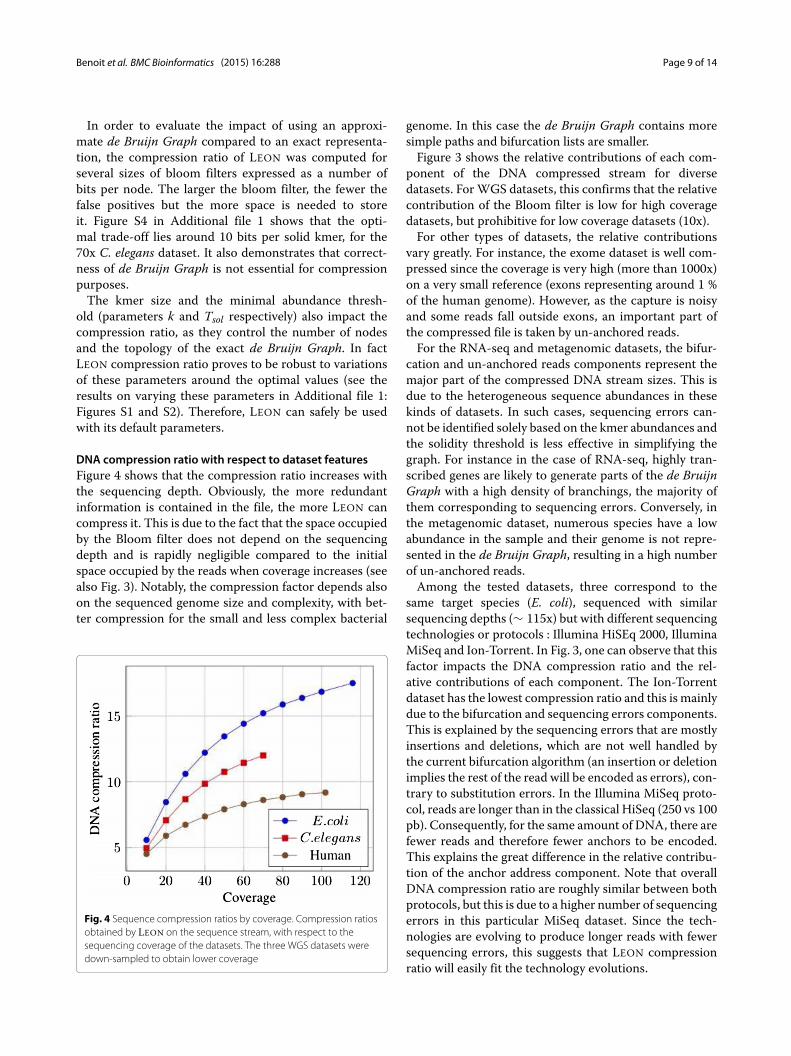
DNA compression ratio with respect to dataset featuresFigure 4 shows that the compression ratio increases withthe sequencing depth. Obviously, the more redundantinformation is contained in the file, the more LEON cancompress it. This is due to the fact that the space occupiedby the Bloom filter does not depend on the sequencingdepth and is rapidly negligible compared to the initialspace occupied by the reads when coverage increases (seealso Fig. 3). Notably, the compression factor depends alsoon the sequenced genome size and complexity, with bet-ter compression for the small and less complex bacterial
Fig. 4 Sequence compression ratios by coverage. Compression ratiosobtained by LEON on the sequence stream, with respect to thesequencing coverage of the datasets. The three WGS datasets weredown-sampled to obtain lower coverage
genome. In this case the de Bruijn Graph contains moresimple paths and bifurcation lists are smaller.Figure 3 shows the relative contributions of each com-
ponent of the DNA compressed stream for diversedatasets. ForWGS datasets, this confirms that the relativecontribution of the Bloom filter is low for high coveragedatasets, but prohibitive for low coverage datasets (10x).For other types of datasets, the relative contributions
vary greatly. For instance, the exome dataset is well com-pressed since the coverage is very high (more than 1000x)on a very small reference (exons representing around 1 %of the human genome). However, as the capture is noisyand some reads fall outside exons, an important part ofthe compressed file is taken by un-anchored reads.For the RNA-seq and metagenomic datasets, the bifur-
cation and un-anchored reads components represent themajor part of the compressed DNA stream sizes. This isdue to the heterogeneous sequence abundances in thesekinds of datasets. In such cases, sequencing errors can-not be identified solely based on the kmer abundances andthe solidity threshold is less effective in simplifying thegraph. For instance in the case of RNA-seq, highly tran-scribed genes are likely to generate parts of the de BruijnGraph with a high density of branchings, the majority ofthem corresponding to sequencing errors. Conversely, inthe metagenomic dataset, numerous species have a lowabundance in the sample and their genome is not repre-sented in the de Bruijn Graph, resulting in a high numberof un-anchored reads.Among the tested datasets, three correspond to the
same target species (E. coli), sequenced with similarsequencing depths (∼ 115x) but with different sequencingtechnologies or protocols : Illumina HiSEq 2000, IlluminaMiSeq and Ion-Torrent. In Fig. 3, one can observe that thisfactor impacts the DNA compression ratio and the rel-ative contributions of each component. The Ion-Torrentdataset has the lowest compression ratio and this is mainlydue to the bifurcation and sequencing errors components.This is explained by the sequencing errors that are mostlyinsertions and deletions, which are not well handled bythe current bifurcation algorithm (an insertion or deletionimplies the rest of the read will be encoded as errors), con-trary to substitution errors. In the Illumina MiSeq proto-col, reads are longer than in the classical HiSeq (250 vs 100pb). Consequently, for the same amount of DNA, there arefewer reads and therefore fewer anchors to be encoded.This explains the great difference in the relative contribu-tion of the anchor address component. Note that overallDNA compression ratio are roughly similar between bothprotocols, but this is due to a higher number of sequencingerrors in this particular MiSeq dataset. Since the tech-nologies are evolving to produce longer reads with fewersequencing errors, this suggests that LEON compressionratio will easily fit the technology evolutions.
Benoit et al. BMC Bioinformatics (2015) 16:288 Page 10 of 14
Lastly, because of the anchor selection procedure, initialread order may theoretically impact compression ratio.However, test showed that LEON compression ratio onlyvaries slightly when changing read order, generally below1% variation.
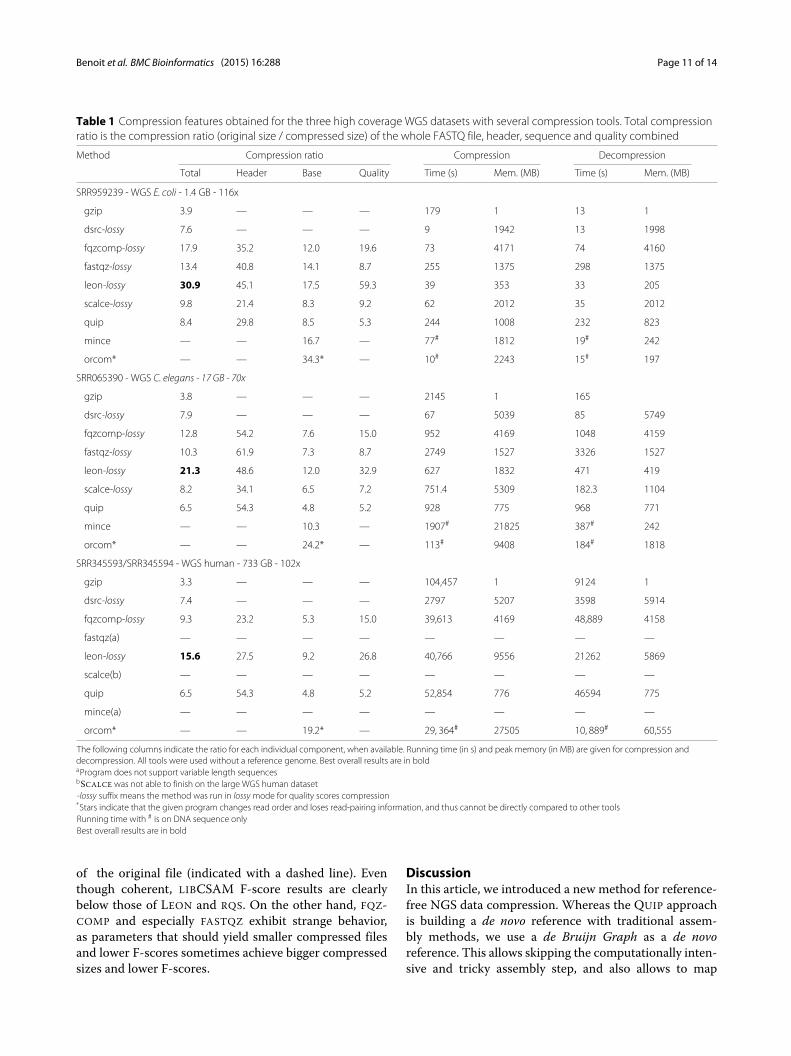
Comparison with other toolsFor high coverage WGS datasets, LEON obtains the bestcompression ratio for the whole FASTQ file, i.e. sequence,header and quality streams combined, in comparison toother compression software (see Table 1). In particular,with respect to the most used tool, GZIP, LEON com-pressed file can be up to 7 times smaller than the GZIPone for high coverage datasets. In the large human datasetcase, we can save up to 686 GB (the file size drops from733 GB to 47 GB).Interestingly, although QUIP is similar in approach to
LEON, results in terms of sequence compression ratio aremuch lower than LEON. This can probably be explained bythe large amount of reads that could not be mapped to theassembled contigs, either because they were incompleteor too fragmented. As expected, ORCOM, which allowsread-reordering, achieves the highest sequence compres-sion ratios. However, it looses important read pairinginformation and thus cannot be directly compared tolossless methods. Moreover, it only compresses the DNAsequence part and completely discards header and qual-ity scores. MINCE and SCALCE that both re-order readsbut keep read pairing information have a lower compres-sion ratio than LEON on the DNA sequence. It seemsthan keeping read pairing information without degradingcompression ratio is not a simple task for read-reorderingmethods.To be on par with LEON lossy quality scores compres-
sion, other tools were also run in a lossy compressionmode when available (see command lines in Additionalfile 1: Table ST2). LEON achieves much higher compres-sion of quality scores than other tools, 26.8 on the humandataset, compared to 15x for FASTQZCOMP.Additional comparisons on other types of datasets
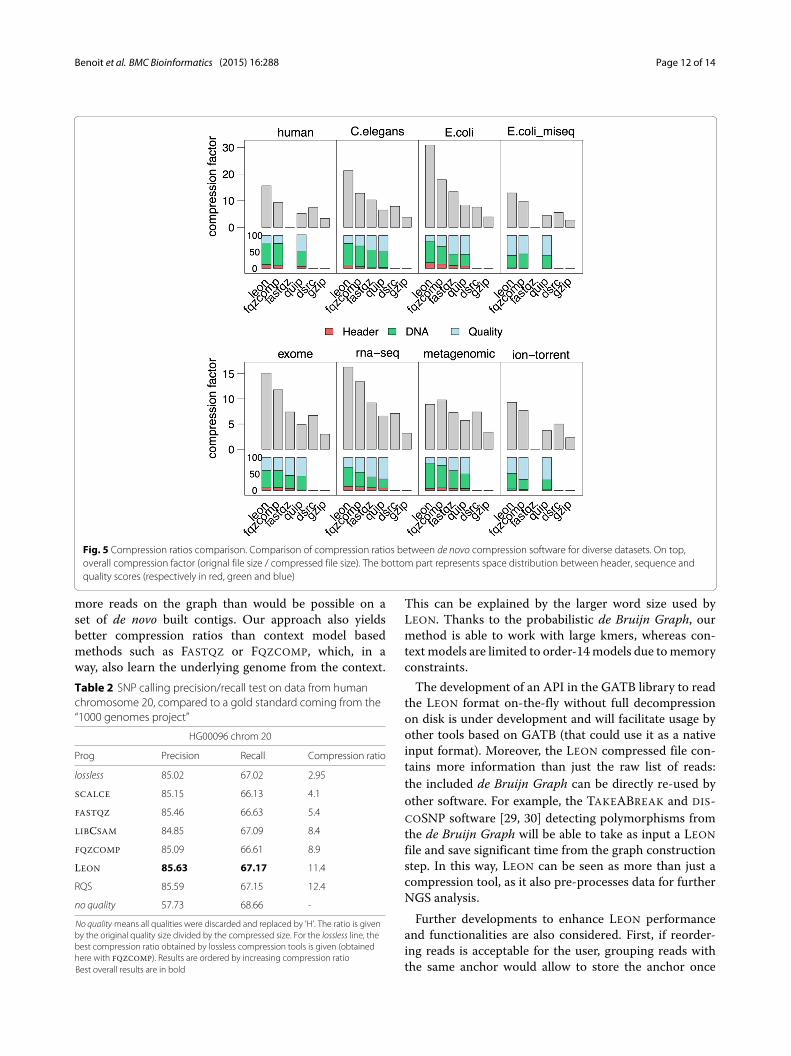
are shown in Fig. 5. LEON is better than other toolson all datasets, except on the metagenomic one whereall tools perform roughly equally bad. In general, thesequence stream takes the most space in the wholecompressed file for all tools. Interestingly, this isnot the case for the Miseq and ion-torrent datasets.They suffer from higher sequencing error rates, whichimpact more the quality smoothing than the sequencecompression.Concerning running times, DSRC is by far the fastest
method. It achieves compression ratios generally lowerthan other methods, but still up to two times better thanGZIP. It is a good choice when running time is the majorconcern. Apart from DSRC, LEON compression time is
about the same order of magnitude as other methodscompressing the whole FASTQ file, and a bit faster fordecompression.Regarding memory, contrary to other tools that use
fixed memory resources, the memory used by LEONdepends on the genome size, with less than 2 GB fora medium genome such as C. elegans. Importantly, itremains reasonable for a human genome with 9.5 GB,making LEON still usable on desktop computers.
Impact of lossy compression of qualitiesThe impacts of several lossy quality compression schemeswere evaluated by measuring the SNP-calling accuracy.Results are summarized in Table 2 and Fig. 6.In Table 2 we compared the compression ratios obtained
by the five lossy quality compression tools with parame-ters producing precision and recall values close to thoseobtained for the reference lossless case. The losslessand the no quality results give precision/recall scoresof extreme cases where, respectively, the original qualityscores are kept or completely discarded. Moreover, theoriginal qualities file compressed with FQZCOMP tool (thelossless compression tool that gives the best compres-sion ratio on this data) gives a lower bound in terms ofcompression ratio. The parameters used for these tests,given in Table ST2 of Additional file 1, were chosen toyield a good compromise between precision/recall andcompressed size.The results in Table 2 show that, unsurprisingly, naive
smoothing (no quality) leads to high recall but very poorprecision. Moreover, FASTQZ, FQZCOMP and LIBCSAMhave both lower precision/recall scores and compressionratios than LEON and RQS.This confirms our initial hypothesis that smoothing
qualities based on the information extracted from thereads is more effective than reducing the quality spec-trum with generic transformations. Moreover, the pre-cision/recall results of RQS and LEON corroborate theobservation made in [15, 28] regarding the ability of suchtools to locally correct the data and thus to enhance theSNP-calling process.Whereas in Table 2 we choose, for each tool, one set
of parameters giving a good compromise between preci-sion/recall and compressed size, in Fig. 6 we analyze awide range of parameters affecting the trade-off betweencompression ratios and SNP-calling results (measuredwith the F-score). Figure 6 shows the F-score as a functionof the compressed size.For LEON and RQS the kmer solidity threshold (Tsol)
was varied. For FQZCOMP, FASTQZ and LIBCSAM theparameter governing the amount of quality score mod-ified was varied. As expected, for LEON and RQS theF-score increases when the compressed size increases,and is above that of the other tools and also above that
Benoit et al. BMC Bioinformatics (2015) 16:288 Page 11 of 14
Table 1 Compression features obtained for the three high coverage WGS datasets with several compression tools. Total compressionratio is the compression ratio (original size / compressed size) of the whole FASTQ file, header, sequence and quality combined
Method Compression ratio Compression Decompression
Total Header Base Quality Time (s) Mem. (MB) Time (s) Mem. (MB)
SRR959239 - WGS E. coli - 1.4 GB - 116x
gzip 3.9 — — — 179 1 13 1
dsrc-lossy 7.6 — — — 9 1942 13 1998
fqzcomp-lossy 17.9 35.2 12.0 19.6 73 4171 74 4160
fastqz-lossy 13.4 40.8 14.1 8.7 255 1375 298 1375
leon-lossy 30.9 45.1 17.5 59.3 39 353 33 205
scalce-lossy 9.8 21.4 8.3 9.2 62 2012 35 2012
quip 8.4 29.8 8.5 5.3 244 1008 232 823
mince — — 16.7 — 77# 1812 19# 242
orcom* — — 34.3* — 10# 2243 15# 197
SRR065390 - WGS C. elegans - 17 GB - 70x
gzip 3.8 — — — 2145 1 165
dsrc-lossy 7.9 — — — 67 5039 85 5749
fqzcomp-lossy 12.8 54.2 7.6 15.0 952 4169 1048 4159
fastqz-lossy 10.3 61.9 7.3 8.7 2749 1527 3326 1527
leon-lossy 21.3 48.6 12.0 32.9 627 1832 471 419
scalce-lossy 8.2 34.1 6.5 7.2 751.4 5309 182.3 1104
quip 6.5 54.3 4.8 5.2 928 775 968 771
mince — — 10.3 — 1907# 21825 387# 242
orcom* — — 24.2* — 113# 9408 184# 1818
SRR345593/SRR345594 - WGS human - 733 GB - 102x
gzip 3.3 — — — 104,457 1 9124 1
dsrc-lossy 7.4 — — — 2797 5207 3598 5914
fqzcomp-lossy 9.3 23.2 5.3 15.0 39,613 4169 48,889 4158
fastqz(a) — — — — — — — —
leon-lossy 15.6 27.5 9.2 26.8 40,766 9556 21262 5869
scalce(b) — — — — — — — —
quip 6.5 54.3 4.8 5.2 52,854 776 46594 775
mince(a) — — — — — — — —
orcom* — — 19.2* — 29, 364# 27505 10, 889# 60,555
The following columns indicate the ratio for each individual component, when available. Running time (in s) and peak memory (in MB) are given for compression anddecompression. All tools were used without a reference genome. Best overall results are in boldaProgram does not support variable length sequencesbSCALCE was not able to finish on the large WGS human dataset-lossy suffix means the method was run in lossy mode for quality scores compression*Stars indicate that the given program changes read order and loses read-pairing information, and thus cannot be directly compared to other toolsRunning time with # is on DNA sequence onlyBest overall results are in bold
of the original file (indicated with a dashed line). Eventhough coherent, LIBCSAM F-score results are clearlybelow those of LEON and RQS. On the other hand, FQZ-COMP and especially FASTQZ exhibit strange behavior,as parameters that should yield smaller compressed filesand lower F-scores sometimes achieve bigger compressedsizes and lower F-scores.
DiscussionIn this article, we introduced a new method for reference-free NGS data compression. Whereas the QUIP approachis building a de novo reference with traditional assem-bly methods, we use a de Bruijn Graph as a de novoreference. This allows skipping the computationally inten-sive and tricky assembly step, and also allows to map
Benoit et al. BMC Bioinformatics (2015) 16:288 Page 12 of 14
Fig. 5 Compression ratios comparison. Comparison of compression ratios between de novo compression software for diverse datasets. On top,overall compression factor (orignal file size / compressed file size). The bottom part represents space distribution between header, sequence andquality scores (respectively in red, green and blue)
more reads on the graph than would be possible on aset of de novo built contigs. Our approach also yieldsbetter compression ratios than context model basedmethods such as FASTQZ or FQZCOMP, which, in away, also learn the underlying genome from the context.Table 2 SNP calling precision/recall test on data from humanchromosome 20, compared to a gold standard coming from the“1000 genomes project”
HG00096 chrom 20
Prog Precision Recall Compression ratio
lossless 85.02 67.02 2.95
SCALCE 85.15 66.13 4.1
FASTQZ 85.46 66.63 5.4
LIBCSAM 84.85 67.09 8.4
FQZCOMP 85.09 66.61 8.9
LEON 85.63 67.17 11.4
RQS 85.59 67.15 12.4
no quality 57.73 68.66 -
No quality means all qualities were discarded and replaced by ’H’. The ratio is givenby the original quality size divided by the compressed size. For the lossless line, thebest compression ratio obtained by lossless compression tools is given (obtainedhere with FQZCOMP). Results are ordered by increasing compression ratioBest overall results are in bold
This can be explained by the larger word size used byLEON. Thanks to the probabilistic de Bruijn Graph, ourmethod is able to work with large kmers, whereas con-text models are limited to order-14models due tomemoryconstraints.The development of an API in the GATB library to read
the LEON format on-the-fly without full decompressionon disk is under development and will facilitate usage byother tools based on GATB (that could use it as a nativeinput format). Moreover, the LEON compressed file con-tains more information than just the raw list of reads:the included de Bruijn Graph can be directly re-used byother software. For example, the TAKEABREAK and DIS-COSNP software [29, 30] detecting polymorphisms fromthe de Bruijn Graph will be able to take as input a LEONfile and save significant time from the graph constructionstep. In this way, LEON can be seen as more than just acompression tool, as it also pre-processes data for furtherNGS analysis.Further developments to enhance LEON performance
and functionalities are also considered. First, if reorder-ing reads is acceptable for the user, grouping reads withthe same anchor would allow to store the anchor once

Benoit et al. BMC Bioinformatics (2015) 16:288 Page 13 of 14
Fig. 6 Compression / accuracy trade-off for quality compression. Impact of lossy compression methods of quality scores on SNP calling, for a humanchromosome 20 (HG00096 individual, SRR062634) compared to a gold standard. Each line represents the F-score/compressed size trade-off for amethod, the higher the line, the better. The dashed line represents the F-score obtained by the original fastq file and by lossless compressionmethods
for many reads and save significant space. However, read-reordering strategy is acceptable in our opinion only ifread pairing information is preserved, which is not thecase of current read-reordering methods. With LEONmethod, since paired reads are close in the graph, it may bepossible to encode paired reads together, by also encodingthe path in-between reads. This would allow read reorder-ing without losing read pairing information. Secondly, thedetection of insertion and deletion errors could boost sub-stantially the compression ratio of datasets issued fromnovel sequencing technologies (Ion Torrent or Pacific Bio-science). Moreover, our approachmakes it possible to dealwith multiple datasets efficiently. It would be straightfor-ward to store the de Bruijn Graph only once for severaldatasets sequenced from the same organism for instance,and thus improving compression ratio.Lastly, our approach bears some similarities with error
correction methods. When reads are anchored to thegraph, some sequencing errors are clearly identified andsaved in the file for the decompression. It could becombined with more powerful error detection algorithmsto provide state-of-the art error correction, for examplewith the BLOOCOO1 tool already implemented with theGATB library [23]. It would then be straightforward topropose an option when decompressing the file, to choose
between lossless sequence decompression mode, or withthe sequencing errors corrected.
ConclusionsWe introduced LEON, an all-in-one software for FASTQfile compression that handles DNA, header and qualityscores. LEON uses the same data structure for both DNAand quality scores compression, a de Bruijn Graph com-pactly stored in a Bloom filter. The quality compressionscheme is lossy, allowing for good overall compressionratios, without losing the essential quality informationand thus not hampering downstream NGS analysis. LEONachieves higher compression ratios than other state-ofthe art tools and seems robust regarding diverse types ofdata.
Endnote1 http://gatb.inria.fr/software/bloocoo/
Additional file
Additional file 1: Supplementary material. This supplementary filecontains full details of datasets used and command line parameters oftools benchmarked, as well as additional test results concerning the impactof parameters k and Tsol on LEON. (PDF 116 kb)

Benoit et al. BMC Bioinformatics (2015) 16:288 Page 14 of 14
Availability of supporting dataAll datasets used for tools benchmarking are publicly available in theSequence Read Archive (SRA) and were downloaded either from the NCBI orEBI web servers. Full list of SRA accession numbers is detailed in table ST1 inthe Additional file 1.
AbbreviationsNGS: next-generation sequencing; SNP: single-nucleotide polymorphism;BWT:Burrows-Wheeler transform; LCP: Longest common prefix; WGS:Whole-genome sequencing.
Competing interestsThe authors declare that they have no competing interests.
Authors’ contributionsGB, CL, DL, RU and GR participated in the design of the algorithm. GB and GRimplemented the method. RU, TD and GR designed and implemented thequality score compression algorithm. ED, GR, GB and CL carried out thecomparative benchmarks. All authors read and approved the final manuscript.
AcknowledgementsThe authors are grateful to Thomas Derrien, Rayan Chikhi and DelphineNaquin for beta-testing. This work was supported by theANR-12-EMMA-0019-01 GATB project and ANR-12-BS02-0008 Colib’readproject. The GenOuest BioInformatics Platform provided the computingresources necessary for benchmarking.
Author details1INRIA/IRISA/GenScale, Campus de Beaulieu, 35042 Rennes, France.2University of Bordeaux, CNRS/LaBRI, F-33405 Talence, France. 3University ofBordeaux, CBiB, F-33000 Bordeaux, France.
Received: 16 April 2015 Accepted: 17 August 2015
References1. Leinonen R, Sugawara H, Shumway M. The sequence read archive.
Nucleic Acids Res. 2010;39:1019.2. Jones DC, Ruzzo WL, Peng X, Katze MG. Compression of next-generation
sequencing reads aided by highly efficient de novo assembly. NucleicAcids Res. 2012;40(22):171. doi:10.1093/nar/gks754.
3. Fritz MHY, Leinonen R, Cochrane G, Birney E. Efficient storage of highthroughput sequencing data using reference-based compression.Genome Res. 2011;21:734–40. doi:10.1101/gr.114819.110.
4. Kingsford C, Patro R. Reference-based compression of short-readsequences using path encoding. Bioinformatics. 2015;31:071.
5. Bonfield JK, Mahoney MV. Compression of fastq and sam formatsequencing data. PLoS One. 2013;8(3):59190.doi:10.1371/journal.pone.0059190.
6. Hach F, Numanagic I, Alkan C, Sahinalp SC. Scalce: boosting sequencecompression algorithms using locally consistent encoding.Bioinformatics. 2012;28(23):3051–057. doi:10.1093/bioinformatics/bts593.
7. Deorowicz S, Grabowski S. Compression of dna sequence reads in fastqformat. Bioinformatics. 2011;27(6):860–2.
8. Grabowski S, Deorowicz S, Roguski Ł. Disk-based compression of datafrom genome sequencing. Bioinformatics. 2014;31:844.
9. Janin L, Schulz-Trieglaff O, Cox AJ. Beetl-fastq: a searchable compressedarchive for dna reads. Bioinformatics. 2014;30:387.
10. Patro R, Kingsford C. Data-dependent bucketing improves reference-freecompression of sequencing reads. Bioinformatics. 2015;31:248.
11. Cox AJ, Bauer MJ, Jakobi T, Rosone G. Large-scale compression ofgenomic sequence databases with the burrows–wheeler transform.Bioinformatics. 2012;28(11):1415–9.
12. Wan R, Anh VN, Asai K. Transformations for the compression of fastqquality scores of next-generation sequencing data. Bioinformatics.2012;28(5):628–35.
13. Cánovas R, Moffat A, Turpin A. Lossy compression of quality scores ingenomic data. Bioinformatics. 2014;30(15):2130–136.
14. Janin L, Rosone G, Cox AJ. Adaptive reference-free compression ofsequence quality scores. Bioinformatics. 2013;30:257.
15. Yu YW, Yorukoglu D, Berger B. Traversing the k-mer landscape of ngsread datasets for quality score sparsification. In: Research incomputational molecular biology. Springer; 2014. p. 385–99.
16. Kirsch A, Mitzenmacher M. Less hashing, same performance: Building abetter bloom filter. Algorithms-ESA 2006. 2006456–67.
17. Chikhi R, Medvedev P. Informed and automated k-mer size selection forgenome assembly. Bioinformatics. 2013;30:310.
18. Iqbal Z, Caccamo M, Turner I, Flicek P, McVean G. De novo assemblyand genotyping of variants using colored de bruijn graphs. Nat Genet.2012;44(2):226–32.
19. Pell J, Hintze A, Canino-Koning R, Howe A, Tiedje JM, Brown CT. Scalingmetagenome sequence assembly with probabilistic de bruijn graphs.Proc Natl Acad Sci. 2012;109(33):13272–7.
20. Chikhi R, Rizk G. Space-efficient and exact de bruijn graph representationbased on a bloom filter. Algorithms Mol Biol. 2013;8(1):22.doi:10.1186/1748-7188-8-22.
21. Salikhov K, Sacomoto G, Kucherov G. Using cascading bloom filters toimprove the memory usage for de brujin graphs. Algoritm Bioinforma.2013;9:364–76.
22. Witten I, Neal R, Cleary J. Arithmetic coding for data compression.Commun ACM. 1987;30:520–540.
23. Drezen E, Rizk G, Chikhi R, Deltel C, Lemaitre C, Peterlongo P, et al. Gatb:Genome assembly and analysis tool box. Bioinformatics. 2014.doi:10.1093/bioinformatics/btu406.
24. Rizk G, Lavenier D, Chikhi R. Dsk: k-mer counting with very low memoryusage. Bioinformatics. 2013;29(5):652–3.doi:10.1093/bioinformatics/btt020.
25. Deorowicz S, Kokot M, Grabowski S, Debudaj-Grabysz A. Kmc 2: Fast andresource-frugal k-mer counting. Bioinformatics. 2015;31:022.
26. Li H, Handsaker B, Wysoker A, Fennell T, Ruan J, Homer N, et al. Thesequence alignment/map format and samtools. Bioinformatics.2009;25(16):2078–079.
27. Li H, Durbin R. Fast and accurate short read alignment withburrows–wheeler transform. Bioinformatics. 2009;25(14):1754–60.
28. Yu YW, Yorukoglu D, Peng J, Berger B. Quality score compressionimproves genotyping accuracy. Nat Biotechnol. 2015;33(3):240–3.
29. Lemaitre C, Ciortuz L, Peterlongo P. Mapping-free and assembly-freediscovery of inversion breakpoints from raw ngs reads. Algoritm ComputBiol. 2014;8542:119–30. doi:10.1007/978-3-319-07953-0_10.
30. Uricaru R, Rizk G, Lacroix V, Quillery E, Plantard O, Chikhi R, et al.Reference-free detection of isolated snps. Nucleic Acids Res. 2015;43(2):11.
Submit your next manuscript to BioMed Centraland take full advantage of:
• Convenient online submission
• Thorough peer review
• No space constraints or color figure charges
• Immediate publication on acceptance
• Inclusion in PubMed, CAS, Scopus and Google Scholar
• Research which is freely available for redistribution
Submit your manuscript at www.biomedcentral.com/submit
Copyright © 2022 FDOKUMEN