Fractal compression of satellite images
13
J. Indian Soc. Remote Sens. (December 2008) 36:299–311 Fractal Compression of Satellite Images Jayanta Kumar Ghosh . Ankur Singh Received: 22 October 2007 / Accepted: 25 September 2008 Keywords Fractal compression . IRS satellite images J.K. Ghosh 1 () . Ankur Singh 2 1 Assistant Professor, Geomatics Engineering Group, Civil Engineering Department, Indian Institute of Technology Roorkee, Uttarakhand – 247667, India 2 Software Engineer, SAP Labs India Ltd., RMZ NXT, 2B/2C, Sonnenahalli Village, Mahadevapura, East Taluk, Bangalore – 560066, India e-mail: [email protected] Photonirvachak Abstract Fractal geometry provides a means for describing and analysing the complexity of various features present in digital images. In this paper, characteristics of Fractal based compression of satellite data have been tested for Indian Remote Sensing (IRS) images (of different bands and resolution). The fidelity and efficiency of the algorithm and its relationship with spatial complexity of images is also evaluated. Results obtained from fractal compression have been compared with popularly used compression methods such as JPEG 2000, WinRar. The effect of bands and pixel resolution on the compression rate has also been examined. The results from this study show that the fractal based compression method provides higher compression rate while maintaining the information content of RS images to a great extent than that of JPEG. This paper also asserts that information loss due to fractal compression is minimal. It may be concluded that fractal technique has many potential advantages for compression of satellite images. Introduction Rapid development of remote sensing technology leads to the generation of huge quantities of satellite data. These data, in the form of multispectral, multiresolution, multisensor, have become important sources for geographic information but require considerable space for storage. For example, a scene of LANDSAT TM image has 2,340 (rows) × 3,240 (columns) × 7 (bands) pixels. Each pixel requires 8 123 RESEARCH ARTICLE
-
Upload
independent -
Category
Documents
-
view
1 -
download
0
Transcript of Fractal compression of satellite images

J. Indian Soc. Remote Sens. (December 2008) 36:299–311
Fractal Compression of Satellite Images
Jayanta Kumar Ghosh . Ankur Singh
Received: 22 October 2007 / Accepted: 25 September 2008
Keywords Fractal compression . IRS satellite images
J.K. Ghosh1 (�) . Ankur Singh2
1Assistant Professor, Geomatics Engineering Group,Civil Engineering Department,Indian Institute of Technology Roorkee,Uttarakhand – 247667, India2 Software Engineer, SAP Labs India Ltd.,RMZ NXT, 2B/2C, Sonnenahalli Village,Mahadevapura, East Taluk, Bangalore – 560066, India
e-mail: [email protected]
Photonirvachak
Abstract Fractal geometry provides a means fordescribing and analysing the complexity of variousfeatures present in digital images. In this paper,characteristics of Fractal based compression ofsatellite data have been tested for Indian RemoteSensing (IRS) images (of different bands andresolution). The fidelity and efficiency of thealgorithm and its relationship with spatial complexityof images is also evaluated. Results obtained fromfractal compression have been compared with
popularly used compression methods such as JPEG2000, WinRar. The effect of bands and pixel resolutionon the compression rate has also been examined. Theresults from this study show that the fractal basedcompression method provides higher compressionrate while maintaining the information content of RSimages to a great extent than that of JPEG. This paperalso asserts that information loss due to fractalcompression is minimal. It may be concluded thatfractal technique has many potential advantages forcompression of satellite images.
Introduction
Rapid development of remote sensing technologyleads to the generation of huge quantities of satellitedata. These data, in the form of multispectral,multiresolution, multisensor, have become importantsources for geographic information but requireconsiderable space for storage. For example, a sceneof LANDSAT TM image has 2,340 (rows) × 3,240(columns) × 7 (bands) pixels. Each pixel requires 8
123
RESEARCH ARTICLE

300 J. Indian Soc. Remote Sens. (December 2008) 36:299–311
bits to represent 256 gray levels. So it needs424,569,600 bits of storage. For the images takenfrom IKONOS, the storage requirements are evenlarger because of high radiometric resolution (it uses11 bits to represent 2048 gray levels). On the otherhand, the complexity and density of remote sensingdata have also become much higher. For example, IRSPAN, LISS and other sensors provide data of about1 terabyte per day. The range of spatial resolutionsfrom these satellites varies from meters to tens ofkilometers, and with a wide range of wavelengthsfrom visible to microwave, as well as a morefrequently repeated coverage. Moreover, hyperspectral remote sensing satellites use a largenumbers of bands with resolution of tens of meters,and produces hundreds of gigabytes of data sets foreven small regional coverage. Similarly, terrestrial andvideo images are also generating quite a lot of data.Evidently, the amount of spatial and spectral satellitedata is enormous.
Despite rapid progress in mass-storage devices,demands for larger data storage capacity continueto outstrip the capabilities of available technologies.Thus, it is desirable to represent satellite image withfewer storage bits i.e., it is required to compress thesatellite data and when needed, to be able toreconstruct the original image. The compression ofimages not only reduces the cost of data storage byincreasing the effectiveness of storage resources butalso increases the effective speed of transmissionwithout ‘broad banding’. Image compression alsofacilitates storage and electronic transfer of images,maintaining fidelity and accuracy. A technique forcompression of images based on fractals is beingevolved. The objective of this paper is to evaluateand assess the utility of fractal based compressionfor satellite images.
This paper is organized as follows, in Section-2we have briefly discussed the concept of imagecompression and fractal compression technique.Section-3 covers the steps those have been adoptedfor compression of remote sensing images using
fractal technique. Section 4 describes the data usedfor the study and Section 5 discusses the results ofthe study.
A brief review on fractal image compression
The basic idea of image compression is to removeredundancy in images using an invertible lineartransformation(s) such as Fourier transformation,cosine and sine transform, Hadamard transform, andKarhunen-Loeve transform (KLT). This is achievedthrough transformation of correlated image into anarray of uncorrelated variables that can berepresented with fewer numbers of bits in storagecompared to the original image. The KLT producesexactly uncorrelated transform coefficients for finiteimages, but needs long computing time and largespaces.
Commercially popular JPEG-2000 format proposedby the Joint Photographic Experts Group (JPEG) hasfour steps algorithm for compressing an image,sequential encoding (based on the Digital CosineTransform), progressive encoding, losslessencoding; and hierarchical encoding (based on apredictive method). However, the conventionaltechniques used for compression of satellites imagesare associated with many limitations such asdecompression of large digital images is time-consuming, geometric degradation effect occurswith higher compression rates because coefficientsof Fourier, cosine, and sine are not ‘exactly’uncorrelated, these techniques do not includegeometrical and spatial relationship of the objectsand the inherent characteristics of geo-spatialimages. These compression techniques are primarilybased on the format of the images as these formatsdo not factor into the equation of the individualfeatures or any special peculiarities of the geo-spatialimages. Moreover, storage, compression rates andefficiency of existing methods are usually lower thanthe required limit. Thus, a compression technique

301J. Indian Soc. Remote Sens. (December 2008) 36:299–311
that can accommodate the geo-spatial features ofsatellite imagery is warrant of the present situation.The objective of paper is to evaluate compressionof satellite data based on fractal geometry.
The philosophy behind compression of image(s)using fractals is self similarity (Mandelbrot, 1982)in the image(s), which is characterized by IteratedFunction Systems (IFS) (Jacquin, 1990) and itsAttractor (Peitgen, 2003; Lee, 1998). Root of fractalgeometry lies in the works of 19th centurymathematician who found curves, such as Peanocurve, Wierstrass curve, Koch curve, etc (Peitgenet al., 2003) that are continuous everywhere butdifferentiable nowhere. Barnsley was the first whoproposed the idea of Fractal Image Compression,by which real-life objects or images would bemodelled by deterministic fractal objects-attractorsof sets of two-dimensional affine transformations(Bamsley et al., 1993). Iterated Function Systems(IFS) (Jacquin, 1992; Lu, 1997), a contractive affinetransformation constitute basic tool for fractalcompression. Theorems that serve the theoreticalbasis of fractal image compression are ContractiveMapping Fixed Point Theorem, Collage Theorem(Barnsley and Hurd, 1993). However, these theoriesdo not provide any constructive procedure for the‘encoding’ of a gray-tone image, because accordingto Contractive Mapping Fixed Point Theorem, eachimage has a unique fixed point, but in practice, it isimpossible to find a unique fixed point for a wholeimage. This particular task is performed by definingpiece-wise affine contractive transformations whichmake use of only partial self transformability ofimages, this is known as Partitioned IterationFunction System, according to which image ispartitioned in different parts, and the fixed points forthe corresponding parts are obtained throughdifferent transformations (or maps) (Lu, 1997;Peitgen et al., 2003).
The basic idea of the theorems is that in order tofind IFS (Iterated Function System) whose attractoris close to, or looks like a given set, one should seek
to find a set of contractive transformations on asuitable space with which the given set lies, suchthat the union, or collage of the images of the givenset under the transformation is close to or looks likethe given set (Lu, 1997; Peitgen, 2003). Any imagemodelled as a function f(x, y), we can apply affinetransformation W to an image f as W (f)��W (x, y,f(x,y)) to encode the image, where W determines howthe partitioned domains of an original image aremapped to the copy (Fisher, 1995).
The Iterative Function System (IFS) for grayimages can be written as:
���
�
�
���
�
��
���
�
�
���
�
�
���
�
�
���
�
�
���
�
�
���
�
�
i
i
i
ii
ii
ofe
zyx
sdcba
zyx
W00
00
where, W is the affine transformation, x and y arethe coordinates of a point and z is a brightness valueof the pixel in the gray scale image; ai, bi, ci, di, ei,and fi are the coefficients of the transformation,while si and oi determine the contrast and brightnessof the transformation (Fisher, 1995; Lu, 1997).
Adapted algorithm for fractal image compression
Step 1: Input Original Image - To read original imageinto the designated image buffer.
Step 2: Create Reference Region List - To prepare thelist of all possible reference regions for a destinationregion to match through partitioning of image byquadtree.
Step 3: Initialize destination region list - To allocatethe space for all possible fractal elements and set thedefault values.
Step 4: Search for the Fractal Match - Given adestination region, loop over all possible referenceregions to find the best match using a tolerancemetric for different tolerance level and hencecorresponding different compression ratio (Jacquin,1992). Error at different tolerance levels is defined as

302 J. Indian Soc. Remote Sens. (December 2008) 36:299–311
a distance between original and fractal compressedimage,
er1 (O, F)=d1 (O, F)= 2/1
,
2||,||,|| ��
���
��
jil jiFjiO
where, er1 is a error or distance (d1) between original(O) and fractal (F) compressed images at tolerancelevel l.
Step 5: Select fractal elements.
Step 6: Pack the fractal codes. Fractal parameters ofthe image (coefficients of equations), received fromstep 1 to 5 is persistently stored using standardlossless compression method as Huffman codingmethod. The idea behind Huffman coding is simplyto use shorter bit patterns for more commoncharacters, and longer bit patterns for less commoncharacters. In this way more bits are being saved.
Data used
Indian Remote Sensing satellite (IRS) LISS III sensorimages acquired on 02 November 2002 have beenused for this study. Spatial resolution of the sensoris 23.5 m but the images have been resampled at 20m and are having four spectral resolution. Twoimages (say, scene 1 and scene 2) of 512 × 512 eachhave been considered for this study. The scenecontains various types of land covers. Statisticaldetails (minimum and maximum DN values, mean,standard deviation of DN values of image pixels) ofall the four bands of both the images are as given inTables 1 and 2 respectively. Samples of Band 4 (nearinfra-red) and Band 5 (Middle infra-red) images ofscene1 and scene2 are as shown in Figs. 1 and 2respectively.
Table 2 Statistics of original and fractal compressed (derived) images of scene2
Band Status Min Max Mean Standard Coefficient of Entropy Compressiondeviation variance ratio
2Original 94 188 130.28 10.98 0.08 5.46 7.25Derived 89 186 128.31 10.16 0.08 5.34
3 Original 70 169 109.72 13.59 0.12 5.78 6.43Derived 61 169 108.24 13.04 0.12 5.72
4Original 54 162 109.26 8.13 0.07 4.88 16Derived 50 157 107.90 7.47 0.07 4.67
5Original 69 255 209.25 23.75 0.11 6.51 7.27Derived 61 253 206.84 23.75 0.11 6.52
Table 1 Statistics of original and fractal compressed (derived) images of scene1
Band Status Min Max Mean Standard Coefficient of Entropy Compressiondeviation variance ratio
2Original 94 193 131.10 12.39 0.09 5.64 7.22Derived 90 194 129.12 11.61 0.09 5.53
3Original 67 175 111.00 15.16 0.14 5.95 6.44Derived 62 175 109.46 14.54 0.13 5.89
4Original 54 170 111.37 10.26 0.09 5.15 14.11Derived 47 171 110.00 9.72 0.09 5.04
5Original 64 255 198.60 23.81 0.12 6.49 8.30Derived 62 253 196.21 23.79 0.12 6.49

303J. Indian Soc. Remote Sens. (December 2008) 36:299–311
To investigate the effect of various resolutionsof satellite images in fractal compression, IRS LISSII data (36.5 m spatial resolution), LISS III data (23.5m spatial resolution) and PAN data (5.8 m spatialresolution) of Roorkee (Latitude: 29º 52' 00"N;Longitude: 77º 53' 52" E) area have been used in thisstudy. These images are selected because of thepresence of different type of land cover classes inthe scene and thus highly complex images. Thestatistical details of the different resolution images(LISS II, LISS III and PAN) are given in Table 4.
Results and discussion
In order to evaluate the capability of fractalcompression, the characteristics of the fractalcompressed images are being studied and comparedwith that of original images. A comparison andevaluation of both the images on the criteria ofefficiency, fidelity have also been carried out.Moreover, the effects of bands and resolution on thefractal compression are also evaluated. Further, acomparative study between fractal compression andsome familiar compression methods have also beencarried out.
Fidelity evaluation
To evaluate the quality of fractal compression,statistical analysis of original and fractal compressedimages of scene1 and scene2 have been done andcompared with each other in all four bands. Thestatistical attributes of images includes minimum,maximum, mean, standard deviation of digital number(DN) values of image pixels and coefficient ofvariance of the digital number values of image pixels,are given in Tables 1 and 2 respectively for originaland fractal compressed scene1 and scene 2. A closelook at the minimum and maximum DN values oforiginal and fractal compressed images shows thatminimum and maximum values for the original andderived images are very close to each other, andhence the range of DN values are also similar. Forexample: in scene1 band 5 samples have minimumDN values for original and derived images as 64 &62 and maximum as 255 & 253 and thus ranges forboth the images are same i.e., 191 [(255–64) & (253–62)]. Corresponding data for band 2 samples ofscene2 are (94, 89), (188, 186) and ranges are 94 and97 respectively. The mean and standard deviationvalues are also found to be quite close to each otherin all the bands and in both the images. For example,mean values of band 2 samples of scene2 for originaland derived images are 130.28 and 128.31 and forband 5 samples of scene1 these are found to be
Fig. 1 Original band 4 (near IR) image of first scene.
Fig. 2 Original band 5 (mid IR) image of second scene.
304 J. Indian Soc. Remote Sens. (December 2008) 36:299–311
198.60 and 196.21 respectively. Standard deviationsof band 4 samples of scene1 for original and derivedimages are 10.26 and 9.72 and for band 3 sample ofscene2, these are 13.59 and 13.04 respectively.Variation in the mean values of original and derivedimages ranges around 1 to 2.5 and in standarddeviation around 0.8 to 0.01. The values of thecoefficient of variance for different band samplesshow no difference between the original and fractalcompressed images (Tables 1 and 2) till two placesof decimal. For example: the coefficient of variancesof original and derived images of band 2 samples ofscene1 are 0.09 and 0.09; of band 3 samples of scene2are 0.12 and 0.12 respectively.
Based on the results and their analysis, it is foundthat fractal compressed images maintain the qualityof the original images within a very acceptable rangeof fidelity. The statistical qualities reveal that theoriginal and the fractal compressed images are quitesimilar to each other. The fidelity of fractalcompression for original and compressed images aremore or less same.
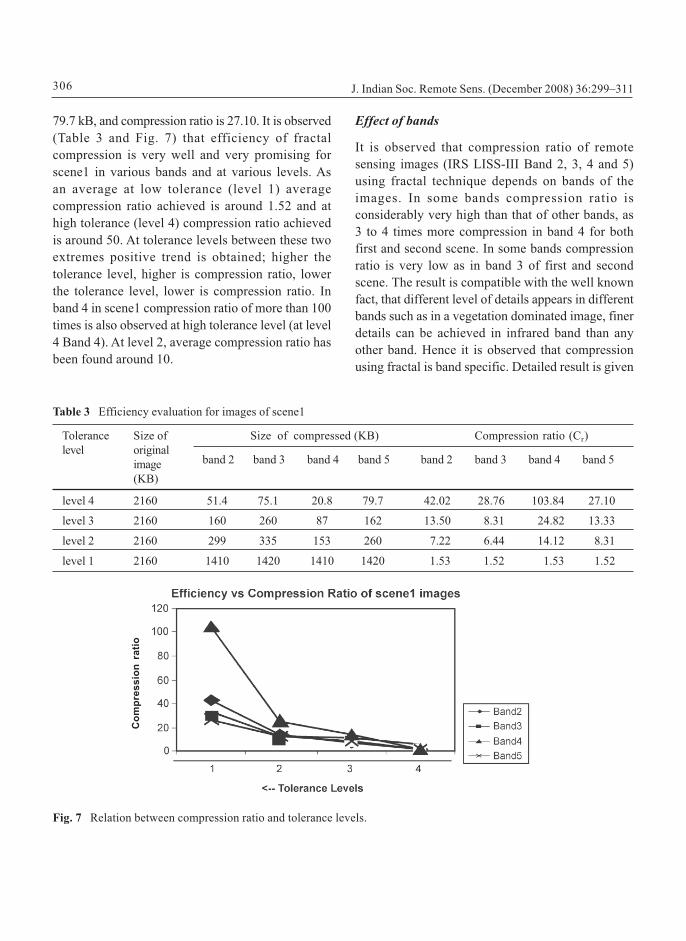
Entropy, a measure of information (Klir and Yuan,2000) of an image has been used to find the inherentinformation content in the fractal compressed imageand compared with that of original image (Tables 1and 2). It has been found that these values, oforiginal and fractal compressed images, are very nearto each other with a little variation mostly at second
place of decimal. A graphical presentation of theentropy values of different bands of images are givenin Figs. 3 and 4 for scene1 and scene2 respectively.These results shows that the information content ofthe original and fractal compressed images are moreor less same.
Fig. 4 Comparison of entropy values of scene2.
Ent
ropy
Fig. 3 Comparison of entropy values of scene1.
Compression ratio achieved by FractalCompression algorithms is used as efficiency indexin this study. Compression ratio (Cr) is defined asthe size of the original image divided by the size ofthe compressed image. The compression ratios of thedifferent images are shown in Tables 1 and 2. It canbe found that fractal compression provides 6 to 16times compression and thus the size of a file may bereduced by 6 to 16 times of its original size by fractalcompression.
Ent
ropy

305J. Indian Soc. Remote Sens. (December 2008) 36:299–311
Evaluation through visual quality
The restored images of fractal compressed image ofband 4 samples (Fig. 1) of scene1 and band 5 samplesare as shown in Figs. 5 and 6 respectively. Throughvisual interpretation and mutual comparison of theoriginal (Figs. 1 and 2) and restored images (Figs. 5and 6), one can easily find that different classesin the restored images are as clear as they aredepicted in original images. Specifically, the river andriver bed are as clear and discernible in the restoredimages as they are in original images. Hence, visualappearance of restored images from fractalcompression is comparable with the visualappearance of original images in their respectivebands. No significant difference between originaland compressed image can be detected visually.
Efficiency evaluation
Efficiency of fractal compression algorithm isevaluated at different tolerance level for the imagesof first scene. Higher the amount of allowable errorgreater is the level of tolerance. In this study, four
levels of tolerance have been used. These are Level1 to level 4 having allowable error around 1%, 10%,15% and 35% respectively.
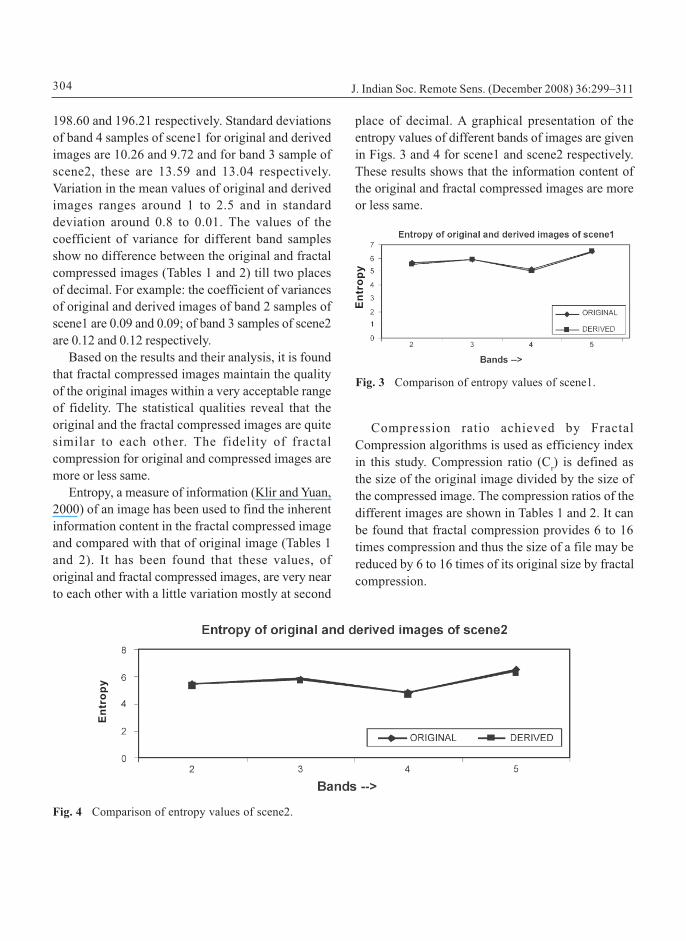
Size of original images of scene1 and fractalcompressed images in Band 2 to Band 5 at varioustolerance levels (Level 1 to level 4), along with theircorresponding ratio are given in Table 3. A graphicalrepresentation of the amount of compression ratiosfor different bands and at different levels oftolerance are given in Fig. 7.
A close look on the amount of compression ratiosand their graphical presentation state that higher thelevel of tolerance, lower is the size of compressedimage and thus higher is the compression ratio andvice versa. Higher compression ratio also providesan indication on the information content of theimage. Higher the compression ratio less isinformation content of the image and vice-versa, asin band 5 of scene1 at level 1 size of compressed fileis 1420 kB, and compression ratio is 1.52. For hightolerance (level 4) size of compressed image is lowand corresponding compression ratio is high, as forband 5 of scene1 at level 4 size of compressed file is
Fig. 5 Restored band 4 image of scene1. Fig. 6 Restored band 5 image of scene2.
306 J. Indian Soc. Remote Sens. (December 2008) 36:299–311
79.7 kB, and compression ratio is 27.10. It is observed(Table 3 and Fig. 7) that efficiency of fractalcompression is very well and very promising forscene1 in various bands and at various levels. Asan average at low tolerance (level 1) averagecompression ratio achieved is around 1.52 and athigh tolerance (level 4) compression ratio achievedis around 50. At tolerance levels between these twoextremes positive trend is obtained; higher thetolerance level, higher is compression ratio, lowerthe tolerance level, lower is compression ratio. Inband 4 in scene1 compression ratio of more than 100times is also observed at high tolerance level (at level4 Band 4). At level 2, average compression ratio hasbeen found around 10.
Table 3 Efficiency evaluation for images of scene1
Tolerance Size of Size of compressed (KB) Compression ratio (Cr)level original
image band 2 band 3 band 4 band 5 band 2 band 3 band 4 band 5(KB)
level 4 2160 51.4 75.1 20.8 79.7 42.02 28.76 103.84 27.10
level 3 2160 160 260 87 162 13.50 8.31 24.82 13.33
level 2 2160 299 335 153 260 7.22 6.44 14.12 8.31
level 1 2160 1410 1420 1410 1420 1.53 1.52 1.53 1.52
Fig. 7 Relation between compression ratio and tolerance levels.
Effect of bands
It is observed that compression ratio of remotesensing images (IRS LISS-III Band 2, 3, 4 and 5)using fractal technique depends on bands of theimages. In some bands compression ratio isconsiderably very high than that of other bands, as3 to 4 times more compression in band 4 for bothfirst and second scene. In some bands compressionratio is very low as in band 3 of first and secondscene. The result is compatible with the well knownfact, that different level of details appears in differentbands such as in a vegetation dominated image, finerdetails can be achieved in infrared band than anyother band. Hence it is observed that compressionusing fractal is band specific. Detailed result is given
Com
pres
sion
rat
io

307J. Indian Soc. Remote Sens. (December 2008) 36:299–311
in Tables 1 and 2 and their graphical presentation isas shown in Fig. 8.
LISS II, LISS III and for PAN data has been foundas given Table 4.
Table 4 Compression ratio vs. resolution for LISS II, LISS III and PAN images of Roorkee
Image band Original data
Min* Max# Mean sd& cr%
Roorkee IRS LISS II 1 52 173 79.27 11.99 8.7
2 28 129 49.51 12.67 7.87
3 18 141 76.73 15.33 6.16
4 30 201 104.92 16.11 10.6
Roorkee IRS LISS III 2 70 210 95.11 12.37 6.39
3 30 162 52.76 14.15 5.79
4 19 175 92.23 23.24 3.88
5 24 209 73.98 13.96 5.55
Roorkee IRS PAN 1 0 255 90.50 50.48 3.78
* Minimum, # Maximum, & standard deviation, % compression ratio
Effect of resolution
In order to study the effect of resolution of satelliteimages, LISS II (all four bands), LISS III (all fourbands) and PAN data of Roorkee area have beenused. Statistical qualities of LISS II, LISS III data ofall four bands, and of PAN data are listed in Table 4.Also, the compression ratio for all four bands of
Fig. 8 Relations between bands and compression ratio.
Com
prat
ion
It can be noted that compression ratio is least forPAN data and maximum for LISS II data. This trendcan be observed in all the 4 bands of LISS II & IIIdata. Thus, it is evident that ratio of compressionusing fractal also depends on resolution of RSimagery. This is attributed to the fact that finer theresolution of an image more will be features availablein the image and thus higher is the complexity of theimage leading less compression in image.

308 J. Indian Soc. Remote Sens. (December 2008) 36:299–311
Table 6 Size of images in various formats of scene2
Images of scene2 Size of original Compressed imagesimage (KB) JPEG2000 (KB) FRACTAL (KB) WinRar (KB)
Size (KB) Cr Size (KB) Cr Size (KB) Cr
band 2 2160 119 18.15 46.5 46.45 1250 1.73
band 3 2160 152 14.22 73.5 29.39 1320 1.64
band 4 2160 76.1 28.38 16.8 128.57 1080 2.00
band 5 2160 155 13.94 86.7 24.91 1020 2.12
Comparison of different compression methods
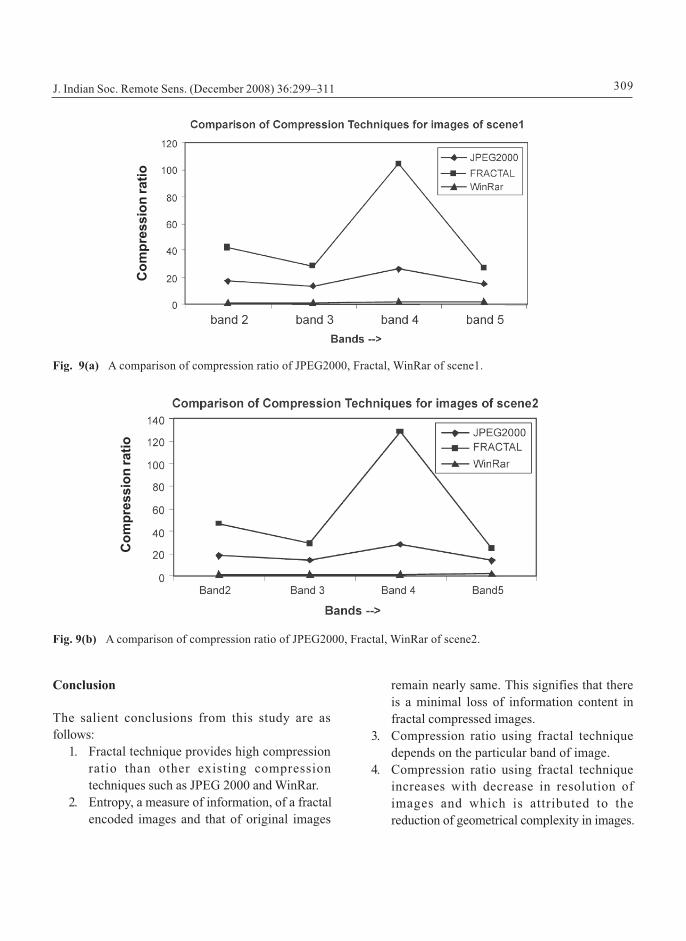
An evaluation of fractal compression with otherfamiliar compression techniques has also beencarried out. The different band images of first andsecond scenes each of size 2160 KB have beencompressed using JPEG2000, Fractal and WinRartechniques. The sizes of the different compressedimages are as given in Tables 5 and 6. It can be notedthat for the original image of size 2160 kB (in allbands), size of the compressed image of band 2 image(of scene1) in JPEG 2000 is 123 KB, in Fractal it is51.4 KB, and in WinRar 1260 kB. Similarly, for band4 Image (of scene2) of 2160 KB, size in JPEG 2000 is76.1 KB, in Fractal 16.8 KB and in WinRar 1080 KB.Thus, fractal provides much higher compression thanother two methods.
With reference to the compression ratio for FractalCompression with other compression technique suchas JPEG 2000 and WinRar, fractal compression isproved to be more efficient by achieving high
compression ratio over others methods. Size ofcompressed image using fractal is found 2 to 4 timesmore than that of JPEG in all the four bands for boththe images and in some cases even more whereasWinRar has been completely outstripped by givingsize of compressed images 12.5 (scene1 band5) to65 times (scene2 band4) larger than that of FractalCompressed images. A graphical presentation ofcomparative results is given as shown in Fig. 9(a)and (b) respectively for scene1 and scene2.
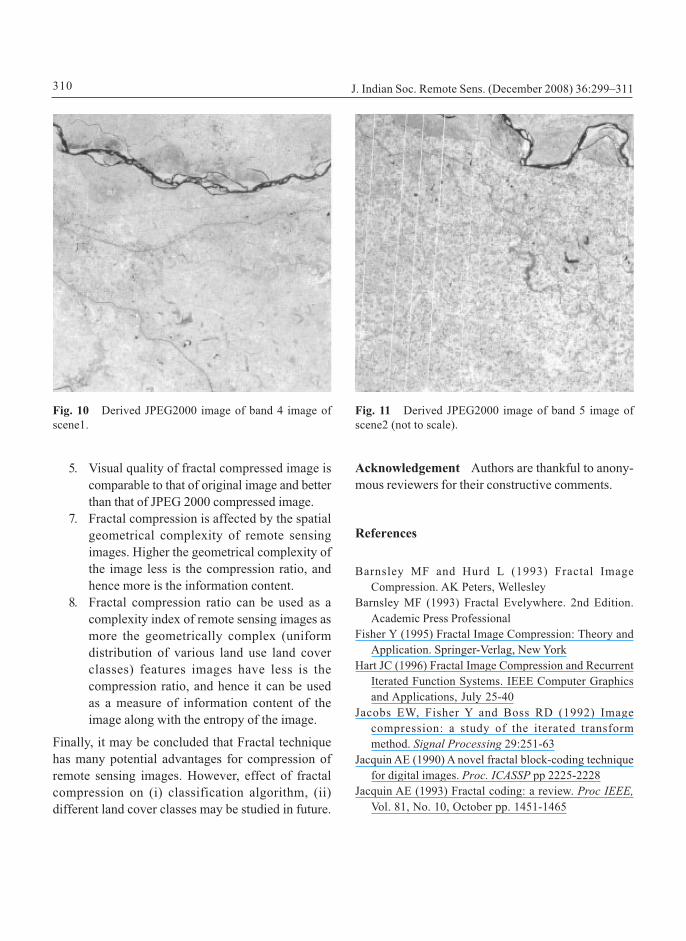
Further, the visual quality of the Fractal and JPEG2000 compressed images has been tested. Figure 5is the restored fractal compressed image of band 4image of scene1 (Fig. 1), whereas Fig. 6 is the band5 image of scene2 (Fig. 2), whereas Figs. 10 and 11are restored images from JPEG2000 respectively forband 4 image of scene1 and band 5 image of scene2.Closely observing these images one can observe thatdifferent classes in fractal compressed images areclear but in JPEG2000 images these got smoothedout.
Table 5 Size of images in various formats of scene1
Images of scene1 Size of original Compressed imagesimage (KB) JPEG2000 (KB) FRACTAL (KB) WinRar (KB)
Size (KB) Cr Size (KB) Cr Size (KB) Cr
band 2 2160 123 17.56 51.4 42.02 1260 1.71
band 3 2160 156 13.84 75.1 28.76 1320 1.64
band 4 2160 82.8 26.08 20.8 103.85 1100 1.96
band 5 2160 140 15.43 79.7 27.1 997 2.17
309J. Indian Soc. Remote Sens. (December 2008) 36:299–311
Com
pres
sion
ratio
Fig. 9(b) A comparison of compression ratio of JPEG2000, Fractal, WinRar of scene2.
Com
pres
sion
ratio
Fig. 9(a) A comparison of compression ratio of JPEG2000, Fractal, WinRar of scene1.
Conclusion
The salient conclusions from this study are asfollows:
1. Fractal technique provides high compressionratio than other existing compressiontechniques such as JPEG 2000 and WinRar.
2. Entropy, a measure of information, of a fractalencoded images and that of original images
remain nearly same. This signifies that thereis a minimal loss of information content infractal compressed images.
3. Compression ratio using fractal techniquedepends on the particular band of image.
4. Compression ratio using fractal techniqueincreases with decrease in resolution ofimages and which is attributed to thereduction of geometrical complexity in images.
310 J. Indian Soc. Remote Sens. (December 2008) 36:299–311
Fig. 11 Derived JPEG2000 image of band 5 image ofscene2 (not to scale).
Fig. 10 Derived JPEG2000 image of band 4 image ofscene1.
5. Visual quality of fractal compressed image iscomparable to that of original image and betterthan that of JPEG 2000 compressed image.
7. Fractal compression is affected by the spatialgeometrical complexity of remote sensingimages. Higher the geometrical complexity ofthe image less is the compression ratio, andhence more is the information content.
8. Fractal compression ratio can be used as acomplexity index of remote sensing images asmore the geometrically complex (uniformdistribution of various land use land coverclasses) features images have less is thecompression ratio, and hence it can be usedas a measure of information content of theimage along with the entropy of the image.
Finally, it may be concluded that Fractal techniquehas many potential advantages for compression ofremote sensing images. However, effect of fractalcompression on (i) classification algorithm, (ii)different land cover classes may be studied in future.
Acknowledgement Authors are thankful to anony-mous reviewers for their constructive comments.
References
Barnsley MF and Hurd L (1993) Fractal ImageCompression. AK Peters, Wellesley
Barnsley MF (1993) Fractal Evelywhere. 2nd Edition.Academic Press Professional
Fisher Y (1995) Fractal Image Compression: Theory andApplication. Springer-Verlag, New York
Hart JC (1996) Fractal Image Compression and RecurrentIterated Function Systems. IEEE Computer Graphicsand Applications, July 25-40
Jacobs EW, Fisher Y and Boss RD (1992) Imagecompression: a study of the iterated transformmethod. Signal Processing 29:251-63
Jacquin AE (1990) A novel fractal block-coding techniquefor digital images. Proc. ICASSP pp 2225-2228
Jacquin AE (1993) Fractal coding: a review. Proc IEEE,Vol. 81, No. 10, October pp. 1451-1465

311J. Indian Soc. Remote Sens. (December 2008) 36:299–311
Jacquin A (1992) Image Coding Based on a Fractal Theoryof Iterated Contractive Image Transformations. IEEETransactions on Image Processing 1:18-30
Klir GJ and Yuan B (2000) Fuzzy Sets and Fuzzy Logic.Prentice-Hall India Pvt Ltd, New Delhi, pp 574
Kominek J (1995) Advances in Fractal Compression forMultimedia Applications. Internal Report CS95-28,University of Waterloo
Lee CK and Lee WK (1998) Fast Fractal Image BlockCoding Based on Local Variances. IEEE Transactionson Image Processing, 7(6):888-91
Lu N (1997) Fractal Imaging. Academic Press, San DiegoMandelbrot B (1982) Fractal Geometry of Nature. San
Francisco: FreemanPeitgen Jurgens Saupe (2003) Fractals for the class room.
Springer-Verlag