Mammalian community responses to a gradient of land-use ...
260
Mammalian community responses to a gradient of land-use intensity on the island of Borneo Oliver Richard Wearn Division of Ecology and Evolution Department of Life Sciences Imperial College London A thesis submitted for the degree of Doctor of Philosophy 2015
-
Upload
khangminh22 -
Category
Documents
-
view
0 -
download
0
Transcript of Mammalian community responses to a gradient of land-use ...

Mammalian community responses to a gradient of land-use intensity on the island of Borneo
Oliver Richard Wearn
Division of Ecology and Evolution Department of Life Sciences
Imperial College London
A thesis submitted for the degree of Doctor of Philosophy 2015

ii

iii
Copyright declaration
The copyright of this thesis rests with the author and is made available under a Creative Commons
Attribution Non-Commercial No Derivatives licence. Researchers are free to copy, distribute or
transmit the thesis on the condition that they attribute it, that they do not use it for commercial
purposes and that they do not alter, transform or build upon it. For any reuse or distribution,
researchers must make clear to others the license terms of this work.

iv
Abstract
Southeast Asian rainforests have, in recent decades, experienced the highest rates of deforestation and
logging across the major tropical regions. This has left a vast estate of degraded forest in the region,
which is under threat from further degradation and conversion to agriculture, principally for the
expansion of oil palm (Elaeis guineensis) plantations. However, knowledge of the relative
conservation value of different land-uses in the region is still limited, and a robust quantitative basis
for resolving land-use tradeoffs, in particular between agricultural yield and biodiversity, is lacking. I
aimed to assess terrestrial mammal species richness, abundance and β-diversity across a gradient of
land-use intensity (old-growth forest, logged forest and oil palm) in Sabah, Malaysian Borneo.
Overall mammal species richness was conserved even in the intensively-logged forests that I sampled,
as were the majority of apparent old-growth specialists. Oil palm, on the other hand, harboured a
highly depauperate mammal community. These broad patterns were echoed for overall mammal
abundance, as well as in the potential ecosystem functions of mammals that I examined. However, I
found evidence that the fundamental drivers of community assembly were altered across the land-use
gradient and so, consequently, were patterns of β-diversity. Fine-grained β-diversity, in particular,
was highest across the land-uses in logged forest, reflecting the increased environmental heterogeneity
in this habitat. In addition, community composition and species abundance were not stable across
land-uses. Omnivores and herbivores were more abundant in logged forest compared to old-growth
forest, and only a limited number of carnivore species persisted in oil palm. Invasive species increased
in abundance with land-use intensity.
My findings underline the conservation importance of the large areas of degraded forest in Southeast
Asia, and the extremely limited value offered by oil palm. If sustainability of the palm oil industry is
to be achieved, new plantations should be diverted away from all remaining unfragmented forests,
both old-growth and degraded forests alike.

v
Acknowledgements
Inevitably, the acknowledgements that follow are but the tip of the iceberg of the many and varied
people and organisations that, in no small part, helped me at all stages in the formation of this thesis.
To all those people not mentioned here, rest assured I remain wholly indebted to you.
Firstly, I acknowledge my principal funder, the Sime Darby Foundation, as well as the Zoological
Society of London, for providing the resources needed to complete this work. I acknowledge the
Economic Planning Unit and, latterly, the Sabah Biodiversity Council, for allowing me to conduct
research in Malaysia. I also appreciate the agreement from the Sabah Forestry Department, Yayasan
Sabah, the Maliau Basin Management Committee, Benta Wawasan and Sabah Softwoods to allow
research to be done in their respective areas. I am grateful for the support I received from the Royal
Society South East Asia Rainforest Research Programme and am especially indebted to Glen
Reynolds and his team for the huge amount of logistical assistance I received in-country. I extend my
thanks also to Henry Bernard, my local collaborator, for kindly obliging with all my requests for
research or logistical support in Sabah.
An emphatic word of thanks must go to my supervisory team: Rob Ewers, Chris Carbone and Marcus
Rowcliffe. Thank-you for all of the ideas and counsel you gave me during my Ph. D. I couldn’t have
asked for a better team and your supervision was always absolutely spot-on. I’ve learnt a lot from you
all and will miss the sometimes confusing, sometimes enlightening, meetings we’ve had over the
years. I am also grateful to my broader supervisory panel, Tim Coulson and E. J. Milner-Gulland, for
the insightful feedback they provided during the earlier stages of my Ph. D.
Of everyone involved in this thesis, I am most deeply indebted to the research assistants who helped
me to collect the data out in Borneo, often shedding blood (if the leeches got their way), sweat and
tears in the process, with apparently little reward. To Leah Findlay, Matt Holmes, Faye Thompson,

vi
Jack Thorley and Jess Haysom, thank-you all for being superlative in the field, always rising to meet
whatever challenge was thrown at us and, quite obligingly, for putting up with me in the field. You
have all learned a life-time supply of free beer on me. Thank-you also to Jeremy Cusack and Robin
Loveridge for being great field companions and, of course, for sharing the heavy work-load on Team
Tikus. It was an absolute pleasure to work with you.
Thank-you so much, also, to the many and varied people who helped form the tapestry of social life at
the SAFE “temporary camp” that we called a home from home. It pains me that I am unable to name
everyone individually here in the limited space available, but thanks in particular to the rest of the
“trinity”, Sarah Luke and Claudia Gray, as well as Timm Döbert, Terhi Riutta, Jen Sheridan and
James Rice for making field life that much more enjoyable.
I could not have achieved the back-breaking task of collecting data on elusive mammals without the
tireless work of staff at the SAFE Project. In particular, Matiew bin Tarongak, James Loh, Mohd
Sabri bin Bationg and Aleks Warat Koban bin Lukas should all be applauded for working so tirelessly
and diligently in the field. Even when the day involved lugging 100 steel traps up the face of a
slippery hillside, it was a pleasure with you guys. The help of Ed Turner, MinSheng Khoo, Johnny
Larenus, Sarah Watson and Ryan Gray was also absolutely invaluable in making the fieldwork even
remotely possible.
During my, admittedly limited, time spent in the UK working in my two institutions – both at Silwood
Park and at the Institute of Zoology – I’ve also had the great pleasure of working with a fantastic
bunch of people over the years. I thank everyone I’ve ever shared an office with for making the write-
up just that bit more bearable and in particular all of the “FEC” lab group, both past and present. I am
especially grateful for the inordinate amount of help that Marion Pfeifer provided with all things
RapidEye.

vii
Lastly, I am deeply grateful to my family for their constant support and encouragement, and for their
unquestioning accommodation of my tropical wanderlust over the years before and during the making
of this thesis.

viii
Declaration of originality
R. M. Ewers, C. Carbone and J. M. Rowcliffe contributed at all stages of the thesis, including the
conception, design and analysis. All further assistance received is detailed below.
Chapter 1: R. M. Ewers and E. J. Milner-Gulland commented on an earlier draft of this chapter.
Chapter 2: R. M. Ewers, J. M. Rowcliffe, C. Carbone and H. Bernard provided extensive comments
on this chapter. M. Linkie and an anonymous reviewer also greatly helped to improve the manuscript
during submission to PLoS One.
Chapter 3: R. M. Ewers, C. Carbone, J. M. Rowcliffe and H. Bernard all provided comments on an
earlier draft of this chapter, which greatly assisted in improving the clarity of the presentation.
Chapter 4: R. M. Ewers and C. Carbone provided helpful comments on this chapter. M. Pfeifer pre-
processed the RapidEye satellite images and ran the models of above-ground live tree biomass, of
which the mapped outputs featured in my modelling of community assembly. These maps were
provided as part of an ongoing collaborative effort at the SAFE Project.
Chapter 5: R. M. Ewers, J. M. Rowcliffe and C. Carbone provided comments on this chapter. M.
Tobler provided helpful feedback on an earlier version of one of the hierarchical models used. The
Imperial College High Performance Computing facility was used to run the bulk of the analysis. M.
Pfeifer’s above-ground live tree biomass estimates were again used in this chapter.
Chapter 6: R. M. Ewers, J. M. Rowcliffe and C. Carbone all provided comments on this chapter.
I herewith certify that all other material in this thesis is solely the result of my own work.

ix
Table of contents
Copyright declaration .......................................................................................................................... iii
Abstract ................................................................................................................................................. iv
Acknowledgements ............................................................................................................................... v
Declaration of originality .................................................................................................................. viii
Table of contents .................................................................................................................................. ix
Chapter 1: Land-use change and its ecological impacts in Southeast Asia: A review .................... 1
1. 1. Introduction ................................................................................................................................. 1
1. 2. The impacts of land-use change on species and communities – what do we know? .................. 3
1. 2. 1. The influence of the land-use change process ..................................................................... 3
1. 2. 2. The influence of the spatial pattern and composition of land-uses in the landscape .......... 6
1. 3. Land-use change and fragmentation in a Southeast Asian context ........................................... 12
1. 4. Current understanding of the ecological impacts of selective logging in Southeast Asia ........ 16
1. 5. Biodiversity in plantation forests and croplands in Southeast Asia .......................................... 21
1. 6. Confounding factors in the assessment of ecological responses to land-use change ................ 25
1. 7. Previous studies of mammalian biodiversity in anthropogenic landscapes in Southeast Asia . 33
1. 8. Research objectives ................................................................................................................... 40
1. 9. Sampling methods, design and study site ................................................................................. 40
1. 10. Thesis chapter outline ............................................................................................................. 43
Chapter 2: Assessing the status of wild felids in a highly-disturbed commercial forest reserve in Borneo and the implications for camera trap survey design .......................................................... 47
Abstract ............................................................................................................................................. 47
2. 1. Introduction ............................................................................................................................... 48
2. 2. Methods ..................................................................................................................................... 51
2. 2. 1. Study area .......................................................................................................................... 51
2. 2. 2. Data collection .................................................................................................................. 52
2. 2. 3. Data analysis ..................................................................................................................... 54
2. 3. Results ....................................................................................................................................... 55
2. 4. Discussion ................................................................................................................................. 60
Appendices ........................................................................................................................................ 66
Appendix A – Camera-trapping data from previous studies (1998-2012) .................................... 66
Chapter 3: Grain-dependent responses of mammalian species richness and β-diversity to land-use and the implications for managing conservation values in tropical human-modified landscapes ............................................................................................................................................ 71

x
Abstract ............................................................................................................................................. 71
3. 1. Introduction ............................................................................................................................... 72
3. 2. Methods ..................................................................................................................................... 75
3. 2. 1. Study sites and sampling design ....................................................................................... 75
3. 2. 2. Mammal sampling ............................................................................................................ 77
3. 2. 3. Data analysis ..................................................................................................................... 78
3. 3. Results ....................................................................................................................................... 82
3. 4. Discussion ................................................................................................................................. 86
Appendices ........................................................................................................................................ 92
Appendix A – Detailed study site descriptions ............................................................................. 92
Appendix B - Quantifying β-diversity .......................................................................................... 94
Appendix C – Supplementary results ............................................................................................ 96
Appendix D – Mammal species list ............................................................................................ 100
Chapter 4: Anthropogenic land-use change alters the ecological processes assembling tropical rainforest mammal communities ..................................................................................................... 102
Abstract ........................................................................................................................................... 102
4. 1. Introduction ............................................................................................................................. 103
4. 2. Methods ................................................................................................................................... 107
4. 2. 1. Sampling design .............................................................................................................. 107
4. 2. 2. Field methods .................................................................................................................. 109
4. 2. 3. Data analysis ................................................................................................................... 110
4. 3. Results ..................................................................................................................................... 114
4. 3. Discussion ............................................................................................................................... 121
Appendices ...................................................................................................................................... 127
Appendix A – Detailed description of methods used to measure environmental variables ........ 127
Appendix B – Supplementary Results ........................................................................................ 132
Chapter 5: Species abundance across a gradient of tropical land-use intensity: a hierarchical multi-species approach applied to a Bornean mammal community ............................................ 137
Abstract ........................................................................................................................................... 137
5. 1. Introduction ............................................................................................................................. 138
5. 2. Methods ................................................................................................................................... 142
5. 2. 1. Sampling design .............................................................................................................. 142
5. 2. 2. Field methods .................................................................................................................. 143
5. 2. 3. Data analysis ................................................................................................................... 145
5. 3. Results ..................................................................................................................................... 151
5. 4. Discussion ............................................................................................................................... 160

xi
Appendices ...................................................................................................................................... 168
Appendix A – Supplementary figures ......................................................................................... 168
Appendix B – Supplementary tables ........................................................................................... 179
Appendix C – BUGS (Bayesian inference Using Gibbs Sampling) code used to obtain Markov Chain Monte Carlo (MCMC) samples of the joint posterior ...................................................... 181
Chapter 6: The conservation of terrestrial mammals in human-modified landscapes in Southeast Asia: richness, composition, abundance and heterogeneity ........................................ 185
6. 1. Key findings of this thesis ....................................................................................................... 185
6. 2. Putting the findings into context ............................................................................................. 187
6. 3. New research directions .......................................................................................................... 189
6. 4. Implications for conservation .................................................................................................. 194
6. 5. The scope of inference ............................................................................................................ 197
6. 6. Future work ............................................................................................................................. 199
6. 7. Avoiding Navjot Sodhi’s “Impending Disaster” ..................................................................... 200
Bibliography ...................................................................................................................................... 202
Appendices ......................................................................................................................................... 235
Appendix A – Species checklists for four study sites in south-east Sabah, Malaysia ................ 235
Appendix B – Supplementary figures of sampling effort over time ........................................... 240
Appendix C – Example camera trap images of Bornean mammal and bird species................... 242

Chapter 1: The impacts of land-use change on Southeast Asian biodiversity
1
Chapter 1:
Land-use change and its ecological impacts in Southeast Asia: A review
1. 1. Introduction
Global rates of habitat loss and degradation over the last half-century have been unprecedented in
human history (Ramankutty & Foley, 1999; Goldewijk, 2001; Gibbs et al., 2010). Most of the
changes in land-use wrought by man, both presently and historically, have been to convert natural
forests into agricultural land, including cropland, pasture and plantation forest (Ramankutty & Foley,
1999; Goldewijk, 2001). The natural forests of Europe, North America and China had largely
stabilized in area by 1960 (Ramankutty & Foley, 1999) and the recent upsurge in deforestation and
degradation is occurring with the expansion of agricultural land in the developing tropics (Green et
al., 2005; Gibbs et al., 2010). Land-use change is now entrenched as the leading cause of biodiversity
loss (Wilcove et al., 1998; Sala et al., 2000; Green et al., 2005; Schipper et al., 2008; Vié et al., 2009)
and is causing widespread population declines and local extinctions across many taxa (Ceballos &
Ehrlich, 2002; Vié et al., 2009; Collen et al., 2009; Hoffmann et al., 2010). Across terrestrial
vertebrates, habitat loss and degradation is implicated as an extinction threat process for 42% of
species assessed on the IUCN Red List (IUCN, 2014).
Of the three major tropical forest biomes, the fastest rates of deforestation and degradation are
occurring in Southeast Asia (Achard et al., 2002; Mayaux et al., 2005; Hansen et al., 2008). Over the
last decade, the islands of Sumatra and Borneo have experienced the fastest rates of forest loss in the
region, annually losing 2.7% and 1.3% of forest cover, respectively (Miettinen et al., 2011). For a
long time, accurate data on the extent of logging in the region was difficult to obtain, although it was
thought that the vast majority of remaining forest area had been designated for selective logging (e.g.
Meijaard & Sheil, 2007; Koh, 2007a; Giam et al., 2011), and logging was known to be occurring even
in protected areas (Curran et al., 2004). Recent mapping efforts have substantially improved

Chapter 1: The impacts of land-use change on Southeast Asian biodiversity
2
knowledge of the spatial extent and foci of past logging in the region (Bryan et al., 2013; Margono et
al., 2014; Gaveau et al., 2014). It is now estimated that 46% of Borneo’s remaining natural forests are
in a logged-over state (Gaveau et al., 2014), and 65% for the country of Indonesia (Margono et al.,
2014).
As well as playing host to widespread changes in land-use, Southeast Asia also harbours globally-
significant amounts of biodiversity, much of it endemic to the region (Myers et al., 2000; Sodhi et al.,
2004, 2009b); though it only covers 4% of the Earth’s land surface, it contains 20-25% of the animal
and plant species known to science (Woodruff, 2010). As a result of the high rates of deforestation
and logging, Southeast Asia is a focal region for species listed as threatened with extinction on the
IUCN Red List (Schipper et al., 2008; Sodhi et al., 2009b; IUCN, 2014), as well as for species which
are becoming increasingly threatened over time (Hoffmann et al., 2010). Indeed, much of the region
has been identified as one of the planet’s top three conservation priorities in the form of the Sundaland
biodiversity hotspot (Myers et al., 2000).
Given the current rates of habitat loss in the tropics and the ubiquity of anthropogenic landscapes, the
causal relationships between changes in land-use and declines in biodiversity might be assumed to be
well understood. Certainly, a disproportionately high amount of conservation research effort is
devoted to investigating this subject: 24% of papers from 3 high-impact conservation journals dealt
with habitat loss, degradation and fragmentation (Fazey et al., 2005). However, large gaps in our
understanding of the land-use impacts on biodiversity remain and, for many landscapes, we lack
information on even the most basic conservation biology of species and communities. This applies
especially to Southeast Asia, which is one of the world’s least known regions biologically. The island
of Borneo, especially, is a peak region of mammal species listed as Data Deficient on the IUCN Red
List (Schipper et al., 2008). With rates of tropical forest loss showing no signs of slowing (Bradshaw
et al., 2009), we urgently need better management and conservation tools for decision-makers in the
region if the “impending disaster” (Sodhi et al., 2004) is to be averted. An important step towards this

Chapter 1: The impacts of land-use change on Southeast Asian biodiversity
3
will be to bridge existing knowledge gaps and begin to construct empirically-supported models of
biodiversity at landscape scales. This will enable tradeoffs between biodiversity and yields in
production systems to be better reconciled, and also help identify any opportunities for biodiversity-
friendly practices which do not conflict with yields.
I here review the current state of land-use change research and identify 1) broad ecological trends that
have been empirically well-supported across landscapes and 2) neglected or newly-recognised aspects
to the land-use change process which could yield step-changes in our understanding of the ecological
impacts of land-use change. I take a forward-looking approach to the literature and attempt to avoid a
recapitulation of old debates that have largely been resolved or have been unproductive. Following
this, I review the overall state of knowledge on land-use change effects in Southeast Asia, ultimately
focussing on mammalian taxa. In doing so, I evaluated the available literature critically and gave less
weight to studies that were of short duration, limited sample size, or were obviously biased due to
study design. In light of this review, I present the aims of the current work, seeking to fill gaps in the
available knowledge. Finally, I briefly describe the study region and novel methods used in the
current thesis (more details can be found in the individual chapters) and outline the content of the
chapters to follow.
1. 2. The impacts of land-use change on species and communities – what do we know?
1. 2. 1. The influence of the land-use change process
It is useful to separate land-use impacts into those which are wrought by the change process itself (e.g.
log extraction or clearance of habitat) and those which are manifested by the properties of the new,
altered landscape (e.g. the areal extent and spatial configuration of different land-uses). This
distinction is rarely made, probably because the opportunities to study the change process itself are
relatively few: most studies commence after the altered landscape is already in existence (McGarigal
& Cushman, 2002). As a consequence of this, we know relatively less about the independent effects

Chapter 1: The impacts of land-use change on Southeast Asian biodiversity
4
of land-use change processes themselves, including how the speed and spatial pattern of the change
process may mitigate or aggravate impacts on biological communities.
The direct consequences of log extraction, clearance, enrichment planting or crop establishment are
more obvious for plants and, to some extent, for sedentary animal species, but are less obvious for
highly mobile species capable of escaping direct killing from the land-use change process. Where
land-use is altered, but not completely substituted for a new land-use type (e.g. during selective
logging), many species will be able to persist by temporarily emigrating from the focal areas of
disturbance. For example, the lar gibbon Hylobates lar and the banded leaf monkey Presbytis
melalophos were able to modify their ranging and adopt more cryptic behaviour (specifically, making
fewer calls) to avoid logging operations at Sungai Tekam, Peninsular Malaysia, all the while
remaining within their established home ranges (Johns, 1985). Bornean orangutans Pongo pygmaeus
generally do not maintain exclusive home-ranges and instead have been reported to temporarily
emigrate from active logging concessions altogether, only returning once the disturbance has ceased
(Davies, 1986; Morrogh-bernard et al., 2003; Ancrenaz et al., 2010). Individual-based simulation
models for sessile taxa have shown that the spatio-temporal pattern of logging disturbance may be
critical in determining population persistence for poorly-dispersing species with clumped
distributions, with higher probabilities of extinction if logging occurs in large contiguous blocks, as
opposed to at random in the landscape (Ramage et al., 2013a). However, equivalent simulations for
more mobile species, which may actively avoid the logging process itself, are currently lacking, in
part because of the paucity of suitable data on the movements of individual animals.
Where land-use type is completely substituted (e.g. forest to agricultural crop), the options available
are fewer and many small-bodied species (e.g. non-volant invertebrate taxa), as well as species which
rely on crypsis for avoiding predation, probably suffer large direct losses of individuals.
Hypothetically, more mobile species might avoid these initial population losses by: 1) seeking shelter
from the clearance process (e.g. in underground burrows or under deadwood); 2) fleeing to remnants

Chapter 1: The impacts of land-use change on Southeast Asian biodiversity
5
of the original habitat, or 3) dispersing from the landscape entirely. Which of these is applicable to
different species is almost entirely unknown, though basic life-history factors, such as the habitual use
of protected holes or burrows and a tolerance to open spaces, will probably increase survival rates
over this initial phase of land-use change. Many understorey-adapted forest birds rarely cross forest
gaps larger than 100 m (Laurance et al., 2002) and can become trapped in remnant habitat as it is
cleared; this resulted in a strong “crowding effect” of increased species richness and abundance in
remnant forest fragment during a clearance process observed in central Amazonia (Bierregaard &
Lovejoy, 1989; Ferraz et al., 2003). This influx of immigrants was associated with an increase in
territoriality in many of the species, implying increased competition for resources; this likely caused
the observed decreases in bird populations over the months that followed clearance (Bierregaard &
Lovejoy, 1989).
If we are to model and predict land-use change impacts with any reasonable accuracy, then species
responses to the land-use change process itself will need to be incorporated. Clearly, species which
disperse from the landscape will show an immediate, dramatic population crash at the landscape scale
(with potential knock-on effects on populations beyond the altered landscape), whilst species which
crowd into remnant habitat will show sudden population explosions at the scale of individual patches.
Species may show these responses facultatively, depending on the pattern and severity of the land-use
change process. Community-level parameters will likely also be biased by neglecting the impacts of
the change process itself. The most often used method of modelling species richness as a function of
land-use is to use the species-area relationship, which typical fits a power function of the form:
zcAS = , where S is the number of species, A is the area of habitat and z and c are constants (e.g.
Rosenzweig, 1995). This relationship will be wrongly parameterised if the clearance process has
given rise to temporary crowding effects. In addition, multiple lines of evidence, both theoretical
(Tilman et al., 1994; Ovaskainen & Hanski, 2002; Halley & Iwasa, 2011) and empirical (Ferraz et al.,
2003; Kuussaari et al., 2009; Wearn et al., 2012), now strongly support the idea that many
communities show gradual adjustments in species richness following changes in habitat area, giving

Chapter 1: The impacts of land-use change on Southeast Asian biodiversity
6
rise to an extinction debt (Tilman et al., 1994). Properly modelling this “relaxation” (Diamond, 1972)
process will necessitate characterising the initial state of the community after habitat change:
specifically, the degree to which communities are initially “supersaturated” due to crowding effects.
All other things being equal, a strong supersaturation effect will result in a larger initial extinction
debt, followed by an initially more rapid relaxation process.
1. 2. 2. The influence of the spatial pattern and composition of land-uses in the landscape
A more substantial corpus of knowledge has accumulated on the impacts of land-use change on
species and communities caused by the actual properties of the new, altered landscape. Much of this
has been accumulated by observational studies (McGarigal & Cushman, 2002), but some clear
patterns have nonetheless emerged. Most obviously, the nature of the alterations which occur to
natural habitat during land-use change will have a strong bearing on the species and communities that
are able to persist in a landscape. Typically, the complete conversion of natural habitat to an
agricultural crop will have a larger impact on biodiversity than partly converting natural habitat (such
as in some “jungle rubber” and shade-grown coffee systems) or introducing a new disturbance process
into natural habitat (as occurs during selective logging). This has been supported by global-scale
meta-analyses of land-use change effects, in which agricultural systems were significantly
impoverished in species richness compared to predominantly natural systems (Gibson et al., 2011;
Newbold et al., 2015). In addition, agricultural systems which mimic at least some of the structural
characteristics or microclimate conditions – such as incident light, humidity and temperature – of the
original habitat will support larger proportions of the original species pool (Jones et al., 2003;
Ranganathan et al., 2008; Gardner et al., 2009; Foster et al., 2011). This trend was supported when
plantation types were ranked by their perceived land-use intensity (Newbold et al., 2015), but was not
evident when shaded and un-shaded plantations were compared directly (Gibson et al., 2011).
When land-use alterations to a landscape are patchy, a complex mosaic of habitat types may result,
with fragments of natural habitat embedded in a matrix of one or more land-use types, such as

Chapter 1: The impacts of land-use change on Southeast Asian biodiversity
7
degraded forest, plantation forest, cropland, fallows or regrowth. In such landscapes, the areal extent
of land-use types in the new landscape has been the most consistently identified determinant of
species- and community-level properties (Hanski, 1998; Harrison & Bruna, 1999; Fahrig, 2003;
Radford et al., 2005; Ewers & Didham, 2006; Zurita & Bellocq, 2010). Such area effects have been
supported by both empirical (Bender et al., 1998; Connor et al., 2000; Debinski & Holt, 2000) and
theoretical (Macarthur & Wilson, 1967; Hanski, 1998; Hubbell, 2001; Flather & Bevers, 2002) studies
and at multiple scales, from individual patches (Turner, 1996; Debinski & Holt, 2000; Laurance et al.,
2002; Michalski & Peres, 2005; Watling & Donnelly, 2006), to local landscapes (Andrén, 1994;
Robinson et al., 1995; Mazerolle & Villard, 1999; Fahrig, 2002, 2003; Stephens et al., 2003; Radford
et al., 2005; Zurita & Bellocq, 2010). It is worth noting that, though not usually considered within the
remit of habitat fragmentation research, logged forests may be perceived by species as fragmented
landscapes when the intensity of logging disturbance is highly heterogeneous, as may be the case
when extraction rates reach very high levels in localised patches (Cannon et al., 1994; Berry et al.,
2008). Most studies of logging instead assume that logging disturbance is homogenous, in part
because of a paucity of data on the spatial variation in logging intensity (but see Asner et al., 2004).
Significant advances in our understanding of logging impacts may be gained by applying continuous
metrics akin to fragmentation metrics, such as the area of unlogged patches in a local landscape or
density of ‘soft’ edges (Broadbent et al., 2008), to these apparently uniform systems. Few studies of
this nature have been done to date, but in a forested system disturbed by fire Cushman & McGarigal
(2004) found that the composition of different habitat types surrounding a given location was an
important determinant of community composition.
The scale at which individual species respond most strongly to area effects will depend on their
mobility and distribution in a landscape: species which can move easily across a landscape will
exhibit little population sub-division and may respond to the total area of their preferred habitat
present in a landscape, whilst those with more limited exchange of individuals between sub-
populations, which are largely confined to remnants of intact habitat, may respond to the size

Chapter 1: The impacts of land-use change on Southeast Asian biodiversity
8
distribution of individual patches of preferred habitat. This has implications for the design of reserves
and conservation set-aside within production landscapes, which aim to maximise gains for
biodiversity in the smallest possible area. Simulation studies of the impacts of a patchy logging
process, albeit on tree communities, have shown that randomly distributed species communities (akin
to strongly-dispersing taxa) are most efficiently conserved simply by leaving a single large area
unlogged in the landscape, whilst aggregated species communities (akin to weakly-dispersing taxa)
are best conserved by setting aside a large number of small, intact patches of forest distributed across
the landscape (Potts & Vincent, 2008).
Negative effects of reductions in habitat area on species are usually hypothesised to be driven by: 1)
instantaneous sampling processes, especially for sedentary species; 2) the loss of key habitats or
resources (e.g. food or shelter), and 3) reductions in population size causing an increased stochastic
risk of extinction, for example due to environmental or demographic stochasticity. These drivers will
cause declines in population abundance or species richness over different time-scales: sampling
processes will result in immediate declines, whilst the reduced availability of resources (causing
deterministic population declines) and the effects of small population size (causing stochastic
declines) will both be manifested over the medium to long term. Although area effects are a
widespread finding, often observed in terms of a lower occupancy of smaller habitat areas, the relative
importance of the three main drivers of this pattern is poorly understood. This reflects a general
pattern that fragmentation studies are overwhelmingly focussed on patterns of change, rather than
mechanisms of change. In the few studies which have attempted to investigate these hypotheses
explicitly, the results have sometimes shown support for the resource-shortage (Burke & Nol, 1998;
Zanette et al., 2000) or the stochasticity hypothesis (Berger, 1990; Sekercioglu et al., 2002). Many
other studies have demonstrated that small populations are more prone to extinction (Schoener &
Spiller, 1987; Pimm et al., 1988; Hanski et al., 1995; Lima et al., 1996; Crooks & Suarez, 2001;
Krauss et al., 2003), but it is unclear in these cases if small populations went extinct because of
stochastic processes or because they were sink populations in deterministic decline, for example due

Chapter 1: The impacts of land-use change on Southeast Asian biodiversity
9
to resource shortages. It should also be noted that many other studies have not observed clear area
effects on individual species (Debinski & Holt, 2000; Brotons et al., 2003) or observed effects at odds
with the expectations (Dooley & Bowers, 1998; Brooker & Brooker, 2001), even though area effects
have been found to be marginally positive for species on average (Bender et al., 1998; Connor et al.,
2000; Haddad et al., 2015).
The aggregated area effects for individual species leave a more clearly observable (and far more
frequently studied) area effect on communities as a whole, in the form of the species-area relationship
(SAR). The SAR is one of the most widely-studied and most truly universal patterns in ecology, and
holds for a diversity of taxa and ecological systems (Macarthur & Wilson, 1967; Connor & McCoy,
1979; Rosenzweig, 1995; Drakare et al., 2006). When parameterised in continuous habitat, the SAR
may be useful for determining the number of species expected to exist in a given area of more-or-less
uniform habitat, such as a reserve or logging concession. It is also often applied in heterogeneous
landscapes, with parameterisation based on patches of preferred habitat, embedded in what is assumed
to be a more-or-less hostile matrix. Given that the SAR assumes a single habitable land-use type, its
application in heterogeneous landscapes is likely to be most successful when there is high “contrast”
between land-uses present in a landscape (e.g. forest fragments and an agricultural matrix habitat), or
for species which perceive the landscape in this way (Prugh et al., 2008). More recently, however, the
species-area model has been extended to include multiple land-uses, in order to incorporate the many
species which exhibit continuous, rather than binary, response functions across different types of land-
use (Tjørve, 2002; Triantis et al., 2003; Pereira & Daily, 2006; Koh & Ghazoul, 2010b). In addition to
this, Hanski et al. (2013) have modified the SAR to allow for metapopulation dynamics occurring in
fragmented landscapes, which may prove promising, in general, in the context of poorly-dispersing
taxa in heterogeneous environments. Indeed, in a meta-analysis of fragmentation effects on the
occurrence of species, Prugh et al. (2008) found that the strongest effects of patch isolation were in
forestry landscapes, rather than in agricultural or urban landscapes.

Chapter 1: The impacts of land-use change on Southeast Asian biodiversity
10
The influence of the spatial configuration of land-use types in a landscape, i.e. effects of habitat
fragmentation per se, have generally been found to be weaker than the effects of the areal extent of
different land-use types (Watling & Donnelly, 2006; Prugh et al., 2008), and are generally thought to
be restricted to landscapes with low levels of forest cover (Andrén, 1994; Pardini et al., 2010).
However, one notable exception to this is the effect of road networks introduced into continuous
habitat, a process which is expected to increase dramatically in the next half-century (Laurance et al.,
2014a). A rapidly-growing road ecology literature, albeit primarily in temperate and boreal systems,
has shown that many species avoid roads or suffer mortality due to collisions (Coffin, 2007; Fahrig &
Rytwinski, 2009), with bird and mammal occurrence near roads and other infrastructure being
depressed by approximately 30% across past studies (Benítez-López et al., 2010). If species habitually
avoid or cannot cross (for example due to fencing) roads, local population immigration rates will be
reduced, which may increase the risk of local population extinction (Hanski, 1998) and cause declines
in species richness (Chave & Norden, 2007). In addition, roads may introduce a broad range of edge
effects, including those mediated by abiotic mechanisms such as altered micro-climatic regimes
(Didham & Lawton, 1999; Grimbacher et al., 2006), as well as biotic mechanisms, such as the
changes in predation, competition and parasitism rates that have been observed in edge habitats more
generally (Paton, 1994; Donovan et al., 1997; Piper & Catterall, 2003; de Almeida et al., 2008). A
problematic aspect of road ecology studies, as in land-use change studies more broadly, has been the
suitability of control measurements (Fahrig & Rytwinski, 2009). The incidence of roads is often
correlated with other attributes of landscapes, such as habitat quality and extent, leading to uncertainty
over whether land managers and conservationists should prioritise the mitigation of road impacts or
not. In addition, roads interact in often complex ways with the societal context in which they are
introduced, leading to unforeseen indirect effects of roads, such as increased hunter access and
colonisation rates, which may be more substantial than the direct effects of fragmentation of habitat
(Wilkie et al., 2000; Laurance & Cochrane, 2001; Laurance et al., 2009).

Chapter 1: The impacts of land-use change on Southeast Asian biodiversity
11
Significant research effort has been devoted to elucidating the intrinsic characteristics of species
which make them more or less susceptible to population extinction under land-use change. Although
much of the research effort on this topic has focussed on birds (e.g. Castelletta et al., 2000; Lees &
Peres, 2008; Sodhi et al., 2010; Uezu & Metzger, 2011), and there is a persistent problem that many
species characteristics are highly correlated (Laurance, 1991; McKinney, 1997; Ewers & Didham,
2006), some broad generalisations are still possible. In particular, species which: 1) occur at low
density; 2) exhibit fluctuating populations; 3) are resource or micro-habitat specialists, or 4) have poor
dispersal abilities, are all likely to be more susceptible to extinction under land-use change
(McKinney, 1997; Tscharntke et al., 2002; Henle et al., 2004). If species responses to land-use change
are consistently determined by their intrinsic traits, this may give rise to “nestedness” patterns
(Patterson, 1987) along land-use gradients, i.e. species communities in progressively more species-
poor land-uses may be simple subsets of communities in species-rich land-uses. Nested patterns of
species occurrence have indeed been observed along gradients varying in one dimension, for example
in habitat fragments ordered by area (e.g. Lynam & Billick, 1999; Wethered & Lawes, 2003; Fischer
& Lindenmayer, 2005; Hill et al., 2011), suggesting that, at least in some cases, community change
can be modelled, and perhaps predicted, with reasonable accuracy (but see Mac Nally, 2007).
However, land use gradients often involve changes in many ecological properties of landscapes at
once. Moreover, there is often an interaction between the intrinsic characteristics of species with the
particular properties of a given landscape, such that no two landscapes function entirely consistently
(Wright et al., 1997; Henle et al., 2004). This means that models of land-use effects on communities
will need to sacrifice some generality if they are to be sufficiently accurate to be useful in a
management context and, ideally, to be parameterised on a landscape-by-landscape basis.
Much of the land-use change literature, thus far, has dealt with statistically confirming, or quantifying
effect sizes, of various landscape or species characteristics on biological responses. There is now a
pressing need to begin to use such statistical relationships to assess and predict the accumulated
biological responses over space and time. Available evidence suggests that it will be difficult to

Chapter 1: The impacts of land-use change on Southeast Asian biodiversity
12
construct simple models with high explanatory power for the multi-scale, multi-dimensional and
interdependent processes occurring in multiple-use landscapes, despite the promise of modified SARs,
for example. Instead, the way forward will likely require 1) empirically determining whether a
categorical description of land-use types is an allowable simplification for a given management
question in a given region, or whether additional complexity, such as habitat heterogeneity within
landscapes, is necessary (Cushman & McGarigal, 2004), 2) explicitly incorporating spatial scale into
models, including the potential for scale-dependent effects of land-use change (Wiens, 1989; Sax &
Gaines, 2003; Hill & Hamer, 2004), and 3) identifying groups of species which show similar
responses and which can therefore be modelled together (McIntyre & Hobbs, 1999; Vos et al., 2001;
Didham et al., 2012).
1. 3. Land-use change and fragmentation in a Southeast Asian context
The Southeast Asian region was almost entirely covered in closed tropical forest from at least the
early Holocene (Bird et al., 2005; Corlett, 2009a). Today, however, extensive areas of this original
forest have been cleared, degraded and fragmented (Stibig et al., 2003, 2004) due to agriculture,
plantation forestry and urban development. These large-scale changes in land-use have occurred in
relatively recent history compared to elsewhere in the world (Ramankutty & Foley, 1999), and the
history of land-use changes in the region may have important ramifications for the ecological patterns
and processes we observe today.
Small-scale clearance and settlement of forest areas had occurred ever since the first arrival of Homo
sapiens in Southeast Asia, 40,000-70,000 years before present (Corlett, 2007). Forest clearance
became more widespread with the spread of rice-cultivation in the last few thousand years (Corlett,
2009a) and, from the 15th Century, with the expansion of pepper grown for export to Europe and
China (Reid, 1995). However, it was not until the latter half of the 19th Century that changes in land-
use really began to define the ecology of large regions of Southeast Asia (Flint, 1994). This coincided
with the increasing political dominance of colonial powers, which resulted in the first commercial
Chapter 1: The impacts of land-use change on Southeast Asian biodiversity
13
logging (for a limited number of species, such as teak Tectona grandis, changal Neobalanocarpus
heimii, Bornean ironwood Eusideroxylon zwageri and Palaquium gutta for the production of “gutta
percha” latex) and also extensive conversion of natural forest to plantations, especially rubber Hevia
brasiliensis (Thang, 1987; Brookfield et al., 1995).
Logging at this time was, however, still dependent on human and animal power, and was largely
confined to the margins of navigable rivers in order to transport logs off-site (Johns, 1997). With the
dawn of mechanized logging in the 1950s, especially the development of the one-man chain-saw, as
well as soaring demand for hardwood logs (largely driven by Japan), commercial logging in its
modern form rapidly expanded in the region from the 1960s onwards (Brookfield et al., 1995). This
was also the first time that markets were developed for many of the dipterocarp species of Sundaland,
initially focussing on red merantis (Shorea spp.) but later expanding to other genera. Sundaland
lowland forests, and indeed Southeast Asian forest in general, are unusual in their high stocks of
saleable timber: most canopy trees belong to the Dipterocarpaceae family (Whitmore, 1984; Newbery
et al., 1992), of which the species can often be marketed together. These forests are, as a result, some
of the most productive in existence, with typical extraction rates of 14-24 trees ha-1 or a timber
volume of more than 100 m3/ha, and up to 72 trees ha-1 or 220 m3/ha possible in some areas; this
compares with 3-5 trees ha-1 in Amazonian terra firme forest or < 1 tree ha-1 in Central Africa, with
timber yields of usually less than 20 m3/ha (Johns, 1997; Putz et al., 2012). This high-stocking of
forests in the region fuelled a logging boom, with the volume of dipterocarp timber exported from just
the island of Borneo (East Malaysia and Kalimantan, Indonesia) becoming greater during this period
than the timber exports from all of the Neotropics and Afrotropics combined (Curran et al., 2004).
Reflecting this boom, the Malaysian state of Sabah saw primary forest cover fall from 55% of land
area in 1973 to just 25% a decade later (Dauvergne, 1997).
Logging operations also have substantial indirect effects on forests, even if parts of a concession
remain unlogged. They bring increasing numbers of people into an area either directly or indirectly

Chapter 1: The impacts of land-use change on Southeast Asian biodiversity
14
employed by the logging operation, and they increase the accessibility of forests by building roads,
which can facilitate hunting, mining and illegal logging, as well as spontaneous colonisation by slash-
and-burn farmers (Bennett & Gumal, 2001; Meijaard et al., 2005). Indeed, due to the high intensity of
logging in Southeast Asian dipterocarp forests, the density of logging roads is much higher than
elsewhere in the tropics: Gaveau et al. (2014) mapped 0.5 km of roads per km2 of forest logged in
Borneo (between 1973 and 2010), which is an order of magnitude higher than similar estimates for
Central Africa at 0.03 km/km2 (Laporte et al., 2007). Logging also substantially increases the risk of
fires, which can burn vast areas in El Nino years (Siegert et al., 2001). Perhaps most importantly,
logging decreases the perceived, as well as marketable, value of natural forest, and therefore much
reduces any opportunity costs of converting such areas to plantations or cropland (McMorrow &
Talip, 2001; Koh & Wilcove, 2008; Fitzherbert et al., 2008; Berry et al., 2010). Heavily-degraded
logged forests have been left out of recent efforts in Indonesia to control deforestation (Edwards &
Laurance, 2011) and, in general, are less likely to be deemed of high conservation value in landscape
planning exercises.
By the 1990s, log production had declined in many countries in the region due to unsustainable
harvesting practices (prompting logging bans and temporary moratoriums of various forms in
Thailand, Vietnam, Cambodia and the Philippines) and the role of plantation forestry increased,
principally using teak, rubber, Eucalyptus spp., Acacia spp., Paraserianthes (Albizia) falcataria,
white teak Gmelina arborea, Anthocephalus chinensis and Pinus spp.. Plantation forests, mostly at the
expense of logged forest, now dominate entire landscapes in many regions of Southeast Asia,
especially in Thailand and Vietnam, where they represent more than 20% of the forest estate (FAO,
2011). Few areas of continuous primary forest now remain in Southeast Asia, mostly in Indonesia,
Thailand and Malaysia (FAO, 2011).
In the last decade, a new threat to Southeast Asia’s forests has emerged in the form of oil palm Elaeis
guineensis agriculture. In the last two decades, the land area harvested for palm oil in Southeast Asia

Chapter 1: The impacts of land-use change on Southeast Asian biodiversity
15
has nearly quadrupled, from 2.7 million ha in 1991 to 10.7 million ha in 2011 (FAO, 2012). Indeed,
the world’s top three palm oil producers are found in Southeast Asia (Indonesia, Malaysia and
Thailand) and oil palm now dominates large areas of these countries; this is especially the case for
Malaysia, in which mature oil palm occupies 12.2% of total land area (FAO, 2012), and up to 13.4%
if the area of immature palms (0.4 million ha in 2005; Wicke et al., 2011) is included. Oil palm has
been a major driver of primary and logged forest loss: more than half of the expansion between 1990
and 2005 possibly occurred on previously forested land (Koh & Wilcove, 2008; but see Gibbs et al.,
2010), though this also includes plantation forests, such as Acacia mangium, and does not establish a
direct causal link between initial clearance and oil palm cultivation itself. Evidence at a local scale is
more conclusive, however (e.g. McMorrow & Talip, 2001; Abdullah & Nakagoshi, 2007; Ichikawa,
2007; Reynolds et al., 2011). The Indonesian province of Riau, on the island of Sumatra, is one such
example, in which ca. 85% of oil palm expansion between 1982 and 2007 occurred at the expense of
natural forest (Uryu et al., 2008). Plantation forestry is expanding rapidly in most countries in
Southeast Asia, especially Vietnam and Indonesia, but the expansion of oil palm has tempered this
and likely even caused a reduction in the plantation forest area reported for Malaysia (FAO, 2011;
Wicke et al., 2011).
Projections of population growth and per-capita intake of vegetable oil (whilst accounting for oil palm
yield improvements) suggest that the area of oil palm will need to increase more than two-fold, by 12
million ha, in order to meet demand by 2050, excluding any use in biodiesel production (medium
scenario; Corley, 2009). Much of this expansion of oil palm will occur in Indonesia, which is
predicted to increase its area under oil palm by 3-5 million ha in the next decade alone (Koh &
Ghazoul, 2010a), but an increasing proportion will also come from the agricultural power-houses of
Brazil and Colombia. The contribution of certain Southeast Asian nations which currently produce
only negligible amounts of palm oil is also rapidly increasing: Myanmar, Laos and Cambodia
currently do not report any land area under oil palm (FAO, 2012), but large-scale forest clearance
recently detected using satellite remote-sensing has already been linked to the establishment of new

Chapter 1: The impacts of land-use change on Southeast Asian biodiversity
16
plantations (Stibig et al., 2007). In contrast, Malaysia, which has spearheaded the growth in oil palm
production over the last three decades, will likely decrease in importance and is expected to reach its
maximum area of oil palm before 2020 (Shean, 2011).
1. 4. Current understanding of the ecological impacts of selective logging in Southeast Asia
The study of the impacts of logging has been the defining paradigm for ecological research in
Southeast Asia for at least the last three decades. The earliest ecological work done on the impacts of
logging was conducted within the context of forestry research, and was primarily concerned with the
management of timber stocks and the improvement of silvicultural systems (e.g. Wyatt-Smith, 1963;
Burgess, 1970; Tang, 1974; Whitmore, 1984; Appanah & Turnbull, 1998). Subsequently, the breadth
of research increased, extending to the impacts of logging on non-commercial, but nonetheless
ecologically important, species. This demonstrated the non-selective, random nature of “selective
logging”, in which trees species are killed by the logging process in proportion to their pre-logging
abundance and irrespective of tree size class (Johns, 1988). In addition, given that the disturbance
from this type of logging was in fact random with respect to species, high species richness is often
maintained, albeit at a larger spatial scale (Cannon et al., 1998). However, fig trees (Ficus spp.) may
experience high loss rates during logging: 75% of figs were lost at Sungai Tekam, Peninsular
Malaysia (Johns, 1987). This occurs since many species exhibit hemi-epiphytic growth forms (the
strangling figs, in the subgenus Urostigma) and host trees are commonly timber species. Figs,
particularly the hemi-epiphytic figs, are especially important for many frugivorous species, owing to
their large fruit crops, short fruiting intervals and weak inter- and intra-specific synchronicity in
fruiting, resulting in year-round fruit availability (Lambert & Marshall, 1991).
The high intensity of logging in Southeast Asian dipterocarp forests creates substantial habitat
heterogeneity at fine spatial scales, with observable vegetation phase changes occurring over tens of
metres (Cannon et al., 1994). Crown sizes of trees in Southeast Asia are relatively small compared to
the Neotropics (Putz & Appanah, 1987) and canopy gaps created by felling individual trees are
Chapter 1: The impacts of land-use change on Southeast Asian biodiversity
17
usually less than 600 m2. Nonetheless, “super-gaps” of > 2,000 m2 can form under the high-intensity
logging typical in Sundaland lowland dipterocarp forest (Sist et al., 2003). In logged forest in Sabah,
Malaysia, gaps were mostly less than 10 m wide (i.e. 100 m2) after 16 years of natural regeneration,
and very few were > 20 m across (Bebber et al., 2002). Habitat heterogeneity may also be created
over larger spatial scales, with ridgetops typically experiencing the greatest impacts (where skid trails,
access roads and log-landing areas are located) and less severe disturbance in valley bottoms (Johns,
1988). Very steep (> 35º) or rocky areas may avoid disturbance altogether, as may “islands” of habitat
surrounded by swamp forest (Cannon et al., 1994). In some cases, cable yarding may be employed on
steep slopes, in which case damage to vegetation may be even more severe than tractor-based log
extraction (Marsh & Greer, 1992). Overall, the amount of area directly affected by logging is usually
substantial: between 77 and 87% of logging concessions in West Kalimantan, Indonesia (Curran et al.,
1999), with as much as 17% of land area cleared just for transporting logs from felling site to sawmill
(Pinard et al., 2000a).
Immediately after logging, it has been suggested that fruiting and increased leaf flush may occur as a
response by the remaining trees to conditions resembling drought, as well as the increased light
availability (Chivers, 1974). Indeed, leaf production significantly increased following logging at the
Sungai Tekam study, as did fruit production along the edges of logging roads (Johns, 1988). In the
medium-term after logging, changes may occur due to the increased prevalence of canopy gaps,
which are otherwise rare in mature, closed canopy forest (ca. 1% of area; Newbery et al., 1992; Hill et
al., 2001; Sist et al., 2003). This leads to increased leaf production and tree growth rates at the
margins of gaps and also increased colonisation by pioneer species. In the high-intensity logging
disturbance typical in Southeast Asia, in which 62-80% of the canopy may be damaged (Johns, 1997),
such pioneer species can become dominant: for example, 25% of all trees (> 30 cm girth at breast
height) were of a single species, Macaranga hypoleuca, in logged areas in Sabah, Malaysia (Heydon
& Bulloh, 1997). Larger open areas created by logging, such as log landing areas and main haulage
roads, may be subjected to topsoil loss, erosion and compaction. In this case, regeneration may be

Chapter 1: The impacts of land-use change on Southeast Asian biodiversity
18
severely arrested and only grasses and herbaceous vegetation may be able to colonise in the medium-
term.
In the longer-term, further changes in tree species composition may occur with disrupted plant-animal
interactions, including herbivory, pollination, seed dispersal and seed predation (e.g. Ickes et al.,
2001; Brodie et al., 2009; Sethi & Howe, 2009; Harrison et al., 2013). For strangling fig trees, even if
dispersal agents persist, pre-logging densities are unlikely to be restored over the short- to medium-
term, since they require high canopy host trees upon which to germinate (Johns, 1987), which in turn
may take centuries to grow (Loader et al., 2011). Indeed, in general, logging may be detectable in the
floristic composition of tropical forests for centuries following the initial disturbance (Brearley et al.,
2004; Liebsch et al., 2008), which matches estimated rates of tropical forest recovery from other
disturbance processes evident in the palynological record (Cole et al., 2014). There is also evidence,
from Borneo’s lowland dipterocarp forests, that regional-scale logging and clearance of forest can
lead to the persistent failure of canopy tree recruitment in remaining protected forests, even if
protected areas are large (900 km2) and contiguous (Curran et al., 1999). Logging likely disrupts the
large-scale satiation of seed predators, which is necessary for recruitment in many dipterocarp species
(Curran & Leighton, 2000), and may also alter responses to the specific climatic conditions which are
ordinarily thought to induce flowering and mast fruiting (Curran et al., 1999).
Increasing concern for wildlife depletion in logged forests in the 1970s led to the first concerted
studies of logging impacts on wildlife in Southeast Asia, beginning with easily-observed, diurnal
vertebrates, including birds, primates and other large mammals (Davies & Payne, 1982; Wilson &
Johns, 1982; Johns, 1986a, 1986b, 1987; Wong, 1986; Lambert, 1992). These early studies
established that the species richness of logged areas was similar to old-growth forest and that few
species were extirpated by logging: for example, studies in lowland dipterocarp forest in Sabah,
Malaysia, showed that between 87 and 96% of bird species recorded in old-growth forest were also
recorded in logged forest (Johns, 1992; Lambert, 1992) and all six species of primate were still

Chapter 1: The impacts of land-use change on Southeast Asian biodiversity
19
present at the Sungai Tekam study site after it was logged six years earlier (Johns, 1986a). We now
have a broader taxonomic picture of logging impacts in Southeast Asia and these results have
generally been corroborated for a range of vertebrate and invertebrate groups, including bats (Fukuda
& Tisen, 2009; Furey et al., 2010), non-volant small mammals (Wells et al., 2007; Bernard et al.,
2009), butterflies (Willott et al., 2000; Ghazoul, 2002; Hamer et al., 2003; Dumbrell & Hill, 2005, but
see Hill et al., 1995), moths (Willott, 1999), dung beetles (Davis et al., 2001; Slade et al., 2011), ants
(Berry et al., 2010; Woodcock et al., 2011) and termites (Eggleton et al., 1997, 1999; Gathorne-Hardy
& Jones, 2002, but see Donovan et al., 2007). Recently, two meta-analyses of logging impacts on
biodiversity have extended the generality of this finding across all tropical forest regions (Gibson et
al., 2011; Putz et al., 2012).
However, this widely-repeated finding is a simplification in at least two respects. Firstly, logged
forests rarely retain all of the species occurring in old-growth forest and these species extirpations,
even if few in number, may have a disproportionate impact on global biodiversity if they occur mostly
amongst highly threatened, restricted-range species. It is, at least, a relatively robust macroecological
pattern that species occurring at low population density – which, all else being equal, will be more
susceptible to reductions in the availability of habitat or resources – often have a small geographic
range (Brown, 1984). There was no evidence that old-growth forest-dependents were also restricted-
range species for bird communities either in Central Kalimantan, Borneo (Cleary et al., 2007) or on
the island of Seram, Indonesia (Marsden, 1998). Some support for this, however, was found amongst
butterfly species in Borneo: although restricted-range species mostly persisted in logged forest, they
exhibited particularly depressed populations in this habitat compared to old-growth forest (Cleary &
Mooers, 2006). Indeed, evidence from a number of studies, albeit fragmentary, appears to support this
for butterfly communities, more generally, in undisturbed and disturbed habitats in Southeast Asia
(Koh, 2007b). Amongst Bornean mammals, there was also a significant trend for phylogenetically
older species, which typically also have small geographic ranges (as well as dietary specialisations),
to be more affected by logging (Meijaard et al., 2008).

Chapter 1: The impacts of land-use change on Southeast Asian biodiversity
20
Secondly, the widespread focus on univariate measures, such as species richness, in order to gauge the
severity of logging impacts, may be concealing important detrimental effects at the level of species
communities. The proliferation of gap dynamics in logged-over forests creates winners and losers out
of communities of species, since species vary in their pre-adaptations to exploit such gap resources or
in their ability to exhibit the phenotypic plasticity necessary to do so. As a result, logging-induced
changes in species composition and trophic structure can be significant (Eggleton et al., 1997;
Ghazoul, 2002; Akutsu et al., 2006; Cleary et al., 2007; Edwards et al., 2009, 2011), although
significant decreases in species diversity or evenness have not usually been found (but see Ghazoul,
2002). It is worth emphasising that, since logged areas typically retain most of the species occurring
in old-growth forest, these composition changes are driven almost entirely by abundance changes,
rather than the loss of species. Even so, changes in the relative abundance of different species may
have important effects on species interactions and, in turn, on ecosystem function (Tylianakis et al.,
2008), particularly if abundance changes are correlated between functionally-similar species. Species
occurring at very low density may even be functionally extinct, even if their populations persist.
When these species, often known only from single records, are removed from species lists, this may
result in a dramatically altered picture of the severity of logging impacts on biodiversity (Barlow et
al., 2010).
Current knowledge of the ecological impacts of logging is also deficient in one increasingly important
way: the overwhelming majority of studies have been done in forests that have undergone only one
rotation of logging. Although cutting cycles of 60 years or more were envisioned for lowland
dipterocarp forest (Whitmore, 1984; Reynolds et al., 2011), most forests in the region have not been
managed on a sustainable basis, with re-entry logging commonly occurring after 15-30 years in
Sabah, Malaysia (Fisher et al., 2011a) and after a prescribed 35 years in Indonesia (van Gardingen et
al., 2003). As a result, an increasing proportion of Southeast Asia’s production forest has now been
logged repeatedly (Reynolds et al., 2011), or soon will be (van Gardingen et al., 2003; Samsudin et
al., 2010). Ecological research has not kept pace with this evolving state of land-use in the region:

Chapter 1: The impacts of land-use change on Southeast Asian biodiversity
21
very few studies have specifically investigated the biological responses to repeated logging. To my
knowledge, only a handful of studies, all conducted in the landscape surrounding the Danum Valley
Conservation Area, have compared once-logged and repeatedly-logged forest (Slade et al., 2011;
Edwards et al., 2011, 2014a; Woodcock et al., 2011). More broadly, many forest areas in Southeast
Asia are highly disturbed due to small-scale logging, the collection of non-timber forest products,
mining, grazing, fire and shifting agriculture (e.g. Salafsky et al., 1993; Brookfield et al., 1995; de
Jong, 1997; McMorrow & Talip, 2001; Paoli et al., 2001; Rao et al., 2002; Pattanavibool & Dearden,
2002; Goldammer, 2006; Ichikawa, 2007). Unlike for the Neotropics, where these practices are also
widespread (Peres et al., 2010), there is scant information on the extent and scale of these disturbance
processes and very little knowledge about the ecological consequences for forests in the region. Given
the large variability in the nature of disturbed forests in the region, a way forward may be to move
away from categorical descriptions of land-use types and begin to quantify biodiversity responses
along continuous metrics of land-use intensity. This poses the challenge of identifying which
characteristics of disturbed landscapes species respond to, and at what scale, but may allow better
integration of findings across studies and more precise predictions of the effects of land-use change.
Support for this has recently been provided by a meta-analysis of the effects of tropical forest logging,
in which a continuous metric – logging intensity, measured as the volume of timber extracted –
proved to be the most important predictor of species richness responses to logging, despite the broad
range of studies included (Burivalova et al., 2014).
1. 5. Biodiversity in plantation forests and croplands in Southeast Asia
The study of land-use types beyond disturbed natural forest has lagged behind in Southeast Asia and
we therefore have poor knowledge of the relative biodiversity value of the huge variety of plantation
and cropland types prevalent in the region. Nonetheless, we would a priori expect greater ecological
responses, for example in terms of forest species loss and compositional changes, to the clearance and
replacement of forest as compared to its disturbance, for example under intense logging. The
relatively limited number of studies done in Southeast Asia across all three types of land-use – old-

Chapter 1: The impacts of land-use change on Southeast Asian biodiversity
22
growth forest, logged/disturbed forest and agriculture – broadly support this for a range of taxonomic
groups, including mammals (Wilson & Johns, 1982; Duff et al., 1984; Danielsen & Heegaard, 1995;
Bernard et al., 2009; Rustam et al., 2012), birds (Waltert et al., 2004; Sodhi et al., 2005; Peh et al.,
2005), amphibians (Wanger et al., 2010), termites (Gathorne-Hardy et al., 2002; Jones et al., 2003),
isopods (Hassall et al., 2006), beetles (Chung et al., 2000; Davis et al., 2001), butterflies (Schulze &
Waltert, 2004), moths (Beck et al., 2002; Chey, 2006) and all arthropods combined (Turner & Foster,
2008). Using data provided in a meta-analysis for Southeast Asia (Sodhi et al., 2009), it possible to
state that agriculture in the region, including plantation forestry, leads to an estimated average decline
in species richness of birds, mammals and invertebrates by 35.9% (SE = 4.7, n = 87 comparisons,
from 23 separate studies), which is 15% greater than that caused by logging and disturbance of forest
alone.
Some exceptions to this broad pattern have, however, been noted. The single study incorporating
reptiles (Wanger et al., 2010) showed equivocal responses with respect to land-use, as did one study
of small mammals (Nakagawa et al., 2006). Bees exhibited conflicting patterns of change across land-
use, with the species richness and diversity being higher in oil palm than in some secondary forests,
although the community composition changes from old-growth forest were more dramatic in oil palm
compared to secondary forest, and abundance was lower (Liow et al., 2001).
This effect size is also strongly dependent on the specific land-use investigated, most likely due to
differences across land-use in structural complexity, available resources and the properties (including
variability) of their microclimates. For example, one emerging pattern is that plantation forests
typically retain greater biodiversity than other types of plantation or cropland. For example,
Paraserianthes (Albizia) falcataria plantations in Sabah, Malaysia, were found to harbour 64% of the
avifauna of surrounding old-growth forests, most likely because the relatively open canopy of P.
falcataria allows the development of a complex and diverse under- and mid-storey plant community,
as well as the abundant food resource provided by insect pests of the tree itself (Mitra & Sheldon,

Chapter 1: The impacts of land-use change on Southeast Asian biodiversity
23
1993). Similarly, Acacia mangium plantations, which have been the subject of recent research effort
in the 5,000 km2 Planted Forest Zone in Sarawak, were found to contain 41% of old-growth forest
bird species (Sheldon et al., 2010) and 74% of the mammal taxa detected overall (McShea et al.,
2009). A. mangium plantations support a relatively diverse under-storey plant community (although
the canopy is lower and denser than in P. falcataria plantations) and additionally provide seeds on the
trees themselves, which are eaten by frugivorous species (Styring et al., 2011). Although the sample
sizes are small, this general pattern is evident in a recent meta-analysis (Gibson et al., 2011):
plantation forests in Asia (including oil palm) were associated with a standardised effect size of 0.32
(n = 27 comparisons, from 6 studies, for a range of biological metrics relative to old-growth forest),
whilst agricultural croplands had a much larger effect size of 2.59 (n = 33 comparisons, from 5
studies).
Oil palm plantations are a special case in that, although tree-based and perennial, they are intensively
managed for an agricultural crop, in the form of oil palm fruit. A relatively large amount of research
effort has been devoted to oil palm in the last decade and, even if the vast majority of the oil palm
literature is not relevant to biodiversity (Turner et al., 2008) or does not actually present new field
data (Foster et al., 2011), we now know comparatively more about its value for biodiversity than
many other important agricultural crops in the tropics, especially relative to its global land area
(Balmford et al., 2012). In almost all cases, oil palm habitat has been shown to support highly
impoverished species communities, even when compared to other degraded or plantation forest
habitats (Fitzherbert et al., 2008; Foster et al., 2011), and was shown to support just 10% of forest bird
species and 23% of forest vertebrate species overall (Danielsen et al., 2009; Sheldon et al., 2010).
This is apparently to do with the more intensive management practices associated with oil palm,
including frequent human disturbance, understorey weed clearing and herbicide application, as well as
its low and dense canopy (at least after closure at 15-20 years). As a result, the plant diversity and
structural complexity of oil palm habitat is substantially lower than in other tree-based plantations
(Chung et al., 2000; Danielsen et al., 2009; Sheldon et al., 2010). Interestingly, rubber plantations are

Chapter 1: The impacts of land-use change on Southeast Asian biodiversity
24
similarly depauperate in forest vertebrate species (Aratrakorn et al., 2006), for example containing
just 10-24% of forest bird species (Danielsen & Heegaard, 1995; Peh et al., 2006), whilst this is not
true of rubber agroforestry (Beukema et al., 2007). As in the case of oil palm, rubber plantations are
typically managed on an intensive basis, with frequent understorey clearing and human disturbance.
This may explain the high degree of similarity observed between species communities in oil palm and
rubber plantations (Aratrakorn et al., 2006). Both habitats share species which have high vagility,
large geographic ranges and a preference for open habitats, that is to say, species which are low
priorities for conservation attention (Danielsen & Heegaard, 1995; Aratrakorn et al., 2006).
Beyond oil palm, rubber, P. falcataria, and A. mangium, our knowledge of the biodiversity values of
Southeast Asia’s plantation and agricultural lands is currently sparse. For example, almost no studies
have been made in plantations composed of teak, Eucalyptus spp. (e.g. camaldulensis, deglupta and
pelita), Pinus spp. (e.g. merkusii, carabaea and oocarpa), or coconut Cocos nucifera, or in certain
agricultural landscapes which are highly dominant in some local areas, such as tea Camellia sinensis
monoculture. As a result, it is difficult to make any further generalisations beyond those tentatively
noted above. In particular, two generalisations, which might be expected to be relatively robust, have
not yet been supported by the limited evidence available. Firstly, agroforestry systems are a common
land-use type in Southeast Asia and typically harbour a diverse tree community (including, in “jungle
rubber” systems, some Dipterocarpaceae and other native canopy trees) and high structural diversity
(Thiollay, 1995); we would therefore expect agroforestry to contain greater biodiversity value than
monoculture plantation forests, but this has not been borne out by the data available so far: 59% and
27.1% of forest bird species were found in mixed and coffee Coffea canephora agroforestry systems
in Sumatra, respectively (Thiollay, 1995; Philpott et al., 2007), which is broadly similar to the
percentages retained by plantation forests (see above), with the exception of rubber and oil palm.
Secondly, open land-use types with no tree cover would be expected to contain significantly fewer
species than other land-use types, on the basis that their properties are the most dissimilar to native
vegetation types, but this was not supported conclusively in the case of bird, butterfly and dung beetle

Chapter 1: The impacts of land-use change on Southeast Asian biodiversity
25
communities compared between cacao Theobroma cacao agroforestry and maize Zea mays fields
(Schulze & Waltert, 2004), nor for amphibians and reptiles compared between cacao agroforestry and
open pasture (Wanger et al., 2010). Clearly, further studies are warranted if we are to reconcile the
various conservation strategies available to decision-makers in the face of inevitable expansions in
agricultural land area over the coming decades (Green et al., 2005; Balmford et al., 2012).
1. 6. Confounding factors in the assessment of ecological responses to land-use change
In reviewing current understanding of the impacts of land-use change in Southeast Asia I have largely
followed the current consensus, as represented in the literature, and attempted to avoid reproducing
the conclusions of studies which were based on obviously limited, biased or otherwise flawed
datasets. As a result, the overall generalisations are most likely robust in qualitative terms. Even so,
there is reason to be cautious with respect to the quantitative underpinnings of most studies reviewed
here, and this is especially important if quantitative assessments of biodiversity loss, and indeed
predictions into the future, are to be made on the basis of current knowledge. There are four main
confounding factors that are present in many land-use studies in the region: 1) the exchange of
transient and dispersing individuals between land-uses; 2) extinction debts (both deterministic and
stochastic); 3) inadequate statistical controls, and 4) imperfect detection of species. I will deal with
each of these confounding factors in turn.
A commonly conceded problem with focussing on records of species presence and absence, and the
species lists they generate, is that the presence of a species does not necessarily equate with the
presence of a viable population in a particular land-use (Gardner et al., 2007; Gibson et al., 2011). In
other words, if the population growth rate (r) could be measured within the given land-use only (i.e.
assuming no migration between land-uses), it would not necessarily be greater than zero. This is
important, since the highest conservation priority should be assigned to land-uses with viable
populations. There are a number of ways that misleading species records in a particular land-use type
(i.e. from populations for which r would be less than 0) might arise. Species may be detected in a

Chapter 1: The impacts of land-use change on Southeast Asian biodiversity
26
plantation or other land-use type in which they derive no use simply because they are moving between
patches of habitat which are used (i.e. the problem of transient individuals). Species may also be
detected in a land-use type in which they may derive some use, but are unable to reproduce (i.e. the
problem of long-distance ranging). For example, flocks of birds were observed ranging into P.
falcataria plantations from surrounding forest to feed on the abundant caterpillars on plantation trees
(Mitra & Sheldon, 1993). In addition, bearded pigs and leopard cats are both known to forage outside
forest areas to exploit increased food resources in oil palm habitat, in the form of oil palm fruit and
small mammals, respectively (Ickes, 2001; Rajaratnam et al., 2007). Such species may not be able to
procure sufficient resources from the plantation forest alone and suitable conditions for reproduction
may not exist. Equally, populations in optimal habitat will produce a surplus of individuals which
would not survive due to competition for resources, but these individuals may disperse to surrounding
habitats even if they are sub-optimal (i.e. the problem of mass effects; Shmida & Wilson, 1985).
Each of these processes giving rise to misleading species records in a particular land-use type are a
by-product of being in proximity to a stable population source in optimal habitat, and the effects will
therefore likely decline with distance from this source. In this way they can be considered a type of
edge-effect, but in the opposite direction to that usually studied, i.e. from good-quality to poor-quality
habitat in this case. This reverse edge-effect, sometimes called a “spill-over” effect in the literature
(e.g. Barlow et al., 2010; Gibson et al., 2011), can be explicitly tested for and quantified. This can
start with the simple prescription that all species records are associated with data on the distance from
undisturbed, or otherwise optimal, habitat. Alternatively, land-use types should be studied in isolation,
where independence is judged relative to the ranging and dispersal abilities of focal taxa. This has
rarely been done in land-use studies thus far conducted in Southeast Asia, with most studies focussing
on plantations and cropland adjacent to large, intact forest areas. The extent of the bias caused by this
widespread practice is largely unknown, though in a global analysis of land-use effects, there was no
indication of larger effect sizes in studies conducted at study sites surrounded by natural habitats (i.e.
old-growth or logged forest; Gibson et al., 2011).

Chapter 1: The impacts of land-use change on Southeast Asian biodiversity
27
Aside from spill-over, species may also be detected in a land-use in which they are not viable due to
time-delays in extinction. If the ratio of births and deaths for a species is below replacement (i.e. r <
0), the population may temporarily exist in a “living dead” state (Janzen, 1986), until the population
gradually declines deterministically to extinction. Such species are said to represent a deterministic
“extinction debt” (Kuussaari et al., 2009). Strong evidence of long-term population declines in
specific land-uses is lacking, since most studies are short-term in length. However, populations of two
Cercopithecus primate species in logged forest in Uganda apparently showed continuing declines
nearly three decades after logging (Chapman et al., 2000), and there was evidence of reduced infant
recruitment in two Presbytis primate species at the Sungai Tekam study site even 12 years after
logging (Johns & Johns, 1995). Long-term extinction debts such as these may create a window of
opportunity to conserve species populations using management interventions which foster positive
population growth rates (e.g. by using artificial nest boxes, limiting the clearance of undergrowth in
managed forests and plantations or restoring patches of native habitat).
The final population trend is one which exhibits a stable or positive population growth rate (r ≥ 0),
which can be inferred from changes in abundance (and, ideally, survival and recruitment rates) over
time. In most cases, such populations represent the highest chance of survival in a landscape for a
given species and identifying them should be the focus, where possible, when assessing the
biodiversity value of a particular land-use. However, it is worth noting that even populations with r ≥
0 may not represent viable populations in a specific land-use, for two reasons. In the first case, this
can occur due to another type of reverse edge effect, and certainly the most cryptic, which is the
“rescue effect” (Brown & Kodric-Brown, 1977). The rescue effect is when individuals permanently
dispersing from a source population sustain a sink population indefinitely. This will manifest itself in
a deterministically declining population only once the source population is lost (unlike the sink
populations considered above, which were already declining), or it can be inferred from detailed
knowledge of demographic parameters and dispersal rates between land-uses. The second reason that
populations with r ≥ 0 may not be viable is really a re-statement of the fact that all populations go
Chapter 1: The impacts of land-use change on Southeast Asian biodiversity
28
extinct over an indefinite time horizon. However, this may have more immediate consequences for
population viability in a land-use when the effective population is small and therefore vulnerable to
extinction due to environmental and demographic stochasticity. Such populations represent a
stochastic, as opposed to demographic, extinction debt and may be pervasive in many land-uses.
Identifying the size of this particular debt in a given land-use is an ongoing challenge but, at the very
least, an attempt to formally estimate population size or density across land-uses would help to assess
its likely significance. Unfortunately this is still rarely done, with most studies relying on indices of
abundance (see below).
The next potential problem of confounding is associated with inadequate study design, arising either
from poor statistical practice or real-world constraints on sampling. Inadequate study design can take
many forms, such as low levels of treatment replication and low sample sizes within experimental
treatments, which may have an impact on the ability to discern treatment effects from sampling
variation (i.e. lead to Type II errors). However, potentially more serious is the lack of suitable
statistical controls, which may mean inferences about the effects of land-use change are entirely
confounded. Control measurements are necessarily taken at a different point in space or time to
measurements taken under the effect of a given treatment, in this case land-use change, but ideally
should be identical in all respects except the treatment itself. In practice, ecological systems vary in
space and time, for example due to differences in the prevailing edaphic properties, slope or elevation
across space, due to neutral turnover in species communities, or due to seasonal effects across time.
This means that laboratory-standard controls are rarely achievable in field ecology. This is especially
the case when the spatial and temporal design of experimental is highly constrained, as is most often
the case in studies of land-use change, in which opportunities to conduct manipulative experiments
are rare. In Southeast Asian landscapes, for example, land-uses are not randomly distributed with
respect to elevation, with plantations typically established below 400 m elevation, and remaining old-
growth forest typically occurring at higher elevations (Reynolds et al., 2011; Edwards et al., 2014b;
Scriven et al., 2015). Although every effort may be made at the design stage of a study to choose

Chapter 1: The impacts of land-use change on Southeast Asian biodiversity
29
treatment and control areas which are comparable, it may not always be possible in practice. In
addition, substantial a priori knowledge of an ecological system, often lacking in poorly-studied
tropical systems, may be required to identify all potential confounding factors at the design stage. This
underlines the importance of making strong a priori hypotheses about the ecological systems under
study.
The problem of confounding differences between treatment and control areas may be especially acute
in studies which are not replicated at the treatment level at all, because these differences will covary
perfectly with the treatment effect. This issue of “pseudoreplication” has been well known in
ecological field studies for several decades (Hurlbert, 1984; Heffner et al., 1996), and may be an even
more common feature in studies of the impacts of land-use change than in other areas of ecology. In
the most part, this is because land-uses within any given landscape are often highly segregated in
space, meaning that sampling locations within each land-use may not all be truly independent from a
statistical viewpoint. Recently, attention has been drawn to this in the context of studies assessing the
impacts of logging (Putz et al., 2012; Laufer et al., 2013; Ramage et al., 2013b). Indeed, just 7% of
studies on the effects of logging, across all tropical forests, were deemed to be definitely free of
pseudoreplication (Ramage et al., 2013b). For example, logging concessions are typically allocated in
contiguous blocks and managed separately to any adjacent old-growth forests, such as protected areas,
making the interspersion of experimental units difficult to achieve within a given landscape. Even if
interspersion were achievable, however, it is not always clear that it would be desirable within a given
study, given that it may increase the inferential problems associated with the exchange of individuals
among land-uses (see above). The scale of interspersion can be matched to the dispersal abilities of
focal taxonomic groups but, for highly vagile groups, this may mean interspersion is ultimately
required at scales which are impractical to sample at sufficient intensity and coverage within a single
study. It is also worth noting that it is clear that any impacts of logging which are perhaps
unjustifiably inferred from single, pseudoreplicated studies are nonetheless real: three large-scale
meta-analyses have confirmed that the ecological effects are significantly negative overall, albeit

Chapter 1: The impacts of land-use change on Southeast Asian biodiversity
30
modest compared to other forest disturbance processes (Sodhi et al., 2009; Gibson et al., 2011; Putz et
al., 2012)
There are no simple solutions to the challenges inherent in designing studies of land-use change. From
an analysis viewpoint, it may be possible to statistically control for some of the inherent differences
between experimental units, by explicitly including extra covariates during modelling. It may also be
possible to examine the residual spatial autocorrelation in the response variable, after land-use has
been accounted for, which may for example be indicative of a broad gradient in community
composition. Most importantly, however, the scope of inferences must be matched to the study design
in hand, and in particular to the specific nature of the land-use change process, the taxonomic groups
under study, as well as the spatial extent and scale of sampling. This may mean that single studies of
land-use change often cannot make abstract generalisations about the impacts of a land-use change
process per se – this is the realm of continental- and global-scale meta-analyses – but nonetheless are
able to make inferences which may be of sufficient scope to be relevant to political and management
decisions directly affecting land-use.
The fourth main confounding factor present throughout the land-use impacts literature for Southeast
Asia is the imperfect detection of species. Ecological studies typically collect data on the abundance
or occurrence of a species in count or binary form, respectively. However, for the majority of species
which cannot be completely censused, these data are negatively biased with respect to the actual
abundance or occurrence. The formal link between such count or binary data and absolute abundance
can be made by quantifying the extent of the imperfect detection problem, i.e. by statistically
estimating the probability of detecting a species or an individual of that species (Williams et al.,
2002). Crucially, detection probability may vary due to 1) the properties of the detector (which may
be a human observer, trap or electronic device), 2) the characteristics of the species or individual
(such as its behaviour, crypsis, movement rates, habitat use and interest in any baits or lures used),
and 3) spatial and temporal influences which interact with these properties of detectors and

Chapter 1: The impacts of land-use change on Southeast Asian biodiversity
31
species/individuals (for example, effects of weather patterns through time or spatial variation in
vegetation structure). Failing to control for detection probability can lead to quantitatively biased
results, which will compromise any ability to accurately assess and predict biodiversity losses, but
will often not affect the qualitative conclusions drawn; this depends, however, on a monotonic
relationship existing between the observed data and actual occurrence or abundance, and even
qualitative conclusions may be entirely misleading where this does not exist. In addition, use of count
or binary data in this way is only indicative of relative differences in abundance or occurrence of a
species, for example over space or time, and is not suited to making comparisons between species
with substantially different ecology, behaviour and morphology.
Many of the earliest studies in Southeast Asia are known to have various sampling design
shortcomings, most obviously with respect to controlling for imperfect detection (Lambert, 1992;
Sheldon et al., 2010). Despite this, some of these studies are the only such examples of work done on
a particular taxon or in a particular land-use and therefore the inferences drawn from them can have
disproportionate influence. For example, one of the only longitudinal studies to date of the impacts of
logging on bird and mammal communities (e.g. Johns, 1986a, 1989, 1992) was entirely conducted
along roads in the logged forest areas and along cut transects in the old-growth forest. Detection
probabilities along roads are very unlikely to be comparable with those made inside the forest itself
and such sampling will also bias detections in logged forest towards species which frequent the
specific vegetation characteristics found along the edges of roads (e.g. nectarivorous birds and
herbivorous mammals). Although the problem of imperfect detection is well-known in the vertebrate
ecology literature, it is more rarely considered in studies of invertebrates, though similar biases are
likely to be present. For example, moths are typically sampled using light traps, the effectiveness of
which is thought to vary depending on many factors, including vegetation density (Willott, 1999). As
a result, studies of the impacts of land-use on moths in Southeast Asia have been unable to make
unbiased comparisons of moth abundance, typically focussing instead on species richness or diversity
controlled for the varying sample sizes (e.g. Chey et al., 1997; Willott, 1999; Beck et al., 2002).

Chapter 1: The impacts of land-use change on Southeast Asian biodiversity
32
The problem of imperfect detection is a very active area of statistical research and a number of
methods are available which help control for this confounding factor (Iknayan et al., 2013; Dénes et
al., 2015). For species-level parameters, such as abundance and occurrence, robust estimation
methods exist which rely on replicate observations (e.g. over space or time, or by different observers)
to confront the seemingly intractable problem of estimating detection probability and abundance or
occurrence at the same time (Otis et al., 1978; MacKenzie et al., 2002). Although sometimes held up
as a statistical panacea, these models, which include capture-recapture- and occupancy-based
approaches, often suffer from estimation issues when sample sizes are low (Guillera-Arroita et al.,
2010; Marques et al., 2011) and can be sensitive to violations of their assumptions (Otis et al., 1978;
Kendall, 1999; Rota et al., 2009; Harmsen et al., 2010; Welsh et al., 2013), some of which require
further empirical validation (Rota et al., 2009; Efford & Dawson, 2012). Even so, it remains the case
that accounting for detectability much reduces the chances of making wrong inferences compared to
using naïve estimators such as abundance indices (Sollmann et al., 2013; Guillera-Arroita et al.,
2014), albeit at the cost of requiring further data collection. In their simplest form, these models
assume “closure” (i.e. no changes in abundance or occupancy occur) but, given suitable data, these
models can also be extended to the dynamic case, allowing insights to be made about the viability of
populations across land-use, for example by providing estimates of population extinction, colonisation
and turnover rates (MacKenzie et al., 2003), as well as individual vital rates (Pollock, 1982; Gardner
et al., 2010).
For species richness and diversity, estimates can be made at a common sample size using rarefaction
or, alternatively, asymptotic estimates can be obtained using non-parametric methods which also
attempt to correct for the number of unseen species (Bunge & Fitzpatrick, 1993; Boulinier et al.,
1998; Chao & Shen, 2003; Chao et al., 2005). In principle, these methods can correct for changes over
space or time in the overall efficiency of the detection process, but may not perform well if species-
level detection probabilities are strongly heterogeneous, especially if this heterogeneity is itself
manifested over space or time (Iknayan et al., 2013). Recently, a more process-based approach to

Chapter 1: The impacts of land-use change on Southeast Asian biodiversity
33
estimating species richness (or indeed diversity) has emerged, in which detection probabilities for
each species are modelled as a function of site- or survey-specific covariates, all within the framework
of a multi-species hierarchical model (Dorazio et al., 2006). These “metacommunity” models have
also been extended to the case when species richness is a dynamic balance of colonization and
extinction over time (Dorazio et al., 2010).
1. 7. Previous studies of mammalian biodiversity in anthropogenic landscapes in Southeast Asia
Mammals are a taxonomic group which foster a high level of popular and scientific attention and, as a
result, are often the focus of conservation and research efforts. In Southeast Asia, this has resulted in a
reasonable corpus of anecdotal information about mammalian species and community responses to
land-use change, but surprisingly has not yet translated into a corpus of robust quantitative
knowledge. This is a consequence of the difficulties associated with formally sampling a group which
is composed of highly mobile, rare, cryptic, and often nocturnal species inhabiting a dense tropical
forest environment. Nonetheless, a meta-analysis of key studies conducted in Southeast Asia between
1975 and 2007 identified mammals as the group most sensitive to land-use change, based on the
studies done so far, and the median effect size was more than twice that for birds, a much more well-
known group (Sodhi et al., 2009). Mammals also likely play important roles in ecosystems in the
region, as herbivores (Ickes et al., 2001; Harrison et al., 2013), ecosystem “engineers” (Campos-
Arceiz, 2009), seed dispersers (Corlett, 1998; Brodie et al., 2009; Nakashima et al., 2010; Campos-
Arceiz et al., 2012), granivores (Blate et al., 1998; Curran & Webb, 2000; Mcconkey, 2005; Wells &
Bagchi, 2005; Kitamura et al., 2008; Wells et al., 2009; Hautier et al., 2010; Bagchi et al., 2011) and
predators (Ross et al., 2013), roles which may not easily be replaced by smaller-bodied taxonomic
groups which operate at smaller spatial scales (Corlett, 2009; Campos-Arceiz et al., 2012). Given this,
we urgently need to quantitatively assess, and indeed begin to predict into the future, mammalian
biodiversity losses due to the rapid and large-scale changes in land-use ongoing in the region.
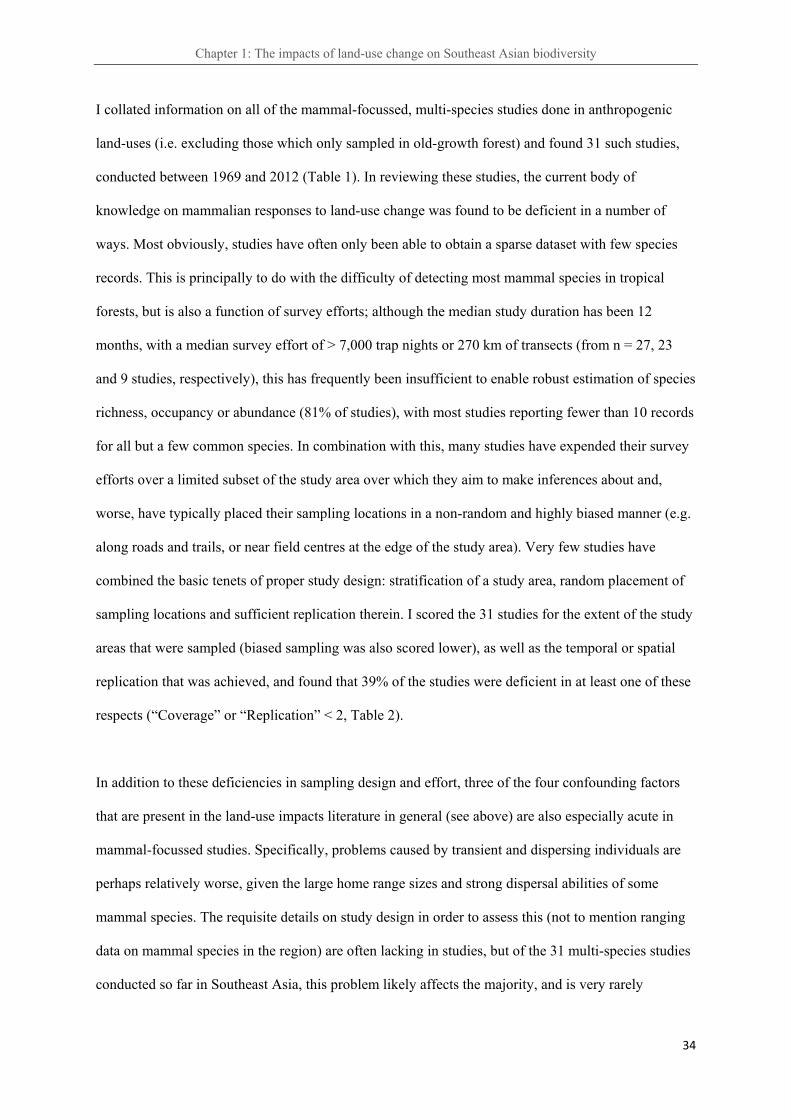
Chapter 1: The impacts of land-use change on Southeast Asian biodiversity
34
I collated information on all of the mammal-focussed, multi-species studies done in anthropogenic
land-uses (i.e. excluding those which only sampled in old-growth forest) and found 31 such studies,
conducted between 1969 and 2012 (Table 1). In reviewing these studies, the current body of
knowledge on mammalian responses to land-use change was found to be deficient in a number of
ways. Most obviously, studies have often only been able to obtain a sparse dataset with few species
records. This is principally to do with the difficulty of detecting most mammal species in tropical
forests, but is also a function of survey efforts; although the median study duration has been 12
months, with a median survey effort of > 7,000 trap nights or 270 km of transects (from n = 27, 23
and 9 studies, respectively), this has frequently been insufficient to enable robust estimation of species
richness, occupancy or abundance (81% of studies), with most studies reporting fewer than 10 records
for all but a few common species. In combination with this, many studies have expended their survey
efforts over a limited subset of the study area over which they aim to make inferences about and,
worse, have typically placed their sampling locations in a non-random and highly biased manner (e.g.
along roads and trails, or near field centres at the edge of the study area). Very few studies have
combined the basic tenets of proper study design: stratification of a study area, random placement of
sampling locations and sufficient replication therein. I scored the 31 studies for the extent of the study
areas that were sampled (biased sampling was also scored lower), as well as the temporal or spatial
replication that was achieved, and found that 39% of the studies were deficient in at least one of these
respects (“Coverage” or “Replication” < 2, Table 2).
In addition to these deficiencies in sampling design and effort, three of the four confounding factors
that are present in the land-use impacts literature in general (see above) are also especially acute in
mammal-focussed studies. Specifically, problems caused by transient and dispersing individuals are
perhaps relatively worse, given the large home range sizes and strong dispersal abilities of some
mammal species. The requisite details on study design in order to assess this (not to mention ranging
data on mammal species in the region) are often lacking in studies, but of the 31 multi-species studies
conducted so far in Southeast Asia, this problem likely affects the majority, and is very rarely

Chapter 1: The impacts of land-use change on Southeast Asian biodiversity
35
investigated (except in one bat-focussed study: Struebig et al., 2009). Secondly, mammals are often
long-lived, meaning responses to land-use change at a population level may often be delayed
compared to other groups, giving rise to substantial extinction debts. Thirdly, the low detection
probabilities inherent in sampling most mammal species mean that count- and occurrence-based
indices are likely to exhibit substantial negative bias compared to true abundance and occupancy.
Although relative indices may be instructive when investigating qualitative changes (if monotonically
related to the true parameter of interest), they are frequently used as if they are absolute quantities
(e.g. when converted directly to density, as in some of the live-trapping and line-transect studies in
Table 1) and this will lead to especially poor inference in the case of mammal species. There has, at
least, been a general trend of improvement in the statistical treatment of data through time, especially
since the emergence of occupancy methods (MacKenzie et al., 2006).
Of the 31 studies conducted to date, I found six to be of sufficient quality, in terms of study design
and statistical analysis (Inference Strength Score ≥ 0.9, Table 2), to allow strong inferences about
mammalian responses to land-use change. This included three long-term small mammal studies
(Lynam & Billick, 1999; Wells et al., 2007; Struebig et al., 2008) and three long-term camera-
trapping studies (McShea et al., 2009; Samejima et al., 2012; Brodie & Giordano, 2013). Of these,
three investigated community or species responses due to logging, two studied the distribution of
species among habitat fragments and one tested for the importance of logged forest set-aside habitat in
a large-scale A. mangium plantation.
At this stage, generalisations are difficult to make at a species level; contradictory responses to land-
use change have been reported for many species, likely, at least in part, due to insufficient sampling
efforts and the problem of imperfect detection (see above). At a community level, however, it does
appear to be a consistent finding that mammal species richness and overall abundance, although not
necessarily diversity or evenness, is maintained at the landscape scale when forests are disturbed by
logging (disturbance by fire or shifting agriculture is more poorly known). This is probably explained

Chapter 1: The impacts of land-use change on Southeast Asian biodiversity
36
by a high degree of dietary flexibility amongst many mammal species (e.g. Langham, 1983; Johns,
1986a; Meijaard & Sheil, 2008; Meijaard et al., 2010) and the fact that very few species directly
utilise harvested timber species to any substantial degree (Johns, 1988; Heydon & Bulloh, 1997).
When natural forest is converted to plantation, some species appear able to persist, but this is likely to
be dependent on the maintenance of sufficient ground cover (Maddox et al., 2007; Sunarto et al.,
2012), as well as patches of natural forest at the landscape scale (Nasi et al., 2007; McShea et al.,
2009). Intensively-managed plantations such as oil palm and rubber appear to support a more
depauperate community of mammal species than other tree-based plantation types, such as A.
mangium and P. falcataria, though the confounding influence of remnant natural habitat at the
landscape scale has not been investigated or controlled for. I identified six studies which have
investigated mammal abundance and diversity in oil palm: one made observations of primates and
squirrels and captured bats in mist-nets (Danielsen & Heegaard, 1995); four studies sampled only for
small mammals (Wood, 1984; Rajaratnam et al., 2007; Bernard et al., 2009; Puan et al., 2011), and
one included both large and small mammals (Scott & Gemita, 2004; Maddox et al., 2007). Across
these studies, only a small number of native mammal species were recorded inside oil palm habitat,
although invasive murid rodent species can reach very high densities, if not diversity, in some areas of
extensive oil palm monoculture in Peninsular Malaysia (Wood, 1984; Puan et al., 2011).
Despite the large amount of research attention, in general, given to mammals, surprisingly no study
conducted in Southeast Asia has yet assessed the responses of an entire mammal community when
forests are logged or converted to plantations. Those studies which have assessed responses by a
subset of mammal species have almost entirely been compromised either by inadequate sample sizes
or poor design and analysis. Community-level responses, besides species richness, have largely been
ignored and we have scant knowledge of changes in β-diversity and community structure, as well as
the emergent effects on ecosystem function.

Chapter 1: The impacts of land-use change on Southeast Asian biodiversity
37
Table 1. Multi-species mammal studies conducted across land-use types in Southeast Asia between 1969 and 2012. Studies which only sampled in old-growth forest were excluded.
Study number References Survey
dates
Study duration (months)
Methods
Sample size
Taxonomic focus Study locations
Land-uses surveyed
Trap nights
Transect length (km)
Old-growth Logged Fire-
disturbed Secondary Fragment
(< 100 km2)
Edge Non-natural land-uses
1 Wood, 1984; Wood & Liau, 1984a, 1984b
1969-1979 132 Live-trap 230,400 Terrestrial small mammals
Johor state, Peninsular Malaysia Mature oil palm
2 Wilson & Wilson, 1975; Wilson & Johns, 1982
1973 onwards
2+ Line-transect, sign survey
153 Large mammals East Kalimantan, Indonesian Borneo
Albizia
3 Johns, 1983, 1985, 1986a, 1992; Johns & Johns, 1995
1979-1993 ? Line-transect, censusing
? Primates Sungai Tekam Forest Reserve, Peninsular Malaysia and Ulu Segama Forest Reserve, Sabah, Malaysian Borneo
4 Kemper & Bell, 1985
1981 5 Live-trap 5,757 Terrestrial small mammals
Pasoh Forest Reserve, Peninsular Malaysia
5 Duff et al., 1984 1983 4 Sign survey 274 All non-volant mammals
Sabah Softwoods Brumas Estate, Sabah, Malaysian Borneo
Albizia, Eucalyptus, shade Cacao
6 Stuebing & Gasis, 1989
1983-1984 1 Live-trap 5,040 Terrestrial small mammals
Sabah Softwoods Brumas Estate, Sabah, Malaysian Borneo
Albizia, Eucalyptus, shade Cacao
7 Bennett & Dahaban, 1995; Dahaban, 1996
1989-1992 24 Line-transect
548 All non-volant, diurnal mammals
Various sites (n = 11) in Sarawak and Brunei Darussalam, Borneo
8 Charles & Ang, 2010
1989 onwards
? Live-trap, camera trap
17,955 Terrestrial small mammals and carnivores
Brunei-Muara and Tutong districts, Brunei Darussalam, Borneo
9 Danielsen & Heegaard, 1995
1991 2 Line-transect, mist-netting
3,170 160 Primates, squirrels, treeshrews and bats
Riau and Jambi provinces, Sumatra, Indonesia
Rubber, mature oil palm
10 Laidlaw, 2000 1991-1992 13 Sign survey 360 All non-volant, diurnal mammals
Pahang and Selangor states, Peninsular Malaysia
Acacia
11 Heydon & Bulloh, 1996, 1997
1992-1993 19 Line-transect
122 Civets and mouse-deer Tragulus spp.
Ulu Segama Forest Reserve, Sabah, Malaysian Borneo
12 Lynam, 1997; Lynam & Billick, 1999
1992-1994 21 Live-trap 31,892 Terrestrial small mammals
Chiew Larn reservoir islands and surrounding area, southern Thailand
13 Rajaratnam et al., 2007
1993-1994 12 Live-trap 38,445 Leopard cat Prionailurus bengalensis and small mammal prey
Tabin Wildlife Reserve and adjacent oil palm, Sabah, Malaysian Borneo
Mature oil palm

Chapter 1: The impacts of land-use change on Southeast Asian biodiversity
38
14 Pattanavibool & Dearden, 2002
1997-1998 10 Sign survey 56 Large mammals Om Koi and Mae Tuen Wildlife Sanctuaries, northern Thailand
15 Nasi et al., 2007 2000 3 Line-transect
? Primates Riau province, Sumatra, Indonesia Acacia, rubber
16 Mohd-Azlan, 2003, 2006; Mohd-Azlan & Sharma, 2006
2000-2001 21 Camera trap 5,972 Large mammals Jerangau Forest Reserve, Peninsular Malaysia
?
17 Bernard, 2004; Bernard et al., 2009
2000-2008 8 Live-trap 5,000 Terrestrial small mammals
Tabin Wildlife Reserve, Sabah, Malaysian Borneo
Mixed-age oil palm
18 Scott & Gemita, 2004; Maddox et al., 2007
2001-2006 9+ Live-trap, camera trap, sign survey, car-based survey
9,925 422 All non-volant mammals
Jambi Province, Sumatra, Indonesia Mixed-age oil palm
19 Numata et al., 2005 2002 3 Camera trap 677 Terrestrial mammals
Pasoh Forest Reserve, Peninsular Malaysia
20 Wells et al., 2007 2002-2004 18 Live-trap 40,552 Terrestrial small mammals
Various sites (n = 6) in Sabah, Malaysian Borneo
21 Struebig et al., 2008 2002-2007 ? Live-trap 2,321 Insectivorous bats Krau landscape, Pahang state, Peninsular Malaysia
22 Nakagawa et al., 2006
2003-2005 7 Live-trap 6,821 Terrestrial small mammals
Lambir Hills National Park and surrounding areas, Sarawak, Malaysian Borneo
Rubber
23 Kitamura & Thong-Aree, 2010
2004-2007 36 Camera trap 11,106 Terrestrial mammals
Hala-Bala Wildlife Sanctuary, southern Thailand
24 Belden et al., 2007a, 2007b; McShea et al., 2009
2005-2007 28 Camera trap 7,311 Terrestrial mammals
Planted Forest Zone, Sarawak, Malaysian Borneo
? Acacia
25 Rustam et al., 2012 2005-2010 ? Camera trap 1,017 Terrestrial mammals
Sungai Wain Protection Forest, Bukit Soeharto Grand Forest Park and surrounding areas, East Kalimantan, Indonesian Borneo
26 Onoguchi & Matsubayashi, 2008
2006 4 Camera trap 797 Terrestrial mammals
Deramakot Forest Reserve, Sabah, Malaysian Borneo
27 Puan et al., 2011 2007-2008 14 Live-trap 25,200 Terrestrial small mammals
Negeri Sembilan state, Peninsular Malaysia
Young Oil Palm
28 Imai et al., 2009; Samejima et al., 2012
2008-2009 11 Camera trap 19,720 Terrestrial mammals
Deramakot and Tangkulap-Pinangah forest reserves, Sabah, Malaysian Borneo
29 Mohamed et al., 2009, 2013; Wilting et al., 2010, 2012
2008-2010 17 Camera trap, car-based surveys
7,052 615 Carnivores Three forest reserves in Sabah, Malaysian Borneo: Deramakot, Tangkulap-Pinangah and Segaliud-Lokan
30 Bernard et al., 2012 2009-2010 16 Camera trap 3,733 Felids Tabin Wildlife Reserve and adjacent oil palm, Sabah, Malaysian Borneo
31 Brodie & Giordano, 2013
2010-2012 12+ Camera trap 16,608 Clouded leopard Neofelis diardi and four prey species
Various sites (n = 7) in Sabah and Sarawak, Malaysian Borneo

Chapter 1: The impacts of land-use change on Southeast Asian biodiversity
39
Table 2. Assessment of multi-species land-use studies of mammals conducted in Southeast Asia based on the study design and statistical techniques employed. Study Number References Coveragea Replicationb Robust statisticsc Inference strength scored
1 Wood (1984) 1 3 3 0.8
2 Wilson & Wilson (1975), Wilson & Johns (1982) 1 1 1 0.3
3 Johns (1983, 1985, 1986, 1992), Johns & Johns (1995) 1 2 1 0.4
4 Kemper & Bell (1985) 2 2 1 0.6
5 Duff et al. (1984) 2 1 1 0.4
6 Stuebing & Gasis (1989) 1 2 1 0.4
7 Dahaban et al. (1996), Bennett & Dahaban (1995) 1 2 1 0.4
8 Charles & Ang (2010) 2 3 2 0.8
9 Danielsen & Heegaard (1995) 2 1 1 0.4
10 Laidlaw (2000) 2 2 1 0.6
11 Heydon & Bulloh (1996, 1997) 2 2 2 0.7
12 Lynam & Billick (1999), Lynam (1997) 3 3 2 0.9
13 Rajaratnam et al. (2007) 1 2 2 0.6
14 Pattanavibool & Dearden (2002) 1 2 2 0.6
15 Nasi et al. (2007) 3 2 2 0.8
16 Mohd-Azlan (2003, 2006), Mohd-Azlan & Sharma(2006) 2 2 2 0.7
17 Bernard (2004), Bernard et al. (2009) 1 2 2 0.6
18 Scott & Gemita (2004), Scott et al. (2004), Maddox et al. (2007) 3 2 2 0.8
19 Numata et al. (2005) 1 1 1 0.3
20 Wells et al. (2007) 2 3 3 0.9
21 Struebig et al. (2008) 3 2 3 0.9
22 Nakagawa et al. (2006) 3 2 2 0.8
23 Kitamura et al. (2010) 2 2 2 0.7
24 Belden et al. (2007a, 2007b), McShea et al. (2009) 2 3 3 0.9
25 Rustam et al. (2012) 2 2 2 0.7
26 Onoguchi & Matsubayashi (2008) 1 1 1 0.3
27 Puan et al. (2011) 2 3 2 0.8
28 Imai et al. (2009), Samejima et al. (2012) 3 3 2 0.9
29 Mohamed et al. (2009, 2013), Wilting et al. (2010, 2012) 2 2 3 0.8
30 Bernard et al. (2012) 2 2 1 0.6
31 Brodie & Giordano (2013) 2 3 3 0.9 a1 = limited proportion of study site covered or highly-biased sample e.g. on trails or roads; 2 = reasonable extent, with limited bias; 3 = majority of study site with fully random sampling b1 = very limited replication in space or time; 2 = reasonable replication, though possibly pseudoreplicated; 3 = well replicated, with limited pseudoreplication c1 = limited number of species occurrences and/or no accounting for sampling effort or variance; 2 = relative abundance index or similar, based on reasonable sample size; 3 = robust estimation of species richness, abundance or occupancy based on relatively large sample size dCalculated as a proportion of the maximum potential score (i.e. [Coverage + Replication + Robust Statistics] / 9). Therefore all studies achieve a minimum score of 0.3 and a maximum of 1. This score is subjective and is not formally related to the probability of a study making poor inference, e.g. the probability of a Type I or Type II error.
Chapter 1: The impacts of land-use change on Southeast Asian biodiversity
40
1. 8. Research objectives
Four inter-linked objectives for the current work arise from reviewing current knowledge of
mammalian responses to land-use change in the region.
1. Robustly quantify the response of mammalian species richness, including both large and
small mammals, to the principal gradient of land-use intensity in Southeast Asia (old-growth
forest, logged forest and oil palm plantations).
2. Investigate the spatial patterns of species occurrence and, in turn, the effects of spatial grain
on estimates of mammalian species richness and β-diversity across land-uses
3. Characterise changes in community composition along the gradient of land-use intensity and
identify the local-scale drivers assembling communities.
4. Assess abundance responses, using robust estimation methods, of individual mammal
species, across both large and small mammals, to land-use change and the potential
implications for community structure and ecosystem functioning.
1. 9. Sampling methods, design and study site
To circumvent many of the problems that have proved challenging in previous studies of mammalian
responses to land-use, I employed a combination of field methods (covering both small mammals and
large mammals) with high sampling effort, in a nested plot design, with high levels of study site
coverage (see individual chapters for detailed information on the sampling design and field methods
used). Within each plot, sampling occurred at either systematic random locations (for small mammals)
or a random subset of locations (for large mammals). I sampled along the principal land-use trajectory
in the region: old-growth forest selectively logged forest oil palm plantation. Plots within the
forested land-uses were embedded within large continuous tracts of habitat, thereby minimising the
occurrence of transient and dispersing individuals from other land-uses, as well as the potential for
“rescue effects”. Oil palm plots, as is common for plantations in the region, were in the vicinity of
remnant logged forest areas. The potential for spill-over from these forested areas was assessed using
landscape-level metrics (distance from the nearest forest and percentage forest cover). For species

Chapter 1: The impacts of land-use change on Southeast Asian biodiversity
41
richness and abundance estimation, robust methods were used, which controlled for imperfect
detection. Considering these details together, this study fills important gaps in current knowledge of
mammalian species and community responses to land-use change in the region. Moreover, this is the
only study thus far which has characterised almost the entire non-volant mammalian community
across these land-uses, including both large and small mammals.
Fieldwork was carried out between October 2010 and July 2014 in south-eastern Sabah, Malaysian
Borneo, at the Maliau Basin Conservation Area, Stability of Altered Forest Ecosystems (SAFE)
Project experimental area, Brantian-Tatulit Virgin Jungle Reserve and Benta Wawasan and Sabah
Softwoods oil palm plantations. More detailed information on these study sites can be found in the
individual chapters. The SAFE Project area is also the focus of a long-term forest fragmentation
experiment (Ewers et al., 2011), in which ~63% of the landscape (9,400 ha, including the Virgin
Jungle Reserve, which abuts the experimental area) began to be gradually cleared in April 2013 for
the development of an oil palm plantation (as of April 2015, this process is yet to be completed). The
SAFE project has been given the opportunity to dictate the size and location of remnant forest
fragments totalling ~10% of the experimental area, and has opted to create fragments of 1, 10 and 100
ha size. The 2,200 ha Virgin Jungle Reserve will also be isolated by the clearance. My own sampling
was conducted with a view to this future change in land-use from logged forest to fragmented forest,
with plots placed to coincide with the planned forest fragments. The current study can therefore also
be viewed as a pre-fragmentation baseline for the longer-term investigation of fragmentation effects
on mammals.

Chapter 1: The impacts of land-use change on Southeast Asian biodiversity
42
Figure 1. Land-use types sampled in this thesis: (A) old-growth forest with an intact canopy, (B) logged forest with a discontinuous canopy and few mature trees remaining, and (C) oil palm plantations with remnant forest patches in the broader landscape.
A
B
C

Chapter 1: The impacts of land-use change on Southeast Asian biodiversity
43
1. 10. Thesis chapter outline
Chapter 2 reports on the richness and relative abundance of Felidae from the SAFE project
experimental area. This is of particular conservation importance since this study site is amongst the
most heavily-disturbed logged forest so far sampled within the range of these species. The finding that
all five species, including the rare Bornean bay cat Pardofelis badia, have so far persisted suggests
that this land-use type, much undervalued by land-use managers and policy-makers alike, needs to be
given greater priority for conservation.
I used fully random placement of camera traps in collecting data on these species of wild cat and, to
my knowledge, this has never been done before in Southeast Asia. I also show in Chapter 2 that
typical placement, for example along roads and trails, produces a biased account of the relative
abundance of these species, due to differences in the propensity of species to use different habitat
features. This is the case both within my own dataset, when locations on- and off-trail are compared,
and also across studies, when the results from my random sampling are compared to the
(bootstrapped) results from previous, non-random camera-trapping studies conducted in the region.
This first investigation of the utility of random camera trap sampling in the region demonstrates that
the method yields data on even the rarest of species (typically the focus and justification of the non-
random methods that have prevailed), provides insights into finer-scale habitat use than has been
possible before and also provides an alternative explanation for the extreme rarity of some species in
camera trap studies, such as the bay cat.
Chapter 3 explores the often-neglected spatial component of diversity and its relevance in the
assessment of the biodiversity value of land-uses, as well as in the design of conservation set-aside.
The spatial grain at which studies of land-use change are conducted is often not considered, and I
show that grain-dependent responses to land-use may be one reason for the conflicting results
reported in the literature. Using the nested sampling design that was employed (in order of increasing
grain: sampling points plots blocks land-use), I quantify the species richness of large and

Chapter 1: The impacts of land-use change on Southeast Asian biodiversity
44
small mammals at multiple spatial grains within each land-use, using measures which are robust to
variation in sampling effort. The grain of sampling affects the type of response inferred, with large
mammal richness at the sampling point level significantly lower in logged forest relative to old-
growth forest, but unchanged at the overall land-use level, due to higher turnover of species across
space. Small mammals, however, exhibit higher richness at all spatial grains in logged forest relative
to old-growth forest, highlighting the fact that patterns even within a single taxonomic group, in this
case terrestrial mammals, can be non-concordant.
The rate of increase in species richness with sampling grain can be explained by the spatial
distribution of individuals and species, and grain-dependent richness responses are symptomatic of an
alteration in these distributions across land-uses. Chapter 3 also characterises these changes using the
framework of β-diversity, i.e. the variance in community composition between two points in space. β-
diversity metrics are often not comparable across communities of different sizes and different
sampling designs, so I calculate β-diversity as the deviance from a null model of the occurrence of
species. This allows for meaningful comparisons between large and small mammals and controls for
both sampling effort and the spatial pattern of sampling locations. By calculating β-diversity in each
land-use at each spatial grain in the sampling design (points, plots and blocks), contrasting patterns
are again evident between large and small mammals. In particular, large mammal communities in old-
growth forest become more heterogeneous at coarser spatial grains and small mammal communities
become more homogeneous, whilst this pattern is reversed in logged forest. This finding suggests that
small forest reserves, such as High Conservation Value areas, set-aside for protection from either
logging or outright clearance within concessions, will capture different levels of large and small
mammal diversity depending on their size and distribution in a concession. However, both species
groups exhibited a strong β-diversity signal at the fine spatial grain of individual sampling points,
most likely an effect of logging-induced habitat heterogeneity.
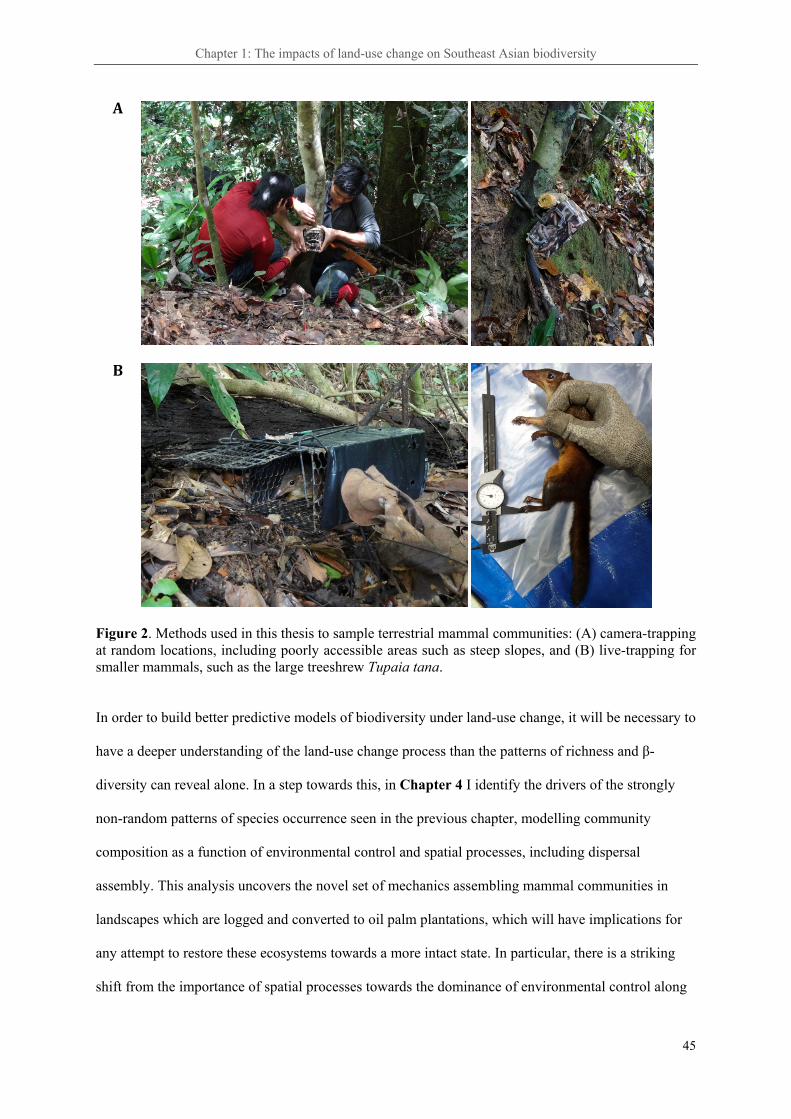
Chapter 1: The impacts of land-use change on Southeast Asian biodiversity
45
Figure 2. Methods used in this thesis to sample terrestrial mammal communities: (A) camera-trapping at random locations, including poorly accessible areas such as steep slopes, and (B) live-trapping for smaller mammals, such as the large treeshrew Tupaia tana.
In order to build better predictive models of biodiversity under land-use change, it will be necessary to
have a deeper understanding of the land-use change process than the patterns of richness and β-
diversity can reveal alone. In a step towards this, in Chapter 4 I identify the drivers of the strongly
non-random patterns of species occurrence seen in the previous chapter, modelling community
composition as a function of environmental control and spatial processes, including dispersal
assembly. This analysis uncovers the novel set of mechanics assembling mammal communities in
landscapes which are logged and converted to oil palm plantations, which will have implications for
any attempt to restore these ecosystems towards a more intact state. In particular, there is a striking
shift from the importance of spatial processes towards the dominance of environmental control along
B
A

Chapter 1: The impacts of land-use change on Southeast Asian biodiversity
46
the gradient of land-use intensity. An analysis of species co-occurrence in parallel to this, also
indicates a potential weakening along the land-use gradient of inter-specific competition as an
influential process in community assembly. Analyses of this nature are rarely applied to mammalian
communities, but may prove to be a fertile ground of new hypotheses to test, ideally with
manipulative experiments, in the future.
In Chapter 5, I explore species-level abundance responses to the land-use gradient, complementing
previous chapters on the richness and composition of communities. I combine the live- and camera-
trapping data across all species into one framework, using a hierarchical modelling approach, and use
both continuous and categorical descriptors of the land-use gradient. Using a multi-species
hierarchical approach also allows for the estimation of abundance for even the rarest species in the
community by “borrowing strength” from the more well-sampled species. The analysis provides the
first robust estimates of abundance for any taxonomic group along the old-growth forest logged
forest oil palm land-use gradient. I find that the abundance of most species is conserved from old-
growth to logged forest (indeed, omnivorous and herbivorous species show large increases on
average), whilst dramatic declines are seen from forest to oil palm, in particular in species of high
conservation concern. The main exception to this overall pattern is for invasive species, which
increase along the land-use gradient. By constructing nine dietary functional effects groups, I also
show that the biomass of species carrying out key ecosystem functions such as leaf-eating and
invertebrate predation is also conserved in logged forests, but only vertebrate predation is maintained
in oil palm plantations.
Finally, Chapter 6 serves as a synthesis, by seeking the connections between the findings within
individual chapters and identifying the broader conclusions and implications of the work.

Chapter 2: Using random camera locations to survey felids in a logging concession
47
Chapter 2:
Assessing the status of wild felids in a highly-disturbed commercial forest reserve in
Borneo and the implications for camera trap survey design
This chapter was published at the following location:
Wearn, O.R., Rowcliffe, J.M., Carbone, C., Bernard, H. & Ewers, R.M. (2013) Assessing the
status of wild felids in a highly-disturbed commercial forest reserve in Borneo and the
implications for camera trap survey design. PLoS One, 8, e77598.
Abstract
The proliferation of camera-trapping studies has led to a spate of extensions in the known
distributions of many wild cat species, not least in Borneo. However, we still do not have a clear
picture of the spatial patterns of felid abundance in Southeast Asia, particularly with respect to the
large areas of highly-disturbed habitat. An important obstacle to increasing the usefulness of camera
trap data is the widespread practice of setting cameras at non-random locations. Non-random
deployment interacts with non-random space-use by animals, causing biases in our inferences about
relative abundance from detection frequencies alone. This may be a particular problem if surveys do
not adequately sample the full range of habitat features present in a study region. Using camera-
trapping records and incidental sightings from the Kalabakan Forest Reserve, Sabah, Malaysian
Borneo, we aimed to assess the relative abundance of felid species in highly-disturbed forest, as well
as investigate felid space-use and the potential for biases resulting from non-random sampling.
Although the area has been intensively logged over three decades, it was found to still retain the full
complement of Bornean felids, including the bay cat Pardofelis badia, a poorly known Bornean
endemic. Camera-trapping using strictly random locations detected four of the five Bornean felid
species and revealed inter- and intra-specific differences in space-use. We compare our results with an
extensive dataset of > 1,200 felid records from previous camera-trapping studies and show that the
relative abundance of the bay cat, in particular, may have previously been underestimated due to the

Chapter 2: Using random camera locations to survey felids in a logging concession
48
use of non-random survey locations. Further surveys for this species using random locations will be
crucial in determining its conservation status. We advocate the more wide-spread use of random
survey locations in future camera-trapping surveys in order to increase the robustness and generality
of inferences that can be made.
2. 1. Introduction
With rates of forest loss and degradation in Southeast Asia exceeding all other tropical regions
(Achard et al., 2002), and the majority of remaining forest existing in a highly disturbed state (Curran
et al., 2004; Laurance, 2007), there is now an urgent need for accurate assessments of the impacts on
wildlife in the region. This situation applies especially to Borneo and to the five species of felid
inhabiting the island: Sunda clouded leopard Neofelis diardi (Vulnerable on the IUCN Red List),
leopard cat Prionailurus bengalensis (Least Concern), flat-headed cat Prionailurus planiceps
(Endangered), marbled cat Pardofelis marmorata (Vulnerable) and bay cat Pardofelis badia
(Endangered). For all of these species, we still have a paucity of information on their distributions,
population statuses and responses to land-use changes. This is particularly the case for the bay cat, a
Bornean endemic which has been called “the world’s least known felid” (Sunquist & Sunquist, 2002).
Certainly, very few confirmed records of it exist (Mohd-Azlan & Sanderson, 2007) and it has
variously been suggested to be either tolerant (Kitchener et al., 2004; Hunter, 2011) or intolerant of
habitat disturbance (Wilting & Mohamed, 2010).
A number of targeted field studies of Borneo’s terrestrial fauna have recently been undertaken
(McShea et al., 2009; Mathai et al., 2010; Samejima et al., 2012), with some focussing on wild felids
(Mohd-Azlan & Sanderson, 2007; Mohamed et al., 2009; Cheyne & Macdonald, 2011; Brodie &
Giordano, 2012b). Importantly, there has been a rapid increase over the last decade in the use of
camera traps for conducting such studies (Rowcliffe & Carbone, 2008), allowing intensive surveys to
be made over larger areas with reduced effort in the field. This has led to significant extensions in the
known distributions and habitat tolerances of many species (Wilting et al., 2010b; Brodie & Giordano,

Chapter 2: Using random camera locations to survey felids in a logging concession
49
2011; Matsubayashi et al., 2011; Lhota et al., 2012), including Borneo’s wild cat species (Mohamed
et al., 2009; Wilting et al., 2010a; Bernard et al., 2012). However, it remains the case that few camera
trap surveys have been done beyond the boundaries of protected areas, in forests which are not
pristine and not sustainably managed (but see Scott & Gemita, 2004; McShea et al., 2009; Rustam et
al., 2012). Less than 6% of land area in Indonesia and Malaysia is protected (IUCN categories I-IV;
IUCN/UNEP, 2012) and most landscapes are now dominated by highly-disturbed forests which have
undergone multiple rounds of logging (Curran et al., 2004; Miettinen et al., 2011; Reynolds et al.,
2011). It is only these highly-disturbed forests that still occur over sufficiently large and contiguous
areas to potentially conserve viable populations of felid species occurring at very low densities, such
as the clouded leopard (Wilting et al., 2006, 2012; Brodie & Giordano, 2012b).
The proliferation of camera-trap studies has allowed more robust inference on the relative abundance
of highly cryptic species than has been possible before. This has led to a re-assessment of the
supposed rarity of some taxa, including the Asiatic golden cat Pardofelis temminckii (Mohd-Azlan &
Sharma, 2006; Johnson et al., 2009; Bashir et al., 2011). The bay cat, on the other hand, has remained
consistently rare in camera-trap surveys throughout its range, usually appearing at least one order of
magnitude less frequently than other Bornean felids (Hunter, 2011). Since detection frequencies are a
function of both abundance and detection probability (Williams et al., 2002), the rarity of bay cat
records could reflect low detection probability rather than low population densities. Low detection
probability in camera trap surveys can result from a range of factors, broadly categorised as factors
that reduce camera sensitivity, and factors that reduce the chances of animals encountering cameras.
An important species-specific correlate of camera-sensitivity is body size (Rowcliffe et al., 2011).
However, the bay cat is comparable in size to the other three small cats of Borneo: the leopard cat,
flat-headed cat and marbled cat (Sunquist & Sunquist, 2002). In terrestrial surveys, reduced detection
probabilities are obviously expected for arboreal species, but it also does not seem likely that the bay
cat is more arboreal than the other cat species: all direct sightings have been made on or very close to

Chapter 2: Using random camera locations to survey felids in a logging concession
50
the ground (Mohd-Azlan & Sanderson, 2007) and its morphology is consistent with terrestriality
(Kitchener et al., 2004).
Low detection probabilities can also result from avoidance of the particular habitat features on which
camera-trapping surveys typically focus. Ever since their early use in mark-recapture studies (Karanth
& Nichols, 1998), camera traps have been deployed preferentially where the presence of a focal
species is deemed most likely – usually on trails, roads, water points or mineral licks – in order to
increase individual capture probability. It is now common and accepted practice to use these non-
random deployment locations in general wildlife surveys and then calculate an index of relative
abundance (Williams et al., 2002). In some cases, researchers have stated that cameras were deployed
“randomly” but actually refer to a two-step process in which potential deployment zones (typically
squares of a grid overlain on the study area) are selected at random and then cameras are deployed
non-randomly within these zones. Given that deployment zones are typically much larger than the
area actually sampled by a camera trap – 2 km2 grid squares are often used (e.g. Ahumada et al.,
2011) compared to sensors with maximum detection zones mostly less than 2 x 10⁻⁴ km2 (Meek et al.,
2012) – species may be detected less frequently, or not at all, if they avoid certain habitat features
within the focal area.
Choosing ‘optimal’ locations for deploying cameras in this way violates a key assumption of
sampling theory – the random selection of sample units – and necessarily limits the scope of inference
of a study to the specific conditions found at the survey locations. Inferences made beyond this
limited subset of features of a habitat or landscape are likely to be biased, even though this is routinely
done. To our knowledge, no camera-trapping study conducted in Borneo, or indeed more broadly in
the Palaeotropics, has used strictly random locations (within 5-10 m of a pre-marked point, e.g. Kays
et al., 2011). This may have implications for the currently inferred abundance and understanding of
habitat use for all species, including felids. Owing to the prevailing use of non-random camera trap
surveys, up to now it has not been possible to explicitly test for these possibilities.

Chapter 2: Using random camera locations to survey felids in a logging concession
51
We aimed to assess the status of wild felids in a highly-disturbed commercial forest reserve, gathering
together both incidental sightings and camera-trapping records from strictly random locations. Given
that we used random camera locations, we also investigated the potential for non-random survey
designs to interact with non-random space-use by animals, which would cause biased inferences about
relative abundance. To do this, we investigated felid space-use patterns with respect to anthropogenic
habitat features, which have typically been the focus of camera trap surveys, and also compared our
relative abundance estimates to those from previous camera-trapping studies conducted in the region.
As a result, we suggest that prevailing camera trap methods have indeed confounded assessments of
felid species rarity. Our findings have implications for the conservation of our focal species, as well as
the study design of camera-trap surveys in general.
2. 2. Methods
2. 2. 1. Study area
This study was carried out in Kalabakan Forest Reserve (4º 33’ N, 117º 16’ E) in the state of Sabah,
Malaysia, and forms part of the Stability of Altered Forest Ecosystems (SAFE) Project (Ewers et al.,
2011). Kalabakan Forest Reserve lies within the Yayasan Sabah Forest Management Area and, as
such, has been subject to multiple, intense rounds of logging, beginning in 1978 and ongoing until the
early 2000s. This has led to a heterogeneous landscape composed of stands which have undergone
varying intensities and timings of log extraction, using both tractor-based and high-lead yarding
methods. During the logging, a network of regenerating skid trails, logging roads and log-landing
areas was also created (approximately 10% of land area; Pinard et al., 2000). As a result, there is a
range of habitat types currently exhibited in the reserve, from grassy open areas and low scrub
vegetation, to lightly logged forest on steep slopes and in rocky areas, but the timber volume
remaining in the area is mostly very low (below 10 m3 ha-1). In addition to the logged forest areas,
large portions of the reserve have been terraced and planted with oil palm, or have been salvage
logged in preparation (removing all trees above 25 cm diameter at breast height). Medium-resolution

Chapter 2: Using random camera locations to survey felids in a logging concession
52
(250 m) land cover maps for 2010 (Miettinen et al., 2011) therefore indicate that just 54% of the area
of the Kalabakan Forest Reserve (2,240 km2) still retains natural forest cover.
2. 2. 2. Data collection
We deployed remotely-operated digital cameras (Reconyx HC500, Holmen, Wisconsin, USA) in the
north-east of the Kalabakan Forest Reserve (4º 42’ N, 117º 34’ E), overlapping with the SAFE Project
experimental area (72 km2). We had full permission from the land-owners and concession holders,
Yayasan Sabah and Benta Wawasan Sdn Bhd, to conduct this study in the reserve. We also had an
access license in place from the Sabah Biodiversity Council for the use of camera traps at the study
site. Our study was approved by the Zoological Society of London Animal Ethics Committee and the
work detailed here did not involve any direct sampling methods or the collection of any specimens.
We sampled 135 locations between May and December 2011 for an average of 49 camera-trap nights
(CTNs), giving a total effort of 6650 CTNs. Camera traps were deployed inside 18 separate plots,
each covering 1.75 ha, which were clustered into three groups (Fig. 1). This design was chosen to
overlap with the sampling locations of the SAFE Project (Ewers et al., 2011). The SAFE Project has
attempted to control the confounding effects of elevation by stratifying the study site and only
sampling within a relatively narrow range centred at ~450 m; the elevation of our plots reflects this
stratification. For each plot, we established a 4 x 12 grid of points (23 m spacing) in the field using a
tape measure and GPS receiver (Garmin GPSMAP 60CSx, Olathe, Kansas, USA). There is a margin
of error associated with these methods, but we ensured that field teams marked the grids with no
consideration of the practicalities of whether or where a camera might be set at each grid point. Grid
points can therefore be considered to be truly random within plots. Cameras were deployed at a
random subset of points within each grid (mean = 8 points per grid), as close to the marked points as
possible. Necessarily, large obstructions in the camera’s detection zone (such as rock boulders or
large tree buttresses) were avoided, but cameras were always deployed strictly within 5 m of marked
points. We usually set cameras at a height of 30 cm, to maximise detection for a range of species, but

Chapter 2: Using random camera locations to survey felids in a logging concession
53
some cameras were set higher (and faced downwards), depending on the situation found at each
random location. No bait or lure was used and disturbance to vegetation was kept to a minimum.
Cameras were programmed to take 10 consecutive photographs for each trigger event (over
approximately 5 seconds). We noted if the detection zone contained a logging road (wide, heavily
compacted ground, sometimes with gravel remnants, no canopy cover), a skid trail (width of a tractor,
canopy cover, recruiting vegetation at ground-level, earth-banked sides), footpath or none of these
(which we term “off-trail”).
Figure 1. Locations sampled using camera traps within the Kalabakan Forest Reserve, Malaysian Borneo. Camera traps were deployed at random locations (black points) within 1.75 ha plots (white rectangles), clustered into three groups placed deliberately to control for elevational effects. Shaded areas lie outside the Kalabakan Forest Reserve and are composed of the Brantian-Tatulit Virgin Jungle Reserve (to the south) and Mount Louisa Forest Reserve (to the north). Inset shows the location of Kalabakan Forest Reserve (red outline) within the Malaysian state of Sabah, northern Borneo.
In parallel to the camera-trapping effort, we also recorded the location and time of all incidental
records of felids obtained during the course of the fieldwork detailed here and across all of the
research activities at the SAFE Project. These data are inherently biased towards less-cryptic, large-
bodied and diurnal species, and sampling was highly non-random in space and time. We excluded

Chapter 2: Using random camera locations to survey felids in a logging concession
54
periods for which consistent reporting from the SAFE Project was unavailable, leaving approximately
10 months of observations between August 2010 and August 2011.
We also conducted an extensive literature search for previous camera-trapping studies done on any of
the five Bornean felid species. We used the ISI Web of Science (www.isiknowledge.com, using
various searches on the vernacular and scientific species names, as well as “camera trap*” and the
names of Southeast Asian countries) to locate published and peer-reviewed studies, and supplemented
this with other published and unpublished sources we were aware of or which were cited in other
sources. For inclusion in our database, studies had to report the total number of CTNs conducted, as
well as the number of independent captures. Where data were not presented in a suitable form, we
attempted to contact authors directly for clarification.
2. 2. 3. Data analysis
Image sequences were judged to be independent capture events if they a) contained different
individuals or b) were separated by more than an arbitrary 1 hour. We present a detection frequency
(d) – often referred to in the literature as a relative abundance index – for each species, which is the
number of independent captures per 100 CTNs (accounting for camera failure).
We modelled the binary detection or non-detection of each species as a function of the habitat features
at camera locations, using a generalised linear model with binomial errors and a logit link function.
Factor-level simplification was done using chi-squared likelihood ratio tests. For the clouded leopard,
we also tested for an interaction between habitat features and the sex of individuals. We used Fisher’s
exact test with the null hypothesis that the number of detections of males and females is not
conditional on whether a camera is placed on a logging feature (road or skid trail) or not.
Using empirical data from our literature survey of camera-trap records, we constructed a probability
density function for the expected detection frequency of each of the five cat species. This was done by

Chapter 2: Using random camera locations to survey felids in a logging concession
55
taking bootstrap samples of the data (n = 10,000) and calculating the overall detection frequency each
time. We stratified samples by study site, to give each study site equal weight and to ensure that each
observation within randomisations was independent.
We then used the bootstrapped median detection frequencies to estimate the minimum survey efforts
required to detect each species with a given probability, incorporating the uncertainty in the
distributions of d using the 95% quantile values. Detections of a species D were modelled as a
Poisson process, with a rate parameter λ (detections per camera-trap night). For consistency with the
camera-trapping literature we used the detection frequency d, which has units per 100 CTNs, i.e. λ = d
/ 100, and for a survey conducted over n camera trap nights, the expected number of detections E(D)
= λn = nd / 100. Given Poisson distributed detections, we can use the cumulative exponential
distribution to calculate the probability p of obtaining at least one detection of a species after
surveying for a given number of camera trap nights. Using d instead of λ gives
)100
(1
dnep
−−=
(1)
Plotting this for a range of n gives a detectability curve (Wintle et al., 2005). We can determine the
number of camera trap nights required for a given cumulative probability or “confidence” either
graphically or by solving for n. For example, for 90% confidence (p = 0.9) in detecting a species, the
minimum sampling effort required is calculated by
d
n )9.01log(100 −−=
(2)
All analyses were done in R version 2.12.2 (R Development Core Team, 2014).
2. 3. Results
Camera-trapping yielded 504 photos of wild cats, consisting of 41 independent captures across 29
locations (21% of random locations sampled). It took 873 camera trap nights to detect four out of the
five Bornean felid species. The clouded leopard was detected most frequently and at the most
locations, followed by the leopard cat (Table 1). Both of these species were also detected by

Chapter 2: Using random camera locations to survey felids in a logging concession
56
incidental sightings. The two rarest felids from camera-trapping were the marbled cat and bay cat; the
marbled cat was detected more times than the bay cat but at fewer locations (Table 1). Neither of
these species were observed during incidental sightings. In contrast, the flat-headed cat was not
detected during camera-trapping but was directly sighted. This observation consisted of a single
individual crossing a narrow logging road (~ 5 m wide and bordered with ~ 2 m of dense scrub and
Coelorachis glandulosa grass) approximately 70 m from the nearest stream (~5 m width) and at 180
m elevation.
Table 1. Wild felid species recorded from the Kalabakan Forest Reserve, Sabah, Malaysia.
Common name, scientific name
Direct
sightingsa
Camera trapping
No.
photos
Independent
capturesb
Detection
frequency (d)c
Naive
occupancyd
Sunda clouded leopard Neofelis diardi 1 267 14 0.211 0.081
Marbled cat Pardofelis marmorata 0 89 9 0.135 0.052
Bay cat Pardofelis badia 0 64 8 0.120 0.059
Leopard cat Prionailurus bengalensis 13 84 10 0.150 0.067
Flat-headed cat Prionailurus planiceps 1 0 0 0 0
aIncidental records obtained during the course of fieldwork (August 2010 to August 2011). bDefined as image sequences of different individuals or sequences obtained more than 1 hour apart. cThe number of captures per 100 camera trap nights. dThe proportion of sampled locations at which the species was detected.
The minimum adequate models for site detection probabilities of each species revealed a significantly
higher probability of detection on logging features (z = 2.639, p = 0.008), i.e. logging roads and skid
trails, for clouded leopard and on skid trails only for marbled cat (z = 2.615, p = 0.009). The
probabilities of detection on the back-transformed scale were 0.195 (SE = 0.066) and 0.040 (SE =
0.020) for clouded leopard at locations on and off logging features, respectively, and 0.200 (SE =
0.103) and 0.025 (SE = 0.014) for marbled cat on and off skid trails, respectively. There was an
indication of sex-specific differences in habitat feature use in clouded leopard (p = 0.061): male
clouded leopards were only detected on logging features, whilst two-thirds of detections of females
were made off-trail. No habitat feature variables were retained in the minimum adequate models for

Chapter 2: Using random camera locations to survey felids in a logging concession
57
the leopard cat and bay cat, which means that the null hypothesis of random use of habitat features
was not rejected. Note, however, that 7 of 8 independent captures of bay cat were off-trail.
We were able to obtain useable data on previous detections of the five Bornean felid species from 34
separate camera trap studies across at least 27 study sites. This represents a combined effort of
approximately 62 years of fieldwork between 1998 and 2011, resulting in 1,212 felid detections over
142,672 CTNs. The amount of effort spent surveying for each species was unequal, being largely
dependent on the geographic range of the species: bay cat survey effort (60,914 CTNs) has been
approximately half that of marbled cat (120,231 CTNs). Without exception, these studies used non-
random survey locations.
We calculated the detection frequency (d) across all studies combined for each species. These showed
an order of magnitude difference between the relatively commonly detected leopard cat (d = 0.701)
and clouded leopard (d = 0.320) to the more rarely detected marbled cat (d = 0.079), flat-headed cat (d
= 0.021) and bay cat (d = 0.015). Once we accounted for the unbalanced and autocorrelated nature of
the dataset using a stratified bootstrap sampling approach, the expected detection frequencies were
lower in the case of the bay cat and leopard cat, but the rank order of detection frequencies amongst
the species was the same (Fig. 2). The detection frequencies observed in the current study lay within
the 2.5% and 97.5% quantiles of the bootstrapped distribution for the clouded leopard, marbled cat
and flat-headed cat, but were significantly higher and lower than expected for the bay cat and leopard
cat, respectively (Fig. 2). The detection frequency we obtained for bay cat from random survey
locations was more than 10 times larger than that expected from previous studies.

Chapter 2: Using random camera locations to survey felids in a logging concession
58
Figure 2. Probability density functions for bootstrapped values of detection frequency (d) derived from previous camera-trapping studies. Data for each of Borneo’s felid species were obtained from 34 studies conducted between 1998 and 2011 and bootstrap randomisations (n = 10,000) were stratified according to study site. Each panel shows the probability density function obtained by kernel density estimation, the median d from bootstrap samples (solid line) and d obtained in the current study, using strictly random survey locations (dashed line). Dotted lines for bay cat and leopard cat show d calculated after excluding off-trail survey locations. Note that the x-axis is not consistent across panels.
Owing to this significant difference for the bay cat and leopard cat, we decided post hoc to compare
our overall detection frequencies for these species with those we would have obtained at our study site
with a traditional trail-based survey, by excluding data obtained from off-trail cameras. We found the
same qualitative differences between random and non-random camera placement designs within our

Chapter 2: Using random camera locations to survey felids in a logging concession
59
study as we had found between our results and those found in the camera-trapping literature: detection
frequencies were 2.5 times larger and 0.8 times smaller for the bay cat and leopard cat, respectively,
for a survey design with off-trail cameras than one without (dotted lines, Fig. 2).
We calculated the minimum survey efforts required for each species based on the data from previous
studies (Fig. 2) and Eq. 2 (using p = 0.9). Huge disparities between species were revealed, ranging
from more than 26,000 CTNs required for bay cat to just 425 CTNs for leopard cat (Fig. 3). We also
calculated the worst-case scenario (using the 2.5% quantile for d) and this extended the survey effort
required substantially in all cases (Fig. 3): the requirement more than doubled for clouded leopard and
leopard cat and more than trebled for marbled cat. For the bay cat and flat-headed cat, the lower
bound did not exclude zero, so we could not rule out the possibility of never detecting these species
regardless of survey effort. For the bay cat, we compared the required effort suggested by previous
studies to that suggested by the current study using random locations: the required effort was reduced
by more than 24,000 CTNs for the detection frequency observed in our study (Fig. 3). This was also
associated with a comparatively small increase of 1,106 CTNs in the minimum effort required for the
leopard cat.

Chapter 2: Using random camera locations to survey felids in a logging concession
60
Figure 3. Detectability curves and minimum required survey efforts calculated using a Poisson model for detections. Detectability curves for each of Borneo’s felid species were plotted using Eq. 1 and minimum survey efforts calculated using Eq. 2 with a “confidence” of 90% and per-trial probability of success estimated using d (captures per 100 camera trap nights). Solid lines use median d from bootstrap samples of camera trap data obtained from previous studies (with shading corresponding to the 95% quantiles of d from bootstrap samples) and dashed lines use d obtained in the current study using random survey locations (except for flat-headed cat, which was not detected by camera-trapping in our study). For each detectability curve, survey efforts required for 90% confidence are indicated with dot-dash lines and annotated on the axes. Note that the x-axis is not consistent across panels.
2. 4. Discussion
Using camera traps and direct sightings, we confirmed the presence of all five Bornean wild felids in
the Kalabakan Forest Reserve. Moreover, the four species detected by camera-trapping were
estimated to have a relative abundance of the same, or higher, order of magnitude as previous studies

Chapter 2: Using random camera locations to survey felids in a logging concession
61
conducted elsewhere (Fig. 2). We also investigated possible biases in the relative abundances derived
from past camera-trapping efforts, caused by the non-random survey designs which have typically
been used. Importantly, we found both inter- and (for clouded leopard) intra-specific differences in
the use of habitat features. In addition, there were significant differences between the relative
abundances we obtained using random camera locations and those from previous studies, and we
found similar differences in comparing on- and off-trail locations within our own survey design. We
suggest these differences are evidence of biases, caused by an interaction between patterns of animal
space-use and the non-random deployment of camera traps at locations chosen by researchers.
Many book and journal pages have been devoted to exploring issues of survey design for monitoring
and assessment of populations (Thompson et al., 1998; Olsen et al., 1999; Yoccoz et al., 2001;
Williams et al., 2002) and we do not wish to recapitulate all of the design principles that have been
recommended. However, random selection of sample units is central to most sampling schemes
(Cochran, 1977). Given our findings, it is clear that this should also be central to the design of camera
trap surveys. We have shown that this allows small-scale habitat-use to be investigated, and provides
a stronger basis for inferences about relative abundance. There are, however, some important
instances where a non-random design might be preferred for species monitoring, such as when the
detectability of individuals can be explicitly modelled using mark-recapture methods. Although such
models require high capture, and indeed recapture, rates and employ stricter assumptions (Otis et al.,
1978), they allow inferences about absolute abundance for the limited subset of species which can be
individually identified from camera trap images. Occupancy methods, too, account for detectability
(of a species) and, although having similarly demanding data requirements (a large number of
independent sample locations may be required for anything other than common species), may also
provide a strong basis for inference about the status of a population, if not abundance per se
(Mackenzie & Nichols, 2004). Beyond monitoring, non-random designs might also be considered in
rapid, preliminary surveys which seek only to determine if a species is present in an area, rather than
its population status.

Chapter 2: Using random camera locations to survey felids in a logging concession
62
We found all five species of Bornean felid in the Kalabakan Forest Reserve. We are aware of only
three other sites which have confirmed records of all five species: Deramakot Forest Reserve
(Mohamed et al., 2009), Danum Valley Conservation Area (Hearn & Ross, 2009) and Tabin Wildlife
Reserve (Bernard et al., 2012). These sites range from pristine (Danum), through to sustainably
managed (Deramakot) and selectively logged until the late 1980s (Tabin). The addition to this list of
the Kalabakan Forest Reserve, a highly-disturbed commercial forest reserve which has undergone
decades of sustained logging until very recently, therefore extends this list to the full range of forest
disturbances present in Borneo.
Taken together, our results suggest that the large areas of highly-disturbed natural forest in the region
could play a greater role in the conservation of wild felids than is currently recognised. It does still
remain to be known if populations of these five species would be viable in disturbed forest in the
long-term and we therefore echo previous assertions of the importance of undisturbed forest (Didham,
2011; Gibson et al., 2011). However, we did obtain photographic evidence of breeding within our
highly-disturbed study site for clouded leopard (one female with cub) and calculated a relative
abundance that was similar to those from previous studies, mostly done in more intact sites (Fig. 2).
The habitat tolerances of the bay cat are poorly known, but our results using random survey locations
indicate that the relative abundance of this species may be of the same order of magnitude as the other
wild felid species in disturbed habitats.
We did not detect the flat-headed cat in the period of our camera-trapping survey. Given a total survey
effort of 6650 CTNs, and based on the detectability of this species in previous studies (Fig. 3), we had
a 25% chance of failing to detect this species. Most records of this species have been obtained within
3 km of large bodies of freshwater (including rivers and lakes) and below 100 m elevation (Wilting et
al., 2010a). None of our random camera trap locations were near large water bodies and, due to a
stratification inherent in the survey design, locations were at a mean elevation of 432 m (range: 278-
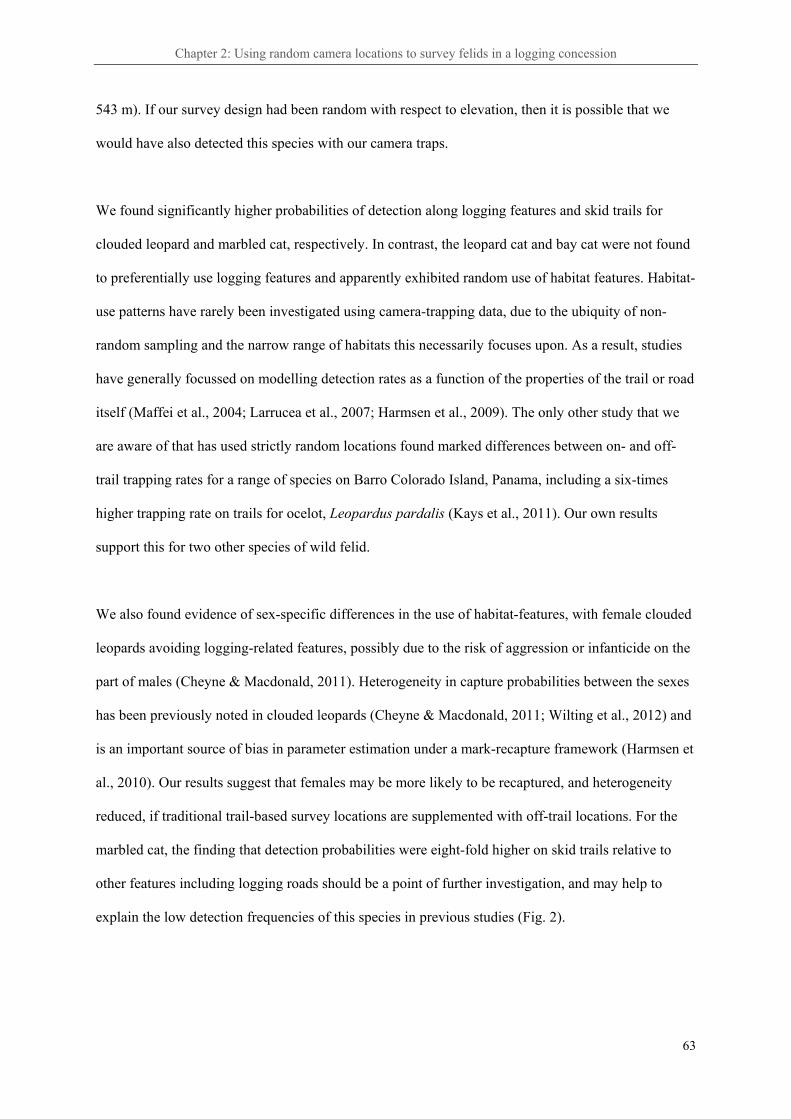
Chapter 2: Using random camera locations to survey felids in a logging concession
63
543 m). If our survey design had been random with respect to elevation, then it is possible that we
would have also detected this species with our camera traps.
We found significantly higher probabilities of detection along logging features and skid trails for
clouded leopard and marbled cat, respectively. In contrast, the leopard cat and bay cat were not found
to preferentially use logging features and apparently exhibited random use of habitat features. Habitat-
use patterns have rarely been investigated using camera-trapping data, due to the ubiquity of non-
random sampling and the narrow range of habitats this necessarily focuses upon. As a result, studies
have generally focussed on modelling detection rates as a function of the properties of the trail or road
itself (Maffei et al., 2004; Larrucea et al., 2007; Harmsen et al., 2009). The only other study that we
are aware of that has used strictly random locations found marked differences between on- and off-
trail trapping rates for a range of species on Barro Colorado Island, Panama, including a six-times
higher trapping rate on trails for ocelot, Leopardus pardalis (Kays et al., 2011). Our own results
support this for two other species of wild felid.
We also found evidence of sex-specific differences in the use of habitat-features, with female clouded
leopards avoiding logging-related features, possibly due to the risk of aggression or infanticide on the
part of males (Cheyne & Macdonald, 2011). Heterogeneity in capture probabilities between the sexes
has been previously noted in clouded leopards (Cheyne & Macdonald, 2011; Wilting et al., 2012) and
is an important source of bias in parameter estimation under a mark-recapture framework (Harmsen et
al., 2010). Our results suggest that females may be more likely to be recaptured, and heterogeneity
reduced, if traditional trail-based survey locations are supplemented with off-trail locations. For the
marbled cat, the finding that detection probabilities were eight-fold higher on skid trails relative to
other features including logging roads should be a point of further investigation, and may help to
explain the low detection frequencies of this species in previous studies (Fig. 2).

Chapter 2: Using random camera locations to survey felids in a logging concession
64
We obtained data from previous camera-trapping surveys carried out across Southeast Asia to
characterise for the first time the probability distribution of d, the detection frequency, for each
species of felid, and from this provide general recommendations for minimum survey efforts. Though
rarely available, this is vital information for the effective design of wildlife surveys. The detection
frequencies observed for our random survey locations deviated significantly from the expectation
based on previous studies in the case of the bay cat and leopard cat. Together with the differences
observed between off-trail and on-trail locations within our own study, this suggests that non-random
sampling regimes have resulted in biased inferences with respect to the relative abundance of these
species, especially for the bay cat.
The bay cat was listed as Endangered when it was last assessed under the IUCN Red List categories
and criteria (Hearn et al., 2008). This was on the basis of an estimated population size of less than
2500 mature individuals and a projected population decrease of more than 20% over 12 years. Since
this assessment was made, the proliferation of camera trap studies has yielded a number of new
records for the bay cat, both published (this study, Mohamed et al., 2009; Bernard et al., 2012; Brodie
& Giordano, 2012a; Samejima & Semiadi, 2012) and unpublished (Anonymous, 2011a, 2011b, 2012),
which has greatly expanded the known habitat tolerances of this species in terms of both disturbance
and maximum altitude (up to ~1500 m). It now seems likely that the bay cat can occur in highly-
disturbed forest, as well as the vast areas of upland forest (300 to 1,000 m elevation) and possibly
even montane forest (>1,000 m elevation) in the proposed Heart of Borneo transboundary
conservation area (WWF, 2012). Our finding that bay cat detection frequencies increase substantially
using random camera locations could also indicate a widespread underestimation of its relative
abundance. Considering these facts, a case could be made for reconsideration of the conservation
status of the bay cat during the next IUCN Red List cat assessments, due to be completed by 2015.
However, important uncertainties still remain in assessing the future for the bay cat, especially with
regards to land-use trends in the Yayasan Sabah Forest Management Area (Reynolds et al., 2011),

Chapter 2: Using random camera locations to survey felids in a logging concession
65
which is emerging as an apparent stronghold for the species, but also more broadly in the ongoing
land-use planning process for the Heart of Borneo area (Persoon & Osseweijer, 2008).
Camera traps are typically placed non-randomly in order to obtain a greater quantity of data per unit
of effort expended or money spent. We have shown here that, for certain species such as the bay cat,
this may not always be appropriate. Cameras and other wildlife sensors, such as sound recorders, are
rapidly improving in terms of sensitivity, battery life, data storage capabilities and robustness to
adverse environmental conditions, and are therefore producing more data per unit of effort or
monetary input than ever before. As a result, the traditional barrier to strictly random survey locations
– the paucity of data that may result – is rapidly being overcome. There will always be a role for non-
random placement in certain circumstances, such as when confirming the presence of a particular
species or using mark-recapture methods, but otherwise we advocate the adoption of random survey
locations and an emphasis on quality of data – as judged by the robustness and generality of
conclusions that can be drawn – rather than quantity of data per se. This will be especially productive
for study sites or study species which are poorly known, such as the bay cat, or for multi-species
surveys, as a means of controlling for differential use of habitat features across species or between
sexes within the same species.

Chapter 2: Using random camera locations to survey felids in a logging concession
66
Appendices
Appendix A – Camera-trapping data from previous studies (1998-2012)

Chapter 2: Using random camera locations to survey felids in a logging concession
67
Table A1. Previous camera-trapping studies conducted in Southeast Asia (1998 to 2012) and the number of captures obtained for Bornean felid species.
Reference Survey years
Location (* = sites with all 5 Bornean wild cat species)
Study site code
Borneo Wild cat captures [number of individuals] Number
of Bornean
cat species
Camera trap
nights Logged (L) / Old-growth
(OG)
Clouded leoparda
Marbled cat
Bay cat
Flat-headed
cat
Leopard cat
Lynam (2006) 1998 Ta Phraya NP, Thailand 1
OG
0.9/100 camera trap
nights 0 - - ≥1 3 Lynam (2006) & Jenks et al.
(2011) 1999-2000 Khao Yai NP, Thailand 2
OG 6 1 - - 10 3 1,226
Jenks et al. (2011) 2003-2007 Khao Yai NP, Thailand 2
OG 8 1 - - 4 3 6,260
Lynam (2003) 1999-2002 Myanmar (17 different sites) 3
OG 50 15 - - 80 3 15,560
Grassman (2003) 1999-2003 Phu Khieo Wildlife Sanctuary, Thailand 4
OG 2 0 - 0 4 2 1,224
Rao et al. (2005) 2002-2003 Hkakaborazi National Park buffer zone, Myanmar 5
OG & L 77 0 - - 49 2 1,238
Kawanishi & Sunquist (2004) 1999-2000 Merapoh, Taman Negara National Park, Peninsular Malaysia 6
OG 5 1 - 0 59 3 4,336
Kawanishi & Sunquist (2004) 2000-2001 Kuala Terengan, Taman Negara National Park, Peninsular Malaysia 6
OG 6 5 - 0 1 3 4,847
Kawanishi & Sunquist (2004) 2000-2001 Kuala Koh, Taman Negara National Park, Peninsular Malaysia 6
OG 5 10 - 0 2 3 4,871
Mohd-Azlan & Sharma(2006) & Mohd-Azlan (2006) 2000-2001
Jerangau FR, Ulu Terenganu, Peninsular Malaysia 7
L 13 1 - 0 86 3 5,972
Yasuda et al. (2007) 2000-2003 Tasek Merimbun Heritage Park, Brunei Darussalam 8 L 0 0 0 4 1 2 334
Imai et al. (2009) 2002 Tabin Wildlife Reserve, Sabah, Malaysia* 9 L 1 1 0 1 2 4 574
Yasuda et al. (2007) 2002-2003 Pasoh FR, Peninsular Malaysia 10
OG 0 0 0 0 2 1 3,659
Yasuda et al. (2007) 2003-2006 Deramakot FR, Sabah, Malaysia* 11 L 5 0 0 2 7 3 981 Yasuda et al. (2007) & Yasuda et al. (2009) 2004-2007
Sungai Wain Protection Forest, Kalimantan, Indonesia 12 OG 0 0 1 0 0 1 770
Yasuda et al. (2007) & Yasuda et al. (2009) 2004-2007
Bukit Soeharto Research & Education Forest, Kalimantan, Indonesia 13 L 0 0 0 0 1 1 840
Scott & Gemita (2004) 2003 Jambi Province, Sumatra, Indonesia 14
L 0 0 - 0 104 1 3,010
Scott & Gemita (2004) 2003 Jambi Province, Sumatra, Indonesia 14
Oil Palm 0 0 - 0 16 1 522 Johnson et al. (2009) & Johnson et al. (2006) 2003-2006
Nam Et-Phou Louey National Protected Area, Laos 15
OG ≥5 39 - - 24 3 8,499
Mohd-Azlan & Sanderson (2007) 2003-2006 Various in Sarawak, Malaysia 16 L?
1
5,034
Mohd-Azlan & Lading (2006) 2004 Lambir Hills NP, Sarawak, Malaysia 17 OG 3 0 0 0 0 1 1,127
Kitamura et al. (2010) 2004-2007 Hala-Bala Wildlife Sanctuary, 18
OG & L 4 0 - 0 13 2 11,106

Chapter 2: Using random camera locations to survey felids in a logging concession
68
Thailand
Giman et al. (2007) 2005 PFZ, Sarawak, Malaysia 19 L + Acacia 0 0 0 0 1 1 1,632
McShea et al. (2009) 2005-2007 PFZ, Sarawak, Malaysia 19 L + Acacia ≥1 ≥1 0 0 ≥4 3 5,679
Mathai et al. (2010) 2005-2008 Upper Baram, Sarawak, Malaysia – Logged 20 L 0 0 0 0 0 0 461
Mathai et al. (2010) 2005-2008 Upper Baram, Sarawak, Malaysia – Old-growth 20 OG 3 1 0 0 1 3 4,791
Datta et al. (2008) 2006-2007 Namdapha National Park, India 21
OG & L 2 ≥1 - - ≥1 3 1,537
Cheyne & Macdonald (2011) 2008-2009 Sabangau Forest, Kalimantan, Indonesia 22 L 29 [4] 4 0 7 25 4 5,777
Mohamed et al. (2009) 2008-2009 Deramakot FR, Sabah, Malaysia* 11 L 10 [1] 0 1 4 183 4 1,916
Samejima et al. (2012) 2008-2009 Pre-harvested plots, Deramakot FR, Sabah, Malaysia* 11 L ≥6 ≥4 ≥1 0 ≥2 4 11,550
Samejima et al. (2012) 2008-2009 2 years after RIL plot, Deramakot FR, Sabah, Malaysia* 11 L 0 0 3 1 0 2 770
Samejima et al. (2012) 2008-2009 6 years after RIL plot, Deramakot FR, Sabah, Malaysia* 11 L 2 1 0 0 0 2 770
Samejima et al. (2012) 2008-2009 8 years after RIL plot, Deramakot FR, Sabah, Malaysia* 11 L 0 0 0 0 0 0 770
Samejima et al. (2012) 2008-2009 11 years after RIL plot, Deramakot FR, Sabah, Malaysia* 11 L 0 0 0 0 0 0 770
Samejima et al. (2012) 2008-2009 13 years after RIL plot, Deramakot FR, Sabah, Malaysia* 11 L 0 0 0 0 0 0 770
Imai et al. (2009) 2008-2009 Tangkulap FR, Sabah, Malaysia 23 L ≥1 ≥1 0 0 ≥2 3 4,320
Bernard et al. (2012) 2009-2010 Tabin Wildlife Reserve, Sabah, Malaysia* 9 L 5 2 2 0 7 4 2,700
Bernard et al. (2012) 2009-2010 Fragments near Tabin Wildlife Reserve, Sabah, Malaysia 24
L (Fragments) 0 0 0 0 13 1 1,033
Wilting et al. (2012) & Wilting et al. (2009, unpublished report) 2009
Tangkulap-Pinangah FR, Sabah, Malaysia 23 L 29 [5] 1 0 ≥2 ≥1 4 2,688
Wilting et al. (2012) & Wilting & Mohamed (2010, unpublished) 2010 Segaliud-Lokan FR, Sabah, Malaysia 25 L 15 [5] 3 0 0 >15 3 2,640
Brodie & Giordano (2011 & 2012) 2010
Maliau Basin Conservation Area buffer, Sabah, Malaysia (and adjacent area) 26 L 1 [1] 0 0 0 0 1 1,165
Brodie & Giordano (2011 & 2012) 2010
Maliau Basin Conservation Area, Sabah, Malaysia 26 OG 59 [4] 3 0 1 20 4 1,747
van Berkel et al. (unpublished) [T. van Berkel, 2012, personal communication] 2010-2011 Mohot River, Kalimantan, Indonesia 27 OG 0 0 0 0 ≥1 1 546

Chapter 2: Using random camera locations to survey felids in a logging concession
69
Reference Study
duration (months)
Trap sites Camera trap nights per site
Study area size
(km2)
Taxonomic focus
Inter-trap distance (km)
Paired cameras?
Flash (white or infrared)
Lure/ Bait?
Relative abundance
index? Occupancy? Density?
Lynam (2006) 5 28 30-40
Tigers & prey 1-2 Some White
Lynam (2006) & Jenks et al. (2011) 19 34 30-40
Tigers & prey 1-2 Some White
Jenks et al. (2011) 42 217 ≥21
Mammals ~1 N White
Lynam (2003) 36 430 >24 5491 Tigers ~2 Some White
Grassman (2003) 48 <200 30 200 Mammals 0.5-1 N White
Rao et al. (2005) 12 64 30-35
Mammals & birds 0.5 N White
Kawanishi & Sunquist (2004) 14 47 92 165
Tigers & prey 4 Y White
Kawanishi & Sunquist (2004) 11 43 113 164 Tigers & prey 4 Y White
Kawanishi & Sunquist (2004) 11 45 108 151 Tigers & prey 4 Y White
Mohd-Azlan & Sharma(2006) & Mohd-Azlan (2006) 21 24 284
Tigers 1.8-2.2 N White
Yasuda et al. (2007) ~33
Mammals
N White Imai et al. (2009) 1
Mammals
N White
Yasuda et al. (2007)
Mammals
N White Yasuda et al. (2007) ~24
Mammals
N White
Yasuda et al. (2007) & Yasuda et al. (2009)
10
Mammals 0.2 N White
Yasuda et al. (2007) & Yasuda et al. (2009)
22
Mammals 0.2 N White
Scott & Gemita (2004) 9 >48 ≥14
Mammals 0.5 N White
Scott & Gemita (2004) 9 48 ≥14
Mammals 0.5 N White
Johnson et al. (2009) & Johnson et al. (2006) 37 273 >37 500
Tigers & prey ~2 Y White
Mohd-Azlan & Sanderson (2007) 37
Mammals
? White
Mohd-Azlan & Lading (2006) 8 7 161
Mammals
N White
Kitamura et al. (2010) 36 45 247
Mammals & birds 0.3-0.5 N White
Giman et al. (2007) 5 83 <30
Mammals 0.2 minimum N White McShea et al. (2009) 22 212 14-36 (mean= 27) 644 Mammals 0.2 N White
Mathai et al. (2010) 45
150 Mammals
N White

Chapter 2: Using random camera locations to survey felids in a logging concession
70
Mathai et al. (2010) 45
150 Mammals
N White Datta et al. (2008) 4 80 15 360 Mammals 0.2-0.5 N White
Cheyne & Macdonald (2011) 18 27 214 7 Clouded leopard
Y
White & infrared
Mohamed et al. (2009) 7 48 42 112 Felids
1.2-2.4 (mean = 1.7) Y White
Samejima et al. (2012) 19 >135 90-150 47
Mammals & birds
N White
Samejima et al. (2012) 19 ≥9 90-150 3
Mammals & birds
N White
Samejima et al. (2012) 19 ≥9 90-150 3
Mammals & birds
N White
Samejima et al. (2012) 19 ≥9 90-150 3
Mammals & birds
N White
Samejima et al. (2012) 19 ≥9 90-150 3
Mammals & birds
N White
Samejima et al. (2012) 19 ≥9 90-150 3
Mammals & birds
N White
Imai et al. (2009) 11 81 53 7
Mammals & birds
N White
Bernard et al. (2012) 16 >9
Mammals 0.2 N White Bernard et al. (2012) 16 >8
Mammals 0.05-0.1 N White
Wilting et al. (2012) & Wilting et al. (2009, unpublished report) 5 64 42 122 Felids 1.7 Y White
Wilting et al. (2012) & Wilting & Mohamed (2010, unpublished) 4 55 48 114 Felids 1.7 Y White
Brodie & Giordano (2011 & 2012) 5 26 81-128
Clouded leopard 1-2 Y Infrared
Brodie & Giordano (2011 & 2012) 5 26 123-126
Clouded leopard 1-2 Y Infrared
van Berkel et al. (unpublished) [T. van Berkel, 2012, personal communication] 1 ≥25 3-43 (mean = 22)
Mammals & birds 0.5 N
White & infrared
aBoth recognised species of clouded leopard are here included (Neofelis nebulosa and N. diardi).

Chapter 3: Mammalian species richness and β-diversity across a tropical land-use gradient
71
Chapter 3:
Grain-dependent responses of mammalian species richness and β-diversity to land-use
and the implications for managing conservation values in tropical human-modified
landscapes
Abstract
Diversity responses to land-use change are poorly understood at local scales, hindering our ability to
make forecasts and management recommendations at scales which are of practical relevance. A key
barrier in this has been the under-appreciation of grain-dependent diversity responses and the role that
β-diversity – variation in community composition across space – plays in this. Decisions about the
most effective spatial arrangement of conservation set-aside, for example High Conservation Value
areas, have also neglected β-diversity, despite its role in determining the complementarity of sites. We
investigated local-scale richness and β-diversity at multiple spatial grains for large and small
mammals, across old-growth forest, logged forest and oil palm plantations in Borneo, using intensive
camera- and live-trapping. β-diversity was quantified by comparing observed β-diversity with that
obtained under a null model, in order to control for sampling effects, and we refer to this as the β-
diversity signal. Community responses to land-use were grain-dependent, with large mammals
showing reduced richness in logged forest compared to old-growth forest at the grain of individual
sampling points, but no change at the overall land-use level. Responses varied with species group,
however, with small mammals increasing in richness at all grains in logged forest compared to old-
growth forest. Both species groups were significantly depauperate in oil palm. Large mammal
communities in old-growth forest became more heterogeneous at coarser spatial grains and small
mammal communities became more homogeneous, whilst this pattern was reversed in logged forest.
Both groups, however, showed a significant β-diversity signal at the finest grain in logged forest, most
likely due to logging-induced environmental heterogeneity. The β-diversity signal in oil palm was
weak, but heterogeneity at the coarsest spatial grain was still evident, likely due to variation in

Chapter 3: Mammalian species richness and β-diversity across a tropical land-use gradient
72
landscape forest cover. Our findings suggest that the most effective spatial arrangement of
conservation set-aside will involve a trade-off for large and small mammals. Greater consideration in
the conservation and management of tropical landscapes needs to be given to β-diversity at a range of
spatial grains.
3. 1. Introduction
It is widely acknowledged that global biodiversity is in decline (Butchart et al., 2010), primarily due
to unprecedented rates of habitat loss and degradation (Hansen et al., 2013). Many attempts have been
made at quantifying this biodiversity loss due to land-use change at coarse scales and forecasting this
into the future (Sodhi et al., 2004; Koh & Ghazoul, 2010a; Wearn et al., 2012; Pimm et al., 2014),
with the aim of informing policy-making at the highest administrative levels. In reality, biodiversity
loss at coarse scales is a summation of the changes occurring at the local scale of landscapes, such as
forestry concessions or private landholdings. Local stakeholders often make management decisions
that have substantial impact on the outcomes for biodiversity in these landscapes. At this local scale,
however, there is little consensus about the community responses to land-use, which hinders our
ability to make management recommendations and biodiversity forecasts at scales relevant to local
stakeholders.
Much confusion surrounding local-scale biodiversity responses has arisen due to an under-
appreciation of spatial grain (Hamer & Hill, 2000; Whittaker et al., 2001; Sax & Gaines, 2003). At the
smallest scales (e.g. those of a quadrat or plot), species richness has been shown to be stable
(Dornelas et al., 2014) or even increasing in post-disturbance areas (Vellend et al., 2013). On the other
hand, a number of other meta-analyses focussing on overtly disturbed areas, and which did not
account for spatial grain, have shown the contrasting result of declines in species richness (Dunn
2004; Scales & Marsden 2008; Sodhi et al. 2009; Gibson et al. 2011; Burivalova et al. 2014; Newbold
et al. 2015). It is difficult to completely reconcile these two apparently conflicting findings, and make
firm conclusions with respect to local-scale biodiversity responses, due to the lumping together of

Chapter 3: Mammalian species richness and β-diversity across a tropical land-use gradient
73
studies using vastly different spatial grains. For example, in a review of past studies, Hill & Hamer
(2004) found that the effects of disturbance on Lepidoptera (moths and butterflies) and birds were
strongly grain-dependent. Specifically, in response to disturbance, Lepidoptera richness often
increased at small scales (< 1 ha) and decreased at intermediate scales (1 – 25 ha), while bird richness
also decreased at intermediate scales but then increased at still larger scales (> 25 ha). Although
consideration of spatial grain has largely been neglected in global meta-analyses, it offers the potential
of uniting seemingly contradictory results and allowing better forecasting of biodiversity changes at
the local-scale. An essential component in this framework will be a better understanding of
community variance, or β-diversity, which largely determines the relationship between spatial grain
and richness (Scheiner, 2004; Drakare et al., 2006). Indeed, changes in β-diversity can potentially
explain how, in response to land-use change, species richness might remain constant or even increase
at the level of a sampling point, yet decline at the level of a study site.
β-diversity patterns are important in systematic conservation planning, as they determine the
complementarity of communities across sites (Ferrier, 2002). This also applies, at smaller scales, to
decisions about how to allocate conservation set-aside. Major certification schemes, including those
of the Forest Stewardship Council (FSC), Round-table on Responsible Soy (RTRS) and Round-table
on Sustainable Palm Oil (RSPO), require concession holders to identify and set-aside forest patches
with High Conservation Value (HCV), but do so without explicit consideration of local-scale β-
diversity. Although it is an open question whether β-diversity is itself a HCV that should be
maintained, it is nonetheless a crucial determinant of the values conserved within set-aside,
particularly in the context of deciding the spatial distribution of patches and how large each patch
should be (Nekola & White, 2002). This is relevant in the context both of the expansion of cropland
and tree plantations into forested landscapes, which is ongoing at a rapid rate (Phalan et al., 2013;
Wilcove et al., 2013), and of the increasing uptake of sustainability principles by logging companies,
as required under certification schemes such as the FSC, but also more broadly under the banner of
retention forestry (Gustafsson et al., 2012; Lindenmayer et al., 2012).

Chapter 3: Mammalian species richness and β-diversity across a tropical land-use gradient
74
Selective logging is the main driver of tropical forest degradation worldwide (Asner et al., 2009;
Bryan et al., 2013) and, by modifying the structure (Cannon et al., 1994; Hill, 1999; Bischoff et al.,
2005), resources (Johns, 1988; Heydon & Bulloh, 1997; Munshi-South et al., 2007) and micro-climate
(Hardwick et al., 2015) of forests through space, may act as a strong environmental filter on the
occurrence patterns of species post-logging (Cleary et al., 2005; Kitching et al., 2013). Only a handful
of studies have investigated β-diversity in logged forests, but these support the notion that
environmental heterogeneity in logged forests increases β-diversity (Hill & Hamer 2004; Berry et al.
2008; Woodcock et al. 2011, but see Kitching et al. 2012). Plantation habitats, by contrast, may be
more homogeneous in space than natural forest, not only in terms of floral species composition, but
also in terms of structure, resources and micro-climate (Thiollay, 1995; Scales & Marsden, 2008).
This may be particularly true of oil palm (Elaeis guineensis) plantations (Luskin & Potts, 2011; Foster
et al., 2011), which are expanding across the tropics at a rapid rate, particularly in Southeast Asia
(Wilcove et al., 2013).
Across taxa, β-diversity may vary depending on dispersal capacity, as well as the home-range size of
individuals: all else being equal, poor dispersers with small home-ranges will both be more dispersal-
limited and less able to buffer spatial variation in habitat quality, leading to higher β-diversity.
Certainly, Soininen et al. (2007a) found evidence across past studies that larger-bodied organisms,
which have higher dispersal capacity and larger home-ranges, generally exhibited lower levels of β-
diversity. Despite the expected differences among taxa, very few studies have explored this at the
local scale using data collected simultaneously on multiple species groups at the same spatial
locations (but see Dormann et al. 2007; Kessler et al. 2009; Cabra-García et al. 2012; Gossner et al.
2013).
The primary aim of our study was to quantify the species richness and β-diversity of mammal
communities across a land-use gradient and investigate whether diversity responses to land-use were
dependent on spatial grain. In doing so, we used robust estimators and comparisons with null models

Chapter 3: Mammalian species richness and β-diversity across a tropical land-use gradient
75
to control for the specific properties of our sampling design. As a secondary aim, we also investigated
differences in richness and β-diversity among large and small mammals across a range of spatial
grains. We chose mammals as our focus due to the fact that they are a high-profile group that are
often the targets of policy and land-use decisions, and are often given strong weighting in
conservation planning, especially the HCV assessment process.
We made three specific hypotheses with regard to β-diversity. We hypothesised that logged forest
areas would be more environmentally heterogeneous than old-growth forest, therefore giving rise to
higher levels of β-diversity (HI), whilst oil palm would be environmentally homogeneous, giving rise
to lower levels of β-diversity (HII). We also hypothesised that small mammals (< 1 kg) would be more
dispersal-limited than large mammals, owing to their smaller body size, and less able to buffer fine-
grained variation in habitat quality (HIII). We therefore expected small mammals to exhibit greater
levels of β-diversity than large mammals. To address these hypotheses, we gathered one of the most
comprehensive datasets on local-scale mammal occurrence from the tropics that we are aware of,
using multiple sampling methods to incorporate nearly the entire non-volant community, from the
smallest murid rodents (~0.03 kg) up to the Asian elephant Elephas maximus (~2,700 kg). Our
findings with respect to the importance of spatial grain and β-diversity have important implications
for the conservation and management of biodiversity in these systems and, in particular, with regard
to optimal designs for conservation set-aside.
3. 2. Methods
3. 2. 1. Study sites and sampling design
We sampled mammals in three different land-uses, taking advantage of the experimental design of the
Stability of Altered Forest Ecosystems (SAFE) Project in Sabah, Malaysian Borneo (Ewers et al.,
2011). This consists of old-growth forest within the Maliau Basin Conservation Area, repeatedly-
logged forest within the Kalabakan Forest Reserve and two adjacent oil palm plantations straddling
the Kalabakan Forest Reserve boundary (see Appendix A for detailed study site descriptions).

Chapter 3: Mammalian species richness and β-diversity across a tropical land-use gradient
76
We used a hierarchical nested sampling design in order to explore β-diversity at three different spatial
grains (Fig. 1). We based this on the fractal sampling design of the SAFE Project (Ewers et al., 2011),
which is an especially efficient design for quantifying β-diversity (Marsh & Ewers, 2012). At the
lowest level in the hierarchy were individual sampling points. These were clustered into rectangular
sampling grids, which we call here plots, of (4 x 12 =) 48 points separated by 23 m. At the highest
level in the hierarchy, plots were clustered together into blocks. These were arranged differently in the
logged forest compared to the other two land-uses (Fig. 1), in order to overlay the locations of future
experimental fragments (Ewers et al., 2011), but separation distances between plots (170 to 290 m)
and between blocks (0.6 to 3 km) were similar across the land-uses. The spatial arrangement of
sampling points at the SAFE Project has been deliberately designed to minimise confounding factors
across the land-use gradient, including latitude, slope and elevation (Ewers et al., 2011), and this
applied equally to our sampling design for mammals.
Figure 1. Sampling design across (a) old-growth forest, (b) oil palm and (c) logged forest used in this study, illustrating the three spatial grains within each land-use: individual sampling points, 1.75 ha rectangular plots (consisting of clusters of points) and blocks (consisting of clusters of plots). Blocks were arranged identically in old-growth forest and oil palm, and were arranged to coincide with future experimental forest fragments in logged forest. Separation between points, plots and blocks was nonetheless similar across land-uses. Shaded areas lie outside the Kalabakan Forest Reserve, consisting of a 2,200 ha Virgin Jungle Reserve (Brantian-Tatulit) to the south and an extensive (>1 million ha) area of logged forest to the north (Mount Louisa Forest Reserve and other contiguous forest reserves). Insets show the location within insular Southeast Asia and the spatial proximity of the three land-uses within southeast Sabah, Malaysian Borneo.

Chapter 3: Mammalian species richness and β-diversity across a tropical land-use gradient
77
3. 2. 2. Mammal sampling
Small mammal trapping was conducted at the level of the plot, with each session consisting of seven
consecutive days. Two locally-made steel-mesh traps (18 cm wide, 10-13 cm tall and 28 cm in
length), baited with oil palm fruit, were placed at or near ground level (0 - 1.5 m) within 10 m of each
grid point. Traps were checked each morning and captured individuals were anaesthetised using
diethyl ether (following Wells et al. 2007), measured, permanently marked using a subcutaneous
passive inductive transponder tag (Francis Scientific Instruments, Cambridge, UK), identified to
species using Payne et al. (2007) and released at the capture location. Trapping was carried out
between May 2011 and March 2014, during which there were no major mast-fruiting events. Some
plots (8 of 31) were sampled more than once over this period (mean effort per plot = 925 trap nights).
We deployed camera traps (Reconyx HC500, Holmen, Wisconsin, USA) at a random subset of grid
points within plots, setting the cameras as close to the points as possible and strictly within 5 m. The
random deployment of cameras in this manner has rarely been used before, though is essential for
revealing species-specific patterns of space-use (Chapter 2), which is a contributor towards β-
diversity. Cameras were fixed to trees or wooden poles, or placed within locally-made steel security
cases in areas of high human traffic, with the camera sensors positioned at a height to maximise
detection for a range of species (most often 30 cm, though this was flexible depending on the terrain
encountered at each location). No bait or lure was used and disturbance to vegetation was kept to a
minimum. Camera traps were active between May 2011 and April 2014, during which most plots (39
of 42) were sampled for multiple sessions (mean points per plot = 13; mean effort per plot = 625 trap
nights).
In total, 543 points were camera-trapped and 1,488 points were live-trapped, and we used these
datasets for estimating large and small mammal species richness, respectively. Both trapping
protocols were used at 430 points and we used only this subset of the data for the β-diversity analyses.

Chapter 3: Mammalian species richness and β-diversity across a tropical land-use gradient
78
This subset included data from 31 plots nested in 8 blocks (9 plots in 3 blocks for old-growth forest;
16 plots in 3 blocks for logged forest, and 6 plots in 2 blocks for oil palm).
3. 2. 3. Data analysis
All analyses were ultimately derived from the separate community matrices from live-trapping and
camera-trapping, with trap nights forming rows of the matrices, species forming the columns and each
cell containing the number of independent capture events. Unlike live traps, camera traps are
continuous-time detectors, so we considered photographic capture events to be independent if they a)
contained different individuals or b) were separated by > 12 hours, which matches the approximate
minimum separation between live trap events.
Our hierarchical sampling design allowed us to partition species richness and β-diversity into multiple
spatial grains across the three land-uses, by aggregating the community matrices to the appropriate
grain. However, unequal levels of effort, replication and sample completeness across spatial grains
and across land-uses makes comparisons of richness and β-diversity problematic, an issue that has
often been neglected in past studies (Beck et al., 2013).
For species richness, there are non-parametric estimators which can be used to make richness values
more robust to sampling design variation. We used the Abundance-based Coverage Estimator (ACE)
for overall richness in each land-use, because we were confident that sufficient sampling had been
done to estimate the minimum asymptotic richness (Gotelli & Chao, 2013), whilst we standardised
point richness to 90% sample coverage (Colwell et al., 2012). We hereafter refer to overall richness in
each land-use and point richness as γ-diversity and α-diversity, respectively. For both γ- and α-
diversity, we used the full camera trap and live trap datasets to make estimates for large and small
mammals, respectively.

Chapter 3: Mammalian species richness and β-diversity across a tropical land-use gradient
79
We modelled either large or small mammal α-diversity using a Poisson generalised linear mixed-
effects model, with the hierarchical sampling design specified in the random effects (points nested
within plots, in turn nested within blocks), as well as an observation-level random effect to account
for overdispersion (Harrison, 2014). We note that, given our relatively fine-scale sampling of
mammal communities, spatial variation in α-diversity is due to coarse-scale species occurrence
patterns, as well as finer-scale patterns of habitat-use by individual animals. The random effects
helped account for any spatial dependence between sampling points, caused by detections of the same
individuals at multiple points. We also made estimates of γ- and α-diversity across large and small
mammals for the subset of locations which had been sampled using both live traps and camera traps.
In this case, we were able to model α-diversity as a function of both land-use and species group (large
or small mammal), as well as their interaction.
Commonly used metrics of β-diversity are also sensitive to the specific sampling design employed
(see Appendix B for more information). Instead of using β-diversity values directly, we compared
observations with an appropriate null model (Crist et al., 2003; Kraft et al., 2011), an approach which
has been underexploited to date (Lessard et al., 2012). Differences from the null model, calculated
using simple subtraction (βobserved – βnull), can be interpreted as a measure of β-diversity due to
community assembly processes (including those of intraspecific aggregation, environmental filtering
and dispersal limitation), over and above that due to the vagaries of the sampling process itself. We
refer to this difference between observed and null β-diversity as the β-diversity signal (as opposed to
the random β-diversity noise). Observed β-diversities were calculated using Lande’s (1996) additive
formulation, in which β-diversity at a given level, i, in a hierarchy is the average richness at the given
level substracted from that in the level above: βi = αi+1 – αi. This was done for each combination of
land-use (old-growth forest, logged forest and oil palm) and species group (large mammals, small
mammals or both combined), for each of three spatial grains: points (camera detection zone = 0.02
ha), plots (1.75 ha in area) and blocks (covering an average minimum convex polygon of 25 ha;
range: 24.1 – 25.4). It follows from Lande’s (1996) additive diversity partitioning that overall

Chapter 3: Mammalian species richness and β-diversity across a tropical land-use gradient
80
observed γ-diversity of each land-use is: αpoint + βpoint + βplot + βblock. We used additive partitioning
because β-diversity is in units of species richness in this framework, which means differences from
null models can also be calculated in units of species richness using simple subtraction (βobserved –
βnull), allowing more straightforward comparisons between land-uses, between species groups and
between hierarchical levels.
To estimate null β-diversities, we used null models based on the sample-based randomisations of Crist
et al. (2003). For each spatial grain i in the hierarchy, we randomly shuffled (without replacement) the
community samples at the level below (i – 1), whilst constraining the random placements to maintain
the integrity of any higher-level (i + 1) spatial nesting. For example, null β-diversity for the plot level
was derived by randomly shuffling point-level communities amongst plots, but only amongst plots
within the same block. By constraining the null model in this way, we were able to test for differences
from null at the specific spatial grain of interest. We extended this to the case of multiple sampling
methods, by keeping the matrices derived from live-trapping and camera-trapping separate and
conducting the randomisations in parallel, mimicking how the data were generated. This also allowed
us to specifically control for the different sampling efforts achieved during live-trapping and camera-
trapping.
By repeating the randomisation process, we obtained distributions of differences from the null. We
calculated the 95% quantiles of these distributions and deemed differences to be significant if the
quantiles did not overlap zero. Sample size necessarily declines at the higher spatial levels of a fractal
sampling design, causing a loss in the precision of β-diversity estimates (Marsh & Ewers, 2012). This
was also true of our null model approach, because we had fewer community samples to shuffle at
higher levels. We used 1000 randomisations in all cases, except for our oil palm sampling design, in
which there were few possible combinations of placing plots within blocks. In this case we restricted
the number of randomisations to the number of combinations (n = 40).

Chapter 3: Mammalian species richness and β-diversity across a tropical land-use gradient
81
We modelled the differences from null using linear mixed-effects models in order to explore
differences across land-use, across spatial grains and across the two species groups. Since β-diversity
at a given hierarchical level is, in the additive framework, the mean of the number of “missing”
species in each sample (species which are absent from a sample but present at the level above), we
took advantage of this by extracting the un-averaged number of missing species for each sample. We
calculated the difference from null for each of these observed values and accounted for the lack of
independence between values by specifying the hierarchical sampling design in the random effects
structure. Point-level values were nested within plots and blocks, whilst plot-level values were nested
within blocks. For the block-level model, no random effects were specified because this was the
highest level in the hierarchy.
Finally, using the approach outlined by Baselga (2010a), we differentiated between the two broad
proximate causes of β-diversity – species turnover and nestedness (see Appendix B for more
information) – to investigate which was primarily responsible for β-diversity at each spatial grain in
the three land-uses. Given the sample size dependence of these measures, we calculated them over
100 random sub-samples of our data (Baselga, 2010a), taking the minimum sample sizes at each
hierarchical level across the whole dataset each time (8 points per plot, 3 plots per block and 2 blocks
per land-use). This would still not enable fair comparisons across spatial grains, so we calculated
values as a proportion of the total β-diversity (nestedness and turnover), as given by the Sørensen
index (Baselga, 2010a). We modelled the proportion of β-diversity in the nestedness component using
beta regression models with a log link and constant dispersion parameter, constructing separate
models with land-use, species group or spatial grain as the explanatory variable. We used the
combined live trap and camera trap dataset for this analysis, removing 12 points which had been
camera-trapped for less than 7 days.
Chapter 3: Mammalian species richness and β-diversity across a tropical land-use gradient
82
All analyses were done in R version 3.1.0 (R Development Core Team, 2014), using the additional
packages vegan 2.0-10 (Oksanen et al., 2013), iNEXT 1.0 (Hsieh, 2013), plyr 1-29 (Wickham, 2010),
lme4 1.1-6 (Bates et al., 2014) and betareg 3.0-5 (Cribari-Neto & Zeileis, 2010).
3. 3. Results
Live-trapping resulted in a total of 4,046 captures of 25 mammal species over 28,681 trap nights,
whilst camera-trapping resulted in a total of 12,788 independent captures of 58 mammal species over
26,251 trap nights. This gave a total of 65 mammal species (Appendix D), of which 19 species were
captured using both protocols. Over the points sampled using both live traps and camera traps (n =
430), we obtained 11,579 captures of 61 species over a combined effort of 27,176 trap nights.
Live-trapping of 2,976 locations over 28,681 trap nights resulted in a total of 4,046 captures of 25
species, whilst camera-trapping of 543 locations over 26,251 trap nights resulted in a total of 12,788
independent captures of 58 species. This gave a total of 65 mammal species (Appendix D), of which
19 species were captured using both protocols. Over the 430 locations sampled using both live traps
and camera traps, we obtained 11,579 captures of 61 species over the combined effort of 27,176 trap
nights.
Species accumulation curves in each land-use were closely approaching an asymptote (Appendix C,
Fig. C1), all with an estimated sample coverage ˃ 98%. Logged forest had the highest observed and
estimated total mammal γ-diversity, though the 95% confidence intervals overlap with those for old-
growth forest (Fig. 2). Of the 44 species found in old-growth forest, 39 species (89%) were also
detected in the logged habitats. Oil palm plantations were a significantly depauperate habitat (Fig. 2),
harbouring just 22 of the 63 species (35%) found in the forest habitats, in addition to the plantain
squirrel Callosciurus notatus and invasive domestic dog Canis familiaris. We separately calculated oil
palm γ-diversity after excluding 6 grid points which fell within a 200 m wide margin of forest-scrub

Chapter 3: Mammalian species richness and β-diversity across a tropical land-use gradient
83
habitat that was connected to a 45 km2 block of logged forest (Appendix C, Table C1), which left just
19 forest species (30%) that were found in the oil palm crop itself.
The overall γ-diversity differences between land-uses were in large part due to the small mammals.
Observed and estimated large mammal γ-diversities were very similar for old-growth and logged
habitats (Fig. 2) and, for the full camera trap dataset, the 95% confidence intervals for oil palm
overlap, albeit slightly, with those of old-growth forest (Appendix C, Table C1). In contrast, small
mammal γ-diversity was significantly different among all three land-use contrasts, except for a slight
overlap in 95% confidence intervals between old-growth forest and oil palm in the combined live trap
and camera trap dataset (Fig. 2; Appendix C, Table C1).
Figure 2. Diversity partitions for all mammals, large mammals and small mammals across a gradient of land-uses, including observed values (± SD) at four spatial grains and estimated α- and γ-diversities (± 95% CI). Estimates of α-diversity (standardised to 90% sample coverage) are predictions from a mixed-effects model which accounted for the hierarchical nested sampling design. Estimates of γ-diversity were calculated using the Abundance-based Coverage Estimator (ACE). Only data from sampling points which were both camera-trapped and live-trapped were used in this figure (see Appendix C for full results).

Chapter 3: Mammalian species richness and β-diversity across a tropical land-use gradient
84
Mixed-effects models of α-diversity (standardised to 90% sample coverage) indicated a significant
effect of land-use, for both small mammals from the live trap data (χ2(2) = 119, p < 0.0001) and large
mammals from the camera trap data (χ2(2) = 21.7, p < 0.0001). As with γ-diversity, large and small
mammals showed markedly different responses for α-diversity (Fig. 2), which was confirmed by a
significant interaction term between land-use and species group using the combined live trap and
camera trap dataset (χ2(2) = 251, p < 0.0001). In this model, logged forest had a significantly higher α-
diversity than old-growth forest for small mammals (3.7 times higher, z = 14.2, p < 0.0001) and a
significantly lower α-diversity for large mammals (24% lower, z = -2.51, p = 0.01). This difference
between the two forest habitats was also significant for small mammal α-diversity with the full live
trap dataset (5 times higher in logged forest, z = 6.76, p < 0.0001), but was not significant for large
mammals when the full camera trap dataset was used (19% lower in logged forest, z = -1.54, p =
0.12). Oil palm was, again, highly depauperate compared to the forest habitats (either with or without
the locations in the forest-scrub boundary; Appendix C, Table C2), and this difference was significant
for both small mammals from the live trap data (compared to old-growth forest: z = 4.61, p < 0.0001)
and large mammals from the camera trap data (compared to logged forest: z = -3.47, p < 0.01).
Diversity partitioning suggested that the majority of the γ-diversity was contained in the β-diversity
components (Fig. 2): 83% in old-growth forest and 84% in both logged forest and oil palm. The
percentages for each of the spatial grains also appear broadly similar for overall mammal diversity
(Fig. 2): 38%, 38% and 30% as βpoint-diversity; 20%, 25% and 27% as βplot-diversity, and 25%, 20%
and 28% as βblock-diversity for old-growth forest, logged forest and oil palm, respectively. However,
the proportion of diversity contained within the β components across land-use, especially βplot and
βblock, is markedly different for large and small mammals (Fig. 2).
Null model comparisons demonstrated that most community samples had a significant signal of non-
random assembly processes (as evidenced by 95% confidence intervals which did not overlap zero;
Appendix C, Table C3). In old-growth forest, the β-diversity signal at large spatial grains was

Chapter 3: Mammalian species richness and β-diversity across a tropical land-use gradient
85
increasingly strong for large mammals and increasingly weak for small mammals, whilst this pattern
was reversed in logged forest (Fig. 3). The β-diversity signal in oil palm was found to be much lower
overall, due in part to the depauperate nature of the mammal community that exists there, especially
for small mammals. However the β-diversity signal for large mammals in oil palm was still
comparable at the point level to that found in old-growth forest, and did not decline at the block level
as it did in logged forest (Fig. 3).
Figure 3. β-diversity differences from null models (± SE) with increasing spatial grain, for all mammals, large mammals and small mammals. Panels show results across a gradient of land-uses. The horizontal line at y=0 represents the case of no difference between observed β-diversity and expected β-diversity from null models. Dashed vertical lines show the three spatial grains of β-diversity sampling within each land-use (points, plots and blocks). Smoothed lines between data points are to aid interpretation. See Appendix C, Table C3 for 95% CIs.
Mixed-effects models of βpoint differences from null showed significant differences among the land-
uses (χ2(2) = 7.70, p = 0.02) and among the species groups (χ2
(1) = 13.94, p < 0.001). These were driven
by: an increase from old-growth to logged habitats (showing support for HI); a reduction in oil palm
(showing support for HII), and the consistently higher values, irrespective of land-use, for large
mammals (showing no support for HIII). The interaction between land-use and species group was not
significant at this spatial grain (χ2(2) = 3.31, p = 0.19). There were no consistent differences in βplot or
βblock differences from null, either between land-uses (plot-level: χ2(2) = 0.87, p = 0.65; block-level: F(2,
10) = 0.30, p = 0.75) or species groups (plot-level: χ2(1) = 0.92, p = 0.34; block-level: F(1, 10) = 1.17, p =

Chapter 3: Mammalian species richness and β-diversity across a tropical land-use gradient
86
0.30), showing no support at this spatial grain for any of HI to HIII. The interaction terms in both
models were also not significant (plot-level: χ2(2) = 0.28, p = 0.87; block-level: F(2, 10) = 0.63, p = 0.55).
β-diversity was predominantly generated by species turnover rather than nestedness, with turnover
forming the larger component in all cases except for small mammals at the plot level in oil palm and
block level in logged forest (Fig. 4). Nestedness formed a larger component of β-diversity for small
mammals compared to large mammals (z = 2.09, p = 0.04). There was a trend for nestedness to be
more important in oil palm (compared to logged forest: z = 1.68, p = 0.093), but no obvious patterns
across spatial grains (χ2(2) = 2.28, p = 0.32).
Figure 4. Percentage of overall β-diversity generated by nestedness (variation in species richness without species composition changes) and species turnover (changes in species composition) across species groups and land-use types, calculated following the approach of Baselga (2010).
3. 4. Discussion
Our finding that the vast majority of old-growth species are retained in logged forest is in agreement
with the emerging consensus, from studies of a large variety of taxa, that logged forest has substantial
conservation value (Dunn, 2004; Berry et al., 2010; Putz et al., 2012; Edwards et al., 2014a). Logging
responses are strongly taxon- and continent-specific (Burivalova et al., 2014), and our study also adds
to a relatively small body of literature on Southeast Asian mammals, supporting the general notion

Chapter 3: Mammalian species richness and β-diversity across a tropical land-use gradient
87
that large areas of logged forest in the region retain much of the terrestrial mammal diversity of old-
growth forest (Kemper & Bell, 1985; Numata et al., 2005; Wells et al., 2007; Bernard et al., 2009;
Kitamura et al., 2010; Brodie et al., 2015), despite timber extraction rates that may be an order of
magnitude higher than on other continents (Putz et al., 2012).
Whilst supporting this general notion, our study also offers a more comprehensive assessment of
mammal community responses to logging than has been possible before. For the first time, we were
able to examine mammal diversity responses at multiple spatial grains, and across the whole terrestrial
mammal community, including both large and small mammals. This revealed a more nuanced view of
community responses to logging: logged habitats had either a higher or lower richness of large
mammals depending on spatial grain, whilst small mammals were richer in logged forest across all
spatial grains. Moreover, large mammal communities became more heterogeneous at increasing
spatial grains in old-growth forest but more homogeneous in logged forest, whilst the reverse pattern
was seen in small mammal communities.
Large mammal richness at small spatial grains was reduced by 19-24% in logged forest, even though
species richness at larger spatial grains was maintained. Similarly, Brodie et al. (2015) found a
reduction in large mammal richness of 11% at the sampling point level in recently-logged (< 10 years)
areas, similar to our logged areas (last logged 3 to 6 years before data collection). Therefore, whilst
logged forests in the region do retain much of the mammal diversity of old-growth forest, logging
may in fact be having subtle but pervasive impacts on the diversity of mammals utilising resources
within any given forest patch, with unknown consequences for ecosystem functioning.
Small mammals, on the other hand, appeared to respond positively to logging, which is consistent
with the broader literature from across the tropics (Isabirye-Basuta & Kasenene, 1987; Lambert et al.,
2006). Small mammals may be resilient to logging due to their apparently high dietary flexibility
(Langham, 1983; Munshi-South et al., 2007) and to the greater availability of their preferred

Chapter 3: Mammalian species richness and β-diversity across a tropical land-use gradient
88
microhabitats post-logging (Cusack et al., 2015). Small mammal communities in old-growth habitats
are also likely constrained by supra-annual cycles of mast-fruiting in dipterocarp forests, in contrast to
more consistent food resources in logged forests (Curran & Leighton, 2000; Brearley et al., 2007;
Munshi-South et al., 2007).
Oil palm mammal communities were highly depauperate for both large and small mammals at all
spatial grains, even when including non-native species and species occurring in plantation margins.
This finding agrees with studies of a range of other taxa (Foster et al., 2011), as well as a small
number of published and unpublished mammal studies (Scott & Gemita, 2004; Maddox et al., 2007;
Rajaratnam et al., 2007; Bernard et al., 2009; Puan et al., 2011), and underlines the grave threat to
wildlife populations that oil palm expansion represents (Koh & Wilcove, 2008; Wilcove et al., 2013).
This is especially the case given that our results likely represent something of a best-case scenario for
oil palm biodiversity: plantations were in close proximity to a large block of well-protected forest,
riparian forest margins existed in the broader landscape and hunting levels were relatively low (only
three incidences of hunting activity were photographed in 3,104 camera trap nights).
We hypothesised that logged forest would be more environmentally heterogeneous than old-growth
forest, giving rise to higher β-diversity (HI). We found that the β-diversity signal was more strongly
evident in logged forests compared to the other land-uses consistently only at the smallest grains,
though small mammal communities showed a stronger signal of β-diversity in logged forest compared
to the other land-uses at more coarse spatial grains as well. This appears to match with the spatial
grain of heterogeneity imparted by the logging process: felling of individual dipterocarp trees usually
creates initial canopy gaps of less than 600 m2 (Sist et al., 2003) and these gaps are mostly less than
10 m in length (i.e. 100 m2) after a decade or more of regeneration (Cannon et al., 1994; Bebber et al.,
2002). In contrast, gaps are rare in old-growth forest, typically occupying less than 1% of forest area
(Sist et al., 2003). Other forms of disturbance – e.g. the creation of skid-trails, roads and log landings
– also impart heterogeneity at a more coarse grain than the felling process, as does variation among

Chapter 3: Mammalian species richness and β-diversity across a tropical land-use gradient
89
logging compartments in the intensity of extraction (Cannon et al., 1994), which may be of an order
of magnitude (Berry et al., 2008). For small mammals, which show strong preferences for specific
microhabitats (Cusack et al., 2015), this latter source of environmental heterogeneity may have driven
the strong signal of β-diversity we observed at larger spatial grains. Note, however, that small
mammal β-diversity at the block level was primarily driven by nestedness rather than turnover in
logged forest, which may suggest that the processes of local extinction and dispersal limitation may
also be important at this scale. For large mammals, communities may not respond as strongly to forest
structure per se, and the greater homogeneity at coarse grains may reflect the greater homogeneity of
tree communities in logged forest at coarse grains, overwhelmingly dominated by a single pioneer
species, Macaranga pearsonii, in this forest.
We also hypothesised that oil palm would be environmentally homogeneous, giving rise to lower β-
diversity (HII). Oil palm communities, overall, were more homogeneous than forest, but this was not
consistently the case: large mammal communities at the block level showed a stronger β-diversity
signal in oil palm compared to logged forest. This was likely due to the substantial differences in
management practices between blocks – for example in the year of planting and the extent of
undergrowth clearance – and, perhaps more crucially, due to differences in the proximity to forest
across blocks. β-diversity in oil palm was also generated comparatively more by nestedness than in
the other land-uses.
Our final hypothesis was that small mammal communities would be more dispersal-limited than large
mammal communities, and would therefore show higher levels of β-diversity (HIII). Support for this
hypothesis was only found at the block level in logged forest and large mammals otherwise showed a
stronger signal of β-diversity. Given the greater dispersal abilities expected of larger bodied mammals
(Sutherland et al., 2000), this does not suggest a primary role for local-scale dispersal limitation in the
assembly of communities in these systems, and niche-based assembly may prevail. We do note,
however, that a greater proportion of β-diversity was driven by nestedness in small mammals than

Chapter 3: Mammalian species richness and β-diversity across a tropical land-use gradient
90
large mammals, especially at the largest spatial grain, which is consistent with the idea of greater
dispersal limitation in this group (albeit not sufficiently high to drive stronger β-diversity patterns in
small mammals overall).
Our findings have implications for the management and conservation of mammal biodiversity at local
scales. In the context of logging, our results point to the importance of spatial heterogeneity,
particularly at fine grains, in maintaining the diversity of mammal communities at similar levels to
old-growth forest. Small mammal diversity may also be increased by heterogeneity in forest structure
at larger spatial grains, but the high levels of nestedness at this scale also suggests that populations
could benefit from interventions to increase connectivity amongst populations. For large mammals,
heterogeneity in forest structure at larger spatial grains was apparently less important, and the
maintenance instead of floristically diverse areas of old-growth forest may have greater benefits for
large mammal diversity. In the context of plantation landscapes, our findings point to the key role that
the maintenance of heterogeneity could play in improving biodiversity values, for example by
deliberately varying the year of planting across coupes within a concession and, more importantly, by
retaining forested areas in the broader landscape.
An understanding of β-diversity patterns is essential for the effective identification of HCV set-aside
in forest landscapes. In Southeast Asia, these forest landscapes are overwhelmingly composed of
logged and degraded forest (Margono et al., 2012; Bryan et al., 2013), and HCV assessments are
made in the context of re-entry logging under sustainable certification or conversion to tree plantation.
Typically ~10% or more of a concession may be considered for set-aside (WWF-Malaysia, 2009), in
patches of approximately 30 ha (Tawatao et al., 2014) or more. Given this, our results suggest that the
specific placement of set-aside for the conservation of large mammal communities, which we have
shown are homogeneous in logged forest at spatial grains < 30 ha, will be less critical and we would
tentatively suggest an approach of maximising the size of set-aside patches. Such patches, even when
isolated from surrounding natural forest, may have considerable value for mammals (McShea et al.,

Chapter 3: Mammalian species richness and β-diversity across a tropical land-use gradient
91
2009; Bernard et al., 2014). For small mammals on the other hand, logged forest communities showed
substantial heterogeneity at the scale of conservation set-aside, which may favour a distributed
network of patches. Although the long-term viability of these meta-populations is largely unknown,
patches would ideally be connected, for example by riparian margins, and positioned according to
robust HCV baseline surveys. Trade-offs in the most effective spatial arrangement of conservation
areas often exist between different species groups (Schwenk & Donovan, 2011), and our findings for
large and small mammals suggest that a diversified strategy including a small number of large patches
and a network of smaller stepping-stone patches would be necessary for the conservation of both
groups. These recommendation for large and small mammals are supported by simulation studies,
albeit of sessile taxa, of randomly-occurring and aggregated species communities undergoing logging,
in which a single large set-aside patch was optimal for maximising yield and biodiversity in the case
of homogeneous communities, but multiple smaller reserves were favoured for aggregated
communities (Potts & Vincent, 2008). We should underline that our results are relevant for set-aside
at the local-scale, for example of a single concession, and a different approach may be necessary at
the regional scale of large forest management units or other administrative regions.
We have shown that diversity responses are strongly grain-dependent and that patterns of β-diversity
at each spatial grain play a fundamental role in this. Better forecasting of local-scale responses to
land-use will require consideration of this grain-dependency. Our data also suggest that management
decisions taken at the local scale, including optimising the spatial arrangement of conservation set-
aside, may be made more effective by considering patterns of β-diversity. Given the increased uptake
of sustainable forestry principles, in particular FSC, in the management of logged forests in the region
(Dennis et al., 2008), as well as rising membership of the RSPO and other crop certification schemes
(Edwards et al., 2012), it is now critical that the scientific underpinnings of HCV are improved, and
this should include consideration of β-diversity at a range of spatial grains.

Chapter 3: Mammalian species richness and β-diversity across a tropical land-use gradient
92
Appendices
Appendix A – Detailed study site descriptions
The Maliau Basin Conservation Area (1,054 km2 including the buffer zone), one of the last remaining
examples of lowland undisturbed habitat in the region (Reynolds et al., 2011), represented our old-
growth control site. The sampled area consisted mostly of pristine hill forest, dominated by
dipterocarps including Shorea johorensis, Dryobalanops lanceolata and Parashorea melaanonan.
One-third of the sampled sites (lying within the buffer zone) were in a water catchment that had been
subjected to low levels of ironwood (Eusideroxylon zwageri) extraction in the 1970s and 1990s; some
old skid-trails were present in the area, though the structure and community composition of the
canopy and understorey were comparable to the surrounding unlogged forest (Ewers et al., 2011).
Part of the Kalabakan Forest Reserve (2,240 km2), the SAFE Project experimental area (94 km2
including a Virgin Jungle Reserve) represented our logged forest site. This was connected to a large
(> 1 million ha) area of logged forest to the north and was otherwise surrounded by oil palm
plantations. Similar to our old-growth forest site, the SAFE Project experimental area was composed
of hill dipterocarp forest, but had been affected by multiple, intense rounds of extraction, beginning in
1978 (Chong et al., 2005). Logging ended as recently as 2008, by which time timber restrictions had
been lifted in anticipation of future clearance, and a total of 179 m3 ha-1 had been removed from the
area (Yayasan Sabah, unpublished data). This land-use history, in combination with topographical
constraints on access, means there was substantial spatial variability in the intensity and timing of
logging, as well as the methods used (tractor-based and cable yarding), creating a highly
heterogeneous forest landscape. There were few old-growth trees remaining, and pioneer species such
as Macaranga pearsonii, M. hypoleuca and Neolamarckia cadamba were dominant. Indeed, M.
pearsonii alone formed ~10% of tree basal area (SAFE Project, unpublished data). In addition,
logging created a network of regenerating skid trails, roads of varying width and heavily degraded

Chapter 3: Mammalian species richness and β-diversity across a tropical land-use gradient
93
log-landing areas, which means there were also some areas of grassland and low scrub, often
containing non-native shrubs including Clidemia hirta and Chromolaena odorata.
Our oil palm sites were spread across two neighbouring plantation estates: Selangan Batu estate
(operated by Benta Wawasan Sendirian Berhad) and Mawang estate (operated by Sabah Softwoods
Sendirian Berhad). Oil palms within the Selangan Batu estate were mostly planted in 2006 and were
1-4 m in height, forming a discontinuous canopy. Oil palms within the Mawang estate were mostly
planted in 2000, with some trees up to 10 m in height and forming a continuous canopy layer. Palms
in both estates were planted with approximately 10 m separation. Understorey communities within the
plantations consisted of various grasses, ferns, other herbs such as Ageratum conyzoides, and vines,
including the highly invasive Mikania cordata (T. Döbert, personal communication). Herbicide use in
the plantations meant that the area directly around each palm was bare in most cases, but there was
otherwise substantial variation in the extent of understorey growth. In the older plantations, where the
canopy was unbroken, much of the ground was bare except for the oil palm fronds which are cut
during harvesting and stacked between the rows of palms. Some small areas within the younger
plantations had been planted with seedlings of subsistence crops, or had been burned in anticipation of
doing so. Small riparian buffers of degraded logged forest existed in the broader landscape, as well as
a 45 km2 block of logged forest (managed by the Sabah Forestry Department) immediately to the west
of the sampling points. Interviews with the estate managers indicated that there were no active rodent
control programmes operating in the plantations (W. Lojinin, personal communication; R. Hussein,
personal communication), with no recent use of rodenticide or biocontrol by barn owls (Tyto alba
javanica).
Chapter 3: Mammalian species richness and β-diversity across a tropical land-use gradient
94
Appendix B - Quantifying β-diversity
β-diversity patterns remain poorly characterised at least in part because of uncertainty surrounding
how to define β-diversity (Tuomisto, 2010) and how best to measure it (Jost, 2007; Baselga, 2010a;
Chao et al., 2012; Legendre & De Cáceres, 2013). β-diversity may be separated into those
components which vary due to sampling effects, including the effects of sampling extent (Soininen et
al., 2007b), grain (Mac Nally & Fleishman, 2004; Steinbauer et al., 2012; Olivier & Aarde, 2014),
replication (Crist & Veech, 2006; Chao et al., 2012) and sample completeness (Cardoso et al., 2009;
Beck et al., 2013), and those components which vary depending on the assembly of communities,
including patterns of species abundance, occupancy, co-occurrence and intraspecific aggregation
(Veech et al., 2003; Veech, 2005). It is these latter components that are typically of interest to
researchers.
In the context of diversity partitioning, there is the additional problem that β-diversity is calculated
using values for α- and γ-diversity, and as a result there has been a recurring debate about whether β-
diversity calculated in this way is truly independent (Jost, 2007, 2010; Baselga, 2010b; Ricotta, 2010;
Veech & Crist, 2010a, 2010b). Chao et al. (2012) recently synthesised this debate, showing
conclusively that neither additive β-diversity (= γ-α) nor multiplicative β-diversity (= γ/α) are free of
this dependence, and recommended a normalisation to overcome this. However, it remains unclear
whether sampling effects on α- and γ-diversity are completely controlled for using this normalisation.
The effects of the sampling process, as well as the size of regional species pools (Lessard et al., 2012),
can be accounted for by comparing observations with a null model which specifically includes these
details (Crist et al., 2003; Kraft et al., 2011). Any differences between observations and the null model
which remain are taken to be indicative of non-random processes that were excluded from the null
model, for example community assembly processes. This is the approach we chose to use here (see
the Methods for more details).

Chapter 3: Mammalian species richness and β-diversity across a tropical land-use gradient
95
β-diversity sensu lato includes community variance due both to the turnover of species and due to
variation in species richness independent of turnover, i.e. the nestedness of communities. Baselga
(2007, 2010a) and others (for a review see Legendre, 2014) have argued for a separation of turnover
and nestedness and for β-diversity sensu stricto to be measured independently of the effects of
nestedness. The predominance of turnover or nestedness in communities is related to the assembly
processes at work. For example, niche assembly and random community drift will often be
responsible for patterns of turnover at local scales, whilst differential dispersal capacities and selective
extinction are more likely to create nested communities across space. The distinction between
turnover and nestedness is particularly important in the context of conservation set-aside; if β-
diversity is driven by species turnover, a distributed network of set-aside patches would be required to
ensure representation of all species, whilst if β-diversity is completely driven by nestedness patterns,
the optimal solution would simply be to prioritise the conservation of the most diverse forest patches
(most often, these will be areas with highest habitat quality for the given taxonomic group overall).
Following the approach of Baselga (2010a), we therefore separated observed β-diversity into its
turnover and nestedness components (more details on this approach are given in the Methods).

Chapter 3: Mammalian species richness and β-diversity across a tropical land-use gradient
96
Appendix C – Supplementary results
Figure C1. Sample-based species accumulation curves across land-use types, based on a Bernoulli product model (Colwell et al., 2012). Only data from sampling points which were both camera-trapped and live-trapped were used. Solid lines show interpolated values, whilst dashed lines show extrapolated values. Filled circles show the observed γ-diversities.

Chapter 3: Mammalian species richness and β-diversity across a tropical land-use gradient
97
Table C1. Observed and estimated γ-diversity across land-use types. Species group Land-use Dataset γobserved γACE
a 95% CI Mammals Old-growth forest Locations both camera- and live-trapped 42 46.7 42.0 - 52.7
Logged forest Locations both camera- and live-trapped 51 52.4 51.0 - 59.1
Oil palm plantation Locations both camera- and live-trapped 21 33.9 28.2 - 39.5
Oil palm cropb Locations both camera- and live-trapped within oil palm crop 18 27.1 22.2 - 32.0
Large mammals Old-growth forest All camera trap locations 30 31.8 30.0 - 36.8
Logged forest All camera trap locations 32 33.0 32.0 - 38.2
Oil palm plantation All camera trap locations 18 27.8 22.6 - 32.9
Oil palm cropb All camera trap locations within oil palm crop 17 28.7 23.6 - 33.9
Old-growth forest Locations both camera- and live-trapped 30 31.8 30.0 - 36.8
Logged forest Locations both camera- and live-trapped 30 30.3 30.0 - 35.4
Oil palm plantation Locations both camera- and live-trapped 17 23.7 18.9 - 28.5
Oil palm cropb Locations both camera- and live-trapped within oil palm crop 16 24.5 19.7 - 29.4
Small mammals Old-growth forest All live trap locations 11 13.2 11.0 - 16.6
Logged forest All live trap locations 21 21.5 21.0 - 25.5
Oil palm plantation All live trap locations 4 4.8 4.0 - 6.8
Oil palm cropb All live trap locations within oil palm crop 2c
Old-growth forest Locations both camera- and live-trapped 12 16.7 13.0 - 20.3
Logged forest Locations both camera- and live-trapped 21 22.2 21.0 - 26.4
Oil palm plantation Locations both camera- and live-trapped 4 12.8 9.7 - 15.8
Oil palm cropb Locations both camera- and live-trapped within oil palm crop 2 3.1 2.0 - 4.6
aEstimates of minimum asymptotic richness calculated using the Abundance-based Coverage Estimator (ACE). See Gotelli & Chao (2013). bExcluding sampling locations within scrub habitat at the oil palm plantation margins. cInsufficient data to estimate asymptotic minimum richness.

Chapter 3: Mammalian species richness and β-diversity across a tropical land-use gradient
98
Table C2. Observed α-diversity and model estimates of standardised α-diversity across land-use types. Species group Land-use Dataset αobserved
a αstandardisedb 95% CI
Mammals Old-growth forest Locations both camera- and live-trapped 7.21 7.60 6.53 - 8.83
Logged forest Locations both camera- and live-trapped 8.19 9.29 7.68 - 11.24
Oil palm plantation Locations both camera- and live-trapped 3.29 3.19 2.42 - 4.21
Oil palm cropc Locations both camera- and live-trapped within oil palm crop 3.22 3.16 2.39 - 4.17
Large mammals Old-growth forest All camera trap locations 5.99 6.07 4.94 - 7.45
Logged forest All camera trap locations 4.94 4.91 3.75 - 6.42
Oil palm plantation All camera trap locations 3.00 2.91 2.12 - 3.98
Oil palm cropc All camera trap locations within oil palm crop 2.97 2.91 2.12 - 3.99
Old-growth forest Locations both camera- and live-trapped 5.99 5.95 5.04 - 7.02
Logged forest Locations both camera- and live-trapped 4.77 4.53 3.66 - 5.60
Oil palm plantation Locations both camera- and live-trapped 3.13 2.96 2.19 - 3.99
Oil palm cropc Locations both camera- and live-trapped within oil palm crop 3.09 2.96 2.20 - 4.00
Small mammals Old-growth forest All live trap locations 0.53 0.45 0.30 - 0.69
Logged forest All live trap locations 2.66 2.72 1.62 - 4.57
Oil palm plantation All live trap locations 0.10 0.08 0.04 - 0.16
Oil palm cropc All live trap locations within oil palm crop 0.10 0.07 0.04 - 0.14
Old-growth forest Locations both camera- and live-trapped 1.21 1.14 0.95 - 1.36
Logged forest Locations both camera- and live-trapped 3.42 5.34 4.32 - 6.61
Oil palm plantation Locations both camera- and live-trapped 0.16 0.29 0.15 - 0.59
Oil palm cropc Locations both camera- and live-trapped within oil palm crop 0.13 0.23 0.11 - 0.51
aMean observed α-diversity across sampling points. bStandardised to 90% sample coverage (Chao & Jost, 2012). Estimates are from mixed-effects models and include shrinkage. cExcluding sampling locations within scrub habitat at the oil palm plantation margins.

Chapter 3: Mammalian species richness and β-diversity across a tropical land-use gradient
99
Table C3. β-diversity differences from null models across land-use types and spatial grains.
Species group Land-use Spatial grain β-diversity difference
from null 95% CIa
Mammals Old-growth forest βpoint 1.54 1.40 - 1.69
βplot 1.64 1.06 - 2.49
βblock 1.41 0.49 - 2.82
Logged forest βpoint 2.26 2.12 - 2.41
βplot 1.45 0.76 - 2.08
βblock 1.75 0.50 - 2.84
Oil palm βpoint 0.82 0.64 - 0.99
βplot 0.60 0.20 - 1.04
βblock 0.50 -0.01 - 0.99
Large mammals Old-growth forest βpoint 0.67 0.60 - 0.75
βplot 0.58 0.16 - 1.05
βblock -0.17 -0.67 - 0.33
Logged forest βpoint 0.86 0.77 - 0.96
βplot 0.63 0.26 - 1.01
βblock 1.40 0.48 - 2.14
Oil palm βpoint -0.01 -0.01 - 0.01
βplot -0.06 -0.11 - 0.05
βblock 0.00b 0.00 - 0.00
Small mammals Old-growth forest βpoint 0.87 0.75 - 1.00
βplot 1.05 0.66 - 1.55
βblock 1.51 0.68 - 3.01
Logged forest βpoint 1.39 1.28 - 1.50
βplot 0.78 0.32 - 1.32
βblock 0.34 -0.65 - 1.35
Oil palm βpoint 0.83 0.68 - 0.99
βplot 0.65 0.12 - 1.12
βblock 0.52 0.04 - 1.04
aConfidence intervals calculated as the quantiles of the distribution of difference from null values across simulations. bAll null simulations returned the same β-diversity as the observed case, likely caused by a sparse dataset in this case.

Chapter 3: Mammalian species richness and β-diversity across a tropical land-use gradient
100
Appendix D – Mammal species list
Table D1. Order, scientific name and common name of mammal species detected by camera-trapping and live-trapping surveys in the Maliau Basin Conservation Area (including the Maliau Basin Buffer Zone Forest Reserve), Kalabakan Forest Reserve and nearby oil palm plantations (Selangan Batu and Mawang estates). Species Common name Old-growth forest Logged forest Oil palm Erinaceomorpha
Echinosorex gymnura Moon rat Pholidota Manis javanica Sunda pangolin Carnivora Prionailurus bengalensis Leopard cat Pardofelis badia Bay cat Pardofelis marmorata Marbled cat Neofelis diardi Sunda clouded leopard Diplogale hosei Hose's civet Hemigalus derbyanus Banded civet Paguma larvata Masked palm civet Paradoxurus
h h di Common palm civet
Arctictis binturong Binturong Viverra tangalunga Malay civet Prionodon linsang Banded linsang Herpestes semitorquatus Collared mongoose Herpestes brachyurus Short-tailed mongoose Canis familiaris Domestic dog Helarctos malayanus Sun bear * Mydaus javanensis Sunda stink badger Martes flavigula Yellow-throated marten Mustela nudipes Malay weasel Aonyx cinereus Oriental small-clawed otter Cetartiodactyla Sus barbatus Bearded pig Tragulus napu Greater mouse-deer Tragulus kanchil Lesser mouse-deer Muntiacus atherodes Bornean yellow muntjac Muntiacus muntjak Red muntjac Rusa unicolor Sambar deer Bos javanicus Banteng Scandentia Ptilocercus lowii Pen-tailed treeshrew Tupaia minor Lesser treeshrew Tupaia gracilis Slender treeshrew Tupaia longipes Plain treeshrew Tupaia tana Large treeshrew * Tupaia dorsalis Striped treeshrew Primates Cephalopachus bancanus Western tarsier Presbytis rubicunda Maroon langur Macaca fascicularis Long-tailed macaque Macaca nemestrina Southern pig-tailed macaque Hylobates muelleri Bornean gibbon Pongo pygmaeus Orangutan Rodentia Lariscus hosei Four-striped ground squirrel Callosciurus prevostii Prevost's squirrel Callosciurus notatus Plantain squirrel * Callosciurus adamsi Ear-spot squirrel Exilisciurus exilis Least pygmy squirrel Sundasciurus lowi Low's squirrel

Chapter 3: Mammalian species richness and β-diversity across a tropical land-use gradient
101
Sundasciurus tenuis Slender squirrel Sundasciurus brookei Brooke's squirrel Sundasciurus hippurus Horse-tailed squirrel Rheithrosciurus macrotis Tufted ground squirrel Aeromys thomasi Thomas's flying squirrel Trichys fasciculata Long-tailed porcupine Hystrix brachyura Malay porcupine
Hystrix crassispinis Thick-spined porcupine Leopoldamys sabanus Long-tailed giant rat Sundamys muelleri Müller's rat Niviventer cremoriventer Dark-tailed tree rat Maxomys whiteheadi Whitehead's rat
Maxomys surifer Red spiny rat * Maxomys rajah Brown spiny rat Maxomys baeodon Small spiny rat Maxomys ochraceiventer Chestnut-bellied spiny rat Rattus exulans Polynesian rat Rattus rattus Black rat Proboscidea Elephas maximus Asian elephant *Records from scrub habitat at the oil palm plantation margins and not inside the oil palm crop itself.

Chapter 4: Drivers of mammalian community assembly across a tropical land-use gradient
102
Chapter 4:
Anthropogenic land-use change alters the ecological processes assembling tropical
rainforest mammal communities
Abstract
Relatively little is known about how drivers of community assembly change along environmental
gradients, including gradients which are due to anthropogenic drivers such as land-use change. In
addition, most previous research in this area has focussed on sessile taxa and has neglected groups of
high conservation concern, such as the vertebrates. Using concurrent camera- and live-trapping, we
investigated the local-scale processes assembling mammal communities along an environmental
gradient representing the principal trajectory of land-use in Borneo, including old-growth forest,
logged forest and oil palm plantations. We found that communities were assembled by a mixture of
niche and spatial processes – likely including dispersal limitation and, at fine scales, the home-ranges
of individuals – as well as community drift. The relative balance of these processes was not stable
across the land-use gradient, supporting the idea of a niche-neutrality continuum. Old-growth forest
communities were strongly spatially-structured, with important roles played by dispersal and broad-
scale environmental control, including coarse-grain variations in forest structure and topography. In
contrast, anthropogenic environments were not strongly spatially-structured, with more important
roles played by drift and logging-induced microhabitat variation in logged forest, and fine-scale
environmental control due to management practices in oil palm. Analysis of species co-occurrences
indicated that interactions, including competition, never exerted a strong effect on communities, but
what effect there was weakened along the land-use gradient. This suggests that environmental control
was predominantly due to the filtering of species by their environmental niche. We conclude that
anthropogenic disturbance may lead to novel mechanics governing the local assembly of
communities. An understanding of these mechanics for a broad range of organisms – both sessile and

Chapter 4: Drivers of mammalian community assembly across a tropical land-use gradient
103
motile – and ecosystems will be essential for testing and refining assembly theory, as well as for the
more effective conservation and management of highly-threatened natural systems.
4. 1. Introduction
The turn of this century saw the beginning of a resurgence of interest in community assembly in
ecology (HilleRisLambers et al., 2012). This was driven by new conceptual and mathematical models
of the mechanisms of assembly, including better integration of scale (Leibold et al., 2004) and
dispersal (Chave et al., 2002; Tilman, 2004). Perhaps most importantly, the emergence of neutral
theory (Bell, 2000; Hubbell, 2001) has brought the principle of parsimony in community ecology to
the fore and has challenged the discipline’s propensity for model proliferation rather than integration
(Lawton, 1999; Vellend, 2010). In addition, the last decade has seen the development of new
analytical tools to investigate the mechanisms of community assembly (Ovaskainen et al., 2010;
Wiens et al., 2010; Chase & Myers, 2011; Dray et al., 2012; Gotelli & Ulrich, 2012), as well as new
technology to collect community-wide biodiversity data in higher spatial and temporal resolutions
than has been possible before, even in the most challenging environments (Rowcliffe & Carbone,
2008; Turner, 2014).
Despite these developments in community assembly theory and data generation, there have been
relatively few empirical investigations of community assembly mechanisms to date, particularly for
non-sessile organisms. It is essential that new theoretical developments in community assembly are
confronted with empirical data from a wide range of organisms and ecosystems in order to inform the
next generation of models. Importantly, natural habitats across the globe, and in particular in the
tropics, are being subject to unprecedented rates of clearance and disturbance (Asner et al., 2009) and
it is critical that the anthropogenic component to community assembly is better understood and
integrated into models. This will require investigating community assembly along anthropogenic
environmental gradients. In this context, land-use change can be thought of as a large-scale natural
“experiment” which can reveal insights into community assembly processes along environmental
gradients which would otherwise be difficult to obtain (Lomolino & Perault, 2000). In addition to

Chapter 4: Drivers of mammalian community assembly across a tropical land-use gradient
104
theoretical insights, this will lead to better forecasts of the impacts of land-use change (Matias et al.,
2014) and more effective recommendations to policy-makers, industry and other stakeholders in order
to conserve biodiversity.
Two contrasting processes are generally thought to be dominant in community assembly at the local
scale: niche assembly and dispersal assembly. Niche assembly mechanisms have a long pedigree in
ecology (Grinnell, 1917; Elton, 1927; Hutchinson, 1957; Hardin, 1960; MacArthur & Levins, 1967)
and involve selection of species according to their fundamental environmental niche (the “abiotic
filter”), as well as small-scale interactions with competitors, mutualists and consumers (the “biotic
filter”). Niche assembly is generally viewed as deterministic, although stochasticity can play a role in
the outcome of niche assembly, as exemplified by priority effects and the effects of environmental
stochasticity (Weiher et al., 2011). Dispersal assembly refers to the stochastic assembly of a local
community by dispersal, i.e. by the movement of organisms across space (Vellend, 2010). Although
dispersal was recognised in some of the earliest models of community assembly, most notably in
island biogeography theory (Macarthur & Wilson, 1967), it has since become associated with the
unified neutral theory (Hubbell, 2001), in which dispersal is conceptually from the metacommunity
(Leibold et al., 2004). Contemporary assembly theory recognises that niche and dispersal assembly
processes are not mutually exclusive and that both may operate concurrently (Gravel et al., 2006;
Mutshinda & O’Hara, 2011). The challenge, therefore, is to identify the relative importance of these
two assembly mechanisms and how the balance might change in the face of anthropogenic drivers.
An important advance in this regard has been the development of analytical tools for specifically
dissecting the site-to-site variation in community composition, or β-diversity, as a function of
environmental and spatial components, using canonical ordination (Borcard et al., 1992; Borcard &
Legendre, 2002; Legendre et al., 2005; Peres-Neto et al., 2006). In this framework, the importance of
niche assembly can be inferred from the community variance explained in the ordination by the
environmental control component. In order to infer the importance of spatial processes, including
dispersal assembly, surrogate spatial variables representing positive spatial correlation can be used

Chapter 4: Drivers of mammalian community assembly across a tropical land-use gradient
105
during ordination. In this case, the variance explained will partly be due to spatially-structured
environmental variables, causing induced spatial dependence (Peres-Neto & Legendre, 2010), and it is
therefore necessary to factor out the environmental control component using variation partitioning.
The pure spatial component that remains, assuming all the important spatially-structured
environmental variables have been accounted for, represents the relative importance of contagious
spatial processes such as dispersal, as well as the home-ranging of individuals and positive biotic
interactions at small scales. Variation left unexplained by environmental control and space is likely
due to random community drift, as well as any unmeasured environmental variables (which are not
structured in space) and measurement error. In common with all other spatial modelling approaches,
this analytical method is not a direct test of causal processes. Nonetheless, it can lead to strong
mechanistic inferences when combined with clear a priori hypotheses and sound ecological
knowledge of the system under study (McIntire & Fajardo, 2009; Dray et al., 2012).
Niche assembly is generally characterised as involving both environmental filtering and species
interactions. In addition, the relative fitness differences between interacting species will often be a
function of the environment, potentially leading to complicated feed-backs between the two
components of niche assembly (Chesson, 2000; HilleRisLambers et al., 2012). Although species
interactions are generally thought to operate at smaller spatial scales than environmental filtering
(Soberón, 2007), the two components to niche assembly are otherwise difficult to separate on the
basis of spatial modelling alone. However, different classes of species interactions leave differing
signatures of co-occurrence in space and time and can, in combination with knowledge about the
strength of environmental control, allow for the testing of a priori hypotheses. In particular, ongoing
competition will often leave a signature of negative co-occurrence relationships between pairs of
species due to compensatory dynamics; a lack of negative co-occurrence relationships, despite
evidence for niche assembly in general, may therefore suggest a primacy of environmental filtering
over competition. Indeed, this has been the basis for a number of recent such assertions, based either
on species co-occurrence (Veech, 2006) or covariance (Houlahan et al., 2007; Volkov et al., 2009;
Mutshinda et al., 2009). Weak interspecific competition may increase the long-term stability of such

Chapter 4: Drivers of mammalian community assembly across a tropical land-use gradient
106
communities (Chesson, 2000), but a predominance of environmental filtering may increase the
sensitivity of communities to environmental change (Mutshinda et al., 2009).
Land-use change represents the principal threat to biodiversity in the tropics (Laurance et al., 2014b),
but we know very little about how assembly processes might change across environmental gradients
in general, let alone newly-emerging anthropogenic gradients. There is evidence that patterns of β-
diversity are altered by selective logging and conversion of forest to plantations (Berry et al., 2008;
Woodcock et al., 2011; Kitching et al., 2013; Chapter 3), and one explanation for these patterns is an
alteration in the balance of the underlying drivers of assembly. Logging greatly increases the
frequency and area of gap habitat in forests and may lead to increases in environmental heterogeneity
at the small scales at which individual trees are felled (Cannon et al., 1994). In parallel, logging may
lead to greater floristic homogeneity at larger scales, for example between logging coupes, with
disturbed areas typically becoming dominated by just a few pioneer species (Heydon & Bulloh, 1997;
Brearley et al., 2004). These changes wrought by logging may act as a strong environmental filter on
the composition of communities. In addition, it might be expected that the strength of species
interactions would be affected by disturbance (Tylianakis et al., 2008). For mammals, it has
previously been shown that diversity at small scales is significantly reduced by the intensive logging
typical in Southeast Asia (Brodie et al., 2015; Chapter 3). This may mean communities at small scales
are further from saturation than in old-growth forest, leading to weaker compensatory dynamics. This
dominance of environmental filtering over interactions may be more pronounced still in plantation
habitats, which drastically differ from pristine forest – in terms of structure, species composition,
resources and microclimate – and typically only host a depauperate subset of species (Aratrakorn et
al., 2006; Styring et al., 2011; Foster et al., 2011; Chapter 3).
Here we investigate the processes assembling mammal communities along an environmental gradient
of land-use change in the tropical forests of Borneo, including primary forest, logged forest and oil
palm (Elaeis guineensis) plantations. This land-use gradient represents the principal trajectory of land-
use change in Southeast Asia (Wilcove et al., 2013), with the majority of remaining forest in the

Chapter 4: Drivers of mammalian community assembly across a tropical land-use gradient
107
region now existing in a logged and degraded state (Gaveau et al., 2014) and conversion to oil palm
likely continuing at a rapid rate over the coming decades (Koh & Ghazoul, 2010a). We focussed on
the mammals owing to their highly threatened status in Southeast Asia (Sodhi et al., 2009b) and the
strong weighting they are often given in policy decisions surrounding land-use. Mammals are a
cryptic and mostly nocturnal group which occur at low densities and actively avoid human observers,
often resulting in datasets too sparse to investigate community assembly processes. To circumvent
these problems and generate robust community data, we used concurrent networks of camera traps
and live traps to sample almost the entire terrestrial mammal community, and expended much higher
levels of sampling effort than would be typical for other taxonomic groups. We had three competing
hypotheses about mammalian community assembly processes across the land-use gradient. The null
hypothesis was that mammal communities would mostly be assembled by neutral processes, including
dispersal and random drift, giving rise to a non-significant environmental control model and, owing to
the importance of drift, a low explanatory power of the overall environment-space model. The first
alternative hypothesis was that both niche and dispersal assembly would be important across all land-
uses, reflected in important portions of the community variance explained by environmental and
spatial variables, and that environmental filtering would be the dominant niche assembly process,
resulting in only weak evidence of competitive interactions in the form of negative co-occurrence
patterns. Our final competing hypothesis was that environmental filtering would become increasingly
more important than both dispersal and competitive interactions along the land-use gradient, resulting
in a relative increase in the variance explained by environmental variables and reduced evidence of
negative co-occurrence patterns.
4. 2. Methods
4. 2. 1. Sampling design
We sampled mammals in three different land-uses, taking advantage of the experimental design of the
Stability of Altered Forest Ecosystems (SAFE) Project in Sabah, Malaysian Borneo (Ewers et al.,
2011). This consists of old-growth forest within the Maliau Basin Conservation Area, repeatedly-
logged forest within the Kalabakan Forest Reserve and two adjacent oil palm plantations straddling

Chapter 4: Drivers of mammalian community assembly across a tropical land-use gradient
108
the Kalabakan Forest Reserve boundary (see Chapter 3 for more detailed descriptions of the study
sites).
We employed a clustered hierarchical sampling design, with individual sampling points clustered
together into 1.75 ha plots, and 3 to 6 plots in turn clustered into blocks (Fig. 1). This multi-scale
approach allowed for the investigation of fine-scale assembly processes, such as competition between
species, whilst also allowing for the investigation of larger-scale gradients in community composition
within a study site. Plots consisted of (4 x 12 =) 48 potential sampling points, separated by 23 m, of
which a random subset were chosen for sampling (mean number of points per plot = 14). Plots were
arranged together into blocks differently in the logged forest compared to the other two land-uses
(Fig. 1), so that they would overlay the locations of future experimental fragments in this study site
(Ewers et al., 2011). Separation distances between plots (170 to 290 m) and between blocks (0.6 to 3
km) were similar across the land-uses. The SAFE Project has been deliberately designed to minimise
confounding factors across the land-use gradient, including latitude, slope and elevation (Ewers et al.,
2011), and this applied equally to our sampling design for mammals.
Across the study sites, 430 points were sampled using both camera-trapping and live-trapping. These
were nested within 31 plots and 8 blocks (9 plots in 3 blocks for old-growth forest; 16 plots in 3
blocks for logged forest, and 6 plots in 2 blocks for oil palm). We excluded 12 points which had been
camera-trapped for less than seven days, giving a total sampling effort of 9,430 live trap nights and
19,116 camera trap nights (after correcting for camera failures). The sampling intensity was similar
across land-uses (mean trap nights per sampling point: 60 in old-growth forest; 78 in logged forest,
and 58 in oil palm).

Chapter 4: Drivers of mammalian community assembly across a tropical land-use gradient
109
Figure 1. Sampling design across logged forest (A), oil palm (B) and old-growth forest (C), showing the sampling points (in red) sampled using both camera traps and live traps. Clusters of sampling plots, i.e. sampling blocks, were arranged in the same spatial configuration in old-growth forest and oil palm, and were arranged to coincide with future experimental forest fragments in logged forest. Separation between points, plots and blocks was nonetheless similar across land-uses. Shaded areas lie outside the Kalabakan Forest Reserve, consisting of a 2,200 ha Virgin Jungle Reserve (Brantian-Tatulit) to the south and an extensive (>1 million ha) area of logged forest to the north (Mount Louisa Forest Reserve and other connecting reserves). Insets show the location within insular Southeast Asia and the spatial proximity of the three land-uses within south-east Sabah, Malaysian Borneo.
4. 2. 2. Field methods
We deployed camera traps (Reconyx HC500, Holmen, Wisconsin, USA) strictly within 5 m of each
randomly chosen sampling point, aiming to get as close as possible to each point (marked in the field
on a previous occasion), whilst avoiding major obstructions in the camera’s field of view. The random
deployment of cameras in this manner has rarely been used before, though it is essential for reducing
biases in species detection rates caused by non-random space-use by animals (Chapter 2). No bait or
lure was used, cameras used an infrared flash during night-time hours, and disturbance to vegetation
was kept to a minimum. Camera traps are continuous-time detectors, so we considered photographic
capture events to be independent if they a) contained different individuals or b) were separated by >
12 hours, which matched the approximate minimum separation between live trap events. Camera traps

Chapter 4: Drivers of mammalian community assembly across a tropical land-use gradient
110
were active between May 2011 and April 2014, during which most plots (28 of 31) were sampled
multiple times (mean effort per plot = 617 trap nights).
Small mammal trapping was conducted at the plot level, with two locally-made steel-mesh traps (18
cm wide, 10-13 cm tall and 28 cm in length) placed at or near ground level (0 - 1.5 m) within 10 m of
each of the 48 sampling points and baited with oil palm fruit. Here, however, we only use data from
the 418 points which were also sufficiently sampled using camera traps. Each session consisted of
seven consecutive trapping days and some plots (15 of 31) were sampled for multiple sessions over
the course of the study (mean effort per plot for the subset of points used in this analysis = 304 trap
nights). Traps were checked each morning and captured individuals were anaesthetised using diethyl
ether (following Wells et al. 2007), measured, permanently marked using a subcutaneous passive
inductive transponder tag (Francis Scientific Instruments, Cambridge, UK), identified to species using
Payne et al. (2007) and released at the capture location. Although we marked individuals, we here
used the number of detections of each species, since this better matches the protocol used for camera-
trapping. Trapping was carried out between May 2011 and July 2014, during which there were no
major mast-fruiting events.
4. 2. 3. Data analysis
We measured a range of environmental variables for each sampling point, which fell into three
distinct sets: 1) fine-scale habitat structure variables; 2) topographical variables, and 3) broader-scale
characteristics of the local landscape, including percent forest cover and a remotely-sensed measure of
above-ground live tree biomass within a 0.5 km radius (see Appendix A for full details of each
environmental variable). We expected these sets of variables to be inter-correlated and were interested
in the relative importance of each of these sets of factors, both independently and together, in the
overall environmental control model. This involved creating parsimonious redundancy analysis
(RDA) sub-models for each set of variables and then applying variation partitioning to the composite
model Y = f[E] + R = f[H + T + L] + R, where Y is the community response matrix, E is the

Chapter 4: Drivers of mammalian community assembly across a tropical land-use gradient
111
environmental component, R is a matrix of residuals, and H, T and L are, respectively, the habitat
structure, topography and landscape context variables.
Rather than use all available variables in each RDA sub-model, we applied the modified forward-
selection method of Blanchet et al. (2008) to select a parsimonious set of variables. This method uses
an unbiased estimate of explained variation, the adjusted coefficient of multiple determination (R2adj).
Inflated Type I error rates were prevented by applying a permutation test of the significance of the
saturated RDA model before forward-selecting in each case (Blanchet et al., 2008). In addition to
creating a set of three environmental RDA sub-models for the dataset as a whole, we also repeated
these analysis steps for each step along the land-use gradient and for large and small mammals
separately.
We constructed two sets of surrogate spatial variables, in order to model both fine-scale and broad-
scale spatial processes. Fine-scale positive spatial correlations were modelled using Moran’s
eigenvector maps (MEMs; Borcard & Legendre, 2002; Dray et al., 2006) based on the geographic
distances among sampling points (i.e. distance-based MEMs, or db-MEMs). We selected the db-
MEMs with positive eigenvalues, which model positive spatial correlations. MEMs represent a
spectral decomposition of the distances among points, for example sine-waves of different periods for
the specific case of regular sampling along a transect, and can potentially model spatial processes at
all scales perceivable in the sampling design (Borcard et al., 2004). The finest scale that can be
modelled is determined by the minimum distance connecting all points to their nearest neighbour. For
clustered sampling designs with large minimum distances, it is possible to create separate db-MEM
variables for each cluster and then assemble all variables into a single staggered matrix (Declerck et
al., 2011). We therefore created separate db-MEM variables for each block in our sampling design,
and the largest spatial processes modelled using these variables are at the block scale. We also
augmented the set of geographic coordinates for each block with a small number of supplementary
points (between 5 and 10 per block; 12% of the total) to fill in the widest gaps between plots, which
were then removed before RDA modelling (Borcard & Legendre, 2002; Borcard et al., 2004). This

Chapter 4: Drivers of mammalian community assembly across a tropical land-use gradient
112
causes a slight loss of orthogonality between db-MEM variables, but allowed for the modelling of
fine-scale spatial processes, giving minimum distances of between 67 and 76 m.
Broader-scale spatial processes, such as those between blocks, were modelled using surrogate trend-
surfaces (Borcard et al., 1992). For each land-use, orthogonal trend-surface variables representing
linear gradients and saddle-shaped responses were created using 1st- and 2nd-order polynomial
functions of the geographic coordinates. As with the db-MEM variables, we assembled the trend-
surface variables for each land-use into a single staggered matrix for RDA modelling.
We treated the two sets of spatial variables – db-MEM and trend-surface variables – in the same way
as our sets of environmental variables, by submitting each to the modified forward selection method
to create parsimonious RDA sub-models. The selected variables were then entered into the model Y =
f[S] + R = f[F + B] + R, where S is the spatial component that is subjected to variation partitioning, to
calculate the independent and shared portions of the variation explained by the fine-scale (F) and
broad-scale (B) spatial processes.
To make inferences about the relative importance, overall, of environmental control and space in
assembling mammal communities, we defined a global environmental control RDA model and a
global spatial RDA model for input into variation partitioning. These global models contained the
variables selected in the respective sub-models, such that Y = f[E + S] + R = f[(H + T + L) + (F + B)]
+ R. For the environmental control model, we also tested if adding land-use as a categorical variable
(LU) explained a significant additional portion of the variance not captured by the selected
environmental variables. Although land-use explained just 1.8% of the variance independently,
suggesting that our measured environmental variables successfully captured the environmental
gradient, we found that this fraction was nonetheless significant using a permutation test (F(2, 397) =
5.82, p < 0.001) and therefore added land-use to the global environmental control model, such that Y
= f[(E + LU) + S] + R = f[((H + T + L) + LU) + S] + R. We also created environmental control and
spatial RDA models for each land-use and for large (> 1 kg body mass) and small mammals

Chapter 4: Drivers of mammalian community assembly across a tropical land-use gradient
113
separately, and subjected each of these to variation partitioning. This allowed us to explore the
relative importance of environment and space in each land-use and for the two species groups. We
tested for significant differences in the variation explained overall, explained by environment and
explained by space in each case, using a bootstrap procedure (Peres-Neto et al., 2006).
RDA models in each case were fitted to Hellinger-transformed community matrices, with mammal
detections per seven days summed over the camera- and live-trapping protocols. Raw species data is
inappropriate for use in RDA, and the commonly-used Hellinger transformation, which divides by the
total abundance at a site and then takes the square-root (therefore dampening the effect of extremely
abundant species), has previously been shown to have desirable properties in the context of RDA
(Legendre & Gallagher, 2001). Detection probabilities likely vary across species and across the two
protocols, but we do not expect that this will substantially affect the relative sizes of the variance
fractions explained by environment and space, although imperfect detection could inflate the
unexplained variance in all cases. The Hellinger transformation is asymmetrical, meaning that species
absences, which could be a result of non-detection rather than lack of presence, have a lower
influence on the coefficient than presences. This transformation also does not give undue weight to
rare species (Legendre & Gallagher, 2001). Our use of random sampling locations controls for the
biases due to trap placement which are common in camera-trapping studies (Chapter 2).
We investigated co-occurrence patterns among species within each land-use using new probabilistic
models (Veech, 2013), which avoid the need for much-debated data randomisation algorithms and
comparison with null distributions (Gotelli & Ulrich, 2012). Instead, the probabilistic approach uses
the hypergeometric distribution to calculate the probability that two species co-occur either less or
more often than expected based on their mean incidence probabilities (Griffith et al., 2014). Using the
observed co-occurrence frequencies and a specified alpha level (in this case, α = 0.05), species co-
occurrences were then classified as significantly positive or negative, or occurring at random. Random
co-occurrence patterns can potentially be generated both by genuine non-association between species
or by a lack of statistical power. We had a relatively large number of sites within each land-use (56 to

Chapter 4: Drivers of mammalian community assembly across a tropical land-use gradient
114
213) and high sampling effort, with simulations suggesting that in this case models would typically
have very high power to detect any deviations from random co-occurrence of approximately > 5% of
the total number of sites. Following Veech (2013), we did not analyse species pairs with expected co-
occurrence frequencies < 1. We did not divide the mammal community into guilds of putatively
interacting species, in part because there was scant prior information available on the interactions
among Bornean mammals, but also because we were interested in a community-wide assessment of
the co-occurrence patterns across land-uses.
All analyses were done in R version 3.1.0 (R Core Team 2014), using the additional packages vegan
2.0-10 (Oksanen et al., 2013), PCNM 2.1-2 (Legendre et al., 2013) and cooccur 1.0 (Griffith et al.,
2014).
4. 3. Results
We obtained 1,237 live captures of 20 species and 10,464 photo-captures of 56 species over the
locations sampled using both trapping methods. Fifteen species were captured using both methods,
giving a total of 61 mammal species detected. Occurrence rates for individual species ranged from 77
% of sampling points for the red muntjac (Muntiacus muntjak) to just one point for five species (mean
occurrence = 12%). Overall trapping rates were similar for old-growth and logged forest (0.47 and
0.38 captures per trap night, respectively), but lower in oil palm (0.19).
Environmental and spatial variables together explained 33% of the community variance in the overall
RDA model (Fig. 2). The two sets of variables explained a similar portion of the variance (95% CI of
the difference: -0.03 – 0.03, p = 0.776), though a large portion was shared between them (49% of the
total explained variation).

Chapter 4: Drivers of mammalian community assembly across a tropical land-use gradient
115
Figure 2. Overall variation partitioning of the mammal community composition data, separated into variation explained by a) local habitat characteristics only, and local habitat in combination with land-use, b) spatial processes (represented by spatial surrogate variables) and c) environmental control (local habitat and land-use) and spatial processes together. Percentage values represent the adjusted coefficient of multiple determination (R2
adj) calculated using redundancy analyses. Values lying outside the area of the Euler diagrams represent the percentage variation left unexplained in each case.
Community variation in absolute terms was broadly similar across the land-uses (Var[YOld-growth] =
0.57; Var[YLogged] = 0.58; Var[YOil palm ] = 0.53). In old-growth forest, space explained significantly
more of the variation than environment (95% CI of the difference: 0.05 – 0.14, p < 0.001), with 90%
of the variation explained by environment being spatially-structured (Fig. 3). Only a small, albeit
significant, fraction of the variation was explained by pure environmental control (F(12, 112) = 1.34, p <
0.01). In logged forest, just 14% (95% CI: 10 – 19%) of the total variance was explained, much lower
than for old-growth forest (33%, 95% CI: 27 – 39%) and oil palm (30%, 95% CI: 15 – 46%).
However, the independent environmental and spatial components were still significant (environment:
F(10, 179) = 1.90, p < 0.001; space: F(16, 179) = 1.91, p < 0.001). The variance explained by environmental
and spatial variables was not significantly different for logged forest communities (95% CI of the
difference: -0.06 – 0.01, p = 0.17). In oil palm, 86% of the variation was explained by environmental
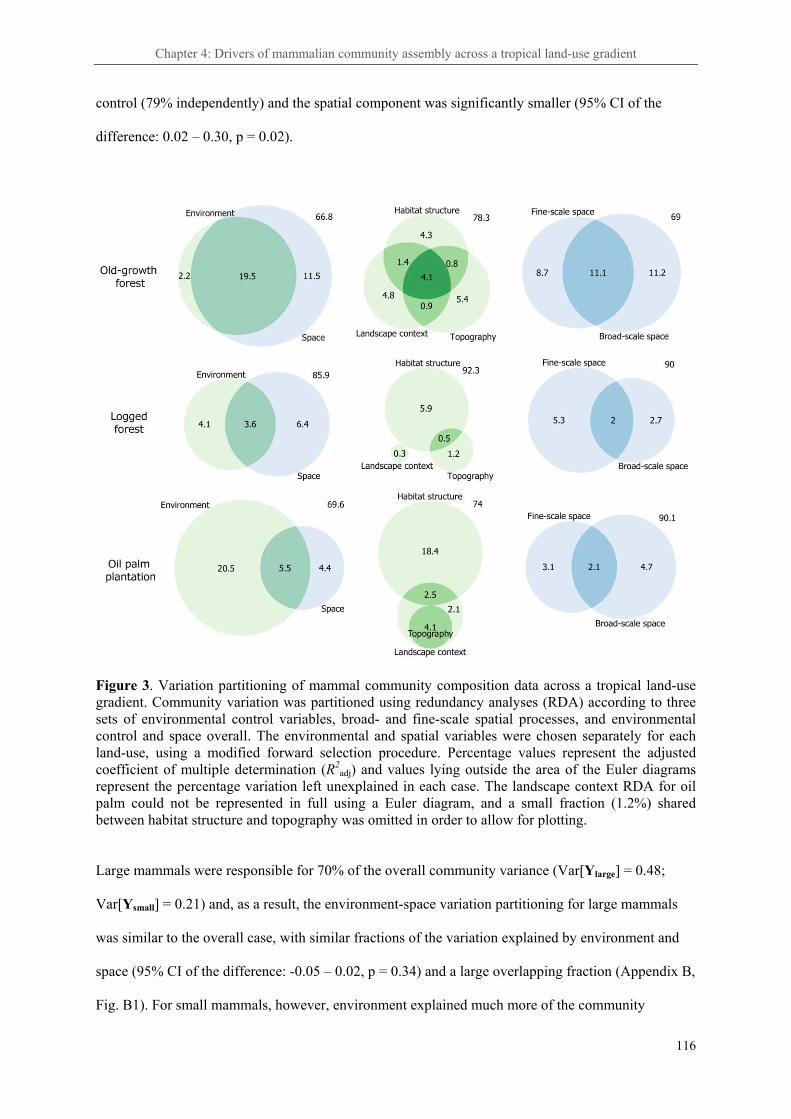
Chapter 4: Drivers of mammalian community assembly across a tropical land-use gradient
116
control (79% independently) and the spatial component was significantly smaller (95% CI of the
difference: 0.02 – 0.30, p = 0.02).
Figure 3. Variation partitioning of mammal community composition data across a tropical land-use gradient. Community variation was partitioned using redundancy analyses (RDA) according to three sets of environmental control variables, broad- and fine-scale spatial processes, and environmental control and space overall. The environmental and spatial variables were chosen separately for each land-use, using a modified forward selection procedure. Percentage values represent the adjusted coefficient of multiple determination (R2
adj) and values lying outside the area of the Euler diagrams represent the percentage variation left unexplained in each case. The landscape context RDA for oil palm could not be represented in full using a Euler diagram, and a small fraction (1.2%) shared between habitat structure and topography was omitted in order to allow for plotting.
Large mammals were responsible for 70% of the overall community variance (Var[Ylarge] = 0.48;
Var[Ysmall] = 0.21) and, as a result, the environment-space variation partitioning for large mammals
was similar to the overall case, with similar fractions of the variation explained by environment and
space (95% CI of the difference: -0.05 – 0.02, p = 0.34) and a large overlapping fraction (Appendix B,
Fig. B1). For small mammals, however, environment explained much more of the community

Chapter 4: Drivers of mammalian community assembly across a tropical land-use gradient
117
variation than space (95% CI of the difference: 0.06 – 0.17, p < 0.001), and the majority of this (69%)
was not spatially-structured (Appendix B, Fig. B1).
The measured environmental variables successfully captured the environmental gradient across the
land-uses, with environmental and community separation between the land-uses evident in ordination
space (Fig. 4). The relative importance of each set of environmental variables for structuring
communities within land-uses differed markedly (Fig. 3). Fine-scale habitat structure was an
important independent component in all land-uses (old-growth forest: F(6, 143) = 2.35, p < 0.001;
logged forest: F(7, 195) = 2.83, p < 0.001; oil palm: F(6, 45) = 3.08, p < 0.001). Habitat in the broader
landscape was also important in old-growth forest, both in combination with fine-scale habitat
structure and also independently (F(6, 143) = 2.35, p < 0.001), but was only important in oil palm in
combination with topography (F(4, 45) = 1.72, p = 0.01) and not independently (F(3, 45) = 1.29, p = 0.16).
Landscape context was found to be entirely unimportant for logged forest communities (F(1, 204) =
1.25, p = 0.31). Topography was important mostly in combination with other variables, but was also
important in its own right in old-growth forest (F(5, 143) = 3.03, p < 0.001).

Chapter 4: Drivers of mammalian community assembly across a tropical land-use gradient
118
Figure 4. Ordination tri-plot depicting the position of sampling points (coloured circles), species (blue crosses) and environmental variables (black arrows) along the first two axes of a redundancy analysis (RDA) of the mammal community composition data. The first and second axes were both significant in permutation tests (1st axis: F(1, 399) = 65.1, p < 0.001; 2nd axis: F(1, 399) = 35.2, p < 0.001) and explained 7.2% and 3.9% (calculated using the adjusted coefficient of multiple determination) of the community variation, respectively. Environmental variables were chosen by a modified forward-selection procedure applied to three separate RDA sub-models for habitat structure, topography and landscape context (corresponding to Fig. 1A). This explains the strong correlations evident here between some environmental variables, making causality difficulty to ascribe in these cases. Land-use was not included as a variable in this model and sampling points are instead coloured post hoc, illustrating the differences in community composition across land-uses. Scores for each sampling point were calculated as weighted sums of the species scores. Four species which were characteristic of old-growth forest (greater mouse-deer T. napu), logged forest (bearded pig S. barbatus and red spiny rat M. surifer) and oil palm (Malay civet V. tangalunga) are individually-named. Species located close to the origin either show weak responses to the environmental variables or show highest occurrence at mean values of the variables. Note that ‘logging road or not’ was a binary variable, with the reference level, i.e. ‘not on a logging road’, located at the origin.

Chapter 4: Drivers of mammalian community assembly across a tropical land-use gradient
119
The two anthropogenic land-uses were less structured in space than old-growth forest (Fig. 3; 95% CI
of the variance explained for old-growth forest: 0.26 – 0.37; 95% CI for logged forest: 0.05 – 0.15;
95% CI for oil palm: -0.05 – 0.24). Broad- and fine-scale spatial processes were equally important in
old-growth forest (95% CI of the difference: -0.04 – 0.08, p = 0.43) and oil palm (95% CI of the
difference: -0.11 – 0.13, p = 0.90), but there was a trend for the dominance of fine-scale space in
logged forest (95% CI of the difference: -0.06 – 0.00, p = 0.09).
Co-occurrence patterns became increasingly random along the land-use gradient, with 26%, 14% and
7% of analysed species pairs classified as non-random in old-growth forest (n = 392 species pairs),
logged forest (n = 627 pairs) and oil palm (n = 43 pairs), respectively. Of these non-random
associations, most were positive (Fig. 5) and only in old-growth forest was there any substantial
evidence of negative co-occurrences (13% of non-random associations). However, it should be noted
that Type II errors are a possibility for oil palm, in which 25% of associations classified as random
represented deviations of > 3% of the total number of sites (this was the case for just 1% and 0% for
old-growth and logged forest, respectively).

Chapter 4: Drivers of mammalian community assembly across a tropical land-use gradient
120
Figure 5. Observed and expected species co-occurrences between species (excluding species species pairs for which expected co-occurrences were < 1) for each land-use type. Significant positive co-occurrences (blue points) lie above the 1:1 line and significant negative co-occurrences (orange points) lie below it. Effects sizes were calculated by standardising the difference between observed and expected co-occurrences by the number of sampling points in each land-use.

Chapter 4: Drivers of mammalian community assembly across a tropical land-use gradient
121
4. 3. Discussion
Our overall results showed a strong role for environmental control in assembling mammal
communities and therefore do not support our initial hypothesis of completely neutral communities.
Indeed our results most closely fitted the predictions arising from our final hypothesis, which posited
that both niche and dispersal would be important in assembling communities and that the relative
importance of each would not be stable along the environmental gradient created by land-use, with
dispersal and competition declining in importance and environmental filtering increasing in
importance. This was supported by an increasing dominance of environmental variables over spatial
variables along the land-use gradient, in particular an increase in the share of the explained variation
contained within the pure environmental component, and by increasingly weak evidence of negative
species co-occurrences along the land-use gradient.
We also found that the explanatory power of our models for logged forest communities was low
compared to the other land-uses. We interpret this to be consistent with an increase in the importance
of random drift, a term which we use here to refer to unexplained stochasticity in the broadest sense,
for example due to demographic processes, environmental stochasticity and historical effects. We do
not consider the decreased explanatory power to be caused by under-sampling of logged forest
communities, since the sampling intensity in logged forest was similar, if not higher, than in the other
land-uses, as were the overall trapping rates. An alternative explanation is that the environmental
variables we used were inappropriate for logged forest. We specifically designed the variables to
capture the structural dimensions affected by logging (such as the vertical stratification of vegetation
density and the degree of canopy closure), but we did not have fine-scale information on tree species
composition or direct measures of resource abundance, such as the availability of fruit. It remains the
case, however, that spatial variables performed poorly in logged forest, indicating that, if there were
key environmental variables missing from the analysis, they were not spatially-structured. Why,
therefore, might drift be more important in logged relative to old-growth forest? One possibility is that
the size of local communities is smaller in logged forest, which results in more rapid drift (Hubbell,
2001). In particular, it has been shown that the fragmentation of local communities into favourable

Chapter 4: Drivers of mammalian community assembly across a tropical land-use gradient
122
habitat patches, such as could occur within the heterogeneous logged forest, reduces local community
sizes and can allow drift to prevail over niche assembly processes (Orrock & Watling, 2010).
Consistent with this hypothesis, we have previously found that the fine-scaled aggregation of
individuals and species in logged forest is greater than in old-growth forest (Chapter 3).
For old-growth forest communities, both fine- and coarse-grained variation in habitat was involved in
environmental control, with microhabitat structure, topography and the broader landscape all playing
important roles. From old-growth forest to logged forest, there was a marked reduction in the variance
explained by the local landscape context and topographical variables, which meant that space played a
larger role than environment in structuring mammal communities. This could be due to a destruction
by logging of the heterogeneity in forest structure and species composition which is ordinarily present
across local landscapes and along topographical gradients in old-growth forest (Newbery et al., 1996).
The very high intensity of logging that Southeast Asian dipterocarp forests are typically subjected to
(Putz et al., 2012) often results in forests that are uniformly dominated by pioneer tree species, such as
Macaranga pearsonii in our logged forest sites (~10% of basal area; M. Khoo, personal
communication). Whilst elevation featured in the topography RDA model for logged forest, we
consider this more likely to be due to the variability in logging intensity, and indeed logging methods
employed, that occurs with elevation (Pinard et al., 2000b), rather than an effect of any natural
elevational gradients.
Of the three land-uses, environmental control was strongest in oil palm, particularly due to variation
in habitat at fine scales. Although evidence exists from a range of taxonomic groups that oil palm
plantations act as a strong environmental filter at the land-use scale (Foster et al., 2011), far less is
known about the effects of fine-scale habitat variation on the occurrence of species within plantations.
Oil palm plantations often exhibit substantial heterogeneity (Luskin & Potts, 2011), for example in the
age and height of palms, the amount of scrub vegetation in the understorey and the presence of access
roads, and indeed we found these to be important fine-scale filters of mammal communities. This
echoes findings for other taxa in oil palm (Chung et al., 2000; Aratrakorn et al., 2006; Peh et al., 2006;

Chapter 4: Drivers of mammalian community assembly across a tropical land-use gradient
123
Nájera & Simonetti, 2010), and more generally in other plantation types (Thiollay, 1995; Greenberg et
al., 1997; Wanger et al., 2010; Styring et al., 2011; Lantschner et al., 2012), and may indeed be a
robust pattern in these highly-modified habitats. This sensitivity to fine-scale environmental control
could be because species in plantations are persisting closer to their biological tolerances (e.g. for
food resources, microclimate or cover from predators), but further work is needed to test this
hypothesis. Besides fine-scale environmental control, we also found that the local landscape context,
in particular the proportion of forest cover remaining, played an important role in explaining
community variation in oil palm. This has not previously been demonstrated for mammal
communities in oil palm, and suggests a spill-over effect from forest to oil palm (e.g. Lucey et al.,
2014) or, at least, the importance of forest patches in providing key resources, such as resting and
breeding sites (Rajaratnam et al., 2007; Koh, 2008a). A large part of the variation explained by
landscape context was shared with topography, most likely because of the highly non-random nature
of plantation expansion; steep and high elevation forest areas are often the least likely to be converted
and therefore have a greater proportion of forest cover remaining in the landscape.
We found that broad- and fine-scale spatial variables each captured important components of
community variation, of a similar relative importance in each land-use. However, logged forest and
oil palm communities were much less spatially-structured than old-growth communities in absolute
terms, with spatial variables in both cases explaining approximately one-third the variance explained
in old-growth forest. In logged forest, this was partly caused by the reduction in the importance of
environmental control, especially landscape context, and consequent reduction in the
environmentally-induced spatial component compared to old-growth forest. However, we also
calculated post hoc the variation explained by broad- and fine-scale space once the environmental
control model had been factored out. This showed that broad-scale space, independently of
environment, explained 6%, 3% and 1% of the community variation in old-growth forest, logged
forest and oil palm, respectively. This is consistent with a reduction in the importance of dispersal
limitation along the land-use gradient.
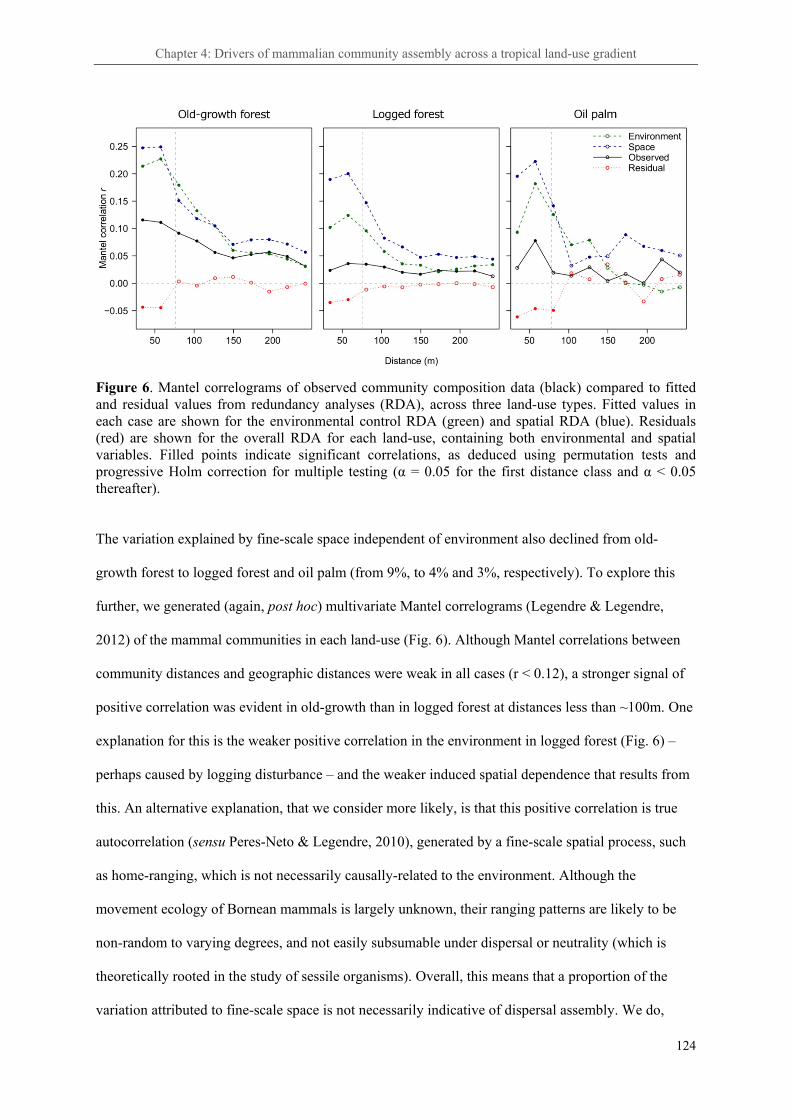
Chapter 4: Drivers of mammalian community assembly across a tropical land-use gradient
124
Figure 6. Mantel correlograms of observed community composition data (black) compared to fitted and residual values from redundancy analyses (RDA), across three land-use types. Fitted values in each case are shown for the environmental control RDA (green) and spatial RDA (blue). Residuals (red) are shown for the overall RDA for each land-use, containing both environmental and spatial variables. Filled points indicate significant correlations, as deduced using permutation tests and progressive Holm correction for multiple testing (α = 0.05 for the first distance class and α < 0.05 thereafter).
The variation explained by fine-scale space independent of environment also declined from old-
growth forest to logged forest and oil palm (from 9%, to 4% and 3%, respectively). To explore this
further, we generated (again, post hoc) multivariate Mantel correlograms (Legendre & Legendre,
2012) of the mammal communities in each land-use (Fig. 6). Although Mantel correlations between
community distances and geographic distances were weak in all cases (r < 0.12), a stronger signal of
positive correlation was evident in old-growth than in logged forest at distances less than ~100m. One
explanation for this is the weaker positive correlation in the environment in logged forest (Fig. 6) –
perhaps caused by logging disturbance – and the weaker induced spatial dependence that results from
this. An alternative explanation, that we consider more likely, is that this positive correlation is true
autocorrelation (sensu Peres-Neto & Legendre, 2010), generated by a fine-scale spatial process, such
as home-ranging, which is not necessarily causally-related to the environment. Although the
movement ecology of Bornean mammals is largely unknown, their ranging patterns are likely to be
non-random to varying degrees, and not easily subsumable under dispersal or neutrality (which is
theoretically rooted in the study of sessile organisms). Overall, this means that a proportion of the
variation attributed to fine-scale space is not necessarily indicative of dispersal assembly. We do,

Chapter 4: Drivers of mammalian community assembly across a tropical land-use gradient
125
however, consider that broad-scale space is indicative of true dispersal limitation. Between-block
movements of individuals are likely to be infrequent, except for the most wide-ranging species in the
community, such as the Sunda clouded leopard (Neofelis diardi).
The vast majority of species pairs we examined were found to be co-occurring at random. Moreover,
there was only weak evidence of the negative co-occurrences expected under competition, and this
was only the case in old-growth forest. Most of the non-random co-occurrences were positive. We are
not aware of any documented examples of mutualism or commensalism among Bornean mammals,
and the best explanation for the positive co-occurrences is shared habitat preferences. The few
significant negative co-occurrences could equally have been generated by dissimilar fine scale habitat
preferences. This is supported by the fact that 69% of the negative co-occurrences involved the same
species (Appendix B, Fig B2), the greater mouse-deer (Tragulus napu), which our environmental
RDA identified as an old-growth forest specialist (Fig. 4). However, among the negatively co-
occurring species, were three congeneric pairs which may be suitable candidates for future
investigation into inter-specific competition: two morphologically very similar and abundant
Maxomys rats (M. surifer and M. rajah), the greater and lesser (T. kanchil) mouse-deer, and the thick-
spined and Malay porcupines (Hystrix crassispinis and H. brachyura). Overall, however, we maintain
that environmental filtering is likely a more dominant assembly process for mammal communities
than species interactions. This does not discount the possibility that species pools have been shaped
by competition in the evolutionary past (Connell, 1980).
Our results suggest that the assembly of mammal communities in logged forest may be driven by
dissimilar mechanisms to old-growth forest, which could represent a pervasive, but as-yet-
undocumented, legacy of logging. Besides some fine-scale environmental control, environmental
control was weak overall, possibly due to the homogeneous composition of logged forest at coarse
scales, which meant that community drift was a more important process in relative and possibly
absolute terms. If this is a general result for mammal communities in the region, it could call into
question the prospects for large-scale, unassisted restoration of ecosystem processes in logged-over

Chapter 4: Drivers of mammalian community assembly across a tropical land-use gradient
126
forests, and may mean that more active management interventions, targeted at species of particularly
concern, may be more appropriate (Lamb et al., 2005). Our finding that mammal communities in oil
palm were strongly assembled by environmental control, particularly at fine-scales, suggests that there
is at least the potential for ameliorating the impacts of oil palm by altering management practices.
Further detailed study of the factors determining species persistence in oil palm would be required in
order to identify recommendations that would be practical for industry to implement. Although we
found an important role for landscape context in oil palm, in particular remnant forest cover, the
potential benefits of advocating this conservation strategy for mammals would have to be reconciled
with potential losses of natural forest elsewhere due to agricultural extensification (Edwards et al.,
2010b).
We conclude that assembly processes are not robust to anthropogenic environmental gradients such as
land-use, and indeed that disturbance may lead to novel mechanics governing the local assembly of
mammal communities. Our overall results support the niche-neutrality continuum model of
community assembly, in which dispersal, drift and environmental control all combine variously to
create communities at the local scale (Gravel et al., 2006; Mutshinda & O’Hara, 2011). Our study
represents one of the first to investigate the local scale drivers of mammalian community assembly
and it remains unknown whether our findings might also hold for other non-sessile organisms,
including other vertebrate groups. New biodiversity sampling technologies offer an opportunity to
generate a more comprehensive picture of community assembly for a wider range of taxonomic
groups in the future, thus allowing the testing and refinement of ecological theory, as well as
facilitating better conservation and management of these imperilled natural systems.
Chapter 4: Drivers of mammalian community assembly across a tropical land-use gradient
127
Appendices
Appendix A – Detailed description of methods used to measure environmental variables
A. 1. Field-based measurement of environmental variables
All habitat structure variables were quantified directly in the field. Eight variables were measured
directly at sampling points by a single observer (O.R.W.), whilst a further five were measured in
intensively-sampled 25 m2 vegetation plots as part of ongoing monitoring at the Stability of Altered
Forest Ecosystems (SAFE) Project (Ewers et al., 2011). We hereafter refer to these vegetation plots as
‘quadrats’ to distinguish them from the larger plots used to sample mammal communities. Two
quadrats were located within each sampling plot, spaced evenly within the plot area and 150 m apart
(centre-to-centre distance). Quadrats were mostly < 45 m from individual sampling points (range: 0 to
75 m).
Vegetation cover within a 5 m radius of each sampling point was estimated in four height strata
(ground: 0-0.5 m; understorey: 0.5-3 m; mid-storey: 3-20 m, and canopy: above 20 m) and placed into
one of five broad classes for each stratum (1: 0-25%; 2: 25-50%; 3: 50-75%, and 4: 75-100%).
Canopy cover was quantified using a spherical densiometer (Lemmon, 1957), held at waist height and
recorded as an average percentage across four measurements (one for each cardinal direction). Before
analysis, this percentage was arcsine-transformed, owing to the strong negative skew apparent across
all measurements. The intensity of habitat disturbance (“habitat score”) within a 5 m radius of each
point was recorded on a 1 to 5 scale (definitions provided in Table A1), following a similar
methodology to previous studies (Ewers et al., 2011; Cusack et al., 2015). Higher habitat scores
represent more intact sites, and sites within the oil palm plantation crop itself never exceeded a score
of 2, though areas in the margins of plantations reached scores of 3 in some areas. We also noted
whether the sampling point was on a logging road or not, due to the strong influence these features
have on the occurrence of some species in our study sites (see Chapter 2). Old logging roads, often
following ridge-lines, were apparent due to their graded surface, the poor regeneration state of

Chapter 4: Drivers of mammalian community assembly across a tropical land-use gradient
128
understorey vegetation, and the lack of canopy cover. Habitat scores and vegetation cover estimates
were treated as ordered categorical variables during analysis. We also included in the analysis a 2nd-
order polynomial term for habitat disturbance (“habitat score2”), due to the non-linear responses to
this variable we have previously found for some species (Cusack et al., 2015).
Quadrat-based variables were measured during the course of long-term vegetation monitoring using
RAINFOR protocols (Malhi et al., 2002; Turner et al., 2012). This involved mapping, measuring and
tagging all trees ≥ 10 cm diameter at breast height (DBH) inside each quadrat. Tree heights were
estimated by field teams on the ground, and were not significantly different from model-based
estimates obtained using DBH measurements (M. Pfeifer, unpubl. data). We also included a 2nd-order
polynomial term for DBH during the analysis. This was because we expected hump-shaped responses
to this variable in at least some species, owing to the fact that the largest mean DBH values were
observed within oil palm (Elaeis guineensis) quadrats. Total deadwood volumes in each quadrat were
obtained by summing the volumes of all coarse woody debris pieces (≥ 10 cm diameter), including
standing, hanging and fallen deadwood. Volumes of each piece were estimated using the formula for a
truncated cone, following (Baker et al., 2007), which required measuring the diameter of each piece at
both ends, as well as the length. For standing deadwood, the top-most diameter was estimated using
the taper function (Chambers et al., 2000).
Table A1. Definition of habitat disturbance scale. Habitat score Definition
1 Open area. Dominated by grasses and small shrubs (< 1 m in height). Typically on logging roads or old log landing areas. 2 Herbaceous scrub. Dominated by herbs (typically Zingiberaceae), vines and shrubs, with no trees > 3 m in height (except
oil palm Elaeis guineensis). Typically representing secondary re-growth from clear-felling, or large gaps due to landslides.
3 Heavily-disturbed forest. High scrub or dense understorey layer (typically with vines and Dinochloa climbing bamboo species), with a low, heavily-broken canopy layer (< 20 m). Possibly some large isolated trees (> 20 m). Intensively-logged area or large gap disturbance.
4 Disturbed forest. Mostly pioneer tree species (typically Macaranga species), but some old-growth dipterocarp species may be present. Discontinuous canopy. Lower intensity of logging or natural disturbance.
5 Undisturbed forest. Dominated by old-growth dipterocarps. High, continuous canopy with sparsely-vegetated understorey. Unlogged, with little recent disturbance evident.

Chapter 4: Drivers of mammalian community assembly across a tropical land-use gradient
129
A. 2. Satellite-based measurement of environmental variables
Topographical variables were all derived from the Advanced Spaceborne Thermal Emission and
Reflection Radiometer Global Digital Elevation Model (DEM) version 2 (https://lpdaac.usgs.gov),
jointly developed by the Ministry of Economy, Trade and Industry of Japan and the United States
National Aeronautics and Space Administration, and which was provided at 30 m horizontal
resolution. We extracted elevation data from this DEM at our sampling points, applying bilinear
interpolation. Slope was estimated as the maximum rate of change from each cell in the DEM and was
calculated in degrees (taking values between 0 and 90). To calculate flow accumulation, we 1) created
a depressionless DEM by filling in ‘sink’ artefacts in the data, 2) created a flow direction map from
this corrected DEM, and then 3) for each cell, summed the number of upstream cells. Areas of zero or
low flow accumulation represented ridges, whilst high flow accumulation areas represented gullies,
stream heads, streams and rivers. For the purposes of analysis, we log-transformed flow accumulation,
owing to the strong positive skew in the values, with rivers otherwise represented by very large
values. All topographical variables were calculated in ArcMap version 10 (ESRI, Redlands,
California, USA). During analysis, we also included 2nd-order polynomial terms for each
topographical variable, owing to the non-linear, and possibly hump-shaped, species responses we
expected for these variables.
Ground-based measurements of above-ground live tree biomass (AGB) were taken from all
vegetation quadrats (n = 193) sampled across the SAFE Project, which amounts to intensive-sampling
of > 12 ha in total. AGB was calculated for each quadrat using Chave et al.'s (2014) pan-tropical
algorithm. Spectral data were derived from sensors onboard the RapidEye satellite (European Space
Agency Earth Observation Portal: https://earth.esa.int), which were provided at 5 m resolution. All
pre-processing and atmospheric correction of the images, taken in 2012 and 2013, followed the steps
outlined in Pfeifer et al. (2015). Within 20 m radius buffers centred on each quadrat, we extracted the
spectral intensity values for each of the five bands present in the RapidEye images (blue, green, red,
red-edge and near-infrared) and calculated a spectral vegetation index, the Modified Soil-Adjusted
Vegetation Index 2 (MSAVI2) from the red and near-infrared bands (Qi et al. 1994). Note, we did not

Chapter 4: Drivers of mammalian community assembly across a tropical land-use gradient
130
take the red and near-infrared band spectral intensities forward into modelling, since these were used
in the calculation of MSAVI2. We transformed MSAVI2 by taking its exponent, because of the
saturating response observed at high levels of AGB. We also calculated a measure of image texture
(dissimilarity), within 9 x 9 pixel moving windows, for each band. 58 quadrats were covered by cloud
or cloud shadow in our images and were excluded. Using linear models of AGB as a function of each
possible combination of the nine covariates (MSAVI2, three spectral intensity covariates and five
dissimilarity covariates), we then obtained a candidate set of “best” models based on information-
theoretic criteria (i.e. models for which ΔAICc < 4) and calculated model-averaged estimates for each
parameter (Table A2) based on the model selection weights in this set. The pseudo-R2 (explained
deviance) of this final model was 0.53.
Based on the model-averaged parameters, we made AGB predictions within 500 m, 1 km and 2 km
radius buffers surrounding each of our sampling points, at a resolution of 25 m2, which matched the
resolution of our ground-based measurements. Finally, we calculated the mean AGB (excluding
cloud-covered pixels) within each buffer size. All steps in the analysis of AGB were done in R
version 3.1.0 (R Development Core Team, 2014), using the packages raster 2.3-0 (Hijmans, 2014),
rgeos 0.3-8 (Bivand & Rundel, 2014), glcm 1.2 (Zvoleff, 2015) and MuMIn (Barton, 2015).
AGB values across buffer sizes were highly correlated (Pearson’s r > 0.98), so we fitted redundancy
analysis (RDA) models (with the vegan 2.0-10 package in R; Oksanen et al. 2013) for each buffer size
and used the buffer size explaining the largest share of the community variation (calculated using the
adjusted coefficient of multiple determination, R2adj; Blanchet et al. 2008) in further analyses. This
selected the buffer with a 500 m radius (R2adj = 11.1%), although there were not large differences in
the variation explained by the different buffer sizes (1 km: 10.8 %; 2 km: 10.7 %).
In order to calculate landscape forest cover and distances from forest for each sampling point, we first
created a digitised forest cover map in ArcMap using visual interpretation of RapidEye satellite
images, in combination with cloud-free Landsat 7 and 8 images (30 m resolution) released by Hansen

Chapter 4: Drivers of mammalian community assembly across a tropical land-use gradient
131
et al. (2013). We distinguished natural forest from mature oil palm and Acacia mangium plantations
by observing the dynamics of vegetation gain and loss over multiple years (1999-2013), as well as
using our detailed knowledge of the study sites, but it is possible that some older plantation areas may
have been included in our forest cover map (if they were already > 5 m in height before the year 2000
and were not harvested after that time). Euclidean distances from forest were calculated in ArcMap
and percentage forest cover was quantified in buffers with 500 m, 1 km and 2 km radii using the rgeos
package in R. As for AGB, we fit RDA models for each of the buffer sizes and selected the radius
which explained the largest percentage of the community variation. This resulted in the 500 m radius
being chosen (R2adj = 6.2%), though similar percentage variances were explained by the other buffer
sizes (1 km: 5.8%; 2 km: 5.3%).
Table A2. Model-averaged parameter estimates for linear models of field-based above-ground live tree biomass (AGB) measurements, as a function of satellite-derived measures of vegetation, spectral intensity and image texture.
Parameter Estimate Standard error
(adjusted) z-value p-value Relative variable
importancea
Intercept 145.03 38.21 3.80 < 0.001 -
Band 2 (green) intensity -17.44 3.56 4.91 < 0.001 1
Band 2 (green) dissimilarity 20.99 5.92 3.55 < 0.001 1
Band 4 (red-edge) intensity 8.28 2.61 3.18 0.001 1
exp(MSAVI2) -29.97 12.05 2.49 0.013 0.97
Band 3 (red) dissimilarity 6.41 5.00 1.28 0.20 0.42
Band 1 (blue) dissimilarity 5.69 5.11 1.12 0.27 0.34
Band 5 (near-infrared) dissimilarity -1.15 1.34 0.86 0.39 0.31
Band 4 (red-edge) dissimilarity -1.89 3.38 0.56 0.58 0.26
Band 1 (blue) intensity -0.13 2.81 0.05 0.96 0.19 aCalculated as the sum of the AICc weights for the models in which the given parameter appears.

Chapter 4: Drivers of mammalian community assembly across a tropical land-use gradient
132
Appendix B – Supplementary Results
Table B1. Environmental variables chosen by a modified forward-selection procedure based on the adjusted coefficient of multiple determination (R2
adj), for the global model and models specific to land-use types (old-growth forest, logged forest and oil palm) and species groups (large mammals and small mammals).
Environmental variable
Redundancy analysis (RDA) model
Global Old-growth forest
Logged forest
Oil palm
Large mammals
Small mammals
Habitat structurea
Ground cover
Understorey cover
Midstorey cover
Canopy cover
Canopy closure (arcsine-transformed %)
Habitat score
Habitat score2
Logging road (binary)
Maximum tree height (m) (quadrat-based)c
Tree density (quadrat-based)c
Mean DBH (cm) (quadrat-based)c
Mean DBH2 (quadrat-based)c
Deadwood volume (m3) (quadrat-based)c
Topographyb
Elevation (m)
Elevation2
Flow accumulation
Flow accumulation2
Slope (degrees)
Slope2
Local landscape contextb
Above-ground live tree biomass (Mg/ha) (500 m radius)
Forest cover (%) (500 m radius)
Distance from forest (m)
aAll habitat structure variables were measured in the field.
bAll topographical and landscape variables were derived from satellite data. c"Quadrat-based" variables were measured within 25 m2 quadrats, located 0 - 75 m from sampling points, at a density of two quadrats per plot.

Chapter 4: Drivers of mammalian community assembly across a tropical land-use gradient
133
Figure B1. Shared and independent percentages of community variation explained (as determined using the adjusted coefficient of multiple determination, R2
adj) by environmental and spatial surrogate variables, for large and small mammal communities separately.
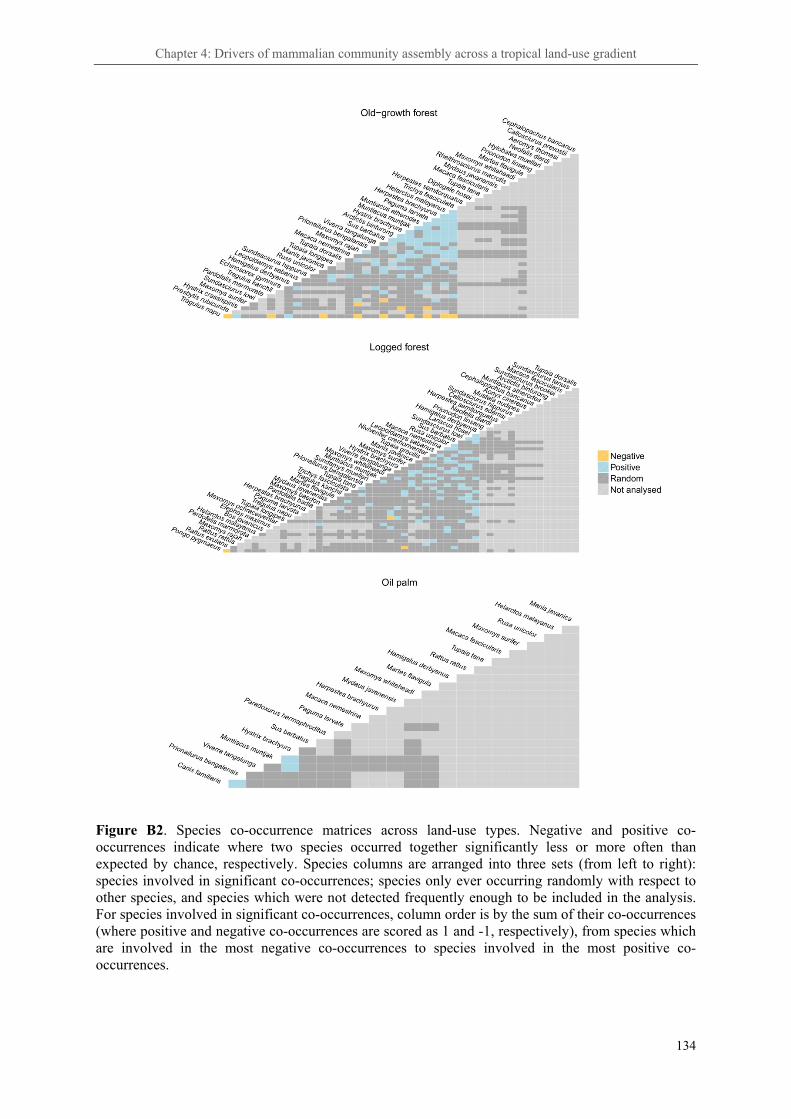
Chapter 4: Drivers of mammalian community assembly across a tropical land-use gradient
134
Figure B2. Species co-occurrence matrices across land-use types. Negative and positive co-occurrences indicate where two species occurred together significantly less or more often than expected by chance, respectively. Species columns are arranged into three sets (from left to right): species involved in significant co-occurrences; species only ever occurring randomly with respect to other species, and species which were not detected frequently enough to be included in the analysis. For species involved in significant co-occurrences, column order is by the sum of their co-occurrences (where positive and negative co-occurrences are scored as 1 and -1, respectively), from species which are involved in the most negative co-occurrences to species involved in the most positive co-occurrences.

Chapter 4: Drivers of mammalian community assembly across a tropical land-use gradient
135
Figure B3. Distance-based Moran’s eigenvector map (db-MEM) variables chosen by a modified forward selection procedure during redundancy analysis of the community composition data. MEM variables represent a spectral decomposition of the spatial relationships among points and are ordered from the coarsest to the finest scale within each block. Of the 156 db-MEMs generated, 47 were identified as significant in forward selection and were subsequently used as spatial surrogate variables for modelling fine-scale spatial processes. Single-predictor R2
adj values were derived from separate redundancy analyses for each db-MEM.

Chapter 4: Drivers of mammalian community assembly across a tropical land-use gradient
136
Figure B4. Examples of distance-based Moran’s eigenvector maps (db-MEMs) identified as significant by a modified forward-selection procedure used in a redundancy analysis. These db-MEMs were used as spatial surrogate variables of fine-scale spatial processes. Broad-scale spatial processes were modelled using trend-surface variables.

Chapter 5: Mammalian species abundance responses to land-use change
137
Chapter 5:
Species abundance across a gradient of tropical land-use intensity: a hierarchical
multi-species approach applied to a Bornean mammal community
Abstract
Despite rapid rates of global land-use change, we still have a limited ability to make forecasts of
species abundance. Although most work has hitherto focussed on species richness, abundance is often
a more useful state variable for conservation and management. Consistency in reported abundance
responses to land-use change has remained elusive across different study regions or taxa, even when
similar types of land-use transition (e.g. forest to plantation) have been compared. In part, this is
because the detectability of species in a given study is rarely accounted for. In addition, continuous, as
opposed to categorical, metrics of land-use change are rarely used, but may allow better predictions in
heterogeneous landscapes, as well as provide more practical recommendations for management and
conservation. We applied a novel hierarchical multi-species model to data from two sampling
methods, in order to estimate the abundance (number of individuals using a given sampling point) of a
near-complete terrestrial mammal metacommunity in our study region in northern Borneo, using both
categorical and continuous metrics of land-use change in the model. We found that mammalian
abundance was resilient overall across the transition from old-growth to logged forest, but declined
substantially in oil palm. Abundance responses to above-ground live tree biomass (a continuous
measure of logging intensity) in a given local landscape were negative overall, although weakly
unimodal, whilst they were strongly positive for landscape forest cover. From old-growth to logged
forest, small mammals increased in abundance much more than large mammals. Similarly, omnivores,
insectivores and herbivores increased more than other trophic guilds. From forest to oil palm, species
of high conservation concern fared especially poorly. Invasive species consistently increased along
the gradient of land-use intensity. The functional effects of these abundance changes, as assessed
using nine species groups based on diet, were minimal from old-growth to logged forest, but only the

Chapter 5: Mammalian species abundance responses to land-use change
138
vertebrate predation function was maintained in oil palm. Our results complement previous assertions
of the high value of even the most degraded forests in Southeast Asia for conserving species richness,
extending this value to their role in conserving the abundance of individual species and their
functions. Our results also underline the very low value of the oil palm crop habitat for conserving
species and support the view that “wildlife-friendly” practices within plantations offer a low potential
for reducing biodiversity impacts.
5. 1. Introduction
Wilderness areas free of anthropogenic influence are now rare on planet Earth, and changes in land-
use due to biomass extraction and agriculture have created novel ecosystems over vast areas. In
particular, tropical forests, the most biodiverse of terrestrial biomes, are currently experiencing
historically unprecedented rates of selective logging and conversion to plantations, cropland and
pasture (Asner et al., 2009; Gibbs et al., 2010). In Southeast Asia land-use change has been especially
acute, with the vast majority of remaining forest now existing in a logged-over state (Margono et al.,
2014; Gaveau et al., 2014) and deforestation rates, in large part due to oil palm (Elaeis guineensis)
plantation expansion (Koh & Wilcove, 2008; Gunarso et al., 2013), the highest among the major
tropical forest regions (Asner et al., 2009). Land-use is well-known as a major driver of ecological
change, for example as a leading cause of species endangerment (Vié et al., 2009), but there remains a
limited capacity to make biodiversity forecasts, especially of species abundances, at scales which are
relevant to local stakeholders and policy-makers responsible for making land-use decisions.
Most previous research on the biodiversity impacts of land-use change has focussed on community-
level parameters, in particular species richness. The more subtle impacts on species abundances have
been quantified less frequently, and often only for single focal species or a limited subset of species.
In part, this reflects the additional challenge that abundance monitoring represents. The problems
caused by imperfect detection are well-known (Williams et al., 2002; Sollmann et al., 2013) and, for
species richness estimation, there is a relatively well-established toolbox of statistical methods

Chapter 5: Mammalian species abundance responses to land-use change
139
available to control for this (Gotelli & Colwell, 2001). However, this is not the case for abundance
estimation, except in the limited cases when individuals of a species can be recognised, or are
deliberately marked. This has led many researchers to avoid making inferences about abundance
using the, often very sparse, data they have available for each species in a community, especially for
the rarest or most cryptic species. Despite this, abundance, as opposed to species incidence, is often
the state variable of most use for conservation. Abundance estimates give a finer resolution of
information on species responses to environmental change, facilitating better decisions surrounding
trade-offs in land-use (Phalan et al., 2011) and potentially acting as an early-warning indicator before
species go extinct altogether. Importantly, species abundances may also be indicative of ecosystem
functioning (Ewers et al., 2015), as well as the trophic structure and interaction strengths present in an
ecosystem (Barnes et al., 2014).
There is a developing consensus about the impacts of land-use change on species richness, such as the
relatively lower impacts of selective logging relative to plantation forestry, which in turn often retain
more species than monoculture plantations (Barlow et al., 2007; Scales & Marsden, 2008; Gibson et
al., 2011; Barnes et al., 2014; Edwards et al., 2014a). For abundance responses, on the other hand,
declines under increasing disturbance are typically less marked and consistent patterns across land-use
types have remained elusive (Sodhi et al., 2009a; Gibson et al., 2011; Newbold et al., 2014; Supp &
Ernest, 2014). Moreover, abundance responses to land-use change often differ across taxonomic
groups, with some groups reaching their highest abundance in highly modified habitats (Foster et al.,
2011; Senior et al., 2012). In a global meta-analysis across taxonomic groups, available data indicated
that mammals, in particular, were a group which apparently often increase in abundance under
disturbance (Gibson et al., 2011).
The variability in abundance responses reported across studies means that there is still a limited
capacity to make robust predictions about the impacts of land-use change (Newbold et al., 2014). The
majority of past studies have based their inferences about abundance on sparse data, often on a biased

Chapter 5: Mammalian species abundance responses to land-use change
140
subset of species in a community, and without controlling for the potentially confounding influence of
detection probability, for example across species and across land-use types. These factors may, at
least in part, explain the large variability in reported abundance responses and, in the worst cases, may
be a source of systematic bias in inferences.
Land-use change sometimes involves dramatic and rapid changes to a natural habitat, for example
when a primary forest is converted to pasture. More often, land-use change manifests itself as a
gradient of disturbance intensity, rather than distinct land-use categories, and incorporating this into
models of abundance may be an opportunity to increase the predictive power and practical relevance
of forecasts for conservation and management. For example, the intensity of selective logging may
vary considerably across a landscape, due to access constraints and natural variability in marketable
timber volumes (Cannon et al., 1994; Berry et al., 2008). Similarly, plantations may vary in their
proximity to remaining forests and in their structural properties, such as height and canopy cover, as
they mature (Luskin & Potts, 2011; Foster et al., 2011). The propensity in past studies to use land-use
categories, rather than continuous metrics of disturbance, perhaps reflects the often categorical nature
of land-use decisions and is therefore politically expedient. However, the focus on categorical
measures of land-use intensity may, in many cases, also be due to a lack of suitable metrics available
for modelling. The burgeoning availability of aerial and satellite remotely-sensed data is rapidly
overcoming this problem (Pettorelli et al., 2014), offering the potential to provide continuous metrics
of land-use intensity at any location and at any spatial extent.
Statistical tools for robustly estimating abundance are also rapidly advancing. Importantly, the
statistical toolbox has recently been extended to include abundance estimation for species which are
not individually identifiable (Royle & Nichols, 2003; Royle, 2004; Rowcliffe et al., 2008). In
addition, computing power is now sufficiently advanced such that complex but flexible hierarchical
models, which can account for the specific observational and ecological processes at work in a dataset
(Royle & Dorazio, 2008), are now a practical option using Bayesian inference and Markov chain

Chapter 5: Mammalian species abundance responses to land-use change
141
Monte Carlo (MCMC) methods. The application of new statistical models, using advanced
computational tools, has opened up the possibility, for the first time, of multi-species models of
abundance for whole communities. Moreover, these methods are ideally suited to the large datasets
being generated by the increasing deployment of remotely-operated sensors in the field, such as
acoustic recorders and camera traps.
Here we investigate species abundances for a community of terrestrial mammals across a land-use
gradient in Borneo. We estimate abundance for all species using a novel hierarchical model of the
mammal metacommunity in our study region which accounts for 1) imperfect detection, 2) correlated
detections in group-living species, 3) multiple sampling methods (camera traps and live traps), 4)
clustered sampling designs, and 5) habitat filtering according to land-use and fine-scale habitat
disturbance. We used both categorical and continuous approaches to characterise the land-use
gradient. In the former case, we used three categories which match the major land-use options
available to forest concession holders in the region: old-growth forest, logged forest and oil palm
plantation. For our continuous metrics of land-use intensity, we employed satellite-derived measures
of above-ground live tree biomass (AGB) and local landscape forest cover. AGB is directly
proportional to carbon content (Martin & Thomas, 2011), and this metric is therefore relevant for
assessing the value of High Carbon Stock (HCS) set-aside areas – likely to be implemented by many
of the world’s leading palm oil producers (Poynton, 2014) – for mammal species. Landscape forest
cover is relevant to management decisions concerning the quantity of forest set-aside within a
concession, for example as High Conservation Value (HCV) areas or riparian reserves in oil palm
plantations (Koh et al., 2009; Edwards et al., 2012). We also partitioned the mammal community
according to four ecological response traits – body size, conservation status, native status and trophic
guild – as well as into functional effects groups based on diet, and present abundance and biomass
responses of these sub-groups. In particular, we were interested in whether: a) small and large
mammals respond similarly, given that current consensus surrounding mammal responses to
disturbance are based primarily on small mammal studies (Gibson et al., 2011); b) particular trophic
Chapter 5: Mammalian species abundance responses to land-use change
142
guilds are more susceptible to land-use change, as indicated recently for birds (Gray et al., 2007;
Edwards et al., 2009); c) species of high conservation concern, often the focus of HCV surveys and
assessments, are more sensitive to logging and conversion to oil palm, relative to native and invasive
species of lower concern, and d) the biomass of particular dietary functional groups is altered across
the land-use gradient, with potential implications for ecosystem function.
5. 2. Methods
5. 2. 1. Sampling design
We sampled mammals in three different land-uses, taking advantage of the experimental design of the
Stability of Altered Forest Ecosystems (SAFE) Project in Sabah, Malaysian Borneo (Ewers et al.,
2011). This consists of old-growth forest within the Maliau Basin Conservation Area and Brantian-
Tatulit Virgin Jungle Reserve (VJR), repeatedly-logged forest within the Kalabakan Forest Reserve
and two adjacent oil palm plantations straddling the Kalabakan Forest Reserve boundary. The VJR
(4,140 ha) was gazetted in 1984, and is managed by the Sabah Forestry Department for the purposes
of research and conservation. It is split into four main fragments, of which the largest (2,200 ha) lay
within the SAFE Project area. There was some evidence of illegal logging in the reserve, with old skid
trails (now with continuous canopy cover) present in the vicinity of some sampling points. However,
the majority of the reserve remains unlogged and, for the purposes of our land-use categorisation, we
class this as old-growth forest. Detailed descriptions of the other study sites can be found in Chapter
3.
We employed a clustered hierarchical sampling design, with 48 sampling points clustered together
into each of 46 sampling plots (each covering 1.75 ha), in turn clustered into 11 sampling blocks
distributed across the land-use gradient (Fig. 1). This included 13 plots (in 4 blocks) in old-growth
forest, 24 plots (in 4 blocks) in logged forest and 9 plots (in 3 blocks) in oil palm plantations. The
clustered design we used likely comes at the cost of reduced precision in our abundance estimates, but
also allowed us to investigate the fine-scale spatial patterns of species occurrence, which we have

Chapter 5: Mammalian species abundance responses to land-use change
143
explored elsewhere (see Chapters 3 and 4). Sampling plots overlapped the SAFE Project sampling
design, and therefore benefitted from the deliberate control of potentially confounding factors
(including latitude, slope and elevation) that was central to this project’s design (Ewers et al., 2011).
Figure 1. Sampling design across a gradient of land-use intensities in Borneo, showing the plots sampled using both camera traps and live traps (in red) and plots sampled only with camera traps (in orange). In logged forest, plots were arranged to coincide with future experimental forest fragments. The shaded area in panel C shows the edge of Mount Louisa Forest Reserve, which connects Kalabakan Forest Reserve to an extensive (>1 million ha) area of contiguous logged forest to the north. The area of old-growth forest in panel C is indicative of the boundaries of the Brantian-Tatulit Virgin Jungle Reserve only, and forest along the western and southern boundaries has been degraded by edge effects and illegal logging. Insets show the location within insular Southeast Asia and the spatial proximity of panels A to C within south-east Sabah, Malaysia.
5. 2. 2. Field methods
Of the 48 sampling points within each plot, a random subset of 13 points (range: 8 to 22) in each of
the 46 plots were selected for camera-trapping, giving 590 points sampled in total. We deployed
camera traps (Reconyx HC500, Holmen, Wisconsin, USA) as close to each random point (marked in
the field on a separate occasion) as possible, and strictly within 5 m. Cameras were fixed to trees or

Chapter 5: Mammalian species abundance responses to land-use change
144
wooden poles, or placed within locally-made steel security cases in areas of high human traffic, with
the camera sensors set at a height to maximise detection for a range of species (most often 30 cm,
though this was flexible depending on the terrain encountered at each location). No bait or lure was
used, cameras used an infrared flash during night-time hours, and disturbance to vegetation was kept
to a minimum. Cameras were programmed to take 10 consecutive photos on being triggered (1 image
per ~ 0.5 s), with the minimum possible delay on triggering (~ 0.2 s), and the sensor was set to
maximum sensitivity. Camera-trapping took place between May 2011 and April 2014, during which
most plots (40 of 46) were sampled in multiple years (mean effort per plot = 635 trap nights). We
excluded 18 points which had been camera-trapped for less than seven days, giving a total sampling
effort of 29,121 camera trap nights (after correcting for camera failures).
Of the 46 plots sampled using camera traps, 31 were also sampled using live traps. Two locally-made
steel-mesh traps (18 cm wide, 10 - 13 cm tall and 28 cm in length), baited with oil palm fruit, were
placed at or near ground level (0 - 1.5 m) within 10 m of all 48 points in a plot. Each trapping session
consisted of seven consecutive trapping days and some plots (14 of 31) were sampled for multiple
sessions across the study period (mean effort per plot = 1099 trap nights). Traps were checked each
morning and captured individuals were anaesthetised using diethyl ether (following Wells et al. 2007),
measured, permanently marked using a subcutaneous passive inductive transponder tag (Francis
Scientific Instruments, Cambridge, UK), identified to species using Payne et al. (2007) and released at
the capture location. Trapping, totalling 34,058 trap nights, was carried out between May 2011 and
July 2014, during which there were no major mast-fruiting events.
We scored the habitat disturbance in a 5 m radius around each sampling point on a 1-5 scale,
representing a scale of high to low disturbance intensity. For example, a score of 1 was used in open
areas, such as on roads or log-landing areas, whilst a score of 5 was used in intact, high canopy forest
(full definitions of the levels are provided in Chapter 4, Appendix A). This variable was used because

Chapter 5: Mammalian species abundance responses to land-use change
145
it has previously been shown to be important in explaining the fine-scale composition of communities
(Chapter 4; Cusack et al., 2015). All measurements were made by a single observer (O.R.W.).
5. 2. 3. Data analysis
We reviewed all camera trap images (~800,000) in Adobe Photoshop Lightroom versions 4 and 5
(Adobe Systems, San Jose, California, USA) and added keyword tags to record the content of each
image, including the onset of photo-trapping events (i.e. when an animal entered a camera’s field-of-
view) and the species present. This created a text string in the Extensible Metadata Platform keyword
field of each image, which we exported to a spreadsheet using ExifTool version 9.41 (Harvey, 2013)
and subsequently parsed in R version 3.1.0 (R Core Team, 2014) . We then filtered the photo-trapping
events, with an algorithm written in R, into independent captures, using two criteria: 1) events
consisting of different individuals, or 2) events separated by > 1 hour. Different individuals were
distinguished based on species, as well as accessory tags we applied during cataloguing, such as sex,
age class and other distinguishing features. In this way, our data are fully reproducible and did not
involve any manual data entry into a spreadsheet.
To estimate species abundance, we extended a class of multi-species occupancy models (Royle &
Dorazio, 2008; Dorazio et al., 2011; Yamaura et al., 2011; Tobler et al., 2015) to accommodate
multiple sampling methods and group-living species. These all have in common a necessity for
replicate samples in space and time, in order to separate the latent ecological processes of interest
from the observational processes by which the data are generated. We therefore transformed our data
to the required form of detections and non-detections within temporal replicates, or occasions, for
each site. Here we define an occasion, for live-trapping, as a single night’s trapping at a point (i.e. two
trap nights, given that two traps were deployed per point) or, for camera-trapping, as five consecutive
calendar days. Data from partially-observed days at the beginning and end of a camera’s deployment,
and any days remaining after division into occasions, were excluded.

Chapter 5: Mammalian species abundance responses to land-use change
146
For the observation component of our model, we posited that heterogeneity among sites (i) in the
abundance (Ni,j) of species j imparts heterogeneity in species detection probabilities (pi,j,k) for
sampling method k, extending Royle & Nichols' (2003) approach to allow for multiple methods.
Specifically, species detection probabilities were assumed to equal the probability of observing at
least one of the individuals present at a site, each with a method- and site-specific, individual-level
detection probability (ri,j,k):
jiNkjikji rp ,)1(1 ,,,, −−= (1)
In turn, the number of species detections Di,j,k were assumed to be a realisation of ni,k binomial trials,
one for each occasion sampled, so that:
Di,j,k ~ Binomial(ni,k, pi,j,k) (2)
Importantly, this model formulation assumes that 1) detections across occasions are independent and
2) the observation of individuals within a sampling occasion is independent (individual probabilities
are simply multiplied to obtain pi,j,k). For the first assumption, there is the potential for violation of
independence given that camera traps are continuous-time detectors, but our filtering of photo-
trapping events into independent detections helped guard against this. We relaxed the second
assumption for seven species that were group-living (Asian elephant Elephas maximum, banteng Bos
javanicus, bearded pig Sus barbatus, domestic dog Canis familiaris, long-tailed macaque Macaca
fascicularis, southern pig-tailed macaque M. nemestrina and Oriental small-clawed otter Aonyx
cinereus) using a quasi-binomial observation process by introducing a parameter jθ (Royle &
Dorazio, 2008) into Eq. 2, which allowed detections to accrue faster than binomial:
)1(,)1(1 ,,,,
jjiN
kjikji rpθ+
−−= (3)
We considered two site-specific covariates – land-use type (LU) and fine-scale habitat disturbance
(HD) – acting on individual-level detection probabilities, and used a logit link function to keep ri,j,k on
the probability scale. We also included a 2nd-degree polynomial term for habitat disturbance, to allow
for unimodal responses.

Chapter 5: Mammalian species abundance responses to land-use change
147
We did not expect large variation in detection probability due to changes in the effectiveness of either
live- or camera-trapping with land-use or habitat disturbance, so we interpret any differences to be
largely due to the responses of species themselves to these factors. In particular, range sizes and
movement speeds may change across land-use, affecting the probability that an individual passes a
sampling point. Habitat disturbance may affect this probability too, by filtering species according to
the fine-scale habitat preferences of each species, which we have previously shown to affect trapping
rates (Chapter 2) and community composition per se (Chapter 4).
We accounted for differences in detection probability between live-trapping and camera-trapping by
including a covariate for trap-type. Given the small size of our live traps, we set individual detection
probabilities to zero for species which could never be caught with this method (by multiplying ri,j,k by
a binary matrix describing the availability of each species to trapping for each observation Di,j,k), but
considered that all species could theoretically be caught by the highly sensitive camera traps we were
using (even though not all species were camera-trapped).
The linear predictor for the observation component of our model was therefore:
logit(ri,j,k) = ×+ −LUrlj
rkj
,1,, βα LUi,l-1 ×+ HDr
j,β HDi ×+
2,HDrjβ HD 2
i (4)
where LUi,l-1 was a two-column matrix of dummy variables coding for the logged forest and oil palm
land-use (l) types, and the parameter for old-growth forest was integrated into the intercept. We note
that our model for the observation process assumes that all heterogeneity in detection probability is
either induced by variation in abundance or else by the covariates we included in the model. In
particular, heterogeneity induced by the proximity of trap locations to the centres of activity of
individual animals is not included.
For the ecological component of our model, we introduced a land-use filter (Ωj) which determined
whether a given land-use (l) was occupied by the species (wj,l = 1) or not (wj,l = 0). Ωj can be thought

Chapter 5: Mammalian species abundance responses to land-use change
148
of as the occupancy probability at the level of land-uses, rather than the traditional point-level
occupancy probability, and provides a source of zero-inflation in our model.
wj,l = Bernoulli(Ωj) (5)
For species which were detected in a given land-use during sampling, wj,l will be equal to 1 in every
MCMC iteration. Otherwise, wj,l varies across iterations, and the mean of these values provides the
probability that the species occupies the given land-use, despite not being detected. If a species was
present, it was assumed that individuals were randomly distributed in space, meaning that the
expected abundance at a sampling point would follow a Poisson distribution with intensity λij, so that
Ni,j = Poisson(λi,j) × wj,l (6)
The Poisson intensity for a given species represents the number of individuals using a given sampling
point in a given sampling session. We stress that this is not equivalent to animal density and will be a
function of the effective trapping area for each species, as is also true of occupancy estimates (Efford
& Dawson, 2012). In order to make density comparisons across species, it would be necessary to
make further assumptions, in particular that species home range sizes are comparable. However, our
abundance estimates likely serve as a good index of density changes across the land-use gradient,
given that we controlled for detectability by land-use category and habitat disturbance. This means
that changes in the availability of animals for trapping, for example due to changes in the size of their
home range, will be accounted for. We also note that the number of individuals using a given point in
space is an ecologically-relevant state variable, with potential implications for ecosystem function.
We modelled species abundances as a function of site-specific covariates and both spatial and
temporal additive random effects for each species, using a log link function to constrain Nij to be
positive. Spatial random effects accounted for the clustered sampling design we used, with sampling
points nested within plots, in turn within blocks. A temporal random effect of year enabled us to
account for varying abundance across the multiple years of our study. We considered year to be a
random effect, rather than modelling abundance as a function of covariates or using an explicit
population model, since any temporal variation was not a focus of the analysis presented here.

Chapter 5: Mammalian species abundance responses to land-use change
149
The site-specific covariates for abundance were either 1) categorical land-use types or 2) continuous
metrics of above-ground live tree biomass (AGB) and percent forest cover (FCOV), both calculated as
means within 500 m radius buffers around each sampling point (further details on the mapping of
AGB and forest cover are provided in Chapter 4). We have previously used this buffer size to
investigate community composition responses in the same study sites (Chapter 4). To allow for
unimodal responses, we also included a 2nd-degree polynomial term for AGB. We did not include a
polynomial term for FCOV because we had insufficient coverage of the covariate’s full range, which
meant that we did not have sufficient information to resolve any particular non-linear form of the
response.
The linear predictor for the categorical model (CAT) was therefore
log(λij) = ×+ −LU
ljCAT
j,
1,, λλ βα LUi,l-1
CATji
CATji
CATji ,,, εδγ +++ (7)
where γi,j, δi,j and εi,j represent the plot, block and year random effects, respectively. The linear
predictor for the continuous metric model (CONT) was
log(λij) = ×+ AGBj
CONTj
,, λλ βα AGBi ×+2,AGB
jλβ AGB 2
i ×+ FCOVj
,λβ FCOVi (8)
CONTji
CONTji
CONTji ,,, εδγ +++
Species-specific slope and intercept parameters in the link functions for the observation and
ecological model components were drawn as random effects from a normal distribution defined by
hyperparameters for the overall mean and standard deviation for the metacommunity. The land-use
filter Ωj and spatial and temporal random effects terms were estimated separately for each species.
Considering species as random effects is the key advantage of this class of multi-species hierarchical
models, and allows for inference about the rarest and most infrequently detected members of a
community by “borrowing strength” from the rest of the data. Necessarily, this involves making a
trade-off for well-sampled species which could have been modelled independently, given that
parameter estimates for species are pulled towards the overall community mean by way of
“shrinkage”. One way to mitigate this is to divide a community into sub-groups of ecologically-

Chapter 5: Mammalian species abundance responses to land-use change
150
similar species which are hypothesised to respond to the modelled covariates in a similar way
(Dorazio et al., 2011). In our case, we did not have any strong a priori justifications for sub-groups of
species, and modelled all species together.
Hierarchical models with random effects, such as the model outlined here, are analytically and
computationally intractable in a maximum likelihood framework (Dorazio et al., 2011), but MCMC
methods, applied within a Bayesian inference framework, can now be readily applied in such cases.
We wrote the model in the BUGS (Bayesian inference Using Gibbs Sampling) language (provided in
Appendix C) and used JAGS (Just Another Gibbs Sampler) version 3.4.0 (Plummer, 2013), called
using the runjags 1.2.1-0 package (Denwood, 2015) in R, to obtain the MCMC samples of the joint
posterior distribution. We used standard uninformative priors for all parameters (Kéry & Schaub,
2012): a flat normal prior for intercept and slope parameters, and a wide uniform prior for variance
parameters (Appendix C). As an exception to this, we used a half-Cauchy prior for the temporal
random effects, which is recommended for random effects with fewer than five levels (Gelman,
2006). All continuous covariates were centred to a mean of zero and scaled to unit standard deviation
prior to analysis, to assist with model convergence (Kéry & Schaub, 2012). We ran three MCMC
chains for 200,000 iterations each, thinning by a factor of 10 and discarding the first 80,000 iterations
as “burn-in”. To judge convergence, we visually inspected chains for good mixing and non-
directionality and checked that the Gelman-Rubin statistics (Gelman & Rubin, 1992) for all
parameters were < 1.1. We also assessed the goodness-of-fit of our model with a posterior predictive
check, based on the χ2 discrepancy statistic for binomial data (Kéry & Schaub, 2012; Tobler et al.,
2015).
Derived parameters, which carry over all sources of estimation uncertainty, are relatively
straightforward to calculate in a Bayesian framework using the marginal posterior distributions of
parameters. In particular, we calculated the mean abundance, summed abundance and summed
biomass for each of the ecological trait groups we were interested in. We also estimated the
Chapter 5: Mammalian species abundance responses to land-use change
151
probability of each species and trait-defined group declining at each transition along the categorical
land-use gradient (i.e. from old-growth forest to logged forest, and from logged forest to oil palm
plantation) by calculating the proportion of times abundance declined across the MCMC iterations.
Functional effects groups based on diet were mutually-inclusive groups (i.e. all species implicated in
leaf-eating, fruit-eating, seed-eating, bark-eating, root-eating, fungi-eating, invertebrate predation or
vertebrate predation), and we focussed on the summed local biomass of each group in this case, rather
than abundance. We used the median to summarise across MCMC iterations in all cases, owing to the
skew that was evident in the marginal posterior distributions of some parameters.
Species body masses were obtained from the PanTHERIA database (Jones et al., 2009) and Payne et
al. (2007). If a range of masses was provided, we took the mid-point. Small mammals were defined as
species never exceeding 1 kg. Species of high conservation concern were defined as those listed as
threatened (Critically Endangered, Endangered or Vulnerable) or ‘data deficient’ (n = 4) on the IUCN
(2014) Red List. Information on mammal diets was based on Langham (1983), Emmons (2000),
Payne et al. (2007) and, for scavenging records, Edwards et al. (2014), as well as our own field
observations.
5. 3. Results
A total of 4,381 live trap captures and 15,148 independent camera trap captures were made, for 57
mammal species. After reducing these data into detections or non-detections within sampling
occasions (17,025 live trap occasions and 5,428 camera trap occasions), this translated into 4,284 live
trap detections of 23 species, and 7,772 camera trap detections of 53 species (19 species were
common to both sampling methods). We also had a limited number of captures (mostly ≤ 2 per
species) for nine additional mammal species which we classified as obligate arboreal species (listed in
Appendix B, Table B2) and which we did not include in our abundance models. We did not, however,
exclude all rare species, with four terrestrial or scansorial species present in our models which were

Chapter 5: Mammalian species abundance responses to land-use change
152
captured fewer than five times (Hose’s civet Diplogale hosei, Malay weasel Mustela nudipes, plantain
squirrel Callosciurus notatus and western tarsier Cephalopachus bancanus).
The posterior predictive checks indicated that our models were an adequate reflection of the
ecological and observational processes generating the data (categorical land-use model: Bayesian p-
value, )Pr( 22simulatedobserved χχ > = 0.66, lack-of-fit statistic = 1.08; continuous metric model: p = 0.64,
lack-of-fit = 1.08). We also calculated Bayesian p-values for each species within our model
(Appendix B, Table B1); this indicated poor fit for three of the 57 species (red spiny rat Maxomys
surifer, brown spiny rat Maxomys rajah and long-tailed giant rat Leopoldamys sabanus), suggesting
caution is needed with respect to inferences about the absolute abundances of these species. In
particular, we suspect the poor fit in these cases is due to substantial heterogeneity in the individual
detection probability r, likely induced by the fine-scale patterns of space-use in these species. By
analogy with heterogeneity in a capture-recapture framework, we would expect this to exert negative
bias (Otis et al., 1978), and our estimates are therefore likely to be conservative for these species.
Based on the hyperparameter estimates, mean abundance across the mammal community was
marginally higher in logged forest compared to old-growth forest (Pr )0( , >LULoggedλβ = 0.81), but much
lower in oil palm compared to either of the two forest land-uses (Pr =< )0( ,LUOilPalmλβ 1.00). These
overall trends, however, belie substantial differences among species groups (Fig. 2) and among
individual species (Fig. 3; Appendix A, Fig. A5). From old-growth to logged forest, large mammals
exhibited a modest (11%) increase in mean abundance, but small mammals increased substantially
(by 169%). The mean abundance of high conservation concern species was similar, or increased, in
logged forest compared to old-growth forest (Fig. 2), but dropped precipitously (by 83%) in oil palm.
In contrast, the abundance of low conservation concern species was largely robust to the land-use
gradient, whilst invasive species increased substantially along the land-use gradient (Fig. 2). The
mean abundance of all trophic guilds except frugivores increased from old-growth to logged forest,
whilst the abundance of all guilds except carnivores declined in oil palm (Fig. 2). The trends in

Chapter 5: Mammalian species abundance responses to land-use change
153
summed abundances and biomasses for each trait-defined group were largely similar to those for
mean abundance (Appendix A, Fig. A1). However, the relatively modest abundance increases in
herbivores (19%) and threatened species (26%) in logged forest were much more prominent in terms
of biomass (140% and 108%, respectively), due to increases in large-bodied species in these groups
(e.g. sambar deer Rusa unicolor, banteng and Asian elephant). Similarly, large changes in mean
abundance apparent in omnivores (100%) were not as strong in terms of biomass (51%), because
these abundance changes were partly driven by small-bodied murid rodent species. The summed
biomasses of functional effects groups were maintained, or increased, from old-growth to logged
forest, but from forest to oil palm substantial declines were evident in all cases except vertebrate
predation (Fig. 4). For individual species, the mean number of individuals per sampling point was
relatively low (< 1; Appendix A, Fig. A5) in most cases, reflecting the patchy occurrence of species in
space. There was large uncertainty about abundance for the rarest species, which properly reflects the
information present in the data and underlines the importance of accounting for all sources of
uncertainty during modelling (observational as well as ecological), but abundance estimates across
land-use were nonetheless biologically plausible in all cases.
Figure 2. Mean species abundance across land-use categories, partitioned by ecological response groups defined by body size (large and small mammals), conservation status (threatened, non-threatened), native status (only invasives shown) and trophic guild (five mutually-exclusive feeding guilds). Error bars indicate 90% credible intervals.

Chapter 5: Mammalian species abundance responses to land-use change
154
Figure 3. Probabilities of a decline in abundance (calculated across MCMC iterations) from old-growth to logged forest (orange) and from logged forest to oil palm (purple), for each ecological response group and each species. We did not calculate the probability of decline from logged forest to oil palm for four species which were not recorded in logged forest.

Chapter 5: Mammalian species abundance responses to land-use change
155
Figure 4. Summed local biomass across land-use categories, partitioned by functional effects species groups based on diet. Each group is mutually-inclusive such that all species engaging in the given function are included in the group, meaning that some species are included in multiple groups. Error bars indicate 90% credible intervals.
Abundance responses were broadly negative for AGB (Pr AGB,( λβ < 0) = 0.96) and broadly positive
for forest cover (Pr FCOV,( λβ > 0) = 1.00; Figs. 5-6; Appendix A, Figs. A2-3). The effect of forest
cover was stronger, albeit more uncertain, than the effect of AGB (standardised hyperparameter
estimates with 90% credible intervals: AGB,λβ = -0.18, 90% CI: -0.01 – -0.35; 2,AGBλβ = -0.10, 90%
CI: -0.003 – -0.22; FCOV,λβ = 0.68, 90% CI: 0.38 – 0.98), and this was also true at the level of
individual species in most cases (Appendix A, Figs. A6-7). There was weak evidence, overall, of
unimodal responses to AGB (2,AGBλβ overlapped zero, Pr
2,( AGBλβ < 0) = 0.90), and this was also
generally the case for individual species, although some species (e.g. long-tailed giant rat, Low’s

Chapter 5: Mammalian species abundance responses to land-use change
156
squirrel Sundasciurus lowii, orangutan Pongo pygmaeus, plain treeshrew Tupaia longipes and sambar
deer) exhibited evidence of a threshold response in which increases in abundance with decreasing
AGB were not maintained below ~ 90 Mg/ha (Appendix A, Fig. A6). All ecological response trait
groups showed increased mean abundance under the decreases in AGB which accompany logging,
with the exception of frugivores (Fig. 5A). However, the increases were most stark in omnivores,
small mammals and non-natives (Fig. 5A), all groups which are dominated by murid rodent species.
All ecological response trait groups showed large abundance reductions in response to reduced forest
cover, except carnivores and non-natives (Fig. 6A). In fact, mean carnivore abundance exhibited a
unimodal response curve, being lowest at ~ 70% forest cover. This reflected a shift from native, forest
predators such as the yellow-throated marten Martes flavigula and Sunda clouded leopard Neofelis
diardi to native and non-native carnivores tolerant of more open habitats, such as the leopard cat
Prionailurus bengalensis, Malay civet Viverra tangalunga and domestic dog (Appendix A, Fig. A7).
For the continuous metrics, we also calculated the mean across species of the percentage change in
abundance along the land-use gradient (effectively giving each species equal weight, irrespective of
their absolute abundance). The mean percentage changes exhibited similar trends to the mean
abundance of each species group (Figs. 5B and 6B), except there was stronger evidence in some
groups of lower rates of abundance increases, or even decreases in abundance, at lower values of
AGB (< 90 Mg/ha), and there was no evidence of a recovery in carnivore abundance at low forest
cover (because, for mean abundance, responses were driven largely by the abundance of three
carnivores in particular: leopard cat, Malay civet and domestic dog). The biomass responses of the
dietary functional effects groups to declines in AGB were largely positive, whilst they were largely
negative under declines in forest cover, except in the case of vertebrate predation (Appendix A, Fig.
A4).

Chapter 5: Mammalian species abundance responses to land-use change
157
Figure 5. Mean abundance (A) and mean percentage change (B) across species as a function of above-ground live tree biomass in a given local landscape, partitioned by ecological response groups defined by body size, conservation status, native status (only invasives shown) and trophic guild. Percentage change refers to the change relative to the abundance at AGB values typical of intact forest (400 Mg/ha). Forest cover was fixed at 100%. 90% credible intervals (in grey) indicate uncertainty surrounding median estimates across MCMC iterations (red line). Greater uncertainty in panel B reflects the uncertainty about species-specific responses.

Chapter 5: Mammalian species abundance responses to land-use change
158
Figure 6. Mean abundance (A) and mean percentage change (B) across species as a function of forest cover in a given local landscape, partitioned by ecological response groups defined by body size, conservation status, native status (only invasives shown) and trophic guild. Percentage change refers to the change in abundance as forest cover decreases from 100%. Above-ground live tree biomass was fixed at the average across oil palm locations. 90% credible intervals (in grey) indicate uncertainty surrounding median estimates across MCMC iterations (red line). Greater uncertainty in panel B reflects the uncertainty in individual species responses.
Chapter 5: Mammalian species abundance responses to land-use change
159
Individual detection probabilities were, based on the overall estimated hyperparameters, higher using
camera traps rCameraα( = 0.023 for 5 camera trap nights, 90% CI: 0.013 – 0.038) than live traps r
Liveα( =
0.017 for 2 live trap nights, 90% CI: 0.006 – 0.043). Whilst this was true overall, live traps resulted in
higher detectability for nine small mammal species (Appendix A, Fig. A8). Detection probabilities
were, overall, marginally highest in old-growth forest, followed by logged forest LUrLogged
,(β = -0.13,
90% CI: -0.32 – 0.05; Pr )0( , <LUrLoggedβ = 0.89) and oil palm LUr
OilPalm,(β = -0.34, 90% CI: -1.38 – 0.30; Pr
)0( , <LUrOilPalmβ = 0.80). The effect of fine-scale habitat disturbance on individual detection probabilities
was positive overall (i.e. negative for increases in the habitat score; HDr ,β = -0.09, 90% CI: -0.01 – -
0.17) and there was some evidence of a unimodal response 2,( HDrβ = -0.03, 90% CI: -0.06 – 0.01; Pr
2,( HDrβ < 0) = 0.90). However, there was substantial variation in the response of individual species
(Appendix A, Fig. A9), reflecting contrasting patterns of fine-scale habitat-use. In addition, the
absolute detectability of different species showed marked variation, as expected from the differences
across species in body size, movement rates and degree of scansorial behaviour. Correcting for
detectability resulted in substantial alterations in the abundance ranks of some species, compared to
ranks based only on the number of independent captures (Appendix A, Fig. A10). This was especially
true in old-growth forest, and in particular for the yellow muntjac Muntiacus atherodes, brown spiny
rat, lesser mouser-deer Tragulus kanchil, greater mouse-deer T. napu and thick-spined porcupine
Hystrix crassispinis. Nonetheless, abundance ranks calculated using model estimates and the number
of independent captures were strongly correlated (rOld-growth = 0.79, rLogged = 0.85, rOilPalm = 0.84) and
ranks were not significantly different (Wilcoxon signed-rank test, old-growth forest: V = 950, p =
0.33; logged forest: V = 708, p = 0.87; oil palm: V = 756, p = 0.91). This suggests that the uncorrected
number of captures provides a similar snapshot of community structure to that revealed by local
abundance. However, this may not be the case for comparisons over space or time if detectability also
varies.
Chapter 5: Mammalian species abundance responses to land-use change
160
5. 4. Discussion
Mammalian abundance was conserved, or increased, from old-growth to logged forest overall, whilst
it declined substantially from forest to oil palm plantations. This was true of mean mammal
abundance, summed abundance and total biomass. Mammalian abundance (mean and summed) and
biomass responses to decreases in local landscape AGB due to logging were positive (and weakly
unimodal), but were strongly negative for decreases in local landscape forest cover. Although this is
the first time, to our knowledge, that a robust assessment of Southeast Asian mammal abundance has
been made along the principal land-use gradient in the region, these findings at the community level
broadly agree with the consensus from past studies of abundance responses (all of which used
detection frequencies) in small mammal communities (Wells et al., 2007; Bernard et al., 2009) and
large mammal communities (Imai et al., 2009; McShea et al., 2009; Samejima et al., 2012).
There are strong a priori reasons to expect these responses in mammals. Selective logging in
Southeast Asia primarily targets members of the Dipterocarpaceae, which few mammals make use of
to any significant degree in their diet (Meijaard et al., 2005), whilst at the same time logging creates
canopy openings which stimulate the growth of understorey vegetation, thereby increasing the food
resources available to terrestrial grazer-browsers and frugivores (Davies et al., 2001), and increasing
the availability of favourable microhabitats for small mammals (Cusack et al., 2015). In contrast, the
conversion of forest to oil palm likely removes the food resources and foraging or resting
microhabitats suitable for most mammals, especially in intensively-managed industrial plantations,
which typically limit the growth of most non-commercial plant species (Luskin & Potts, 2011).
More broadly across other taxonomic groups in Southeast Asia, few studies have investigated
abundance responses (and rarely using robust estimation methods), but apparent trends have usually
been similar to our results for mammals. Abundance in logged areas has usually been found to be
maintained at a community level (ants: Luke et al., 2014; birds: Edwards et al., 2011; butterflies:
Willott et al., 2000; dung beetles: Slade et al., 2011, isopods: Hassall et al., 2006), but substantially
declines in oil palm plantations (e.g. birds: Edwards et al., 2010; arthropods: Turner & Foster, 2008).

Chapter 5: Mammalian species abundance responses to land-use change
161
In some cases, however, apparent declines in abundance have also been noted for some groups in
logged areas (e.g. birds: Edwards et al., 2009; termites: Jones et al., 2003 and Luke et al., 2014), as
well as increases in oil palm plantations (e.g. isopods: Hassall et al., 2006; dung beetles: Chung et al.,
2000), contrary to our findings for mammals. It is difficult to reconcile these reported changes with
the apparent consensus from other studies in part because detectability has not been accounted for, as
the researchers note in some cases (Edwards et al., 2009), but there are also mechanistic explanations
for the atypical responses seen in some specialised groups (e.g. Jones et al., 2003; Hassall et al.,
2006).
The evidence overall, taken together with our findings for mammals, increasingly supports the view
that large, contiguous areas of logged forest in Southeast Asia not only conserve similar levels of
species richness to old-growth forest (Edwards et al., 2014; Chapter 3), but they also conserve the
community-level abundance of many groups. This adds further emphasis to the calls for increasing
recognition of logged and degraded forests as an essential part of the conservation estate (Wilson et
al., 2010; Berry et al., 2010; Edwards & Laurance, 2011; Edwards et al., 2011; Struebig et al., 2015a).
Remaining old-growth forests, which are undoubtedly the absolute highest priority for conservation
(Gibson et al., 2011), have largely already been gazetted in protected areas and degraded forests have
been the primary source of new land for expanding plantations in the region (Gunarso et al., 2013).
Degraded forests could represent a relatively low opportunity-cost option for conservation, given that
much of their timber value has been extracted (Wilson et al., 2010; Fisher et al., 2011b; Edwards et
al., 2014a). Our study is also one of the few studies which has been undertaken in repeatedly-logged
forests (Edwards et al., 2011, 2014a; Woodcock et al., 2011; Struebig et al., 2013), and the finding
that mammal community richness and abundance is maintained even in these heavily-degraded
forests, further strengthens the argument for low-cost conservation in such areas. Our findings with
respect to the community richness (Chapter 3) and abundance of mammals in oil palm also support
previous assertions of the very limited conservation role played by this land-use type (Edwards et al.,
2010b, 2014a).

Chapter 5: Mammalian species abundance responses to land-use change
162
By assessing almost the whole non-volant mammal community, we were also able to go further than
previous studies in the region and assess the abundance responses of important sub-groups of
mammals defined by their traits, as well as the potential functional effects of changes in abundance
across the community. We found that, for almost all response trait groups, logged forests retained
similar or higher abundances (mean and summed across species) and summed biomasses compared to
old-growth forest. This was also true for the biomasses of functional effects groups we examined, a
finding which is consistent with other evidence that the functional role of vertebrates increases in
logged relative to old-growth forests (Ewers et al., 2015). Moreover, these group-level increases were
largely maintained even at very low levels of AGB in a local landscape, indicative of high levels of
logging disturbance. On the other hand, our results indicate that conversion to oil palm, and
reductions in forest cover, cause declines in the abundance (mean and summed) and summed biomass
of almost all the trait-defined sub-groups we examined (not carnivores and invasives), as well as in
the biomasses of almost all the functional effects groups (not vertebrate predation).
The increase in the mean and summed abundance of small mammals was substantial in logged forest
(and also in response to declining AGB), similar to findings elsewhere in tropical forests (Isabirye-
Basuta & Kasenene, 1987; Lambert et al., 2006), and was much more dramatic than in large
mammals. We suggest that this is driven, in part, by an expansion in the area covered by
microhabitats which small mammals, in particular murid rodents, use for foraging and concealment
from predators (Cusack et al., 2015). In addition, populations of murid rodents in undisturbed
dipterocarp forests of the region are likely constrained by the supra-annual pulses in fruit and seed
availability which are a defining feature of these systems (Curran & Leighton, 2000). However, we
also note that the biomass increase in large mammals was much greater than the modest change in
mean abundance suggested, and was two orders of magnitude larger in absolute terms compared to
the increase in small mammals. Much of this increase was driven by increases in the mean abundance,
and average body size, of the herbivore trophic guild. This may have much greater implications for
ecosystem functions, such as seedling recruitment rates (Howlett & Davidson, 2003; Harrison et al.,
2013) and nutrient cycling (Wardle & Bardgett, 2004; Nichols et al., 2008; Doughty et al., 2013) than

Chapter 5: Mammalian species abundance responses to land-use change
163
the increased abundance of small mammals, even though small mammals may be significant seed
predators in these forests on a per capita basis (Blate et al., 1998; Wells & Bagchi, 2005).
Among other trophic guilds, we found that omnivores increased markedly in logged compared to old-
growth forest. Wide dietary breadth has often been proposed as a trait conferring increased resistance
to extinction (Laurance, 1991; McKinney, 1997), but support for its advantages under disturbance has
often been mixed (e.g. Posa & Sodhi, 2006; Gray et al., 2007; Rickart et al., 2011), perhaps because
dietary flexibility, rather than breadth per se, may be the more critical trait. Dietary flexibility is more
difficult to measure, and is poorly known for Bornean mammals, but we would expect that most of the
omnivorous species in our dataset (i.e. murid rodents, bearded pig and sun bear Helarctos malayanus)
also exhibit high dietary flexibility (Caldecott et al., 1993; Fredriksson et al., 2006). For insectivores,
some studies on birds have shown a disproportionate sensitivity to logging (Lambert & Collar, 2002;
Edwards et al., 2009), and disturbance more generally (Gray et al., 2007), which we did not find for
mammals. The abundance responses of insects, and invertebrates more generally, to logging is poorly
known in Southeast Asia, but we note that, at our study sites, invertebrate biomass is apparently
higher in logged forest compared to old-growth forest (Ewers et al., 2015), potentially indicating that
food resources for insectivorous mammals are conserved. For carnivores, we would expect numerical
responses to the abundance of vertebrate prey species. Most of the carnivores we studied, and in
particular the felids, focus on mammal prey such as murid rodents (Grassman et al., 2005; Rajaratnam
et al., 2007; Shehzad et al., 2012), which we have shown here are conserved in logged forests.
Frugivory is a trait which has often been associated with an increased susceptibility to disturbance
(Johns & Skorupa, 1987; Gray et al., 2007), but it is not clear whether logging causes a consistent
decline in fruit availability across species or not (Wong, 1986; Heydon & Bulloh, 1997; Munshi-
South et al., 2007). Certainly, some key fruiting resources such as hemi-epiphytic figs are often much
reduced after logging (Lambert, 1991), but the availability of small fruit on lianas and understorey
shrubs might increase in gaps or along edges (Davies et al., 2001; Meijaard et al., 2005). Frugivores
exhibited no changes in abundance from old-growth to logged forest, but modelling using the
continuous AGB metric revealed a modest decline in abundance with increasing logging disturbance.

Chapter 5: Mammalian species abundance responses to land-use change
164
We note, however, that the summed biomass of all species engaging in fruit-eating did not decline,
suggesting frugivory as a function may be resilient to logging, even though specialist frugivores do
not fare as well as other groups. Finally, of crucial conservation relevance, we found that the
abundance of high conservation concern species was retained in logged forests, and that this group
was resilient even to high intensities of logging (low levels of AGB) in a given landscape. We should
emphasise, however, that this does not necessarily mean that high conservation concern species would
persist in hypothetical landscapes consisting of homogeneously low AGB areas; AGB values refer to
an average over a local landscape, and will contain some patches of less intensively logged forest, as
well as areas that are heavily-disturbed.
Overall, we have shown that no trait-defined group suffered substantial losses in logged forest, and
that the functional effects we examined were also resilient to logging. These findings further
strengthen our arguments about the high conservation importance that logged forests, even those that
are repeatedly-logged, should be assigned in regional- or landscape-level land-use planning exercises.
In a positive move in this direction, palm oil producers, traders and buyers are increasingly
recognising the reputational risk of being associated with deforestation in their supply chain, and
many have now made commitments to help curtail the conversion of forest to oil palm. Applying this
in practice requires a consistent definition of forested land, as opposed to degraded scrub land, and the
possibility of using a carbon-based definition has arisen repeatedly during these discussions, in
particular a threshold of ≥ 35 MgC/ha to define High Carbon Stock (HCS) forest (Greenpeace, 2013;
Poynton, 2014). This is equivalent to an AGB of ~ 74 Mg/ha (assuming that carbon constitutes 47%
of live tree biomass; Martin & Thomas, 2011), which could, if our findings apply more broadly in the
region, yield major conservation benefits for mammals over the business-as-usual.
The biggest caveat to this conclusion is that bushmeat hunting, which often accompanies logging
(Bennett & Gumal, 2001), is strictly controlled. Brodie et al. (2015) investigated the effects of logging
on large mammal occupancy in the context of much higher levels of hunting than was present in our
study (~ 3% of days at a given camera trap location with ≥ 1 hunter detections, compared to < 0.001

Chapter 5: Mammalian species abundance responses to land-use change
165
% across forest locations in this study), finding strongly negative effects of recent logging (≤ 10 years
prior to sampling, similar to our study), possibly due to the synergistic effects of logging and hunting
in combination. We emphasise that the huge conservation potential of HCS forests for mammals will
only be realized with additional investment in protection, as well as investment in education and
livelihoods for communities in the vicinity of HCS forests.
Our conclusions concerning the conservation potential of oil palm are less optimistic. Although the
plantations in which we sampled may represent something of a best-case scenario for oil palm, with
relatively high levels of landscape forest cover and strict enforcement of hunting bans, our modelling
of mammal abundance as a function of forest cover indicates only a very limited potential for
conservation gains by attempting a land-sharing, ‘wildlife-friendly’ approach (e.g. Bhagwat & Willis,
2008; Koh, 2008; Koh et al., 2009) to this land-use. Increases in local landscape forest cover from 0 to
30%, the likely range which could realistically be manipulated in oil palm landscapes, resulted in very
limited abundance increases across species groups and across most individual species within the oil
palm crop, suggesting only a limited degree of ‘spill-over’ from remnant forest patches. Among
trophic guilds, only carnivores showed some resilience to decreases in forest cover, but this was in
large part driven by increases in free-ranging domestic dogs, which are considered a detrimental
invasive species across Asian landscapes (Azhar et al., 2013; Hughes & Macdonald, 2013). We did
not sample remnant forest fragments within the oil palm, but it is unlikely that the abundance and
richness of mammals in these areas would approach that of contiguous forest (Bernard et al., 2014),
even if individuals present in the oil palm crop itself were also counted. Overall, this indicates that a
land-sparing approach might better serve mammal conservation in the region, in which companies
intending to invest in on-site conservation, for example by retaining small forest patches in their
concession, are instead encouraged to invest in the conservation of equivalent, or larger, areas of
contiguous forest off-site, for example by way of a regional ‘bio-bank’ (Edwards et al., 2010b). As a
caveat to this, there may be the potential for ‘win-win’ solutions for both conservation and oil palm
yield, such as in the bio-control of pest species, and in this case on-site conservation activities should
be encouraged (Foster et al., 2011). In particular, the high abundance of leopard cats we found within

Chapter 5: Mammalian species abundance responses to land-use change
166
the oil palm crop, and the low abundance of murid rodents, suggests a likely role for this species in
bio-control (Silmi et al., 2013), though the necessary habitat conditions for the persistence of this
species remain inadequately known (Rajaratnam et al., 2007; Jennings et al., 2015).
In common with studies of other taxonomic groups in oil palm (Senior et al., 2012), we found that a
small number of species became dominant in the plantations (even reaching abundances exceeding
those in natural forest), and that the resilient species could not necessarily be predicted from
abundances in natural forest or the abundance responses to logging. These ‘winner’ species were
primarily carnivorous species, preying upon murid rodents (Whitehead’s rat Maxomys whiteheadi and
black rat Rattus rattus), herptiles and birds, and possibly benefitting from increased hunting success in
the open oil palm habitats (Rajaratnam et al., 2007). This underlines the often idiosyncratic nature of
abundance responses to intense disturbance by individual species, and supports the need for studies
which are designed to address specific conservation and management questions at the local scale. In
contrast to the strong metacommunity filter that oil palm represented, logging resulted in a more
continuous gradient of abundance responses across species (Fig. 3), perhaps reflective of the fact that
selective logging, to a greater or lesser extent, exaggerates the natural dynamics of gap creation and
succession. Species of globally high conservation concern which were most affected by logging
included both of the insectivorous civets, the banded civet Hemigalus derbyanus and Hose’s civet, as
well the tufted ground squirrel Rheithrosciurus macrotis and binturong Arctictis binturong. Our
metacommunity model also provided information on the patterns of fine-scale habitat-use across
species, revealing that some species – including invasives (Polynesian rat Rattus exulans, black rat
and domestic dog), macaque species and grazing herbivores (Asian elephant, banteng and sambar
deer) – preferred to use highly-disturbed log-landing areas and roads, whilst others actively avoided
these features – including treeshrews (Tupaia tana and T. longipes), some murid rodents (Maxomys
surifer and Leopoldamys sabanus) and the bay cat Pardofelis badia (Appendix A, Fig. A9).
Using a novel hierarchical model for a Southeast Asian mammal metacommunity, applied to one of
the largest mammal datasets across land-use to date, we have shed light on the contrasting abundance

Chapter 5: Mammalian species abundance responses to land-use change
167
responses to logging and conversion to oil palm, as well as the responses to the continuous metrics of
logging intensity and forest cover loss, both of which are directly relevant to conservation and
management at local scales. Our approach, which can integrate data from multiple sources, could be
applied to other taxonomic groups, and allow for more robust inferences with respect to the impacts of
land-use change in Southeast Asia. We anticipate that this will help resolve apparently contradictory
responses reported by previous studies, by properly accounting for all sources of uncertainty
surrounding estimates, and pave the way for improved biodiversity forecasting and more effective
decision-making in the face of biodiversity trade-offs across land-use.

Chapter 5: Mammalian species abundance responses to land-use change
168
Appendices
Appendix A – Supplementary figures
Figure A1. Summed abundance (A) and local biomass (B) as a function of land-use categories, partitioned by ecological response groups defined by body size, conservation status, native status (only invasives shown) and trophic guild. Error bars indicate 90% credible intervals.

Chapter 5: Mammalian species abundance responses to land-use change
169
Figure A2. Summed abundance (A) and local biomass (B) as a function of the average above-ground live tree biomass within a given local landscape, with forest cover fixed at 100%. Estimates were derived for ecological response groups defined by body size, conservation status, native status (only invasives shown) and trophic guild. 90% credible intervals (in grey) indicate uncertainty surrounding median estimates across MCMC iterations (red line).

Chapter 5: Mammalian species abundance responses to land-use change
170
Figure A3. Summed abundance (A) and local biomass (B) as a function of forest cover within a given local landscape (defined using a 500 m radius buffer). Above-ground live tree biomass was fixed at the average across oil palm locations. Estimates were derived for ecological response groups defined by body size, conservation status, native status (only invasives shown) and trophic guild. 90% credible intervals (in grey) indicate uncertainty surrounding median estimates across MCMC iterations (red line).

Chapter 5: Mammalian species abundance responses to land-use change
171
Figure A4. Summed local biomass responses to above-ground live tree biomass (A) and forest cover (B) in a given landscape (with other parameters fixed in each case), for functional effects groups based on diet. Each group is mutually-inclusive, so that all species engaging in the given function are included in the group. 90% credible intervals (in grey) indicate uncertainty surrounding median estimates across MCMC iterations (red line).

Chapter 5: Mammalian species abundance responses to land-use change
172
Figure A5. Abundance estimates for each of 57 mammal species across categorical land-uses. Error bars indicate 90% credible intervals.

Chapter 5: Mammalian species abundance responses to land-use change
173
Figure A6. Abundance for each of 57 mammal species, as a function of above-ground live tree biomass in a given landscape, with forest cover fixed at 100%. 90% credible intervals (in grey) indicate uncertainty surrounding median estimates across MCMC iterations (red line).

Chapter 5: Mammalian species abundance responses to land-use change
174
Figure A7. Abundance for each of 57 mammal species, as a function of local landscape forest cover, with above-ground live tree biomass fixed at the average for oil palm. 90% credible intervals (in grey) indicate uncertainty surrounding median estimates across MCMC iterations (red line).

Chapter 5: Mammalian species abundance responses to land-use change
175
Figure A8. Individual detection probability estimates across species and land-uses, for two sampling methods (live- and camera-trapping). Probabilities are per sampling occasion (two and five trap nights for live-trapping and camera-trapping, respectively). Error bars indicate 90% credible intervals. Estimates were made at a habitat score of 3.

Chapter 5: Mammalian species abundance responses to land-use change
176
Figure A9. Individual detection probability for each species as a function of the habitat score at a sampling point, indicative of fine-scale disturbance (low habitat scores indicate high disturbance), and for each of the land-use types. Estimates relate to detectability using camera traps (per five trap nights of sampling).

Chapter 5: Mammalian species abundance responses to land-use change
177

Chapter 5: Mammalian species abundance responses to land-use change
178
Figure A10. Comparison of relative abundance across land-use types for a hierarchical state-space model and a naïve index based on detection frequencies. Relative abundance was calculated separately for the modelled estimates and the detection frequencies, and was obtained by standardising values for each species according to the maximum value obtained for any species in any land-use. Species are ranked by their modelled abundance estimates.

Chapter 5: Mammalian species abundance responses to land-use change
179
Appendix B – Supplementary tables
Table B1. Bayesian p-values for 57 mammal species modelled using a hierarchical state-space model of abundance. Values > 0.95 or < 0.05 are indicative of poor fit.
Order Species Common name Bayesian p-
value Significant lack of fit
Erinaceomorpha
Echinosorex gymnura Moon rat 0.593
Pholidota
Manis javanica Sunda pangolin 0.444
Carnivora
Prionailurus bengalensis Leopard cat 0.359
Pardofelis badia Bay cat 0.302
Pardofelis marmorata Marbled cat 0.270
Neofelis diardi Sunda clouded leopard 0.254
Diplogale hosei Hose's civet 0.456
Hemigalus derbyanus Banded civet 0.759
Paguma larvata Masked palm civet 0.425
Paradoxurus hermaphroditus Common palm civet 0.447
Arctictis binturong Binturong 0.393
Viverra tangalunga Malay civet 0.439
Prionodon linsang Banded linsang 0.823
Herpestes semitorquatus Collared mongoose 0.639
Herpestes brachyurus Short-tailed mongoose 0.631
Canis familiaris Domestic dog 0.471
Helarctos malayanus Sun bear 0.718
Mydaus javanensis Sunda stink badger 0.725
Martes flavigula Yellow-throated marten 0.424
Mustela nudipes Malay weasel 0.476
Aonyx cinereus Oriental small-clawed otter 0.343
Cetartiodactyla
Sus barbatus Bearded pig 0.493
Tragulus napu Greater mouse-deer 0.857
Tragulus kanchil Lesser mouse-deer 0.941
Muntiacus atherodes Bornean yellow muntjac 0.762
Muntiacus muntjak Red muntjac 0.544
Rusa unicolor Sambar deer 0.587
Bos javanicus Banteng 0.452
Scandentia
Tupaia minor Lesser treeshrew 0.406
Tupaia gracilis Slender treeshrew 0.532
Tupaia longipes Plain treeshrew 0.648
Tupaia tana Large treeshrew 0.507
Tupaia dorsalis Striped treeshrew 0.529
Primates
Cephalopachus bancanus Western tarsier 0.382
Macaca fascicularis Long-tailed macaque 0.406
Macaca nemestrina Southern pig-tailed macaque 0.524
Pongo pygmaeus Orangutan 0.339
Rodentia

Chapter 5: Mammalian species abundance responses to land-use change
180
Lariscus hosei Four-striped ground squirrel 0.545
Callosciurus notatus Plantain squirrel 0.604
Callosciurus adamsi Ear-spot squirrel 0.594
Sundasciurus lowi Low's squirrel 0.591
Sundasciurus hippurus Horse-tailed squirrel 0.556
Rheithrosciurus macrotis Tufted ground squirrel 0.578
Trichys fasciculata Long-tailed porcupine 0.864
Hystrix brachyura Malay porcupine 0.740
Hystrix crassispinis Thick-spined porcupine 0.473
Leopoldamys sabanus Long-tailed giant rat 0.980 *
Sundamys muelleri Müller's rat 0.611
Niviventer cremoriventer Dark-tailed tree rat 0.251
Maxomys whiteheadi Whitehead's rat 0.793
Maxomys surifer Red spiny rat 0.998 *
Maxomys rajah Brown spiny rat 0.968 *
Maxomys baeodon Small spiny rat 0.351
Maxomys ochraceiventer Chestnut-bellied spiny rat 0.864
Rattus exulans Polynesian rat 0.278
Rattus rattus Black rat 0.553
Proboscidea
Elephas maximus Asian elephant 0.479
Table B2. List of obligate arboreal species which are poorly sampled using live traps and camera traps, and were excluded from modelling. Captures represent the sum of the number of independent captures (as defined in the main text) from both live- and camera-trapping. Order Species Common name Captures
Scandentia
Ptilocercus lowii Pen-tailed treeshrew 1
Primates
Presbytis hosei Hose's langur 1
Presbytis rubicunda Maroon langur 12
Hylobates muelleri Bornean gibbon 1
Rodentia
Callosciurus prevostii Prevost's squirrel 2
Exilisciurus exilis Least pygmy squirrel 1
Sundasciurus tenuis Slender squirrel 2
Sundasciurus brookei Brooke's squirrel 1
Aeromys thomasi Thomas's flying squirrel 1

Chapter 5: Mammalian species abundance responses to land-use change
181
Appendix C – BUGS (Bayesian inference Using Gibbs Sampling) code used to obtain Markov Chain
Monte Carlo (MCMC) samples of the joint posterior
C. 1. Representation of the hierarchical model, including priors, used to obtain abundance
estimates as a function of continuous metrics of land-use change (the categorical land-use
model, not shown, is similar).
# A multi-species matrix of detection histories constitutes the main data used by the model. These data are 5-dimensional, i.e. site x species x occasion x trap-type x session, and also highly unbalanced (not all 5-way combinations were observed, giving rise to a large number of NA values). Further complications arise because the model is required, at certain points, to split sites according to land-use, and split species according to two different criteria (whether they can be detected using both sampling methods or not, and whether they are group-living). # Here, the data are ‘flattened’ to two dimensions, i.e. ‘observation’ x species, giving the matrix D. Each ‘observation’ (row) of D constitutes a different site x trap-type x session combination. Every row contains data, and no NA values are used. The ‘missing’ dimensions to the data are then re-created virtually, principally by using nested indexing (e.g. plot.counter[]) and offsets (e.g. site.startstop.i[]). # Note that different sessions are ‘stacked’ in D and treated as if they were separate sites, as is common in occupancy analyses when occupancy dynamics across sessions are not being modelled explicitly. # The following data inputs must be provided to the model: # -------------------------------------------------------- # D = a 2-D ‘observation’ x species matrix of detection counts, where each row constitutes a different site x trap-type x session combination # occasions = a vector providing the number of sampling occasions corresponding to each row of D # traptype = a vector identifying the traptype used for each row of D # avail = a 2-D matrix indicating the availability of each species to the sampling method used in each ‘observation’ row of D # Log/OP = indicator variables, identifying logged forest and oil palm sites # AGB/AGB2 = 1st- and 2nd-order polynomials of the above-ground live tree biomass (AGB) variable # ForestCov = percent forest cover variable # plot.counter/block.counter/session.counter = vectors identifying which plot, block and session each site corresponds to # HabitatScore/HabitatScore2 = 1st- and 2nd-order polynomials of the habitat disturbance variable # landuse.i = a vector, used as an offset, containing the beginning and end site indices for each land-use # site.startstop.i = a 2-D matrix containing, for each site, the beginning and end row indices of D # The following dimensions must also be provided as inputs to the model: # ---------------------------------------------------------------------- # nbothtrapspp = number of species which are detectable using both sampling methods # ntraptype = number of sampling methods or trap-types (here, ntraptype = 2) # nctrapspp = number of species detectable with camera traps only # ngroupspp = number of species which are group-living # nlanduse = number of land-uses # nplot/nblock/nsession = number of plots, blocks and sessions # Parameters named “.r” relate to the observation model (r = individual detection probability). # Parameters named “.lam” relate to the abundance model (lambda = estimated local abundance). # Parameters named “.mu”, “.tau” and “.sd” refer to mean, precision and standard deviation hyperparameters, respectively.
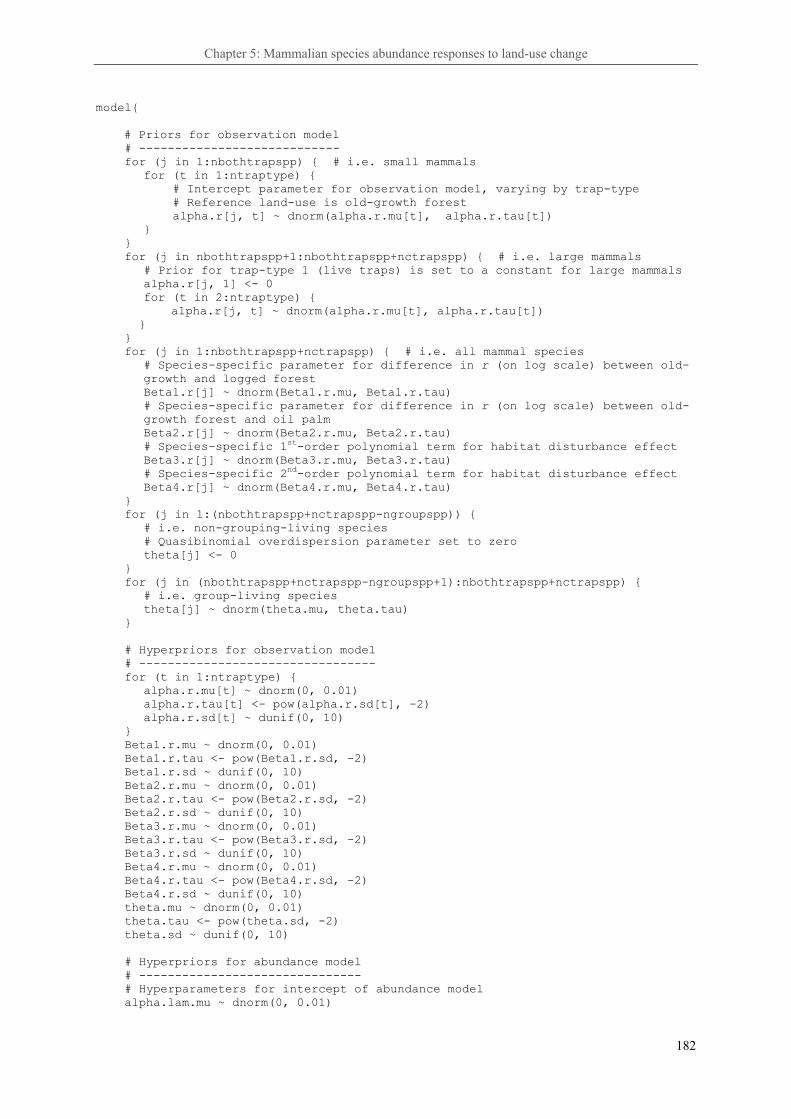
Chapter 5: Mammalian species abundance responses to land-use change
182
model{ # Priors for observation model
# ---------------------------- for (j in 1:nbothtrapspp) { # i.e. small mammals for (t in 1:ntraptype) {
# Intercept parameter for observation model, varying by trap-type # Reference land-use is old-growth forest alpha.r[j, t] ~ dnorm(alpha.r.mu[t], alpha.r.tau[t])
} } for (j in nbothtrapspp+1:nbothtrapspp+nctrapspp) { # i.e. large mammals
# Prior for trap-type 1 (live traps) is set to a constant for large mammals alpha.r[j, 1] <- 0
for (t in 2:ntraptype) { alpha.r[j, t] ~ dnorm(alpha.r.mu[t], alpha.r.tau[t])
} } for (j in 1:nbothtrapspp+nctrapspp) { # i.e. all mammal species
# Species-specific parameter for difference in r (on log scale) between old-growth and logged forest Beta1.r[j] ~ dnorm(Beta1.r.mu, Beta1.r.tau) # Species-specific parameter for difference in r (on log scale) between old-growth forest and oil palm Beta2.r[j] ~ dnorm(Beta2.r.mu, Beta2.r.tau) # Species-specific 1st-order polynomial term for habitat disturbance effect Beta3.r[j] ~ dnorm(Beta3.r.mu, Beta3.r.tau) # Species-specific 2nd-order polynomial term for habitat disturbance effect Beta4.r[j] ~ dnorm(Beta4.r.mu, Beta4.r.tau)
} for (j in 1:(nbothtrapspp+nctrapspp-ngroupspp)) {
# i.e. non-grouping-living species # Quasibinomial overdispersion parameter set to zero theta[j] <- 0
} for (j in (nbothtrapspp+nctrapspp-ngroupspp+1):nbothtrapspp+nctrapspp) {
# i.e. group-living species theta[j] ~ dnorm(theta.mu, theta.tau) } # Hyperpriors for observation model # --------------------------------- for (t in 1:ntraptype) {
alpha.r.mu[t] ~ dnorm(0, 0.01) alpha.r.tau[t] <- pow(alpha.r.sd[t], -2) alpha.r.sd[t] ~ dunif(0, 10)
} Beta1.r.mu ~ dnorm(0, 0.01) Beta1.r.tau <- pow(Beta1.r.sd, -2) Beta1.r.sd ~ dunif(0, 10) Beta2.r.mu ~ dnorm(0, 0.01) Beta2.r.tau <- pow(Beta2.r.sd, -2) Beta2.r.sd ~ dunif(0, 10) Beta3.r.mu ~ dnorm(0, 0.01) Beta3.r.tau <- pow(Beta3.r.sd, -2) Beta3.r.sd ~ dunif(0, 10) Beta4.r.mu ~ dnorm(0, 0.01) Beta4.r.tau <- pow(Beta4.r.sd, -2) Beta4.r.sd ~ dunif(0, 10) theta.mu ~ dnorm(0, 0.01) theta.tau <- pow(theta.sd, -2) theta.sd ~ dunif(0, 10) # Hyperpriors for abundance model # ------------------------------- # Hyperparameters for intercept of abundance model alpha.lam.mu ~ dnorm(0, 0.01)

Chapter 5: Mammalian species abundance responses to land-use change
183
alpha.lam.tau <- pow(alpha.lam.sd, -2) alpha.lam.sd ~ dunif(0, 10) # Hyperparameters for 1st–order polynomial term for AGB # (AGB = above-ground live tree biomass) Beta1.lam.mu ~ dnorm(0, 0.01) Beta1.lam.tau <- pow(Beta1.lam.sd, -2) Beta1.lam.sd ~ dunif(0, 10) # Hyperparameters for 2nd–order polynomial term for AGB Beta2.lam.mu ~ dnorm(0, 0.01) Beta2.lam.tau <- pow(Beta2.lam.sd, -2) Beta2.lam.sd ~ dunif(0, 10) # Hyperparameters for effect of landscape forest cover Beta3.lam.mu ~ dnorm(0, 0.01) Beta3.lam.tau <- pow(Beta3.lam.sd, -2) Beta3.lam.sd ~ dunif(0, 10) # Hyperpriors for half-Cauchy scale parameter # ------------------------------------------- xi.tau <- pow(xi.sd, -2) xi.sd ~ dunif(0, 10) for (j in 1:nbothtrapspp+nctrapspp) { # i.e. all mammal species # Priors for land-use environmental filter # ---------------------------------------- omega[j] ~ dunif(0, 1) # Priors for abundance model # --------------------------
# Poisson intensity for abundance at the centred covariate values alpha.lam[j] ~ dnorm(alpha.lam.mu, alpha.lam.tau)
# 1st-order polynomial term for AGB effect Beta1.lam[j] ~ dnorm(Beta1.lam.mu, Beta1.lam.tau)
# 2nd-order polynomial term for AGB effect Beta2.lam[j] ~ dnorm(Beta2.lam.mu, Beta2.lam.tau) # Parameter for effect of landscape forest cover Beta3.lam[j] ~ dnorm(Beta3.lam.mu, Beta3.lam.tau)
# Priors for random spatial and temporal effects # ---------------------------------------------- for (plot in 1:nplot) {
# Random sampling plot effects gamma[plot, j] ~ dnorm(0, gamma.tau[j])
} for (block in 1:nblock) {
# Random block effects delta[block, j] ~ dnorm(0, delta.tau[j])
} for (k in 1:nsession) {
# Random session effects (here, sampling year effects) eps[k, j] ~ dnorm(0, eps.tau[j])
} eps.tau[j] ~ dgamma(0.5, 0.5) # chi-squared with 1 d.f. xi[j] ~ dnorm (0, xi.tau) # priors on scale parameter of half-Cauchy
sigma.cauchy[j] <- abs(xi[j]) / sqrt(eps.tau[j]) # Cauchy = normal/sqrt(chi-squared)
# Hyperpriors for random spatial effects # -------------------------------------- gamma.tau[j] <- pow(gamma.sd[j], -2) gamma.sd[j] ~ dunif(0, 10) delta.tau[j] <- pow(delta.sd[j], -2) delta.sd[j] ~ dunif(0, 10) for (l in 1:nlanduse) {
# Land-use filter # --------------- # Occurrence of species j in land-use l

Chapter 5: Mammalian species abundance responses to land-use change
184
# w[j, l] = 1 if the species was detected w[j, l] ~ dbern(omega[j]) for (i in (landuse.i[l]+1):landuse.i[l+1]) {
# Abundance is zero-inflated by multiplying by the outcome of the land-use filter N[i, j] <- A[i, j] * w[j, l]
# Ecological model for latent abundance state (Poisson random effect) # ------------------------------------------------------------------- # Abundance, if present, assumed to be Poisson-distributed A[i, j] ~ dpois(lambda[i, j]) # Linear predictor for abundance log(lambda[i, j]) <- alpha.lam[j] + Beta1.lam[j] * AGB[i] + Beta2.lam[j] * AGB2[i] + Beta3.lam[j] * ForestCov[i] + gamma[plot.counter[i], j] + delta[block.counter[i], j] + xi[j] * eps[session.counter[i], j]
for (obs in site.startstop.i[i, 1]:site.startstop.i[i, 2]) {
# Observation model for detection history # --------------------------------------- # Capture history D modelled as the outcome of a binomial process D[obs, j] ~ dbin(p[obs, j], occasions[obs]) # Species-level detection probability p p[obs, j] <- 1 - (1 - r[obs, j])^(N[i, j]^(1 + theta[j])) # r is the inverse logit of the linear predictor for r # avail[obs, j] specifies if species j can be caught by the sampling method used for observation obs, i.e. is ‘available’ r[obs, j] <- (1 / (1 + exp(-logit.r[obs, j]))) * avail[obs, j] # Linear predictor for individual detection probability r logit.r[obs, j] <- alpha.r[j, traptype[obs]+1] + Beta1.r[j] * Log[i] + Beta2.r[j] * OP[i] + Beta3.r[j] * HabitatScore[i] + Beta4.r[j] * HabitatScore2[i] # Calculate Pearson chi-squared residuals to assess goodness-of-fit # ----------------------------------------------------------------- # Simulate an ‘ideal’ dataset D.new[obs, j] ~ dbin(p[obs, j], occasions[obs]) # Calculate the observed and ‘ideal’ residuals # (A small non-zero value, 1.0E-9, prevents division by zero) Res[obs, j] <- (D[obs, j] - p[obs, j] * occasions[obs]) / sqrt((p[obs, j]+1.0E-9) * occasions[obs] * abs(1-p[obs, j]-1.0E-9)) Res.new[obs, j] <- (D.new[obs, j] - p[obs, j] * occasions[obs]) / sqrt((p[obs, j]+1.0E-9) * occasions[obs] * abs(1-p[obs, j]-1.0E-9)) Res.2[obs, j] <- Res[obs, j]^2 Res.new2[obs, j] <- Res.new[obs, j]^2
} # obs trap-types within site i # Derived occupancy parameter (optional) # -------------------------------------- occ[i, j] <- step(N[i, j] - 1)
} # i sites (including stacked sessions) } # l land-uses # Calculate the Pearson chi-squared discrepancy for each species # -------------------------------------------------------------- # Sum the residuals Pears.fit[j] <- sum(Res.2[, j]) Pears.fitnew[j] <- sum(Res.new2[, j])
} # j species
# Calculate the overall Pearson chi-squared discrepancy # ----------------------------------------------------- # Sum the residuals across species Pears.fit.all <- sum(Pears.fit) Pears.fitnew.all <- sum(Pears.fitnew)
}

Chapter 6: Conserving mammals in human-modified landscapes in Southeast Asia
185
Chapter 6:
The conservation of terrestrial mammals in human-modified landscapes in Southeast
Asia: richness, composition, abundance and heterogeneity
6. 1. Key findings of this thesis
Over the preceding chapters, I have attempted to fulfil the four objectives I outlined at the outset. In
brief, these objectives were to: 1) robustly quantify mammalian species richness across the principal
land-use gradient in Southeast Asia, 2) investigate grain-dependency in species richness and β-
diversity, 3) identify how land-use change is altering the composition of communities and the drivers
of local-scale assembly, and 4) robustly quantify mammalian species abundance across the land-use
gradient. I will now outline my findings as they relate to these objectives.
I found that the richness of terrestrial mammals in old-growth forest was retained overall in logged
forest (Chapter 3), and that this was also true for the Felidae (Chapter 2), the mammal family with
more species of high conservation concern than any other in Borneo (IUCN, 2014). However, changes
in the fine-scale occurrence of species in logged forest meant that species richness at the finest spatial
grain was lower for large mammals than in old-growth forest (Chapter 3). Concomitant with this, fine-
grained β-diversity was higher in logged forest compared to old-growth forest (Chapter 3). At coarser
spatial grains, however, β-diversity in logged forest decreased for large mammals and increased for
small mammals, whilst the opposite patterns for both species groups were evident in old-growth
forest. These changes in β-diversity patterns in logged forest can be understood in terms of an
alteration in the underlying drivers of community assembly (Chapter 4). Whilst communities in old-
growth forest were strongly spatially-structured – a signature of highly autocorrelated movements by
animals, dispersal limitation and a spatially-correlated environment – this was not the case in logged
forest, with fine-grained environmental heterogeneity (caused by logging), as well as random
community drift at coarser spatial grains, likely playing much stronger roles. Community composition

Chapter 6: Conserving mammals in human-modified landscapes in Southeast Asia
186
was also markedly different between old-growth and logged forest (Chapter 4), a difference which
could be explained in large part by changes in habitat structure, at both fine and broad scales, as a
result of logging. Beyond composition per se, the abundance of species also changed from old-growth
to logged forest (Chapter 5), in many cases showing an increasing trend with logging-related
disturbance in a landscape or, in some cases, a weakly unimodal response.
In the transition from forest to oil palm, the changes in species richness, β-diversity, community
composition and abundance were even starker. Oil palm plantations did not conserve similar levels of
species richness to forest, at any spatial grain (Chapter 3). After controlling for the smaller size of this
species pool, I also found that β-diversity was generally lower than in forest, across both large and
small mammals and across spatial grains (Chapter 3). The composition of mammal communities in oil
palm was also markedly different compared to forest, except for those sampling points in the margins
of the plantation, which more closely resembled forest communities (Chapter 4). Even for those
species which were retained in the plantations, abundances were vastly different to those in forest,
with most species persisting at low abundance, but with a limited subset of mammal species (mostly
low conservation concern members of the Carnivora) apparently prospering in the open oil palm
habitat and reaching a higher abundance than in forest.
The ability to achieve the objectives of my thesis was in large part predicated on the success of
random spatial sampling of the mammal communities. In particular, this was essential for analyses
relying on the spatial patterns of species occurrence (i.e. Chapters 3 and 4). Random sampling for
small mammals is widely practiced, but this has rarely been the case for camera-trapping. Given this, I
wanted to know if indeed there were strong reasons to depart from the fundamental statistical bedrock
of randomisation, for example in the case of rapid surveys of high conservation concern species.
Whilst the overall photo-capture rate across species was likely lowered by the use of random
sampling, capture rates for threatened felid species were statistically indistinguishable from rates
obtained in previous non-random studies, and indeed were much higher for the poorly-known bay cat,
Pardofelis badia (Chapter 2). In addition, explicit modelling of detection probabilities showed that,

Chapter 6: Conserving mammals in human-modified landscapes in Southeast Asia
187
whilst some species were much more detectable in the open areas used by non-random sampling (e.g.
roads), many other species showed the opposite pattern (Chapter 5).
6. 2. Putting the findings into context
There is a large amount of agreement between my findings and those of past studies of land-use
change in Southeast Asia, in particular the high value of selectively-logged forests for conserving
species richness, and the very low value of oil palm. Most previous studies in the region have found
that the overall species richness (i.e. γ-diversity) of a broad range of taxonomic groups in logged
forests is statistically indistinguishable from old-growth forest (Cannon et al., 1998; Ghazoul, 2002;
Hamer et al., 2003; Peh et al., 2005; Cleary et al., 2007; Berry et al., 2008; Woodcock et al., 2011;
Struebig et al., 2013; Edwards et al., 2014a), as I also found for terrestrial mammals (Chapter 3).
Moreover, these logged forests retain > 70% of old-growth forest species for most invertebrate and
vertebrate taxonomic groups investigated (Ghazoul, 2002; Peh et al., 2005; Slade et al., 2011;
Woodcock et al., 2011; Edwards et al., 2014a), broadly agreeing with my finding of 89% for
terrestrial mammals (Chapter 3).
In oil palm, on the other hand, it has been an almost universal finding that species richness declines
overall compared to forest, whether logged or old-growth forest (Koh & Wilcove, 2008; Fitzherbert et
al., 2008; Foster et al., 2011; Edwards et al., 2014a), and that the overwhelming majority of forest
species – approximately 75-80% across studies (Koh & Wilcove, 2008; Fitzherbert et al., 2008),
comparable to my observation of 70% for mammals (Chapter 3) – do not persist in the plantations.
The notable exceptions to these species richness patterns across land-use have been in termites (Jones
et al., 2003; Donovan et al., 2007; but see Eggleton et al., 1997) and canopy-dwelling butterflies
(Dumbrell & Hill, 2005), both of which have shown significantly lower richness in logged relative to
old-growth forest, possibly due to the specialized niches of species in these groups, which may not be
supported in logged forest. In addition, bees have been shown to increase in richness in oil palm
(Liow et al., 2001), the only group reported to respond in this way.

Chapter 6: Conserving mammals in human-modified landscapes in Southeast Asia
188
My findings with respect to species richness across the land-use gradient also agree with previous
studies focussed on terrestrial mammals. As with other taxonomic groups, the species richness of
terrestrial mammals in logged forests has been found to be broadly similar in logged and old-growth
forests (Kemper & Bell, 1985; Numata et al., 2005; Wells et al., 2007; Bernard et al., 2009; Kitamura
et al., 2010; Brodie et al., 2015), and substantially lower in oil palm plantations (Danielsen &
Heegaard, 1995; Scott & Gemita, 2004; Maddox et al., 2007; Rajaratnam et al., 2007; Bernard et al.,
2009; Puan et al., 2011; Silmi et al., 2013; Jennings et al., 2015). Only three previous studies,
however, have robustly investigated terrestrial mammal richness across multiple land-uses, finding
that differences between logged and old-growth forest were not significant for large mammals
(Kitamura et al., 2010; Brodie et al., 2015) or small mammals (after excluding poorly-sampled species
> 1 kg; Wells et al., 2007); I found that, whilst large mammal richness was not significantly different,
small mammal richness was significantly higher in logged forest (Chapter 3).
Beyond species richness responses, there is rather less consensus on the biodiversity impacts of land-
use change in Southeast Asia. One important example which relates to my findings is the change in β-
diversity across land-use. Levels of β-diversity will partly determine the optimal spatial design of
conservation set-aside in logged forest or plantation landscapes, and may also lead to grain-dependent
species richness responses across land-use (Hill & Hamer, 2004). I hypothesised in Chapter 3 that
logged forests would be more environmentally heterogeneous than old-growth forests, as supported
by environmental measurements in a limited number of studies (e.g. frequency of gaps: Berry et al.,
2008, understorey ground cover variance: Ghazoul, 2002; leaf area index variance: Ewers et al., 2015;
canopy cover variance: Struebig et al., 2013), as well as coarser-grained spatial variation in the
intensity of logging itself (Cannon et al., 1994; Berry et al., 2008), and that this would lead to higher
β-diversity in logged forest. My own results for terrestrial mammals supported this overall, with a
stronger signal of β-diversity in logged forests (particularly at fine spatial grains), and this has also
apparently been the case in previous studies of ants (Woodcock et al., 2011) and trees (Berry et al.,
2008). However, there are also a number of studies which do not appear to show obvious differences
between old-growth and logged forest (birds and dung beetles: Edwards et al., 2011; butterflies:

Chapter 6: Conserving mammals in human-modified landscapes in Southeast Asia
189
Dumbrell et al., 2008), or indeed show the opposite pattern to that which I found (butterflies: Hamer
& Hill, 2000, Cleary, 2003; dung beetles: Davis et al., 2001). The reasons for these discrepancies are
not yet clear. It might indeed be the case that logged forests are not more heterogeneous than old-
growth forest when defined along alternative environmental dimensions, such as resource availability
rather than habitat structure per se. Alternatively, and as shown in my own results, the β-diversity
signal may often be grain-dependent, meaning that studies carried out at different grains may not be
comparable. This might even occur when studies are apparently sampling at a similar grain, because
the effective sampling area will depend on the mobility of the taxa under consideration (Hill &
Hamer, 2004). It may also be significant that previous studies in the region have not controlled for
differences across land-use in the sampling process and in species pools (e.g. using the null model
approach I used in Chapter 3), both of which are known to have strong effects on observed β-diversity
(Lessard et al., 2012; Beck et al., 2013).
6. 3. New research directions
In this thesis, I also explored some new research avenues which have been little investigated to date. I
presented evidence that the fundamental drivers of community assembly are altered along the most
important land-use gradient in Southeast Asia. This idea has been little explored for the vast areas of
degraded forest in the region, but could have consequences for how we view the prospects for
wholesale ecological restoration in these systems, whether through natural or assisted recovery.
Although, as I have outlined in this thesis, there is a building consensus that the impacts of logging on
species richness and abundance are often minimal, we know much less about the changing roles of
environmental control, species interactions and spatial processes (e.g. dispersal) in constructing
communities. This may have direct management implications in determining the most effective
conservation interventions. Simplistically, communities under environmental control will be most
malleable to interventions which restore habitat, whilst dispersal-limited communities may respond
most strongly to interventions which increase connectivity amongst populations. We might also
expect that where environmental control is strong relative to compensatory dynamics, for example
generated by inter- and intra-specific interactions, communities may be less resilient to environmental

Chapter 6: Conserving mammals in human-modified landscapes in Southeast Asia
190
change (Mutshinda et al., 2009), be it over space or time. Further studies investigating the processes
assembling communities are now needed in the region, ideally for a broad range of taxonomic groups,
in order to corroborate my findings for terrestrial mammals.
I also explored the utility of hierarchical state-space models of abundance, which had not previously
been done for any taxonomic group in Southeast Asia. Although there have been a considerable
number of studies of the impacts of land-use change on mammals in Southeast Asia (see Chapter 1),
very few of these have provided robust estimates of abundance. Whilst the abundance responses of
some species across land-use have become increasingly clear as more studies have been done (e.g.
orangutans: Ancrenaz et al., 2010, Meijaard et al., 2010; some tupaiid species: Emmons, 2000, Wells
et al., 2007; some murid rodent species: Nakagawa et al., 2006, Rajaratnam et al., 2007, Wells et al.,
2007, Bernard et al., 2009; large herbivores: Wilson & Johns, 1982, Duff et al., 1984, Davies et al.,
2001; felids: Rajaratnam et al., 2007, Mohamed et al., 2009, 2013, Brodie & Giordano, 2012) there
remains a large group of species for which responses have remained variable and inconsistent
(Meijaard & Sheil, 2008). For example, conflicting responses to logging by mouse-deer (Tragulus
kanchil and T. napu), sun bears (Helarctos malayanus) and civets (Viverridae) have been reported in
the literature (Meijaard et al., 2005; Meijaard & Sheil, 2008). Given the high conservation status of
some of these species, as well as their potential importance for example in seed dispersal (Meijaard et
al., 2005), further studies using robust methods are needed to allow for comparisons with my findings.
Beyond the conservation importance of accurately estimating the abundance of threatened species,
absolute measures of abundance also provide the prospect of more directly assessing the functional
effects of abundance changes, for example by re-scaling abundance in terms of biomass (as I did in
Chapter 5). There is also now an opportunity to build upon biomass as an index of ecosystem function
and explicitly incorporate metabolic and food web theory (e.g. Barnes et al., 2014). This will require
better information on mammal diets in particular, as well as on the potential for dietary shifts across
land-use (e.g. in sun bear: Fredriksson et al., 2006; primates: Johns, 1983; Malay civet: Colón, 2002;
tupaiids: Munshi-South et al., 2007; murid rodents: Nakagawa et al., 2007). Quantifying the
ecosystem functions carried out by mammals may be especially crucial if, as suggested by recent

Chapter 6: Conserving mammals in human-modified landscapes in Southeast Asia
191
studies (Barnes et al., 2014; Ewers et al., 2015), losses in the richness or abundance of other
taxonomic groups mean that functional redundancy is eroded under increasing land-use intensity.
A common theme running throughout this thesis, which has been much-neglected in models of
biodiversity change across land-use, has been the important role of heterogeneity in structuring
communities in space. Environmental heterogeneity, at both local and landscape scales, was seen to
be a prominent driver of community variation (Chapter 4), giving rise to aggregated distributions of
individuals and species (Chapter 3). I explored this at the species level for felids (Chapter 2), finding
that each species exhibited contrasting patterns of habitat feature use, as indicated by their
unconditional probabilities of detection. This result was bolstered with explicit modelling of
conditional probabilities of detection across 57 species (Chapter 5), in which contrasting patterns of
fine-scale habitat use were again evident across species. In addition, variation among local landscapes
in logging intensity and forest cover was seen to exert influence on the abundance of individual
species (Chapter 5). This leads to a number of hypotheses that could be tested in future work. In
particular, my results are consistent with greater aggregation of individuals and species in favourable
patches of habitat (Chapters 3 and 4). This leads to the hypothesis that individuals in logged forest
may, in some species, have larger home ranges (possibly also with a less regular shape, or with
fragmented core areas of use), in order to capture sufficient resources across spatially-separated
patches of favourable patches. This is supported by the breakdown of spatially-autocorrelated patterns
of movement (Chapter 4) and the lower detection probability, overall, of species in logged forest (i.e.
because individuals are spending a greater amount of time unavailable for capture; Chapter 5).
Available radio-tracking data for Malay civets (Colón, 2002) and treeshrews (Munshi-South et al.,
2007) has so far not indicated a clear difference in home range size between logged and unlogged
forests, though sample sizes are small and the intensity of logging in these studies was much lower
than in my study. There are two further corollaries of this hypothesis: 1) for territorial species,
changes in home range characteristics may have implications for daily ranging distances required, and
for the energetic costs associated with this; 2) increases in fine-grained habitat heterogeneity may lead
to greater levels of “habitat sampling”, in which species utilise resources in non-optimal patches

Chapter 6: Conserving mammals in human-modified landscapes in Southeast Asia
192
situated between preferred habitats, and a consequent reduction in the strength of species-environment
relationships (Debinski et al., 2001). Habitat sampling would be especially frequent in species for
which habitat heterogeneity is at a much finer grain relative to their scales of movement.
The importance of heterogeneity in disturbed landscapes I have identified also suggests that
significant improvements in biodiversity forecasting might be made by considering land-use change
as a continuum of disturbance occurring at multiple spatial grains, rather than discretizing the land-use
change process into homogeneous categories. To my knowledge, this has been little explored in the
land-use change literature, beyond the widespread use of ordination methods poorly suited for
biodiversity forecasting (but see: Koh, 2008; McShea et al., 2009; Struebig et al., 2013). There are
parallels between this suggestion and the idea of continuous response gradients in the habitat
fragmentation literature (e.g. the “variegation” model: Mcintyre & Barrett, 1992, McIntyre & Hobbs,
1999; the “continuum” model: Fischer & Lindenmayer, 2006). Indeed, an increasing recognition of
heterogeneity in the land-use change literature and a decreasing emphasis on the patch-based view of
landscapes in the fragmentation literature (e.g. Laurance, 2008) may offer the potential for these two
relatively discrete sub-disciplines of ecology to find significant common ground. Continuous response
models recognise that different species, or groups of species, often show contrasting responses to
heterogeneity (Fischer et al., 2004; Manning et al., 2004), for example due to their differing innate
abilities to perceive the grain of a landscape (With, 1994) or their differing requirements for
persistence (Fischer & Lindenmayer, 2006). Hierarchical metacommunity models, such as I used in
Chapter 5, potentially offer an opportunity to bring together species- or group-specific responses to
land-use change, across multiple scales, under one framework, whilst also allowing for the estimation
of emergent community parameters, such as species richness and β-diversity, at the same time
(Dorazio et al., 2011).

Chapter 6: Conserving mammals in human-modified landscapes in Southeast Asia
193
Figure 1. An example of heterogeneity within the logged forest landscape of the Kalabakan Forest Reserve: (A) a southern pig-tailed macaque Macaca nemestrina crossing an open area on an old primary logging road, (B) a red muntjac Muntiacus muntjak in a dense area of herbaceous scrub, dominated by wild ginger (Zingiberaceae), and (C) a lesser mouse-deer Tragulus kanchil in a lightly-disturbed forest patch with an intact canopy.
A
B
C
Chapter 6: Conserving mammals in human-modified landscapes in Southeast Asia
194
6. 4. Implications for conservation
The findings in this thesis have a number of key implications for conservation. Firstly, there are
implications for wildlife surveys in the region, for example those undertaken by conservationists,
protected area managers or as a requirement for sustainability certification. Sustainability certification
schemes, such as the Forest Stewardship Council or Round-table on Responsible Palm Oil, in
particular, require the identification, often with very limited time, of High Conservation Value (HCV)
areas or species (e.g. Persey et al., 2011). As I outlined in Chapter 1, I would advocate the random
sampling approach as the default survey design for such surveys, though there may be circumstances
in which it is justifiable to deviate from this (e.g. if surveys are targeting a limited number of focal
species which are strongly associated with specific habitats). For felids, often a target of conservation
surveys, I provided evidence that random sampling may substantially decrease the sampling efforts
required to detect (with 90% probability) some species of high conservation concern (e.g. the bay cat),
albeit with the cost of marginally increasing sampling efforts in other low conservation concern
species (e.g. the leopard cat Prionailurus bengalensis). In Chapter 3 I showed that, in the logged
forests that are the focus of most HCV surveys, high levels of coarse-grained β-diversity in small
mammals may mean that sampling designs will need to be sufficiently large in extent (e.g. with a
coverage > 35 km2) in order to capture the full diversity of species (results suggested that this was not
as important for large mammals). In Chapter 5, estimates of abundance for single species showed
large uncertainty once all of the sources of ecological and observational sampling variation were
properly accounted for, even though I used very large sampling efforts. In part, this is a reflection of
the highly clustered sampling design that I was constrained to use (both for the long-term value of the
study as a baseline, but also because I was interested in fine-scale patterns of occurrence), but there is
an even more important implication of this: short-term surveys of species with limited sampling effort
should, in most cases, avoid making inferences about the abundance of species (e.g. using relative
abundance indices) and should instead focus on documenting which species are present in the study
site of interest. In addition, Chapter 5 showed the very high value of conducting sampling using
multiple methods. This allowed for the estimation of abundance in a greater number of species but it
was also the case that simultaneous live-trapping in areas that were camera-trapped allowed for the

Chapter 6: Conserving mammals in human-modified landscapes in Southeast Asia
195
identification of a far greater number of small mammals from camera trap images than has been
possible in previous studies (e.g. McShea et al., 2009; Samejima et al., 2012; Brodie et al., 2015).
The finding that overall species richness (γ-diversity) and species abundance are conserved in
contiguous logged forest, including > 85% of old-growth species, gives strong emphasis to calls for
the increased recognition of the conservation value of extensive tracts of degraded forests in Southeast
Asia (as discussed in Chapters 3 and 5), albeit with the condition that hunting is also controlled
effectively (Bennett & Gumal, 2001). Moreover, the depauperate mammal communities found within
oil palm (and the limited responses in abundance to increases of forest even as high as 30%) is
consistent with recent assertions that it is the “greatest immediate threat to biodiversity in Southeast
Asia” (Wilcove & Koh, 2010), and is unlikely to contribute substantially to conservation in the
region, even if more “wildlife-friendly” management practices were implemented (e.g. Bhagwat &
Willis, 2008; Koh, 2008). In a coarse, qualitative sense, these findings aid conservationists in making
recommendations to industry and governments, and give land-use managers and policy-makers the
requisite information on the relative biodiversity value of different land-use types in order to make
more well-informed decisions. However, in order to more effectively assist decision-makers to
resolve tradeoffs between competing land-uses, it will be necessary to integrate the expanding corpus
of data on biodiversity responses in a quantitative, and ideally spatially-explicit, framework. Thus far,
attempts to do this have largely relied on imprecise modelling of biodiversity responses, for example
using generic species-area relationships (Koh & Ghazoul, 2010) or assigning species to broad
categories of sensitivity to land-use change, based on expert opinion (Wilson et al., 2010). Edwards et
al. (2014), using non-spatial simulations, explored the economic and biodiversity tradeoffs between
selective logging, protection and oil palm, using field data on a range of taxonomic groups surveyed
in Sabah, Malaysia. They found that land-use portfolios comprising mostly of logged forest were the
most efficient way to conserve the most species for the lowest opportunity cost (Edwards et al.,
2014a). It remains to be seen, however, how this would translate to real landscapes in a spatially-
explicit scenario, and this represents a key area of uncertainty about land-use change in the region.
Chapter 6: Conserving mammals in human-modified landscapes in Southeast Asia
196
Although I have argued for a spatial separation of forest and oil palm land-uses in this thesis (i.e.
through a practice of landscape-scale land-sparing; Edwards et al., 2010), important uncertainties
remain about the biodiversity and economic value of retaining forest fragments within oil palm
plantations. For example, although the biodiversity value of small fragments is likely relatively low
for terrestrial mammals (Bernard et al., 2014) and birds (Edwards et al., 2010b), which mostly have
large area requirements, they may have more value for insectivorous bats (Struebig et al., 2008,
2011), butterflies (Benedick et al., 2006), dung beetles (Gray et al., 2014), ants (Lucey et al., 2014)
and other taxa with smaller area requirements. In addition, within a larger landscape context, even
small fragments may have a value as “stepping-stone” habitats for individuals dispersing between
larger blocks of contiguous forest (Uezu et al., 2008). Remnant forest fragments also sometimes come
at no cost to yields, for example in areas in which it is not profitable to grow oil palm, such as on
steep slopes, high elevation areas or on poor soils.
Perhaps most importantly, it may be the case that forest fragments even increase yields by exporting
ecosystem services to the oil palm crop, for example if predators of pest species exhibit spill-over
from forest fragments into the plantation habitat (Koh, 2008b; Lucey et al., 2014; but see Edwards et
al., 2014b). I found that carnivores substantially increased in abundance in oil palm compared to
forest (Chapter 5). In part, this was due to increased abundance of free-ranging domestic dogs (Canis
familiaris), but it was also due to increases in a limited number of native carnivores – the leopard cat,
common palm civet (Paradoxurus hermaphroditus) and Malay civet (Viverra tangalunga) – which
might be expected to be dependent on remnant forest patches. These native carnivores all likely prey
upon murid rodents (Rajaratnam et al., 2007; Nakashima et al., 2013; Naim et al., 2014) – which can
be a cause of substantial losses in oil palm yield when occurring in high abundance (Wood & Chung,
2003) – and may therefore be good candidates for biological control. Further studies of the diets of
these species within oil palm plantations are needed, as well as mensurative or manipulative
experiments investigating their role in reducing murid rodent populations. Crucially, the habitat
requirements of these species are still poorly known, and in particular whether they require remnant
forest fragments in order to persist. Certainly, both the leopard cat and common palm civet are known
Chapter 6: Conserving mammals in human-modified landscapes in Southeast Asia
197
to use resting sites within oil palm plantations (Rajaratnam et al., 2007; Nakashima et al., 2013), but
radio-tracking studies of these species, which have thus far focussed on individuals occurring at the
plantation-forest edge (Rajaratnam et al., 2007; Nakashima et al., 2013), remain equivocal on whether
some individuals are able to persist entirely within the plantation. The Malay civet appears to be more
dependent on remnant forest than the leopard cat and common palm civet, based on the available
radio-tracking (Jennings et al., 2006) and camera-trapping (Jennings et al., 2015) data available to
date.
6. 5. The scope of inference
My thesis leaves a number of questions surrounding the impacts of land-use change on mammals still
open. Importantly, the long-term viability of mammal populations in logged forest is poorly known
and, whilst I observed evidence of breeding in a large number of species (e.g. murid rodents, Malay
porcupine, tupaiids, some squirrel species, macaque species, orangutan, all ungulate species, pangolin,
sun bear, banded civet, Sunda clouded leopard and Asian elephant), populations could still have a
negative growth rate overall. Information on population trends over time or, ideally, the survival and
recruitment rates of individuals would be required to address this uncertainty. An additional
complication over time comes from the effects of forest successional dynamics. The effects of forest
canopy recovery, for example, in heavily-degraded forests are poorly known for mammals, and
indeed other taxonomic groups, with few studies reporting the time since logging occurred (in part
because of the difficulty of obtaining spatially- and temporally-precise information). In logged forests
in Central Africa, Clark et al. (2009) found evidence of unimodal abundance responses over time in
some mammal species (with initial recovery in the decade after logging, but with a decline thereafter).
No equivalent studies have been done in Southeast Asia, but Brodie et al. (2015) found that mammal
occupancy was higher for many species in older logged forests in Malaysian Borneo (logged > 10
years previously) compared to recently logged forests. An added complication is that, in repeatedly-
logged forests, it may be more important to consider the full history of logging through time, rather
than just the time since last logging.

Chapter 6: Conserving mammals in human-modified landscapes in Southeast Asia
198
It should also be noted that I focussed on terrestrial mammals in this study, and the responses of other
mammalian groups may be dissimilar. Some groups, most especially the arboreal squirrels (and in
particular the flying squirrels, Pteromyini), remain very difficult to sample effectively and very little
is known about their responses to disturbance. Novel sampling methods, such as arboreal camera-
trapping or hair traps (Castro-Arellano et al., 2008) may provide the necessary data to estimate the
abundance of these species. The responses to land-use change of bats, which can form a substantial
proportion of species in Southeast Asia mammal communities (often up to 50%), are also poorly
known (but see: Danielsen & Heegaard, 1995; Furey et al., 2010; Struebig et al., 2011, 2013), despite
being important pollinators and seed dispersers (Meijaard et al., 2005).
Just as my findings need to be corroborated across the full spectrum of mammal groups, my findings
also need to be corroborated over a broader set of study sites. My findings are likely to be directly
applicable to much of the broader Yayasan Sabah Forest Management Area (~ 1 million ha) within
which my study was set. This area, which contains nearly a third of remaining forest cover in the
Malaysian state of Sabah, has undergone rapid rates of degradation and forest conversion in recent
decades, and is now comprised of a mosaic of multiple land-uses including protected areas,
sustainable forest management (in areas much degraded by past logging) and plantations of fast-
growing timber and oil palm (Reynolds et al., 2011). Yayasan Sabah, the para-statal organisation
created by a Malaysian government decree in order to manage this area, ultimately intends to convert
20% of the original forest cover for plantations, of which 13% will be under oil palm (Reynolds et al.,
2011). My findings suggest that this will have caused considerable local-scale loss of mammal
biodiversity by the time the plantations are fully developed, but that the 80% of remaining natural
forest, although mostly in a highly degraded state, will retain much of the regional-scale mammal
biodiversity if protected from conversion in perpetuity. Similar land-use change processes are
occurring in Indonesian Borneo, Sumatra, other islands in the Indonesian archipelago, and indeed
continental Southeast Asia, and further studies should therefore aim to corroborate my findings more
broadly across landscapes in these regions. Much of the Bornean mammal fauna I investigated occurs
more widely across the Sunda shelf islands and Malay peninsula, with some species extending further

Chapter 6: Conserving mammals in human-modified landscapes in Southeast Asia
199
north into continental Southeast Asia proper (Payne et al., 2007), which does at least suggest that the
mammalian responses to land-use change I have found in this thesis, particularly on a species-level
basis, may be more broadly applicable in the region.
6. 6. Future work
This thesis has exploited patterns of animal occurrence to uncover the impacts of land-use change,
often with the necessity of estimating latent parameters which are not directly observable, but this
approach often entails combining strong assumptions with inductive reasoning in order to make
inferences, and there are limits to the mechanistic insights that can be gained from such an approach
(widespread though it is in ecology). There are two natural extensions of the approaches used in this
thesis: namely, the addition of data on individually-identified animals and experimental
manipulations. The former will allow for greater insights into the movement ecology of many of the
poorly-known Bornean mammals I have focussed upon and will, in combination with the trapping
data I have presented, allow some key missing details to be filled in, most obviously with respect to
dispersal and home-ranging.
Experimental manipulations, crucially, often allow for much stronger inferences about the
mechanisms at work in producing observed patterns (McGarigal & Cushman, 2002). In the context of
land-use change, opportunities to conduct experiments at sufficiently large scales are rare (Fayle et al.,
2015), but just such an experiment is now being undertaken with the mammal communities
investigated in this thesis. All of the logged forest sampling sites investigated in this thesis are
undergoing (at the time of writing) isolation within forest fragments, surrounded by an oil palm
matrix. These fragments have been strategically designed as part of the Stability of Altered Forest
Ecosystems (SAFE) Project (Ewers et al., 2011), in order to investigate the effects on biodiversity of,
for example, habitat area, isolation from contiguous forest and landscape forest cover. Importantly,
the SAFE Project represents a rare, long-term opportunity to investigate the temporal dynamics of
biodiversity responses to land-use change, which is a key area of uncertainty in biodiversity
forecasting (Wearn et al., 2012; Gibson et al., 2013).

Chapter 6: Conserving mammals in human-modified landscapes in Southeast Asia
200
6. 7. Avoiding Navjot Sodhi’s “Impending Disaster”
What does the future hold for Southeast Asia’s biodiversity? The human population growth rate for
Southeast Asia currently stands at 1.2%, and by 2030 there will an additional 90 million people in the
region (United Nations Population Division, 2015). Although an increasing proportion of this
population is living in urban centres, the economies of most countries in the region are tied to
agriculture and the impacts of this sector on natural habitats are likely to grow in the coming decades,
most especially due to the expansion of oil palm and rubber plantations (Wilcove et al., 2013;
Warren-Thomas et al., 2015). At the same time, production of timber from natural forests has been
declining since the 1990s and is at the lowest level in decades in most areas (FAO, 2011; Reynolds et
al., 2011), with the emphasis for wood production having instead shifted to plantations of fast-
growing exotics. Few unlogged forest areas remain in the region, and vast areas of forest now exist in
a highly degraded state (Reynolds et al., 2011; Margono et al., 2014; Gaveau et al., 2014), mostly
under the management of commercial interests. Historical trends in land-use have no doubt resulted in
heavy losses in local biodiversity, but thus far have apparently resulted in only a limited number of
global extinctions (Sodhi et al., 2004; Clements et al., 2006; Duckworth et al., 2012; Giam et al.,
2012; Szabo et al., 2012). Therefore, whilst it will not be possible to emerge from the Anthropocene
“bottleneck” (Malhi et al., 2014) with predominantly intact systems in Southeast Asia (as, for
example, is still possible in Amazonia), there is still a tangible, but rapidly narrowing, window of
conservation opportunity in the region, especially for those species and ecosystem functions which
can be conserved in degraded forests. This will require significant investment in the protection and
restoration of these degraded areas, in particular to reconnect remaining intact forest areas and provide
potential migration corridors for species adapting to future climate change (Scriven et al., 2015;
Struebig et al., 2015b). For vertebrates, this must also include an effort to curtail hunting and
overharvesting of species (Duckworth et al., 2012). Increases in investment could be achieved, for
example, by a rapidly scaled-up market for the conservation and enhancement of carbon stocks
(Edwards et al., 2010a), and by governments and companies making the transition towards more
sustainable policies on land-use (there is already some limited evidence that this occurring; Gregory et
al., 2012; Poynton, 2014). Provided, therefore, that further agricultural expansion into forest is

Chapter 6: Conserving mammals in human-modified landscapes in Southeast Asia
201
avoided (or, at least, compensated for by off-site conservation restoration activities), and that tradeoffs
between forest product yields and biodiversity in degraded forests can be effectively and efficiently
reconciled through partnerships between the commercial and conservation sectors, there is still hope
that Navjot Sodhi’s business-as-usual scenario of an “impending disaster” (Sodhi et al., 2004) in
Southeast Asia can largely be averted.
Bibliography
202
Bibliography
Abdullah, S.A. & Nakagoshi, N. (2007) Forest fragmentation and its correlation to human land use
change in the state of Selangor, Peninsular Malaysia. For. Ecol. Manage., 241, 39–48. Achard, F., Eva, H.D., Stibig, H.-J., Mayaux, P., Gallego, J., Richards, T. & Malingreau, J.-P. (2002)
Determination of deforestation rates of the world’s humid tropical forests. Science, 297, 999–1002.
Ahumada, J.A., Silva, C.E.F., Gajapersad, K., Hallam, C., Hurtado, J., Martin, E., McWilliam, A., Mugerwa, B., O’Brien, T., Rovero, F., Sheil, D., Spironello, W.R., Winarni, N. & Andelman, S.J. (2011) Community structure and diversity of tropical forest mammals: data from a global camera trap network. Philos. Trans. R. Soc. Lond. B. Biol. Sci., 366, 2703–2711.
Akutsu, K., Khen, C.V. & Toda, M.J. (2006) Assessment of higher insect taxa as bioindicators for different logging-disturbance regimes in lowland tropical rain forest in Sabah, Malaysia. Ecol. Res., 22, 542–550.
de Almeida, W.R., Wirth, R. & Leal, I.R. (2008) Edge-mediated reduction of phorid parasitism on leaf-cutting ants in a Brazilian Atlantic forest. Entomol. Exp. Appl., 129, 251–257.
Ancrenaz, M., Ambu, L., Sunjoto, I., Ahmad, E., Manokaran, K., Meijaard, E. & Lackman, I. (2010) Recent surveys in the forests of Ulu Segama Malua, Sabah, Malaysia, show that orang-utans (P. p. morio) can be maintained in slightly logged forests. PLoS One, 5, e11510.
Andrén, H. (1994) Effects of habitat fragmentation on birds and mammals in landscapes with different proportions of suitable habitat: a review. Oikos, 71, 355–366.
Anonymous (2011a) Rare bay cat spotted in Pulong Tau national park. The Borneo Post. Available from http://www.theborneopost.com/2011/01/04/rare-bay-cat-spotted-in-pulong-tau-national-park/.
Anonymous (2011b) Bay cat captured on video by camera traps. The Borneo Post. Available from http://www.theborneopost.com/2011/08/26/bay-cat-captured-on-video-by-camera-traps/.
Anonymous (2012) Endangered bay cat recorded to be seen in Upper Baram. The Borneo Post. Available from http://www.theborneopost.com/2012/11/21/endangered-bay-cat-recorded-to-be-seen-in-upper-baram/.
Appanah, S. & Turnbull, J.M. (1998) A Review of Dipterocarps: Taxonomy, Ecology and Silviculture. Center for International Forestry Research, Bogor, Indonesia.
Aratrakorn, S., Thunhikorn, S. & Donald, P.F. (2006) Changes in bird communities following conversion of lowland forest to oil palm and rubber plantations in southern Thailand. Bird Conserv. Int., 16, 71–82.
Asner, G.P., Keller, M. & Silva, J.N.M. (2004) Spatial and temporal dynamics of forest canopy gaps following selective logging in the eastern Amazon. Glob. Chang. Biol., 10, 765–783.
Asner, G.P., Rudel, T.K., Aide, T.M., Defries, R. & Emerson, R. (2009) A contemporary assessment of change in humid tropical forests. Conserv. Biol., 23, 1386–1395.
Azhar, B., Lindenmayer, D., Wood, J., Fischer, J., Manning, A., McElhinny, C. & Zakaria, M. (2013) Contribution of illegal hunting, culling of pest species, road accidents and feral dogs to biodiversity loss in established oil-palm landscapes. Wildl. Res., 40, 1–9.
Bagchi, R., Philipson, C.D., Slade, E.M., Hector, A., Phillips, S., Villanueva, J.F., Lewis, O.T., Lyal, C.H.C., Nilus, R., Madran, A., Scholes, J.D. & Press, M.C. (2011) Impacts of logging on density-dependent predation of dipterocarp seeds in a South East Asian rainforest. Philos. Trans. R. Soc. Lond. B. Biol. Sci., 366, 3246–3255.

Bibliography
203
Baker, T.R., Honorio Coronado, E.N., Phillips, O.L., Martin, J., Van Der Heijden, G.M.F., Garcia, M. & Silva Espejo, J. (2007) Low stocks of coarse woody debris in a southwest Amazonian forest. Oecologia, 152, 495–504.
Balmford, A., Green, R. & Phalan, B. (2012) What conservationists need to know about farming. Proc. R. Soc. B, 279, 2714–2724.
Barlow, J., Gardner, T., Araujo, I.S., Ávila-Pires, T.C., Bonaldo, A.B., Costa, J.E., Esposito, M.C., Ferreira, L. V, Hawes, J., Hernandez, M.I.M., Hoogmoed, M.S., Leite, R.N., Lo-Man-Hung, N.F., Malcolm, J.R., Martins, M.B., Mestre, L.A.M., Miranda-Santos, R., Nunes-Gutjahr, A.L., Overal, W.L., et al. (2007) Quantifying the biodiversity value of tropical primary, secondary, and plantation forests. Proc. Natl. Acad. Sci. U. S. A., 104, 18555–18560.
Barlow, J., Gardner, T.A., Louzada, J. & Peres, C.A. (2010) Measuring the conservation value of tropical primary forests: the effect of occasional species on estimates of biodiversity uniqueness. PLoS One, 5, e9609.
Barnes, A.D., Jochum, M., Mumme, S., Haneda, N.F., Farajallah, A., Widarto, T.H. & Brose, U. (2014) Consequences of tropical land use for multitrophic biodiversity and ecosystem functioning. Nat. Commun., 5, 5351.
Barton, K. (2015) MuMIn: Multi-Model Inference. R package version 1.13-4. Available from http://cran.r-project.org/package=MuMIn.
Baselga, A. (2010a) Partitioning the turnover and nestedness components of beta diversity. Glob. Ecol. Biogeogr., 19, 134–143.
Baselga, A. (2010b) Multiplicative partition of true diversity yields independent alpha and beta components; additive partition does not. Ecology, 91, 1974–1981.
Baselga, A., Jiménez-Valverde, A. & Niccolini, G. (2007) A multiple-site similarity measure independent of richness. Biol. Lett., 3, 642–645.
Bashir, T., Bhattacharya, T., Poudyal, K. & Sathyakumar, S. (2011) Notable observations on the melanistic Asiatic golden cat (Pardofelis temminckii) of Sikkim, India. NeBIO, 2, 1–4.
Bates, D., Maechler, M., Bolker, B. & Walker, S. (2014) lme4: Linear mixed-effects models using Eigen and S4. R package version 1.1-6. Available from http://cran.r-project.org/package=lme4.
Bebber, D., Brown, N., Speight, M., Moura-Costa, P. & Wai, Y.S. (2002) Spatial structure of light and dipterocarp seedling growth in a tropical secondary forest. For. Ecol. Manage., 157, 65–75.
Beck, J., Holloway, J.D. & Schwanghart, W. (2013) Undersampling and the measurement of beta diversity. Methods Ecol. Evol., 4, 370–382.
Beck, J., Schulze, C.H., Linsenmair, K.E. & Fiedler, K. (2002) From forest to farmland: diversity of geometrid moths along two habitat gradients on Borneo. J. Trop. Ecol., 18, 33–51.
Belden, G., Stuebing, R., Megum, N., McShea, W.J. & Stewart, C. (2007a) A camera trapping inventory for mammals in a mixed use planted forest in Sarawak. Raffles Bull. Zool., 55, 209–215.
Belden, G., Stuebing, R. & Nyegang, M. (2007b) Small carnivores in mixed-use forest in Bintulu division, Sarawak, Malaysia. Small Carniv. Conserv., 36, 35–37.
Bell, G. (2000) The distribution of abundance in neutral communities. Am. Nat., 155, 606–617. Bender, D.J., Contreras, T.A. & Fahrig, L. (1998) Habitat loss and population decline: a meta-analysis
of the patch size effect. Ecology, 79, 517–533. Benedick, S., Hill, J.K., Mustaffa, N., Chey, V.K., Maryati, M., Searle, J.B., Schilthuizen, M. &
Hamer, K.C. (2006) Impacts of rain forest fragmentation on butterflies in northern Borneo: species richness, turnover and the value of small fragments. J. Appl. Ecol., 43, 967–977.
Benítez-López, A., Alkemade, R. & Verweij, P.A. (2010) The impacts of roads and other infrastructure on mammal and bird populations: A meta-analysis. Biol. Conserv., 143, 1307–

Bibliography
204
1316. Bennett, E. & Dahaban, Z. (1995) Wildlife responses to disturbances in Sarawak and their
implications for forest management. In Ecology, conservation and management of Southeast Asian rainforests (eds R. Primack & T. Lovejoy), pp. 66–86.
Bennett, E. & Gumal, M. (2001) The inter-relationships of commercial logging, hunting and wildlife in Sarawak, and recommendations for forest management. In The cutting edge: conserving wildlife in logged tropical forest (eds R. Fimbel, A. Grajal & J. Robinson), pp. 359–374.
Berger, J. (1990) Persistence of different-sized populations: an empirical assessment of rapid extinctions in bighorn sheep. Conserv. Biol., 4, 91–98.
Bernard, H. (2004) Effects of selective logging on the microhabitat-use patterns of non-volant small mammals in a Bornean tropical lowland mixed-dipterocarp forest. Nat. Hum. Act., 8, 1–11.
Bernard, H., Baking, E.L., Giordano, A.J., Wearn, O.R., Hamid, A. & Ahmad, A.H. (2014) Terrestrial mammal species richness and composition in three small forest patches within an oil palm landscape in Sabah, Malaysian Borneo. Mammal Study, 39, 141–154.
Bernard, H., Baking, E.L., Matsubayashi, H. & Ahmad, A.H. (2012) Records of Bornean felids in and around Tabin Wildlife Reserve, Sabah, Malaysia. Cat News, 56, 4–7.
Bernard, H., Fjeldså, J. & Mohamed, M. (2009) A case study on the effects of disturbance and conversion of tropical lowland rain forest on the non-volant small mammals in north Borneo: management implications. Mammal Study, 34, 85–96.
Berry, N.J., Phillips, O.L., Lewis, S.L., Hill, J.K., Edwards, D.P., Tawatao, N.B., Ahmad, N., Magintan, D., Khen, C. V., Maryati, M., Ong, R.C. & Hamer, K.C. (2010) The high value of logged tropical forests: lessons from northern Borneo. Biodivers. Conserv., 19, 985–997.
Berry, N.J., Phillips, O.L., Ong, R.C. & Hamer, K.C. (2008) Impacts of selective logging on tree diversity across a rainforest landscape: the importance of spatial scale. Landsc. Ecol., 23, 915–929.
Beukema, H., Danielsen, F., Vincent, G., Hardiwinoto, S. & Andel, J. (2007) Plant and bird diversity in rubber agroforests in the lowlands of Sumatra, Indonesia. Agrofor. Syst., 70, 217–242.
Bhagwat, S.A. & Willis, K.J. (2008) Agroforestry as a solution to the oil palm debate. Conserv. Biol., 22, 1368–1369.
Bierregaard, R. & Lovejoy, T. (1989) Effects of forest fragmentation on Amazonian understory bird communities. Acta Amaz., 19, 215–241.
Bird, M.I., Taylor, D. & Hunt, C. (2005) Palaeoenvironments of insular Southeast Asia during the Last Glacial Period: a savanna corridor in Sundaland? Quat. Sci. Rev., 24, 2228–2242.
Bischoff, W., Newbery, D.M., Lingenfelder, M., Schnaeckel, R., Petol, G.H., Madani, L. & Ridsdale, C.E. (2005) Secondary succession and dipterocarp recruitment in Bornean rain forest after logging. For. Ecol. Manage., 218, 174–192.
Bivand, R. & Rundel, C. (2014) rgeos: Interface to Geometry Engine - Open Source (GEOS). R package version 0.3-8. Available from http://cran.r-project.org/package=rgeos.
Blanchet, F., Legendre, P. & Borcard, D. (2008) Forward selection of explanatory variables. Ecology, 89, 2623–2632.
Blate, G., Peart, D. & Leighton, M. (1998) Post-dispersal predation on isolated seeds: a comparative study of 40 tree species in a Southeast Asian rainforest. Oikos, 82, 522–538.
Borcard, D. & Legendre, P. (2002) All-scale spatial analysis of ecological data by means of principal coordinates of neighbour matrices. Ecol. Modell., 153, 51–68.
Borcard, D., Legendre, P., Avois-Jacquet, C. & Tuomisto, H. (2004) Dissecting the spatial structure of ecological data at multiple scales. Ecology, 85, 1826–1832.

Bibliography
205
Borcard, D., Legendre, P. & Drapeau, P. (1992) Partialling out the spatial component of ecological variation. Ecology, 73, 1045–1055.
Boulinier, T., Nichols, J. & Sauer, J. (1998) Estimating species richness: the importance of heterogeneity in species detectability. Ecology, 79, 1018–1028.
Bradshaw, C.J., Sodhi, N.S. & Brook, B.W. (2009) Tropical turmoil: a biodiversity tragedy in progress. Front. Ecol. Environ., 7, 79–87.
Brearley, F.Q., Prajadinata, S., Kidd, P.S. & Proctor, J. (2004) Structure and floristics of an old secondary rain forest in Central Kalimantan, Indonesia, and a comparison with adjacent primary forest. For. Ecol. Manage., 195, 385–397.
Brearley, F.Q., Proctor, J., Nagy, L., Dalrymple, G. & Voysey, B.C. (2007) Reproductive phenology over a 10-year period in a lowland evergreen rain forest of central Borneo. J. Ecol., 95, 828–839.
Broadbent, E.N., Asner, G.P., Keller, M., Knapp, D.E., Oliveira, P.J.C. & Silva, J.N. (2008) Forest fragmentation and edge effects from deforestation and selective logging in the Brazilian Amazon. Biol. Conserv., 141, 1745–1757.
Brodie, J. & Giordano, A.J. (2011) Small carnivores of the Maliau Basin, Sabah, Borneo, including a new locality for Hose’s Civet Diplogale hosei. Small Carniv. Conserv., 44, 1–6.
Brodie, J. & Giordano, A.J. (2012a) New high elevation record of the bay cat from Malaysian Borneo. Cat News, 56, 8.
Brodie, J. & Giordano, A.J. (2012b) Density of the Vulnerable Sunda clouded leopard Neofelis diardi in a protected area in Sabah, Malaysian Borneo. Oryx, 46, 427–430.
Brodie, J.F. & Giordano, A. (2013) Lack of trophic release with large mammal predators and prey in Borneo. Biol. Conserv., 163, 58–67.
Brodie, J.F., Giordano, A.J., Zipkin, E.F., Bernard, H., Mohd-Azlan, J. & Ambu, L. (2015) Correlation and persistence of hunting and logging impacts on tropical rainforest mammals. Conserv. Biol., 29, 110–121.
Brodie, J.F., Helmy, O.E., Brockelman, W.Y. & Maron, J.L. (2009a) Functional differences within a guild of tropical mammalian frugivores. Ecology, 90, 688–698.
Brodie, J.F., Helmy, O.E., Brockelman, W.Y. & Maron, J.L. (2009b) Bushmeat poaching reduces the seed dispersal and population growth rate of a mammal-dispersed tree. Ecol. Appl., 19, 854–863.
Brooker, M. & Brooker, L. (2001) Breeding biology, reproductive success and survival of blue-breasted fairy-wrens in fragmented habitat in the Western Australian wheatbelt. Wildl. Res., 28, 205–214.
Brookfield, H., Potter, L. & Byron, Y. (1995) In Place of the Forest: Environmental and Socio-Economic Transformation in Borneo and the Eastern Malay Peninsula. United Nations University Press.
Brotons, L., Mönkkönen, M. & Martin, J.L. (2003) Are fragments islands? Landscape context and density-area relationships in boreal forest birds. Am. Nat., 162, 343–357.
Brown, J. (1984) On the relationship between abundance and distribution of species. Am. Nat., 124, 255–279.
Brown, J. & Kodric-Brown, A. (1977) Turnover rates in insular biogeography: effect of immigration on extinction. Ecology, 58, 445–449.
Bryan, J.E., Shearman, P.L., Asner, G.P., Knapp, D.E., Aoro, G. & Lokes, B. (2013) Extreme differences in forest degradation in Borneo: comparing practices in Sarawak, Sabah, and Brunei. PLoS One, 8, e69679.
Bunge, J. & Fitzpatrick, M. (1993) Estimating the number of species: a review. J. Am. Stat. Assoc., 88, 364–373.

Bibliography
206
Burgess, P.F. (1970) An approach towards a silvicultural system for the hill forests of the Malay Peninsula. Malaysian For., 33, 126–134.
Burivalova, Z., Şekercioğlu, Ç.H. & Koh, L.P. (2014) Thresholds of logging intensity to maintain tropical forest biodiversity. Curr. Biol., 24, 1893–1898.
Burke, D.M. & Nol, E. (1998) Influence of food abundance, nest-site habitat, and forest fragmentation on breeding ovenbirds. Auk, 115, 96–104.
Butchart, S.H.M., Walpole, M., Collen, B., van Strien, A., Scharlemann, J.P.W., Almond, R.E.A., Baillie, J.E.M., Bomhard, B., Brown, C., Bruno, J., Carpenter, K.E., Carr, G.M., Chanson, J., Chenery, A.M., Csirke, J., Davidson, N.C., Dentener, F., Foster, M., Galli, A., et al. (2010) Global biodiversity: indicators of recent declines. Science, 328, 1164–1168.
Cabra-García, J., Bermúdez-Rivas, C., Osorio, A.M. & Chacón, P. (2012) Cross-taxon congruence of α and β diversity among five leaf litter arthropod groups in Colombia. Biodivers. Conserv., 21, 1493–1508.
Caldecott, J.O., Blouch, R.A. & Macdonald, A.A. (1993) The Bearded Pig (Sus barbatus). In Pigs, Peccaries and Hippos Status Survey and Action Plan (ed W.L.R. Oliver), pp. 136–145.
Campos-Arceiz, A. (2009) Shit happens (to be useful)! Use of elephant dung as habitat by amphibians. Biotropica, 41, 406–407.
Campos-Arceiz, A., Traeholt, C., Jaffar, R., Santamaria, L. & Corlett, R.T. (2012) Asian tapirs are no elephants when it comes to seed dispersal. Biotropica, 44, 220–227.
Cannon, C.H., Peart, D. & Leighton, M. (1998) Tree species diversity in commercially logged Bornean rainforest. Science, 281, 1366–1368.
Cannon, C.H., Peart, D.R., Leighton, M. & Kartawinata, K. (1994) The structure of lowland rainforest after selective logging in West Kalimantan, Indonesia. For. Ecol. Manage., 67, 49–68.
Cardoso, P., Borges, P.A. V. & Veech, J.A. (2009) Testing the performance of beta diversity measures based on incidence data: the robustness to undersampling. Divers. Distrib., 15, 1081–1090.
Castelletta, M., Sodhi, N. & Subaraj, R. (2000) Heavy extinctions of forest avifauna in Singapore: lessons for biodiversity conservation in Southeast Asia. Conserv. Biol., 14, 1870–1880.
Castro-Arellano, I., Madrid-Luna, C., Lacher, T.E. & León-Paniagua, L. (2008) Hair-trap efficacy for detecting mammalian carnivores in the tropics. J. Wildl. Manage., 72, 1405–1412.
Ceballos, G. & Ehrlich, P.R. (2002) Mammal population losses and the extinction crisis. Science, 296, 904–907.
Chambers, J.Q., Higuchi, N. & Melack, J.M. (2000) Decomposition and carbon cycling of dead trees in tropical forests of the central Amazon. Oecologia, 122, 380–388.
Chao, A., Chazdon, R.L., Colwell, R.K. & Shen, T.-J. (2005) A new statistical approach for assessing similarity of species composition with incidence and abundance data. Ecol. Lett., 8, 148–159.
Chao, A., Chiu, C.-H. & Hsieh, T.C. (2012) Proposing a resolution to debates on diversity partitioning. Ecology, 93, 2037–2051.
Chao, A. & Jost, L. (2012) Coverage-based rarefaction and extrapolation: standardizing samples by completeness rather than size. Ecology, 93, 2533–2547.
Chao, A. & Shen, T. (2003) Nonparametric estimation of Shannon’s index of diversity when there are unseen species in sample. Environ. Ecol. Stat., 10, 429–443.
Chapman, C.A., Balcomb, S.R., Gillespie, T.R., Skorupa, J.P. & Struhsaker, T.T. (2000) Long-term effects of logging on African primate communities: a 28-year comparison from Kibale National Park, Uganda. Conserv. Biol., 14, 207–217.
Charles, J. & Ang, B. (2010) Non-volant small mammal community responses to fragmentation of

Bibliography
207
kerangas forests in Brunei Darussalam. Biodivers. Conserv., 19, 543–561. Chase, J.M. & Myers, J.A. (2011) Disentangling the importance of ecological niches from stochastic
processes across scales. Philos. Trans. R. Soc. Lond. B. Biol. Sci., 366, 2351–2363. Chave, J., Muller-Landau, H. & Levin, S. (2002) Comparing classical community models: theoretical
consequences for patterns of diversity. Am. Nat., 159, 1–23. Chave, J. & Norden, N. (2007) Changes of species diversity in a simulated fragmented neutral
landscape. Ecol. Modell., 207, 3–10. Chave, J., Réjou-Méchain, M., Búrquez, A., Chidumayo, E., Colgan, M.S., Delitti, W.B.C., Duque,
A., Eid, T., Fearnside, P.M., Goodman, R.C., Henry, M., Martínez-Yrízar, A., Mugasha, W.A., Muller-Landau, H.C., Mencuccini, M., Nelson, B.W., Ngomanda, A., Nogueira, E.M., Ortiz-Malavassi, E., et al. (2014) Improved allometric models to estimate the aboveground biomass of tropical trees. Glob. Chang. Biol., 20, 3177–3190.
Chesson, P. (2000) Mechanisms of maintenance of species diversity. Annu. Rev. Ecol. Syst., 31, 343–366.
Chey, V.K. (2006) Impacts of forest conversion on biodiversity as indicated by moths. Malayan Nat. J., 57, 383–418.
Chey, V.K., Holloway, J. & Speight, M. (1997) Diversity of moths in forest plantations and natural forests in Sabah. Bull. Entomol. Res., 87, 371–385.
Cheyne, S.M. & Macdonald, D.W. (2011) Wild felid diversity and activity patterns in Sabangau peat-swamp forest, Indonesian Borneo. Oryx, 45, 119–124.
Chivers, D.J. (1974) The siamang in Malaya: a field-study of a primate in tropical rain forest. Contrib. Primatol., 4, 1–335.
Chong et al., B.S.H. (2005) Special environmental impact assessment (SEIA) for the proposed oil palm plantation and industrial tree plantation development at Benta Wawasan I and Benta Wawasan IIC, Yayasan Sabah Forest Management Area, Kalabakan and Gunung Rara Forest Reserves, Tawau. Chemsains Konsultant Sdn Bhd, Kota Kinabalu, Sabah, Malaysia.
Chung, A.Y., Eggleton, P., Speight, M.R., Hammond, P.M. & Chey, V.K. (2000) The diversity of beetle assemblages in different habitat types in Sabah, Malaysia. Bull. Entomol. Res., 90, 475–496.
Clark, C.J., Poulsen, J.R., Malonga, R. & Elkan, P.W. (2009) Logging concessions can extend the conservation estate for central African tropical forests. Conserv. Biol., 23, 1281–1293.
Cleary, D., Boyle, T., Setyawati, T., Anggraeni, C.D., Van Loon, E.E. & Menken, S.B. (2007) Bird species and traits associated with logged and unlogged forest in Borneo. Ecol. Appl., 17, 1184–1197.
Cleary, D.F.R. (2003) An examination of scale of assessment, logging and ENSO-induced fires on butterfly diversity in Borneo. Oecologia, 135, 313–321.
Cleary, D.F.R., Genner, M.J., Boyle, T.J.B., Setyawati, T., Angraeti, C.D. & Menken, S.B.J. (2005) Associations of bird species richness and community composition with local and landscape-scale environmental factors in Borneo. Landsc. Ecol., 20, 989–1001.
Cleary, D.F.R. & Mooers, A.O. (2006) Burning and logging differentially affect endemic vs. widely distributed butterfly species in Borneo. Divers. Distrib., 12, 409–416.
Clements, R., Sodhi, N.S., Schilthuizen, M. & Ng, P.K.L. (2006) Limestone karsts of Southeast Asia: Imperiled arks of biodiversity. Bioscience, 56, 733–742.
Cochran, W.G. (1977) Sampling Techniques, 3rd edition. John Wiley & Sons. Coffin, A.W. (2007) From roadkill to road ecology: A review of the ecological effects of roads. J.
Transp. Geogr., 15, 396–406.

Bibliography
208
Cole, L.E.S., Bhagwat, S.A. & Willis, K.J. (2014) Recovery and resilience of tropical forests after disturbance. Nat. Commun., 5, 3906.
Collen, B., Loh, J., Whitmee, S., McRae, L., Amin, R. & Baillie, J.E.M. (2009) Monitoring change in vertebrate abundance: the living planet index. Conserv. Biol., 23, 317–327.
Colón, C.P. (2002) Ranging behaviour and activity of the Malay civet (Viverra tangalunga) in a logged and an unlogged forest in Danum Valley, East Malaysia. J. Zool., 257, 473–485.
Colwell, R.K., Chao, A., Gotelli, N.J., Lin, S.-Y., Mao, C.X., Chazdon, R.L. & Longino, J.T. (2012) Models and estimators linking individual-based and sample-based rarefaction, extrapolation and comparison of assemblages. J. Plant Ecol., 5, 3–21.
Connell, J.H. (1980) Diversity and the coevolution of competitors, or the ghost of competition past. Oikos, 35, 131–138.
Connor, E., Courtney, A. & Yoder, J. (2000) Individuals-area relationships: the relationship between animal population density and area. Ecology, 81, 734–748.
Connor, E. & McCoy, E. (1979) The statistics and biology of the species-area relationship. Am. Nat., 113, 791–833.
Corlett, R. (2007) The impact of hunting on the mammalian fauna of tropical Asian forests. Biotropica, 39, 292–303.
Corlett, R.T. (1998) Frugivory and seed dispersal by vertebrates in the Oriental (Indomalayan) Region. Biol. Rev. Camb. Philos. Soc., 73, 413–448.
Corlett, R.T. (2009a) The Ecology of Tropical East Asia. Oxford University Press, Oxford, UK. Corlett, R.T. (2009b) Seed dispersal distances and plant migration potential in tropical East Asia.
Biotropica, 41, 592–598. Corley, R. (2009) How much palm oil do we need? Environ. Sci. Policy, 12, 134–139. Cribari-Neto, F. & Zeileis, A. (2010) Beta Regression in R. J. Stat. Softw., 34, 1–24. Crist, T.O. & Veech, J.A. (2006) Additive partitioning of rarefaction curves and species-area
relationships: unifying alpha-, beta- and gamma-diversity with sample size and habitat area. Ecol. Lett., 9, 923–932.
Crist, T.O., Veech, J.A., Gering, J.C. & Summerville, K.S. (2003) Partitioning species diversity across landscapes and regions: a hierarchical analysis of alpha, beta, and gamma diversity. Am. Nat., 162, 734–743.
Crooks, K. & Suarez, A. (2001) Extinction and colonization of birds on habitat islands. Conserv. Biol., 15, 159–172.
Curran, L. & Leighton, M. (2000) Vertebrate responses to spatiotemporal variation in seed production of mast-fruiting Dipterocarpaceae. Ecol. Monogr., 70, 101–128.
Curran, L. & Webb, C. (2000) Experimental tests of the spatiotemporal scale of seed predation in mast-fruiting Dipterocarpaceae. Ecol. Monogr., 70, 129–148.
Curran, L.M., Caniago, I., Paoli, G.D., Astiani, D., Kusneti, M., Leighton, M., Nirarita, C. & Haeruman, H. (1999) Impact of El Niño and logging on canopy tree recruitment in Borneo. Science, 286, 2184–2188.
Curran, L.M., Trigg, S.N., McDonald, A.K., Astiani, D., Hardiono, Y.M., Siregar, P., Caniago, I. & Kasischke, E. (2004) Lowland forest loss in protected areas of Indonesian Borneo. Science, 303, 1000–1003.
Cusack, J.J., Wearn, O.R., Bernard, H. & Ewers, R.M. (2015) Influence of microhabitat structure and disturbance on detection of native and non-native murids in logged and unlogged forests of northern Borneo. J. Trop. Ecol., 31, 25–25.
Cushman, S.A. & McGarigal, K. (2004) Hierarchical analysis of forest bird species-environment

Bibliography
209
relationships in the Oregon Coast Range. Ecol. Appl., 14, 1090–1105. Dahaban, Z., Nordin, M. & Bennett, E. (1996) Immediate effects on wildlife of selective logging in a
hill dipterocarp forest in Sarawak: mammals. In Tropical Rainforest Research - Current Issues (eds D. Edwards, W. Booth & S. Choy), pp. 341–346.
Danielsen, F., Beukema, H., Burgess, N.D., Parish, F., Brühl, C.A., Donald, P.F., Murdiyarso, D., Phalan, B., Reijnders, L., Struebig, M. & Fitzherbert, E.B. (2009) Biofuel plantations on forested lands: double jeopardy for biodiversity and climate. Conserv. Biol., 23, 348–358.
Danielsen, F. & Heegaard, M. (1995) Impact of logging and plantation development on species diversity: a case study from Sumatra. In Management of tropical forests: towards an integrated perspective (ed Ø. Sandbukt), pp. 73–92.
Dauvergne, P. (1997) Shadows in the Forest: Japan and the Politics of Timber in the Southeast Asia. MIT Press, Cambridge, Massachusetts.
Davies, G. (1986) The orang-utan in Sabah. Oryx, 20, 40–45. Davies, G., Heydon, M., Leader-Williams, N., MacKinnon, J. & Newing, H. (2001) The effects of
logging on tropical forest ungulates. In The cutting edge: conserving wildlife in logged tropical forest (eds R.A. Fimbel, A. Grajal & J.G. Robinson), pp. 93–124.
Davies, G. & Payne, J. (1982) A faunal survey of Sabah. WWF-Malaysia, Kuala Lumpur. Davis, A.J., Holloway, J.D., Huijbregts, H., Krikken, J., Kirk-Spriggs, A.H. & Sutton, S.L. (2001)
Dung beetles as indicators of change in the forests of northern Borneo. J. Appl. Ecol., 38, 593–616.
Debinski, D. & Holt, R. (2000) A survey and overview of habitat fragmentation experiments. Conserv. Biol., 14, 342–355.
Debinski, D.M., Ray, C. & Saveraid, E.H. (2001) Species diversity and the scale of the landscape mosaic: Do scales of movement and patch size affect diversity? Biol. Conserv., 98, 179–190.
Declerck, S.A.J., Coronel, J.S., Legendre, P. & Brendonck, L. (2011) Scale dependency of processes structuring metacommunities of cladocerans in temporary pools of High-Andes wetlands. Ecography, 34, 296–305.
Dénes, F. V., Silveira, L.F. & Beissinger, S.R. (2015) Estimating abundance of unmarked animal populations: accounting for imperfect detection and other sources of zero inflation. Methods Ecol. Evol., [in press].
Dennis, R.A., Meijaard, E., Nasi, R. & Gustafsson, L. (2008) Biodiversity conservation in Southeast Asian timber concessions: a critical evaluation of policy mechanisms and guidelines. Ecol. Soc., 13, 25.
Denwood, M.J. (2015) runjags: An R package providing interface utilities, parallel computing methods and additional distributions for MCMC models in JAGS. Available from http://cran.r-project.org/package=runjags.
Diamond, J. (1972) Biogeographic kinetics: estimation of relaxation times for avifaunas of southwest Pacific islands. Proc. Natl. Acad. Sci. U. S. A., 69, 3199–3203.
Didham, R.K. (2011) Life after logging: strategic withdrawal from the Garden of Eden or tactical error for wilderness conservation? Biotropica, 43, 393–395.
Didham, R.K., Kapos, V. & Ewers, R.M. (2012) Rethinking the conceptual foundations of habitat fragmentation research. Oikos, 121, 161–170.
Didham, R.K. & Lawton, J.H. (1999) Edge structure determines the magnitude of changes in microclimate and vegetation structure in tropical forest fragments. Biotropica, 31, 17–30.
Donovan, S.E., Griffiths, G.J.K., Homathevi, R. & Winder, L. (2007) The spatial pattern of soil-dwelling termites in primary and logged forest in Sabah, Malaysia. Ecol. Entomol., 32, 1–10.

Bibliography
210
Donovan, T., Jones, P., Annand, E. & Thompson III, F. (1997) Variation in local-scale edge effects: mechanisms and landscape context. Ecology, 78, 2064–2075.
Dooley, J.J.L. & Bowers, M.A.M. (1998) Demographic responses to habitat fragmentation: experimental tests at the landscape and patch scale. Ecology, 79, 969–980.
Dorazio, R., Gotelli, N. & Ellison, A. (2011) Modern methods of estimating biodiversity from presence-absence surveys. In Biodiversity Loss in a Changing Planet (eds O. Grillo & G. Venora), pp. 277–302.
Dorazio, R.M., Kéry, M., Royle, J.A. & Plattner, M. (2010) Models for inference in dynamic metacommunity systems. Ecology, 91, 2466–2475.
Dorazio, R.R.M., Royle, J.A., Söderström, B. & Glimskär, A. (2006) Estimating species richness and accumulation by modeling species occurrence and detectability. Ecology, 87, 842–854.
Dormann, C.F., Schweiger, O., Augenstein, I., Bailey, D., Billeter, R., de Blust, G., DeFilippi, R., Frenzel, M., Hendrickx, F., Herzog, F., Klotz, S., Liira, J., Maelfait, J.-P., Schmidt, T., Speelmans, M., van Wingerden, W.K.R.E. & Zobel, M. (2007) Effects of landscape structure and land-use intensity on similarity of plant and animal communities. Glob. Ecol. Biogeogr., 16, 774–787.
Dornelas, M., Gotelli, N.J., McGill, B., Shimadzu, H., Moyes, F., Sievers, C. & Magurran, A.E. (2014) Assemblage time series reveal biodiversity change but not systematic loss. Science, 344, 296–299.
Doughty, C.E., Wolf, A. & Malhi, Y. (2013) The legacy of the Pleistocene megafauna extinctions on nutrient availability in Amazonia. Nat. Geosci., 6, 761–764.
Drakare, S., Lennon, J.J. & Hillebrand, H. (2006) The imprint of the geographical, evolutionary and ecological context on species-area relationships. Ecol. Lett., 9, 215–227.
Dray, S., Legendre, P. & Peres-Neto, P.R. (2006) Spatial modelling: a comprehensive framework for principal coordinate analysis of neighbour matrices (PCNM). Ecol. Modell., 196, 483–493.
Dray, S., Pélissier, R., Couteron, P., Fortin, M.-J., Legendre, P., Peres-Neto, P.R., Bellier, E., Bivand, R., Blanchet, F.G., De Caceres, M., Dufour, A.-B., Heegaard, M., Jombart, T., Munoz, F., Oksanen, J., Thioulouse, J. & Wagner, H.H. (2012) Community ecology in the age of multivariate multiscale spatial analysis. Ecol. Monogr., 82, 257–275.
Duckworth, J.W., Batters, G., Belant, J.L., Bennett, E.L., Brunner, J., Burton, J., Challender, D.W.S., Cowling, V., Duplaix, N., Harris, J.D., Hedges, S., Long, B., Mahood, S.P., McGowan, P.J.K., McShea, W.J., Oliver, W.L.R., Perkin, S., Rawson, B.M., Shepherd, C.R., et al. (2012) Why South-East Asia should be the world’s priority for averting imminent species extinctions, and a call to join a developing cross-institutional programme to tackle this urgent issue. Sapiens, 5, 76–95.
Duff, A.B., Hall, R.A. & Marsh, C.W. (1984) A survey of wildlife in and around a commercial tree plantation in Sabah. Malaysian For., 47, 197–213.
Dumbrell, A.J., Clark, E.J., Frost, G.A., Randell, T.E., Pitchford, J.W. & Hill, J.K. (2008) Changes in species diversity following habitat disturbance are dependent on spatial scale: theoretical and empirical evidence. J. Appl. Ecol., 45, 1531–1539.
Dumbrell, A.J. & Hill, J.K. (2005) Impacts of selective logging on canopy and ground assemblages of tropical forest butterflies: implications for sampling. Biol. Conserv., 125, 123–131.
Dunn, R.R. (2004) Managing the tropical landscape: a comparison of the effects of logging and forest conversion to agriculture on ants, birds, and lepidoptera. For. Ecol. Manage., 191, 215–224.
Edwards, D.P., Ansell, F.A., Ahmad, A.H., Nilus, R. & Hamer, K.C. (2009) The value of rehabilitating logged rainforest for birds. Conserv. Biol., 23, 1628–1633.
Edwards, D.P., Fisher, B. & Boyd, E. (2010a) Protecting degraded rainforests: enhancement of forest

Bibliography
211
carbon stocks under REDD+. Conserv. Lett., 3, 313–316. Edwards, D.P., Fisher, B. & Wilcove, D.S. (2012) High Conservation Value or high confusion value?
Sustainable agriculture and biodiversity conservation in the tropics. Conserv. Lett., 5, 20–27. Edwards, D.P., Hodgson, J.A., Hamer, K.C., Mitchell, S.L., Ahmad, A.H., Cornell, S.J. & Wilcove,
D.S. (2010b) Wildlife-friendly oil palm plantations fail to protect biodiversity effectively. Conserv. Lett., 3, 236–242.
Edwards, D.P., Larsen, T.H., Docherty, T.D.S., Ansell, F.A., Hsu, W.W., Derhé, M.A., Hamer, K.C. & Wilcove, D.S. (2011) Degraded lands worth protecting: the biological importance of Southeast Asia’s repeatedly logged forests. Proc. R. Soc. London Ser. B Biol. Sci., 278, 82–90.
Edwards, D.P. & Laurance, W.F. (2011) Loophole in forest plan for Indonesia. Nature, 477, 33. Edwards, D.P., Magrach, A., Woodcock, P., Ji, Y., Lim, N.T.-L., Edwards, F.A., Larsen, T.H., Hsu,
W.W., Benedick, S., Vun Khen, C., Chung, A.Y.C., Reynolds, G., Fisher, B., Laurance, W.F., Wilcove, D.S., Hamer, K.C. & Yu, D.W. (2014a) Selective-logging and oil palm: multitaxon impacts, biodiversity indicators, and trade-offs for conservation planning. Ecol. Appl., 24, 2029–2049.
Edwards, F.A., Edwards, D.P., Sloan, S. & Hamer, K.C. (2014b) Sustainable management in crop monocultures: the impact of retaining forest on oil palm yield. PLoS One, 9, e91695.
Efford, M. & Dawson, D. (2012) Occupancy in continuous habitat. Ecosphere, 3, 1–15. Eggleton, P., Homathevi, R., Jeeva, D., Jones, D.T., Davies, R.G. & Maryati, M. (1997) The species
richness and composition of termites (Isoptera) in primary and regenerating lowland dipterocarp forest in Sabah, East Malaysia. Ecotropica, 3, 119–128.
Eggleton, P., Homathevi, R., Jones, D.T., MacDonald, J.A., Jeeva, D., Bignell, D.E., Davies, R.G. & Maryati, M. (1999) Termite assemblages, forest disturbance and greenhouse gas fluxes in Sabah, East Malaysia. Philos. Trans. R. Soc. Lond. B. Biol. Sci., 354, 1791–1802.
Elton, C. (1927) Animal Ecology. Sedgwick and Jackson, London. Emmons, L.H. (2000) Tupai: A Field Study of Bornean Treeshrews. University of California Press,
Los Angeles. Ewers, R.M., Boyle, M.J.W., Gleave, R.A., Plowman, N.S., Benedick, S., Bernard, H., Bishop, T.R.,
Bakhtiar, E.Y., Chey, V.K., Chung, A.Y.C., Davies, R.G., Edwards, D.P., Eggleton, P., Fayle, T.M., Hardwick, S.R., Homathevi, R., Kitching, R.L., Khoo, M.S., Luke, S.H., et al. (2015) Logging cuts the functional importance of invertebrates in tropical rainforest. Nat. Commun., 6, 6836.
Ewers, R.M. & Didham, R.K. (2006) Confounding factors in the detection of species responses to habitat fragmentation. Biol. Rev. Camb. Philos. Soc., 81, 117–142.
Ewers, R.M., Didham, R.K., Fahrig, L., Ferraz, G., Hector, A., Holt, R.D., Kapos, V., Reynolds, G., Sinun, W., Snaddon, J.L. & Turner, E.C. (2011) A large-scale forest fragmentation experiment: the Stability of Altered Forest Ecosystems Project. Philos. Trans. R. Soc. Lond. B. Biol. Sci., 366, 3292–3302.
Fahrig, L. (2002) Effect of habitat fragmentation on the extinction threshold: a synthesis. Ecol. Appl., 12, 346–353.
Fahrig, L. (2003) Effects of habitat fragmentation on biodiversity. Annu. Rev. Ecol. Evol. Syst., 34, 487–515.
Fahrig, L. & Rytwinski, T. (2009) Effects of roads on animal abundance: an emperical review and synthesis. Ecol. Soc., 14, 21–41.
FAO (2011) Southeast Asia Subregional Report: Asia-Pacific Forestry Sector Outlook Study II. Food and Agriculture Organisation of the United Nations, Bangkok, Thailand.
FAO (2012) FAOSTAT database. Food and Agriculture Organisation of the United Nations.

Bibliography
212
Available from http://faostat.fao.org. Fayle, T.M., Turner, E.C., Basset, Y., Ewers, R.M., Reynolds, G. & Novotny, V. (2015) Whole-
ecosystem experimental manipulations of tropical forests. Trends Ecol. Evol., [in press]. Fazey, I., Fischer, J. & Lindenmayer, D.B. (2005) What do conservation biologists publish? Biol.
Conserv., 124, 63–73. Ferraz, G., Russell, G.J., Stouffer, P.C., Bierregaard, R.O., Pimm, S.L. & Lovejoy, T.E. (2003) Rates
of species loss from Amazonian forest fragments. Proc. Natl. Acad. Sci. U. S. A., 100, 14069–14073.
Ferrier, S. (2002) Mapping spatial pattern in biodiversity for regional conservation planning: where to from here? Syst. Biol., 51, 331–363.
Fischer, J. & Lindenmayer, D. (2005) Perfectly nested or significantly nested – an important difference for conservation management. Oikos, 109, 485–489.
Fischer, J. & Lindenmayer, D. (2006) Beyond fragmentation: the continuum model for fauna research and conservation in human-modified landscapes. Oikos, 2, 473–480.
Fischer, J., Lindenmayer, D.B. & Fazey, I. (2004) Appreciating ecological complexity: habitat contours as a conceptual landscape model. Conserv. Biol., 18, 1245–1253.
Fisher, B., Edwards, D.P., Giam, X. & Wilcove, D.S. (2011a) The high costs of conserving Southeast Asia’s lowland rainforests. Front. Ecol. Environ., 9, 329–334.
Fisher, B., Edwards, D.P., Larsen, T.H., Ansell, F.A., Hsu, W.W., Roberts, C.S. & Wilcove, D.S. (2011b) Cost-effective conservation: Calculating biodiversity and logging trade-offs in Southeast Asia. Conserv. Lett., 4, 443–450.
Fitzherbert, E.B., Struebig, M.J., Morel, A., Danielsen, F., Brühl, C.A., Donald, P.F. & Phalan, B. (2008) How will oil palm expansion affect biodiversity? Trends Ecol. Evol., 23, 538–545.
Flather, C.H. & Bevers, M. (2002) Patchy reaction-diffusion and population abundance: the relative importance of habitat amount and arrangement. Am. Nat., 159, 40–56.
Flint, E. (1994) Changes in land use in South and Southeast Asia from 1880 to 1980: a data base prepared as part of a coordinated research program on carbon fluxes in the tropics. Chemosphere, 29, 1015–1062.
Foster, W.A., Snaddon, J.L., Turner, E.C., Fayle, T.M., Cockerill, T.D., Ellwood, M.D.F., Broad, G.R., Chung, A.Y.C., Eggleton, P., Khen, C.V. & Yusah, K.M. (2011) Establishing the evidence base for maintaining biodiversity and ecosystem function in the oil palm landscapes of South East Asia. Philos. Trans. R. Soc. Lond. B. Biol. Sci., 366, 3277–3291.
Fredriksson, G.M., Wich, S.A. & Trisno (2006) Frugivory in sun bears (Helarctos malayanus) is linked to El Niño-related fluctuations in fruiting phenology, East Kalimantan, Indonesia. Biol. J. Linn. Soc., 89, 489–508.
Fukuda, D. & Tisen, O. (2009) Bat diversity in the vegetation mosaic around a lowland dipterocarp forest of Borneo. Raffles Bull. Zool., 57, 213–221.
Furey, N.M., Mackie, I.J. & Racey, P.A. (2010) Bat diversity in Vietnamese limestone karst areas and the implications of forest degradation. Biodivers. Conserv., 19, 1821–1838.
van Gardingen, P.R., McLeish, M.J., Phillips, P.D., Fadilah, D., Tyrie, G. & Yasman, I. (2003) Financial and ecological analysis of management options for logged-over Dipterocarp forests in Indonesian Borneo. For. Ecol. Manage., 183, 1–29.
Gardner, B., Reppucci, J., Lucherini, M. & Royle, J.A. (2010) Spatially explicit inference for open populations: estimating demographic parameters from camera-trap studies. Ecology, 91, 3376–3383.
Gardner, T.A., Barlow, J., Chazdon, R., Ewers, R.M., Harvey, C.A., Peres, C.A. & Sodhi, N.S. (2009) Prospects for tropical forest biodiversity in a human-modified world. Ecol. Lett., 12, 561–582.

Bibliography
213
Gardner, T.A., Barlow, J., Parry, L.W., Peres, C.A., Mpeg, G., Perimetral, A. & Firme, B.T. (2007) Predicting the uncertain future of tropical forest species in a data vacuum. Biotropica, 39, 25–30.
Gathorne-Hardy, F., Jones, D. & Syaukani (2002) A regional perspective on the effects of human disturbance on the termites of Sundaland. Biodivers. Conserv., 11, 1991–2006.
Gaveau, D.L.A., Sloan, S., Molidena, E., Yaen, H., Sheil, D., Abram, N.K., Ancrenaz, M., Nasi, R., Quinones, M., Wielaard, N. & Meijaard, E. (2014) Four decades of forest persistence, clearance and logging on Borneo. PLoS One, 9, e101654.
Gelman, A. (2006) Prior distributions for variance parameters in hierarchical models. Bayesian Anal., 1, 515–533.
Gelman, A. & Rubin, D. (1992) Inference from iterative simulation using multiple sequences. Stat. Sci., 7, 457–511.
Ghazoul, J. (2002) Impact of logging on the richness and diversity of forest butterflies in a tropical dry forest in Thailand. Biodivers. Conserv., 11, 521–541.
Giam, X., Clements, G.R., Aziz, S.A., Chong, K.Y. & Miettinen, J. (2011) Rethinking the ‘back to wilderness’ concept for Sundaland’s forests. Biol. Conserv., 144, 3149–3152.
Giam, X., Koh, L.P., Tan, H.H., Miettinen, J., Tan, H.T.W. & Ng, P.K.L. (2012) Global extinctions of freshwater fishes follow peatland conversion in Sundaland. Front. Ecol. Environ., 10, 465–470.
Gibbs, H.K., Ruesch, A.S., Achard, F., Clayton, M.K., Holmgren, P., Ramankutty, N. & Foley, J.A. (2010) Tropical forests were the primary sources of new agricultural land in the 1980s and 1990s. Proc. Natl. Acad. Sci. U. S. A., 107, 16732–16737.
Gibson, L., Lee, T.M., Koh, L.P., Brook, B.W., Gardner, T.A., Barlow, J., Peres, C.A., Bradshaw, C.J.A., Laurance, W.F., Lovejoy, T.E. & Sodhi, N.S. (2011) Primary forests are irreplaceable for sustaining tropical biodiversity. Nature, 478, 378–381.
Gibson, L., Lynam, A.J., Bradshaw, C.J.A., He, F., Bickford, D.P., Woodruff, D.S., Bumrungsri, S. & Laurance, W.F. (2013) Near-complete extinction of native small mammal fauna 25 years after forest fragmentation. Science, 341, 1508–1510.
Goldammer, J.G. (2006) History of equatorial vegetation fires and fire research in Southeast Asia before the 1997–98 episode: a reconstruction of creeping environmental changes. Mitig. Adapt. Strateg. Glob. Chang., 12, 13–32.
Goldewijk, K.K. (2001) Estimating global land use change over the past 300 years: the HYDE Database. Global Biogeochem. Cycles, 15, 417–433.
Gossner, M.M., Getzin, S., Lange, M., Pašalić, E., Türke, M., Wiegand, K. & Weisser, W.W. (2013) The importance of heterogeneity revisited from a multiscale and multitaxa approach. Biol. Conserv., 166, 212–220.
Gotelli, N. & Colwell, R. (2001) Quantifying biodiversity: procedures and pitfalls in the measurement and comparison of species richness. Ecol. Lett., 4, 379–391.
Gotelli, N.J. & Chao, A. (2013) Measuring and estimating species richness, species diversity, and biotic similarity from sampling data. In Encyclopedia of Biodiversity. 2nd Edition. (ed S.A. Levin), pp. 195–211.
Gotelli, N.J. & Ulrich, W. (2012) Statistical challenges in null model analysis. Oikos, 121, 171–180. Grassman, L.I., Tewes, M.E., Silvy, N.J. & Kreetiyutanont, K. (2005) Ecology of three sympatric
felids in a mixed evergreen forest in north-central Thailand. J. Mammal., 86, 29–38. Gravel, D., Canham, C.D., Beaudet, M. & Messier, C. (2006) Reconciling niche and neutrality: the
continuum hypothesis. Ecol. Lett., 9, 399–409. Gray, C.L., Slade, E.M., Mann, D.J. & Lewis, O.T. (2014) Do riparian reserves support dung beetle
biodiversity and ecosystem services in oil palm-dominated tropical landscapes? Ecol. Evol., 4, 1049–1060.

Bibliography
214
Gray, M.A., Baldauf, S.L., Mayhew, P.J. & Hill, J.K. (2007) The response of avian feeding guilds to tropical forest disturbance. Conserv. Biol., 21, 133–141.
Green, R.E., Cornell, S.J., Scharlemann, J.P.W. & Balmford, A. (2005) Farming and the fate of wild nature. Science, 307, 550–555.
Greenberg, R., Bichier, P., Angon, A.C. & Reitsma, R. (1997) Bird populations in shade and sun coffee plantations in central Guatemala. Conserv. Biol., 11, 448–459.
Greenpeace (2013) Identifying High Carbon Stock (HCS) forest for protection. Available from http://www.greenpeace.org/international/Global/international/briefings/forests/2013/HCS-Briefing-2013.pdf.
Gregory, S.D., Brook, B.W., Goossens, B., Ancrenaz, M., Alfred, R., Ambu, L.N. & Fordham, D.A. (2012) Long-term field data and climate-habitat models show that orangutan persistence depends on effective forest management and greenhouse gas mitigation. PLoS One, 7, e343846.
Griffith, D.M., Veech, J.A. & Marsh, C.J. (2014) cooccur: Probabilistic species co-occurrence analysis in R. Available from http://cran.r-project.org/package=cooccur.
Grimbacher, P.S., Catterall, C.P. & Kitching, R.L. (2006) Beetle species’ responses suggest that microclimate mediates fragmentation effects in tropical Australian rainforest. Austral Ecol., 31, 458–470.
Grinnell, J. (1917) Field tests of theories concerning distributional control. Am. Nat., 51, 115–128. Guillera-Arroita, G., Lahoz-Monfort, J.J., MacKenzie, D.I., Wintle, B.A. & McCarthy, M.A. (2014)
Ignoring imperfect detection in biological surveys is dangerous: a response to ‘fitting and interpreting occupancy models’. PLoS One, 9, e99571.
Guillera-Arroita, G., Ridout, M.S. & Morgan, B.J.T. (2010) Design of occupancy studies with imperfect detection. Methods Ecol. Evol., 1, 131–139.
Gunarso, P., Hartoyo, M.E., Agus, F. & Killeen, T.J. (2013) Oil palm and land use change in Indonesia, Malaysia and Papua New Guinea. In Reports from the Technical Panels of the 2nd Greenhouse Gas Working Group, Roundtable on Sustainable Palm Oil (RSPO) pp. 29–64.
Gustafsson, L., Baker, S.C., Bauhus, J., Beese, W.J., Brodie, A., Kouki, J., Lindenmayer, D.B., Lõhmus, A., Pastur, G.M., Messier, C., Neyland, M., Palik, B., Sverdrup-thygeson, A., Volney, W.J.A., Wayne, A. & Franklin, J.F. (2012) Retention forestry to maintain multifunctional forests: A world perspective. Bioscience, 62, 633–645.
Haddad, N.M., Brudvig, L.A., Clobert, J., Davies, K.F., Gonzalez, A., Holt, R.D., Lovejoy, T.E., Sexton, J.O., Austin, M.P., Collins, C.D., Cook, W.M., Damschen, E.I., Ewers, R.M., Foster, B.L., Jenkins, C.N., King, A.J., Laurance, W.F., Levey, D.J., Margules, C.R., et al. (2015) Habitat fragmentation and its lasting impact on Earth’s ecosystems. Sci. Adv., 1, e1500052.
Halley, J.M. & Iwasa, Y. (2011) Neutral theory as a predictor of avifaunal extinctions after habitat loss. Proc. Natl. Acad. Sci. U. S. A., 108, 2316–2321.
Hamer, K.C. & Hill, J.K. (2000) Scale-dependent effects of habitat disturbance on species richness in tropical forests. Conserv. Biol., 14, 1435–1440.
Hamer, K.C., Hill, J.K., Benedick, S., Mustaffa, N., Sherratt, T.N., Maryati, M. & K., C. V. (2003) Ecology of butterflies in natural and selectively logged forests of northern Borneo: the importance of habitat heterogeneity. J. Appl. Ecol., 40, 150–162.
Hansen, M.C., Potapov, P. V, Moore, R., Hancher, M., Turubanova, S.A., Tyukavina, A., Thau, D., Stehman, S. V, Goetz, S.J., Loveland, T.R., Kommareddy, A., Egorov, A., Chini, L., Justice, C.O. & Townshend, J.R.G. (2013) High-resolution global maps of 21st-century forest cover change. Science, 342, 850–853.
Hansen, M.C., Stehman, S. V, Potapov, P. V, Loveland, T.R., Townshend, J.R.G., DeFries, R.S., Pittman, K.W., Arunarwati, B., Stolle, F., Steininger, M.K., Carroll, M. & Dimiceli, C. (2008)

Bibliography
215
Humid tropical forest clearing from 2000 to 2005 quantified by using multitemporal and multiresolution remotely sensed data. Proc. Natl. Acad. Sci. U. S. A., 105, 9439–9444.
Hanski, I. (1998) Metapopulation dynamics. Nature, 396, 41–49. Hanski, I., Pakkala, T., Kuussaari, M. & Lei, G. (1995) Metapopulation persistence of an endangered
butterfly in a fragmented landscape. Oikos, 72, 21–28. Hanski, I., Zurita, G.A., Bellocq, M.I. & Rybicki, J. (2013) Species-fragmented area relationship.
Proc. Natl. Acad. Sci. U. S. A., 110, 12715–12720. Hardin, G. (1960) The competitive exclusion principle. Science, 131, 1292–1297. Hardwick, S.R., Toumi, R., Pfeifer, M., Turner, E.C., Nilus, R. & Ewers, R.M. (2015) The
relationship between leaf area index and microclimate in tropical forest and oil palm plantation: forest disturbance drives changes in microclimate. Agric. For. Meteorol., 201, 187–195.
Harmsen, B., Foster, R. & Silver, S. (2009) Differential use of trails by forest mammals and the implications for camera-trap studies: a case study from Belize. Biotropica, 42, 126–133.
Harmsen, B.J., Foster, R.J. & Doncaster, C.P. (2010) Heterogeneous capture rates in low density populations and consequences for capture-recapture analysis of camera-trap data. Popul. Ecol., 53, 253–259.
Harrison, R.D., Tan, S., Plotkin, J.B., Slik, F., Detto, M., Brenes, T., Itoh, A. & Davies, S.J. (2013) Consequences of defaunation for a tropical tree community. Ecol. Lett., 16, 687–694.
Harrison, S. & Bruna, E. (1999) Habitat fragmentation and large-scale conservation: what do we know for sure? Ecography, 22, 225–232.
Harrison, X.A. (2014) Using observation-level random effects to model overdispersion in count data in ecology and evolution. PeerJ, 2, e616.
Harvey, P. (2013) ExifTool, version 9.41. Available from http://owl.phy.queensu.ca/~phil/exiftool/. Hassall, M., Jones, D.T., Taiti, S., Latipi, Z., Sutton, S.L. & Mohammed, M. (2006) Biodiversity
and abundance of terrestrial isopods along a gradient of disturbance in Sabah, East Malaysia. Eur. J. Soil Biol., 42, S197–S207.
Hautier, Y., Saner, P., Philipson, C., Bagchi, R., Ong, R.C. & Hector, A. (2010) Effects of seed predators of different body size on seed mortality in Bornean logged forest. PLoS One, 5, e11651.
Hearn, A., Sanderson, J., Ross, J., Wilting, A. & Sunarto, S. (2008) Pardofelis badia. IUCN 2012. IUCN Red List of Threatened Species. Version 2012.2. Available from www.iucnredlist.org.
Hearn, A.J. & Ross, J. (2009) Flat-headed cat photographed in Danum. Available from http://borneanwildcat.blogspot.co.uk/2009/04/flat-headed-cat-photographed-in-danum.html.
Heffner, R., Butler, M. & Reilly, C. (1996) Pseudoreplication revisited. Ecology, 77, 2558–2562. Henle, K., Davies, K.F., Kleyer, M., Margules, C. & Settele, J. (2004) Predictors of species sensitivity
to fragmentation. Biodivers. Conserv., 13, 207–251. Heydon, M. & Bulloh, P. (1997) Mousedeer densities in a tropical rainforest: the impact of selective
logging. J. Appl. Ecol., 34, 484–496. Heydon, M.J. & Bulloh, P. (1996) The impact of selective logging on sympatric civet species in
Borneo. Oryx, 30, 31–36. Hijmans, R.J. (2014) raster: Geographic data analysis and modeling. R package version 2.3-0.
Available from http://cran.r-project.org/package=raster. Hill, J. (1999) Butterfly spatial distribution and habitat requirements in a tropical forest: impacts of
selective logging. J. Appl. Ecol., 36, 564–572. Hill, J. & Hamer, K. (2004) Determining impacts of habitat modification on diversity of tropical
Bibliography
216
forest fauna: the importance of spatial scale. J. Appl. Ecol., 41, 744–754. Hill, J., Hamer, K., Lace, L. & Banham, W. (1995) Effects of selective logging on tropical forest
butterflies on Buru, Indonesia. J. Appl. Ecol., 32, 754–760. Hill, J., Hamer, K., Tangah, J. & Dawood, M. (2001) Ecology of tropical butterflies in rainforest gaps.
Oecologia, 128, 294–302. Hill, J.K., Gray, M.A., Khen, C.V., Benedick, S., Tawatao, N. & Hamer, K.C. (2011) Ecological
impacts of tropical forest fragmentation: how consistent are patterns in species richness and nestedness? Philos. Trans. R. Soc. Lond. B. Biol. Sci., 366, 3265–3276.
HilleRisLambers, J., Adler, P.B., Harpole, W.S., Levine, J.M. & Mayfield, M.M. (2012) Rethinking community assembly through the lens of coexistence theory. Annu. Rev. Ecol. Evol. Syst., 43, 227–248.
Hoffmann, M., Hilton-Taylor, C., Angulo, A., Böhm, M., Brooks, T.M., Butchart, S.H.M., Carpenter, K.E., Chanson, J., Collen, B., Cox, N.A., Darwall, W.R.T., Dulvy, N.K., Harrison, L.R., Katariya, V., Pollock, C.M., Quader, S., Richman, N.I., Rodrigues, A.S.L., Tognelli, M.F., et al. (2010) The impact of conservation on the status of the world’s vertebrates. Science, 330, 1503–1509.
Houlahan, J.E., Currie, D.J., Cottenie, K., Cumming, G.S., Ernest, S.K.M., Findlay, C.S., Fuhlendorf, S.D., Gaedke, U., Legendre, P., Magnuson, J.J., McArdle, B.H., Muldavin, E.H., Noble, D., Russell, R., Stevens, R.D., Willis, T.J., Woiwod, I.P. & Wondzell, S.M. (2007) Compensatory dynamics are rare in natural ecological communities. Proc. Natl. Acad. Sci. U. S. A., 104, 3273–3277.
Howlett, B.E. & Davidson, D.W. (2003) Effects of seed availability, site conditions, and herbivory on pioneer recruitment after logging in Sabah, Malaysia. For. Ecol. Manage., 184, 369–383.
Hsieh, T.C. (2013) iNEXT: iNterpolation and EXTrapolation for species diversity. R package version 1.0. Available from http://chao.stat.nthu.edu.tw/blog/software-download/.
Hubbell, S.P. (2001) The Unified Neutral Theory of Biodiversity and Biogeography. Princeton University Press.
Hughes, J. & Macdonald, D.W. (2013) A review of the interactions between free-roaming domestic dogs and wildlife. Biol. Conserv., 157, 341–351.
Hunter, L. (2011) Carnivores of the World. Princeton University Press. Hurlbert, S. (1984) Pseudoreplication and the design of ecological field experiments. Ecol. Monogr.,
54, 187–211. Hutchinson, G.E. (1957) Concluding remarks. Cold Spring Harb. Symp. Quant. Biol., 22, 415–427. Ichikawa, M. (2007) Degradation and loss of forest land and land-use changes in Sarawak, East
Malaysia: a study of native land use by the Iban. Ecol. Res., 22, 403–413. Ickes, K. (2001) Hyper-abundance of native wild pigs (Sus scrofa) in a lowland dipterocarp rain forest
of Peninsular Malaysia. Biotropica, 33, 682–690. Ickes, K., Dewalt, S.J. & Appanah, S. (2001) Effects of native pigs (Sus scrofa) on woody
understorey vegetation in a Malaysian lowland rain forest. J. Trop. Ecol., 17. Iknayan, K.J., Tingley, M.W., Furnas, B.J. & Beissinger, S.R. (2013) Detecting diversity: emerging
methods to estimate species diversity. Trends Ecol. Evol., 29, 97–106. Imai, N., Samejima, H., Langner, A., Ong, R.C., Kita, S., Titin, J., Chung, A.Y.C., Lagan, P., Lee,
Y.F. & Kitayama, K. (2009) Co-benefits of sustainable forest management in biodiversity conservation and carbon sequestration. PLoS One, 4, e8267.
Isabirye-Basuta, G. & Kasenene, J.M. (1987) Small rodent populations in selectively felled and mature tracts of Kibale Forest, Uganda. Biotropica, 19, 260–266.

Bibliography
217
IUCN (2014) The IUCN Red List of Threatened Species. Version 2014.3. Available from http://www.iucnredlist.org.
IUCN/UNEP (2012) The World Database on Protected Areas (WDPA). Cambridge, UK. Janzen, D.H. (1986) The future of tropical ecology. Annu. Rev. Ecol. Syst., 17, 305–324. Jennings, A.P., Naim, M., Advento, A.D., Aryawan, A.A.K., Ps, S., Caliman, J.-P., Verwilghen, A. &
Veron, G. (2015) Diversity and occupancy of small carnivores within oil palm plantations in central Sumatra, Indonesia. Mammal Res., 60, 181–188.
Jennings, A.P., Seymour, A.S. & Dunstone, N. (2006) Ranging behaviour, spatial organization and activity of the Malay civet (Viverra tangalunga) on Buton Island, Sulawesi. J. Zool., 268, 63–71.
Johns, A. (1985) Behavioral responses of two Malaysian primates (Hylobates lar and Presbytis melalophos) to selective logging: vocal behavior, territoriality, and nonemigration. Int. J. Primatol., 6, 423–433.
Johns, A. (1986a) Effects of selective logging on the behavioral ecology of West Malaysian primates. Ecology, 67, 684–694.
Johns, A. (1986b) Effects of selective logging on the ecological organization of a peninsular Malaysian rainforest avifauna. Forktail, 1, 65–79.
Johns, A. (1989) Recovery of a peninsular Malaysian rainforest avifauna following selective timber logging: the first twelve years. Forktail, 4, 89–105.
Johns, A. (1992) Vertebrate responses to selective logging: implications for the design of logging systems. Philos. Trans. R. Soc. B Biol. Sci., 335, 437–442.
Johns, A. & Skorupa, J. (1987) Responses of rain-forest primates to habitat disturbance: a review. Int. J. Primatol., 8, 157–191.
Johns, A.D. (1983) Tropical forest logging and primates - can they co-exist? Oryx, 17, 114–118. Johns, A.D. (1987) The use of primary and selectively logged rainforest by Malaysian hornbills
(Bucerotidae) and implications for their conservation. Biol. Conserv., 40, 179–190. Johns, A.D. (1988) Effects of ‘selective’ timber extraction on rain forest structure and composition
and some consequences for frugivores and folivores. Biotropica, 20, 31–37. Johns, A.G. (1997) Timber Production and Biodiversity Conservation in Tropical Rain Forests.
Cambridge University Press. Johns, A.G. & Johns, B.G. (1995) Tropical forest primates and logging: long-term coexistence? Oryx,
29, 205–211. Johnson, A., Vongkhamheng, C. & Saithongdam, T. (2009) The diversity, status and conservation of
small carnivores in a montane tropical forest in northern Laos. Oryx, 43, 626–633. Jones, D.T., Susilo, F.X., Bignell, D.E., Hardiwinoto, S., Gillison, A.N. & Eggleton, P. (2003)
Termite assemblage collapse along a land-use intensification gradient in lowland central Sumatra, Indonesia. J. Appl. Ecol., 40, 380–391.
Jones, K.E., Bielby, J., Cardillo, M., Fritz, S.A., O’Dell, J., Orme, C.D.L., Safi, K., Sechrest, W., Boakes, E.H., Carbone, C., Connolly, C., Cutts, M.J., Foster, J.K., Grenyer, R., Habib, M., Plaster, C.A., Price, S.A., Rigby, E.A., Rist, J., et al. (2009) PanTHERIA: a species-level database of life history, ecology, and geography of extant and recently extinct mammals. Ecology, 90, 2648–2648.
de Jong, W. (1997) Developing swidden agriculture and the threat of biodiversity loss. Agric. Ecosyst. Environ., 62, 187–197.
Jost, L. (2007) Partitioning diversity into independent alpha and beta components. Ecology, 88, 2427–2439.

Bibliography
218
Jost, L. (2010) Independence of alpha and beta diversities. Ecology, 91, 1969–1974. Karanth, K.U. & Nichols, J.D. (1998) Estimation of tiger densities in India using photographic
captures and recaptures. Ecology, 79, 2852–2862. Kays, R., Tilak, S., Kranstauber, B., Jansen, P.A., Carbone, C., Rowcliffe, M.J., Fountain, T., Eggert,
J. & He, Z. (2011) Monitoring wild animal communities with arrays of motion sensitive camera traps. Int. J. Res. Rev. Wirel. Sens. Networks, 1, 19–29.
Kemper, C. & Bell, D.T. (1985) Small mammals and habitat structure in lowland rain forest of Peninsular Malaysia. J. Trop. Ecol., 1, 5–22.
Kendall, W. (1999) Robustness of closed capture-recapture methods to violations of the closure assumption. Ecology, 80, 2517–2525.
Kéry, M. & Schaub, M. (2012) Bayesian Population Analysis Using WinBUGS: A Hierarchical Approach. Academic Press.
Kessler, M., Abrahamczyk, S., Bos, M., Buchori, D., Putra, D.D., Gradstein, S.R., Höhn, P., Kluge, J., Orend, F., Pitopang, R., Saleh, S., Schulze, C.H., Sporn, S.G., Steffan-Dewenter, I., Tjitrosoedirdjo, S.S. & Tscharntke, T. (2009) Alpha and beta diversity of plants and animals along a tropical land-use gradient. Ecol. Appl., 19, 2142–2156.
Kitamura, S., Thong-Aree, S., Madsri, S. & Poonswad, P. (2010) Mammal diversity and conservation in a small isolated forest of southern Thailand. Raffles Bull. Zool., 58, 145–156.
Kitamura, S., Yumoto, T., Poonswad, P., Suzuki, S. & Wohandee, P. (2008) Rare seed-predating mammals determine seed fate of Canarium euphyllum, a large-seeded tree species in a moist evergreen forest, Thailand. Ecol. Res., 23, 169–177.
Kitchener, A., Yasuma, S., Andau, M. & Quillen, P. (2004) Three bay cats (Catopuma badia) from Borneo. Mamm. Biol., 69, 349–353.
Kitching, R.L., Ashton, L.A., Nakamura, A., Whitaker, T. & Khen, C.V. (2013) Distance-driven species turnover in Bornean rainforests: homogeneity and heterogeneity in primary and post-logging forests. Ecography, 36, 675–682.
Koh, L.P. (2007a) Impending disaster or sliver of hope for Southeast Asian forests? The devil may lie in the details. Biodivers. Conserv., 16, 3935–3938.
Koh, L.P. (2007b) Impacts of land use change on South-east Asian forest butterflies: a review. J. Appl. Ecol., 44, 703–713.
Koh, L.P. (2008a) Can oil palm plantations be made more hospitable for forest butterflies and birds? J. Appl. Ecol., 45, 1002–1009.
Koh, L.P. (2008b) Birds defend oil palms from herbivorous insects. Ecol. Appl., 18, 821–825. Koh, L.P. & Ghazoul, J. (2010a) Spatially explicit scenario analysis for reconciling agricultural
expansion, forest protection, and carbon conservation in Indonesia. Proc. Natl. Acad. Sci. U. S. A., 107, 11140–11144.
Koh, L.P. & Ghazoul, J. (2010b) A matrix-calibrated species-area model for predicting biodiversity losses due to land-use change. Conserv. Biol., 24, 994–1001.
Koh, L.P., Levang, P. & Ghazoul, J. (2009) Designer landscapes for sustainable biofuels. Trends Ecol. Evol., 24, 431–438.
Koh, L.P. & Wilcove, D.S. (2008) Is oil palm agriculture really destroying tropical biodiversity? Conserv. Lett., 1, 60–64.
Kraft, N.J.B., Comita, L.S., Chase, J.M., Sanders, N.J., Swenson, N.G., Crist, T.O., Stegen, J.C., Vellend, M., Boyle, B., Anderson, M.J., Cornell, H. V, Davies, K.F., Freestone, A.L., Inouye, B.D., Harrison, S.P. & Myers, J.A. (2011) Disentangling the drivers of β diversity along latitudinal and elevational gradients. Science, 333, 1755–1758.

Bibliography
219
Krauss, J., Steffan-Dewenter, I. & Tscharntke, T. (2003) Local species immigration, extinction, and turnover of butterflies in relation to habitat area and habitat isolation. Oecologia, 137, 591–602.
Kuussaari, M., Bommarco, R., Heikkinen, R.K., Helm, A., Krauss, J., Lindborg, R., Ockinger, E., Pärtel, M., Pino, J., Rodà, F., Stefanescu, C., Teder, T., Zobel, M. & Steffan-Dewenter, I. (2009) Extinction debt: a challenge for biodiversity conservation. Trends Ecol. Evol., 24, 564–571.
Laidlaw, R. (2000) Effects of habitat disturbance and protected areas on mammals of Peninsular Malaysia. Conserv. Biol., 14, 1639–1648.
Lamb, D., Erskine, P.D. & Parrotta, J.A. (2005) Restoration of degraded tropical forest landscapes. Science, 310, 1628–1632.
Lambert, F. (1991) The conservation of fig-eating birds in Malaysia. Biol. Conserv., 58, 31–40. Lambert, F. (1992) The consequences of selective logging for Bornean lowland forest birds. Philos.
Trans. R. Soc. B Biol. Sci., 335, 443–457. Lambert, F. & Collar, N. (2002) The future for Sundaic lowland forest birds: long-term effects of
commercial logging and fragmentation. Forktail, 18, 127–146. Lambert, F. & Marshall, A. (1991) Keystone characteristics of bird-dispersed Ficus in a Malaysian
lowland rain forest. J. Ecol., 79, 793–809. Lambert, T.D., Malcolm, J.R. & Zimmerman, B.L. (2006) Amazonian small mammal abundances in
relation to habitat structure and resource abundance. J. Mammal., 87, 766–776. Lande, R. (1996) Statistics and partitioning of species diversity, and similarity among multiple
communities. Oikos, 76, 5–13. Langham, N. (1983) Distribution and ecology of small mammals in three rain forest localities of
Peninsula Malaysia with particular references to Kedah Peak. Biotropica, 15, 199–206. Lantschner, M.V., Rusch, V. & Hayes, J.P. (2012) Habitat use by carnivores at different spatial scales
in a plantation forest landscape in Patagonia, Argentina. For. Ecol. Manage., 269, 271–278. Laporte, N.T., Stabach, J.A., Grosch, R., Lin, T.S. & Goetz, S.J. (2007) Expansion of industrial
logging in Central Africa. Science, 316, 1451. Larrucea, E.S., Brussard, P.F., Jaeger, M.M. & Barrett, R.H. (2007) Cameras, coyotes, and the
assumption of equal detectability. J. Wildl. Manage., 71, 1682–1689. Laufer, J., Michalski, F. & Peres, C. (2013) Assessing sampling biases in logging impact studies in
tropical forests. Trop. Conserv. Sci., 6, 16–34. Laurance, W. (2007) Forest destruction in tropical Asia. Curr. Sci., 93, 1544–1550. Laurance, W. (2008) Theory meets reality: how habitat fragmentation research has transcended island
biogeographic theory. Biol. Conserv., 141, 1731–1744. Laurance, W.F. (1991) Ecological correlates of extinction proneness in Australian tropical rain forest
mammals. Conserv. Biol., 5, 79–89. Laurance, W.F., Clements, G.R., Sloan, S., Connell, C.S.O., Mueller, N.D., Goosem, M., Venter, O.,
Edwards, D.P., Phalan, B., Balmford, A., Ree, R. Van Der & Arrea, I.B. (2014a) A global strategy for road building. Nature, 513, 229–232.
Laurance, W.F. & Cochrane, M.A. (2001) Synergistic effects in fragmented landscapes. Conserv. Biol., 15, 1488–1489.
Laurance, W.F., Goosem, M. & Laurance, S.G.W. (2009) Impacts of roads and linear clearings on tropical forests. Trends Ecol. Evol., 24, 659–669.
Laurance, W.F., Lovejoy, T.E., Vasconcelos, H.L., Bruna, E.M., Didham, R.K., Stouffer, P.C., Gascon, C., Bierregaard, R.O., Laurance, S.G. & Sampaio, E. (2002) Ecosystem decay of Amazonian forest fragments: a 22-Year investigation. Conserv. Biol., 16, 605–618.

Bibliography
220
Laurance, W.F., Sayer, J. & Cassman, K.G. (2014b) Agricultural expansion and its impacts on tropical nature. Trends Ecol. Evol., 29, 107–116.
Lawton, J.H. (1999) Are there general laws in ecology? Oikos, 84, 177–192. Lees, A.C. & Peres, C.A. (2008) Avian life-history determinants of local extinction risk in a hyper-
fragmented Neotropical forest landscape. Anim. Conserv., 11, 128–137. Legendre, P. (2014) Interpreting the replacement and richness difference components of beta
diversity. Glob. Ecol. Biogeogr., 23, 1324–1334. Legendre, P., Borcard, D., Blanchet, F.G. & Dray, S. (2013) PCNM: MEM spatial eigenfunction and
principal coordinate analyses. R package version 2.1-2. Available from http://R-Forge.R-project.org/projects/sedar/.
Legendre, P., Borcard, D. & Peres-Neto, P.R. (2005) Analyzing beta diversity: partitioning the spatial variation of community composition data. Ecol. Monogr., 75, 435–450.
Legendre, P. & De Cáceres, M. (2013) Beta diversity as the variance of community data: dissimilarity coefficients and partitioning. Ecol. Lett., 16, 951–963.
Legendre, P. & Gallagher, E. (2001) Ecologically meaningful transformations for ordination of species data. Oecologia, 129, 271–280.
Legendre, P. & Legendre, L. (2012) Numerical Ecology, 3rd edition. Elsevier Science BV, Amsterdam.
Leibold, M.A., Holyoak, M., Mouquet, N., Amarasekare, P., Chase, J.M., Hoopes, M.F., Holt, R.D., Shurin, J.B., Law, R., Tilman, D., Loreau, M. & Gonzalez, A. (2004) The metacommunity concept: a framework for multi-scale community ecology. Ecol. Lett., 7, 601–613.
Lemmon, P.E. (1957) A new instrument for measuring forest overstory density. J. For., 55, 667–668. Lessard, J.-P., Belmaker, J., Myers, J.A., Chase, J.M. & Rahbek, C. (2012) Inferring local ecological
processes amid species pool influences. Trends Ecol. Evol., 27, 600–607. Lhota, S., Loken, B., Spehar, S., Fell, E., Pospěch, A. & Kasyanto, N. (2012) Discovery of Miller’s
grizzled langur (Presbytis hosei canicrus) in Wehea Forest confirms the continued existence and extends known geographical range of an endangered primate. Am. J. Primatol., 74, 193–198.
Liebsch, D., Marques, M.C.M. & Goldenberg, R. (2008) How long does the Atlantic Rain Forest take to recover after a disturbance? Changes in species composition and ecological features during secondary succession. Biol. Conserv., 141, 1717–1725.
Lima, M., Marquet, P.A. & Jaksic, F.M. (1996) Extinction and colonization processes in subpopulations of five neotropical small mammal species. Oecologia, 107, 197–203.
Lindenmayer, D.B., Franklin, J.F., Lõhmus, A., Baker, S.C., Bauhus, J., Beese, W., Brodie, A., Kiehl, B., Kouki, J., Pastur, G.M., Messier, C., Neyland, M., Palik, B., Sverdrup-Thygeson, A., Volney, J., Wayne, A. & Gustafsson, L. (2012) A major shift to the retention approach for forestry can help resolve some global forest sustainability issues. Conserv. Lett., 5, 421–431.
Liow, L., Sodhi, N. & Elmqvist, T. (2001) Bee diversity along a disturbance gradient in tropical lowland forests of south-east Asia. J. Appl. Ecol., 38, 180–192.
Loader, N.J., Walsh, R.P.D., Robertson, I., Bidin, K., Ong, R.C., Reynolds, G., McCarroll, D., Gagen, M. & Young, G.H.F. (2011) Recent trends in the intrinsic water-use efficiency of ringless rainforest trees in Borneo. Philos. Trans. R. Soc. Lond. B. Biol. Sci., 366, 3330–3339.
Lomolino, M. & Perault, D. (2000) Assembly and disassembly of mammal communities in a fragmented temperate rain forest. Ecology, 81, 1517–1532.
Lucey, J.M., Tawatao, N., Senior, M.J.M., Chey, V.K., Benedick, S., Hamer, K.C., Woodcock, P., Newton, R.J., Bottrell, S.H. & Hill, J.K. (2014) Tropical forest fragments contribute to species richness in adjacent oil palm plantations. Biol. Conserv., 169, 268–276.

Bibliography
221
Luke, S.H., Fayle, T.M., Eggleton, P., Turner, E.C. & Davies, R.G. (2014) Functional structure of ant and termite assemblages in old growth forest, logged forest and oil palm plantation in Malaysian Borneo. Biodivers. Conserv., 23, 2817–2832.
Luskin, M.S. & Potts, M.D. (2011) Microclimate and habitat heterogeneity through the oil palm lifecycle. Basic Appl. Ecol., 12, 540–551.
Lynam, A. (1997) Rapid decline of small mammal diversity in monsoon evergreen forest fragments in Thailand. In Tropical forest remnants: ecology, management, and conservation of fragmented communities (eds W.F. Laurance & R.O. Bierregaard), pp. 222–240.
Lynam, A. & Billick, I. (1999) Differential responses of small mammals to fragmentation in a Thailand tropical forest. Biol. Conserv., 91, 191–200.
MacArthur, R.H. & Levins, R. (1967) The limiting similarity, convergence, and divergence of coexisting species. Am. Nat., 101, 377–385.
Macarthur, R.H. & Wilson, E.O. (1967) The Theory of Island Biogeography. Princeton University Press.
MacKenzie, D., Nichols, J. & Hines, J. (2003) Estimating site occupancy, colonization, and local extinction when a species is detected imperfectly. Ecology, 84, 2200–2207.
MacKenzie, D., Nichols, J. & Lachman, G. (2002) Estimating site occupancy rates when detection probabilities are less than one. Ecology, 83, 2248–2255.
Mackenzie, D.I. & Nichols, J.D. (2004) Occupancy as a surrogate for abundance estimation. Anim. Biodivers. Conserv., 1, 461–467.
MacKenzie, D.I., Nichols, J.D., Royle, J.A., Pollock, K.P., Bailey, L.L. & Hines, J.E. (2006) Occupancy Estimation and Modeling: Inferring Patterns and Dynamics of Species Occurrence. Academic Press, New York.
Maddox, T., Priatna, D., Gemita, E. & Salampessy, A. (2007) The conservation of tigers and other wildlife in oil palm plantations. Zoological Society of London, London.
Maffei, L., Cullar, E. & Noss, A. (2004) One thousand jaguars (Panthera onca) in Bolivia’s Chaco? Camera trapping in the Kaa-Iya National Park. J. Zool., 262, 295–304.
Malhi, Y., Gardner, T.A., Goldsmith, G.R., Silman, M.R. & Zelazowski, P. (2014) Tropical forests in the Anthropocene. Annu. Rev. Environ. Resour., 39, 125–159.
Malhi, Y., Phillips, O.L., Lloyd, J., Baker, T., Wright, J., Almeida, S., Arroyo, L., Frederiksen, T., Grace, J., Higuchi, N., Killeen, T., Laurance, W.F., Leano, C., Lewis, S., Meir, P., Monteagudo, A., Neill, D., Nunez Vargas, P., Panfil, S.N., et al. (2002) An international network to monitor the structure, composition and dynamics of Amazonian forests (RAINFOR). J. Veg. Sci., 13, 439–450.
Manning, A.D., Lindenmayer, D.B., Nix, H.A., Resource, C., Studies, E. & Australian, T. (2004) Continua and Umwelt: novel perspectives on viewing landscapes. Oikos, 104, 621–628.
Margono, B.A., Potapov, P. V., Turubanova, S., Stolle, F. & Hansen, M.C. (2014) Primary forest cover loss in Indonesia over 2000–2012. Nat. Clim. Chang., 4, 730–735.
Margono, B.A., Turubanova, S., Zhuravleva, I., Potapov, P., Tyukavina, A., Baccini, A., Goetz, S. & Hansen, M.C. (2012) Mapping and monitoring deforestation and forest degradation in Sumatra (Indonesia) using Landsat time series data sets from 1990 to 2010. Environ. Res. Lett., 7, 034010.
Marques, T.A., Thomas, L. & Royle, J.A. (2011) A hierarchical model for spatial capture-recapture data: comment. Ecology, 92, 526–528.
Marsden, S.J. (1998) Changes in bird abundance following selective logging on Seram, Indonesia. Conserv. Biol., 12, 605–611.
Marsh, C.J. & Ewers, R.M. (2012) A fractal-based sampling design for ecological surveys quantifying

Bibliography
222
β-diversity. Methods Ecol. Evol., 4, 63–72. Marsh, C.W. & Greer, A.G. (1992) Forest land-use in Sabah, Malaysia: an introduction to Danum
Valley. Philos. Trans. R. Soc. B Biol. Sci., 335, 331–339. Martin, A.R. & Thomas, S.C. (2011) A reassessment of carbon content in tropical trees. PLoS One, 6,
e23533. Mathai, J., Hon, J. & Juat, N. (2010) Small carnivores in a logging concession in the Upper Baram,
Sarawak, Borneo. Small Carniv. Conserv., 42, 1–9. Matias, M.G., Gravel, D., Guilhaumon, F., Desjardins-Proulx, P., Loreau, M., Münkemüller, T. &
Mouquet, N. (2014) Estimates of species extinctions from species-area relationships strongly depend on ecological context. Ecography, 37, 431–442.
Matsubayashi, H., Bernard, H. & Ahmad, A.H. (2011) Small carnivores of the Imbak Canyon, Sabah, Malaysia, Borneo, including a new locality for the Hose’s Civet Diplogale hosei. Small Carniv. Conserv., 45, 18–22.
Mayaux, P., Holmgren, P., Achard, F., Eva, H., Stibig, H.-J. & Branthomme, A. (2005) Tropical forest cover change in the 1990s and options for future monitoring. Philos. Trans. R. Soc. Lond. B. Biol. Sci., 360, 373–384.
Mazerolle, M.J. & Villard, M.-A. (1999) Patch characteristics and landscape context as predictors of species presence and abundance: A review. Écoscience, 6, 117–124.
Mcconkey, K.R. (2005) Influence of faeces on seed removal from gibbon droppings in a dipterocarp forest in Central Borneo. J. Trop. Ecol., 21, 117–120.
McGarigal, K. & Cushman, S.A. (2002) Comparative evaluation of experimental approaches to the study of habitat fragmentation effects. Ecol. Appl., 12, 335–345.
McIntire, E. & Fajardo, A. (2009) Beyond description: the active and effective way to infer processes from spatial patterns. Ecology, 90, 46–56.
Mcintyre, S. & Barrett, G.W. (1992) Habitat variegation, an alternative to fragmentation. Conserv. Biol., 6, 146–147.
McIntyre, S. & Hobbs, R. (1999) A framework for conceptualizing human effects on landscapes and its relevance to management and research models. Conserv. Biol., 13, 1282–1292.
McKinney, M.L. (1997) Extinction vulnerability and selectivity: combining ecological and paleontological views. Annu. Rev. Ecol. Syst., 28, 495–516.
McMorrow, J. & Talip, M.A. (2001) Decline of forest area in Sabah, Malaysia: relationship to state policies, land code and land capability. Glob. Environ. Chang., 11, 217–230.
McShea, W.J., Stewart, C., Peterson, L., Erb, P., Stuebing, R. & Giman, B. (2009) The importance of secondary forest blocks for terrestrial mammals within an Acacia/secondary forest matrix in Sarawak, Malaysia. Biol. Conserv., 142, 3108–3119.
Meek, P., Ballard, G. & Fleming, P. (2012) An introduction to camera trapping for wildlife surveys in Australia. Invasive Animals Cooperative Research Centre, Canberra, Australia.
Meijaard, E., Albar, G., Nardiyono, Rayadin, Y., Ancrenaz, M. & Spehar, S. (2010) Unexpected ecological resilience in Bornean orangutans and implications for pulp and paper plantation management. PLoS One, 5, e12813.
Meijaard, E. & Sheil, D. (2007) A logged forest in Borneo is better than none at all. Nature, 446, 974. Meijaard, E. & Sheil, D. (2008) The persistence and conservation of Borneo’s mammals in lowland
rain forests managed for timber: observations, overviews and opportunities. Ecol. Res., 23, 21–34.
Meijaard, E., Sheil, D., Marshall, A. & Nasi, R. (2008) Phylogenetic age is positively correlated with sensitivity to timber harvest in Bornean mammals. Biotropica, 40, 76–85.

Bibliography
223
Meijaard, E., Sheil, D., Nasi, R., Augeri, D., Rosenbaum, B., Iskandar, D., Setyawati, T., Lammertink, M., Rachmatika, I., Wong, A., Soehartono, T., Stanley, S. & O’Brien, T. (2005) Life after Logging: Reconciling Wildlife Conservation and Production Forestry in Indonesian Borneo. Center for International Forestry Research, Bogor, Indonesia.
Michalski, F. & Peres, C. (2005) Anthropogenic determinants of primate and carnivore local extinctions in a fragmented forest landscape of southern Amazonia. Biol. Conserv., 124, 383–396.
Miettinen, J., Shi, C. & Liew, S.C. (2011) Deforestation rates in insular Southeast Asia between 2000 and 2010. Glob. Chang. Biol., 17, 2261–2270.
Mitra, S. & Sheldon, F. (1993) Use of an exotic tree plantation by Bornean lowland forest birds. Auk, 110, 529–540.
Mohamed, A., Samejima, H. & Wilting, A. (2009) Records of five Bornean cat species from Deramakot Forest Reserve in Sabah, Malaysia. Cat News, 51, 12–15.
Mohamed, A., Sollmann, R., Bernard, H., Ambu, L.N., Lagan, P., Mannan, S., Hofer, H. & Wilting, A. (2013) Density and habitat use of the leopard cat (Prionailurus bengalensis) in three commercial forest reserves in Sabah, Malaysian Borneo. J. Mammal., 94, 82–89.
Mohd-Azlan, J. (2003) The diversity and conservation of mustelids, viverrids, and herpestids in a disturbed forest in Peninsular Malaysia. Small Carniv. Conserv., 29, 8–9.
Mohd-Azlan, J. (2006) Mammal diversity and conservation in a secondary forest in Peninsular Malaysia. Biodivers. Conserv., 15, 1013–1025.
Mohd-Azlan, J. & Sanderson, J. (2007) Geographic distribution and conservation status of the bay cat Catopuma badia, a Bornean endemic. Oryx, 41, 394–397.
Mohd-Azlan, J. & Sharma, D. (2006) The diversity and activity patterns of wild felids in a secondary forest in Peninsular Malaysia. Oryx, 40, 36–41.
Morrogh-bernard, H., Husson, S., Page, S.E. & Rieley, J.O. (2003) Population status of the Bornean orang-utan (Pongo pygmaeus ) in the Sebangau peat swamp forest, Central Kalimantan, Indonesia. Biol. Conserv., 110, 141–152.
Munshi-South, J., Emmons, L.H. & Bernard, H. (2007) Behavioral monogamy and fruit availability in the large treeshrew (Tupaia tana) in Sabah, Malaysia. J. Mammal., 88, 1427–1438.
Mutshinda, C.M. & O’Hara, R.B. (2011) Integrating the niche and neutral perspectives on community structure and dynamics. Oecologia, 166, 241–251.
Mutshinda, C.M., O’Hara, R.B. & Woiwod, I.P. (2009) What drives community dynamics? Proc. R. Soc. B Biol. Sci., 276, 2923–2929.
Myers, N., Mittermeier, R.A., Mittermeier, C.G., da Fonseca, G.A. & Kent, J. (2000) Biodiversity hotspots for conservation priorities. Nature, 403, 853–858.
Naim, M., Ketut Aryawan, A., Sudharto, P., Jennings, A.P., Veron, G., Verwilghen, A., Turner, E.C., Aulia, P. & Caliman, J.-P. (2014) Understanding the relationship between rat populations and small carnivores in oil palm plantations: Outputs for sustainable control of rats. In Proceedings of the 4th International Conference on Oil Palm And Environment (ICOPE).
Nájera, A. & Simonetti, J.A. (2010) Can oil palm plantations become bird friendly? Agrofor. Syst., 80, 203–209.
Nakagawa, M., Hyodo, F. & Nakashizuka, T. (2007) Effect of forest use on trophic levels of small mammals: an analysis using stable isotopes. Can. J. Zool., 85, 472–478.
Nakagawa, M., Miguchi, H. & Nakashizuka, T. (2006) The effects of various forest uses on small mammal communities in Sarawak, Malaysia. For. Ecol. Manage., 231, 55–62.
Nakashima, Y., Inoue, E., Inoue-Murayama, M. & Sukor, J.R.A. (2010) Functional uniqueness of a small carnivore as seed dispersal agents: A case study of the common palm civets in the Tabin

Bibliography
224
Wildlife Reserve, Sabah, Malaysia. Oecologia, 164, 721–730. Nakashima, Y., Nakabayashi, M. & Sukor, J.A. (2013) Space use, habitat selection, and day-beds of
the common palm civet (Paradoxurus hermaphroditus) in human-modified habitats in Sabah, Borneo. J. Mammal., 94, 1169–1178.
Mac Nally, R. (2007) Use of the abundance spectrum and relative-abundance distributions to analyze assemblage change in massively altered landscapes. Am. Nat., 170, 319–330.
Mac Nally, R. & Fleishman, E. (2004) Comparative influence of spatial scale on beta diversity within regional assemblages of birds and butterflies. J. Biogeogr., 31, 917–929.
Nasi, R., Koponen, P., Poulsen, J.G., Buitenzorgy, M. & Rusmantoro, W. (2007) Impact of landscape and corridor design on primates in a large-scale industrial tropical plantation landscape. Biodivers. Conserv., 17, 1105–1126.
Nekola, J. & White, P. (2002) Conservation, the two pillars of ecological explanation, and the paradigm of distance. Nat. Areas J., 22, 305–310.
Newbery, D.M., Campbell, E.J.F., Lee, Y.F., Ridsdale, C.E. & Still, M.J. (1992) Primary lowland dipterocarp forest at Danum Valley, Sabah, Malaysia: structure, relative abundance and family composition. Philos. Trans. R. Soc. Lond. B. Biol. Sci., 335, 341–356.
Newbery, D.M., Campbell, E.J.F., Proctor, J. & Still, M.J. (1996) Primary lowland dipterocarp forest at Danum Valley, Sabah, Malaysia. Species composition and patterns in the understorey. Vegetatio, 122, 193–220.
Newbold, T., Hudson, L.N., Hill, S.L.L., Contu, S., Lysenko, I., Senior, R.A., Börger, L., Bennett, D.J., Choimes, A., Collen, B., Day, J., Palma, A. De, Díaz, S., Edgar, M.J., Feldman, A., Garon, M., Harrison, M.L.K., Alhusseini, T., Echeverria-Londoño, S., et al. (2015) Global effects of land use on local terrestrial biodiversity. Nature, 520, 45–50.
Newbold, T., Hudson, L.N., Phillips, H.R.P., Hill, S.L.L., Contu, S., Lysenko, I., Blandon, A., Butchart, S.H.M., Booth, H.L., Day, J., Palma, A. De, Harrison, M.L.K., Kirkpatrick, L., Pynegar, E., Robinson, A., Simpson, J., Mace, G.M., Scharlemann, J.P.W. & Purvis, A. (2014) A global model of the response of tropical and sub-tropical forest biodiversity to anthropogenic pressures. Proc. R. Soc. London Ser. B Biol. Sci., 281, 20141371.
Nichols, E., Spector, S., Louzada, J., Larsen, T., Amezquita, S. & Favila, M.E. (2008) Ecological functions and ecosystem services provided by Scarabaeinae dung beetles. Biol. Conserv., 141, 1461–1474.
Numata, S., Okuda, T., Sugimoto, T., Nishimura, S., Yoshida, K., Quah, E.S., Yasuda, M., Muangkhum, K. & Noor, N. (2005) Camera trapping: a non-invasive approach as an additional tool in the study of mammals in Pasoh Forest Reserve and adjacent fragmented areas in Peninsular Malaysia. Malayan Nat. J., 57, 29–45.
Oksanen, J., Blanchet, F.G., Kindt, R., Legendre, P., Minchin, P.R., O’Hara, R.B., Simpson, G.L., Solymos, P., Henry, M., Stevens, H. & Wagner, H. (2013) vegan: Community ecology package. R package version 2.0-10. Available from http://cran.r-project.org/package=vegan.
Olivier, P.I. & Aarde, R.J. Van (2014) Multi-scale sampling boosts inferences from beta diversity patterns in coastal forests of South Africa. J. Biogeogr., 41, 1428–1439.
Olsen, A.R., Sedransk, J., Edwards, D., Gotway, C.A., Liggett, W., Rathbun, S., Reckhow, K.H. & Young, L.J. (1999) Statistical issues for monitoring ecological and natural resources in the United States. Environ. Monit. Assess., 54, 1–45.
Onoguchi, G. & Matsubayashi, H. (2008) Comparative study on mammalian fauna in different harvesting intensities with reduced-impact and conventional logging in Sabah, Malaysia. In Sustainability and biodiversity assessment on forest utilization options (eds M. Ichikawa, S. Yamashita & T. Nakasizuka), pp. 133–140.
Orrock, J.L. & Watling, J.I. (2010) Local community size mediates ecological drift and competition in

Bibliography
225
metacommunities. Proc. Biol. Sci., 277, 2185–2191. Otis, D., Burnham, K., White, G. & Anderson, D. (1978) Statistical inference from capture data on
closed animal populations. Wildl. Monogr., 62, 1–135. Ovaskainen, O. & Hanski, I. (2002) Transient dynamics in metapopulation response to perturbation.
Theor. Popul. Biol., 61, 285–295. Ovaskainen, O., Hottola, J. & Siitonen, J. (2010) Modeling species co-occurrence by multivariate
logistic regression generates new hypotheses on fungal interactions. Ecology, 91, 2514–2521. Paoli, G.D., Peart, D.R., Leighton, M. & Samsoedin, I. (2001) An ecological and economic
assessment of the nontimber forest product gaharu wood in Gunung Palung National Park, West Kalimantan, Indonesia. Conserv. Biol., 15, 1721–1732.
Pardini, R., Bueno, A.D.A., Gardner, T.A., Prado, P.I. & Metzger, J.P. (2010) Beyond the fragmentation threshold hypothesis: regime shifts in biodiversity across fragmented landscapes. PLoS One, 5, e13666.
Paton, P. (1994) The effect of edge on avian nest success: how strong is the evidence? Conserv. Biol., 8, 17–26.
Pattanavibool, A. & Dearden, P. (2002) Fragmentation and wildlife in montane evergreen forests, northern Thailand. Biol. Conserv., 107, 155–164.
Patterson, B.D. (1987) The principle of nested subsets and its implications for biological conservation. Conserv. Biol., 1, 323–334.
Payne, J., Francis, C.M. & Phillipps, K. (2007) A Field Guide to the Mammals of Borneo, 4th edition. The Sabah Society, Kota Kinabalu.
Peh, K.S.-H., Jong, J. De, Sodhi, N.S., Lim, S.L.-H. & Yap, C.A.-M. (2005) Lowland rainforest avifauna and human disturbance: persistence of primary forest birds in selectively logged forests and mixed-rural habitats of southern Peninsular Malaysia. Biol. Conserv., 123, 489–505.
Peh, K.S.-H., Sodhi, N.S., de Jong, J., Sekercioglu, C.H., Yap, C. a.-M. & Lim, S.L.-H. (2006) Conservation value of degraded habitats for forest birds in southern Peninsular Malaysia. Divers. Distrib., 12, 572–581.
Pereira, H. & Daily, G. (2006) Modeling biodiversity dynamics in countryside landscapes. Ecology, 87, 1877–1885.
Peres, C.A., Gardner, T.A., Barlow, J., Zuanon, J., Michalski, F., Lees, A.C., Vieira, I.C.G., Moreira, F.M.S. & Feeley, K.J. (2010) Biodiversity conservation in human-modified Amazonian forest landscapes. Biol. Conserv., 143, 2314–2327.
Peres-Neto, P., Legendre, P., Dray, S. & Borcard, D. (2006) Variation partitioning of species data matrices: estimation and comparison of fractions. Ecology, 87, 2614–2625.
Peres-Neto, P.R. & Legendre, P. (2010) Estimating and controlling for spatial structure in the study of ecological communities. Glob. Ecol. Biogeogr., 19, 174–184.
Persey, S., Imanuddin & Sadiki, L. (2011) A Practical Handbook for Conserving High Conservation Value Species and Habitats within oil palm landscapes. Zoological Society of London, London.
Persoon, G.A. & Osseweijer, M. (2008) Reflections on the Heart of Borneo. Tropenbos International, Wageningen, the Netherlands.
Pettorelli, N., Laurance, W.F., O’Brien, T.G., Wegmann, M., Nagendra, H. & Turner, W. (2014) Satellite remote sensing for applied ecologists: Opportunities and challenges. J. Appl. Ecol., 51, 839–848.
Pfeifer, M., Kor, L., Nilus, R., Turner, E.C., Khen, C.V., Cusack, J.J., Lysenko, I., Chung, A.Y.C. & Ewers, R.M. (2015) Mapping the structure of Borneo’s tropical forests across a degradation gradient. Remote Sens. Environ., [submitted].

Bibliography
226
Phalan, B., Bertzky, M., Butchart, S.H.M., Donald, P.F., Scharlemann, J.P.W., Stattersfield, A.J. & Balmford, A. (2013) Crop expansion and conservation priorities in tropical countries. PLoS One, 8, e51759.
Phalan, B., Onial, M., Balmford, A. & Green, R.E. (2011) Reconciling food production and biodiversity conservation: land sharing and land sparing compared. Science, 333, 1289–1291.
Philpott, S.M., Bichier, P., Rice, R.A. & Greenberg, R. (2007) Biodiversity conservation, yield, and alternative products in coffee agroecosystems in Sumatra, Indonesia. Biodivers. Conserv., 17, 1805–1820.
Pimm, S., Jones, H. & Diamond, J. (1988) On the risk of extinction. Am. Nat., 132, 757–785. Pimm, S.L., Jenkins, C.N., Abell, R., Brooks, T.M., Gittleman, J.L., Joppa, L.N., Raven, P.H.,
Roberts, C.M. & Sexton, J.O. (2014) The biodiversity of species and their rates of extinction, distribution, and protection. Science, 344, 1246752.
Pinard, M.., Barker, M.. & Tay, J. (2000a) Soil disturbance and post-logging forest recovery on bulldozer paths in Sabah, Malaysia. For. Ecol. Manage., 130, 213–225.
Pinard, M.A., Putz, F.E. & Tay, J. (2000b) Lessons learned from the implementation of reduced-impact logging in hilly terrain in Sabah, Malaysia. Int. For. Rev., 2, 33–39.
Piper, S.D. & Catterall, C.P. (2003) A particular case and a general pattern: hyperaggressive behaviour by one species may mediate avifaunal decreases in fragmented Australian forests. Oikos, 101, 602–614.
Plummer, M. (2013) JAGS: Just Another Gibbs Sampler, version 3.4.0. Available from http://mcmc-jags.sourceforge.net/.
Pollock, K.H. (1982) A capture–recapture design robust to unequal probability of capture. J. Wildl. Manage., 46, 752–757.
Posa, M.R.C. & Sodhi, N.S. (2006) Effects of anthropogenic land use on forest birds and butterflies in Subic Bay, Philippines. Biol. Conserv., 129, 256–270.
Potts, M.D. & Vincent, J.R. (2008) Spatial distribution of species populations, relative economic values, and the optimal size and number of reserves. Environ. Resour. Econ., 39, 91–112.
Poynton, S. (2014) The history of the contentious number behind zero deforestation commitments for palm oil. Available from http://news.mongabay.com/2014/0714-poynton-commentary-35-tons-c.html.
Prugh, L.R., Hodges, K.E., Sinclair, A.R.E. & Brashares, J.S. (2008) Effect of habitat area and isolation on fragmented animal populations. Proc. Natl. Acad. Sci. U. S. A., 105, 20770–20775.
Puan, C.C.L., Goldizen, A.W.A., Zakaria, M., Hafidzi, M.N. & Baxter, G.S. (2011) Relationships among rat numbers, abundance of oil palm fruit and damage levels to fruit in an oil palm plantation. Integr. Zool., 6, 130–139.
Putz, F. & Appanah, S. (1987) Buried seeds, newly dispersed seeds, and the dynamics of a lowland forest in Malaysia. Biotropica, 19, 326–333.
Putz, F.E., Zuidema, P.A., Synnott, T., Peña-Claros, M., Pinard, M.A., Sheil, D., Vanclay, J.K., Sist, P., Gourlet-Fleury, S., Griscom, B., Palmer, J. & Zagt, R. (2012) Sustaining conservation values in selectively logged tropical forests: the attained and the attainable. Conserv. Lett., 5, 296–303.
Qi, J., Chehbouni, A., Huete, A.R., Kerr, Y.H. & Sorooshian, S. (1994) A modified soil adjusted vegetation index. Remote Sens. Environ., 48, 119–126.
R Development Core Team (2014) R: A language and environment for statistical computing. R Foundation for Statistical Computing, Vienna, Austria. Available from http://www.r-project.org/.
Radford, J.Q., Bennett, A.F. & Cheers, G.J. (2005) Landscape-level thresholds of habitat cover for woodland-dependent birds. Biol. Conserv., 124, 317–337.

Bibliography
227
Rajaratnam, R., Sunquist, M., Rajaratnam, L. & Ambu, L. (2007) Diet and habitat selection of the leopard cat (Prionailurus bengalensis borneoensis) in an agricultural landscape in Sabah, Malaysian Borneo. J. Trop. Ecol., 23, 209–217.
Ramage, B.S., Marshalek, E.C., Kitzes, J. & Potts, M.D. (2013a) Conserving tropical biodiversity via strategic spatiotemporal harvest planning. J. Appl. Ecol., 50, 1301–1310.
Ramage, B.S., Sheil, D., Salim, H.M.W., Fletcher, C., Mustafa, N.-Z.A., Luruthusamay, J.C., Harrison, R.D., Butod, E., Dzulkiply, A.D., Kassim, A.R. & Potts, M.D. (2013b) Pseudoreplication in tropical forests and the resulting effects on biodiversity conservation. Conserv. Biol., 27, 364–372.
Ramankutty, N. & Foley, J. (1999) Estimating historical changes in global land cover: Croplands from 1700 to 1992. Global Biogeochem. Cycles, 13, 997–1027.
Ranganathan, J., Daniels, R.J.R., Chandran, M.D.S., Ehrlich, P.R. & Daily, G.C. (2008) Sustaining biodiversity in ancient tropical countryside. Proc. Natl. Acad. Sci. U. S. A., 105, 17852–17854.
Rao, M., Rabinowitz, A. & Khaing, S.T. (2002) Status review of the protected-area system in Myanmar, with recommendations for conservation planning. Conserv. Biol., 16, 360–368.
Reid, A. (1995) Humans and forests in pre-colonial Southeast Asia. Environ. Hist. Camb., 1, 93–110. Reynolds, G., Payne, J., Sinun, W., Mosigil, G. & Walsh, R.P.D. (2011) Changes in forest land use
and management in Sabah, Malaysian Borneo, 1990-2010, with a focus on the Danum Valley region. Philos. Trans. R. Soc. Lond. B. Biol. Sci., 366, 3168–3176.
Rickart, E.A., Balete, D.S., Rowe, R.J. & Heaney, L.R. (2011) Mammals of the northern Philippines: tolerance for habitat disturbance and resistance to invasive species in an endemic insular fauna. Divers. Distrib., 17, 530–541.
Ricotta, C. (2010) On beta diversity decomposition: trouble shared is not trouble halved. Ecology, 91, 1981–1983.
Robinson, S.K., Thompson, F.R., Donovan, T.M., Whitehead, D.R. & Faaborg, J. (1995) Regional forest fragmentation and the nesting success of migratory birds. Science, 267, 1987–1990.
Rosenzweig, M.L. (1995) Species Diversity in Space and Time. Cambridge University Press. Ross, J., Hearn, A.J., Johnson, P.J. & Macdonald, D.W. (2013) Activity patterns and temporal
avoidance by prey in response to Sunda clouded leopard predation risk. J. Zool., 290, 96–106. Rota, C.T., Fletcher Jr, R.J., Dorazio, R.M. & Betts, M.G. (2009) Occupancy estimation and the
closure assumption. J. Appl. Ecol., 46, 1173–1181. Rowcliffe, J.M. & Carbone, C. (2008) Surveys using camera traps: are we looking to a brighter
future? Anim. Conserv., 11, 185–186. Rowcliffe, J.M., Carbone, C., Jansen, P.A., Kays, R. & Kranstauber, B. (2011) Quantifying the
sensitivity of camera traps: an adapted distance sampling approach. Methods Ecol. Evol., 2, 464–476.
Rowcliffe, J.M., Field, J., Turvey, S.T. & Carbone, C. (2008) Estimating animal density using camera traps without the need for individual recognition. J. Appl. Ecol., 45, 1228–1236.
Royle, J. & Nichols, J. (2003) Estimating abundance from repeated presence-absence data or point counts. Ecology, 84, 777–790.
Royle, J.A. (2004) N-Mixture Models for Estimating Population Size from Spatially Replicated Counts. Biometrics, 60, 108–115.
Royle, J.A. & Dorazio, R.M. (2008) Hierarchical Modeling and Inference in Ecology: The Analysis of Data from Populations, Metapopulations and Communities. Academic Press.
Rustam, Yasuda, M. & Tsuyuki, S. (2012) Comparison of mammalian communities in a human-disturbed tropical landscape in East Kalimantan, Indonesia. Mammal Study, 37, 299–311.

Bibliography
228
Sala, O.E., Iii, F.S.C., Armesto, J.J., Berlow, E., Bloomfield, J., Dirzo, R., Huber-sanwald, E., Huenneke, L.F., Jackson, R.B., Kinzig, A., Leemans, R., Lodge, D.M., Mooney, H.A., Poff, N.L., Sykes, M.T., Walker, B.H. & Walker, M. (2000) Global biodiversity scenarios for the year 2100. Science, 287, 1770–1774.
Salafsky, N., Dugelby, B. & Terborgh, J. (1993) Can extractive reserves save the rain forest? An ecological and socioeconomic comparison of nontimber forest product extraction systems in Peten, Guatemala, and West Kalimantan, Indonesia. Conserv. Biol., 7, 39–52.
Samejima, H., Ong, R., Lagan, P. & Kitayama, K. (2012) Camera-trapping rates of mammals and birds in a Bornean tropical rainforest under sustainable forest management. For. Ecol. Manage., 270, 248–256.
Samejima, H. & Semiadi, G. (2012) First record of Hose’s Civet Diplogale hosei from Indonesia, and records of other carnivores in the Schwaner Mountains, Central Kalimantan, Indonesia. Small Carniv. Conserv., 46, 1–7.
Samsudin, M., Khairul Najwan, A.J., Jalil, M.S., Abd Rahman, K., Mohd Nizam, M.S., Wan Mohd Shukri, W.A., Ismail, H., Shamsudin, I. & Wan Razali, W.M. (2010) Stocking and species composition of second growth forests in Peninsular Malaysia. Malaysian For., 73, 213–225.
Sax, D.F. & Gaines, S.D. (2003) Species diversity: from global decreases to local increases. Trends Ecol. Evol., 18, 561–566.
Scales, B.R. & Marsden, S.J. (2008) Biodiversity in small-scale tropical agroforests: a review of species richness and abundance shifts and the factors influencing them. Environ. Conserv., 35, 160–172.
Scheiner, S. (2004) A mélange of curves–further dialogue about species–area relationships. Glob. Ecol. Biogeogr., 13, 479–484.
Schipper, J., Chanson, J.S., Chiozza, F., Cox, N.A., Hoffmann, M., Katariya, V., Lamoreux, J., Rodrigues, A.S.L., Stuart, S.N., Temple, H.J., Baillie, J., Boitani, L., Lacher, T.E., Mittermeier, R.A., Smith, A.T., Absolon, D., Aguiar, J.M., Amori, G., Bakkour, N., et al. (2008) The status of the world’s land and marine mammals: diversity, threat, and knowledge. Science, 322, 225–230.
Schoener, T. & Spiller, D. (1987) High population persistence in a system with high turnover. Nature, 330, 474–477.
Schulze, C. & Waltert, M. (2004) Biodiversity indicator groups of tropical land-use systems: comparing plants, birds, and insects. Ecol. Appl., 14, 1321–1333.
Schwenk, W.S. & Donovan, T.M. (2011) A multispecies framework for landscape conservation planning. Conserv. Biol., 25, 1010–1021.
Scott, D.M. & Gemita, E. (2004) Can human-modified landscapes in Sumatra provide suitable habitat for threatened cat species? Zoological Society of London, London.
Scriven, S.A., Hodgson, J.A., McClean, C.J. & Hill, J.K. (2015) Protected areas in Borneo may fail to conserve tropical forest biodiversity under climate change. Biol. Conserv., 184, 414–423.
Sekercioglu, C.H., Ehrlich, P.R., Daily, G.C., Aygen, D., Goehring, D. & Sandi, R.F. (2002) Disappearance of insectivorous birds from tropical forest fragments. Proc. Natl. Acad. Sci. U. S. A., 99, 263–267.
Senior, M.J.M., Hamer, K.C., Bottrell, S., Edwards, D.P., Fayle, T.M., Lucey, J.M., Mayhew, P.J., Newton, R., Peh, K.S.-H., Sheldon, F.H., Stewart, C., Styring, A.R., Thom, M.D.F., Woodcock, P. & Hill, J.K. (2012) Trait-dependent declines of species following conversion of rain forest to oil palm plantations. Biodivers. Conserv., 22, 253–268.
Sethi, P. & Howe, H.F. (2009) Recruitment of hornbill-dispersed trees in hunted and logged forests of the Indian Eastern Himalaya. Conserv. Biol., 23, 710–718.
Shean, M. (2011) Commodity intelligent report: obstacles may reduce future palm oil production

Bibliography
229
growth. Foreign Agriculture Service, United States Department of Agriculture. Shehzad, W., Riaz, T., Nawaz, M.A., Miquel, C., Poillot, C., Shah, S.A., Pompanon, F., Coissac, E. &
Taberlet, P. (2012) Carnivore diet analysis based on next-generation sequencing: application to the leopard cat (Prionailurus bengalensis) in Pakistan. Mol. Ecol., 21, 1951–1965.
Sheldon, F.H., Styring, A. & Hosner, P.A. (2010) Bird species richness in a Bornean exotic tree plantation: a long-term perspective. Biol. Conserv., 143, 399–407.
Shmida, A. & Wilson, M. V. (1985) Biological determinants of species diversity. J. Biogeogr., 12, 1–20.
Siegert, F., Ruecker, G., Hinrichs, A. & Hoffmann, A.A. (2001) Increased damage from fires in logged forests during droughts caused by El Niño. Nature, 414, 437–440.
Silmi, M., Mislan, S. & Dahlen, B. (2013) Using leopard cats (Prionailurus bengalensis) as biological pest control of rats in a palm oil plantation. Indones. Nat. Hist., 1, 31–36.
Sist, P., Fimbel, R., Sheil, D., Nasi, R. & Chevallier, M.-H. (2003) Towards sustainable management of mixed dipterocarp forests of South-east Asia: moving beyond minimum diameter cutting limits. Environ. Conserv., 30, 364–374.
Slade, E.M., Mann, D.J. & Lewis, O.T. (2011) Biodiversity and ecosystem function of tropical forest dung beetles under contrasting logging regimes. Biol. Conserv., 144, 166–174.
Soberón, J. (2007) Grinnellian and Eltonian niches and geographic distributions of species. Ecol. Lett., 10, 1115–1123.
Sodhi, N., Koh, L., Prawiradilaga, D., Tinulele, I., Putra, D. & Tongtan, T. (2005) Land use and conservation value for forest birds in Central Sulawesi (Indonesia). Biol. Conserv., 122, 547–558.
Sodhi, N.S., Koh, L.P., Brook, B.W. & Ng, P.K.L. (2004) Southeast Asian biodiversity: an impending disaster. Trends Ecol. Evol., 19, 654–660.
Sodhi, N.S., Lee, T.M., Koh, L.P. & Brook, B.W. (2009a) A meta-analysis of the impact of anthropogenic forest disturbance on Southeast Asia’s biotas. Biotropica, 41, 103–109.
Sodhi, N.S., Posa, M.R.C., Lee, T.M., Bickford, D., Koh, L.P. & Brook, B.W. (2009b) The state and conservation of Southeast Asian biodiversity. Biodivers. Conserv., 19, 317–328.
Sodhi, N.S., Wilcove, D.S., Lee, T.M., Sekercioglu, C.H., Subaraj, R., Bernard, H., Yong, D.L., Lim, S.L.H., Prawiradilaga, D.M. & Brook, B.W. (2010) Deforestation and avian extinction on tropical landbridge islands. Conserv. Biol., 24, 1290–1298.
Soininen, J., Lennon, J. & Hillebrand, H. (2007a) A multivariate analysis of beta diversity across organisms and environments. Ecology, 88, 2830–2838.
Soininen, J., McDonald, R. & Hillebrand, H. (2007b) The distance decay of similarity in ecological communities. Ecography, 30, 3–12.
Sollmann, R., Mohamed, A., Samejima, H. & Wilting, A. (2013) Risky business or simple solution – Relative abundance indices from camera-trapping. Biol. Conserv., 159, 405–412.
Steinbauer, M.J., Dolos, K., Reineking, B. & Beierkuhnlein, C. (2012) Current measures for distance decay in similarity of species composition are influenced by study extent and grain size. Glob. Ecol. Biogeogr., 21, 1203–1212.
Stephens, S., Noons, D.N., Rotella, J.J. & Willey, D.W. (2003) Effects of habitat fragmentation on avian nesting success: a review of the evidence at multiple spatial scales. Biol. Conserv., 115, 101–110.
Stibig, H., Achard, F. & Fritz, S. (2004) A new forest cover map of continental southeast Asia derived from SPOT-VEGETATION satellite imagery. Appl. Veg. Sci., 7, 153–162.
Stibig, H., Beuchle, R. & Achard, F. (2003) Mapping of the tropical forest cover of insular Southeast

Bibliography
230
Asia from SPOT4-Vegetation images. Int. J. Remote Sens., 24, 3651–3662. Stibig, H., Stolle, F., Dennis, R. & Feldkotter, C. (2007) Forest cover change in Southeast Asia–the
regional pattern. European Commission JRC Scientific and Technical Reports. Struebig, M.J., Fischer, M. & Gaveau, D.L.A. (2015a) Anticipated climate and land-cover changes
reveal refuge areas for Borneo’s orang-utans. Glob. Chang. Biol., [in press]. Struebig, M.J., Kingston, T., Petit, E.J., Le Comber, S.C., Zubaid, A., Mohd-Adnan, A. & Rossiter,
S.J. (2011) Parallel declines in species and genetic diversity in tropical forest fragments. Ecol. Lett., 14, 582–590.
Struebig, M.J., Kingston, T., Zubaid, A., Le Comber, S.C., Mohd-Adnan, A., Turner, A., Kelly, J., Bożek, M. & Rossiter, S.J. (2009) Conservation importance of limestone karst outcrops for Palaeotropical bats in a fragmented landscape. Biol. Conserv., 142, 2089–2096.
Struebig, M.J., Kingston, T., Zubaid, A., Mohd-Adnan, A. & Rossiter, S.J. (2008) Conservation value of forest fragments to Palaeotropical bats. Biol. Conserv., 141, 2112–2126.
Struebig, M.J., Turner, A., Giles, E., Lasmana, F., Tollington, S., Bernard, H. & Bell, D. (2013) Quantifying the biodiversity value of repeatedly logged rainforests: gradient and comparative approaches from Borneo. Adv. Ecol. Res., 48, 183–224.
Struebig, M.J., Wilting, A., Gaveau, D.L.A., Meijaard, E., Smith, R.J., Fischer, M., Metcalfe, K. & Kramer-Schadt, S. (2015b) Targeted conservation to safeguard a biodiversity hotspot from climate and land-Cover Change. Curr. Biol., 25, 372–378.
Stuebing, R.B. & Gasis, J. (1989) A survey of small mammals within a Sabah tree plantation in Malaysia. J. Trop. Ecol., 5, 203–214.
Styring, A.R., Ragai, R., Unggang, J., Stuebing, R., Hosner, P.A. & Sheldon, F.H. (2011) Bird community assembly in Bornean industrial tree plantations: effects of forest age and structure. For. Ecol. Manage., 261, 531–544.
Sunarto, S., Kelly, M.J., Parakkasi, K., Klenzendorf, S., Septayuda, E. & Kurniawan, H. (2012) Tigers need cover: multi-scale occupancy study of the big cat in Sumatran forest and plantation landscapes. PLoS One, 7, e30859.
Sunquist, M. & Sunquist, F. (2002) Wild Cats of the World. University of Chicago Press. Supp, S.R. & Ernest, S.K.M. (2014) Species-level and community-level responses to disturbance: a
cross-community analysis. Ecology, 95, 1717–1723. Sutherland, G., Harestad, A., Price, K. & Lertzman, K.P. (2000) Scaling of natal dispersal distances in
terrestrial birds and mammals. Conserv. Ecol., 4, 16. Szabo, J.K., Khwaja, N., Garnett, S.T. & Butchart, S.H.M. (2012) Global patterns and drivers of avian
extinctions at the species and subspecies level. PLoS One, 7, e47080. Tang, H.T. (1974) A brief assessment of the regeneration systems for hill forests in Peninsular
Malaysia. Malaysian For., 37, 263–270. Tawatao, N., Lucey, J.M., Senior, M., Benedick, S., Vun Khen, C., Hill, J.K. & Hamer, K.C. (2014)
Biodiversity of leaf-litter ants in fragmented tropical rainforests of Borneo: the value of publically and privately managed forest fragments. Biodivers. Conserv., 23, 3113–3126.
Thang, H.C. (1987) Forest management systems for tropical high forest, with special reference to Peninsular Malaysia. For. Ecol. Manage., 21, 3–20.
Thiollay, J. (1995) The role of traditional agroforests in the conservation of rain forest bird diversity in Sumatra. Conserv. Biol., 9, 335–353.
Thompson, W.L., White, G.C. & Gowan, C. (1998) Monitoring Vertebrate Populations. Academic Press, San Diego, California.
Tilman, D. (2004) Niche tradeoffs, neutrality, and community structure: a stochastic theory of

Bibliography
231
resource competition, invasion, and community assembly. Proc. Natl. Acad. Sci. U. S. A., 101, 10854–10861.
Tilman, D., May, R.M., Lehman, C.L. & Nowak, M.A. (1994) Habitat destruction and the extinction debt. Nature, 371, 65–66.
Tjørve, E. (2002) Habitat size and number in multi-habitat landscapes: a model approach based on species-area curves. Ecography, 1, 17–24.
Tobler, M.W., Hartley, A.Z., Carrillo-Percastegui, S.E. & Powell, G.V.N. (2015) Spatiotemporal hierarchical modelling of species richness and occupancy using camera trap data. J. Appl. Ecol., 52, 413–421.
Triantis, K.A., Mylonas, M., Lika, K., Natural, K.V. & Museum, H. (2003) A model for the species-area-habitat relationship. J. Biogeogr., 30, 19–27.
Tscharntke, T., Steffan-Dewenter, I., Kruess, A. & Thies, C. (2002) Characteristics of insect populations on habitat fragments: a mini review. Ecol. Res., 17, 229–239.
Tuomisto, H. (2010) A diversity of beta diversities: straightening up a concept gone awry. Part 1. Defining beta diversity as a function of alpha and gamma diversity. Ecography, 33, 2–22.
Turner, E.C., Abidin, Y.Z., Barlow, H., Tom, M., Nainar, A., Reynolds, G., Yusof, Y.B.I.N., Khoo, M.I.N.S. & Ewers, R.M. (2012) The Stability of Altered Forest Ecosystems Project: Investigating the Design of Human-Modified Landscapes for Productivity and Conservation. Plant., 88, 453–468.
Turner, E.C. & Foster, W.A. (2008) The impact of forest conversion to oil palm on arthropod abundance and biomass in Sabah, Malaysia. J. Trop. Ecol., 25, 23–30.
Turner, E.C., Snaddon, J.L., Fayle, T.M. & Foster, W.A. (2008) Oil palm research in context: identifying the need for biodiversity assessment. PLoS One, 3, e1572.
Turner, I. (1996) Species loss in fragments of tropical rain forest: a review of the evidence. J. Appl. Ecol., 33, 200–209.
Turner, W. (2014) Sensing biodiversity. Science, 346, 301–302. Tylianakis, J.M., Didham, R.K., Bascompte, J. & Wardle, D.A. (2008) Global change and species
interactions in terrestrial ecosystems. Ecol. Lett., 11, 1351–1363. Uezu, A., Beyer, D.D. & Metzger, J.P. (2008) Can agroforest woodlots work as stepping stones for
birds in the Atlantic forest region? Biodivers. Conserv., 17, 1907–1922. Uezu, A. & Metzger, J.P. (2011) Vanishing bird species in the Atlantic Forest: relative importance of
landscape configuration, forest structure and species characteristics. Biodivers. Conserv., 20, 3627–3643.
United Nations Population Division (2015) Population, consumption and the environment. Available from http://www.un.org/en/development/desa/population/publications/pdf/environment/PopulationConsumptionEnvironment2015.pdf.
Uryu, Y., Mott, C., Foead, N., Yulianto, K., Budiman, A., Setiabudi, Takakai, F., Nursamsu, Sunarto, Purastuti, E., Fadhli, N., Hutajulu, C.M.B., Jaenicke, J., Hatano, R., Siegert, F. & Stüwe, M. (2008) Deforestation, forest degradation, biodiversity loss and CO2 emissions in Riau, Sumatra, Indonesia. WWF-Indonesia.
Veech, J., Crist, T. & Summerville, K. (2003) Intraspecific aggregation decreases local species diversity of arthropods. Ecology, 84, 3376–3383.
Veech, J.A. (2005) Analyzing patterns of species diversity as departures from random expectations. Oikos, 108, 149–155.
Veech, J.A. (2006) A probability-based analysis of temporal and spatial co-occurrence in grassland birds. J. Biogeogr., 33, 2145–2153.

Bibliography
232
Veech, J.A. (2013) A probabilistic model for analysing species co-occurrence. Glob. Ecol. Biogeogr., 22, 252–260.
Veech, J.A. & Crist, T.O. (2010a) Diversity partitioning without statistical independence of alpha and beta. Ecology, 91, 1964–1969.
Veech, J.A. & Crist, T.O. (2010b) Toward a unified view of diversity partitioning. Ecology, 91, 1988–1992.
Vellend, M. (2010) Conceptual synthesis in community ecology. Q. Rev. Biol., 85, 183–206. Vellend, M., Baeten, L., Myers-Smith, I.H., Elmendorf, S.C., Beauséjour, R., Brown, C.D., De
Frenne, P., Verheyen, K. & Wipf, S. (2013) Global meta-analysis reveals no net change in local-scale plant biodiversity over time. Proc. Natl. Acad. Sci. U. S. A., 110, 19456–19459.
Vié, J., Hilton-Taylor, C. & Stuart, S. (2009) Wildlife in a Changing World - An Analysis of the 2008 IUCN Red List of Threatened Species. IUCN, Gland, Switzerland.
Volkov, I., Banavar, J.R., Hubbell, S.P. & Maritan, A. (2009) Inferring species interactions in tropical forests. Proc. Natl. Acad. Sci. U. S. A., 106, 13854–13859.
Vos, C.C., Verboom, J., Opdam, P.F. & Ter Braak, C.J. (2001) Toward ecologically scaled landscape indices. Am. Nat., 157, 24–41.
Waltert, M., Mardiastuti, A. & Mühlenberg, M. (2004) Effects of land use on bird species richness in Sulawesi, Indonesia. Conserv. Biol., 18, 1339–1346.
Wanger, T.C., Iskandar, D.T., Motzke, I., Brook, B.W., Sodhi, N.S., Clough, Y. & Tscharntke, T. (2010) Effects of land-use change on community composition of tropical amphibians and reptiles in Sulawesi, Indonesia. Conserv. Biol., 24, 795–802.
Wardle, D.A. & Bardgett, R.D. (2004) Human-induced changes in large herbivorous mammal density: the consequences for decomposers. Front. Ecol. Environ., 2, 145–153.
Warren-Thomas, E., Dolman, P.M. & Edwards, D.P. (2015) Increasing demand for natural rubber necessitates a robust sustainability initiative to mitigate impacts on tropical biodiversity. Conserv. Lett., [in press].
Watling, J.I. & Donnelly, M.A. (2006) Fragments as islands: a synthesis of faunal responses to habitat patchiness. Conserv. Biol., 20, 1016–1025.
Wearn, O.R., Reuman, D.C. & Ewers, R.M. (2012) Extinction debt and windows of conservation opportunity in the Brazilian Amazon. Science, 337, 228–232.
Weiher, E., Freund, D., Bunton, T., Stefanski, A., Lee, T. & Bentivenga, S. (2011) Advances, challenges and a developing synthesis of ecological community assembly theory. Philos. Trans. R. Soc. Lond. B. Biol. Sci., 366, 2403–2413.
Wells, K. & Bagchi, R. (2005) Eat in or take away - seed predation and removal by rats (Muridae) during a fruiting event in a dipterocarp rainforest. Raffles Bull. Zool., 53, 281–286.
Wells, K., Corlett, R.T., Lakim, M.B., Kalko, E.K. V. & Pfeiffer, M. (2009) Seed consumption by small mammals from Borneo. J. Trop. Ecol., 25, 555–558.
Wells, K., Kalko, E.K.V., Lakim, M.B. & Pfeiffer, M. (2007) Effects of rain forest logging on species richness and assemblage composition of small mammals in Southeast Asia. J. Biogeogr., 34, 1087–1099.
Welsh, A.H., Lindenmayer, D.B. & Donnelly, C.F. (2013) Fitting and interpreting occupancy models. PLoS One, 8, e52015.
Wethered, R. & Lawes, M.J. (2003) Matrix effects on bird assemblages in fragmented Afromontane forests in South Africa. Biol. Conserv., 114, 327–340.
Whitmore, T.C. (1984) Tropical Rain Forests of the Far East, 2nd edition. Clarendon Press, Oxford, UK.

Bibliography
233
Whittaker, R.J., Willis, K.J. & Field, R. (2001) Scale and species richness: towards a general, hierarchical theory of species diversity. J. Biogeogr., 28, 453–470.
Wicke, B., Sikkema, R., Dornburg, V. & Faaij, A. (2011) Exploring land use changes and the role of palm oil production in Indonesia and Malaysia. Land use policy, 28, 193–206.
Wickham, H. (2010) The split-apply-combine strategy for data analysis. J. Stat. Softw., 40, 1–29. Wiens, J. (1989) Spatial scaling in ecology. Funct. Ecol., 3, 385–397. Wiens, J.J., Ackerly, D.D., Allen, A.P., Anacker, B.L., Buckley, L.B., Cornell, H. V, Damschen, E.I.,
Jonathan Davies, T., Grytnes, J.-A., Harrison, S.P., Hawkins, B. a, Holt, R.D., McCain, C.M. & Stephens, P.R. (2010) Niche conservatism as an emerging principle in ecology and conservation biology. Ecol. Lett., 13, 1310–1324.
Wilcove, D., Rothstein, D., Dubow, J., Phillips, A. & Losos, E. (1998) Quantifying threats to imperiled species in the United States. Bioscience, 48, 607–615.
Wilcove, D.S., Giam, X., Edwards, D.P., Fisher, B. & Koh, L.P. (2013) Navjot’s nightmare revisited: logging, agriculture, and biodiversity in Southeast Asia. Trends Ecol. Evol., 28, 531–540.
Wilcove, D.S. & Koh, L.P. (2010) Addressing the threats to biodiversity from oil-palm agriculture. Biodivers. Conserv., 19, 999–1007.
Wilkie, D., Shaw, E., Rotberg, F., Morelli, G. & Auzel, P. (2000) Roads, development, and conservation in the Congo basin. Conserv. Biol., 14, 1614–1622.
Williams, B.K., Nichols, J.D. & Conroy, M.J. (2002) Analysis and Management of Animal Populations: Modeling, Estimation, and Decision Making. Academic Press, San Diego.
Willott, S., Lim, D., Compton, S.G. & Sutton, S.L. (2000) Effects of selective logging on the butterflies of a Bornean rainforest. Conserv. Biol., 14, 1055–1065.
Willott, S.J. (1999) The effects of selective logging on the distribution of moths in a Bornean rainforest. Philos. Trans. R. Soc. Lond. B. Biol. Sci., 354, 1783–1790.
Wilson, C.C. & Wilson, W.L. (1975) The influence of selective logging on primates and some other animals in East Kalimantan. Folia Primatol., 23, 245–274.
Wilson, K.A., Meuaard, E., Drummond, S., Grantham, H.S., Boitani, L., Catullo, G., Christie, L., Dennis, R., Dutton, I., Falcucci, A., Maiorano, L., Possingham, H.P., Rondinini, C., Turner, W.R., Venter, O. & Watts, M. (2010) Conserving biodiversity in production landscapes. Ecol. Appl., 20, 1721–1732.
Wilson, W.L. & Johns, A.D. (1982) Diversity and abundance of selected animal species in undisturbed forest, selectively logged forest and plantations in East Kalimantan, Indonesia. Biol. Conserv., 24, 205–218.
Wilting, A., Cord, A., Hearn, A.J., Hesse, D., Mohamed, A., Traeholt, C., Cheyne, S.M., Sunarto, S., Mohd-Azlan, J., Ross, J., Shapiro, A.C., Sebastian, A., Dech, S., Breitenmoser, C., Sanderson, J., Duckworth, J.W. & Hofer, H. (2010a) Modelling the species distribution of flat-headed cats (Prionailurus planiceps), an endangered South-East Asian small felid. PLoS One, 5, e9612.
Wilting, A., Fischer, F., Abu Bakar, S. & Linsenmair, K.E. (2006) Clouded leopards, the secretive top-carnivore of South-East Asian rainforests: their distribution, status and conservation needs in Sabah, Malaysia. BMC Ecol., 6, 16.
Wilting, A., Mohamed, A., Ambu, L.N., Lagan, P., Mannan, S., Hofer, H. & Sollmann, R. (2012) Density of the Vulnerable Sunda clouded leopard Neofelis diardi in two commercial forest reserves in Sabah, Malaysian Borneo. Oryx, 46, 423–426.
Wilting, A. & Mohamed, A. bin (2010) Wildlife surveys in Segaliud Lokan Forest Reserve KTS Plantations - Final Report. Available from http://www.forest.sabah.gov.my/tangkulap/Pages/KTS_Final_report_ConCaSa.pdf.
Wilting, A., Samejima, H. & Mohamed, A. (2010b) Diversity of Bornean viverrids and other small

Bibliography
234
carnivores in Deramakot Forest Reserve, Sabah, Malaysia. Small Carniv. Conserv., 42, 10–13. Wintle, B., Kavanagh, R., McCarthy, M.A. & Burgman, M.A. (2005) Estimating and dealing with
detectability in occupancy surveys for forest owls and arboreal marsupials. J. Wildl. Manage., 69, 905–917.
With, K.A. (1994) Using fractal analysis to assess how species perceive landscape structure. Landsc. Ecol., 9, 25–36.
Wong, M. (1986) Trophic organization of understory birds in a Malaysian dipterocarp forest. Auk, 103, 100–116.
Wood, B. (1984) A long-term study of Rattus tiomanicus populations in an oil palm plantation in Johore, Malaysia: I. Study methods and population size without control. J. Appl. Ecol., 21, 445–464.
Wood, B. & Liau, S. (1984a) A long-term study of Rattus tiomanicus populations in an oil palm plantation in Johore, Malaysia: II. Recovery from control and economic aspects. J. Appl. Ecol., 21, 465–472.
Wood, B. & Liau, S. (1984b) A long-term study of Rattus tiomanicus populations in an oil palm plantation in Johore, Malaysia: III. Bionomics and natural regulation. J. Appl. Ecol., 21, 473–495.
Wood, B.J. & Chung, G.F. (2003) A critical review of the development of rat control in Malaysian agriculture since the 1960s. Crop Prot., 22, 445–461.
Woodcock, P., Edwards, D.P., Fayle, T.M., Newton, R.J., Khen, C.V., Bottrell, S.H. & Hamer, K.C. (2011) The conservation value of South East Asia’s highly degraded forests: evidence from leaf-litter ants. Philos. Trans. R. Soc. Lond. B. Biol. Sci., 366, 3256–3264.
Woodruff, D.S. (2010) Biogeography and conservation in Southeast Asia: how 2.7 million years of repeated environmental fluctuations affect today’s patterns and the future of the remaining refugial-phase biodiversity. Biodivers. Conserv., 19, 919–941.
Wright, D., Patterson, B., Mikkelson, G., Cutler, A. & Atmar, W. (1997) A comparative analysis of nested subset patterns of species composition. Oecologia, 113, 1–20.
WWF (2012) Heart of Borneo: A Natural Priority for a Green Economy. Heart of Borneo Initiative, WWF Malaysia.
WWF-Malaysia (2009) High Conservation Value Forest (HCVF) toolkit for Malaysia: A national guide for identifying, managing and monitoring High Conservation Value Forests. Kuala Lumpur, Malaysia.
Wyatt-Smith, J. (1963) Manual of Malayan silviculture for inland forest. Malayan Forest Record 23, Forest Department, Kuala Lumpur, Malaysia.
Yamaura, Y., Andrew Royle, J., Kuboi, K., Tada, T., Ikeno, S. & Makino, S. (2011) Modelling community dynamics based on species-level abundance models from detection/nondetection data. J. Appl. Ecol., 48, 67–75.
Yoccoz, N., Nichols, J. & Boulinier, T. (2001) Monitoring of biological diversity in space and time. Trends Ecol. Evol., 16, 446–453.
Zanette, L., Doyle, P. & Trémont, S. (2000) Food shortage in small fragments: evidence from an area-sensitive passerine. Ecology, 81, 1654–1666.
Zurita, G.A. & Bellocq, M.I. (2010) Spatial patterns of bird community similarity: bird responses to landscape composition and configuration in the Atlantic forest. Landsc. Ecol., 25, 147–158.
Zvoleff, A. (2015) glcm: Calculate textures from grey-level co-occurrence matrices (GLCMs) in R. R package version 1.2. Available from http://cran.r-project.org/package=glcm

Appendices
235
Appendices
Appendix A – Species checklists for four study sites in south-east Sabah, Malaysia

Appendices
236
Table A1. Mammal species checklist for two protected areas (Maliau Basin and Brantian-Tatulit) and two unprotected areas (Kalabakan and oil palm plantations). Records were obtained from 2010 to 2015, using camera traps, live traps and direct sightings. Three levels of confidence were assigned to records: 3 (high confidence) = confirmed record, e.g. from a camera trap image; 2 (medium confidence) = possible record, i.e. unconfirmed but likely correct; 1 (low confidence) = unconfirmed record with limited evidence. Note, no live-trapping was done in the Brantian-Tatulit Virgin Jungle Reserve. Order Family Species Common name IUCN
statusa Maliau Basin
Conservation Areab Brantian-Tatulit
Virgin Jungle Reserve SAFE Project experimental area
(Kalabakan Forest Reserve) Oil palm
plantationsc Pholidota Manidae Manis javanica Sunda pangolin EN 3 3 3 3 Eulipotyphla Erinaceidae Echinosorex gymnura Moon rat LC 3 3 3 1 Soricidae Crocidura monticola Sunda shrew LC 1 Scandentia Ptilocercidae Ptilocercus lowii Pen-tailed treeshrew,
Feather-tailed treeshrew LC 3
Tupaiidae Tupaia minor Lesser treeshrew LC 2 3 Tupaia gracilis Slender treeshrew LC 2 3 3 Tupaia longipes Plain treeshrew,
Long-footed treeshrew LC 3 3 3 3
Tupaia tana Large treeshrew LC 3 3 3 3 Tupaia picta Painted treeshrew LC 1 Tupaia dorsalis Striped treeshrew DD 3 3 Dermoptera Cynocephalidae Galeopterus variegatus Colugo, Flying lemur LC 3 3 3 Primates Lorisidae Nycticebus menagensis Bornean slow loris VU 3 3 3 Tarsiidae Cephalopachus bancanus Western tarsier VU 3 3 3 Cercopithecidae Presbytis rubicunda Maroon langur,
Red leaf monkey LC 3 3 3
Presbytis hosei Hose's langur, Grey leaf monkey
VU 3 3 2
Trachypithecus cristatus Silvered langur, Silvery lutung
NT 1
Nasalis larvatus Proboscis monkey EN 1 Macaca fascicularis Long-tailed macaque,
Crab-eating macaque LC 3 3 3 3
Macaca nemestrina Southern pig-tailed macaque VU 3 3 3 3 Hylobatidae Hylobates muelleri Bornean gibbon EN 3 3 3 Pongidae Pongo pygmaeus Orangutan EN 1 3 3 Carnivora Canidae Canis familiaris Domestic dog LC 3 3 3 Ursidae Helarctos malayanus Sun bear VU 3 3 3 3* Mustelidae Martes flavigula Yellow-throated marten LC 3 3 3 3 Mustela nudipes Malay weasel LC 3 3 Mydaus javanensis Sunda stink badger, Malay
badger, Teledu LC 3 3 3
Aonyx cinereus Oriental small-clawed otter VU 3 3 3 Lutrogale perspicillata Smooth otter,
Smooth-coated otter VU 1
Viverridae Viverra tangalunga Malay civet LC 3 3 3 3

Appendices
237
Prionodon linsang Banded linsang LC 3 3 Paradoxurus hermaphroditus Common palm civet LC 3 2 3 3 Paguma larvata Masked palm civet LC 3 3 3 3 Arctictis binturong Binturong, Bear cat VU 3 3 3 Arctogalidia trivirgata Small-toothed palm civet LC 3 3 3 Hemigalus derbyanus Banded civet VU 3 3 3 3 Diplogale hosei Hose's civet VU 3 Herpestidae Herpestes brachyurus Short-tailed mongoose LC 3 3 3 3 Herpestes semitorquatus Collared mongoose DD 3 3 3 3 Felidae Neofelis diardi Sunda clouded leopard VU 3 3 3 Pardofelis marmorata Marbled cat VU 3 3 3 Pardofelis badia Bay cat EN 3 3 Prionailurus planiceps Flat-headed cat EN 3 Prionailurus bengalensis Leopard cat LC 3 3 3 3 Proboscidea Elephantidae Elephas maximus Asian elephant EN 3 3 Cetartiodactyla Suidae Sus barbatus Bearded pig VU 3 3 3 3 Tragulidae Tragulus napu Greater mouse-deer LC 3 3 3 Tragulus kanchil Lesser mouse-deer LC 3 3 3 Cervidae Muntiacus muntjak Red muntjac,
Common barking deer LC 3 3 3 3
Muntiacus atherodes Bornean yellow muntjac LC 3 3 3 Rusa unicolor Sambar deer VU 3 3 3 3 Bovidae Bos javanicus Banteng, Tembedau EN 3 3 Rodentia Sciuridae Lariscus hosei Four-striped ground squirrel NT 3 3 3 Callosciurus prevostii Prevost's squirrel LC 3 3 3 3 Callosciurus notatus Plantain squirrel LC 3 3 3 Callosciurus adamsi Ear-spot squirrel VU 3 Exilisciurus exilis Least pygmy squirrel DD 3 3 Sundasciurus lowi Low's squirrel LC 3 3 3 3 Sundasciurus tenuis Slender squirrel LC 3 Sundasciurus brookei Brooke's squirrel LC 3 Sundasciurus hippurus Horse-tailed squirrel NT 3 3 Ratufa affinis Giant squirrel NT 3 3 3 Rheithrosciurus macrotis Tufted ground squirrel VU 3 3 Petaurista petaurista Red giant flying squirrel LC 3 3 3 Aeromys thomasi Thomas's flying squirrel DD 3 3 3 Aeromys tephromelas Black flying squirrel DD 3 Petaurillus hosei/emiliae Pygmy flying squirrel DD 3 Muridae Rattus exulans Polynesian rat LC 3 3 Rattus rattus (=tanezumi) Black rat, House rat LC 3 3 Rattus tiomanicus Malaysian field rat LC 1 1 Sundamys muelleri Muller's rat LC 3 3 3*

Appendices
238
Maxomys surifer Red spiny rat LC 3 3 3 3* Maxomys rajah Brown spiny rat VU 3 3 3 3 Niviventer cremoriventer Dark-tailed tree rat VU 3 3 3 Maxomys whiteheadi Whitehead's rat VU 3 3 3 Maxomys baeodon Small spiny rat DD 3 Leopoldamys sabanus Long-tailed giant rat LC 3 3 3 3 Maxomys ochraceiventer Chestnut-bellied spiny rat DD 3 3 Haeromys
margarettae/pusillus Ranee mouse / Lesser ranee mouse
DD/VU 3
Hystricidae Hystrix brachyura Malay porcupine, Common porcupine
LC 3 3 3 3
Trichys fasciculata Long-tailed porcupine LC 3 3 3 Hystrix crassispinis Thick-spined porcupine LC 3 3 aThreat categories follow the IUCN Red List categories and criteria version 3.1: CR = critically endangered; EN = endangered; VU = vulnerable; NT = near threatened; LC = least concern, DD = data deficient. bRecords from the Maliau Basin Conservation Area do not include records from the logged-over buffer zone, which is known, for example, to harbour Asian elephant, banteng, Sunda clouded leopard, bay cat and flat-headed cat (O. R. Wearn, unpublished data). cSelengan Batu and Mawang oil palm estates within the SAFE landscape, managed by Benta Wawasan Sdn Bhd and Sabah Softwoods Sdn Bhd, respectively. Asterisks indicate records from scrub habitat at the oil palm plantation margins and not inside the oil palm crop itself.

Appendices
239
Table A2. Bird and reptile species checklist for two protected areas (Maliau Basin and Brantian-Tatulit) and two unprotected areas (Kalabakan, and the Mawang and Selangan Batu oil palm plantations). Records were obtained using camera traps (except where indicated), from 2010 to 2014.
Class Order Family Species Common name IUCN statusa
Maliau Basin Conservation Area
Kalabakan Forest Reserve
Brantian-Tatulit Virgin Jungle Reserve
Oil palm plantations
Reptilia Squamata Pythonidae Python reticulatus Reticulated pyton NE
Varanidae Varanus rudicollis Roughneck monitor NE
Varanus salvator Water monitor LC
Testudines Testudinae Manouria emys Asian brown tortoise EN b b
Aves Accipitriformes Accipitridae Nisaetus nanus Wallace's hawk-eagle VU
Spilornis cheela Crested serpent eagle LC
Columbiformes Columbidae Chalcophaps indica Emerald dove LC
Spilopelia chinensis Spotted dove LC
Cuculiformes Cuculidae Carpococcyx radiceus Bornean ground-cuckoo NT
Centropus sinensis Greater coucal LC
Galliformes Phasianidae Arborophila charltonii Chestnut-necklaced hill partridge VU
Argusianus argus Great argus NT
Coturnix chinensis Blue-breasted quail LC
Gallus gallus Red junglefowl LC
Lophura bulweri Bulwer's pheasant VU
Lophura ignita Crested fireback NT
Rollulus rouloul Crested partridge NT
Gruiformes Rallidae Amaurornis phoenicurus White-breasted waterhen LC
Rallina fasciata Red-legged crake LC
Passeriformes Estrildidae Lonchura atricapilla Chestnut munia LC
Muscicapidae Copsychus saularis Oriental magpie-robin LC
Copsychus stricklandii White-crowned shama NE
Nectariniidae Arachnothera longirostra Little spiderhunter LC
Pellorneidae Malacocincla malaccensis Short-tailed babbler NT
Malacopteron magnirostre Moustached babbler LC
Pellorneum capistratum Black-capped babbler LC
Ptilocichla leucogrammica Bornean ground-babbler VU
Pittidae Erythropitta arquata Blue-banded pitta LC c
Erythropitta ussheri Black-and-crimson pitta NT
Hydrornis baudii Blue-headed pitta VU
Hydrornis caeruleus Giant pitta NT
Hydrornis schwaneri Bornean banded pitta LC
Pitta sordida Hooded pitta LC
Pycnonotidae Pycnonotus goiavier Yellow-vented bulbul LC
Pelecaniformes Ardeidae Ardea alba Great egret LC
aLC = Least Concern, NT = Near Threatened, VU = Vulnerable, EN = Endangered, DD = Data Deficient, NE = Not Evaluated. bDirectly observed, not trapped. cRecord derived from live-trapping, not camera-trapping.

Appendices
240
Appendix B – Supplementary figures of sampling effort over time
Figure B1. Number of camera trap nights sampled in each of 46 sampling plots (after correcting for camera failure) across the four years of the study.

Appendices
241
Figure B2. Number of live trap nights of sampling in each of 31 plots, across the four years of the study.

Appendices
242
Appendix C – Example camera trap images of Bornean mammal and bird species
Plate C1. Marbled cat Pardofelis badia (image taken in the Maliau Basin Conservation Area).
Plate C2. Moon rat Echinosorex gymnura (image taken in the Maliau Basin Conservation Area).

Appendices
243
Plate C3. Sunda pangolin Manis javanica (image taken in the Maliau Basin Conservation Area). Although in decline globally due to hunting, this species was found in all land-use types.
Plate C4. Tufted ground squirrel Rheithrosciurus macrotis (image taken in the Maliau Basin Conservation Area). The function of the bushy tail is unknown, but may be used to distract predators.

Appendices
244
Plate C5. Bearded pig Sus barbatus (image taken in the Maliau Basin Conservation Area).
Plate C6. Banded civet Hemigalus derbyanus (image taken in the Maliau Basin Conservation Area). This species is usually solitary, but this image shows a chance encounter between conspecifics.

Appendices
245
Plate C7. Sunda clouded leopard Neofelis diardi (image taken in the Brantian-Tatulit Virgin Jungle Reserve). In areas with a denser understorey than in this image, males preferred to move along roads.
Plate C8. Bornean orangutan Pongo pygmaeus (image taken in the Kalabakan Forest Reserve). Orangutans were often seen, heard, or detected by their nests in the Kalabakan Forest Reserve.

Appendices
246
Plate C9. Southern pig-tailed macaque Macaca nemestrina (image taken in the Kalabakan Forest Reserve). This adaptable species was found to occur in old-growth and logged habitats alike.
Plate C10. Collared mongoose Herpestes semitorquatus (image taken in the Kalabakan Forest Reserve). This species was primarily found near streams and rivers, as in this image.

Appendices
247
Plate C11. Malay civet Viverra tangalunga (image taken in the Kalabakan Forest Reserve). This image is an unusual capture of this nocturnal civet during daylight hours.
Plate C12. Bay cat Pardofelis badia (image taken in the Kalabakan Forest Reserve). Few records of this Bornean endemic exist, but the Kalabakan Forest Reserve may be one its last strongholds.

Appendices
248
Plate C13. Banteng Bos javanicus (image taken in the Kalabakan Forest Reserve). Only a handful of banteng herds were recorded, and in all cases we found evidence of hunters operating in the vicinity.
Plate C14. Leopard cat Prionailurus bengalensis (image taken in the Selangan Batu oil palm plantation estate). This species was found to be more abundant in oil palm than in forest habitats.

Appendices
249
Plate C15. Striped treeshrew Tupaia dorsalis (image taken in the Maliau Basin Conservation Area). This species, which had not been recorded in Sabah for 25 years, was detected in two new study sites.
Plate C16. Bulwer’s pheasant Lophura bulweri (image taken in the Kalabakan Forest Reserve). A new population of this rare and threatened Bornean endemic was discovered during this study.