mammalian communities as indicators of disturbance across
37
MAMMALIAN COMMUNITIES AS INDICATORS OF DISTURBANCE ACROSS 1 INDONESIAN BORNEO 2 Susan M. Cheyne 1,2 , Wiwit Juwita Sastramidjaja 1 , Muhalir 1 , Yaya Rayadin 3 , and David W. 3 Macdonald 2 4 1 Present Address: Borneo Nature Foundation, Jalan Semeru No. 91, Bukit Hindu, Palangka 5 Raya, Indonesia. 6 2 Wildlife Conservation Research Unit (WildCRU), Department of Zoology, Oxford 7 University, The Recanati-Kaplan Centre, Tubney House, Abingdon Road, Tubney, OX13 8 5QL, UK. 9 3 Forestry Department, Mulawarman University, Kampus Gunung Jl. KH. Dewantara, Samarinda 10 75116, East Kalimantan, Indonesia 11 12 Corresponding Author Email: [email protected] 13 Key words: guild, disturbance, monitoring, felid, tropical, mammal 14 15 Abstract 16 Using camera traps at eight grids across Indonesian Borneo we show how mammalian 17 species assemblages can provide reliable information about how disturbance affects a forest. 18 This enables us to use the large mammal community structure at each site to assess the 19 impacts of human disturbance and habitat variables. Occupancy ranged from 0.01-0.77 with 20 pig-tailed macaques, muntjac, orang-utans, sun bears, bearded pigs and common porcupines 21 consistently having an occupancy of > 0.5. These large mammals were generally making use 22 of the whole forest surveyed and avoided the forest edge in only a few grids. A General 23 Linear Model with general contrasts and survey effort as a covariate was performed to assess 24 the impact of different variables. Logging and hunting were positively associated with low 25 species number (F = 6.3, p = 0.012 and F = 5.4, p = 0.003 respectively). Logging and hunting 26 contributed to a low % of carnivorous species (F = 1.5, p = 0.021 and F = 4.8, p = 0.041 27 respectively) and a higher % of IUCN Endangered and Vulnerable species (F = 5.9, p = 0.044 28 and F = 5.0, p = 0.044 respectively). The presence of burnt areas within the study grids was 29 positively associated with reduced species numbers (F = 5.3, p = 0.018) and reducted % of 30 carnivorous species (F = 6.8, p = 0.023) but not the % of IUCN Endangered and Vulnerable 31 species. This is likely a result of burnt areas reducing the area of suitable habitat for many 32 mammals. The proximity of the grids to roads, villages, rivers and presence of logging camps 33 have been proposed as suitable parameters to indicate disturbance. In our study none of these 34 1
-
Upload
khangminh22 -
Category
Documents
-
view
2 -
download
0
Transcript of mammalian communities as indicators of disturbance across

MAMMALIAN COMMUNITIES AS INDICATORS OF DISTURBANCE ACROSS 1
INDONESIAN BORNEO 2
Susan M. Cheyne1,2, Wiwit Juwita Sastramidjaja1, Muhalir1, Yaya Rayadin3, and David W. 3
Macdonald2 4 1 Present Address: Borneo Nature Foundation, Jalan Semeru No. 91, Bukit Hindu, Palangka 5
Raya, Indonesia. 6 2 Wildlife Conservation Research Unit (WildCRU), Department of Zoology, Oxford 7
University, The Recanati-Kaplan Centre, Tubney House, Abingdon Road, Tubney, OX13 8
5QL, UK. 9 3 Forestry Department, Mulawarman University, Kampus Gunung Jl. KH. Dewantara, Samarinda 10
75116, East Kalimantan, Indonesia 11
12
Corresponding Author Email: [email protected] 13
Key words: guild, disturbance, monitoring, felid, tropical, mammal 14
15
Abstract 16
Using camera traps at eight grids across Indonesian Borneo we show how mammalian 17
species assemblages can provide reliable information about how disturbance affects a forest. 18
This enables us to use the large mammal community structure at each site to assess the 19
impacts of human disturbance and habitat variables. Occupancy ranged from 0.01-0.77 with 20
pig-tailed macaques, muntjac, orang-utans, sun bears, bearded pigs and common porcupines 21
consistently having an occupancy of > 0.5. These large mammals were generally making use 22
of the whole forest surveyed and avoided the forest edge in only a few grids. A General 23
Linear Model with general contrasts and survey effort as a covariate was performed to assess 24
the impact of different variables. Logging and hunting were positively associated with low 25
species number (F = 6.3, p = 0.012 and F = 5.4, p = 0.003 respectively). Logging and hunting 26
contributed to a low % of carnivorous species (F = 1.5, p = 0.021 and F = 4.8, p = 0.041 27
respectively) and a higher % of IUCN Endangered and Vulnerable species (F = 5.9, p = 0.044 28
and F = 5.0, p = 0.044 respectively). The presence of burnt areas within the study grids was 29
positively associated with reduced species numbers (F = 5.3, p = 0.018) and reducted % of 30
carnivorous species (F = 6.8, p = 0.023) but not the % of IUCN Endangered and Vulnerable 31
species. This is likely a result of burnt areas reducing the area of suitable habitat for many 32
mammals. The proximity of the grids to roads, villages, rivers and presence of logging camps 33
have been proposed as suitable parameters to indicate disturbance. In our study none of these 34
1

parameters significantly affected the total species numbers, % of carnivores, and % of IUCN 35
concern (Endangered and Vulnerable), nor did the protected status of the forest. We have 36
identified 4 species as specific indicators whose presence or absence can help determine the 37
type and/or extent of forest disturbance and/or be a proxy indicator for the presence of other 38
species. Leopard cat (Prionailurus bengalensis) and pig-tailed macaques (Macaca nemestrina, 39
generalists); sambar deer (Rusa unicolor, large, wide-ranging herbivores) and clouded leopards 40
(Neofelis diardi) as a proxy for at least 2 of the smaller felid species. 41
Introduction 42
Logging continues at a rapid rate in many tropical forests and has mixed effects on forest 43
animal diversity [van Niewstadt et al., 2001; Wells et al., 2004; Meijaard et al., 2005; 44
Wilcove et al., 2013]. The effects of logging also change over time. Species composition in 45
logged forests approaches that of unlogged forests just a few decades after logging has ceased 46
[Danielsen & Heegaard, 1994; Slik et al., 2002; Brodie et al., 2014]. Selectively logged 47
forests are becoming an increasingly dominant component of many tropical landscapes and 48
yet, the conservation value of selectively logged tropical forests is less understood 49
[Burivalova et al., 2014] than those of more dramatic land cover changes, such as 50
deforestation driven by agriculture or tree-plantation developments [Estrada & 51
CoatesEstrada, 1996; Meittinen et al., 2012]. 52
53
Hunting occurs over even larger areas in the tropics than logging, and often, though not 54
always, accompanies logging [Waltert et al., 2002; Brodie et al., 2014]. It is also important to 55
determine whether impacts of logging and hunting are correlated across species. Certain taxa, 56
particularly large herbivores, may be vulnerable to extirpation due to both logging and 57
hunting (leading to a positive correlation between the impacts of logging and hunting) or 58
susceptible to either hunting or logging but not the other (no correlation) [Ripple et al., 2015]. 59
60
Sundaland, encompassing the Malay Peninsula, as well as the islands of Borneo, Java, and 61
Sumatra, contains one of the richest concentrations of biodiversity on earth, and preserving it 62
is a priority for global biodiversity conservation [Myers et al., 2000]. The island of Borneo 63
covers less than 0.2% of the earth’s land surface (743,330 km2), yet is home to 4% of the 64
world’s plant species and 5% of birds and mammals [MacKinnon et al., 1996b] including up 65
to 15,000 species of flowering plants (as many as the whole African continent), 3,000 species 66
of trees, 222 species of mammals and 420 species of resident birds [MacKinnon et al., 67
2

1996b]. It is also home to 13 non-human primate species, eight of which are endemic 68
[Groves, 2001; Brandon-Jones et al., 2004]. 69
70
Borneo’s biodiversity is under threat from increasing anthropogenic disturbances such as 71
mining and logging, land conversion for monocultures such as oil palm plantations and 72
forest fires [Aldhous, 2004; Fuller et al., 2004]. In addition, indirect destruction is caused by 73
the infrastructure created to access mines/plantations etc. such as roads and settlements and 74
pollution from agricultural and extractive industry as well as artisanal mining. The impact of 75
hunting animals for meat and/or as a response to human-wildlife conflict is poorly 76
documented and understood [e.g. Voss et al., 2001; Matthews, 2006; Peres & Palacios, 2007; 77
Ancrenaz et al., 2013, 2015; Brodie et al., 2014; Gaveau et al., 2014]. Hunting of wildlife is 78
perceived to be widespread across Kalimantan (e.g. [Meijaard, 2001; Struebig et al., 2007; 79
Harrison et al., 2011; Cheyne et al., 2013]. We used questionnaires to complement the 80
camera trap surveys and provide insight into attitudes to conservation and wildlife and 81
potential impact of hunting (direct or indirect) on Sunda clouded leopards (Neofelis diardi) 82
and other species. We sought to gain a better understanding of villagers’ dependency on 83
natural resources, impact on biodiversity and the identification of environmental changes as 84
perceived by locals who might indicate possible threats to nature and communities. We 85
present a single approach method using camera traps at grids with very varied management, 86
protected status, habitat, accessibility and levels of human disturbance. We recognise that no 87
single method is likely to be ideal for all purposes, or even suitable for use in all forests 88
[Harrison et al., 2012a]). Instead, we chose the best and most consistent method, camera 89
trapping, to 1) make use of all the data, 2) remove the reliance on one or two elusive species 90
[Dufrêne & Legendre, 1997; Carignan & Villard, 2001] and 3) provide reference/baseline 91
data. 92
93
Borneo is currently losing more than 500,000 ha of forest each year; one of the highest rates 94
of forest loss in the world [Gaveau et al., 2009, 2014]. The habitats most threatened by forest 95
loss are the more accessible lowland areas, where species richness is greatest [MacKinnon et 96
al., 1996a]. This threatens even the best known of Borneo’s wildlife; for example, of the 97
Bornean orang-utan population at the beginning of the twentieth century, no more than 7% 98
survive today [Rijksen et al., 1999]. The continuing rapid expansion of oil-palm plantations is 99
a particularly severe threat to all wildlife [Marshall et al., 2006; Fitzherbert et al., 2008; Wich 100
et al., 2008]. 101
3

102
Our objectives are 1) to assess the impact of forest type on the spatial distribution of 103
mammals within and between grids, 2) to assess the impact of habitat on felid presence, 104
species numbers and presence of threatened species, 3) to assess the impact of human 105
disturbance on felid presence, species numbers and presence of threatened species and 4) to 106
test the opportunity of using mammal communities to diagnose disturbance at a site and 107
landscape level. The primary focus of the camera trapping was to obtain density estimates of 108
clouded leopards; thus the cameras were placed in order to maximise clouded leopard 109
detection. As a result, it is important to discuss in detail the felid data. 110
Study Grids 111
In Murung Raya and Mungku Baru, the grids were considerably smaller due to access and 112
time limitations (Table 2). The study sites differ in habitat type, altitude, size and human 113
pressures which also impacted the size of the camera grid. 114
4

Table 2 Summary of habitat and climactic characteristics of each study area. Min and Max a.s.l. refer to placement of cameras not the overall 115 altitude of the study area. 116 Grid Habitat Central
latitude Central Longitude
Total Size of forest block/landscape (km2)
Average rainfall (mm/year)
Temperature range ºC
Min a.s.l
Mean a.s.l
Max a.s.l
References
Bawan Lowland Dipterocarp/ Ombrogenous Peat-swamp Forest (PSF) mosaic
9821636 499986 546 2500 12-35 35 72 93 [Harrison et al., 2012b; Wanelik et al., 2013]
Belantikan Lowland Montane/Lowland Dipterocarp (LM/LD)
9834006 536542 5000 2500 12-35 19 72 109 [Sapari et al., 2005]
Kutai Lowland Dipterocarp (LD)
5457920 570690 2000 2500 12-35 41 152 246 [Rodman, 1977]
Lesan Lowland Montane 1774120 527897 110 2500 12-35 64 212 344 [The Nature Conservancy, 2011]
Mungku Baru
Lowland Dipterocarp 9724212 814268 160 2500 12-35 30 60 80 [Harrison et al., 2010]
Murung Raya
Lowland Montane. Pristine and remote
237886 27717 500 4000 24-35 80 150 231 [McConkey & Chivers, 2004; Cheyne et al., 2012]
Sabangau Ombrogenous PSF 9739536 820452 5700 3000 12-35 12 29 30 [Morrogh-Bernard et al., 2003; Cheyne, 2010]
Sungai Wain Lowland Dipterocarp/Alluvial PSF
9877564 480908 100 3000 12-35 35 69 86 [Rustam et al., 2012; Stark et al., 2012; Bersacola et al., 2014; Gilhooly et al., 2015]
117
118
119
120
121
5

Sampling grids were selected to span gradients in habitat type, logging pressure, protected 122
status, and human pressure, while maintaining spacing between cameras of at least 1 km. No 123
systematic camera trap work had been carried out at any of the grids prior to this study. The 124
eight grids representing a range of habitat types, protected area status, accessibility to 125
humans, length of selective logging influence and perceived impact of hunting (Table 3). For 126
ease of analysis the habitats were combined into four categories: Peat-swamp Forest (PSF), 127
Lowland Dipterocarp/PSF, Lowland Dipterocarp and Lowland Montane. 128
6
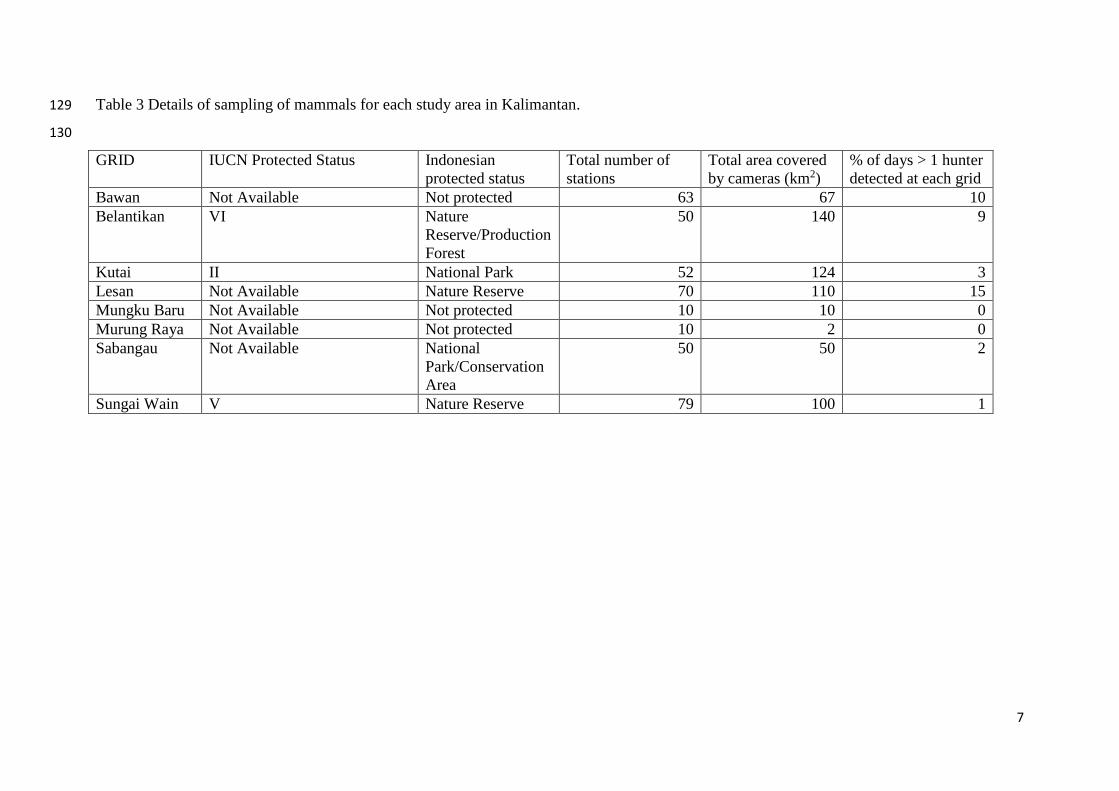
Table 3 Details of sampling of mammals for each study area in Kalimantan. 129
130
GRID IUCN Protected Status Indonesian protected status
Total number of stations
Total area covered by cameras (km2)
% of days > 1 hunter detected at each grid
Bawan Not Available Not protected 63 67 10 Belantikan VI Nature
Reserve/Production Forest
50 140 9
Kutai II National Park 52 124 3 Lesan Not Available Nature Reserve 70 110 15 Mungku Baru Not Available Not protected 10 10 0 Murung Raya Not Available Not protected 10 2 0 Sabangau Not Available National
Park/Conservation Area
50 50 2
Sungai Wain V Nature Reserve 79 100 1
7

All study grids were in Central or East Kalimantan (Figure 1). 131
132
Figure 1 Locations of the study grids. From west to east: White circle – Belantikan; Arrow – 133
Mungku Baru; Cross circle – Sabangau; Diamond – Bawan; Square – Murung Raya; Star – 134
Sungai Wain Circle; Triangle – Kutai National Park; Lesan – Black circle. 135
136
Unlogged areas were sampled in all study grids. Four grids had forest which was logged >20 137
years ago. Due to the size of area surveyed, all grids crossed several habitat types and all 138
were affected by some level of disturbance. Burnt refers to areas where vegetation has been 139
cleared by fire in the last ≤ 15 years and is recovering (Figure 2). 140
141
8

142
Figure 2 Map of the study region in Indonesian Borneo showing for each study grid the 143
proportion of camera stations in logged (light grey), burnt (mid-grey), undisturbed (dark 144
grey) and plantation (black) forest. The elevation model is from Google Earth. White shading 145
indicates high elevation; dark grey shading indicates low elevation. See Supplementary 146
Information for a map detailing exact study grid location. 147
148
Methods 149
Camera Trapping 150
Cuddeback Capture IR® (Cuddeback Digital, Non-Typical) camera traps were placed along 151
established trails and, where possible, watering areas, located so as to maximise the success 152
9

rate of photographic ‘detections’ [Wilting et al., 2006; Gordon & Stewart, 2007; Cheyne et 153
al., 2013]. Two cameras were placed opposite each other, 7 to 10 m apart to create a paired 154
station at each location with the aim of photographing each flank of the animal 155
simultaneously. In Murung Raya and Mungku Baru only one camera was placed at each 156
location. The passive infrared sensors were set at about 50 cm height. The Captures use an 157
infrared flash. There are some logging roads in some of the study areas, all cameras were 158
placed along established trails at cross-roads and near fallen logs or man-made boardwalks, 159
which may facilitate felid movements during the flooded wet season (further information in 160
[Cheyne et al., 2013]). As the focus of the overall study was on detection of clouded leopards 161
and the smaller felids, and the cameras were only placed on the ground, we only include 162
mammal species in this analysis as the detection of birds was too infrequent to provide a 163
suitable sample size. 164
165
The grids were surveyed consecutively except for Sabangau which was surveyed 166
concurrently with the Kutai and Lesan grids (Table 1). 167
168
Table 1 Survey dates for each grid (in date order). 169
Grid Date Start Date end Total
days
Total number
of cameras
stations (*
indicates
cameras were
in pairs)
Trap
nights
(number
of active
survey
nights
Bawan 09/09/2012 26/11/2012 78 63* 4146
Belantikan 23/02/2014 17/06/2014 114 50* 4583
Kutai 12/12/2012 23/03/2013 101 48* 3269
Lesan 15/07/2013 26/01/2014 195 70* 5548
Mungku Baru 02/02/2010 19/03/2010 45 10 200
Murung Raya 15/07/2011 20/09/2011 40 10 558
Sabangau # 01/03/2013 02/09/2013 185 30* 5487
Sungai Wain 17/05/2012 08/08/2012 83 79* 4729 # Cameras have been in place in Sabangau since May 2008 but for the purposes of 170
comparison only data from a 6-month period were used. 171
10

172
Cameras were ideally set in a grid system with ±1km between camera stations (Figure 3). 173
This layout was not possible in Bawan due to the disturbed nature of the forest and issues of 174
water accessibility when setting the cameras thus the cameras were placed along established 175
trails (Figure 4). Non-random deployment of camera traps may interact with non-random 176
space-use by animals, causing biases in our inferences about relative abundance from 177
detection frequencies alone [Wearn et al., 2013]. This limitation was alleviated in the present 178
study by surveying a large number of locations (>60), surveying all available habitats types 179
and sub-types and having the camera traps active for a suitable period of time (90-160 days). 180
181
182
Figure 3 Example of the standard camera trap grid system along in Lesan. 183
184
185
Figure 4 The grid layout in Bawan. 186
11

187
Anthropogenic disturbance 188
We interviewed people living around the forest areas using questionnaires to determine if 189
attitudes to hunting were reflected in evidence from the camera trap data. Questionnaire-190
based surveys were carried out to investigate the extent of direct removal of wildlife. All 191
interviews/discussions took place at the same time the camera traps were in the area thus 192
reflecting attitudes at the time of data collection (Table 4). 193
194
Table 4 Summary of respondents to questionnaires. 195
Location Dates of interviews
Number of respondents
Age range
% of total population
% of male respondents
% of female respondents
Bawan July-September
2012
77 28-70 4.9 75 25
Belantikan January-March
2013
20 21-45 0.5 100 0
Kutai August – October
2012
103 16-63 1.2 60 40
Lesan NA NA NA NA NA NA Mungku Baru*
March – April 2011
20 18-57 0.9 80 20
Murung Raya*
July-September
2011
53 16-68 5.0 31 22
Sabangau* April-May 2013
68 28-70 1.3 65 35
Sungai Wain May-June 2012
12 24-40 0.5 100 0
* Data for Mungku Baru, Murung Raya and Sabangau are from [Harrison et al., 2010; Cheyne et al., 2012, 2013] respectively.
196
The research samples were derived using non-probability quota sampling [Kerlinger, 1986]. 197
The method was chosen to obtain an equally distributed sample over five different categories 198
which were divided by age class (20−39 years, >40 years) and gender, and one category was 199
for local ‘governmental employees’ such as the village head. Age classes were established 200
after consulting with several community members how the age-line (i.e. at what point people 201
are considered ‘young adult’, ‘middle-aged’ or ‘elderly’) was defined within the villages, and 202
the ‘young adult (20-30 years)’ and ‘middle-aged (30-45years)’ classes were combined due to 203
12

a small sample size. Questionnaires represented individual opinions and were adapted to local 204
conditions by using information gained from informal and semi-structured interviews. Before 205
starting the sampling process in the villages, successive refinements of the questionnaire were 206
tested three times on students to identify any questions which could bias the responses. To 207
avoid bias, respondents were selected to come from different households, i.e. although some 208
members of the same extended family were interviewed, they represented independent 209
economic households. Furthermore, different households were selected to cover a wide range 210
of different social levels. The questionnaires contained open as well as closed questions. For 211
some issues, the contingent ranking method [Chambers, 1994] was applied (e.g. to determine 212
the relative importance of different forest resources for peoples’ livelihoods). Thus, each 213
respondent was asked, for example, to choose the five most important aspects for their 214
personal life. Afterwards the aspects were written on small cards and the respondent was 215
asked to arrange them in ascending order of importance. Respondents were asked about all 216
hunting activities to determine their impact on the natural community of which clouded 217
leopards and their prey were part. Respondents were asked to rate their perception of 218
availability of animals hunted by humans over a period of 10 years to account for possible 219
depletion of prey in any given area. All data were collected by Indonesian researchers 220
without foreign presence. Previous studies on which the questionnaire was based [Struebig et 221
al., 2007; Harrison et al., 2011; Cheyne et al., 2013] found a good correlation between levels 222
of hunting being reported anecdotally by people and numbers of flying foxes in markets and 223
hunting pressure on clouded leopards in Sabangau; thus we have no reason to suspect that 224
answers were untruthful. 225
226
The variables likely to influence attitudes to conservation are listed in Appendix 3. We 227
selected respondents from different households and a wide range of different social levels. 228
All questionnaires were carried out in Indonesian. In order to preserve privacy no respondents 229
were photographed while answering questionnaires but the communities were all made aware 230
of the camera trap and questionnaire study at a series of meetings. Informal meetings were 231
held with all villages and village leaders to explain the project. It was made clear no personal 232
information would be used, no photos would be taken and these data were not going to lead 233
to any criminal prosecution. Each individual participant was asked for permission again prior 234
to participating in the questionnaire in case they had not attended the initial socialising 235
meeting. Permissions were also sought from local authorities prior to carrying out the 236
questionnaires. In Sungai Wain the management of the Hutan Lindung Sungai Wain 237
13
(HLSW) refused us permission to carry out structured questionnaires but informal 238
discussions were held with local residents and rangers. In Lesan there were no villages 239
surrounding the forest area. 240
241
Impacts of Logging and Hunting 242
A General Linear Model with general contrasts and survey effort as a covariate was carried 243
out to assess the impact of logging and hunting on three variables: total species detected per 244
site (as a % of all detected species), % of carnivores, and % of IUCN concern (Endangered 245
and Vulnerable). Predictors included were: logging status, presence of hunting, habitat type 246
and protected status. All statistical tests were carried out using SPSS v.16, with a significance 247
level of P < 0.05. By including survey effort as a covariate this accounts for the wide 248
variation in grids and allows a more comprehensive comparison of the data. 249
250
Occupancy 251
We used single-season occupancy modelling [MacKenzie et al., 2006] to estimate occupancy 252
probability (Ψ) of taxa at each site. We reconstructed the camera trap history of each species 253
at six sites (Sabangau, Sungai Wain, Kutai, Bawan, Lesan and Belantikan) and divided the 254
data into five-day sampling periods. We did not run occupancy modelling for Mungku Raya 255
and Mungku Baru sites due to lower sample size compared to the other sites. For estimating 256
occupancy of taxa in Sabangau, we took data from the single wet season in 2011-2012 to 257
allow comparison with other sites. Where possible (grids with more than 5 camera stations), 258
we used habitat as covariate. We entered the data into PRESENCE 7.3 (available for free at: 259
www.mbr-pwrc.usgs.gov/software/presence.html). We ranked models based on the Akaike 260
Information Criterion (AIC) values: models with the lowest AIC values were identified as the 261
best output models. All species detected are listed in Appendix 1 with Occupancy data for 262
each site in Appendix 2. A total of 36 mammal species was detected and included in this 263
analysis. 264
265
RESULTS 266
1. Spatial distribution of mammals 267
Occupancy was calculated for all species in all grids and an averaged calculated. (Table 5). 268
Pig-tailed macaques, muntjac, orang-utans, sun bears, bearded pigs and common porcupines 269
consistently had an occupancy of > 0.5. 270
271
14

272
273
274
275
Table 5 Average detection probability of all mammal species across grids. Due to difficulties 276
in differentiating between greater and lesser mouse deer, yellow and red muntjac and collared 277
and short-tailed mongoose, these species have been combined. See Appendix I for further 278
information. 279
Species Average occupancy Range Muntjac (combined) 2.30 0.25 - 5.35 Pig-tailed Macaque 1.80 0.00 - 5.08 Mouse Deer (combined) 1.50 0.15 - 4.55 Bearded Pig 1.00 0.09 - 2.77 Orangutan 0.66 0.00 - 0.94 Sun Bear 0.61 0.53 - 0.69 Common porcupine 0.52 0.16 - 0.85 Malay Civet 0.37 0.00 - 0.69 Sambar Deer 0.30 0.00 - 0.91 Leopard Cat 0.30 0.00 - 0.65 Clouded Leopard 0.27 0.00 - 0.63 Long-tailed Macaque 0.26 0.00 - 0.64 Red langur 0.23 0.00 - 0.53 Yellow-throated Marten 0.16 0.00 - 0.23 Mongoose (combined) 0.16 0.01 - 0.38 Common Palm Civet 0.12 0.00 - 0.59 Banded civet 0.12 0.00 - 0.36 Pangolin 0.11 0.00 - 0.19 Long-tailed porcupine 0.10 0.00 - 0.25 Marbled Cat 0.09 0.00 - 0.19 Flat-headed Cat 0.07 0.00 - 0.28 Banteng 0.06 0.00 - 0.22 Bay cat 0.06 0.00 - 0.21 Binturong 0.03 0.00 - 0.15 Small toothed Palm Civet 0.03 0.00 - 0.15 Small0clawed Otter 0.03 0.00 - 0.15 Otter Civet 0.02 0.00 - 0.1 Banded Linsang 0.02 0.00 - 0.1 Moonrat 0.02 0.00 - 0.1 Horse-tailed Squirrel 0.02 0.00 - 0.1 White-fronted langur 0.02 0.00 - 0.1 Tarsier 0.01 0.00 - 0.5 Tufted ground squirrel 0.01 0.00 - 0.5 280
15

The maximum and minimum distances of detections from forest edge were calculated for 281
each species detection and compared between habitat types. A Mann-Whitney U-test was 282
used to assess if there a significant difference in minimum and maximum detection distances 283
between habitats (Table 6). 284
285
Table 6 Relationship between forest edge and minimum and maximum detection distance. 286
Species Minimum distance
(km)
Maximum distance
(km)
Relationship to forest edge.
Banteng U = 13.47, p = 0.05 U = 12.25, p = 0.02 Detected significantly closer in Lowland
Montane.
Bay cat NS U = 5.18, p = 0.04 Detected significantly farther in Lowland
Dipterocarp.
Bearded
pig
U = 9.74, p = 0.05 U = 11.32, p = 0.04 Detected significantly further in Lowland
Dipterocarp/PSF and significantly closer in
Lowland Montane.
Muntjac NS NS No difference between habitat types.
Clouded
leopard
U = 6.25, p = 0.03 U = 9.57, p = 0.02 Detected significantly further in Lowland
Dipterocarp and significantly closer in
Lowland Montane.
Flat-
headed
U = 8.64, p = 0.04 NS Detected significantly closer in Peat-
swamp Forest.
Leopard
cat
U = 9.98, p = 0.02 NS Detected significantly closer in Peat-
swamp Forest.
Marbled
cat
U = 14.43, p = 0.02 U = 9.24, p = 0.01 Detected significantly closer in Peat-
swamp Forest and Lowland Montane.
Mouse
deer
NS NS No difference between habitat types.
Sambar
deer
U = 8.25, p = 0.01 NS Detected significantly closer in Peat-
swamp Forest.
Sun bear NS NS No difference between habitat types.
287
2. Communities, habitat and management structure 288
16

The impacts of forest status, habitat and anthropogenic disturbance were investigated 289
separately due to the wide variation in sample size and types of habitat and disturbance which 290
were represented across the study grids. Additionally, the mammalian community structure, 291
while showing much similarity across study grids, was different, likely as a result of the 292
differences in anthrophonic pressure and natural habitat variation. 293
294
Felid Guilds 295
Only two of the eight grids, Kutai and Lesan, both in East Kalimantan, share the same group 296
of felid species based only on camera trap data. None of the grids has confirmed presence of 297
all five Bornean felids (Table 7 but see discussion). Both the demographics of the individual 298
clouded leopards caught on camera and the numbers of individuals varied from 0-3 between 299
grids. 300
301
Table 7 Distribution of felid species and demographics across all grids as detected by the 302
cameras (number of independent photos) X = not detected. 303
Grid Clouded Leopard
Leopard Cat
Flat-headed Cat
Marbled Cat
Bay Cat
Total Felid Species
Total males
Total females
Total unknown Total
Bawan X 1 X 1 X 2 0 0 0 0 Belantikan 3 3 X X X 2 1 0 0 1 Kutai 1 1 X 1 2 4 1 0 0 1 Lesan 3 2 X 1 1 4 2 0 1 3 Mungku Baru 1 1 X X X 2 0 1 0 1
Murung Raya 1 1 X 1 X 3 0 0 1 1
Sabangau* 152 74 30 41 X 4 4 (8) 1 (1) 0 (0) 4 (9) Sungai Wain 12 1 1 X 1 4 2 0 0 2
* Sabangau data are from the 6-month comparison survey period, data in brackets are 304
numbers from the full 7 years of survey [Adul et al., 2014]. 305
306
Impacts of Forest Status 307
Camera trap recorded IUCN Red List Endangered mammals at all grids (Table 8). 308
Table 8 Distribution of IUCN status species across all grids. 309
Grid Logging status/age
Hunting Total Species
E V NT LC DD
Bawan Current Y 19 1 3 0 15 0 Belantikan > 20 Y 30 3 8 1 18 0
17
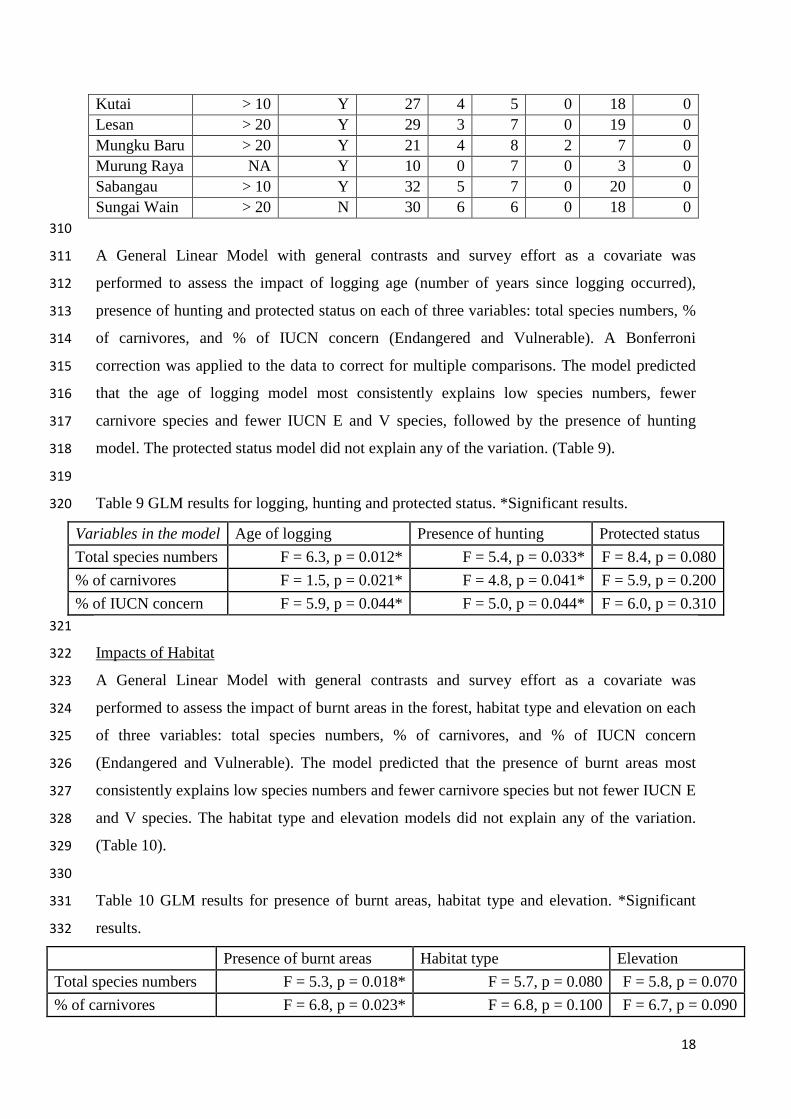
Kutai > 10 Y 27 4 5 0 18 0 Lesan > 20 Y 29 3 7 0 19 0 Mungku Baru > 20 Y 21 4 8 2 7 0 Murung Raya NA Y 10 0 7 0 3 0 Sabangau > 10 Y 32 5 7 0 20 0 Sungai Wain > 20 N 30 6 6 0 18 0 310
A General Linear Model with general contrasts and survey effort as a covariate was 311
performed to assess the impact of logging age (number of years since logging occurred), 312
presence of hunting and protected status on each of three variables: total species numbers, % 313
of carnivores, and % of IUCN concern (Endangered and Vulnerable). A Bonferroni 314
correction was applied to the data to correct for multiple comparisons. The model predicted 315
that the age of logging model most consistently explains low species numbers, fewer 316
carnivore species and fewer IUCN E and V species, followed by the presence of hunting 317
model. The protected status model did not explain any of the variation. (Table 9). 318
319
Table 9 GLM results for logging, hunting and protected status. *Significant results. 320
Variables in the model Age of logging Presence of hunting Protected status Total species numbers F = 6.3, p = 0.012* F = 5.4, p = 0.033* F = 8.4, p = 0.080 % of carnivores F = 1.5, p = 0.021* F = 4.8, p = 0.041* F = 5.9, p = 0.200 % of IUCN concern F = 5.9, p = 0.044* F = 5.0, p = 0.044* F = 6.0, p = 0.310
321
Impacts of Habitat 322
A General Linear Model with general contrasts and survey effort as a covariate was 323
performed to assess the impact of burnt areas in the forest, habitat type and elevation on each 324
of three variables: total species numbers, % of carnivores, and % of IUCN concern 325
(Endangered and Vulnerable). The model predicted that the presence of burnt areas most 326
consistently explains low species numbers and fewer carnivore species but not fewer IUCN E 327
and V species. The habitat type and elevation models did not explain any of the variation. 328
(Table 10). 329
330
Table 10 GLM results for presence of burnt areas, habitat type and elevation. *Significant 331
results. 332
Presence of burnt areas Habitat type Elevation Total species numbers F = 5.3, p = 0.018* F = 5.7, p = 0.080 F = 5.8, p = 0.070 % of carnivores F = 6.8, p = 0.023* F = 6.8, p = 0.100 F = 6.7, p = 0.090
18

% of IUCN concern F = 7.0, p = 0.060 F = 7.1, p = 0.120 F = 8.8, p = 0.100 333
3. Anthropogenic disturbance 334
We compared mammalian species assemblages between forests with different human impacts 335
and distance from human settlements (Table 11). 336
337
Table 11 Details of minimum distances to disturbance for each grid. 338
GRID Distance to tarmac road (km)
Distance to dirt road (km)
Distance to village (km)
Distance to river (km)
Presence of logging camp in forest
Bawan 7.1 0.5 7.2 8.4 N Belantikan 5.6 0.2 1 2 N
Kutai 13 0.5 3.5 1.5 N Lesan 6.3 2 3.8 2.4 N Mungku Baru 4 4 2 0.3 N Murung Raya 45 15 10 0.1 N Sabangau 4 4 6 1.5 N Sungai Wain 6.7 2.4 6 1 N 339
A General Linear Model with general contrasts and survey effort as a covariate was 340
performed to assess the impact of distance to tarmac road, distance to dirt road, distance to 341
village, distance to river and presence of logging camp in the forest on each of three 342
variables: total species numbers, % of carnivores, and % of IUCN concern (Endangered and 343
Vulnerable). None of these models explained the variation in total species numbers, % of 344
carnivores, and % of IUCN concern (Endangered and Vulnerable). 345
346
Hunting 347
Species which were regularly hunted were deer (muntjac, mouse and sambar – average 40% 348
of respondents), bearded pigs (20%) and pangolins (8%). Guns and spears were more 349
commonly used than snares. Recognition and correct identification of photos of clouded 350
leopards varied from 34-68% of respondents. Incorrect answers were leopard cat, tiger and 351
lion. Only in Kutai and Murung Raya was it reported that cats were hunted for their skin 352
(Figure 5). 353
19

354
355
356
357
358
359
360
361
362
363
364
365
366
367
Figure 5 Leopard cat skin in a family home. The cat was trapped and killed as it was believed 368
to be consuming chickens. Photo taken in Tumbang Tujang village, Murung Raya District 369
(central highlands) by BRINCC Expedition team in 2011 [Cheyne et al., 2012]. 370
371
DISCUSSION 372
We have shown how different types of forest disturbance affects the species variation in 373
mammal communities. The variation in the guild of mammals present in an area can be used 374
as an indicator of disturbance. 375
1. Spatial distribution of mammals 376
Pig-tailed macaques, muntjac, orang-utans, sun bears, bearded pigs and common porcupines 377
consistently had an occupancy of > 0.5 suggesting that these species are using all surveyed 378
areas of the forest irrespective of disturbance levels or habitat type. Likely due to the high 379
levels of terrestriality and generalist diet, the pig-tailed macaques were the most frequently 380
detected species combined across all grids followed by bearded pigs, sun bears, orang-utans 381
[Ancrenaz et al., 2014] and muntjac species. 382
383
20

Even within the most disturbed forest (Bawan) these large mammals were making use of the 384
forest edge. Bearded pigs were generally found close to the forest edge but ranged further 385
into the forest interior in LD, LD/PSF and PSF. Clouded leopards, leopard cats and marbled 386
cats were all found <1km from the forest edge only in PSF. Sambar deer were found <2km 387
from the forest edge only in Lowland Montane. 388
389
2. Communities, habitats and management strategy 390
Felid Species Guilds 391
While difficult to confirm absence based only on camera trapping, some clear relationships 392
emerge from the data: Clouded leopards were always found in forest with sambar deer 393
(possible prey) and flat-headed cats are never found in forest without otter civets and Storm’s 394
storks. Both otter civets and sambar deer were found at low occupancy thus communities 395
could be determined by habitat specific species (e.g. wetland specialists) or by less common 396
species e.g. sambar deer rather than muntjac, mouse deer or bearded pigs. With regard to the 397
felids, the following relationships are emerging: 398
• If clouded leopards were present, there were also leopard cats and marbled cats 399
• If flat-headed cats were present, there were also clouded leopards, leopard cats and 400
marbled cats 401
• If bay cats were present there were also clouded leopards, leopard cats and marbled 402
cats. 403
• None of the grids has confirmed presence of all five Bornean felids despite camera 404
trapping continuously for 90-180 days. 405
Elsewhere on Borneo all five felids do co-occur. Sungai Wain is suspected to support all five 406
species but the marbled cat was not detected in this study. Murung Raya is also likely to 407
support all five felids. The flat-headed cat is a habitat-restricted species requiring wetlands 408
[Wilting et al., 2010, 2016] and the bay cat has never been recorded in peat-swamp forest 409
[Sastramidjaja et al., 2015] thus absence of these cats is not necessarily related to habitat 410
disturbance. 411
412
Female clouded leopards had lower encounter rates than males with only 2 females being 413
captured during the study at different grids compared to 14 males. It is clear that there is a 414
bias in the sex of detected clouded leopards at all grids (7:1 in Sabangau). This study 415
demonstrates the challenge with surveying clouded leopard populations where sample sizes 416
21

are small, which is often the norm for rare carnivore studies, thus reliable density estimates 417
are hard to obtain. Cheyne et al. (2013) propose several hypotheses as to the low capture rate 418
of females in peat-swamp forest. With the benefit of more survey grids and habitat types, 419
these hypotheses remain plausible. Females are smaller than males and probably have sole 420
responsibility for raising cubs; therefore, our current hypotheses as to the lack of photo 421
detections of females are as follows. 422
423
(1) Females were not detected on any trails. We strongly suspect that the females are staying 424
well away from any human disturbance thus they are avoiding trails or they are avoiding 425
trails because they are avoiding people. (2) Females were not photographed on any cameras 426
which also captured males. (3) Females are staying away from high concentrations of males 427
as they cannot compete for prey with so many larger males present. (4) All study grids are in 428
selectively logged/disturbed forest. This may render these areas unsuitable for denning cubs 429
so the females do not come there. It is worth noting that the grids with the highest number of 430
encounters with (male) clouded leopards were grids with long-term trails established for at 431
least 10 years, thus perhaps the clouded leopards become tolerant of long-term human 432
presence as long as they are not being persecuted. (5) Sollmann et al. [2011] point out that in 433
other pantherine species, male cats move over larger areas than females and are perhaps more 434
readily detected by camera traps. (6) Wilting et al. [2012] highlight that female clouded 435
leopards may also spend more time in trees than males as they may be more agile and better 436
climbers due to their lower body weight, thus females may be detected less often on ground-437
based camera traps. 438
439
Forest status 440
Camera trapping recorded IUCN Red List Endangered mammals at all grids. Age of logging 441
and hunting pressure were negative indicators of species numbers, % of carnivores and % of 442
IUCN Endangered and Vulnerable species. The two variables are correlated as opening an 443
area for logging often leads to increased human activity. Different species will respond to 444
pressures differently and species will be impacted by hunting pressure in different ways e.g. 445
species targeted for food or retribution will be more heavily impacted. The protected status of 446
the forests did not significantly predict species numbers, % of carnivores and % of IUCN 447
species, perhaps due to the fact that few protected areas have reliable and effective patrol 448
teams thus human impacts on forests are consistent across protected area status. 449
450
22

Habitat Type 451
Only the presence of burnt areas was found to significantly affect the total number of species 452
and the % of carnivore species in an area. Elevation was not a predictor of any of the 453
variables, likely due to the small variation in elevation from ~10-350m a.s.l. Montane areas 454
lack surveys due to inaccessibility but these areas require more work [Geise et al., 2004; 455
Glessner & Britt, 2005; Jennings et al., 2013]. Habitat type again was not a significant 456
predictor of species numbers, % of carnivores or % of IUCN species overall though some 457
specialists do have habitat preferences e.g. flat-headed cats and otter civets preferring 458
wetlands and banteng and bay cats apparently avoiding PSF. 459
460
3. Anthropogenic disturbance 461
The presence of indirect infrastructure did not significantly impact the community structure 462
or presence. The age of indirect logging and direct hunting presence significantly impacted 463
total species richness, % of species that were carnivores, and % of species of IUCN concern 464
(Endangered and Vulnerable). Hunting will be of greater conservation threat for some species 465
than others e.g. primates and ungulates. Logging is more likely to impact other larger 466
mammals e.g. felids, sun bears and sambar deer [Meijaard et al., 2005]. While none of the cat 467
species was reported as being hunted, hunting of these cats does occur. 468
469
4. Using mammal communities as indicators of human perturbation 470
Ecological indicators of habitat quality are a valuable tool for conservation biologists. 471
Previous explorations of indicator performance have generally focussed on single species. 472
Species selection has been based on 1) ease of survey, 2) ease of identification and 3) life 473
history traits, e.g. short-lived species are favoured based on the assumption that they will 474
respond faster to change. Although indicators based on individual species can be useful for 475
developing support for a monitoring program or evoking a public response to an 476
environmental issue, the reliability of individual species as indicators can be problematic if 477
precise estimates are difficult to achieve due to issues with measurement, or if there is 478
considerable natural variation in the real numbers and distribution of a species [Harrison et 479
al., 2005, 2012a; Gardner, 2010]. Variation in numbers and distribution can be caused by 480
many factors including natural population cycles, seasonality, sampling error, annual 481
movements, and natural variation in response to habitat structure. 482
483
23

The use of focal or indicator species has been questioned [Van Horne, 1983; Pearson, 1994; 484
Carignan & Villard, 2001; Harrison et al., 2012a]. An alternative approach is to combine a 485
number of ecological attributes into a holistic assessment of the state of the ecosystem, given 486
that that no one species is likely to provide a complete picture of ecosystem integrity 487
[Cushman & McGarigal, 2003]. Single elements often show sensitivity to different factors 488
e.g. human influence. The use of communities as functional groups of indicators may be a 489
more promising option but needs further work [Dufrêne & Legendre, 1997; Bayne et al., 490
2004; Cushman et al., 2009]. Diversity measures such as species richness are often proposed 491
as ecological indicators because of their reduced variability compared with abundance. 492
493
We sought to determine the value of using indicator communities’ i.e. large and/or small 494
mammals, rather than focusing on life history of individual species, both to evaluate the 495
effectiveness of this approach and as an alternative to using skilled botanists who are often in 496
short supply. Camera trapping at this scale is both expensive and time-consuming, and for 497
some of these species, such as most felids, sample sizes thwart accurate density analysis 498
[Gordon & Stewart, 2007; Wilting et al., 2010, 2012; Brodie & Giordano, 2012; Cheyne et 499
al., 2013], however, combining these data with those for the wider mammal guild is useful. 500
501
CONCLUSIONS 502
The history of logging, the presence of hunting of burnt forest emerge strongly as 503
significantly negatively associated with mammalian community diversity. While the 504
infrastructure changes were not statistically significant, it is perhaps too soon to determine if 505
roads, logging camps and tracks to have an impact or not. The size of the forest will likely 506
affect the mammal communities; more work is needed on small fragments to compare 507
persisting mammalian guilds with larger landscapes. We have demonstrated that wide and 508
disparate data sets can provide ecological monitoring value and urge for more investigation 509
into the use of community and guild datasets as well as the long-term impacts of 510
infrastructure development. We have identified 4 species as specific indicators whose 511
presence or absence can help determine the type and/or extent of forest disturbance and/or be 512
a proxy indicator for the presence of other species. Leopard cat (Prionailurus bengalensis) and 513
pig-tailed macaques (Macaca nemestrina, generalists); sambar deer (Rusa unicolor, large, wide-514
ranging herbivores) and clouded leopards (Neofelis diardi) as a proxy for at least 2 of the 515
smaller felid species. We propose that it is the presence of generalist and rare/specialist 516
24

species which could be a good measure of the level of ecosystem disturbance as well as the 517
completeness of the whole mammalian community. 518
519
ACKNOWLEDGEMENTS 520
We dedicate this paper to Dr Suwido H. Limin who passed away while this paper was in 521
preparation. Dr Limin fought tirelessly for better understanding and conservation of 522
Kalimantan’s peatland forests and this work would not have been possible without him. This 523
project involved collaboration between many individuals, organizations and universities. In 524
Sabangau and Bawan forests, Central Kalimantan the study was carried out within the Borneo 525
Nature Foundation multi-disciplinary research project. We thank Balai Lingkungan Hidup in 526
Purak Cahu for permissions to enter the Murung Raya region and the entire BRINCC 2011 527
Expedition team for their help with the fieldwork. The surveys in Mungku Baru were funded 528
by International Animal Rescue Indonesian who also facilitated research permissions. We 529
thank Pak Herry Mulyadi Tuwan for facilitating logistics with Mungku Baru residents. In 530
Sungai Wain Protection Forest, we gratefully thank Pak Purwanto and Pak Agusdin for 531
permissions and logistical support as well as Stan Lhota and Gabriella Fredriksson for all 532
their advice. In Lesan Forest, Berau, we thank The Nature Conservancy. In Belantikan Forest 533
we thank Yayorin and the Bupati of Lamandau Regency for their collaboration and support. 534
We also thank University Mulawarman Samarinda for their sponsorship of the work in East 535
Kalimantan. We gratefully acknowledge the invaluable contribution of all the researchers and 536
staff that assisted with the project at each grid and all the past and present BNF and BRINCC 537
staff, interns and volunteers. We gratefully thank the Centre for the International Cooperation 538
in Management of Tropical Peatlands (CIMTROP), University of Palangka Raya for 539
sponsoring the overall research project and providing invaluable logistical support. We thank 540
the Indonesian Ministry of Science and Technology (RISTEK) and Director General of 541
Nature Conservation (PHKA) for permission to carry out research in Indonesia. The 542
Robertson Foundation provided funding for the majority of the survey work presented here. 543
Additional funding for different stages of this work was kindly provided by Panthera, 544
International Animal Rescue (IAR) Indonesia, Borneo Nature Foundation, The Barito River 545
Initiative for Nature Conservation and Communities (BRINCC), The Clouded Leopard 546
Project/Point Defiance Zoo and Aquarium, Fresno Chafee Zoo and the Orangutan Foundation 547
UK. Sam Cushman, Paul Johnson, Bob Montgomery and 2 anonymous reviewers provided 548
invaluable comments on previous drafts of this manuscript. 549
550
25

REFERENCES 551
Adul, Ripoll Capilla B, Limin SH, Cheyne SM. 2015. Felids of Sebangau: Camera trapping 552
to estimate activity patterns and population abundance in Central Kalimantan, 553
Indonesia. Biodiversitas 16:151–155. 554
Aldhous P. 2004. Borneo is burning. Nature 432:144–146. 555
Ancrenaz M, Cheyne S, Humle T, Robbins M. 2015. Impacts of Industrial Agriculture on 556
Ape Ecology. In: State of the Apes 2015: Industrial Agriculture and Ape Conservation. . 557
p 165–192. 558
Ancrenaz M, Cheyne SM, Humle T, Robbins MM. 2013. Impacts of Extractive Industry on 559
Ape Ecology. In: State of the Apes 2013: Extractive Industries and Ape Conservation. . 560
p 164–191. 561
Ancrenaz M, Sollmann R, Ambu L, et al. 2014. Coming down from the trees: Is terrestrial 562
activity in Bornean orangutans natural or disturbance driven? Scientific Reports 4:1–5. 563
Bayne E, Boutin S, Moses R. 2004. Are boreal forest mammals good indicators of cumulative 564
effects? Edmonton, Alberta, Canada. Available from: 565
http://www.sfmn.ales.ualberta.ca/en/Publications/~/media/sfmn/Publications/ProjectRep566
orts/Documents/PR_200304boutinsterr6.ashx 567
Bersacola E, Smith DAE, Sastramidjaja WJ, Rayadin Y, Cheyne SM. 2014. Population 568
density of Presbytis rubicunda in a small primary Dipterocarpp forest in East 569
Kalimantan, Indonesian Borneo. Asian Primates Journal 4:16–26. 570
Brandon-Jones D, Eudey AA, T. G, et al. 2004. Asian primate classification. . International 571
Journal of Primatology 25:97–164. 572
Brodie J, Giordano A. 2012. Density of the Vulnerable Sunda clouded leopard Neofelis diardi 573
in a protected area in Sabah, Malaysian Borneo. Oryx 46:427–430. 574
Brodie JF, Giordano A., Zipkin E., et al. 2014. Correlation and Persistence of Hunting and 575
Logging Impacts on Tropical Rainforest Mammals. Conservation Biology. 576
Burivalova Z, Şekercioğlu C., Pin Koh L. 2014. Thresholds of Logging Intensity to Maintain 577
Tropical Forest Biodiversity. Current Biology 24:1893–1898. 578
Carignan V, Villard M-C. 2001. Selecting indicator species to monitor ecological integrity: a 579
review. Environmental Management and Assessment 78:45–61. 580
Chambers R. 1994. The Origins and Practice of Participatory Rural Appraisal. World 581
Development 22:953–969. 582
Cheyne SM, Stark D, Limin SH, Macdonald DW. 2013. First Estimates of Population 583
Ecology and Threats to Sunda Clouded Leopards (Neofelis diardi) in a Peat-swamp 584
26

Forest, Indonesia. Endangered Species Research 22:1–9. 585
Cheyne SM, Zrust M, Hoeing A, et al. 2012. Barito River Initiative for Nature Conservation 586
and Communities (BRINCC) Preliminary Report. Palangka Raya, Indonesia: BRINCC 587
Expedition. 588
Cheyne SM. 2010. Behavioural ecology and socio-biology of gibbons (Hylobates albibarbis) 589
in a degraded peat-swamp forest. In: Supriatna J, Gursky SL, editors. Indonesian 590
Primates. New York: Springer. p 121–156. 591
Cushman S., McGarigal K. 2003. Landscape Level Patterns of Avian Diversity in the Oregon 592
Coast Range. Ecological Monographs 73:259–281. 593
Cushman S., McKelvey K., Noon B., McGarigal K. 2009. Use of Abundance of One Species 594
as a Surrogate for Abundance of Others. Conservation Biology 24:830–840. 595
Danielsen F, Heegaard M. 1994. The impact of logging and forest conversion of lowland 596
forest birds and other wildlife in Seberida, Riau Province, Sumatra. . In: Sandbukt OW, 597
editor. Proceedings of NORINDRA Seminar. Indonesian Institute of Sciences. Vol. 598
Rainforest. Jakarta, Indonesia. p 59–60. 599
Dufrêne M, Legendre P. 1997. Species assemblages and indicator species: the need for a 600
flexible asymmetrical approach. Ecological Monographs 67:245–366. 601
Estrada A, CoatesEstrada R. 1996. Tropical rain forest fragmentation and wild populations of 602
primates at Los Tuxtlas, Mexico. International Journal of Primatology [Internet] 17:759–603
783. Available from: <Go to ISI>://WOS:A1996VU63700005 604
Fitzherbert EB, Struebig MJ, Morel A, et al. 2008. How will oil palm expansion affect 605
biodiversity? Trends in Ecology and Evolution 23:538–545. 606
Fuller DO, Jessup TC, Salim A. 2004. Loss of forest cover in Kalimantan, Indonesia, since 607
the 1997-1998 El Niño. Conservation Biology 18:249–254. 608
Gardner TA. 2010. Monitoring Forest Biodiversity: improving conservation through 609
ecologically responsible management. London: Earthscan. 610
Gaveau DLA, Sloan S, Molidena E, et al. 2014. Four decades of forest persistence, clearance 611
and logging on Borneo. PLoS One 9:e101654. 612
Gaveau DLA, Wich S, Epting J, et al. 2009. The future of forests and orangutans (Pongo 613
abelii) in Sumatra: predicting impacts of oil palm plantations, road construction, and 614
mechanisms for reducing carbon emissions from deforestation. Environmental Research 615
Letters [Internet] 4. Available from: <Go to ISI>://WOS:000270659300017 616
Geise L, Pereira LG, Bossi DEP, Bergallo HG. 2004. Pattern of elevational distribution and 617
richness of non volant mammals in Itatiaia National Park and its surroundings, in 618
27

southeastern Brazil. Brazilian Journal of Biology [Internet] 64:599–612. Available from: 619
<Go to ISI>://MEDLINE:15619998 620
Gilhooly LJ, Rayadin Y, Cheyne SM. 2015. A Comparison of Hylobatid Survey Methods 621
Using Triangulation on Müller’s Gibbon (Hylobates muelleri) in Sungai Wain 622
Protection Forest, East Kalimantan, Indonesia. International Journal of Primatology 623
36:567–582. 624
Glessner KDG, Britt A. 2005. Population density and home range size of Indri indri in a 625
protected low altitude rain forest. International Journal of Primatology [Internet] 626
26:855–872. Available from: <Go to ISI>://WOS:000231280900007 627
Gordon CH, Stewart EA-M. 2007. The use of logging roads by a solitary felid, the clouded 628
leopard. Cat News 47:12–13. 629
Groves C. 2001. Primate Taxonomy. Washington DC: Smithsonian Institute Press. 630
Harrison M., Hendri, Dragiewicz M., et al. 2010. Biodiversity of the Mungku Baru Ulin 631
Forest, Central Kalimantan, Indonesia. Palangka Raya, Indonesia.: Orangutan Tropical 632
Peatland Project. 633
Harrison ME, Cheyne SM, Boonman A, Marchant NC, Husson SJ. 2012a. Biodiversity 634
monitoring protocols for REDD+: pitfalls of a one-size-fits-all approach. Tropical 635
Conservation Science 5:1–11. 636
Harrison ME, Cheyne SM, Darma F, et al. 2011. Hunting of flying foxes and perception of 637
disease risk in Indonesian Borneo. Biological Conservation 144:6–24. 638
Harrison ME, Cheyne SM, Husson SJ, et al. 2012b. Preliminary Assessment of the 639
Biodiversity and Conservation Value of the Bawan Forest, Central Kalimantan, 640
Indonesia. . Palangka Raya: Orangutan Tropical Peatland Project. 641
Harrison ME, Cheyne SM, Morrogh-Bernard H, Husson SJ. 2005. What can apes tell us 642
about the health of their environment? A Preliminary Analysis of the use of orang-utans 643
and gibbons as biological indicators of changes in habitat quality in tropical peat swamp 644
forests. . In: Reiley JO, editor. Proceedings of the International Symposium and 645
Workshop on “Restoration and Wise Use of Tropical Peatland.” Palangka Raya, 646
Indonesia: CIMTROP. p 104–109. 647
Van Horne B. 1983. Density as a misleading indicator of habitat quality. The Journal of 648
Wildlife Management 47:893–901. 649
Jennings A, Mathai J, Brodie J, Giordano A, Veron G. 2013. Predicted distributions and 650
conservation status of two threatened Southeast Asian small carnivores: the banded civet 651
and Hose’s civet. Mammalia 77:261–271. 652
28

Kerlinger FN. 1986. Foundations of Behavioral Research. Forth Worth. TX: Holt, Rinehart 653
and Winston. Inc. 654
MacKenzie DI, Nichols JD, Royle JA, et al. 2006. Occupancy estimation and modeling: 655
inferring patterns and dynamics of species occurrence. , Amsterdam. Amsterdam: 656
Elsevier. 657
MacKinnon K, Hatta G, Halim H, Mangalik A. 1996a. The Ecology of Kalimantan, 658
Indonesian Borneo. Hong Kong, China.: Periplus Editions (HK) Ltd. 659
MacKinnon K, Hatta G, Halim H, et al. 1996b. The Ecology of Kalimantan, Indonesian 660
Borneo. Hong Kong, China.: Periplus Editions (HK) Ltd. 661
Marshall AJ, Nardiyono, Engström LM, et al. 2006. The blowpipe is mightier than the 662
chainsaw in determining population density of Bornean orangutans (Pongo pygmaeus 663
morio) in the forests of East Kalimantan. Biological Conservation 129:566–578. 664
Matthews A. 2006. Inventory of large and medium-sized mammals in south-western 665
Cameroon. Mammalia [Internet] 70:276–287. Available from: <Go to 666
ISI>://WOS:000247732900010 667
McConkey KR, Chivers DJ. 2004. Low mammal and hornbill abundance in the forests of 668
Barito Ulu. Central Kalimantan, Indonesia. Oryx 38:439–447. 669
Meijaard E, Sheil D, Nasi R, et al. 2005. Life after logging: reconciling wildlife forestry and 670
production forestry in Indonesian Borneo. Bogor, Indonesia: CIFOR. 671
Meijaard E. 2001. Conservation and trade of sun bears in Kalimantan. Proceedings of the 672
third international symposium on the trade in bear parts.:26–37. 673
Meittinen J, Hooijer A, Shi C, et al. 2012. Extent of industrial plantations on Southeast Asian 674
peatlands in 2010 with analysis of historical expansion and future projections. GCB 675
Bioenergy 4:908–918. 676
Morrogh-Bernard H, Husson S, Page SE, Rieley JO. 2003. Population status of the Bornean 677
orang-utan (Pongo pygmaeus) in the Sebangau peat swamp forest, Central Kalimantan, 678
Indonesia. Biological Conservation 110:141–152. 679
Myers N, Mittermeier RA, Mittermeier CG, da Fonseca GAB, Kent J. 2000. Biodiversity 680
hotspots for conservation priorities. Nature 403:853–858. 681
van Niewstadt MGL, Shiel D, Kartawinata K. 2001. The ecological consequences of logging 682
in the burned forests of east Kalimantan, Indonesia. Conservation Biology 15:1183–683
1186. 684
Pearson DL. 1994. Selecting indicator taxa for the quantitative assessment of biodiversity. 685
Philosophcial Transactions of the Royal Society of London 345:75–79. 686
29

Peres CA, Palacios E. 2007. Basin-wide effects of game harvest on vertebrate population 687
densities in Amazonian forests: Implications for animal-mediated seed dispersal. 688
Biotropica [Internet] 39:304–315. Available from: <Go to 689
ISI>://WOS:000245939300003 690
Rijksen HD, Meijaard E, Meijard E. 1999. Our vanishing relative: the status of wild orang-691
utans at the close of the Twentieth century. (Tropenbos, editor.). London.: Kluwer 692
Academic Publishers. 693
Ripple WJ, Newsome TM, Wolf C, et al. 2015. Collapse of the world’s largest herbivores. 694
Science Advances [Internet] 1. Available from: 695
http://advances.sciencemag.org/content/1/4/e1400103.abstract 696
Rodman PS. 1977. Feeding behaviour of orang-utans of the Kutai Nature Reserve, East 697
Kalimantan. In: Clutton-Brook TH, editor. Primate Ecology: Studies of feeding and 698
ranging behaviour in lemurs, monkeys and apes. London, UK: Academic Press, London, 699
381-413. p 171–209. 700
Rustam, Yasuda M, Tsuyuki S. 2012. Comparison of mammalian communities in a human-701
disturbed tropical landscape in East Kalimantan, Indonesia. Mammal Study 37:299–311. 702
Sapari I, Sadikin LA, Santoso E, Sadranto M. 2005. Biodiversity, social, economy and 703
culture of communities in three villages of upstream Belantikan, Central Kalimantan. 704
Pangkalan Bun, Indonesia. 705
Sastramidjaja WJ, Cheyne SM, Loken B, Macdonald DW. 2015. The bay cat in Kalimantan, 706
new information from recent sightings. Cat News 62. 707
Slik JWF, Verburg RW, P. K. 2002. Effects of fire and selective logging on the tree species 708
composition of lowland dipterocarp forest in East Kalimantan, Indonesia. Biodiversity 709
and Conservation 11:85–98. 710
Sollmann R, Furtado MM, Gardner B, et al. 2011. Improving density estimates for elusive 711
carnivores: accounting for sex-specific detection and movements using spatial capture–712
recapture models for jaguars in central Brazil. Biological Conservation 144:1017–1024. 713
Stark DJ, Nijman V, Lhota S, Robins JG, Goossens B. 2012. Modeling population viability 714
of local proboscis monkey Nasalis larvatus populations: conservation implications. 715
Endangered Species Research 16:31–43. 716
Struebig MJ, Harrison ME, Cheyne SM, Limin SH. 2007. Intensive hunting of large flying-717
foxes (Pteropus vampyrus natunae) in the Sebangau Catchment, Central Kalimantan, 718
Indonesian Borneo. Oryx 41:1–4. 719
The Nature Conservancy. 2011. Berau Forest Carbon Programme: Delivering Practical 720
30

Solutions to Support Development of a National-level REDD Framework in Indonesia. 721
Voss RS, Lunde DP, Simmons NB. 2001. The mammals of Paracou, French Guiana: A 722
neotropical lowland rainforest fauna - part 2. Nonvolant species. Bulletin of the 723
American Museum of Natural History [Internet]:3–236. Available from: <Go to 724
ISI>://WOS:000169480800001 725
Waltert M, Lien, Faber K, Muhlenberg M. 2002. Further declines of threatened primates in 726
the Korup Project Area, south-west Cameroon. Oryx [Internet] 36:257–265. Available 727
from: <Go to ISI>://WOS:000177616900013 728
Wanelik K, Abdulazis, Cheyne SM. 2013. Note-, phase- and song-specific acoustic variables 729
contributing to the individuality of male duet song in the Bornean Southern gibbon 730
(Hylobates albibarbis). Primates 54:159–170. 731
Wearn O., Rowcliffe JM, Carbone C, Bernard H, EwersR.M. 2013. Assessing the Status of 732
Wild Felids in a Highly-Disturbed Commercial Forest Reserve in Borneo and the 733
Implications for Camera Trap Survey Design. PLoS One 8. 734
Wells K, Pfeiffer M, Lakim MB, Linsenmair KE. 2004. Use of arboreal and terrestrial space 735
by a small mammal community in a tropical rain forest in Borneo, Malaysia. Journal of 736
Biogeography 31:641–652. 737
Wich SA, Meijaard E, Marshall AJ, et al. 2008. Distribution and conservation status of the 738
orang-utan (Pongo spp.) on Borneo and Sumatra: how many remain? Oryx 40:329–339. 739
Wilcove DS, Giam X, Edwards D., Fisher B, Koh L. 2013. Navjot’s nightmare revisited: 740
logging, agriculture, and biodiversity in Southeast Asia. Trends in Ecology & Evolution 741
28:531– 540. 742
Wilting A, Cheyne SM, Mohamed A, et al. 2016. Predicted distribution of the flat-headed cat 743
Prionailurus planiceps (Mammalia: Carnivora: Felidae) on Borneo. Raffles Bulletin of 744
Zoology Supplement:173–179. 745
Wilting A, Cord A, Hearn AJ, et al. 2010. Looking for a home for flat-headed cats; modelling 746
the species distribution of an endangered Southeast Asian small cat species. PLoS One 747
5. 748
Wilting A, Fischer F, Bakar SA, Linsenmair KE. 2006. Clouded leopards, the secretive top-749
carnivore of South-East Asian rainforests: their distribution, status and conservation 750
needs in Sabah, Malaysia. BMC Ecology 6:1–27. 751
Wilting A, Mohamed A, Ambu L, et al. 2012. Density of the Vulnerable Sunda clouded 752
leopard Neofelis diardi in two commercial forest reserves in Sabah, Malaysian Borneo. 753
Oryx 46:423–426. 754
31

755
32

APPENDIX 1 756
Species Scientific Name Order IUCN Status
Number of trap days with >1 detection
Banded civet Hemigalus derbyanus Carnivora V 29 Banded Linsang Prionodon linsang Carnivora LC 7 Banteng Bos javanicus Cetartiodactyla E 17 Bay cat Pardofelis badia Carnivora E 3 Bearded Pig Sus barbatus Cetartiodactyla V 752 Binturong Arctictis binturong Carnivora V 2 Clouded Leopard Neofelis diardi Carnivora V 162 Common Palm Civet Paradoxurus hermaphroditus Carnivora LC 5 Common porcupine Hystrix brachyura Rodentia LC 192 Flat-headed Cat Prionailurus planiceps Carnivora E 32 Horse-tailed Squirrel Sundasciurus hippurus Rodentia NT 1 Leopard Cat Prionailurus bengalensis Carnivora LC 78 Long-tailed Macaque Macaca fascicularis Primates LC 68 Long-tailed porcupine Trichys fasciculata Rodentia LC 11 Malay Civet Viverra tangalunga Carnivora LC 85 Marbled Cat Pardofelis marmorata Carnivora V 27 Mongoose (combined) Herpestes brachyurus and Herpestes
semitorquatus Carnivora LC 113
Moonrat Echinosorex gymnura Insectivora LC 15 Mouse Deer (combined) Tragulus kanchil and Tragulus napu Cetartiodactyla LC 316 Muntjac (combined) Muntiacus muntjak and Muntiacus atherodes Cetartiodactyla LC 553
Orangutan Pongo pygmaeus Primates E 142 Otter Civet Cynogale bennettii Carnivora E 7
33

Pangolin Manis javanica Pholidota E 20 Pig-tailed Macaque Macaca
nemestrina Primates V 2635
Red langur Presbytis rubicunda Primates LC 35 Sambar Deer Rusa unicolor Cetartiodactyla V 87 Small toothed Palm Civet Arctogalidia trivirgata Carnivora LC 4 Small-clawed Otter Aonyx cinerea Carnivora V 3 Sun Bear Helarctos malayanus Carnivora V 653 Tufted ground squirrel Rheithrosciurus macrotis Rodentia V 3 White-fronted langur Presbytis frontata Primates V 4 Yellow-throated Marten Martes flavigula Carnivora LC 26 757
758
759
760
761
762
763
764
765
766
767
768
769
34

APPENDIX 2 OCCUPANCY FOR ALL GRIDS 770
Bawan Belantikan Kutai Lesan Sabangau Sungai Wain
Species Ψ P Ψ P Ψ P Ψ P Ψ P Ψ P Banded civet - - 0.11 0.30 - - 0.24 0.08 - - 0.36 0.15 Banded Linsang - - - - - - - - 0.10 0.70 - - Banteng - - 0.13 0.08 0.22 0.05 - - - - - - Bay cat - - - - 0.12 0.01 - - - - 0.21 0.80 Bearded Pig 0.16 0.11 0.69 0.29 0.64 0.43 1.00 0.34 0.59 0.25 0.48 0.53 Binturong - - 0.02 0.60 - - - - 0.15 0.90 - - Clouded Leopard - - 0.27 0.40 0.46 0.30 - - 0.63 0.20 0.26 0.30 Common Palm Civet - - - - 0.59 0.40 - - 0.15 0.40 - - Common porcupine 0.16 0.45 0.73 0.30 0.85 0.40 0.48 0.20 0.40 0.80 0.51 0.30 Flat-headed Cat - - - - - - - - 0.12 0.04 0.28 0.03 Horse-tailed Squirrel - - 0.10 0.60 - - - - - - - - Leopard Cat 0.61 0.30 0.65 0.30 - - - - 0.51 0.40 - - Long-tailed Macaque 0.33 0.04 0.45 0.40 - - - - 0.16 0.70 0.64 0.20 Long-tailed porcupine - - 0.18 0.70 0.19 0.60 - - - - 0.25 0.40 Malay Civet - - 0.20 0.20 0.50 0.50 0.23 0.40 0.57 0.30 0.69 0.40 Marbled Cat 0.16 0.20 - - 0.19 0.20 - - 0.18 0.20 - - Mongoose (combined) 0.10 0.10 0.01 0.70 0.10 0.30 0.18 0.40 0.38 0.30 0.17 0.40 Moonrat - - - - - - - - 0.10 0.80 - - Mouse Deer (combined) 0.16 0.04 0.23 0.03 0.87 0.11 0.33 0.19 0.43 0.04 0.32 0.08 Muntjac (combined) 0.62 0.06 0.58 0.11 0.59 0.23 0.85 0.24 1.00 0.05 0.68 0.20 Orangutan 0.77 0.04 0.80 0.03 0.88 0.08 0.56 0.20 0.94 0.02 - - Otter Civet - - - - - - - 0.04 0.30 0.10 0.60 Pangolin - - - - 0.19 0.80 0.16 0.70 0.16 0.60 0.12 0.80 Pig-tailed Macaque 0.38 0.07 1.00 0.02 0.63 0.18 0.82 0.10 1.00 0.05 0.78 0.23
35

Red langur 0.23 0.04 - - - - - - 0.53 0.04 - - Sambar Deer - - 0.51 0.08 0.11 0.24 0.54 0.02 0.13 0.34 0.67 0.01 Small toothed Palm Civet - - - - - - - - 0.15 0.70 - - Small-clawed Otter - - - - - - - 0.15 0.70 - - Sun Bear 0.66 0.03 0.53 0.03 0.55 0.04 0.61 0.05 0.62 0.02 0.69 0.03 Tarsier - - - - - - - 0.05 0.80 - - Tufted ground squirrel - 0.05 0.70 - - - - - - - - White-fronted langur - 0.10 0.60 - - - - - - - - Yellow-throated Marten 0.23 0.03 0.17 0.10 0.19 0.20 0.16 0.50 0.21 0.50 - - 771
36

APPENDIX 3 772
Independent Variables Categories Marital status Yes, No, Widowed Education SD, SMP, SMA, D1, D3, S1, STM Employment Unclear, Private, State, Housewife, Farmer,
Teacher, Retired, Boat maker, Driver, Shop owner, Miner, Unemployed, Student
Ethnicity Unclear, Dayak, Javanese, Banjar, Bugis, Flores, Sulteng, Balinese, Toraja, Timur, Buthon, Sangir, Gorontalo, Batak
Religion Muslim, Protestant, Catholic, Kaharingan, Budhist
Frequency visiting the forest Never, Hardly ever, Every week, Every month, Irregular, Daily
Purpose of forest visit None, Shortcut, Stroll, Medicinal plants, Fishing, Hunting, Rotan/bambu, Live animals, Check land, Firewood, Fruit, Damar, Guide researchers/guests, Seedlings for crop, Survey for coal company, Vegetables
Most feared animal in the forest Nothing, Crocodile, Sun bear, Clouded leopard, Orangutan, Python, Pig-tailed macaque, Tiger, All, Other
What will happen if there is no more forest More fires, More floods, More insects, Less problems with animals, More landslides, More pollution, Less clean water, Don't know, Animals leave the forest, Turn into plantation, Increased temperature, Tame the animals, Loss of plant material (firewood, medicinal plants and fruits), Extinction of animals, More difficult to hunt and fish
773
774
775
776
37