Mechanics of the Mammalian Cochlea
48
Mechanics of the Mammalian Cochlea LUIS ROBLES AND MARIO A. RUGGERO Instituto de Ciencias Biome ´dicas, Facultad de Medicina, Programa Disciplinario de Fisiologı ´a y Biofı ´sica, Universidad de Chile, Santiago, Chile; and Institute for Neuroscience and Hugh Knowles Center, Department of Communication Sciences and Disorders, Northwestern University, Evanston, Illinois I. Introduction 1306 A. Scope of the review 1306 B. Anatomical and functional setting 1306 C. Historical highlights 1307 II. In Vivo Basilar Membrane Mechanics at the Base of the Cochlea 1308 A. Responses to single tones 1308 B. Responses to broadband stimuli 1313 III. In Vivo Mechanics at the Apex of the Cochlea 1315 A. Responses to single tones 1315 B. Responses to clicks 1317 IV. Cochlear Vibrations as a Function of Longitudinal Position 1317 A. Mapping of CF upon cochlear location 1317 B. Response magnitudes 1318 C. Response phases 1319 V. Cochlear Traveling Waves 1319 A. Fast and slow cochlear traveling waves 1319 B. Stiffness of the cochlear partition 1321 C. Pressure waves in the cochlear fluids 1322 D. Questioning the existence of cochlear traveling waves 1323 VI. Micromechanics 1324 A. In vivo micromechanics 1324 B. Responses to sound in excised cochleae 1325 VII. Two-Tone Interactions 1326 A. Two-tone suppression 1326 B. Intermodulation distortion 1329 VIII. The Mechanical Origin of Cochlear Frequency Filtering 1331 A. BM vibration at neural threshold 1331 B. The “second filter” 1332 C. Frequency tuning at the BM and in auditory nerve fibers 1332 IX. Evidence for Electromechanical Positive Feedback in Cochlear Mechanics 1333 A. Mechanical feedback from the organ of Corti and amplification 1333 B. Lability of cochlear mechanical responses to sound 1334 C. Efferent control of BM vibration 1337 D. Reverse transduction: mechanical effects of electrical currents 1337 E. Origin of compression and other BM nonlinearities 1338 X. The “Cochlear Amplifier” 1339 A. Are cochlear vibrations really amplified? 1339 B. Gain of the cochlear amplifier 1339 C. Location of the cochlear amplifier 1340 D. Cellular basis of the cochlear amplifier 1341 E. Amplification and the origin of frequency specificity 1342 XI. Conclusions 1342 XII. Appendix: Methods for Measuring Cochlear Vibrations 1343 A. Mo ¨ ssbauer technique 1343 B. Capacitive probe 1343 C. Optical methods 1343 PHYSIOLOGICAL REVIEWS Vol. 81, No. 3, July 2001 Printed in U.S.A. http://physrev.physiology.org 1305 0031-9333/01 $15.00 Copyright © 2001 the American Physiological Society
-
Upload
independent -
Category
Documents
-
view
1 -
download
0
Transcript of Mechanics of the Mammalian Cochlea

Mechanics of the Mammalian Cochlea
LUIS ROBLES AND MARIO A. RUGGERO
Instituto de Ciencias Biomedicas, Facultad de Medicina, Programa Disciplinario de Fisiologıa y Biofısica,
Universidad de Chile, Santiago, Chile; and Institute for Neuroscience and Hugh Knowles Center,
Department of Communication Sciences and Disorders, Northwestern University, Evanston, Illinois
I. Introduction 1306A. Scope of the review 1306B. Anatomical and functional setting 1306C. Historical highlights 1307
II. In Vivo Basilar Membrane Mechanics at the Base of the Cochlea 1308A. Responses to single tones 1308B. Responses to broadband stimuli 1313
III. In Vivo Mechanics at the Apex of the Cochlea 1315A. Responses to single tones 1315B. Responses to clicks 1317
IV. Cochlear Vibrations as a Function of Longitudinal Position 1317A. Mapping of CF upon cochlear location 1317B. Response magnitudes 1318C. Response phases 1319
V. Cochlear Traveling Waves 1319A. Fast and slow cochlear traveling waves 1319B. Stiffness of the cochlear partition 1321C. Pressure waves in the cochlear fluids 1322D. Questioning the existence of cochlear traveling waves 1323
VI. Micromechanics 1324A. In vivo micromechanics 1324B. Responses to sound in excised cochleae 1325
VII. Two-Tone Interactions 1326A. Two-tone suppression 1326B. Intermodulation distortion 1329
VIII. The Mechanical Origin of Cochlear Frequency Filtering 1331A. BM vibration at neural threshold 1331B. The “second filter” 1332C. Frequency tuning at the BM and in auditory nerve fibers 1332
IX. Evidence for Electromechanical Positive Feedback in Cochlear Mechanics 1333A. Mechanical feedback from the organ of Corti and amplification 1333B. Lability of cochlear mechanical responses to sound 1334C. Efferent control of BM vibration 1337D. Reverse transduction: mechanical effects of electrical currents 1337E. Origin of compression and other BM nonlinearities 1338
X. The “Cochlear Amplifier” 1339A. Are cochlear vibrations really amplified? 1339B. Gain of the cochlear amplifier 1339C. Location of the cochlear amplifier 1340D. Cellular basis of the cochlear amplifier 1341E. Amplification and the origin of frequency specificity 1342
XI. Conclusions 1342XII. Appendix: Methods for Measuring Cochlear Vibrations 1343
A. Mossbauer technique 1343B. Capacitive probe 1343C. Optical methods 1343
PHYSIOLOGICAL REVIEWS
Vol. 81, No. 3, July 2001Printed in U.S.A.
http://physrev.physiology.org 13050031-9333/01 $15.00 Copyright © 2001 the American Physiological Society
Robles, Luis, and Mario A. Ruggero. Mechanics of the Mammalian Cochlea. Physiol Rev 81: 1305–1352, 2001.—Inmammals, environmental sounds stimulate the auditory receptor, the cochlea, via vibrations of the stapes, theinnermost of the middle ear ossicles. These vibrations produce displacement waves that travel on the elongated andspirally wound basilar membrane (BM). As they travel, waves grow in amplitude, reaching a maximum and thendying out. The location of maximum BM motion is a function of stimulus frequency, with high-frequency waves beinglocalized to the “base” of the cochlea (near the stapes) and low-frequency waves approaching the “apex” of thecochlea. Thus each cochlear site has a characteristic frequency (CF), to which it responds maximally. BM vibrationsproduce motion of hair cell stereocilia, which gates stereociliar transduction channels leading to the generation ofhair cell receptor potentials and the excitation of afferent auditory nerve fibers. At the base of the cochlea, BMmotion exhibits a CF-specific and level-dependent compressive nonlinearity such that responses to low-level,near-CF stimuli are sensitive and sharply frequency-tuned and responses to intense stimuli are insensitive and poorlytuned. The high sensitivity and sharp-frequency tuning, as well as compression and other nonlinearities (two-tonesuppression and intermodulation distortion), are highly labile, indicating the presence in normal cochleae of apositive feedback from the organ of Corti, the “cochlear amplifier.” This mechanism involves forces generated by theouter hair cells and controlled, directly or indirectly, by their transduction currents. At the apex of the cochlea,nonlinearities appear to be less prominent than at the base, perhaps implying that the cochlear amplifier plays alesser role in determining apical mechanical responses to sound. Whether at the base or the apex, the properties ofBM vibration adequately account for most frequency-specific properties of the responses to sound of auditory nervefibers.
I. INTRODUCTION
A. Scope of the Review
The present review, updating one by Patuzzi andRobertson (273), focuses on the mechanical processesleading to the stimulation of the inner hair cells of themammalian cochlea, i.e., the vibrations of the basilarmembrane (BM), the organ of Corti, and the tectorialmembrane (TM). Otoacoustic emissions (for reviews, seeRefs. 285, 362) are discussed only to the extent that theyshed direct light on cochlear vibrations. Mathematicalmodels of cochlear mechanics (for reviews, see Refs. 80,81, 152) are mentioned, but rather selectively. The readermay want to consult two recent reviews that cover muchthe same ground as the present one, but from differentperspectives. One (271) is especially useful because itprovides theoretical contexts for many of the empiricalfindings, especially those dealing with micromechanics.The other (379) holds views, notably of experiments inexcised cochleae, that clash strongly with our own.
B. Anatomical and Functional Setting
The auditory system of mammals is a marvelousachievement of biological evolution, capable of detectingand analyzing sounds over wide ranges of spectral fre-quency and intensity. Humans can hear sounds with fre-quencies over the range 20 Hz to 20 kHz, and somemammals can perceive frequencies beyond 100 kHz.Mammalian auditory systems also possess great sensitiv-ity and respond to sounds over an intensity range span-ning 12 orders of magnitude or 120 decibels. Such strikingperformance is largely determined by mechanical and
biophysical processes in the cochlea, the peripheral organof hearing of mammals.
The cochlea consists of three adjacent membranoustubes coiled in the form of a snail (hence its name; seeFig. 1) and enclosed by a bony shell, the otic capsule (Fora review of cochlear structure, see Ref. 365). Two of thetubes, the scalae vestibuli and tympani, are filled withperilymph, a liquid whose ionic composition resemblesthat of other extracellular fluids. At the base of the ap-proximately conical otic capsule, two membrane-coveredwindows open into the middle ear: the oval window inscala vestibuli, against which abuts the footplate of thestapes, the innermost of the three middle ear ossicles, andthe round window in scala tympani. Between scala ves-tibuli and scala tympani is the scala media, which endsblindly near the “apex” of the otic capsule, allowing scalavestibuli and scala tympani to communicate (at the heli-cotrema). Scala media contains the organ of Corti, wherethe inner and outer hair cells transduce mechanical vibra-tions into electrical signals, endolymph, a fluid of unusualcomposition (with a high potassium concentration) sus-taining a large positive electrical potential, and the TM,overlying the hair cells. The organ of Corti rests on theBM, which separates scala media from scala tympani. Thelength of the BM in mammals is positively correlated withbody weight (e.g., 7, 18, 20, 21, 25, 34, 60, and 100 mm,respectively, in mouse, chinchilla, guinea pig, squirrelmonkey, cat, human, elephant, and some whales) (206)and considerably greater than in reptiles or birds of com-parable size (221).
Pressure waves reaching the eardrum are transmit-ted via vibrations of the middle ear ossicles to the ovalwindow at the base of the cochlea, where they createpressure differences between scala tympani and the otherscalae, thus displacing the BM in a transverse direction.
1306 LUIS ROBLES AND MARIO A. RUGGERO Volume 81

BM vibration causes shearing between the reticular lam-ina at the top of the organ of Corti and the TM, tilting thestereocilia that protrude from the outer hair cells. In thecase of inner hair cells, whose stereocilia may not be
firmly attached to the TM, stereocilia may be displaced byfriction against the endolymphatic fluid. Tilting of thestereocilia, in turn, gates cationic channels located intheir tips. Aided by the endolymphatic (or endocochlear)potential, the modulation of hair cell conductances pro-duces transduction currents and receptor potentials inthe hair cells (for reviews, see Refs. 64, 149, 153, 282, 409).Depolarizing receptor potentials in inner hair cells lead tothe generation of action potentials in type I auditory nervefibers, which constitute the vast majority (95%) of audi-tory nerve afferents and carry to the brain the bulk of theacoustic information processed by the cochlea.
C. Historical Highlights
The first measurements of the vibrational response tosound of the BM were carried out by Georg von Bekesy(391), for which he was awarded the 1961 Nobel Prize forPhysiology or Medicine. Working principally in the ears ofhuman cadavers, Bekesy showed that the cochlea per-forms a kind of spatial Fourier analysis, mapping frequen-cies upon longitudinal position along the BM. He de-scribed a displacement wave that travels on the BM frombase to apex of the cochlea at speeds much slower thanthat of sound in water. As it propagates, the travelingwave grows in amplitude, reaches a maximum, and thendecays. The location of the maximum is a function ofstimulus frequency: high-frequency vibrations reach apeak near the base of the cochlea, whereas low-frequencywaves travel all the way to the cochlear apex.
A turning point in the understanding of cochlearmechanics came in 1971 when Rhode (293) demonstratedthat BM vibrations in live squirrel monkeys exhibit acompressive nonlinearity, growing in magnitude as afunction of stimulus intensity at a rate of ,1 dB/dB.Rhode also showed that the nonlinearity was frequencyspecific, being demonstrable only at or near the charac-teristic frequency (CF, the frequency to which the BM siteis most sensitive) and that it was labile, disappearing afterdeath. Rhode’s discoveries had to wait longer than adecade for confirmation and extension (205, 307, 355),after several unsuccessful attempts (for review, see Ref.297). However, by the time the confirmatory BM experi-ments were published, the existence of nonlinear andactive cochlear processes consistent with Rhode’s pio-neering findings had received unexpected but influentialsupport from Kemp’s discovery of otoacoustic emissions,sounds emitted by the cochlea which grow at compres-sive rates with stimulus intensity (174). Kemp immedi-ately revived Gold’s prescient arguments (121) on theneed for a positive electromechanical feedback to boostBM vibrations to compensate for the viscous dampingexerted by the cochlear fluids. A few years later, a possi-ble origin for both otoacoustic emissions and the hypo-
FIG. 1. Sites of measurement of mechanical vibrations in mamma-lian cochleae. A: a schematic cross section of the guinea pig cochlea,indicating approaches to basilar membrane (BM) locations at the co-chlear base, via an opening into scala tympani (ST), and to structures atthe cochlear apex, via an opening into scala vestibuli (SV). The record-ing sites are also indicated in B, a diagram of the organ of Corti, the BM,and the TM. The numbers in A indicate the four cochlear turns. HC,Hensen’s cells; IHC, inner hair cell; L, spiral limbus; OHC, outer haircells; OSL, osseous spiral lamina; RM, Reissner’s membrane; SL, spiralligament; TM, tectorial membrane. [From Cooper (44), with permissionfrom Elsevier Science.]
July 2001 MECHANICS OF THE MAMMALIAN COCHLEA 1307

thetical electromechanical feedback was identified byBrownell et al. (21), who showed that outer hair cellschange their length under electrical stimulation.
II. IN VIVO BASILAR MEMBRANE MECHANICS
AT THE BASE OF THE COCHLEA
Most of our knowledge of mechanics in normal innerears is based on observations of BM motion at basal sitesof the cochleae of guinea pigs, chinchillas, squirrel mon-keys, and cats. Studies of BM vibrations at the base of thecochlea have now reached consensus on many issues,including how to judge the quality of recordings, regard-less of species or precise CF. The situation is quite differ-ent with regard to in vivo studies of mechanical responsesat the apex of the cochlea, with studies in chinchilla andguinea pig having yielded contradictory verdicts regard-ing several fundamental issues. Nevertheless, there is nowsufficient evidence to conclude that responses at the apexof the cochlea differ at least quantitatively from those atthe base. Accordingly, in vivo responses to “basic” stimuli(tones, clicks, and noise) of sites at the base and apex ofthe cochlea are described in sections II and III, respec-tively, of this review.
All techniques for measuring cochlear vibrations re-quire a relatively unobstructed view of the site of mea-surement (see sect. XII). At basal locations, the BM can bereached directly via scala tympani, but the organ of Cortiand the TM are inaccessible (Fig. 1). At the “hook” regionof the cochlea (within 2 mm of the stapes), the BM isapproached by way of the round window (41, 47, 179,243). Slightly more apical locations (e.g., 3–4 mm fromthe stapes) are reached after perforating the otic capsule(43, 307, 355). An even more apical BM location (;8–9mm from the stapes) in the squirrel monkey cochlea (293,306) was reached from inside the posterior cranial fossaafter removal of cerebral tissue and perforation of thetemporal bone near the internal auditory meatus (thecentral exit of the auditory nerve).
A. Responses to Single Tones
1. Input/output functions
Figure 2 illustrates velocity-intensity functions forBM responses to tones recorded at a site of the chinchillacochlea located 3.5 mm from the oval window (326). Incontrast to the linear growth of responses to tones withhigher or lower frequencies, responses to stimuli withfrequencies near CF (10 kHz) exhibit highly compressivegrowth, i.e., response magnitude grows by only 28 dB asstimulus intensity increases by 96 dB. Compression ismost prominent at moderate and high levels, with averagerates of growth as low as 0.2 dB/dB at CF (measured for
intensities between 40 and 90 dB SPL; i.e., sound pressurelevel referenced to 20 mPascals) and even lower rates atfrequencies immediately above CF. The input/outputfunctions for responses to CF tones at basal BM sites inguinea pig and cat resemble those in chinchilla (Fig. 3).Rates of growth for responses to CF tones measured inseveral studies are collected in Table 1.
Early measurements of BM vibrations using theMossbauer technique (see sect. XII) suggested, but did notestablish conclusively, that responses to CF tones growlinearly at low stimulus intensities (307, 355). Newer mea-surements using optical techniques have provided confir-mation (47, 237, 259, 326). Theoretical considerations sug-gest that input-output functions should also be linear atsufficiently high stimulus intensities (123, 164, 251, 279,408). Indeed, the literature includes CF input-outputcurves in which compression decreases systematicallyabove 80 dB SPL and slopes approach linearity at 90–100dB SPL (272, 300, 322, 324, 332). In contrast, other reports
FIG. 2. Velocity-intensity functions of BM responses to tones. A:responses to tones with frequency equal to and lower than characteristicfrequency (CF; 10 kHz). B: responses to tones with frequency equal toand higher than CF. The straight dotted lines (bottom right in eachpanel) have linear slopes (1 dB/dB). Recordings were made at a site ofchinchilla cochlea situated some 3.5 mm from its basal end. [FromRuggero et al. (326). Copyright, Acoustical Society of America, 1997.]
1308 LUIS ROBLES AND MARIO A. RUGGERO Volume 81

(43, 259, 326) indicate that highly compressive growth ismaintained essentially undiminished up to intensities ashigh as 100 dB SPL (e.g., Fig. 3). Complicating this issue isthe fact that cochlear damage linearizes input-output BMfunctions (see sect. IXB1) and therefore the occasionallyreported full linearization of input-output curves at highstimulus levels may reflect cochlear damage (326). Onbalance, it seems that although compression may be less-ened in healthy cochleae above 80 dB SPL, full lineariza-tion occurs at levels .100 dB SPL, at which stimulationfor longer than a few minutes is likely to result in perma-nent cochlear damage.
2. Isointensity functions
The variation of BM velocity as a function of stimulusfrequency and intensity is depicted in Figure 4 as a familyof isointensity functions (replotted from the data of Fig.2). At low stimulus levels, the isointensity curves aresharply frequency tuned, with steep slopes arrangedroughly symmetrically on both sides of CF. At higherstimulus levels, isointensity curves retain a steep high-frequency slope near CF but become more broadly tunedand increasingly asymmetrical as the peak responses shifttoward lower frequencies. The response roll-off stops at afrequency about one-third octave higher than CF; athigher frequencies, response magnitude is relatively con-stant, i.e., it reaches a plateau, evident in responses tointense (70–90 dB) tones (Fig. 4).
3. Sensitivity functions and BM/stapes
magnitude ratios
Figure 5 shows curves of BM sensitivity (displace-ment per unit of stimulus pressure) as a function of
frequency for basal sites of the chinchilla and guinea pigcochleae. If responses grew linearly, the sensitivity curvesmeasured at different intensities would be identical. Infact, sensitivity grows systematically larger as a functionof decreasing stimulus level at frequencies near CF so thatthe curves superimpose only at frequencies well removedfrom CF (i.e., frequencies lower than 0.7 CF or in theplateau region above CF).
The compressive nonlinearity is strongly dependenton stimulus frequency. As a result, both the bandwidth (orthe sharpness of tuning) and the peak (or best) frequencyof the sensitivity functions change as a function of stim-ulus level. At the highest stimulus levels, responses reachtheir maxima at frequencies about one-half octave lowerthan at the lowest stimulus levels and the sharpness oftuning decreases (e.g., from a Q10 of 5 at 10 dB to only 1.4at 90 dB SPL for the chinchilla data of Fig. 5). (Q10 equalsthe frequency of the response peak divided by the band-width 10 dB below the peak.)
Normalizing BM sensitivity functions to stapes orincus motion yields estimates of cochlear gain as a func-tion of stimulus frequency, permitting an assessment ofcochlear contributions to frequency tuning in isolationfrom middle ear inputs. Figure 6 compares maximal co-chlear gains (i.e., computed for low-level stimuli), as afunction of frequency, for basal sites of the cochleae ofcat, guinea pig, and chinchilla. (Also shown are curves foran apical site in chinchilla, to be discussed in sect. III.) AtCF, the peak magnitudes of BM vibrations far exceedthose of the middle ear ossicles, with cochlear gainsranging from 47 to 75 dB. At frequencies well below CF,BM vibration at basal cochlear sites exhibit slopes of ;6dB/octave relative to stapes motion. This is as expectedon the following assumptions, which apply to the relevantrange of stimulus frequencies, from ;200 Hz to severalkiloHertz in chinchilla (59, 73, 216, 328, 424): stapes ve-locity gain (re SPL) is roughly constant with respect tostimulus frequency; cochlear input impedance is real (orresistive) so that pressure in scala vestibuli near the sta-pes is proportional to stapes velocity (and greater than inscala tympani); BM displacement is proportional to thelocal pressure difference across the “cochlear partition”(the organ of Corti and the BM).1
1 The assumption that cochlear input impedance is resistive prob-ably does not apply to responses of the chinchilla and cat cochleae tostimulus frequencies ,200 Hz. The helicotrema is especially large in thecochleae of cat and chinchilla so that low-frequency pressure waves areprobably shunted between scala vestibuli and scala tympani more ef-fectively than in the cochleae of other species, causing reduced pressuredifference across the cochlear partition (58). Accordingly, BM responsesat the base of the cochleae of cat and chinchilla (as well as theircorrelate, cochlear microphonics recorded at the round window) havemagnitudes that grow at a rate of ;12 dB/octave and phases that leadstapes displacement by 180 degrees (58, 330, 331).
FIG. 3. Displacement-intensity functions for BM responses to CFtones recorded at basal cochlear sites in chinchilla, guinea pig, and cat.For comparison, the dotted line indicates linear growth. [Chinchilla data(squares) from Ruggero et al. (326); guinea pig data (solid and opencircles) from Nuttal and Dolan (259) and Cooper (43), respectively; catdata (diamonds) from Cooper and Rhode (47).]
July 2001 MECHANICS OF THE MAMMALIAN COCHLEA 1309

4. Phases of BM responses to tones
Because the filter characteristics of the cochlea aredistributed over space, wave propagation from base toapex (see sect. v) involves “pure” (i.e., frequency indepen-dent) delays as well as “filter” delays that vary with fre-quency. As a consequence of these delays, BM responsesto tones exhibit increasing phase lag as a function ofincreasing frequency. Figure 7 displays the phases of BMvibrations, relative to middle ear motion, at basal cochlearsites of squirrel monkey, chinchilla, guinea pig, and cat.Most of the phase versus frequency curves are character-ized by a shallow segment at low frequencies and a steepsegment at frequencies around CF. The exception is thecurve for the squirrel monkey site with CF 5 6 kHz, witha low-frequency segment nearly as steep as the segment in
the neighborhood of CF. At low frequencies, BM re-sponses typically lead middle ear vibration by ;90 de-grees. This phase lead and the 6-dB/octave slope of BMmagnitude gain relative to the middle ear (see sect. IIA3)indicate that BM displacements are proportional to stapesvelocity, consistent with the idea that cochlear input im-pedance is resistive (real) (424) (see footnote 1).
The slopes of the phase versus frequency curves aresteepest just above CF. Because the slope of the phasecurve can be interpreted as the (group) delay interveningbetween the launching of a wave near the stapes and itsarrival at the measuring site, the increase in phase slopewith frequency indicates that waves of higher frequencypropagate more slowly than those of lower frequency.The phase-lag accumulation at CF, 1–2.5 periods, is not
TABLE 1. Sensitivity, nonlinearity, and frequency tuning of basilar membrane responses to tones
at basal sites of the cochlea
SpeciesCF,kHz
MaximalDisplacementSensitivity atCF, mm/Pa
MaximalVelocity
Sensitivityat CF,
mm z s21 zPa21
Velocity andDisplacement at
CF NeuralThreshold
LinearGrowthat CF,
dB SPL
GrowthRate at
CF, dB/dB(SPL
Range)
Sensitivityat CF, Low
Re HighSPL, dB
Sensitivityat CF,
PremortemRe
Postmortem,dB
PeakDisplacement
Sensitivity,Low Re High
SPL, dB
BM/MEMaximumGain, dB Q10
ReferenceNos.
Chinchilla 8–9 (11–19)a 560–1,000 (100 mm/s 0.3–0.5 ;50 .52 75c 5–6 3071.9 nm)b (20–80)
9–10 (8.4–31)a 500–1,750 (50 mm/s ,20 0.2–0.5 56–69 54–69 29–46 73–78 6–7 3261 nm)b (40–90) (60–81)e (35–58)e
high spont.activity
9–9.5 (12–31)a 690–1,840 15 mm/s ;5 2440.26 nm
high spont.activity
164 mm/s2.7 nm
mediumspont. activity
12–14 8–25 (600–1,800)d
160 mm/s2 nm
,0 0.2 45–55 ;32 ;79 ;5 300
15 40 ;19 55 ;5 243
Guineapig
16–19 (1.1–3.7)a 100–400 40 mm/s0.35 nm
,30 0.18(30–60)
33 78 ;47–66 9 355, 360
17–18 (5–14)a 600–1,600 34 mm/s ,20 46–57 72 35 11 1640.3 nm
18 (9)a 1,000 ,10 0.23 55 65 74 9 259(20–80)
15–19 2.4 (220)d ,50 0.12 5.5–10 237, 238(50–100)
17 1.4 (150)d 48 31 9 5230 0.18 (34)d 19 19 6 52
Cat 33 0.04 (8)d 200 mm/s ,30 0.4 36 26 48 11 471 nm (40–90)
Squirrelmonkey
6.5–8 (0.13–0.23)a 6–11 0.05–5 mm/s ,60 0.3–0.4 16–38 ;40 15–31 18–42 ;5 293, 294,296, 297
0.01–0.1 nm (.60)
a Between parentheses: displacement sensitivity at CF (mm/Pa) computed from published values of velocity sensitivity at CF (mm z s21 zPa21). b Between parentheses: BM velocities and displacements at CF neural threshold obtained from comparisons with average neural tuningcurves. Other values in column were derived from comparisons with tuning curves of single auditory nerve fibers. c BM/ME gain from Ruggeroet al. (328). d Between parentheses: velocity sensitivity at CF (mm z s21 z Pa21) computed from published values of displacement sensitivity atCF (mm/Pa). e Between parentheses: compensated for surgically induced reduction of sensitivity at CF (6–12 dB).
1310 LUIS ROBLES AND MARIO A. RUGGERO Volume 81
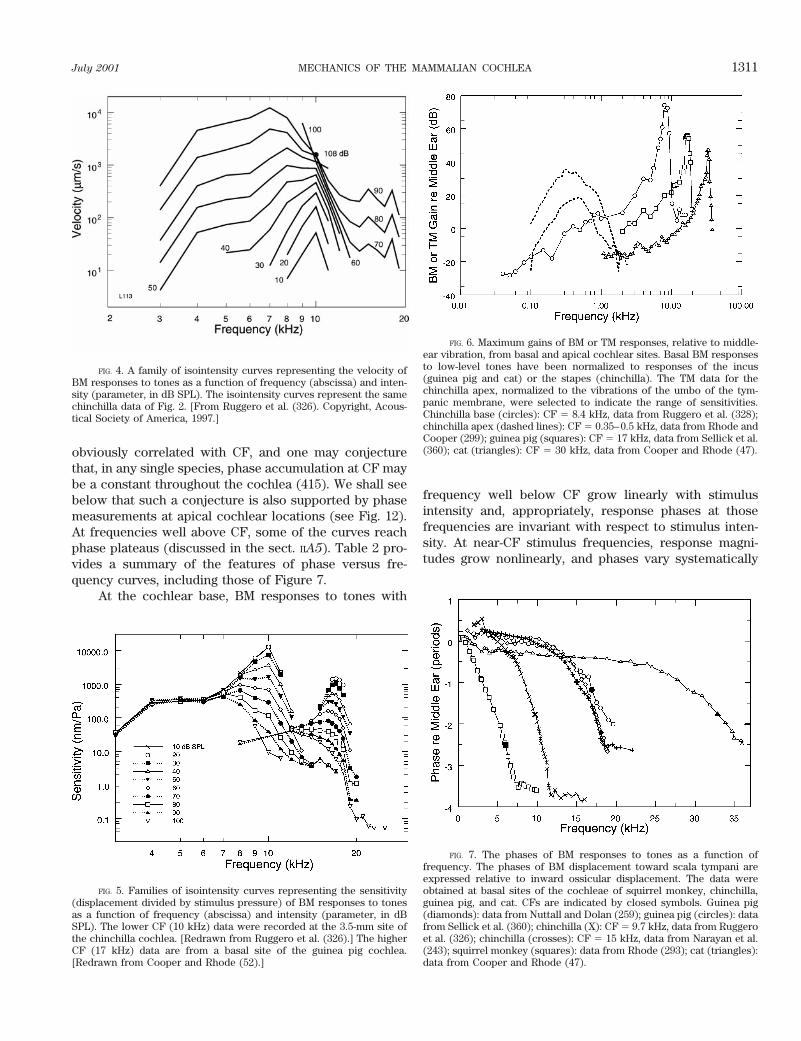
obviously correlated with CF, and one may conjecturethat, in any single species, phase accumulation at CF maybe a constant throughout the cochlea (415). We shall seebelow that such a conjecture is also supported by phasemeasurements at apical cochlear locations (see Fig. 12).At frequencies well above CF, some of the curves reachphase plateaus (discussed in the sect. IIA5). Table 2 pro-vides a summary of the features of phase versus fre-quency curves, including those of Figure 7.
At the cochlear base, BM responses to tones with
frequency well below CF grow linearly with stimulusintensity and, appropriately, response phases at thosefrequencies are invariant with respect to stimulus inten-sity. At near-CF stimulus frequencies, response magni-tudes grow nonlinearly, and phases vary systematically
FIG. 4. A family of isointensity curves representing the velocity ofBM responses to tones as a function of frequency (abscissa) and inten-sity (parameter, in dB SPL). The isointensity curves represent the samechinchilla data of Fig. 2. [From Ruggero et al. (326). Copyright, Acous-tical Society of America, 1997.]
FIG. 5. Families of isointensity curves representing the sensitivity(displacement divided by stimulus pressure) of BM responses to tonesas a function of frequency (abscissa) and intensity (parameter, in dBSPL). The lower CF (10 kHz) data were recorded at the 3.5-mm site ofthe chinchilla cochlea. [Redrawn from Ruggero et al. (326).] The higherCF (17 kHz) data are from a basal site of the guinea pig cochlea.[Redrawn from Cooper and Rhode (52).]
FIG. 6. Maximum gains of BM or TM responses, relative to middle-ear vibration, from basal and apical cochlear sites. Basal BM responsesto low-level tones have been normalized to responses of the incus(guinea pig and cat) or the stapes (chinchilla). The TM data for thechinchilla apex, normalized to the vibrations of the umbo of the tym-panic membrane, were selected to indicate the range of sensitivities.Chinchilla base (circles): CF 5 8.4 kHz, data from Ruggero et al. (328);chinchilla apex (dashed lines): CF 5 0.35–0.5 kHz, data from Rhode andCooper (299); guinea pig (squares): CF 5 17 kHz, data from Sellick et al.(360); cat (triangles): CF 5 30 kHz, data from Cooper and Rhode (47).
FIG. 7. The phases of BM responses to tones as a function offrequency. The phases of BM displacement toward scala tympani areexpressed relative to inward ossicular displacement. The data wereobtained at basal sites of the cochleae of squirrel monkey, chinchilla,guinea pig, and cat. CFs are indicated by closed symbols. Guinea pig(diamonds): data from Nuttall and Dolan (259); guinea pig (circles): datafrom Sellick et al. (360); chinchilla (X): CF 5 9.7 kHz, data from Ruggeroet al. (326); chinchilla (crosses): CF 5 15 kHz, data from Narayan et al.(243); squirrel monkey (squares): data from Rhode (293); cat (triangles):data from Cooper and Rhode (47).
July 2001 MECHANICS OF THE MAMMALIAN COCHLEA 1311

with intensity. This intensity dependence is illustrated inFigure 8, which shows BM response phases in chinchillaand guinea pig normalized to the responses to moderatelyintense stimuli (80 and 74 dB SPL, respectively). Re-sponse phases increasingly lag with intensity for frequen-cies just below CF and lead for frequencies somewhatabove CF, remaining relatively constant at a frequencyclose to CF. This pattern of phase shift with increasingstimulus level, first described in the responses of low-CFauditory nerve fibers (7), has been demonstrated in BMresponses at the base of the cochlea in several species(47, 258, 259, 300, 301, 323, 326, 355). The intensity-depen-dent variation of responses around CF results in system-atic changes of phase slope or group delay as a functionof stimulus level. At the base of the chinchilla cochlea, forexample, group delays around CF decrease from 990 to610 ms as stimulus levels increase from 10 to 90 dB SPL(326). However, the accumulation of phase lag at CF(;1.5 periods, equivalent to a delay of 150 ms) remainsessentially invariant over the same range of intensities.
5. Amplitude and phase plateaus
The sensitivity curves of Figure 5 include high-fre-quency plateaus, within which responses grow linearlyand have sensitivities some 70–90 dB lower than forlow-level stimulation at CF. Similarly, some of the phasecurves in Figure 7 exhibit plateaus in the correspondingfrequency regions. High-frequency plateaus have been ob-served in the cochleae of several species [e.g., curves forsquirrel monkey (squares), chinchilla (crosses and X),and guinea pig (diamonds) in Fig. 7] (47, 243, 259, 293,307, 326, 400, 402). The phase values at the plateaus havebeen variously reported as lagging middle ear vibration by
TABLE 2. Characteristics of phase vs. frequency curves for cochlear mechanical responses to tones
Species(Cochlear Region)
Distance FromBase, mm CF, kHz
Phase Lagat CF,
periods
Low-Frequency Slope Slope Near CFReference
Nos.rad/kHz ms rad/kHz ms
Squirrel monkey(Near middle)
;8.5 7.3 2.5–3 22.51 2400 25.57 20.89 296
Chinchilla(Hook)
1.7 15 0.5–1.5 20.25 240 22.2 20.35 243
Chinchilla(Base)
3.5 9–10 0.9–1.6 21.15 2180 27.5 21.20 326
Chinchilla(Apex)
14 0.4–0.8 0.75 215.7 22.5 299
Guinea pig(Hook)
.1.7 30 ;2 20.1 216 21.9 20.3 47
Guinea pig(Base)
;3.5 17 1.4–1.9 20.29 246 22.1 20.33 360
Guinea pig(Base)
;3.4 18 ;2.2 20.2 232 23.75 20.6 259
Guinea pig(Apex)
16.5 0.4 0.86 215.6 22.5 50
Cat (Hook) 2.5 33 ;1.8 20.09 214 21.3 20.21 47
CF, characteristic frequency.
FIG. 8. Intensity dependence of BM response phases around CF. BMphases in chinchilla (top) or guinea pig (bottom) are expressed relativeto the phases of responses at a single stimulus intensity. Chinchilla datawere normalized to 80 dB SPL and were from Ruggero et al. (326).Guinea pig data were normalized to 74 dB SPL and were from Nuttalland Dolan (258).
1312 LUIS ROBLES AND MARIO A. RUGGERO Volume 81

1.5 periods (165); 3.5, 4, or 4.5 periods (e.g., squares in Fig.7; Refs. 293, 297); 2.5 periods (crosses and diamonds inFig. 7; Refs. 243, 259; also see arrowhead in Fig. 19); 0.25or 1.25 periods (400); 2.3 or 3.3 periods (328); or 3.75periods (X in Fig. 7; Ref. 326). The phase plateaus oftenappear quantized in that, at any given BM site in eachspecies, they occur at discrete values separated by one ormore periods (307, 328, 400) (or, less commonly, 0.5period; Ref. 293) (see also sect. VC and Fig. 15).2
It was once suggested that the plateaus arise fromcochlear damage, including acoustic trauma incurredwhile testing for its presence (133). However, plateauswere subsequently demonstrated in normal cochleae us-ing test stimuli that did not impair normal sensitivity(307). Plateaus do not appear to be instrumental artifacts,since they have been measured at the BM using suchdisparate methodologies as the Mossbauer technique, ca-pacitive probes, and laser velocimetry. In addition, pla-teaus are present in pressure waves recorded in the per-ilymph of scala tympani, near the BM (266, 267) (see Fig.15 and sect. VC). At the apex of the cochlea, plateausappear to be artifacts resulting from opening the oticcapsule over scala vestibuli (50; see sect. IIIC). At the baseof the cochlea, however, it seems unlikely that openingthe otic capsule over scala tympani would have a similareffect, since the round window membrane provides aneffective pressure release even when the otic capsule isintact. Furthermore, plateaus are also evident in pressurerecordings at basal sites of cochleae in which the hydrau-lic seal of the otic capsule was restored after introductionof the microphone into scala tympani (266, 267; see Fig.15 and sect. VC). Interestingly, plateaus are present in BMvibrations but absent from the responses of high-CF au-ditory nerve fibers recorded under identical conditions inthe same cochleae (see Fig. 1B of Ref. 244). In otherwords, BM vibrations at frequencies well above CF seem-ingly are not transmitted to inner hair cells (399). How-ever, magnitude and phase plateaus are apparent in someresponses of auditory nerve fibers as a function of CF(Fig. 10 of Ref. 188).
In conclusion, although BM vibrations at the plateaufrequencies may not participate in determining responsesof auditory nerve fibers, it is clear that the high-frequencyamplitude and phase plateaus are normal features of BMdisplacement waves. By their very nature, which impliesvery high wave velocity, the phase plateaus indicate a
mode of vibration distinct from the “slow” pressure anddisplacement waves that propagate in the cochlear fluidsand on the BM (sect. V). The fixed, frequency-indepen-dent, phase relation between middle ear and BM vibra-tions (and also pressure in scala tympani; see sect. VC )suggests that the plateaus reflect, more or less directly,positive or negative components of stapes motion, trans-mitted as “fast” (acoustic) pressure waves or standingwaves made up by the combination of a sound wave andits reflection (211). If the BM responds resistively to thefast pressure wave, its displacement must be in phase orantiphase with stapes displacement (rather than stapesvelocity) (211), in agreement with many of the reportedphase lags (165, 243, 259, 293, 297) (see footnote 2).
6. Direct-current and harmonic distortion
At the base of the cochlea, BM responses to tonescontain fairly low harmonic distortion (43, 47, 326).Among distortion components, the second harmonic isthe largest (47), attaining levels as high as 3.5% (or 229dB) referred to the fundamental component (43). Har-monic distortion decreases with increasing stimulus leveland with deterioration of cochlear function, an indicationthat harmonics arise as by-products of the mechanismthat enhances cochlear sensitivity at low stimulus levels(43).
Although second-order harmonic distortion might beexpected to be accompanied by direct current (DC) ortonic displacements (since all even-order distortions gen-erate DC distortion), these have been measured at thebase of the cochlea only following severe injury, in re-sponses to very intense stimuli (203, 204). DC displace-ments were sought, but not found, in studies that used adisplacement-sensitive interferometer to measure vibra-tions in near-normal cochleae (47).
B. Responses to Broadband Stimuli
For nonlinear systems, the responses to tones cannotgenerally be used to predict responses to arbitrary stim-uli. Therefore, a thorough understanding of BM behaviorrequires the use of other stimuli, such as tone complexes,noise, and clicks. Clicks are especially useful because,being punctate and wide-band in nature, they permit pre-cise timing of a system’s response while simultaneouslytesting it over a wide range of frequencies. BM responsesto clicks were first recorded in live animals using theMossbauer technique (301, 306). Despite the severe dis-tortion introduced by the Mossbauer recording technique(see sect. XIIA), these early studies revealed responsesexhibiting compressive nonlinearities consistent withthose of responses to tones (293). Those results havebeen confirmed and extended by laser-velocimetry re-cordings in chinchilla and guinea pig (84, 290, 323).
2 If the phase versus frequency curves reflect two componentwaves, one “slow” (the traditional traveling wave) and the other “fast”(an acoustic pressure wave), then the aforementioned quantization ofphase lags at the high-frequency plateaus is more apparent than real,akin to a mathematical artifact. It simply results from the relativemagnitudes of the two vibration components and from the unwrappingof the phases: the phase of the plateau is determined by the accumula-tion of phase (due to the slow component) at the lowest frequency atwhich the fast component is dominant.
July 2001 MECHANICS OF THE MAMMALIAN COCHLEA 1313

Figure 9 shows BM responses to clicks at the 10-kHzsite of the chinchilla cochlea. Responses consist of lightlydamped transient oscillations with latency of ;30 ms(referred to the onset of ossicular motion) and instanta-neous frequency that increases rapidly and settles at CFwithin a few hundreds of microseconds (84, 290). Thefrequency increase is largely impervious to changes instimulus intensity (84, 290) and remains after death (290).Response wave shape and sensitivity change systemati-cally as a function of stimulus intensity. The responses tolow-level clicks have high sensitivity and nearly symmet-rical spindle-shaped envelopes, which reach their maximaroughly 1 ms after the onset of stapes motion. As clicklevel is raised, most cycles of oscillation grow at highlycompressive rates (thus decreasing in sensitivity), but theearliest cycle grows at faster, almost linear, rates. Thisproduces a systematic skewing of the envelopes towardearlier times. Responses to clicks at a basal location ofthe guinea pig cochlea (CF 5 18 kHz; Ref. 84) displaynonlinear behavior similar to that illustrated in Figure 9.
Despite the level-dependent compressive nonlinear-ity, the magnitude and phase spectra of responses toclicks closely resemble the magnitudes (Fig. 10) andphases (data not shown) of responses to tones (290, 323).In other words, the features that characterize steady-stateresponses to tones are also expressed in the brief re-sponses to clicks. This is made possible by the rapiddevelopment of compressive growth, which is detectablewithin 100 ms of the response onset (290). Taking into
account the aforementioned frequency glide, it seems thatcompressive nonlinearity and its correlates, high sensitiv-ity and frequency selectivity, all start nearly as soon as theBM begins to vibrate at CF. It is remarkable that thesealmost instantaneous level-dependent changes in gain areaccomplished while generating relatively low harmonicand intermodulation distortion (see sects. IIA6 and VIIB).For comparison, electronic feedback systems in whichgain is reduced as a function of increasing input magni-tude typically incorporate relatively long time constantsto prevent large harmonic and intermodulation distortion.In the case of the cochlea, harmonic and intermodulationdistortion components appear to be minimized by thesharp frequency filtering that accompanies enhancementof BM responses to low-level stimuli and amplitude com-pression at high stimulus levels.
Many nonlinear systems can be described by analyz-ing their responses to white noise using cross-correlationfunctions (96, 225). The first-order cross-correlation be-tween the noise and the response, the first-order Wienerkernel, is identical to the impulse response in a linearsystem, but it also provides information on odd-ordernonlinearities in the case of nonlinear systems. The sec-ond-order kernel provides information on quadratic andhigher-order even nonlinearities. First-order Wiener ker-nels for BM vibration resemble responses to clicks (84,289). This resemblance, as well as the fact that second-order Wiener kernels are small in magnitude, shows thateven-order nonlinearities contribute little to BM re-sponses to noise at the base of the cochlea (289). This isconsistent with the relative weakness of harmonic distor-tion in BM responses to tones (see sect. IIA6; Refs. 43,47, 326).
FIG. 9. BM responses to rarefaction clicks. The response wave-forms, recorded at a basal site of the chinchilla cochlea, are displayedwith a uniform scale of sensitivity (velocity per unit pressure). The thinvertical line indicates the onset of vibration of the middle-ear ossicles.Positive values indicate velocity toward scala vestibuli. Peak stimuluspressures (in dB/20 mPa) are indicated above each trace. [Data fromRecio et al. (290).]
FIG. 10. BM responses to clicks and tones recorded at the same sitein a chinchilla cochlea. Frequency spectra of BM responses to clicks(dashed and solid lines; peak pressures 24–104 dB) compared with themagnitudes of responses to tones (symbols). The thick solid line indi-cates the spectrum of responses to 104-dB clicks recorded 10–20 minpostmortem. [Adapted from Recio et al. (290).]
1314 LUIS ROBLES AND MARIO A. RUGGERO Volume 81

III. IN VIVO MECHANICS AT THE APEX
OF THE COCHLEA
Mechanical responses to sound at the apex of thecochlea are still poorly understood in part because fewsuch data have been obtained from cochleae that werereasonably free of experimenter-induced damage. Mostmethods for measuring cochlear vibrations require theplacement of artifacts (mirrors, Mossbauer sources) onthe vibrating structures and, therefore, studying the re-sponses of the organ of Corti, the BM, or the TM at theapex (Fig. 1) often entails perforating Reissner’s mem-brane, which alters the endolymph composition and re-duces the endocochlear potential. The scarcity of data hasbeen compounded by a lack of independent controls toassess the physiological state of the preparation. In par-ticular, although compound action potential thresholdsare very useful in testing the overall integrity of functionof high-CF regions of the cochlea, when they have been(exceptionally) used in conjunction with mechanical mea-surements at the cochlear apex (49) they have beenjudged to be very insensitive as an indicator of damage. Inaddition, it is not clear whether compound action poten-tial thresholds provide CF-specific information for co-chlear regions with CFs lower than 500–1,000 Hz (68, 136,166, 413).
A. Responses to Single Tones
1. Response magnitudes
Perhaps the recordings that are most representativeof responses at apical sites in intact cochleae were ob-tained in chinchilla (50, 52, 299). Gold-coated polystyrenebeads, introduced into scala media via small holes inReissner’s membrane, settled on the TM or Claudius cells(which line the scala media surface of the BM; see Fig. 1).When conditions were optimal, substantial compressivenonlinearities (reminiscent of those present in BM vibra-tions at the cochlear base) were demonstrated (50–52,299). Figure 11 (open symbols) displays sensitivity func-tions (isointensity functions normalized to stimulus level)for TM responses to tones at a site of the chinchillacochlea with CF ;500 Hz. Responses grow at mildlycompressive rates (0.5–0.8 dB/dB) so that vibration sen-sitivity increases systematically with decreasing stimulusintensity (by as much as 22 dB between 90 and 30 dBSPL). The region of compressive nonlinearity encom-passes the entire frequency range of responses so thatboth the peak frequency and bandwidth are largely inde-pendent of stimulus level (52, 299). Gains (computedrelative to middle ear ossicular motion) for representativeTM recordings at apical sites of the chinchilla cochlea areshown in Figure 6 (dashed lines) (299).
Several investigations of mechanical vibration in api-
cal regions of guinea pig and squirrel monkey cochleaehave failed to detect compressive nonlinearities compa-rable to those observed in chinchilla (49, 52, 135, 178, 296,413). Especially notable is the absence of nonlinearities inorgan of Corti vibrations measured without rupturing Re-issner’s membrane (177, 178), since under such circum-stances one would expect minimal disruption of normalfunction. A single investigation, however, has described avulnerable expansive nonlinearity at an apical site of theguinea pig cochlea with CF ;300–400 Hz (Fig. 11, solidsymbols) (413). The fact that the expansive nonlinearitydisappeared postmortem (not shown in Fig. 11) suggeststhat this exceptional investigation is the only one that hasmanaged to preserve the apex of the guinea pig cochlea inanything approaching its normal, undisturbed condition.As illustrated in Figure 11 (solid symbols), response mag-nitudes grew almost linearly at frequencies lower thanCF. However, at CF and, especially, at a frequency justhigher than CF, responses grew with stimulus intensity atrates higher than 1 dB/dB, i.e., expansively. In otherwords, for frequencies equal to and just higher than CF,responses became more sensitive as stimulus levels wereraised. This level dependence of response magnitude isthe opposite of the level dependence of responses at theapex of the chinchilla (Fig. 11, open symbols) or at basallocations (Figs. 2–5 and 10).
The mechanical responses of apical sites in guineapig cochleae (Table 3 and Fig. 11) differ from responses inchinchilla in being less sensitive (by 20–30 dB for low-level CF stimuli), regardless of whether responses arelinear (lines without symbols) or nonlinear (solid sym-
FIG. 11. Sensitivity (displacement divided by stimulus pressure) ofresponses to tones at the apex of guinea pig and chinchilla cochleae.Open symbols: chinchilla TM (CF 5 500 Hz), data from Cooper andRhode (52); solid symbols: guinea pig organ of Corti (CF 5 400 Hz), datareplotted from Zinn et al. (413); thick continuous line (no symbols):guinea pig BM (CF ;300 Hz), data replotted from Cooper and Rhode(49); thin lines (no symbols): responses to tones at three intensitiesspaced 10 dB apart, guinea pig organ of Corti (CF ;300 Hz), datareplotted from Khanna and Hao (178).
July 2001 MECHANICS OF THE MAMMALIAN COCHLEA 1315

bols). It is not clear whether this difference in sensitivityreflects differences in species or the locations of therecording sites, ;17 mm from the oval window (CFs 5200–400 Hz) in guinea pig versus 14 mm (CFs 5 400–800Hz) in chinchilla. Despite other differences, apical re-sponses of chinchilla and guinea pig display similar sharp-ness of frequency tuning (Q10 ;0.6–1.3; Fig. 11, Table 3).
2. Response phases
Figure 12 shows the variation of phase as a functionof frequency for TM responses to tones at apical sites ofchinchilla and guinea pig cochleae (42, 49, 50, 299). Thecurves show phase lags (expressed relative to motion ofthe middle ear ossicles) that increase monotonically withalmost constant slope. At CF, the phase accumulationamounts to ;0.8 periods in the cochleae of Figure 12, butlarger phase accumulations (1–1.4 periods), nearly com-parable to those at the base of the cochlea (Fig. 7), havealso been measured at apical sites in other cochleae (50,299). At frequencies lower than 150 Hz, response phases
TABLE 3. Sensitivity and frequency tuning of mechanical responses to tones at apical sites of the cochlea
Species Structure CF, Hz
MaximumDisplacementSensitivity atCF, mm/Pa
MaximumVelocity
Sensitivityat CF,
mm z s21 z Pa21
Gain,Cochlea ReUmbo, dB Q10
Change ofSensitivity atCF, Low Re
High SPLReference
Nos.
In vivochinchilla
Tectorialmembrane
500–800 3–12.5 (12–55)c 18–38 0.7–1.3 10–20 299
500 18 (56)c 0.8 22 52
In vivoguinea pig
Basilarmembranea
200–250 0.4–1.5 (0.63–1.9)c 10–21 0.7 49
Outer hair cellsb 250–300 0.5–0.7 (0.8–1.3)c 0.6–1.1 135Hensen’s cells 350–430 (0.45–1.9)d 1.1–5 0.8–1.1 221f 413
In vitroguinea pigair-filledmiddle ear
Hensen’s andouter hair cells
310–1450 (0.02–0.24)d 0.2–0.6 1.3 131
Hensen’s andouter hair cells
110–216 0.3–0.85 (0.2–1.1)c 0.4–2.9 231
Hensen’s cells 315–1,500 0.002–0.7 0.01–3 230 to 23 0.7–1.6 140
In vitroguinea pigfluid-filledmiddle ear
Hensen’s cells 150–220 0.06–1.1 (0.06–1.2)c 212 to 13 0.8–1.1 157
Basilarmembrane
500–750 0.02–0.06 (0.09–0.28)c 8–17
Hensen’s cells ;600 0.16 (0.6)c 18 0.8 176Hensen’s cells ;150 0.8–1 (0.75)c 0.5–0.8 381Outer hair cells 300–870 45–70e (100–330)c 24
In vitro (DC)guinea pig
Hensen’s andouter hair cells
340–920 6–31e 2.9–12 22
Outer hair cells 300–870 200–1,800e 3–12.5 24
a Data obtained on basilar membrane (49), although most data in this publication were obtained on Reissner’s membrane. b Data obtainedon outer hair cells (135), although most data in this publication were obtained on Reissner’s membrane. c In parentheses, velocity sensitivityat CF (mm z s21 z Pa21) computed from published values of displacement sensitivity at CF (mm/Pa). d In parentheses, displacement sensitivityat CF (mm/Pa) computed from published values of velocity sensitivity at CF (mm z s21 z Pa21). e Values of displacement sensitivity at CF includea correction to compensate for a putative 35-dB loss in stimulus levels due to the middle ear being immersed in fluid. f Maximum decrease insensitivity for low-level stimuli at frequencies above CF.
FIG. 12. Vibration phases at the tectorial membrane (TM) of thecochleae of chinchilla and guinea pig. Displacements toward scala tym-pani (for the “slow” traveling wave) are shown relative to inward dis-placement of the middle ear ossicles. CFs are indicated by closedsymbols. Solid line: chinchilla, at a site ;14 mm from base (CF ;500Hz); reference, umbo. Dashed line: guinea pig, at a site ;16.5 mm frombase (CF ;400 Hz); reference, incus. [Data from Cooper (42).]
1316 LUIS ROBLES AND MARIO A. RUGGERO Volume 81

in chinchilla lead those in guinea pig by nearly 180 de-grees, perhaps partly reflecting differences in the cochlearinput impedance in the two species associated with thedisparate sizes of their helicotremas (58).
At apical sites of chinchilla cochleae that displaycompressive nonlinearity (Fig. 11, open symbols), theresponse phases vary systematically with stimulus level(data not shown), exhibiting leads and lags as a functionof increasing stimulus level for frequencies lower andhigher than CF, respectively (299). At the apex of theguinea pig cochlea, nonlinearity (when it exists) is expan-sive (Fig. 11, solid symbols), but it is also accompanied bylabile changes in response phases with stimulus level(data not shown). However, responses exhibit phaseleads as a function of increasing stimulus level at allfrequencies (413).
3. DC and harmonic distortion
TM vibrations at the apex of the chinchilla cochleaexhibit DC components (299). These are typically tonicdisplacements toward scala vestibuli that accompany al-ternating current (AC) responses within the range of com-pressive growth. The DC displacements (#35 nm in re-sponse to 40- to 80-dB SPL tones) are much smaller thanthe corresponding AC responses.
One study of the apex of the guinea pig cochleareported that, paradoxically, even though organ of Cortivibrations grew at linear rates, they contained enormousharmonic distortion (e.g., second harmonic magnitude ashigh as 50% of the fundamental) for tone frequenciesslightly lower than CF (177). At apical sites of the chin-chilla cochlea, TM responses to tones with frequencylower than CF also exhibit harmonic distortion (299).Although their magnitude was not reported, perusal of thepublished waveforms (299) suggests that harmonic dis-tortion at apical cochlear sites is much lower in chinchillathan in guinea pig (177).
B. Responses to Clicks
Responses to clicks at the third turn of the chinchillacochlea and the fourth turn of the guinea pig cochlea (50)consist of transient oscillations at frequencies corre-sponding to CF. These oscillations, which have a latencyof ;1–1.5 ms relative to the onset of middle ear ossicularvibration, grow at compressive rates in the chinchillathroughout their duration.
In addition to the aforementioned “slow” compo-nents, with latencies of 1–1.5 ms, responses to clicks fromapical turns of chinchilla and guinea pig cochleae includea linear “fast” component with an onset delay of ;20–50ms. This fast wave is believed to be an experimentalartifact (related to the propagation of the sound wave inthe cochlea; see sect. V), since it disappears when the
hydraulic seal of the cochlea is restored (50). Similarly,high-frequency magnitude and phase plateaus becomeless prominent or disappear upon closing the otic capsule.
IV. COCHLEAR VIBRATIONS AS A FUNCTION
OF LONGITUDINAL POSITION
A. Mapping of CF Upon Cochlear Location
As first shown by von Bekesy (388), the systematicmapping of CF upon longitudinal position on the BM is ageneral and fundamental principle of the mechanical pro-cessing of acoustic signals in the cochleae of mammals.Because such “tonotopic” mapping can be demonstratedin vitro, it is clear that spatial frequency analysis arisesfrom the passive mechanical properties of cochlear fluidsand tissues (see sect. VB). The tonotopic cochlear maphas been worked out in some species, such as cat andMongolian gerbil, by measuring the sites of innervation ofauditory nerve fibers of known CF (208, 240). In thesecochleae, as well as in the cochleae of several otherspecies that are known with less precision, the tonotopicmap follows Equation 1
CF 5 A~10ax 2 k!, (1)
where CF is expressed in kHz (127, 128). If x, the distancefrom the apex, is expressed as a proportion of BM length,from 0 to 1, the constant a is the same (2.1) in manycochleae differing widely in length (11.1 to 60 mm), in-cluding those of gerbil, chinchilla, guinea pig, cat, ma-caque monkey, humans, cow, and elephant (127, 129). Theconstant k also varies only slightly in many species (be-tween 0.8 and 1, typically 0.85). This is a remarkableresult, implying that in all these species, where a and k are(nearly) the same, every octave arranged “by rank, fromhighest to lowest in an animal’s frequency range, subtendsthe same proportion of the length of the cochlea” (129).For the basal 75% of the cochlea (i.e., for x . 0.25),Equation 1 describes a simple linear relation between BMposition and the logarithm of CF; for the 25% apicalregion, CF octaves are relatively compressed, occupyingBM lengths shorter than at more basal locations. Theconstant A (0.456 in cat, 0.164 in chinchilla, 0.35 in guineapig; 0.36 in the macaque monkey, and 0.4 in gerbil) deter-mines the range of CFs.
Because the length of the BM tends to be greater inmammals with larger body size (see sect. IB), the actuallength (e.g., in mm) subtended by a particular octave ofCF varies from species to species. Thus, for example, theuppermost octaves represented in the cochleae of cat andgerbil occupy 14% of BM length, which translates to 1.57mm in gerbil and 3.55 mm in cat (129). The corresponding
July 2001 MECHANICS OF THE MAMMALIAN COCHLEA 1317

BM distances are substantially shorter in nonmammalianspecies, which have short BMs (e.g., ;0.6 mm in severalbirds, 0.13 mm in the red-eared turtle, and 1 mm in themonitor lizard) (221). Because, in general, the hearingrange in mammals extends to much higher frequenciesthan in nonmammals (95, 105), it seems reasonable tospeculate that the reptilian ancestors of mammals hadrelatively short basilar papillae and that increased lengthof mammalian cochleae was associated with the evolu-tion of mechanical processes (221), absent (or onlypresent in primitive form) in reptiles, which led to thedevelopment of high-frequency hearing (371) and aconsequent improvement in the ability to localizesounds (227).
B. Response Magnitudes
In addition to the aforementioned compression of CFoctaves near the apex (see sect. IVA), the mechanicalbehavior of the cochlea differs in several other respectsbetween apical and basal regions.
1) BM vibrations are less sharply tuned at the apex ofthe cochlea than at the base (378, 391), regardless ofstimulus level or the physiological state of the cochlea. Inthe chinchilla, for example, responses to intense stimuliof BM sites distant 3.5 and 14 mm from the oval windowhave Q10 values of 1.6 and 0.9, respectively (Fig. 13).
2) Whereas a compressive nonlinearity is a promi-
nent feature of BM vibrations at the base of the cochlea,the presence and/or nature of nonlinearities at apical siteshave not been well established. Some studies have re-ported that apical vibrations are linear (49, 178), othershave demonstrated a relatively weak compressive nonlin-earity (52, 299), and still another has found a weak ex-pansive nonlinearity (413).
3) At the base of the cochlea, compressive nonlinear-ity is confined near CF, and vibrations grow linearly atfrequencies lower than 0.7CF (Fig. 13). In contrast, atapical sites, when a compressive nonlinearity exists (chin-chilla), it extends uniformly throughout the frequencyrange of responses; when an expansive nonlinearity exists(guinea pig), it is prominent only for frequencies higherthan CF (413).
4) At the cochlear base, the strength of the compres-sive nonlinearity and sharpness of tuning are highly cor-related (and perhaps inextricably linked; Figs. 5, 10, 13,19, and 20). At the apex of the chinchilla cochlea, fre-quency tuning is largely independent of stimulus level(Figs. 11 and 13) even in the presence of a compressivenonlinearity (50, 52, 299). At the apex of the guinea pig,however, when an expansive nonlinearity exists, fre-quency tuning is labile and level dependent (413) but to amuch lesser extent than at the base of the cochlea.
5) In chinchilla cochleae, responses to clicks at api-cal sites differ from those at basal sites in that the formergrow at compressive rates throughout their duration,whereas at the base onset oscillations grow linearly. Thisdifference is consistent with the contrasting distributionof compressive nonlinearity as a function of frequency inresponses to tones at both cochlear sites (see point 3
above).Some of the aforementioned differences between BM
responses at the base and the apex are consistent withresults of several studies of auditory nerve fibers. Onestudy derived putative BM input-output functions for CFtones from the responses of auditory nerve fibers, on theassumption that at frequencies well below CF the BM atthe nerve fiber site vibrates linearly (see sect. VIIIA), andfound that the compressive nonlinearity became weakerwith decreasing CF (53). Other studies found that themodulation or suppression exerted by low-frequencytones on auditory nerve fiber responses to CF tones (seesect. VIIA3) grows weaker as a function of decreasing CF(27, 86, 376). All these results on single- and two-tonestimulation could be interpreted as evidence that thestrength of compression diminishes systematically withdecreasing CF or, alternatively, as evidence that at theapex of the cochlea BM responses grow at similarly com-pressive rates at all frequencies. Both interpretations mayturn out to be correct, in light of the contrasting apicalmechanical data from chinchilla and guinea pig (seesect. III).
The base versus apex differences are also consistent
FIG. 13. Comparison of vibration sensitivity (velocity per unit pres-sure) at the base and apex of the chinchilla cochlea. For each family ofcurves, stimulus frequencies are shown normalized to CF (500 Hz and 9kHz). At either site, sensitivity decreases as function of stimulus level. Atthe base of the cochlea, responses to CF tones differ by as much as 56dB as a function of stimulus level; peak sensitivities at the highest andlowest stimulus levels differ by 48 dB. At the apex, the two measures ofthe intensity dependence of sensitivity are the same, 15 dB. The upwardarrows indicate the frequencies of peak sensitivity (BF) for responsesto the highest level tones, which resemble postmortem data. [BasalBM data from Ruggero et al. (326); apical TM data from Cooper andRhode (52).]
1318 LUIS ROBLES AND MARIO A. RUGGERO Volume 81

with the dependence on CF of the effects of furosemideon the responses of auditory nerve fibers (361). Furo-semide elevates the thresholds of high-CF auditory nervefibers at all frequencies, but preferentially at CF. In lightof the effects of furosemide on BM vibration at the base ofthe cochlea (Fig. 20; see sect. IXB3), it is clear that the CFspecificity reflects the reduction of BM vibrations,whereas threshold elevations at other frequencies (andpartially near CF) result from the reduced drive formechanoelectrical transduction in inner hair cells. Inother words, the decrease in endocochlear potential pro-duced by furosemide affects high-CF inner hair cells di-rectly at all frequencies and indirectly (via the outer haircells and BM vibrations) only near CF. In the case oflow-CF fibers, the effects of furosemide are less markedthan for high-CF fibers and are similar at all responsefrequencies. The former finding is consistent with thelesser extent of compressive nonlinearity in the mechan-ical responses to sound at the apex of the cochlea. Thelatter finding agrees with the fact that at the apex thecompressive nonlinearity is nearly evenly distributed overthe entire frequency range of responses (see sect. IIIA1
and Fig. 11). Finally, differences between mechanical re-sponses at the base and apex of the cochlea may underliethe finding that low-frequency hearing thresholds are rel-atively immune to the loss of apical outer hair cells (286).
C. Response Phases
In section IIA4 it was noted that the phase versusfrequency curves of BM responses at basal sites (within 4mm of the stapes) consist of three distinct segments: onewith shallow slope at low frequencies, another with steepslope around CF, and a high-frequency phase plateau (Fig.7). At the apex of the cochlea (Fig. 12), phase versusfrequency curves differ from those at the base mainly inthat there is no distinct separation between the low-frequency and the near-CF segments so that phase accu-mulates at a roughly constant rate. Nevertheless, the ac-cumulation of phase lag at CF is similar at the base (1–2.2periods at the base; Fig. 7, excluding the squirrel monkeydata) and at the apex (0.8–1.4 periods), and in both casesthe curves possess high-frequency plateaus. The squirrelmonkey data for a BM site with CF ;6 kHz, presumablylocated ;9.5 mm (41% of total BM length) from the stapes(128), may represent a region of transition between baseand apex. Low-frequency and near-CF segments are dis-tinguishable in this phase versus frequency curve (Fig. 7),but their slopes do not differ as much as at more basal BMsites, and the phase accumulation at CF (2.5 periods) islarger than at sites closer to the stapes. A maximal phaseaccumulation at CF near the middle of the cochlea hasbeen predicted on theoretical grounds (126). Systematicchanges in phase slope as those noted above have been
observed in cochlear microphonics and in responses ofauditory nerve fibers (281).
Apical responses to tones with frequency lower andhigher than CF exhibit systematic leads and lags, respec-tively, as a function of increasing stimulus intensity inchinchilla (see sect. IIIA2). These level dependencies ofresponse phases are reversed from those that hold bothfor BM vibrations at basal cochlear regions (see sect. IIA4)and for the responses of low-CF auditory nerve fibers (7)as well as low-CF (30, 33, 62) and high-CF (335) inner haircells.
V. COCHLEAR TRAVELING WAVES
A. Fast and Slow Cochlear Traveling Waves
One of von Bekesy’s fundamental contributions toauditory physiology was the discovery of cochlear me-chanical traveling waves, i.e., “slow” displacement wavesthat propagate on the BM from base to apex (391). Al-though strictly speaking sound waves are also travelingwaves, in the context of mammalian cochlear physiology“traveling waves” refers to displacement waves (or pres-sure waves; see sect. VC) that are slower by orders ofmagnitude than ordinary (acoustic) pressure waves,which propagate in the cochlear fluids at speeds of 1,550m/s and traverse the entire cochlea in a few microsec-onds. There has been some confusion regarding what ismeant by a traveling wave. Wever and Lawrence (394)originally rejected the applicability of the term to themammalian cochlea because they thought that the termimplied that energy is transmitted directly from one seg-ment of the BM to another (rather than via the cochlearfluids; see sect. VC). Eventually, however, Wever, Law-rence, and von Bekesy (395) jointly agreed that the pat-terns of motion described by von Bekesy “can be referredto as . . . a traveling wave, provided that . . . nothing isimplied about the underlying causes” (i.e., “how any givensegment of the basilar membrane gets the energy thatmakes it vibrate”).
The traveling-wave displacement patterns that vonBekesy observed on the BM are characterized by threeproperties. 1) Displacements exhibit increasing phaselags as a function of distance from the oval window. At agiven cochlear location, BM responses increasingly lagthe motion of the stapes as a function of stimulus fre-quency, reaching phase accumulations far exceeding the90-degree lag expected from simple resonances. For ex-ample, at the 300-Hz characteristic place of the BM in thehuman temporal bone, von Bekesy measured phase accu-mulations equivalent to about one period at CF. In exper-imental animals, the phase accumulation reaches valuesas high as 4 periods at frequencies higher than CF (Figs.7 and 12). 2) Displacement magnitudes have an asymmet-
July 2001 MECHANICS OF THE MAMMALIAN COCHLEA 1319

rical envelope around the characteristic place, with theapical slope being steeper than the basal slope. At a singlecochlear location, BM displacements are asymmetricallytuned around CF, with the high-frequency slope beingsteeper than the low-frequency slope (211, 399). 3) Trav-eling waves are demonstrable in the absence of normalcellular processes, when cochlear vibrations are entirelylinear, such as in the temporal bones of human cadavers.In other words, traveling waves are manifestations of the“passive” mechanical characteristics (mass, stiffness, anddamping) of cochlear tissues and fluids and constitute thefirst stage of frequency filtering and spatial analysis ofauditory signals.3
A direct demonstration of the traveling wave is ob-tained by measuring the phases of responses to identicalstimuli at closely spaced BM locations (50, 191, 243, 267,293, 300, 338). Detailed measurements using 15-kHz tonesat the base of one guinea pig cochlea (Fig. 14) (338) revealphase lags that accumulate as a function of distance fromthe stapes. Over a range of 1 mm straddling the CF site,the phase accumulation for 35-dB tones amounts to 1.5periods, indicating a wavelength at CF of ;0.67 mm anda wave velocity of 10 m/s, computed according to thefollowing equations
dt 5 df/~2pf ! (2)
wave velocity 5 dx/dt (3)
wavelength 5 2pdx/df (4)
where dt is the travel time, df is the phase differencebetween responses at the two sites (radians), f is thestimulus frequency (Hz), and dx is the distance betweenthe sites.
Wavelengths and wave velocities at CF for cochlearsites in several species are gathered in Table 4. The rela-tion between distance from the oval window and veloci-ties is generally consistent with the slowing down of thetraveling wave as it approaches the cochlear apex. Forany given stimulus frequency, wave velocities are as highas 100 m/s at sites basal to the characteristic place anddecrease rapidly as the wave approaches the characteris-tic site (with CF 5 stimulus frequency) (300). For stimu-lus frequencies close to CF, wave velocities are more thanone order of magnitude greater near the oval window thanat sites close to the apex (e.g., 28 m/s at the 1.7-mm sitevs. 1.55 m/s at the 12.8-mm site in the guinea pig cochlea).
The wavelengths of responses to CF tones also appear tovary as a function of cochlear position, increasing from0.5–0.9 mm near the oval window to 1.2–1.6 mm at apicalsites in the guinea pig and chinchilla cochleae. A some-what different conclusion was reached on the basis of thevariation with CF of the phases of responses of cat audi-tory nerve fibers to near-CF tones: in the CF range 300–2,400 Hz, wavelength was found to be approximately con-stant, 2.2 mm or ;10% of the length of the BM (186).
The finite speed of the traveling wave also causesdelays in the onsets of BM and neural responses to clicksthat grow systematically longer as a function of distancefrom the cochlear base. In the case of the chinchilla, thedelays have been measured directly at basal and apicalcochlear sites, as well as indirectly, from the latencies ofneural responses, throughout the cochlea. The delay be-
3 The phase-locked responses of auditory-nerve fibers in frogsexhibit large phase accumulations (143, 144) comparable to those ofmammalian auditory-nerve fibers (7). Whereas the latter reflect thephase accumulations of a mechanical (BM) traveling wave, the phaseaccumulations in fibers innervating the frog auditory organs, which lackBMs, may result from electrical filtering within hair cells (283).
FIG. 14. Magnitudes and phases of BM responses to 15-kHz tones asfunctions of cochlear longitudinal position (expressed in mm from theapex). Data for BM positions apical to the dotted line were obtainedfrom a single guinea pig, whereas data from more basal sites came fromfour other subjects. [Guinea pig data reprinted from Russell and Nilsen(338). Copyright 1997 National Academy of Sciences, USA.]
1320 LUIS ROBLES AND MARIO A. RUGGERO Volume 81

tween the onset of ossicular motion and BM vibration atthe 3.5-mm site of the chinchilla cochlea (CF 5 9–10 kHz)is 30 ms (289, 290). At the third cochlear turn (14 mm fromthe base: CF 5 ;500 Hz), delays are considerably longer,;1–1.5 ms (50). Appropriately, the response latencies ofauditory nerve fibers in chinchilla (as well as other spe-cies) increase systematically as a function of decreasingCF (184, 187, 314, 364). For rarefaction clicks, latenciesrange from ;1 ms for fibers with CFs higher than 3–4 kHzto ;2.7 ms for fibers with CF of 320 Hz (318, 319, 346).These latencies are entirely consistent with those of BMvibrations, on the assumption that synaptic and neuraldelays account for a constant 1-ms delay (319).
B. Stiffness of the Cochlear Partition
Von Bekesy (391) complemented his observations ofBM vibrations by measuring the stiffness of the cochlearpartition, using two different methods. In one method,“volume” stiffness was inferred by observing the staticdisplacements of Reissner’s membrane as a function of ahydrostatic pressure difference applied between the twosides of the partition. In the other method, the “point”stiffness of the partition was determined by observing thedisplacement caused by pushing a narrow probe onto theBM. Finding that stiffness decreased by 2–4 orders ofmagnitude as a function of distance from the stapes, vonBekesy reasoned that it must be stiffness that principallydetermines CF in the cochlear partition, since other prop-erties of cochlear function do not vary nearly as muchwith longitudinal location. The equations describing thevariation of elasticity and CF as a function of distancehave the same exponential form (see Equation 1), quali-tatively supporting von Bekesy’s contention that CF isdetermined by BM stiffness (127). These equations alsohave similar slopes in each of several species (elephant,human, and guinea pig), a coincidence that when firstnoticed was taken as additional support for CF being
determined by stiffness (127). In hindsight, such interpre-tation seems questionable: since resonance frequency(the frequency at which inertial and elastic reactances areequal and hence impedance is minimal) is determined bythe square root of the stiffness-to-mass ratio, for CF to bedetermined solely by stiffness the slopes of the elasticityversus distance functions should be twice as large asthose of the CF versus distance functions. [Interestingly,von Bekesy’s elasticity and CF data for mouse, rat, andcow do approach such relation (127).]
Following von Bekesy’s lead, most models of co-chlear mechanics have been based on the idea that trav-eling waves are generated by interactions between rela-tively incompressible cochlear fluids and a flexible BM,with CF being determined by the gradation of BM stiff-ness. These models presume that the stiffness of thecochlear partition decreases exponentially with distancefrom the base and that mass is either constant (3, 247,280) or varies only weakly (220). To obtain realistic CF-to-distance maps in which CF changes by more than twodecades between extreme basal and apical cochlear loca-tions, most models set stiffness to vary by 3–5 orders ofmagnitude. It is not clear, however, whether the stiffnessof the cochlear partition actually varies over such wideranges. Extrapolating from measurements that did notfully span the entire cochlear length, von Bekesy (391)estimated base-to-apex ratios of volume stiffness of;10,000 in the cochleae of several species. Other esti-mates of base-to-apex stiffness ratio are much smaller[100 and 1,000, respectively, from measurements of vol-ume and point stiffness in human cochleae (391) and 100from point stiffness measurements in gerbils (242)] andtherefore seemingly inconsistent with CF versus dis-tance maps. It is not clear how these smaller stiffnessratios may be reconciled with the theoretical require-ments. Perhaps the cochlear partition vibrates in acomplex fashion so that CF and stiffness are not simplyrelated (242). Alternatively, the stiffness values ob-
TABLE 4. Characteristics of the traveling wave derived from responses to identical near-CF stimuli
at two or more sites in the cochleae of several species
SpeciesDistance From Base, mm
(Proportion of Total BM Length) CF, kHz Wavelength, mm Velocity, m/s Reference Nos.
Gerbil 1.6 (0.14) 25 0.9 22.5 267Guinea pig 1.7 (0.09) 31 0.9 28 47Guinea pig 4 (0.22) 15 0.67 10 338Guinea pig 5–6.5 (0.27–0.35) 5–9 0.7–1 5–6 191Guinea pig 12.8 (0.69) 1.0 1.55 1.55 50Cat 2.6 (0.1) 31 0.6 19 47Chinchilla 2.6 (0.14) 12 0.5 6 243Chinchilla 2.7 (0.15) 10 0.6 6 300Chinchilla 14 (0.76) 0.62 1.2 0.76 50Squirrel monkey 9 (0.39) 6.5 1.8 12 293
Proportion of total basilar membrane (BM) length refers to distance as a proportion of BM length computed from data in Refs. 128, 129.
July 2001 MECHANICS OF THE MAMMALIAN COCHLEA 1321

tained so far, derived from responses to relatively largeforces, may not reflect the stiffness present in normalcochleae for small-amplitude responses to low-levelstimuli (see below).
Estimates of BM point stiffness at the base of thecochlea (134, 229, 242, 268) have varied over a wide range,exceeding an order of magnitude. The lowest estimates(e.g., 0.2 to 1.1 N/m; Ref. 134), derived from imposed 1–3mm BM deflections, may reflect the low resistance toshear of the ground substance and mesothelial cells of theBM which, being relatively incompressible, may be irrel-evant under more physiological conditions, when BM de-flection is caused by pressure differences across the par-tition (229).4 The stiffness estimates believed to bephysiologically relevant, 2–5 N/m in excised cochlea (229)or 6–11 N/m in vivo (268), were obtained for BM displace-ments as large as 8 mm. One may question the validity ofsuch estimates because they were derived from displace-ments that are orders of magnitude larger than the mag-nitudes of BM responses to acoustic stimuli [e.g., ,10 nmfor CF tones presented at 94 dB SPL (1 Pascal) in Fig. 5].Nevertheless, estimates of volume compliance based onthe point stiffness measurements (;3 3 10214 m4/N) aresimilar to estimates based on independent determinationsof BM displacements and intracochlear pressure underacoustic stimulation (1.8–6.4 3 10214 m4/N; Ref. 328).
The variation among stiffness values reported by dif-ferent studies may partly reflect variations of stiffness asa function of radial position on the BM. Von Bekesy’s invitro observations of the displacements of various struc-tures of the cochlear partition in response to static forcessuggested that the BM is responsible for most of thepartition stiffness (391). He also found that, in response toeither local forces or hydrostatic pressure, displacementsof the BM were largest at central sites and tapered offsmoothly toward its attachments to the spiral lamina andspiral ligament. In basic agreement with von Bekesy’sobservations, in vitro measurements at the base of guineapig cochleae showed that point stiffness varied relativelysimply as a function of radial position, approximately asexpected for a simple beam anchored at the spiral liga-ment and the spiral lamina: the BM was relatively com-pliant near the central region of the pectinate zone, andstiffness increased monotonically with increasing proxim-ity to the spiral lamina or spiral ligament (229). Near thespiral lamina, at the zona arcuata, stiffness was severaltimes higher than in the central region of the BM. A
starkly contrasting result was obtained at the base ofgerbil cochleae: stiffness was several times higher in thezona pectinata than in the zona arcuata (242, 268). Thepattern of stiffness with radial position was also morecomplex in the gerbil: stiffness was ;7 N/m in the centralregion of the pectinate zone, reached a maximum (;11N/m) under the outer pillar cells, and was lowest (1–2N/m) at the arcuate zone (near the spiral lamina, underthe tunnel of Corti). Such variations may imply that thecells of the organ of Corti contribute substantially to theoverall partition stiffness. For example, the feet of theouter pillar cells could provide a fulcrum around whichthe pectinate and arcuate zones of the BM might pivot(see sect. IXD).
C. Pressure Waves in the Cochlear Fluids
Today there is general agreement that the energydelivered to the cochlea by the stapes footplate is trans-ported principally via pressure waves in the cochlearfluids (since the BM exhibits negligible longitudinal cou-pling; Ref. 387). Fluid pressure interacts with the flexibleBM, generating coupled slow waves that travel from baseto apex: a differential pressure wave that propagates inthe cochlear fluids and a displacement wave that propa-gates on the BM. As the slow differential pressure anddisplacement waves approach the BM site with corre-sponding resonance frequency, their group velocity de-creases and their energy is dissipated over a short dis-tance just basal to that site (76, 211).
Pressure has been measured at basal regions of thecochleae of guinea pig (73, 217), cat (60, 245, 246), andMongolian gerbil (266, 267). The earlier studies (in guineapig and cat) reported differential pressure waves whosemagnitudes and phases for stimulus frequencies well be-low CF closely resembled those of BM vibration or co-chlear microphonics but did not find the large phaseaccumulations characteristic of slow traveling waves atfrequencies equal to and higher than CF. These studiesprobably failed to detect slow differential pressure wavesbecause they used microphones placed relatively far fromthe BM.
Theoretical considerations lead to the expectationthat slow pressure waves in the cochlear fluids must beconfined very near the BM at the characteristic place (211,372). This expectation has been confirmed by elegantstudies of E. Olson who observed, for the first time,pressure counterparts of the displacement traveling wave(266, 267). Using a miniature microphone of her owndesign and manufacture, Olson measured pressure inscala vestibuli and in scala tympani at the base of thegerbil cochlea. In scala tympani it was possible to mea-sure pressure as a function of distance between the sen-sor and the BM (Fig. 15). When the microphone was
4 On the basis of its structure, the basilar membrane may bedivided into medial and lateral regions. The medial region (arcuate zone)extends from the osseous spiral lamina to the outer pillar cells. Thelateral region (pectinate zone) extends from the outer pillars to thespiral ligament. The BM is made up of radial fibrils imbedded in abun-dant ground substance, with its tympanic face lined by a single layer of(mesothelial) cells.
1322 LUIS ROBLES AND MARIO A. RUGGERO Volume 81

relatively far from the BM, responses were small, poorlytuned, and exhibited minimal phase lags with increasingstimulus frequency. As the BM was approached within100 mm, scala tympani pressures grew in magnitude, be-came better tuned, and exhibited large phase lags resem-bling those of BM vibrations (Fig. 7). Near the BM, thephase versus frequency curves (Fig. 15, B and D) hadshallow slopes at low frequencies and steep slopesaround CF. Consistent with the existence of phase pla-teaus in BM vibrations (see sect. IIA5 and Fig. 7) and withtheoretical predictions (211), the pressure phase versusfrequency curves also exhibited plateaus at frequencieshigher than CF, in phase with or lagging scala vestibulipressure by one (Fig. 15, B and D) (266) or two (267)periods.
D. Questioning the Existence of Cochlear
Traveling Waves
Von Bekesy (389, 390) maintained that his observa-tions of BM motion implied both the existence of a trav-eling wave and the absence of resonance. His rejection ofresonance was partly based on the observation that press-ing a needle on the surface of the BM causes an almostcircular deformation pattern, implying that longitudinalcoupling is strong, thus preventing resonance. Later stud-ies, however, found that the BM exhibits negligible longi-tudinal coupling (303, 387) (see sect. VIB2). Von Bekesyalso argued against the existence of BM resonance on the
basis of the behavior of hardware models of the cochlea,such as a bank of reeds of graded stiffness, which hebelieved distinguished unambiguously between travelingwaves and resonance, depending on whether the resona-tors (reeds) were coupled or not. It turns out that thedistinction between traveling waves and resonance in thereeds is less absolute than von Bekesy thought (see Fig.12.11a in Ref. 391). Even when the reeds are uncoupled,the bank of resonators sustains rudimentary travelingwaves that propagate from “high-CF” to “low-CF” regions,albeit with symmetrical tuning and with an overall phaseaccumulation of only 180 degrees (399). When the reedsare coupled, reed vibrations become asymmetricallytuned and phase accumulations assume large values (.2periods), much as in the cochlea (399).
After von Bekesy’s rejection of resonance theories ofcochlear mechanics, the pioneering one-dimensionalmathematical model proposed by Zwislocki envisionedthe cochlea as a “pure” traveling-wave system, devoid ofBM resonance (423). Later models, however, beginningwith Peterson and Bogert’s (280) one-dimensional oneand others including two and three dimensions (3, 193,220, 247, 372), have generally been designed to producetraveling waves that also exhibit resonance. According toLighthill (211), all the more successful models, regardlessof whether they simulate the cochlea using one, two, orthree dimensions, describe a specific type of system,namely, “critical layer absorption” (16), in which travelingwaves and resonance coexist. A dissenting opinion has
FIG. 15. Pressure magnitudes (A and C)and phases (B and D) near the BM in scalatympani of a gerbil cochlea. The distancefrom the BM (in mm) is indicated in thelegends of B and D. A and B: in vivo data. C
and D: data recorded immediately postmor-tem. The abscissas indicate stimulus fre-quency. Phases are expressed relative topressure in scala vestibuli. Stimuli were80-dB tones. [Replotted from Olson (266).Copyright, Acoustical Society of America,1998.]
July 2001 MECHANICS OF THE MAMMALIAN COCHLEA 1323

been voiced by Dancer and colleagues (72, 217, 218), whodispute the existence of traveling waves.
Dancer and colleagues (72, 217, 218) have arguedthat, in the absence of “active” processes, BM vibrationsdo not exhibit the substantial accumulations of phase lagat CF that characterize traveling waves (e.g., Fig. 7). Thisargument disregards the fact that large phase accumula-tions (exceeding 2 and 3 periods, respectively) are evidentin vivo in BM vibrations near the apex of guinea pigcochleae even after removal of most of the organ of Corti(49) or in vitro, in excised cochleae (see sect. VIB1),following exposure to glutaraldehyde or dinitrophenol(157). This argument also disregards the fact that deathand other insults to cochlear function at the base of thecochlea typically affect phases minimally or produce sig-nificant phase lags (e.g., Fig. 20; sect. IXB4). Even in theexceptional cases [e.g., Fig. 19 (259); see also Ref. 326] inwhich substantial postmortem phase leads have beendocumented, phase lags were never reduced to valuesinconsistent with the existence of a traveling wave. In theguinea pig data of Figure 19, for example, postmortemphase lag at CF (exceeding 1.5 periods) is actually greaterthan the phase lag measured in vivo at the same cochlearlocation in another guinea pig (see Fig. 7, circles).
The arguments against the existence of travelingwaves (217) were supported by the small phase accumu-lations found in early studies of pressure in the cochlearfluids (73). In fact, however, large phase accumulationswere demonstrated at frequencies near, and especiallyabove, CF (Fig. 15; see sect. VC) when scala tympanipressure measurements were carried out sufficientlyclose to the BM (266, 267). The pressure data of Figure 15also refuted the idea that large phase lags are a product ofactive processes (73), since the large phase lags measuredin vivo (i.e., about one period at the high-frequency pla-teau) were not altered postmortem (compare Fig. 15, B
and D).Another argument against the existence of cochlear
traveling waves hinges on the distinction between filterdelays and “signal-front” delays, both of which may con-tribute to the near-CF (or “weighted-average”) group de-lay (124, 270, 313). In linear systems, “frequency selectiv-ity is obtained at the price of slow response time or,equivalently, long transmission delays” (124): the sharperthe band-pass filtering, the greater the delays. It is inter-esting that a similar correlation also exists in the case ofBM vibrations at any given cochlear site, even thoughthese are nonlinear (117). As discussed in section II, A3
and A4, both the sharpness of frequency filtering and thegroup delay of BM responses around CF decrease system-atically as a function of increasing stimulus intensity(Figs. 5 and 8). In so-called “minimum-phase” linear sys-tems, response phases are completely determined by thefiltering characteristics so that the phase versus frequencyfunction can be accurately computed on the basis of the
magnitude versus frequency function (15, 377). Althoughit is not clear whether the concept of minimum phase isapplicable to a nonlinear system such as the cochlea, onemight argue that if BM responses have the minimum-phase property, then “signal-front” delays (or “traveltime”) must be nil (all delays being solely the result oflocal filtering). It is a matter of dispute whether BMvibrations in normal cochleae display minimum-phase be-havior (82). Some analyses support such behavior (196,415), but others do not (83, 289).
VI. MICROMECHANICS
To a great extent, the focus of cochlear function is todirect mechanical stimulation to the stereocilia of theinner hair cells. Therefore, a reasonably complete under-standing of the mechanics of the cochlea must explainhow the vibrations of the cellular and membranous com-ponents of the cochlear partition result in deflections ofthe inner hair cell stereocilia. Thus it is of immense inter-est to investigate the “micromechanics” of the cochlea,i.e., how various sites of the organ of Corti, the BM, andthe TM move in relation to each other, preferably inindividual ears. Advances in technology are just now be-ginning to permit such measurements.
A. In Vivo Micromechanics
At the base of the cochlea, vibrations at central sitesof the BM are much larger than those at sites near thespiral lamina or the spiral ligament, which support itscentral and peripheral edges (46, 48, 250, 293). This radialprofile of vibration magnitudes reflects the compliance ofthe BM and the relative rigidity of the spiral lamina or thespiral ligament. At the cochlear apex, TM and reticularlamina vibrations are also largest near the center of thecochlear partition (50, 178). Accordingly, the cochlearpartition has been often modeled as a series of indepen-dent slivers, each the analog of a beam anchored at itsends, yielding a relatively simple radial profile of vibrationwith a single maximum near the center of the partition(211, 229, 372). Other models, however, propose that thecochlear partition sustains multiple modes of vibrations(150, 192–195, 220, 233), each of them propagating inde-pendently, and that sites along a radial sliver of the par-tition do not all vibrate in phase. This is not unreasonablegiven the complex architecture of the organ of Corti.
Although electrical stimulation seems to elicit multi-ple vibration modes in the cochlear partition both in vitroand in vivo (sect. IXD), comparable evidence for BM re-sponses to sound is meager. Such evidence includes thefollowing. 1) BM motion may be more sharply tuned nearthe spiral lamina than at more central BM sites (357, 360).2) At the base of the cochlea, notches have been reported
1324 LUIS ROBLES AND MARIO A. RUGGERO Volume 81

in the Fourier spectra of responses to clicks (290) and inisointensity versus frequency functions for responses totones (300). 3) At apical cochlear sites, notches are alsocommon features of isointensity versus frequency func-tions at frequencies near CF (49, 50, 52, 132, 135). Thesenotches are often associated with abrupt phase shifts of;180 degrees, possibly resulting from cancellation be-tween two waves. The notches at apical sites are thoughtto be an artifact of opening the otic capsule, since they areabolished upon restoration of the normal hydraulic seal ofthe cochlea (52). It is unclear whether the notches ob-served at basal BM sites are also artifactual (290, 300).
Convincing evidence for or against the existence ofmultiple modes in BM responses to sound could poten-tially be obtained using sensitive methodology that doesnot require the placement of reflecting beads on the BMand allows laser recordings from many closely spacedlocations in individual cochleae. Using such methodology,one study found a bimodal vibration profile, with ampli-tude maxima flanking a minimum at the foot of the outerpillar cells and response phases exhibiting large phaseshifts (90–180 degrees) as a function of radial position(250). In striking contrast, however, another study usingsimilar methodology found that BM responses closelyresembled those predicted by the beam models: phasesvaried little with radial position and magnitudes exhibiteda single maximum located between the midline of the BMand the feet of the outer pillar cells (46). A third study thatused standard methods, recording from multiple beadsstrewn on the BM, did not find large phase variations orbimodal magnitude profiles as a function of radial posi-tion (300). In conclusion, we are left with the unsatisfac-tory situation that although the complex architecture ofthe organ of Corti and its associated membranes seemswell suited to generate multiple modes of BM motion, andthat these are actually present in electrically evoked mo-tion, clear evidence for multiple modes in BM responsesto sounds is still lacking.
The evidence for the existence of multiple vibrationmodes is more convincing for the stage of signal trans-formation that lies between BM vibration and stimulationof the stereocilia of inner hair cells. The strongest evi-dence comes from recordings of the responses to low-frequency tones of auditory nerve fibers in cats, chinchil-las, and guinea pigs. At stimulus intensities near 90 dB,the responses of auditory nerve fibers undergo large andabrupt phase shifts, approaching 180 degrees, often asso-ciated with prominent harmonic-like distortion and some-times coinciding with notches in rate intensity functions(181, 182, 329, 356). Counterparts of these phenomenaapparently also exist in the receptor potentials of innerhair cells (38, 233). A simple interpretation of these neuraland hair cell data is that they reveal a summation of twomodes of inner hair cell stimulation, reflecting two differ-ent paths of signal transmission from their ultimate origin
at the BM. If the two modes grow at different rates (e.g.,one linearly, the other compressively), one mode woulddominate neural responses below a given intensity (e.g.,90 dB) and the other would control responses at higherintensities. The occasionally observed notches in the rate-intensity functions suggest a mutual cancellation betweenthe two modes. Glimpses of these two modes, and per-haps of as many as two or three others may have beendetected in auditory nerve fiber responses to clicks (212).Finally, some comparisons of frequency tuning in audi-tory nerve fibers and at the BM hint at a “second filter”that attenuates neural responses to stimuli with frequencyboth lower and higher than CF (see sect. VIIIC).
B. Responses to Sound in Excised Cochleae
Mechanical responses to sound at apical cochlearsites have been measured postmortem in isolated guineapig temporal bones (131, 141, 157, 231). These in vitropreparations are useful because they permit relativelyunobstructed access to many structures of the organ ofCorti (380) and therefore can provide crucial informationon the micromechanics of the cochlea which are difficultto obtain from in vivo recordings. However, separation ofthe cochlea from its blood supply renders it severelyanoxic, rapidly and drastically reducing the endocochlearpotential and eventually killing the cells of the organ ofCorti.
1. Vibrations in the “ITER” temporal bone preparation
Many of the in vitro measurements have been per-formed in the ITER preparation, an excised guinea pigtemporal bone in which the middle ear is filled with fluid(22, 24, 157, 172, 176, 381). Measurements in the ITERpreparation have been usually carried out with a laservelocimeter sufficiently sensitive to detect vibrations ofrelatively transparent tissue without using reflecting tar-gets. Thus it was unnecessary to disturb Reissner’s mem-brane to introduce reflectors into scala media. When theimmersion fluid was oxygenated, the excised temporalbone retained residual endocochlear and microphonicpotentials (24, 107, 382).
Studies of cochlear motion using the ITER prepara-tion have generally reported vibrations that grow linearlywith stimulus level (22, 24, 157, 172, 176, 381).5 Frequencytuning at the reticular lamina (Hensen’s cells, outer haircells) in the fourth turn of this preparation resembles thetuning measured at similar locations in living guinea pigs(49, 135, 178). However, at this location in the temporal
5 Exceptionally, CF responses exhibited slightly compressivegrowth rates in two cochleae immersed in oxygenated culture me-dium (382).
July 2001 MECHANICS OF THE MAMMALIAN COCHLEA 1325

bone preparation, the vibrations of the BM are untunedand several hundred times smaller than those of Hensen’scells or outer hair cells (157, 176). This surprising result,whose validity has been recently reasserted (178, 379),has been interpreted as evidence that frequency tuning isan intrinsic property of outer hair cells and that it is theouter hair cells that drive the motion of the BM, ratherthan the other way around (157). In clear contradiction,however, Cooper and Rhode (49) showed that the vibra-tions of the BM at the apex of in vivo cochleae were onlyminimally altered after peeling off the entire organ ofCorti. It is difficult to account for the ITER results. Wewonder whether the “BM” measurements were actuallyobtained from the cochlear bony shell, due to poor reflec-tivity of Claudius cells and the BM, which may resultin underestimating by 10–40 dB the BM vibration ampli-tude (140).
The magnitude of the mechanical responses to soundin the ITER preparation also remains uncertain. Reportedsensitivities at CF have ranged from ;0.06 mm/Pa (157) to;70 mm/Pa (24). These extreme values lie well outsidethe range of in vivo measurements at the same site ofguinea pig cochleae (Table 3). The lowest values mayreflect severe damage caused by excision of the temporalbone. The largest values may be unduly inflated by a35-dB correction intended to compensate for losses instimulus pressure due to the middle ear being immersedin fluid (22–24).6
Responses to sound in the ITER preparation includeDC components with magnitudes and sharpness of tuningmuch greater than those of the AC responses at thefrequency of stimulation (22–24). The sensitivity of theDC component, as high as 200–1,800 mm/Pa, also greatlyexceeds the AC and DC responses measured in vivo at theapex of the chinchilla cochlea (299) (see Table 3 and sect.IIIA). It is questionable whether such enormous DC re-sponses actually exist at the apex of normal cochleae.Rather, it is likely that they represent instrumental orother artifacts (as suggested in Refs. 131, 140, 231).
2. Vibrations in other excised cochlear preparations
DC displacements comparable to those described inthe ITER preparation (22–24) were sought, but not found,at the apex of another isolated guinea pig temporal-bonepreparation (131, 140), which resembles the one used bythe ITER group but with air-filled middle ear (see also Ref.
25). Using this preparation, two studies measured prom-inent radial motion of the TM in responses to eitheracoustic (141) or electrical stimulation (132). However,radial TM motion, which would be consistent with con-jectures that interactions between the TM and the stere-ocilia produce a cochlear resonance additional to that ofthe BM (4, 425, 426), was not found in the ITER prepara-tion (383).
Yet another type of in vitro preparation, the “hemi-cochlea,” is obtained by cutting the cochlea along themid-modiolar plane (303). The hemicochlea preparation,in which fluid pressures are short-circuited, affords theopportunity to study BM vibrations largely in isolationfrom normal hydrodynamics, and therefore almost solelydetermined by the intrinsic mechanical properties of theBM and the organ of Corti. In this abnormal situation,stimulation with a tiny paddle generates waves that prop-agate unidirectionally on the BM, from base to apex, andare tonotopically organized (303). These traveling waves,however, are rudimentary in that they propagate overdistances much shorter than in cochleae in which fluidpressures are not short-circuited. This observation is con-sistent with the idea that the energy of the traveling waveis largely conducted by the cochlear fluids, rather than viathe tissues of the cochlear partition.
VII. TWO-TONE INTERACTIONS
In nonlinear systems, responses to tone pairs ofteninclude interactions between the tones, such as suppres-sion and intermodulation distortion. In the auditory sys-tem, one of these nonlinear phenomena, intermodulationdistortion, has been known for a long time to shape theperception of sounds in humans (139). Psychophysicalstudies of intermodulation distortion led to a recognitionof the existence of BM nonlinearities well before thesewere demonstrated in physiological experiments, andeven to predictions of the existence of a feedback fromthe organ of Corti to BM vibrations (122, 366).
A. Two-Tone Suppression
1. Reduction of response magnitude
Two-tone suppression consists of the reduction ofthe response to one tone by the simultaneous presence ofanother. Figure 16, top, illustrates suppression of BMresponses to a CF (18.8 kHz) tone by a suppressor tone atvarious intensities in the base of the guinea pig cochlea.The abscissa indicates the level of the CF tone, and theparameter indicates suppressor levels. In the absence of asuppressor (or for low suppressor levels, such as in Fig.16) the responses to the CF tone grow at compressiverates. At higher suppressor levels, the responses to low-
6 The effects of filling the middle ear with fluid in the ITER prep-aration have not been well specified, but they are frequency dependentand involve stimulus attenuations lower than 35 dB at frequenciesrelevant to third- and fourth-turn measurements (e.g., they grow from23 to 123 dB as frequency increases from 100 to 1,500 Hz; see Fig. 15in Ref. 110). Moreover, the sensitivity of malleus vibrations in the ITERpreparation (0.6 mm/Pa) is actually larger than in the living guinea pig atfrequencies ,250 Hz (0.16–0.22 mm/Pa) (49, 223).
1326 LUIS ROBLES AND MARIO A. RUGGERO Volume 81

level CF tones are reduced strongly, but only weakly athigh levels. As a result, the BM input-output curve for theCF tones is substantially linearized in the presence ofmoderately intense suppressor tones.7
Two-tone suppression is CF specific with regard toboth the probe tone and the suppressor tone. Figure 16,bottom, illustrates the dependence of suppressionstrength on the frequency of the probe tone. The curvesindicate isoresponse contours (100 mm/s) for probetones presented alone (open symbols) or together with500-Hz or 12-kHz suppressors (332). In the presence ofeither suppressor tone, higher stimulus levels are re-quired to reach a criterion response. The magnitude ofsuppression is maximal at CF and diminishes as thefrequency of the probe tones departs from CF. Suppres-sion is also CF specific in that, with a fixed probe toneat CF, suppression thresholds vary much in the samemanner as the sensitivity of BM responses to singletones, i.e., suppression thresholds are lowest for sup-pressor frequencies close to CF (41, 51, 298). However,the frequency tuning of suppression is broader than thetuning for single tones, and the thresholds are quitedifferent on either side of CF. For suppressor frequen-cies just higher than CF, suppression thresholds arelow so that the overall response to a suppressor pairedwith a CF tone can be lower than for the CF tonepresented alone (41, 332). For suppressor frequencieslower than CF, suppression thresholds are relativelyhigh and proportional to BM displacement (see sect.VIIA3) so that suppression of a CF tone occurs onlywhen the overall displacement response to the pairedtones is larger than for the CF tone in isolation(41, 116).
In general, the main features of two-tone suppressionin auditory nerve fibers have counterparts (and probablyoriginate) in BM vibrations (Table 5; for reviews, see Refs.41, 332). One question still being debated is whether BMsuppression can fully account for neural two-tone ratesuppression by low-frequency suppressors (28, 142, 376).In particular, it was suggested that a suppressive mecha-nism must exist at the synapses of inner hair cells withprimary afferents with low spontaneous activity (28) toaccount for their suppression thresholds, which corre-spond approximately to a constant BM displacement (28,116, 376), but can be substantially lower than the excita-tory thresholds for the suppressor tones (e.g., Refs. 28,
103, 376). The suggestion was based on the assumptionthat neural excitation thresholds correspond to a con-stant BM displacement at all stimulus frequencies higherthan 600 Hz (28). In our view, this assumption is incorrect,since comparisons of neural thresholds and BM vibra-tions in the same cochleae show that, at the base of thecochlea, neural excitation is elicited not by a constant
7 When this behavior was first observed (307) it seemed to conflictwith neural rate suppression, whose strength was thought to be inde-pendent of probe-tone level (162). This idea, however, arose from thestudy of low-threshold fibers, whose response rates saturate at relativelylow stimulus levels and thus cannot reflect level-dependent variations ofBM responses at moderate and high stimulus levels. In high-thresholdfibers, which have broad dynamic ranges and do not reach a rate plateauat physiologically relevant intensities, the magnitude of suppressiondecreases at high probe-tone levels, much as at the BM (368).
FIG. 16. Two-tone suppression at the BM. Top: velocity-intensityfunctions for BM responses to a near-CF tone (18.8 kHz) presentedsimultaneously with a 22.9-kHz suppressor tone. The parameter is theintensity of the suppressor tone. [Guinea pig data from Nuttall and Dolan(257).] Bottom: frequency specificity of two-tone suppression. Iso-veloc-ity contours (100 mm/s) are shown for responses to single tones (opencircles) and for responses to the same tones in the presence of 500-Hz or12-kHz suppressors (solid circles and squares, respectively) presented at70 dB SPL. [Chinchilla data from Ruggero et al. (332).]
July 2001 MECHANICS OF THE MAMMALIAN COCHLEA 1327

magnitude of BM displacement, but rather by a combina-tion of displacement and velocity (see sect. VIIIC) (244,328). As a result, excitatory thresholds are increasinglyelevated relative to suppression thresholds as frequencydecreases. This “high-pass filtering” is also evident in thereceptor potentials of inner hair cells, with isosuppres-sion thresholds much lower than the isodepolarizationthresholds for single tones (358). Therefore, it seemsunnecessary to postulate the existence of a synaptic sup-pressive mechanism. Rather, there is a need to under-stand what processes introduce “high-pass filtering” inneural responses to single tones.
At the apex of the chinchilla cochlea, the effects ofsuppression on BM response magnitude are similar inmost respects to those demonstrable at the base. How-ever, apical and basal locations differ in that at the apexthe rates of growth of suppression are smaller and the
frequency tuning of suppression thresholds is consider-ably broader (51). These two differences are consistentwith the fact that BM responses to single tones at the apexof the cochlea are more linear and less sharply tuned thanat the base (see sect. IVB).
2. Phase changes associated with suppression
Suppression of BM responses is accompanied byphase changes both at basal and apical regions of thecochlea. These are summarized in Table 6 as a function ofthe frequencies of the suppressor and probe tones. Atbasal regions of the cochlea, suppression produces phaselags and leads, respectively, in probe tones with frequencylower and higher than CF (41, 332). Such phase alter-ations are similar to those produced by increments of theintensity of single-tone stimuli (Fig. 8; see sect. IIA4).
TABLE 5. Comparison of two-tone suppression at the basilar membrane and two-tone
rate suppression in auditory nerve fibers
Basilar Membrane Auditory Nerve
Suppression exists for probe fp ; CF and suppressor fs . CF 41, 51, 257, 295, 298, 309, 332 9, 54, 86, 103, 344, 352Suppression exists for fp ; CF and fs , CF 41, 51, 116, 277, 298, 332 9, 27, 54, 86, 103, 344,
352, 376Suppression is labile, being reduced by hair cell damage or death 41, 51, 277, 332 69, 304, 305, 354For fixed fp 5 CF, the rate of growth of suppression magnitude for increasing
suppressor intensity is larger for fs , CF than for fs . CF41, 51, 257, 257, 298, 332 2, 54, 86
For fixed fp 5 CF, suppression magnitude decreases with increasing probeintensity
41, 51, 257, 298, 308, 309, 332 368; but see also Refs. 1,2, 162
For fixed fp 5 CF, suppression thresholds are tuned; thresholds decrease asfs approaches CF
41, 51, 298 9, 344, 352
For fixed fs . CF, suppression magnitude is larger as fp approaches CF 332 352; but see also Refs. 2,162
For fixed fs , CF, suppression magnitude is larger as fp approaches CF 277, 332 1, 103, 118, 183, 276, 356For fixed fp 5 CF and fs , CF, suppression magnitude varies periodically,
attaining 1 or 2 maxima of suppression in each suppressor tone period41, 51, 116, 277, 298, 332 27, 276, 343, 356, 376
Suppression of near-CF tones is accompanied by phase changes (see Table 6) 41, 51, 257, 298, 309, 332 87
fs, Frequency of suppressor tone; fp frequency of probe tone.
TABLE 6. Phase effects of two-tone suppression
Species (CochlearRegion)
fp , CF fp ; CF fp . CFReference
Nos.fs , CF fs . CF fs , CF fs . CF fs , CF fs . CF
Guinea pig(Hook)
2 2 1 1 41
Guinea pig(Base)
257
Cat (Hook) 298
Chinchilla(Base)
2 2 1 309, 332
Chinchilla(Apex)
2 51
1, Phase lead (size of arrows indicates relative magnitude of phase change);2, phase lag; fs, frequency of suppressor tone; fp, frequency ofprobe tone.
1328 LUIS ROBLES AND MARIO A. RUGGERO Volume 81

Similar suppression effects have been noted in recordingsof inner hair cell receptor potentials for probe levelsgenerating responses below saturation (30, 31).
The polarity of phase shifts induced by suppressionon BM responses to CF probes has not been establishedunambiguously (Table 6). There are reports of phaseleads (41, 298), phase lags (332), or a dependence ofpolarity on suppressor frequency (51, 257). It is not clearwhy findings are so disparate. However, given that thepolarity of suppression-induced phase shifts reverses ator near CF, the inconsistent results may reflect errors inthe determination of CF. In auditory nerve fibers, record-ings show mostly phase lags associated with rate suppres-sion for CF probes and above-CF, nonexcitatory suppres-sors (87). Dissimilar phase effects of suppression havealso been found in inner hair cell receptor potentials,depending on cochlear location, probe intensity, and fre-quency of the suppressor (30, 31, 257, 258).
3. Modulation of responses to CF tones
by low-frequency tones
When BM responses to near-CF tones are suppressedby low-frequency tones, the suppression effect waxes andwanes once or twice within each period of the suppressortone, depending on stimulus intensity (41, 116, 277, 298,332). At basal sites of the cochlea, suppression is synchro-nous with BM displacements toward either scala tympanior scala vestibuli, with maximal suppression coincidingwith BM displacement toward scala tympani (41, 116, 277,298).8 At the apex of the chinchilla cochlea, low-frequencysuppressor tones (100–200 Hz) also produce phasic re-ductions of the vibrational responses to near-CF tones,with a periodicity corresponding to the frequency of thesuppressor. As is the case at the base of the cochlea, oneor two suppression maxima occur during each period ofthe suppressor tone. However, in contrast to modulationat the cochlear base, suppression maxima at the apexapparently do not show a clear correspondence to anyparticular phase of BM vibration (51). This observation isalso at odds with results for auditory nerve fibers inchinchilla (376) as well as inner hair cells in guinea pig(e.g., Refs. 32, 274, 334), in which maximal suppression atnear-threshold levels typically coincides with BM dis-placement toward scala tympani, regardless of CF.
B. Intermodulation Distortion
When two or more tones are presented simulta-neously, humans can hear additional tones that are notpresent in the acoustic stimulus. For two-tone stimulithese additional distortion products have pitches corre-sponding to combinations of the primary frequencies (f1
and f2, f2 . f1), such as f2-f1, 2f1-f2, 2f2-f1. Psychophysicalexperiments showed that 2f1-f2 distortion componentshave magnitudes that are highly dependent on stimulus-frequency separation. Even before the discovery of BMnonlinearities, this frequency dependence suggested thatdistortion products originate in the mechanics of the co-chlea (122, 366). Early attempts failed to find distortionproducts in BM vibrations (295, 401), but their presencewas subsequently demonstrated (52, 260, 298, 310–312).BM responses to two-tone stimuli with close primaryfrequencies (f1, f2), as those shown in Figure 17, top,contain several distortion products at frequencies bothhigher and lower than the frequencies of the primarytones (such as 3f2-2f1, 2f2-f1, 2f1-f2, 3f1-2f2 and f2-f1). As thefrequencies of the primaries are increasingly separated,the number of detectable distortion products in the re-sponse decreases.
1. Cubic difference tone (2f1-f2)
Stimulation with pairs of tones elicits robust cubicdifference tones (2f1-f2) at basal sites of the BM in chin-chilla, cat, and guinea pig (52, 260, 298, 310–312). Cubicdifference tones reach levels as high as 216 dB (i.e., 15%)to 220 dB relative to the level of the primaries. Theserelative levels are comparable to those obtained at laterstages of cochlear processing: 227 dB in guinea pig innerhair cells (254) and 220 dB in cat auditory nerve fibers(26, 125). They are also comparable to the 215 to 222 dBrelative levels estimated for the cubic difference tone inpsychophysical experiments with human subjects (122,366). Several other characteristics of the 2f1-f2 distortioncomponents recorded at the BM in animals also resemblethose of distortion components measured psychophysi-cally in humans. 1) For equal-level primaries, distortionproduct magnitudes grow at linear or faster-than-linearrates at low intensities and saturate and even decreaseslightly at higher stimulus intensities (e.g., at 60 dB SPL orhigher). 2) Distortion-product relative levels are highestat low stimulus intensities and decrease little over wideranges of stimulus intensity. 3) For a fixed level of one ofthe primary tones, the distortion product magnitude is anonmonotonic function of the level of the other primarytone. 4) For moderate f2/f1 ratios (e.g., .1.2), distortionproduct magnitudes decrease rapidly with increasing fre-quency ratio f2/f1, reaching rates in the order of 2200 to2300 dB/octave at the basal cochlea (52, 326) and inpsychophysical data (122).
8 The single apparent exception was a study that reported that, atthe 3.5-mm site of the chinchilla BM, maximal suppression of responsesto CF tones coincided with peaks of BM velocity, rather than displace-ment (332). In retrospect, it has become clear that this result wasartifactual (376). It is estimated that the phases of responses to low-frequency tones reported by Ruggero et al. (332) must be corrected by;90 degrees in the lagging direction. Applying this correction brings thephases of maximal suppression at the base of the chinchilla BM intoagreement with those of basal BM sites in other species and withcorresponding findings in chinchilla auditory-nerve fibers (376).
July 2001 MECHANICS OF THE MAMMALIAN COCHLEA 1329

As already indicated for two-tone suppression (seesect. VIIA1), two-tone distortion is CF specific in that themagnitude and phase of distortion products on the BMdepend strongly on the frequency separation between theprimary tones. In agreement with predictions based onearly psychophysical experiments (122, 419), the magni-tude of the cubic difference tone on the BM decays withincreasing frequency ratio, f2/f1 (Fig. 17, bottom). How-ever, there is some uncertainty regarding the dependenceof distortion product magnitudes on frequency ratio forratios close to one. At the base of the guinea pig cochlea(Fig. 17, bottom right) distortion product magnitudes arerelatively small at ratios close to one, increase for ratiosin the range 1.06–1.25, reach a maximum at f2/f1 ;1.2–1.3,and only then begin a steep final decay for higher ratios(52). In contrast, at the base of the chinchilla cochleadistortion product magnitudes decrease monotonicallyfrom a maximum at a frequency ratio near one (312), atlow rates for low-frequency ratios, and at steep rates forhigher ratios (much as in Fig. 17, bottom left). This mono-tonic pattern in chinchilla closely resembles psychophys-ical data for humans (122, 366, 418), whereas the broadlytuned (nonmonotonic) pattern in guinea pig resemblesthe behavior of distortion product otoacoustic emissions(285). It has been argued that the decrease in the magni-tude of the distortion-product otoacoustic emission as the
ratio of the primary frequencies approaches unity reflectsa micromechanical “second filter” within the cochlea (5,19). However, other explanations are possible: nonmono-tonic patterns of distortion product otoacoustic emis-sions could arise from monotonic patterns at the BM(228) or, alternatively, the nonmonotonic pattern mightarise at the BM (Fig. 17, bottom right) as a result ofmutual suppression between the primary tones as well assuppression of the distortion product (52, 170).
At the apex of the cochlea, 2f1-f2 distortion productmagnitude begins to decrease sharply at higher frequencyratios (Fig. 17, bottom left) than at the base of the cochlea,but the rate of decrease is lower than at the base (52).These properties are consistent with the fact that BMvibrations are more broadly tuned at the apex than at thebase, given that the magnitude of the distortion productcomponents must be determined by the extent of inter-action between the BM vibration patterns of the primarytones.
2. Quadratic difference tone (f2-f1)
In contrast to the cubic difference tone, the quadraticdifference tone f2-f1 can only be perceived at high stimu-lus levels and does not exhibit a sharp dependence on thefrequency ratio of the primary tones (122, 417). Neverthe-
FIG. 17. Cubic difference tones in BM vibrations. Top
panel: spectrum of responses from a basal BM site to apair of tones with frequencies slightly higher than CF. Theprimary tones, each presented at 50 dB SPL, were chosenso that 2f1-f2 5 CF (7.5 kHz). [Chinchilla data replottedfrom Robles et al. (312).] Bottom panels: BM magnitude ofthe (2f1-f2) distortion product as a function of stimulusfrequency ratio f2/f1 chosen so that 2f1-f2 5 CF. StimulusSPLs are indicated by the circled numbers (e.g., “8” signi-fies “80 dB SPL”). Left: from an apical site in chinchilla.Right: from a basal site in guinea pig. [From Cooper andRhode (52).]
1330 LUIS ROBLES AND MARIO A. RUGGERO Volume 81

less, recordings of cochlear microphonics (120, 256) andfrom auditory nerve fibers (188, 364) and cochlear nu-cleus neurons (367) suggested that quadratic differencetones propagate mechanically on the BM, much as the2f1-f2 distortion product. Indeed, at the apex of the co-chlea mechanical responses to two-tone stimuli containprominent difference tone components, with levels com-parable to those of cubic difference tones, about 223 dBrelative to the primaries (52).
Quadratic difference tones have not been detected inBM vibrations at the base of the cochlea (52, 256, 295,312). Although it is possible that at basal regions of thecochlea the quadratic difference tone exists in the organof Corti only as a local response that somehow does notreach the BM (258), we think it more likely that its ab-sence from basal BM vibrations results from unfavorableconditions of stimulation. Because setting f2-f1 5 CFwould require values of f2 and f1 higher than the upperfrequency limit of the cochlea, the presence of differencetones at basal sites has only been tested for f2-f1 ,, CF,for which BM vibrations are insensitive.
VIII. THE MECHANICAL ORIGIN OF
COCHLEAR FREQUENCY FILTERING
A. BM Vibration at Neural Threshold
The magnitude of BM vibration at threshold is anissue in which past controversy is being gradually re-placed by consensus. Linear extrapolation from vonBekesy’s apical data for humans leads to the rather im-probable conclusion that the BM moves by ;0.1 pm(10213 m) at hearing threshold for tones between 300 and1,500 Hz (391). Eventually, the discovery of a labile com-pressive nonlinearity (293) implied that BM displace-ments at threshold had to be much larger in vivo. Table 1surveys the BM vibration magnitude corresponding toneural threshold at CF at basal cochlear sites in severalspecies. The BM vibration magnitudes at the base of theguinea pig and chinchilla cochleae may be accepted withconfidence because consistent results have been repeat-edly obtained in essentially intact preparations, as judgedby compound action potential thresholds. However, evenwhen the mechanical data are collected in pristine co-chleae, the determination of BM vibration magnitude atneural threshold is complicated by the substantial vari-ability of single-fiber thresholds across different cochleaeas well as their dependence on spontaneous activity (e.g.,Refs. 207, 210). For the 17- to 18-kHz site of the guinea pigcochlea, neural threshold at CF corresponds to BM vibra-tion magnitudes of 34–40 mm/s or 0.3–0.35 nm (using BMand auditory nerve fiber data recorded from two differentcochleae). For the 9- to 10-kHz site of chinchilla, neuralthreshold (;10 dB SPL for fibers with high spontaneous
activity, Ref. 326) corresponds to BM vibration magni-tudes of 50–100 mm/s or 1–2 nm when using averagedneural data for the comparison (307, 326). A comparisonof BM and auditory nerve fiber data recorded in the samecochleae yielded values of 164 mm/s or 2.7 nm in the caseof a fiber with medium spontaneous activity and 15 mm/sor 0.26 nm for a fiber with high spontaneous activity (244).At the 30- to 33-kHz site of the cat cochlea, the reportedBM vibration magnitude of ;1 nm (or 200 mm/s) at thresh-old (47) is less secure than in guinea pig or chinchilla,since compound action potential thresholds were notused as controls.
It has been suggested that a counterpart of the tran-sition between the linear and compressive regions of BMinput-output functions (Fig. 3) can be demonstrated in theresponses of auditory nerve fibers to CF tones (342, 411).Since at the base of the cochlea BM vibrations growlinearly in response to tones with frequency well belowCF, “BM input-output functions” for responses to CFtones at basal cochlear sites can in principle be derivedfrom rate-intensity functions for auditory nerve fibers (onthe assumption that spike rates are determined solely byBM displacement) by plotting the SPLs required to elicitthe same response rate for stimuli at CF and at a fre-quency sufficiently lower than CF (411). Such derived BMinput-output functions indicate that at the site of theguinea pig cochlea at a distance of 3–4 mm from the ovalwindow (with CF ;17–18 kHz) the “compression thresh-old” is ;30–60 dB SPL (53, 241, 411) or ;30 dB higherthan the CF threshold of the most sensitive fibers in thesame cochlear region. However, the derived values sub-stantially exceed (by 20–30 dB) the compression thresh-olds directly measured at the BM (10–20 dB SPL; see Fig.3), which approximately coincide with the rate thresholdof auditory nerve fibers (e.g., Fig. 18; Refs. 317, 326, seealso Ref. 259). This discrepancy may imply that the deri-vation of the compression threshold from auditory nervefiber data is based on inaccurate assumptions.
At the apex of the chinchilla cochlea (CF 5 400 –800 Hz), TM displacements and velocities at neural CFthreshold (;15–23 dB SPL) (68) in the most sensitivecochleae (Figs. 11 and 18) amount to 1–3 nm and 2–7mm/s, respectively (52, 299). At the apex of the guineapig cochlea (CF 5 350 Hz), the most sensitive re-sponses reach 38 nm at 60 dB SPL in cochleae exhib-iting an expansive nonlinearity (413). Average thresh-olds of guinea pig auditory nerve fibers with CF ;300 –400 Hz have been variously estimated as 28 dB SPL(386) [seemingly with the bulla open, which augmentsmiddle ear transmission by ;10 dB at low frequencies(49) and 50 (49) or 59 dB SPL (99) with the bullaclosed]. Thus vibrations near the apex of the guinea pigcochlea correspond to 1–11 nm at the CF threshold ofauditory nerve fibers. Because the displacements atneural threshold at apical sites of chinchilla and guinea
July 2001 MECHANICS OF THE MAMMALIAN COCHLEA 1331

pig cochleae are similar to the displacement values atthe base, one might conclude that neural thresholdscorrespond to a constant BM displacement (in the or-der of a few nanometers) throughout the cochlea (49).This interpretation, however, clashes with the velocitysensitivity of low-CF inner hair cells and auditory nervefibers (61, 319, 329, 349). The alternative possibility isthat even the most sensitive responses so far measuredat the apex have underestimated, by as much as 25 dB,the magnitude of vibrations in normal cochleae. In thatcase, apical cochlear vibration velocities at thresholdwould be in the range of 39 – 420 mm/s, matching closelythe threshold velocities of basal sites in guinea pig andchinchilla.
B. The “Second Filter”
The concept of the “second filter” provided a focusfor many of the controversies surrounding cochlear func-tion over the last quarter century or so. Second filterswere proposed as mechanisms that could bridge a per-ceived gap between the apparent poor tuning of the BM(the “first filter”) and the sharp tuning of auditory nervefibers: second filters receive their input from (but do notfeed back on) the BM, and transform poorly tuned and
insensitive mechanical vibrations into well-tuned and sen-sitive responses of hair cells and auditory nerve fibers (99,101). Electrical second filters (resonances due to interac-tions of ionic channels in the basolateral membranes ofhair cells) actually exist in the cochleae of turtles andchicks and in the amphibian papilla of frogs (8, 56, 111,283), but have not been found in mammals.
In the case of the mammalian cochlea, second filtermodels (4, 426, 427) dominated thinking about its me-chanics even long after Rhode’s demonstrations of BMcompressive nonlinearities and their vulnerability (293,294, 296, 306). This was partly due to the inability ofseveral investigations (101, 165, 402), including one byRhode himself (296), to replicate his pioneering findingsin species other than the squirrel monkey. Especiallyinfluential in this regard was one study that reportedsharply tuned and sensitive responses of auditory nervefibers from cat cochleae in which BM vibrations wereinsensitive and poorly tuned (101). In retrospect, it seemsapparent that the methods used to measure BM vibra-tions, including a capacitive probe, induced severe butlocalized cochlear damage and that the neural recordingscame from fibers innervating sites other than those wherevibrations were measured.
Even when it became indisputable that BM responsesat the base of the cochlea exhibit a compressive nonlin-earity (307, 355) and that they are well-tuned and sensitive(179, 307, 355), a lack of consensus regarding the exactcorrespondence between BM vibration and auditorynerve excitation permitted a lingering defense (5, 6) ofsecond filter models or even denials that BM vibrationsparticipate in the stimulation of the auditory nerve (18).
C. Frequency Tuning at the BM and in Auditory
Nerve Fibers
At basal cochlear sites, the tuning of the BM and ofauditory nerve fibers is very similar at frequencies nearCF (47, 307, 326, 328, 355), but it is not certain whether,over a wider frequency range, neural threshold curvescorrespond to a constant BM displacement, velocity, orsome function of these variables. Comparisons involvinga single BM tuning curve from one cochlea and a repre-sentative neural tuning curve from another cochlea havevariously suggested that neural threshold corresponds toa velocity of ;40 mm/s (355) or to a displacement of 1 nm(47, 248).
The correspondence between the frequency tuning ofneural thresholds and BM response magnitudes is per-haps best known at the 3.5-mm site of the chinchillacochlea (reviewed by Ruggero et al., Ref. 317). Compari-sons of averaged BM and neural data (307, 317, 328)indicate that, over a wide range of frequencies, thresholdsfor fibers with CF of 9–10 kHz follow a course interme-
FIG. 18. Frequency tuning in cochlear vibrations and in auditory-nerve fibers in chinchilla. Curves at right: a frequency-threshold tuningcurve for an auditory-nerve fiber (solid line) is compared with isore-sponse curves for a BM site with identical CF (9.5 kHz) recorded in thesame ear (244). At the fiber’s CF threshold (13 dB SPL), BM vibrationshad a peak displacement of 2.7 nm or, equivalently, 164 mm/s. Thesevalues were used to plot BM isodisplacement and isovelocity tuningcurves (dotted and dashed lines, respectively). [A better mechanical/neural match was obtained by high-pass filtering the BM displacementcurve at a rate of 3.8 dB/octave (not shown).] Curves at left: isodisplace-ment and isovelocity tuning curves (1-nm and 2.5-mm/s, respectively;dotted and dashed lines) for TM vibrations recorded at an apical co-chlear site (299) are compared with a neural tuning curve (solid line),the average of recordings from many auditory-nerve fibers (A. N. Tem-chin, N. C. Rich, and M. A. Ruggero, unpublished observations).
1332 LUIS ROBLES AND MARIO A. RUGGERO Volume 81

diate between isodisplacement (0.9 nm) and isovelocity(50 mm/s). Direct comparisons of tuning curves for BMand auditory nerve fiber responses recorded in the samechinchilla cochleae under identical conditions (Fig. 18)led to the same conclusion (244). On average, the fre-quency tuning at threshold of auditory nerve fibers forfrequencies below CF corresponds closely to BM dis-placement subjected to high-pass filtering at constantrates of 3–5 dB/octave. High-pass filtering must reflect inpart the velocity sensitivity of inner hair cells at lowfrequencies (which, in turn, probably results from theviscous fluid coupling between endolymph and their ste-reocilia). In the case of high-CF inner hair cells, velocitysensitivity may extend to frequencies as high as 1–1.6 kHz(see Fig. 7 of Ref. 278). (Lower limits for velocity sensi-tivity were estimated in other studies of high-CF innerhair cells, Refs. 253, 341, 359.) However, it is also possiblethat the attenuation of responses to low-frequency stimulimay reflect unspecified micromechanical processes. Mi-cromechanical processes might also account for the ab-sence from neural tuning curves (Fig. 18) of counterpartsof the high-frequency plateaus evident in responses tosound at the BM (Fig. 5, 6, and 18) and in scala tympanipressure (Fig. 15) (see sect. IIA5).
Figure 18 compares isodisplacement and isovelocitytuning curves for TM responses at a site of the chinchillacochlea with CF ;400 Hz (299) with an average frequen-cy-threshold tuning curve derived from the responses ofmany chinchilla auditory nerve fibers with similar CF(A. N. Temchin, N. C. Rich, and M. A. Ruggero, unpub-lished observations). Both the low- and high-frequencyslopes are similar in the neural and mechanical tuningcurves, but the tips of the TM curves are distinctly bluntcompared with the tip of the neural curve. The Q10 of theneural curve is nearly twice as large as the Q10 values ofthe mechanical curves (1.32 vs. 0.77). The discrepancymay indicate that even the best available data underesti-mate the sensitivity and frequency tuning of TM vibrationsnear CF at the cochlear apex (see sect. VIIIA). Near theextreme apical end of the guinea pig cochlea, however,regardless of whether responses to sound are linear ornot, or whether measurements are made in vitro or in vivo(49, 135, 140), the sharpness of mechanical tuning issimilar to the threshold tuning of normal auditory nervefibers, with Q10 values #1.
Table 7 summarizes a series of properties of auditorynerve responses that probably reflect corresponding fea-tures of BM vibration. Appropriately, all these propertiesexhibit CF specificity, i.e., a dependency on stimulus fre-quency relative to CF. Many other properties of auditorynerve fiber responses (e.g., synaptic delay, refractoriness,rate saturation and rectification, decay of phase lockingas a function of increasing stimulus frequency; for review,see Ref. 314) do not exhibit CF specificity and, accord-ingly, probably originate at sites other than the BM (such
as the inner hair cells and their synapses). Some strikingnonlinear features of auditory nerve responses (e.g.,notches in rate-intensity functions and associated phaseshifts) may indicate that the micromechanics of the co-chlear partition contain multiple modes that transmit BMvibrations to the inner hair cell stereocilia via two or moredistinct pathways (see sect. VIA).
IX. EVIDENCE FOR ELECTROMECHANICAL
POSITIVE FEEDBACK IN COCHLEAR
MECHANICS
A. Mechanical Feedback From the Organ of Corti
and Amplification
Today, the “cochlear amplifier” is the dominant uni-fying idea of cochlear mechanics. Although the term co-
chlear amplifier was apparently coined by Davis in 1983(74), cochlear amplification was first proposed by Gold in1948 (121) as an electromechanical feedback process or“negative resistance” that counteracts the viscous damp-ing that would otherwise attenuate and detune BM vibra-tions (see also Refs. 174, 175, 189, 393). As distinct fromthe “second filter” (see sect. VIIIB), the cochlear amplifierprovides a positive feedback to BM vibrations via “reversetransduction” (i.e., the conversion of biological, presum-ably electrical, energy into mechanical vibrations). Al-though cochlear amplifier means different things to dif-ferent people, a simple definition states that it is a“positive feedback process which increases the sensitivityof BM responses to low-level stimuli.” A more strict def-inition additionally requires that the increase in sensitivityinvolves the dissipation of biological energy (i.e., notpresent in the acoustic stimulus).
In discussing the evidence for the existence of acochlear amplifier, it is useful to distinguish this conceptfrom a related one, namely, nonlinearity of BM vibrations.
TABLE 7. Properties of auditory nerve responses that
primarily reflect BM mechanics
Alternating current response (phase locking)Sharp frequency tuningCompressive input-output nonlinearity at near-CF frequenciesFrequency dependence of slopes of rate-intensity functionsDependence of frequency tuning on stimulus intensityTwo-tone rate suppression and low-frequency modulation of
responses to CF tonesTwo-tone distortionCF dependence of onset latency and group delays of responses to
broad-band stimuliDependence on stimulus intensity of response phases at near-CF
frequenciesVulnerability of frequency tuning and two-tone suppression and
distortion
[Modified from Ruggero (314).]
July 2001 MECHANICS OF THE MAMMALIAN COCHLEA 1333

The preceding sections of this review amply documentthe features of compressive nonlinearity at both basal andapical cochlear sites. At least at the base of the cochlea,compressive nonlinearity appears to be inextricablylinked with high sensitivity and sharpness of frequencytuning (327) so that when one of these three properties isabolished by cochlear insults, the other two are alsoeliminated or drastically reduced. Thus the presence ofcompressive nonlinearity may well be a certain indica-tor of the activity of the cochlear amplifier (see sect.XD). However, it is also conceivable that saturation,which attenuates BM vibrations at moderate and highstimulus levels, could arise independently of amplifica-tion. What lends credence to the view that compressivenonlinearity signals amplification is that insults to co-chlear function (see sect. IXB) abolish nonlinearitylargely by reducing the sensitivity of responses to low-level stimuli. Such effect is obviously consistent withthe existence of an amplifier and points to the existenceof a feedback from the organ of Corti that boosts BMvibration.
B. Lability of Cochlear Mechanical Responses
to Sound
1. Effects of death and surgical trauma
on BM sensitivity
Until the 1980s, most investigations of BM vibration,except for those in the squirrel monkey (293, 296, 306),reported linear, insensitive, and poorly tuned responsesto sound (101, 163, 165, 391, 400–402). With hindsight, itis obvious that failures to demonstrate sensitive and non-linear BM responses in vivo resulted from surgical dam-age inflicted during experimental manipulations of thecochlea. This became evident when an independent, sen-sitive, and frequency-specific measure of cochlear func-tion, namely, the threshold of tone-pip-evoked compoundaction potentials, was shown to correlate well with BMsensitivity (307, 355).
The BM compressive nonlinearity discovered byRhode (293) in the squirrel monkey cochlea disappearedwithin minutes after death (294). More recent BM mea-surements at the base of the cochlea (e.g., Figs. 10 and 19)are consistent with most of Rhode’s 1973 observations,showing that postmortem responses exhibit a large de-crease in the sensitivity of responses to low-level near-CFstimuli, a loss in sharpness of tuning, and a downwardshift (by about one-half octave) of the most sensitivefrequency (47, 259, 307, 326, 327, 355). For low-level CFstimuli, death reduces response sensitivity by as much as65–81 dB (259, 326, 355) (see Table 1).
At the apex of the chinchilla cochlea, nonlinear vi-brations can be recorded only when the organ of Cortiand Reissner’s membrane are minimally disturbed (see
sect. IIIA). Responses that initially exhibit compressivenonlinearity always become linear and less sensitive withthe passage of time (51, 299). Similarly, at the apex of theguinea pig cochlea, an expansive nonlinearity has beendemonstrated only in exceptionally intact preparations(413).
2. Effects of acoustic overstimulation
on BM sensitivity
Exposure of the mammalian ear to intense soundscan produce transient or permanent elevations of hearingthresholds (for reviews, see Refs. 351, 353). It is clear thatthese threshold elevations originate in the cochlea, sinceacoustic overexposure causes comparable thresholdshifts in responses to sound of auditory nerve fibers (35,37, 213) and hair cells (39).
The in vivo effects of acoustic overstimulation on BMvibrations were measured, in limited fashion, in the co-chleae of two guinea pigs (272, 355) and one cat (47) and,in a more extensive investigation, in chinchillas (324, 325,327). The latter study, which used both tone and click teststimuli, exposed the ear to intense tones that causedsevere but temporary threshold shift centered at the CF ofthe BM recording site. The effects of acoustic overstimu-lation on BM responses to sounds closely resembled theeffects of death (see sect. IXB1). Responses were linear-ized, reducing sensitivity at CF, broadening frequencytuning, and shifting the peak response to a frequency ;0.5octaves lower than CF (47, 272, 324, 325, 327, 355). Over-all, the BM effects of acoustic overstimulation can ac-count for most (but not all) of the corresponding effectsin auditory nerve fibers (35, 37, 345) and their psycho-
FIG. 19. The effect of death on the magnitudes and phases of BMresponses to tones. The response magnitudes are expressed as tuningcurves, in terms of the stapes velocity required for a constant BMvelocity of 50 mm/s. The phases are given relative to stapes vibrations.The arrowhead indicates the high-frequency phase plateau (see sect.IIA5). Postmortem data were measured within 1 h after death of theanimal. [Guinea pig data replotted from Nuttall and Dolan (259).]
1334 LUIS ROBLES AND MARIO A. RUGGERO Volume 81

physical correlates, including the long-known “half-octaveshift” that accompanies temporary threshold elevations(37, 75). The BM effects cannot account for changes inauditory nerve spontaneous activity or for alterations inthresholds, including hypersensitivity, at frequencies wellbelow CF (209).
3. Pharmacological manipulation
of cochlear sensitivity
Furosemide, a “loop-inhibiting” diuretic, drasticallybut reversibly alters cochlear function by abolishing theendocochlear potential. This reduces the drive to mecha-noelectrical transduction, presumably causing reducedreceptor potentials of inner and outer hair cells, which inturn alter the sensitivity of auditory nerve fibers (100,361). Interestingly, the sensitivity changes in high-CF fi-bers are substantially greater at CF than at other frequen-cies (361). The mechanical bases of this frequency-spe-cific alteration has been elucidated by experiments inchinchillas involving intravenous injection of furosemide.As illustrated in Figure 20, furosemide causes large butreversible CF-specific reduction and linearization of BMresponses to tones and clicks (320, 322).
Although all manipulations of cochlear sensitivitypoint to the existence of cellular processes that boost BMvibrations, most [e.g., the effects of acoustic overstimula-tion (sect. IXB2) and surgical trauma or death (sect. IXB1)]do not address directly the nature of the feedback. Theexperiments involving furosemide are more specific, al-most inescapably implying that the sensitivity and nonlin-earity of BM vibrations depend critically on the receptorpotentials of outer hair cells. Although furosemide mustalso reduce independently the receptor potentials of innerhair cells, it is the outer hair cells that are implicated, inview of the differential effect on inner hair cells of DCcurrents applied extracellularly or intracellularly. Inject-ing negative DC currents into scala vestibuli (a procedureanalogous to decreasing the endocochlear potential bymeans of furosemide) causes CF-specific reductions in
BM (264) (see sect. IXD), inner hair cell (252), and audi-tory nerve sensitivity (375). In contrast, alterations ininner hair cell responses induced by intracellular currentinjection are not frequency specific (252).
It is noteworthy that the large effects of furosemideon BM vibration (e.g., reductions of vibration amplitudeof up to 60 dB at CF, Ref. 322) are seemingly controlled byrelatively small alterations of hair cell potentials. Forexample, if furosemide reduces the endocochlear poten-tial to zero, the receptor currents would be reduced byonly 50% or 6 dB (since approximately one-half of thedrive for the transduction current, namely, the intracellu-lar electrical potential of outer hair cells relative to peri-lymph, would remain unaffected). The fact that a rela-tively small decrement in transduction currents canproduce disproportionately large reductions in the mag-nitude of mechanical vibrations implies that the link be-tween outer hair cells and the BM consists of a high-gainpositive feedback (279, 408).
Quinine can reversibly raise auditory thresholds andinduce tinnitus (for review, see Ref. 137). Quinine doesnot reduce the endocochlear potential (287), but it mayaffect outer hair cells directly (160, 173). Intravenousinjections of quinine in chinchillas linearize BM re-sponses, broadening frequency tuning and reducing sen-sitivity at CF by up to 15 dB (327).
Both acetyl salicylic acid (aspirin) and salicylates canreversibly reduce auditory sensitivity and selectivity andmay induce tinnitus (for review, see Ref. 161). A mechan-ical basis for these effects has been demonstrated: peri-lymphatic perfusion of the cochlea with 2.5–5 mM sodiumsalicylate produces strong but reversible alterations inBM responses to tones (237). During perfusion, BM tuningcurves become broader, lose up to 45 dB in sensitivity atCF, shift their apparent CF to lower frequencies, andbecome sensitized by ;10 dB in their low-frequency tail.Interestingly, salicylate reduces the electromotile forces(see sect. XD) and the axial stiffness of isolated outer haircells (340), effects which may underlie the salicylate-induced alterations of BM responses.
FIG. 20. The effects of furosemide onBM responses. Frequency spectra of BMresponses to 75-dB (peak SPL) clicksmeasured in two cochleae, before (solidline) and after (dashed lines) intravenousfurosemide injections. The panels showmagnitudes and phases, computed byFourier transformation. [Chinchilla datafrom Ruggero and Rich (322).]
July 2001 MECHANICS OF THE MAMMALIAN COCHLEA 1335

4. Lability of BM response phases
With but one exception (272), studies of the effects ofacoustic overstimulation on in vivo BM vibrations foundthat loss of sensitivity is accompanied by phase lags, aswell as decreased slopes of the phase versus frequencycurves (group delays) at frequencies around CF (47, 324,325, 327). Phase lags and decreased group delays are alsoevident after administration of furosemide in responses tolow- and moderate-level tones and clicks at frequenciesaround CF (Fig. 20B) (322).
The first investigation of the effects of death in co-chleae exhibiting in vivo nonlinearities also found post-mortem phase lags at all measured frequencies (frommuch lower than CF to well above CF) as well as de-creased group delays around CF (294). Among more re-cent studies, only one has confirmed these results fully(300). Other studies did not find postmortem phase lags atfrequencies much lower than CF and observed leads(rather than lags) at frequencies higher than CF (259, 290,315) and, in some cases, also at CF (259, 326). Figure 19compares the magnitudes and phases of responses totones measured in vivo and postmortem in an initiallysensitive cochlea (259). Death did not alter significantlythe response phases at frequencies lower than CF butcaused a large relative phase lead (;270 degrees) at CF(18 kHz): lag was reduced from ;2.2 periods premortemto about 1.5 periods postmortem. The phase effects ofdeath on responses to clicks (290, 315) closely resemblethe phase effects of increasing stimulus intensity in vivo:relative lags and leads at frequencies lower and higherthan CF, respectively, with little change at CF (Fig. 8 andsect. IIA4). Such changes are consistent with the de-creased postmortem phase slopes near CF reported byRhode (294) but are not consistent with the results ofother studies using tone stimuli, including those of Figure19. The apparently disparate results could be reconciledby postulating that the various studies measured BM re-sponses at different times after death and that thepostmortem processes are time dependent (326). Thepostmortem phase effects probably consist of relativeleads at CF and at higher frequencies immediately afterdeath, gradually changing to lags at all frequenciesaround CF after 1 h or so (300). In addition, the steepslope of the phase versus frequency curves may confoundinterpretation by exaggerating errors in estimating CF.For example, in the case of Figure 19, if the “real” CF were17 kHz, the postmortem phase lead would amount to only;80 degrees (instead of 270 degrees at the 18-kHz nomi-nal CF).
5. Lability of two-tone interactions
Well before distortion products could be demon-strated on the BM, psychoacoustical and neurophysiolog-ical experiments suggested that distortion products orig-
inate in the cochlea and propagate on the BM much likeresponses to single tones (122, 364, 366). Among thestrongest early evidence for distortion product propaga-tion on the BM (and also for a feedback linking the organof Corti and BM vibrations) was that their audibility wasreduced when the stimulus frequencies coincided withregions of elevated audiometric threshold (366). Parallelresults were obtained using recordings of auditory nervefibers in the cochleae of chinchillas suffering hair cell loss(364). More recently, a similar BM experiment was carriedout using acute acoustic overstimulation to selectivelydecrease cochlear sensitivity to the primary tones, f1 andf2 (see sect. IXB2), selected so that 2f1-f2 was equal to theCF of the recording site (312). Under such circumstances,2f1-f2 distortion products were reduced in magnitude, al-though responses to CF tones were largely unaffected.This is consistent with the idea that the 2f1-f2 distortionproduct originates at the BM region with CFs near theprimary frequencies and propagates to the location withCF equal to 2f1-f2.
Both two-tone suppression and the modulation ofresponses to CF tones by low-frequency tones are CFspecific (Fig. 16, bottom, and sect. VIIA). Therefore, on theassumption that suppression and low-frequency modula-tion are closely related to the nonlinear, compressivegrowth of BM responses at CF, it is not surprising thatthese nonlinearities disappear postmortem and that, invivo, their strength is well correlated with sensitivity atCF (41, 277, 332).
6. Effects of noxious agents on vibrations of the ITER
temporal-bone preparation
Despite being linear, the mechanical responses tosound of the ITER temporal bone preparation can bealtered by exposure to noxious agents (see sect. VIB1).However, the alterations are small and differ qualitativelyfrom those caused by the same insults, in vivo, at basalBM sites. For example, after the ITER preparation wasexposed to intense sounds, response sensitivity “. . .gen-erally increased. . .” (384). Such an increase in sensitivitysharply contrasts with the effects of overstimulation onBM vibrations at the base of the in vivo cochlea (see sect.IXB2) and are also inconsistent with the neurophysiolog-ical and psychophysical correlates of acoustic trauma,including some findings using the ITER preparation (108).The ITER preparation was also used to study the effectsof quinine, again with unexpected results: quinine “. . .increased the vibration amplitude at the peak of the me-chanical resonance curves and increased the sharpness oftuning” (172), effects which are quite different from thoseobserved at basal sites of the BM (see sect. IXB3). Thepeculiarity of the effects of quinine and overstimulationon the ITER preparation probably reflects underlying dys-
1336 LUIS ROBLES AND MARIO A. RUGGERO Volume 81

function, at least in part due to the absence of a bloodsupply.
C. Efferent Control of BM Vibration
The cochlea receives bilateral centrifugal innervationthat originates at the superior olivary complex of thebrain stem (288, 392). Medial efferent fibers originatefrom large cells of the medial regions of the superiorolivary complex and terminate in large synapses at thebase of outer hair cells (369, 392). Although a functionalauditory role of the olivocochlear efferent system has notbeen established, there is clear experimental evidencethat efferent fibers have an inhibitory effect on cochlearresponses. Electrical stimulation of the crossed olivoco-chlear bundle (formed predominantly by medial efferentfibers) reduces the amplitude of cochlear compound ac-tion potentials produced by acoustic clicks (112) andresponses to tones of auditory nerve fibers (106, 396) andinner hair cells (20).
The underlying basis for the neural effects of activa-tion of the olivocochlear system is a CF-specific loss ofsensitivity and linearization of BM vibrations (92, 238,337). At near-CF frequencies, efferent stimulation shiftsthe steep portion of the velocity-intensity curves to higherlevels, by up to 30 dB, and increases its slope. The atten-uation of BM vibration is largest at stimulus levels be-tween 50 and 75 dB SPL and may exceed 10 dB even at 90dB SPL (337). These attenuations are similar to and couldaccount for those produced by efferent stimulation inresponses of low and medium spontaneous-rate auditorynerve fibers (130). In contrast to other experimental ma-nipulations of cochlear sensitivity, olivocochlear stimula-tion does not alter the sharpness of BM frequency tuningor the phases of responses to tones (238). In addition,electrical stimulation of the olivocochlear bundle can in-crease BM responses to tones at frequencies well aboveCF and at high intensities (92). Counterparts of this phe-nomenon have not been previously observed in BM or inauditory nerve responses.
Whatever doubts may have lingered regarding theability of outer hair cells to influence BM vibrations, thesehave been dispelled by the demonstration that stimulationof the olivocochlear bundle, which innervates outer haircells and type I afferent terminals, reduces BM responsesto sound in a frequency-specific manner (238). Because itis inconceivable that afferent fibers can affect BM vibra-tions, the efferent effects must be mediated by the outerhair cells.
Cochlear perfusion of ACh, the neurotransmitter ofmedial olivocochlear efferents, produces transient lossesof sensitivity and linearization of the displacement/inten-sity curves for BM responses, with the greatest effect atlow to moderate levels and at frequencies above CF (239).
As expected, the effects of ACh perfusion on BM re-sponses resemble those induced by electrical stimulationof the efferent system (238). However, in contrast toefferent stimulation, ACh increases the bandwidth of BMtuning curves. BM vibration data (239), as well as mea-surements of somatic electromotility (see sect. XD) inisolated outer hair cells (71), suggest that ACh acts byproducing an influx of Ca21 into outer hair cells, which inturn induces Ca21 release from intracellular stores. Theeffects of ACh on both BM vibrations and the motileresponses of outer hair cells have onset delays in theorder of seconds and probably correspond to the “sloweffects” of efferent stimulation on compound action po-tential thresholds (370). In isolated outer hair cells, AChproduces an increase in the magnitude of axial electro-motile responses (71). This is a surprising result in view ofthe widespread belief that BM vibrations are boosted bythe somatic electromotile responses of outer hair cells(see sect. XD) (63, 64).
D. Reverse Transduction: Mechanical Effects
of Electrical Currents
That “reverse” (i.e., electrical to mechanical) trans-duction can occur in the cochlea was first demonstratedby injecting sinusoidal electrical currents into scala mediawhile simultaneously delivering an acoustic tone (151).Such currents produce otoacoustic emissions at the fre-quency of the electrical stimulus and also interact withthe acoustic tone to produce distortion-product otoacous-tic emissions. Electrically evoked otoacoustic emissionscan also be enhanced by acoustic tones in a mannerroughly consistent with the frequency tuning and tono-topicity of BM vibrations (234, 405) and are modulated bylow-frequency acoustic tones (410) much as these period-ically suppress responses to CF tones at the BM or inauditory-nerve fibers (see sect. VIIA3). In other words,either the electrical stimuli themselves or electricallystimulated cochlear vibrations can interact nonlinearlywith cochlear vibrations elicited by normal acoustic stim-uli. The fact that these interactions between acousticaland electrical stimuli take place on a cycle-by-cycle basissuggests that they occur in hair cells, the sites of mechan-ical to electrical transduction (155, 156). The outer haircells are specifically implicated because acoustically stim-ulated distortion-product emissions can be modified byelectrical activation of the olivocochlear efferent system,whose terminals innervate outer hair cells but not innerhair cells (232, 363).
If reverse transduction in outer hair cells (eithervoltage-driven somatic electromotility or current-drivenstereocilia motility; see sect. XD) plays a role in the me-chanics of the intact cochlea, it should be capable ofinducing motion of the organ of Corti and the BM. Indeed,
July 2001 MECHANICS OF THE MAMMALIAN COCHLEA 1337

in explants of the organ of Corti, outer hair cells andadjacent structures display motile responses to electricalstimulation at frequencies as high as 15 kHz (132, 171, 219,291, 292). Under electrical stimulation, the reticular lam-ina and the BM move with opposite polarity (219), imply-ing that the top and bottom of the organ of Corti couldmove independently under acoustic stimulation (see sect.VIA). Consistent with findings in isolated outer hair cells(e.g., Ref. 350), depolarization causes outer hair cells toshorten, pushing the reticular lamina toward scala tym-pani and the BM toward scala vestibuli (219). Displace-ments are several times larger at the reticular lamina thanat the BM, indicating that the BM is stiffer than thereticular lamina.
Electrically induced BM motion has been demon-strated in vivo in gerbil and guinea pig cochleae (255, 265,406, 407). In gerbil, the electrically evoked vibrationsdiffered substantially from those produced by acousticstimulation. In particular, they exhibited only small phaseaccumulation at CF, indicating that traveling waves werenot generated (see sect. V) (406, 407). A very differentresult was reported for similar experiments in guinea pig(255, 265): BM responses to electrical sinusoids exhibitspectral tuning and phase characteristics (including aphase lag exceeding 2 periods at CF) very similar toresponses evoked by acoustic tones (265). Similarly, stim-ulation with electrical pulses causes “ringing” of the BMpractically indistinguishable from responses to acousticclicks in the same cochlea (see sect. IIB).
Upon cochlear stimulation with electrical pulses, au-ditory nerve fibers exhibit responses strikingly analogousto those seen at the BM in that they resemble neuralresponses to acoustic clicks (146, 236). Although Moxon(236) thought that such “electrophonic” responses wereartifacts, Nuttall and Ren (265) have presented evidencethat they do not originate at the stimulating electrode andthat they require the presence of an intact organ of Corti.It seems as if the fast deformation of biological tissue,probably the outer hair cells, generates (“fast”) acousticpressure waves. Because these apparently behave in ev-ery respect like the pressure waves produced by ossicularvibration, they generate (“slow”) traveling waves thatpropagate in the cochlear fluids and the BM (see sect. V).
Direct currents passed across the organ of Corti pro-duce marked changes in BM responses to acoustic toneswith frequencies at and above CF, and little changes inresponses to tones with frequencies below CF (264). Pos-itive currents (from scala vestibuli to scala tympani) in-crease the sensitivity and frequency tuning of BM sound-evoked motion and shift its characteristic frequencyupward, and negative currents decrease the sensitivityand tuning of the response and shift the characteristicfrequency downward (264). These effects suggest thatpositive and negative direct currents modify cochlear am-plification via enhancement and reduction of the trans-
duction currents in outer hair cells, respectively. Presum-ably, the effect of negative currents is analogous to that ofdecreased endocochlear potential, such as brought aboutby furosemide (see sect. IXB3).
There is no consensus regarding the polarity of thepartition movements produced by injection of electricalcurrents into the cochlea. Both BM displacements towardscala tympani (219, 265) and toward scala vestibuli (406)have been reported for positive currents injected intoscala media (or scala vestibuli). [Yet, in another report,positive and negative currents into scala vestibuli pro-duce displacements toward scala tympani (264).] Onepossible reason for these disparate findings is that understimulation with electrical sinusoids the arcuate and pec-tinate regions of the BM (see footnote 4) move withopposite polarity (404) so that the seemingly contradic-tory reports may reflect different radial sites of measure-ment. Paradoxically, although BM DC-displacement re-sponses to electrical current pulses also exhibit oppositepolarity in the arcuate and pectinate regions, the corre-sponding ringing or transient responses (which closelyresemble responses to acoustic clicks) do not undergophase shifts as a function of radial position (262). Theabsence of phase shifts in the ringing responses is directlyat odds with the polarity reversal observed in response toelectrical sinusoids at the boundary between the arcuateand pectinate zones (404).
E. Origin of Compression and Other
BM Nonlinearities
The receptor potentials of hair cells vary nonlinearlywith stereociliary displacement (155, 201), following avoltage-displacement relation that exhibits compressionand saturation and resembles a second-order Boltzmannfunction. In general, functions exhibiting compressionand/or saturation generate harmonic distortion, as well assuppression and intermodulation distortion under stimu-lation with tone pairs (98, 214, 215, 420). Because themechanical feedback that the organ of Corti exerts uponBM vibration appears to be controlled by the magnitudeof hair cell receptor potentials or transduction currents(see sect. XD), it stands to reason that the nonlinearitiespresent in the transduction process must necessarily re-sult in mechanical counterparts in BM vibration. Accord-ingly, models incorporating a feedback loop betweenouter hair cells and BM vibration often identify mechan-ical-to-electrical transduction as the source of all BMnonlinear phenomena, including the compressive nonlin-ear growth at CF, as well as two-tone suppression andintermodulation distortion (29, 77, 119, 197, 232, 235, 275,279, 421, 422).
There are two other nonlinear processes, namely,adaptation (11, 55, 94, 147; reviewed by Eatock, Ref. 93)
1338 LUIS ROBLES AND MARIO A. RUGGERO Volume 81

and nonlinear gating stiffness (148), that characterizemechanoelectrical transduction in hair cells of the frogsacculus and which could conceivably also play a role ingenerating BM nonlinearities in the mammalian cochlea.However, evidence for the presence of adaptation andnonlinear gating stiffness in outer hair cells is still meagerand mostly derived from recordings in immature cochleae(202, 336, 339).
Finally, the feedback process itself may be a sourceof nonlinearity (see sect. XD). In the case of outer hair cellsomatic electromotility, the deformation of outer haircells follows a nonlinear (Boltzmann) function of trans-membrane voltage, which should introduce nonlinear ef-fects into BM vibrations. These effects, however, arelikely to be smaller than those originating in the nonlin-earity of forward transduction under normal in vivo con-ditions (279, 348).
X. THE “COCHLEAR AMPLIFIER”
A. Are Cochlear Vibrations Really Amplified?
Although the existence of an organ of Corti mechan-ical feedback upon the BM is now well established, thenature of the feedback, including the question of whetherit involves expenditure of biological energy, remains un-certain. In strict terms, the existence of amplification hasbeen addressed directly only by analyses of power fluxes(17, 90, 91, 189, 211). Such analyses, in which energy flowsalong the cochlear duct are calculated from the experi-mentally measured magnitudes and phases of BM vibra-tion, attempt to determine whether the power flux alongthe cochlea increases as the wave propagates toward itsresonance point. Increased power fluxes indicate that thecochlea adds energy to the traveling wave in excess ofthat present in the acoustic stimulus. Calculations basedon data from sensitive cochleae suggest that BM vibra-tions are indeed biologically amplified, whereas no ampli-fication is found in the case of insensitive cochleae (17,90, 91).
In addition to analyses of power fluxes, the veryexistence of spontaneous otoacoustic emissions suggeststhat biological energy can be converted into cochlearvibrations and, therefore, may be taken as (indirect) evi-dence favoring cochlear amplification in the strict sense.Spontaneous otoacoustic emissions are narrow-bandsounds emanating continuously from the inner ear (175,398, 414) in the absence of acoustic stimulation. Both theoccasionally large magnitude of spontaneous emissions(316, 414) and the nature of their frequency spectra (14,403) argue that they do not originate from Brownianmotion within the cochlear fluids but rather that theyrepresent free-standing oscillators powered by biological
energy sources (e.g., Ref. 373).9 Because there is evidence(albeit indirect) that spontaneous emissions are accom-panied by corresponding BM vibrations (102, 284), it isnot too far-fetched to postulate that the same processesthat give rise to spontaneous emissions are also involvedin amplifying the magnitude of acoustically stimulatedBM motion.
Interestingly, spontaneous otoacoustic emissions arebroadcast not only by the ears of mammals but also ofother vertebrates, e.g., frogs, which have neither a BM norouter hair cells (385), and lizards and birds, which have aBM but lack outer hair cells (199, 374). The existence ofspontaneous otoacoustic emissions in nonmammalianvertebrates has led to the hypothesis that the inner ears ofthese animals also possess “amplifiers” (154, 198, 222)whose function is to enhance the motion of hair cellstereocilia (see sect. XE).
B. Gain of the Cochlear Amplifier
Because the amplification (or sensitivity boost) pro-vided by the cochlear amplifier to BM vibration varieswith stimulus frequency and intensity, as well as with thephysiological condition of the cochlea, several definitionsof its gain are possible. One definition presupposes thatBM responses to CF tones grow linearly at both low andhigh levels of stimulation (123, 164, 279, 408). The co-chlear amplifier gain could then be defined as the differ-ence between the asymptotic sensitivities of responses tohigh- and low-level CF tones. However, because compres-sive growth prevails even at very high levels (Figs. 2, 3,and 5), it is only possible to specify lower bounds for thecochlear amplifier gain. These lower bounds, compared inTables 1 and 3, reach 69 dB at mid-basal sites but appearto be substantially lower at the hook region (36 dB). Therelatively low values at the hook may well underestimatethe sensitivity of fully normal cochleae. At the apex, gainsare even smaller or actually negative (Fig. 11). Gainsamount to 22 dB in the compressive responses in chin-chilla, 0 in the linear responses in guinea pig, and 221 dBin guinea pig cochleae exhibiting “active attenuation.” It isnot clear whether the low (or zero) gains result fromsensitivity losses due to surgical damage or simply indi-cate that amplification is weak (or nonexistent) in per-fectly normal cochleae. Active attenuation (413) is aunique finding that demands replication and reinforcesthe impression that cochlear mechanics differ fundamen-
9 Brownian motion may play some role in cochlear mechanics. Ithas been estimated that, if the stereocilia of inner hair cells are freestanding, their motion at low stimulus levels might be aided by “stochas-tic resonance” driven by Brownian motion in the endolymph (89, 159).There is also evidence that, in the absence of acoustic stimulation, theBM exhibits frequency-tuned vibrations (263). Their amplitudes (,10mm/s), however, appear to be insufficient to generate neural excitation.
July 2001 MECHANICS OF THE MAMMALIAN COCHLEA 1339

tally between the extreme apex and more basal regions(see sect. IV).
Another definition states that the gain of the cochlearamplifier corresponds to the difference between the max-imum sensitivities of BM responses to CF tones in vivoand postmortem (Figs. 10 and 19). According to this def-inition, the cochlear amplifier gain is as large as 78 dB atthe 17- to 18-kHz site of the guinea pig cochlea (164, 259,355) and 81 dB at the 9- to 10-kHz region of the chinchillacochlea (326).
The aforementioned definitions of cochlear amplifiergain disregard the frequency shifts of the sensitivity peaks(which are displaced downward by about one-half octavepostmortem or for high-intensity stimuli in vivo) as wellas possible alterations of cochlear passive properties(e.g., elasticity) brought about by death. Therefore, wefavor a third definition (74, 326) which addresses theseissues: the cochlear amplifier gain is the difference be-tween the peaks in the sensitivity functions for low- andhigh-intensity tones (Figs. 5 and 13) or between in vivoand postmortem responses (Fig. 10). According to thisdefinition, the cochlear amplifier gain, measured in termsof displacement (Table 1), is 35–58 dB at the 9- to 10-kHzsite of the chinchilla (326) and 35 dB at the 17- to 18-kHzregion of the guinea pig (52, 164).
C. Location of the Cochlear Amplifier
Keeping in mind the mapping of CF upon longitudinalcochlear position, the level dependence of the frequencyof maximal BM response sensitivity at the base of thecochlea (Figs. 5 and 10) suggests that the passive travel-ing wave has a spatial envelope that peaks ;1 mm or sobasal to the peak of the active (i.e., amplified) wave. Thisposition shift presumably reflects the fact that the ampli-tude at the characteristic place is a function of amplifica-tion not only at that particular site, but also over a longercochlear region, extending mostly toward more basal lo-cations. Presumably, as the BM traveling wave propagatesit gathers energy from outer hair cells nearby until itreaches and passes the BM site of passive resonance forany given stimulus frequency. This idea has been embod-ied in mathematical models of the cochlea, which typi-cally include active elements or negative resistance dis-tributed over a region basal to the characteristic place(78, 79, 189, 248, 249, 421).
The spatial distribution of amplifier elements hasbeen estimated by studying the effects of cochlear lesionson the responses of spiral ganglion neurons innervatingneighboring inner hair cells (36). Significant losses insensitivity were observed in spiral ganglion neurons lo-cated at the apical edge of regions with many missing ordamaged outer hair cells. This indicates that amplificationof the traveling wave occurs in a region basal to the CF
place. Sensitive and sharply tuned responses could berecorded from neurons located apical to and within 0.5mm of an area where 97% of the outer hair cells weremissing or damaged, and within 1.3 mm of an area whereall outer hair cells were missing. This suggests that thecochlear amplifier spans a region between 0.5 and 1.3 mmbasal to the CF site.
Since compressive nonlinearity appears to be inex-tricably linked to amplification (see sects. II and VII), thepresence, extent, and spatial distribution of amplificationmay be inferred by ascertaining the rate of growth ofresponses to single tones as a function of cochlear loca-tion. However, because the literature contains few dataon the spatial patterns of BM responses to single tones, itis useful to attempt to derive such patterns from curves ofBM sensitivity as a function of frequency (such as those ofFig. 5) recorded at a single location. On the assumptionthat BM amplitude and phase scales depend only on theratio of stimulus frequency to CF, the amplitudes of theBM as a function of distance are derived from the re-sponses measured at a single BM point (415), using mapsthat relate CF to longitudinal cochlear position (97, 128,208). Therefore, the spatial extent of the amplifier can beassessed by measuring at a single location the range offrequencies around CF over which responses grow atcompressive rates. For the chinchilla cochlear site withCF ;9–10 kHz, this frequency band extends from one-halfoctave below CF to one-third octave above CF (326). Thecorresponding distances (for a cochlear map with slope of2.5 mm/octave CF, Ref. 128) are 1.3 mm on the basal sideand 0.8 mm on the apical side, respectively, of the char-acteristic place, yielding an overall region of nonlinearityof ;2.1 mm. The spatial extent of this region comparesfavorably with values estimated by analyses of cochlearpower flux of BM responses to tones (see sect. XA) (17,90) and by deriving the mechanical impedance of the BMas a function of distance from first-order Wiener kernelscomputed from BM responses to wide-band noise (seesect. IIB) (85). Such estimates show that the region of“activity” or “amplification,” where the main increase inpower flux occurs and the real part of the impedanceattains negative values, extends basalward from the char-acteristic site over a distance of 1–2 mm.
The longitudinal spatial representation of singletones on the BM has been measured directly in the co-chleae of guinea pig (338) and chinchilla (300). Bothstudies found that nonlinear growth was distributed moreor less symmetrically on both sides of the characteristicplace. In the guinea pig cochlea (Fig. 14), nonlineargrowth of BM displacements was restricted to a 1.25-mmregion flanking the characteristic place. In the chinchilla,the region of nonlinearity was somewhat longer and var-ied with CF: its extent ranged from 2 mm for a CF of 15kHz to 3.5 mm for a CF of 5.5 kHz (300), consistent withthe 2.1 mm computed above on the basis of responses
1340 LUIS ROBLES AND MARIO A. RUGGERO Volume 81

measured at a single site of the chinchilla cochlea with CF;9–10 kHz (326). The guinea pig data of Figure 14 are atvariance with expectations in that spatial tuning does notshift along the cochlea when stimulus intensities are var-ied over a wide range. This result, however, is contra-dicted by comparable measurements carried out in chin-chilla (300), which yielded results entirely consistent withpredictions based on sensitivity versus frequency func-tions for one cochlear position (Fig. 5).
D. Cellular Basis of the Cochlear Amplifier
The feedback from the organ of Corti that enhancesthe sensitivity and frequency tuning of BM responses inthe normal cochlea, the cochlear amplifier, presumablyinvolves mechanical forces produced by the outer haircells under the direct or indirect control of the (forward)transduction currents. The process that has received themost attention as an embodiment of the cochlear ampli-fier is “somatic electromotility,” the electrically inducedlongitudinal deformation of outer hair cells discovered byBrownell et al. (21). Somatic electromotility consists of arapid elongation or shortening of outer hair cells thataccompanies, respectively, the hyperpolarization or depo-larization of their transmembrane potential (10, 63, 167).Such changes in length are generally thought to reflectforces produced by a large number of molecular motors(67, 145), but they may also reflect dynamic stiffnesschanges (70, 138). The motors, densely distributed in thebasolateral plasma membrane (168), appear to be mole-cules of prestin, a newly identified protein (412). Changesin transmembrane voltage (not current) are translatedinto length changes according to a Boltzmann functionwith a peak sensitivity of 30 nm/mV (350). In vitro, thelength changes follow imposed voltage changes very rap-idly, with an upper frequency cut-off at least as high as 79kHz (109). Intrinsically, such responses are sufficientlyfast to provide forces (or stiffness changes) potentiallycapable of enhancing BM vibration, on a cycle-by-cyclebasis, even at the highest-CF regions of the cochleae ofmost mammalian species (104). However, the capacitanceof the basolateral membrane causes the AC receptor po-tentials of outer hair cells to roll off as a function ofincreasing frequency above ;1.2 kHz, at a rate of 6 dB/octave, so that they are very small at high frequencies[e.g., 15 mV for a 16-kHz (CF) stimulus presented nearneural threshold, 15 dB SPL] (333). Therefore, at suchfrequencies, at threshold levels, somatic electromotilitywould be much too weak to account for BM displace-ments in the order of 1 nm (347). Although the decay ofreceptor potentials with frequency might be amelioratedif electromotility at high frequencies could be driven bythe extracellular electrical fields generated jointly bymany outer hair cells (65), the efficacy of such mechanismremains unclear (66).
Another possibility is that the stereociliary transduc-tion mechanism itself functions bidirectionally (393). Theinner ears of certain nonmammalian vertebrates can pro-duce spontaneous otoacoustic emissions (see sect. XA),and their hair cells can respond to mechanical stimulationwith stereociliar “twitches” (13, 57, 88). These “twitches”and spontaneous emissions may signal the existence ofamplification that enhances stereociliar responses to low-level stimulation. One mechanism could involve actin,myosin, and ATPase activity, all of which are present instereocilia and probably participate in the adaptation oftransduction currents to sustained stereociliar displace-ment (154). Rapid movements of hair-bundle myosin mol-ecules could change the tension on the tip links betweenstereocilia, producing motion. However, it is doubtful thatactin/myosin interactions can be fast enough to play a rolein amplifying high-frequency stimuli. A faster mechanismcould be based on an interaction between calcium ionsand the mechanoelectrical transduction channels (34).Upon opening of the transduction channels (due to posi-tive stereociliar deflection), calcium ions enter into thestereocilium, apparently promoting closure of the trans-duction channels and causing negative stereociliar deflec-tion (158). When the frog saccular macula is held in vitroin a chamber allowing endolymph-like fluid to bathe theapical surface of the hair cells, the stereocilia displayspontaneous oscillations as large as 50 nm and are able toamplify imposed displacements, with expenditure of met-abolically generated energy (226).
A current-driven “stereociliar amplifier” would havethe advantage of not being subject to low-pass filtering bythe basolateral membrane of outer hair cells (which re-duces the voltage drive for somatic electromotiliy at highfrequencies). It would also be consistent with the obser-vation that low-frequency tones can modulate electricallyevoked otoacoustic emissions (assuming that the latterindicate the operation of electrical-to-mechanical or re-verse transduction) (410). Although there is no experi-mental evidence for the existence of active hair bundlemotion in outer hair cells, cochlear amplification in themammalian cochlea could conceivably involve both thestereociliar mechanism and somatic electromotility. It hasbeen proposed that the former could enhance BM motionon a cycle-by-cycle basis, whereas the latter could controlthe operating point of the amplifier via activity of themedial olivocochlear efferent system (185). At present,however, it seems unlikely that a fast stereociliar ampli-fier could enhance BM vibrations in mammalian cochleaesince such a mechanism would be effective only if thestiffness of the stereocilia were an important fraction ofthe overall stiffness of the BM/organ of Corti/TM complex(12, 13). The available evidence, albeit not conclusive,indicates that the stiffness of the BM (e.g., 6–11 N/m, Ref.268) far exceeds the stiffness of stereociliary bundles (in
July 2001 MECHANICS OF THE MAMMALIAN COCHLEA 1341

the order of 0.002–0.005 N/m for outer hair cells, Refs.302, 336).
E. Amplification and the Origin
of Frequency Specificity
For longer than a century, the fundamental questionof cochlear mechanics has been, “What mechanisms ac-count for frequency tuning?” In contemporary terms, wemay ask, “What mechanisms account for the frequency-specific and intensity-dependent properties of cochlearresponses to sound, including sharp frequency tuning atlow stimulus levels?” Although an electromechanicalfeedback between receptor currents and BM motionhelps to unify and explain some of the fundamental prop-erties of cochlear responses to sound, including the originof nonlinearities (see sect. IXE), it may not by itself ac-count for frequency specificity. In a frequency-tuned sys-tem like the cochlea, in which sharpness of tuning islimited by viscous damping, it should be possible to in-crease the sharpness of tuning by adding a force thatopposes damping. Such a scheme was successfully imple-mented in an early model of active cochlear mechanicsincorporating “negative damping” (of unspecified origin)over a limited region of the cochlear partition (189). It isnot clear, however, whether sharply tuned BM responsescan be obtained with models based on a feedback loopthat does not itself include frequency filtering. To mimicBM vibrations realistically, modelers of cochlear mechan-ics using specific mechanisms (such as somatic electro-motility) to generate active forces have found it necessaryto include frequency-specific properties other than thepassive resonance of the BM.10 This has been typicallyaccomplished by including a secondary resonant systemin the path that delivers the active forces to the BM (169,220, 224, 248, 249). Such secondary resonances (whichusually represent putative micromechanical interactionsof the TM, the reticular lamina, the subtectorial fluids, andthe stereocilia) have resonant frequencies that define afrequency-distance cochlear map distinct from the mapthat relates to the passive resonances of the BM. Otherfeedback models (114, 115) do not include secondaryresonances but, instead, introduce frequency specificityin the guise of delays that are proportional to the charac-teristic period (51/CF) and thus vary systematically alongthe length of the cochlea (416). The variation of delaywith distance is equivalent to a frequency-to-distancemap, chosen so that at each position the feedback forces
are exerted with timing appropriate to compensate for hy-drodynamic damping. Thus it seems that “good” modelingof BM vibrations requires not only the inclusion of a feed-back, but also of a filter or other frequency-specific mecha-nism that determines the proper timing for exerting thefeedback.11 In this context, it is noteworthy that whereassomatic electromotility provides no intrinsic filtering, ste-reociliar amplification (such as described in saccular haircells) is inherently frequency specific (34, 226).
XI. CONCLUSIONS
At the base of the mammalian cochlea, the sharpfrequency tuning of auditory nerve fibers is fully deter-mined by the vibration of the BM. The second filter pos-tulated at one time is unnecessary, except as a minoradjunct. In this respect, the mammalian cochlea differsfundamentally from the cochleae of turtles (and, perhaps,other reptiles and birds), where second filters, resident inhair cells, sharpen the frequency tuning and enhance thesensitivity of BM vibrations. Furthermore, all the CF-specific nonlinearities of auditory-nerve responses, in-cluding dependence of frequency tuning on stimulus in-tensity, two-tone rate suppression and intermodulationdistortion, also have correlates in BM motion.
Input/output functions for BM responses at basalcochlear sites are highly compressive (0.2–0.3 dB/dB) atfrequencies around CF. This compressive behavior, whichallows the cochlea to translate the enormous range (120dB) of auditory stimuli into a range of vibrations (30–40dB) suitable for transduction by the inner hair cells, prob-ably provides the foundation of many psychoacousticphenomena, such as the nonlinear growth of forwardmasking with masking level and the level dependence inthe ability to detect changes in stimulus intensity (230).
At the base of the cochlea, high sensitivity, frequencyselectivity, and nonlinearity of BM vibrations are inti-mately linked and highly labile, depending on the physi-ological state of the organ of Corti, generally, and on thereceptor potentials or transduction currents of outer haircells specifically. This indicates that in normal cochleaethe sensitivity and frequency tuning of BM responses areenhanced by a positive feedback from the organ of Corti,the cochlear amplifier. This amplification of cochlear vi-brations appears to involve active forces generated by theouter hair cells under direct or indirect control of theirtransduction currents and capable of operating up to thehighest frequency limits of mammalian hearing.
10 The single exception appears to be a single-resonance model(113) in which fairly realistic BM tuning was achieved solely by reducingdamping by means of an electromechanical feedback loop. Unfortu-nately, the model was based on the assumption that depolarizationelongates outer hair cells, i.e., a polarity of electromotility opposite tothat actually present in outer hair cells (10, 350; see also Ref. 224).
11 Hubbard has presented a unique, two-mode model of the co-chlea consisting of two coupled transmission lines. Although only one ofthe transmission lines includes resonances, the other one does includedelays that vary systematically with longitudinal cochlear position. Thevelocities of the two lines match in a short region of the cochlea, inwhich mutual feedback occurs, producing “BM vibrations” that mimicexperimental values amazingly well (150).
1342 LUIS ROBLES AND MARIO A. RUGGERO Volume 81

At the apex of the cochlea, compressively nonlinearvibrations, reminiscent of those at the base, have beenrecorded at the 400- to 800-Hz CF region of chinchilla, butit is not clear whether even the most sensitive data avail-able are representative of the properties of intact co-chleae. At more apical cochlear locations in guinea pig,one report described a weak expansive nonlinearity (413),but others found only linear responses (49, 178). Theseresults suggest that at the extreme cochlear apex positivefeedback (the cochlear amplifier) plays a lesser role thanat the base.
Several other important questions about cochlearmechanics remain unanswered. What mechanical trans-formations intervene between BM motion and deflectionof inner hair cell stereocilia? Are there different modes ofinner hair cell stimulation? Does the positive feedbackloop that boosts BM vibration include tuned elementsadditional to the passive resonance of the BM? Does thismechanism, the cochlear amplifier, actually make use ofbiological energy to boost BM vibrations? Does the co-chlear amplifier reside in the basolateral membrane ofouter hair cells, in their stereocilia, or in both structures?Are spontaneous otoacoustic emissions generated by thesame mechanism that amplifies BM vibrations? Whatmechanisms are involved in the efferent control of thegain of the cochlear amplifier?
XII. APPENDIX: METHODS FOR MEASURING
COCHLEAR VIBRATIONS
Early measurements of BM vibration were performedusing light microscopy under stroboscopic illumination(391). The limited sensitivity of this technique restrictedthe observations to displacements larger than 1 mm andrequired the use of very intense stimuli (e.g., 140 dB SPL).
A. Mossbauer Technique
The first in vivo recordings of BM vibrations (163) aswell as the discovery (293) and early descriptions ofcompressive nonlinearities (306, 307, 355, 357, 360) werecarried out using an application of the Mossbauer effect.A small source of gamma photons is placed on the BM,and a resonant absorber, tuned to the energy of photonsemitted by the source at or near rest, is interposed be-tween the source and a detector. With such configuration,the rate of detected photons is a function of the velocityof the source (293, 355). Because this function is ex-tremely nonlinear, undistorted velocity measurements areonly possible over a narrow range of response magni-tudes. This inherent nonlinearity also confounds the mea-surements of nonlinear cochlear phenomena, such astwo-tone interactions.
B. Capacitive Probe
Cochlear vibrations have also been measured using acapacitive probe. This technique, first used by von Bekesy(391), relies on measuring the capacitance that existsbetween electrically conducting objects, such as a fixedelectrode and the BM, when separated by a nonconduct-ing gap (e.g., air). BM vibrations cause changes in capac-itance, which in turn modulate a radio-frequency carriersignal (391, 402). Although this method is very sensitiveand inherently linear, it requires the removal of most ofthe perilymph from scala tympani at the measurement siteso that the BM remains covered only by a thin film of fluid.In practice, this is difficult to achieve without causingdamage.
C. Optical Methods
Most laboratories now measuring cochlear vibrationshave adopted optical techniques, principally severalforms of laser interferometry, which are essentially linearand at least one order of magnitude more sensitive thanthe Mossbauer method (321). In heterodyne laser inter-ferometry, the laser light is split into two beams whosefrequencies are shifted so that they differ by Df. One ofthe beams is reflected from the vibrating target and theother serves as a fixed reference. Upon reflection, thebeams are recombined at a detector that produces aninterference or beat signal with frequency Df. Vibrationsof the target change the optical path length and translateinto a phase modulation of the beat signal. Direct mea-surement of this phase change provides a signal propor-tional to the displacement of the target (47). Alternatively,target velocity may be extracted by frequency demodula-tion (157, 397), much as implemented in commerciallyavailable Doppler-shift laser vibrometers (261, 321).
Yet another type of interferometer (200, 269) utilizesthe self-mixing effect of a laser diode; when some of theemitted light is reflected back into the laser cavity, theintensity of the light is modulated in proportion to thedistance between laser and target (190). The modulationis measured by a photodiode located behind the lasercrystal. One limitation of this method is that the modula-tion becomes significantly nonlinear for displacement am-plitudes larger than 30 nm.
Laser interferometers are typically used in conjunc-tion with a compound microscope to facilitate the iden-tification and targeting of vibrating cochlear structures(44, 47, 261, 321). In the case of the confocal heterodynevelocimeter used by the ITER group (157), the interferom-eter is integrated with a specially designed optical sec-tioning microscope intended to confine the measurementsite within a thin slice of tissue.
Cochlear motion has also been measured (204, 406)
July 2001 MECHANICS OF THE MAMMALIAN COCHLEA 1343

using a fiber-optic probe whose tip is placed in closeproximity to the BM (40). The probe consists of one ormore central fibers that deliver light to the target andsurrounding fibers that receive reflected light. Theamount of light captured by the receiving fibers variesapproximately in proportion to target displacement sothat target vibration modulates light intensity, which ismeasured with a photodiode.
With the exception of the confocal heterodyne velo-cimeter (157), the self-mixing laser interferometer (200),and a newly developed heterodyne displacement inter-ferometer (44), most optical techniques for measuringcochlear vibration require the use of light-reflecting tar-gets (small flat mirrors, glass microbeads, or polystyrenemicrobeads coated with gold) to make up for the trans-parency of the BM, the organ of Corti, or the TM. Thisraises the question of whether these reflective objects (orradioactive metal foils in the case of the Mossbauer tech-nique) follow the movement of the cochlear partition.This question has generated conflicting answers. Onestudy found that beads placed on the TM or on Claudius’cells in the apical turns of isolated cochleae faithfullyfollow their motion (132). Another study at the apex ofisolated cochleae confirmed the result in the case of theTM but found that beads did not follow the motion ofClaudius’ cells closely (180). Yet a third study in the basalturn of the in vivo cochlea found no significant differencesbetween the motion of beads and adjacent sites of the BM(44, 45).
We are grateful to Graeme Yates, who reviewed a previousversion of this manuscript and helped to improve it greatly. Weare very sorry that he could not see its final version. We alsothank Mary Ann Cheatham, Gulam Emadi, and Robert Withnellfor their comments; Peter Dallos and David Mountain for infor-mative discussions; and Shyamla Narayan, Ed Overstreet, andAndrei Temchin for their help in the preparation of the figures.
We were supported by National Institute on Deafness andOther Communication Disorders Grants R01-DC-00419 and P01-DC-00110.
Address for reprint requests and other correspondence:M. A. Ruggero, Dept. of Communication Sciences and Disorders,Northwestern University, 2299 North Campus Dr., Evanston, IL60208–3550 (E-mail: [email protected]).
REFERENCES
1. ABBAS PJ. Effects of stimulus frequency on two-tone suppression: acomparison of physiological and psychophysical results. J Acoust
Soc Am 63: 1878–1886, 1978.2. ABBAS PJ AND SACHS MB. Two-tone suppression in auditory-nerve
fibers: extension of a stimulus-response relationship. J Acoust Soc
Am 59: 112–122, 1976.3. ALLEN JB. Two-dimensional cochlear fluid model: new results. J
Acoust Soc Am 61: 110–119, 1977.4. ALLEN JB. Cochlear micromechanics—a physical model of trans-
duction. J Acoust Soc Am 68: 1660–1670, 1980.5. ALLEN JB AND FAHEY PF. A second cochlear-frequency map that
correlates distortion product and neural tuning measurements. J
Acoust Soc Am 94: 809–816, 1993.
6. ALLEN JB AND NEELY ST. Micromechanical models of the cochlea.Physics Today 45: 40–47, 1992.
7. ANDERSON DJ, ROSE JE, HIND JE, AND BRUGGE JF. Temporal positionof discharges in single auditory nerve fibers within the cycle of asine-wave stimulus: frequency and intensity effects. J Acoust Soc
Am 49: 1131–1139, 1971.8. ART JJ AND FETTIPLACE R. Variation of membrane properties in hair
cells isolated from the turtle cochlea. J Physiol (Lond) 385: 207–242, 1987.
9. ARTHUR RM, PFEIFFER RR, AND SUGA N. Properties of “two-toneinhibition” in primary auditory neurons. J Physiol (Lond) 212:593–609, 1971.
10. ASHMORE JF. A fast motile response in guinea-pig outer hair cells:the cellular basis of the cochlear amplifier. J Physiol (Lond) 388:323–347, 1987.
11. ASSAD JA, HACOHEN N, AND COREY DP. Voltage dependence of adap-tation and active bundle movement in bullfrog saccular hair cells.Proc Natl Acad Sci USA 86: 2918–2922, 1989.
12. BENSER ME, ISSA NP, AND HUDSPETH AJ. Hair-bundle stiffness dom-inates the elastic reactance to otolithic-membrane shear. Hear Res
68: 243–252, 1993.13. BENSER ME, MARQUIS RE, AND HUDSPETH AJ. Rapid, active hair
bundle movements in hair cells from the bullfrog’s sacculus. J Neu-
rosci 16: 5629–5643, 1996.14. BIALEK WS AND WIT HP. Quantum limits to oscillator stability:
theory and experiments on acoustic emissions from the human ear.Phys Lett 104A: 173–178, 1984.
15. BODE H. Network Analysis and Feedback Amplifier Design. NewYork: Van Nostrand, 1945.
16. BOOKER JR AND BRETHERTON FP. The critical layer for internalgravity waves in a shear flow. J Fluid Mech 27: 513–539, 1967.
17. BRASS D AND KEMP DT. Analyses of Mossbauer mechanical measure-ments indicate that the cochlea is mechanically active. J Acoust Soc
Am 93: 1502–1515, 1993.18. BRAUN M. Tuned hair cells for hearing, but tuned basilar membrane
for overload protection: evidence from dolphins, bats, and desertrodents. Hear Res 78: 98–114, 1994.
19. BROWN AM AND WILLIAMS MW. A second filter in the cochlea. In:Biophysics of Hair Cell Sensory Systems, edited by Duifhuis H,Horst JW, Van Dijk P, and van Netten SM. Singapore: World Sci-entific, 1993, p. 72–77.
20. BROWN MC, NUTTALL AL, AND MASTA RI. Intracellular recordingsfrom cochlear inner hair cells: effects of stimulation of the crossedolivocochlear efferents. Science 222: 69–72, 1983.
21. BROWNELL WE, BADER CR, BERTRAND D, AND RIBAUPIERRE YD. Evokedmechanical responses of isolated cochlear outer hair cells. Science
227: 194–196, 1985.22. BRUNDIN L, FLOCK Å, KHANNA SM, AND ULFENDAHL M. Frequency-
specific position shift in the guinea pig organ of Corti. Neurosci
Lett 128: 77–80, 1991.23. BRUNDIN L, FLOCK Å, KHANNA SM, AND ULFENDAHL M. The tuned
displacement response of the hearing organ is generated by theouter hair cells. Neurosci 49: 607–616, 1992.
24. BRUNDIN L, FLOCK B, AND FLOCK Å. Sound induced displacementresponse of the guinea pig hearing organ and its relation to thecochlear potentials. Hear Res 58: 175–184, 1992.
25. BRUNDIN L, KHANNA SM, KOLSTON PJ, AND ULFENDAHL M. Commentsand replies to “Cellular motility in the guinea pig cochlea,” by A. W.Gummer et al. In: Biophysics of Hair Cell Sensory Systems, editedby Duifhuis H, Horst JW, Van Dijk P, and van Netten SM. Singapore:World Scientific, 1993, p. 236–239.
26. BUUNEN TJF AND RHODE WS. Responses of fibers in the cat’s audi-tory nerve to the cubic difference tone. J Acoust Soc Am 64:772–781, 1978.
27. CAI Y AND GEISLER CD. Suppression in auditory-nerve fibers of catsusing low-side suppressors. I. Temporal aspects. Hear Res 96:94–112, 1996.
28. CAI Y AND GEISLER CD. Suppression in auditory-nerve fibers of catsusing low-side suppressors. II. Effect of spontaneous rates. Hear
Res 96: 113–125, 1996.29. CAI Y AND GEISLER CD. Suppression in auditory-nerve fibers of cats
using low-side suppressors. III. Model results. Hear Res 96: 126–140, 1996.
1344 LUIS ROBLES AND MARIO A. RUGGERO Volume 81

30. CHEATHAM MA AND DALLOS P. Two-tone suppression in inner haircell responses. Hear Res 40: 187–196, 1989.
31. CHEATHAM MA AND DALLOS P. Comparison of low-side and high-sidetwo-tone suppression in inner hair cell and organ of Corti re-sponses. Hear Res 50: 193–210, 1990.
32. CHEATHAM MA AND DALLOS P. Low-frequency modulation of innerhair cell and organ of Corti responses in the guinea pig cochlea.Hear Res 108: 191–212, 1997.
33. CHEATHAM MA AND DALLOS P. The level dependence of responsephase: observations from cochlear hair cells. J Acoust Soc Am 104:356–369, 1998.
34. CHOE Y, MAGNASCO MO, AND HUDSPETH AJ. A model for amplificationof hair-bundle motion by cyclical binding of Ca21 to mechanoelec-trical-transduction channels. Proc Natl Acad Sci USA 95: 15321–15326, 1998.
35. CODY A AND JOHNSTONE B. Single auditory neuron response duringacute acoustic trauma. Hear Res 3: 3–16, 1980.
36. CODY AR. Acoustic lesions in the mammalian cochlea: implicationsfor the spatial distribution of the active process. Hear Res 62:166–172, 1992.
37. CODY AR AND JOHNSTONE BM. Acoustic trauma: single neuron basisfor the “half-octave shift.” J Acoust Soc Am 70: 707–711, 1981.
38. CODY AR AND MOUNTAIN DC. Low-frequency responses of inner haircells. Evidence for a mechanical origin of peak splitting. Hear Res
41: 89–100, 1989.39. CODY AR AND RUSSELL IJ. Acoustically induced hearing loss. Intra-
cellular studies in the guinea pig cochlea. Hear Res 35: 59–70, 1988.40. COOK RO AND HAMM CW. Fiber optic lever displacement transducer.
Appl Optics 18: 3230–3241, 1979.41. COOPER NP. Two-tone suppression in cochlear mechanics. J Acoust
Soc Am 99: 3087–3098, 1996.42. COOPER NP. Mid-band sensitivity notches in apical cochlear me-
chanics. In: Diversity in Auditory Mechanics, edited by Lewis ER,Long GR, Lyon RF, Narins PM, Steele CR, and Hecht-Poinar E.Singapore: World Scientific, 1997, p. 298–304.
43. COOPER NP. Harmonic distortion on the basilar membrane in thebasal turn of the guinea-pig cochlea. J Physiol (Lond) 509: 277–288,
1998.44. COOPER NP. An improved heterodyne laser interferometer for use in
studies of cochlear mechanics. J Neurosci Methods 88: 93–102,
1999.45. COOPER NP. Vibration of beads placed on the basilar membrane in
the basal turn of the cochlea (letter). J Acoust Soc Am 106: L59–L64, 1999.
46. COOPER NP. Radial variation in the vibrations of the cochlear par-tition. In: Recent Developments in Auditory Mechanics, edited byWada H, Takasaka T, Ikeda K, Ohyama K, and Koike T. Singapore:World Scientific, 2000, p. 109–115.
47. COOPER NP AND RHODE WS. Basilar membrane mechanics in thehook region of cat and guinea-pig cochleae: sharp tuning andnonlinearity in the absence of baseline position shifts. Hear Res 63:163–190, 1992.
48. COOPER NP AND RHODE WS. Basilar membrane tonotopicity in thehook region of the cat cochlea. Hear Res 63: 191–196, 1992.
49. COOPER NP AND RHODE WS. Nonlinear mechanics at the apex of theguinea-pig cochlea. Hear Res 82: 225–243, 1995.
50. COOPER NP AND RHODE WS. Fast travelling waves, slow travellingwaves and their interactions in experimental studies of apicalcochlear mechanics. Auditory Neurosci 2: 289–299, 1996.
51. COOPER NP AND RHODE WS. Two-tone suppression in apical co-chlear mechanics. Auditory Neurosci 3: 123–134, 1996.
52. COOPER NP AND RHODE WS. Mechanical responses to two-tonedistortion products in the apical and basal turns of the mammaliancochlea. J Neurophysiol 78: 261–270, 1997.
53. COOPER NP AND YATES GK. Nonlinear input-output functions derivedfrom the responses of guinea-pig cochlear nerve fibres: variationswith characteristic frequency. Hear Res 78: 221–234, 1994.
54. COSTALUPES JA, RICH NC, AND RUGGERO MA. Effects of excitatoryand non-excitatory suppressor tones on two-tone rate suppressionin auditory nerve fibers. Hear Res 26: 155–164, 1987.
55. CRAWFORD AC, EVANS MG, AND FETTIPLACE R. Activation and adap-tation of transducer currents in turtle hair cells. J Physiol (Lond)
419: 405–434, 1989.
56. CRAWFORD AC AND FETTIPLACE R. An electrical tuning mechanism inturtle cochlear hair cells. J Physiol (Lond) 312: 377–412, 1981.
57. CRAWFORD AC AND FETTIPLACE R. The mechanical properties ofciliary hair bundles of turtle cochlear hair cells. J Physiol (Lond)
364: 359–379, 1985.58. DALLOS P. Low-frequency auditory characteristics: species depen-
dence. J Acoust Soc Am 48: 489–499, 1970.59. DALLOS P. The Auditory Periphery: Biophysics and Physiology.
New York: Academic, 1973.60. DALLOS P. Comments on “Measurements of sound pressure in the
cochlea of anesthetized cats.” In: Facts and Models in Hearing,edited by Zwicker E and Terhardt E. Berlin: Springer-Verlag, 1974,p. 54–55.
61. DALLOS P. Response characteristics of mammalian cochlear haircells. J Neurosci 5: 1591–1608, 1985.
62. DALLOS P. Neurobiology of cochlear inner and outer hair cells:intracellular recordings. Hear Res 22: 185–198, 1986.
63. DALLOS P. The active cochlea. J Neurosci 12: 4575–4585, 1992.64. DALLOS P AND COREY ME. The role of outer hair cell motility in
cochlear tuning. Curr Opin Neurobiol 1: 215–220, 1991.65. DALLOS P AND EVANS BN. High-frequency motility of outer hair cells
and the cochlear amplifier. Science 267: 2006–2009, 1995.66. DALLOS P AND EVANS BN. High-frequency outer hair cell motility:
corrections and addendum. Science 268: 1420–1421, 1995.67. DALLOS P, EVANS BN, AND HALLWORTH R. Nature of the motor element
in electrokinetic shape changes of cochlear outer hair cells. Nature
350: 155–157, 1991.68. DALLOS P AND HARRIS D. Properties of auditory nerve responses in
absence of outer hair cells. J Neurophysiol 41: 365–382, 1978.69. DALLOS P, HARRIS DM, RELKIN E, AND CHEATHAM MA. Two-tone
suppression and intermodulation distortion in the cochlea: effectsof outer hair cell lesions. In: Psychophysical, Physiological and
Behavioural Studies in Hearing, edited by van den Brink G andBilsen FA. Delft, The Netherlands: Delft Univ. Press, 1980, p. 242–249.
70. DALLOS P AND HE DZZ. Outer hair cell stiffness and motility: unifiedmodels. In: Recent Developments in Auditory Mechanics, edited byWada H, Takasaka T, Ikeda K, Ohyama K, and Koike T. Singapore:World Scientific, 2000, p. 314–320.
71. DALLOS P, HE DZZ, LIN X, SZIKLAI I, MEHTA S, AND EVANS BN. Acetyl-choline, outer hair cell electromotility, and the cochlear amplifier.J Neurosci 17: 2212–2226, 1997.
72. DANCER A. Experimental look at cochlear mechanics. Audiology 31:301–312, 1992.
73. DANCER A AND FRANKE R. Intracochlear sound pressure measure-ments in guinea pigs. Hear Res 2: 191–206, 1980.
74. DAVIS H. An active process in cochlear mechanics. Hear Res 9:79–90, 1983.
75. DAVIS H, MORGAN CT, HAWKINS JE, GALAMBOS R, AND SMITH FW.Temporary deafness following exposure to loud tones and noise.Acta Oto-Laryngol Suppl LXXXVIII: 4–57, 1950.
76. DE BOER E. Short-wave world revisited: resonance in a two-dimen-sional cochlear model. Hear Res 1: 253–281, 1979.
77. DE BOER E. Nonlinear interactions and the “Kemp echo.” Hear Res
2: 519–526, 1980.78. DE BOER E. No sharpening? A challenge for cochlear mechanics. J
Acoust Soc Am 73: 567–573, 1983.79. DE BOER E. On active and passive cochlear models: toward a
generalized analysis. J Acoust Soc Am 73: 574–576, 1983.80. DE BOER E. Auditory physics. Physical principles in hearing theory
III. Phys Rep 203: 125–231, 1991.81. DE BOER E. Mechanics of the cochlea: modeling efforts. In: The
Cochlea, edited by Dallos P, Popper AN, and Fay RR. New York:Springer-Verlag, 1996, p. 258–317.
82. DE BOER E. Cochlear models and minimum phase. J Acoust Soc Am
102: 3810–3813, 1997.83. DE BOER E AND NUTTALL AL. On cochlear cross-correlation func-
tions: connecting nonlinearity and “activity.” In: Diversity in Au-
ditory Mechanics, edited by Lewis ER, Long GR, Lyon RF, NarinsPM, Steele CR, and Hecht-Poinar E. Singapore: World Scientific,1997, p. 291–297.
84. DE BOER E AND NUTTALL AL. The mechanical waveform of thebasilar membrane. 1. Frequency modulations (“glides”) in impulse
July 2001 MECHANICS OF THE MAMMALIAN COCHLEA 1345

responses and cross-correlation functions. J Acoust Soc Am 101:3583–3592, 1997.
85. DE BOER E AND NUTTALL AL. The mechanical waveform of thebasilar membrane. III. Intensity effects. J Acoust Soc Am 107:1497–1507, 2000.
86. DELGUTTE B. Two-tone rate suppression in auditory-nerve fibers:dependence on suppressor frequency and level. Hear Res 49: 225–246, 1990.
87. DENG L AND GEISLER CD. Changes in the phase of excitor-toneresponses in cat auditory-nerve fibers by suppressor tones andfatigue. J Acoust Soc Am 78: 1633–1643, 1985.
88. DENK W AND WEBB WW. Forward and reverse transduction at thelimit of sensitivity studied by correlating electrical and mechanicalfluctuations in frog saccular hair cells. Hear Res 60: 89–102, 1992.
89. DENK W, WEBB WW, AND HUDSPETH AJ. Mechanical properties ofsensory hair bundles are reflected in their Brownian motion mea-sured with a laser differential interferometer. Proc Natl Acad Sci
USA 86: 5371–5375, 1989.90. DIEPENDAAL RJ, DE BOER E, AND VIERGEVER MA. Cochlear power flux
as an indicator of mechanical activity. J Acoust Soc Am 82: 917–926, 1987.
91. DIEPENDAAL RJ AND VIERGEVER MA. Are active elements necessary inthe basilar membrane impedance? J Acoust Soc Am 80: 124–132,
1986.92. DOLAN DF, GUO MH, AND NUTTALL AL. Frequency-dependent en-
hancement of basilar membrane velocity during olivocochlear bun-dle stimulation. J Acoust Soc Am 102: 3587–3596, 1997.
93. EATOCK RA. Adaptation in hair cells. Annu Rev Neurosci 23: 285–314, 2000.
94. EATOCK RA, COREY DP, AND HUDSPETH AJ. Adaptation of mechano-electrical transduction in hair cells of the bullfrog’s sacculus.J Neurosci 7: 2821–2836, 1987.
95. ECHTELER SM, FAY RR, AND POPPER AN. Structure of the mammaliancochlea. In: Comparative Hearing: Mammals, edited by Fay RRand Popper AN. New York: Springer-Verlag, 1994, p. 134–171.
96. EGGERMONT JJ. Wiener and Volterra analyses applied to the auditorysystem. Hear Res 66: 177–201, 1993.
97. ELDREDGE DH, MILLER JD, AND BOHNE BA. A frequency-position mapfor the chinchilla cochlea. J Acoust Soc Am 69: 1091–1095, 1981.
98. ENGEBRETSON AM AND ELDREDGE DH. Model for nonlinear charac-teristics of cochlear potentials. J Acoust Soc Am 44: 548–554, 1968.
99. EVANS EF. The frequency response and other properties of singlefibres in the guinea-pig cochlear nerve. J Physiol (Lond) 226:263–287, 1972.
100. EVANS EF AND KLINKE R. The effects of intracochlear and systemicfurosemide on the properties of single cochlear nerve fibres in thecat. J Physiol (Lond) 331: 409–428, 1982.
101. EVANS EF AND WILSON JP. Cochlear tuning properties: concurrentbasilar membrane and single nerve fiber measurements. Science
190: 1218–1221, 1975.102. EVANS EF, WILSON JP, AND BORERWE TA. Animal models of tinnitus.
In: Tinnitus. London: Pitman, 1981, p. 108–138.103. FAHEY PF AND ALLEN JB. Nonlinear phenomena as observed in the
ear canal and at the auditory nerve. J Acoust Soc Am 77: 599–612,
1985.104. FAY R. Comparative psychoacoustics. Hear Res 34: 295–306, 1988.105. FAY RR. Hearing in Vertebrates: A Psychophysics Databook. Win-
netka, IL: Hill-Fay, 1988.106. FEX J. Auditory activity in centrifugal and centripetal cochlear
fibres in the cat. Acta Physiol Scand Suppl 55: 189, 1962.107. FLOCK Å, FLOCK B, FRIDBERGER A, AND JAGER W. Methods for inte-
grating fluorimetry in the study of hearing organ structure andfunction. Hear Res 106: 29–38, 1997.
108. FLOCK Å, FLOCK B, FRIDBERGER A, SCARFONE E, AND ULFENDAHL M.Supporting cells contribute to control of hearing sensitivity. J Neu-
rosci 19: 4498–4507, 1999.109. FRANK G, HEMMERT W, AND GUMMER AW. Limiting dynamics of
high-frequency electromechanical transduction of outer hair cells.Proc Natl Acad Sci USA 96: 4420–4425, 1999.
110. FRANKE R, DANCER A, KHANNA SM, AND ULFENDAHL M. Intracochlearand extracochlear sound pressure measurements in the temporalbone preparation of the guinea pig. Acustica 76: 173–182, 1992.
111. FUCHS PA, NAGAI T, AND EVANS MG. Electrical tuning in hair cellsisolated from the chick cochlea. J Neurosci 8: 2460–2467, 1988.
112. GALAMBOS R. Suppression of auditory activity by stimulation ofefferent fibres of the cochlea. J Neurophysiol 19: 424–437, 1956.
113. GEISLER C. A model of the effect of outer hair cell motility oncochlear vibrations. Hear Res 24: 125–132, 1986.
114. GEISLER CD. A cochlear model using feedback from motile outerhair cells. Hear Res 54: 105–117, 1991.
115. GEISLER CD. A realizable cochlear model using feedback frommotile outer hair cells. Hear Res 68: 253–262, 1993.
116. GEISLER CD AND NUTTALL AL. Two-tone suppression of basilar mem-brane vibrations in the base of the guinea pig cochlea using “low-side” suppressors. J Acoust Soc Am 102: 430–440, 1997.
117. GEISLER CD AND RHODE WS. The phases of basilar-membrane vibra-tions. J Acoust Soc Am 71: 1201–1203, 1982.
118. GEISLER CD AND SINEX DG. Responses of primary auditory fibers tocombined noise and tonal stimuli. Hear Res 3: 317–334, 1980.
119. GEISLER CD, YATES G, PATUZZI R, AND JOHNSTONE B. Saturation ofouter hair cell receptor currents causes 2-tone suppression. Hear
Res 44: 241–256, 1990.120. GIBIAN G AND KIM DO. Cochlear microphonic evidence for mechan-
ical propagation of distortion products (f2-f1) and (2f1-f2). Hear Res
6: 35–60, 1982.121. GOLD T. Hearing. II. The physical basis of the action of the cochlea.
Proc R Soc Lond B Biol Sci 135: 492–498, 1948.122. GOLDSTEIN JL. Auditory nonlinearity. J Acoust Soc Am 41: 676–689,
1967.123. GOLDSTEIN JL. Relations among compression, suppression, and
combination tones in mechanical responses of the basilar mem-brane: data and MBPNL model. Hear Res 89: 52–68, 1995.
124. GOLDSTEIN JL, BAER T, AND KIANG NYS. A theoretical treatment oflatency, group delay and tuning. Characteristics for auditory nerveresponses to clicks and tones. In: The Physiology of the Auditory
System. Baltimore, MD: National Educational Consultants, 1971, p.133–141.
125. GOLDSTEIN JL AND KIANG NYS. Neural correlates of the aural com-bination tone 2f1-f2. Proc IEEE 56: 981–992, 1968.
126. GREENWOOD D. Empirical travel time functions on the basilar mem-brane. In: Psychophysics and Physiology of Hearing, edited byEvans EF and Wilson JP. London: Academic, 1977, p. 43–53.
127. GREENWOOD DD. Critical bandwidth and the frequency coordinatesof the basilar membrane. J Acoust Soc Am 33: 1344–1356, 1961.
128. GREENWOOD DD. A cochlear frequency-position function for severalspecies: 29 years later. J Acoust Soc Am 87: 2592–2605, 1990.
129. GREENWOOD DD. Comparing octaves, frequency ranges, and cochlear-map curvature across species. Hear Res 94: 157–162, 1996.
130. GUINAN JJ AND STANKOVIC KM. Medial efferent inhibition producesthe largest equivalent attenuations at moderate to high sound levelsin cat auditory-nerve fibers. J Acoust Soc Am 100: 1680–1690, 1996.
131. GUMMER AW, HEMMERT W, MORIOKA I, REIS P, REUTER G, AND ZENNER
HP. Cellular motility measured in the guinea-pig cochlea. In: Bio-
physics of Hair Cell Sensory Systems, edited by Duifhuis H, HorstJW, Van Dijk P, and van Netten SM. Singapore: World Scientific,1993, p. 229–239.
132. GUMMER AW, HEMMERT W, AND ZENNER HP. Resonant tectorial mem-brane motion in the inner ear: its crucial role in frequency tuning.Proc Natl Acad Sci USA 93: 8727–8732, 1996.
133. GUMMER AW AND JOHNSTONE BM. Group delay measurement fromspiral ganglion cells in the basal turn of the guinea pig cochlea. J
Acoust Soc Am 76: 1388–1400, 1984.134. GUMMER AW, JOHNSTONE BM, AND ARMSTRONG NJ. Direct measure-
ment of basilar membrane stiffness in the guinea pig. J Acoust Soc
Am 70: 1298–1309, 1981.135. HAO LF AND KHANNA SM. Reissner’s membrane vibrations in the
apical turn of a living guinea pig cochlea. Hear Res 99: 176–189,
1996.136. HARRIS D. Action potential suppression tuning curves and thresh-
olds. Comparison with single fiber data. Hear Res 1: 133–154, 1979.137. HAWKINS JE. Drug ototoxicity. In: Handbook of Sensory Physiology:
Auditory System. Clinical and Special Topics, edited by KeidelWD and Neff WD. New York: Springer-Verlag, 1976, p. 707–748.
138. HE DZ AND DALLOS P. Somatic stiffness of cochlear outer hair cellsis voltage-dependent. Proc Natl Acad Sci USA 96: 8223–8228, 1999.
1346 LUIS ROBLES AND MARIO A. RUGGERO Volume 81

139. HELMHOLTZ HLF. On the Sensations of Tone. New York: Dover,1954.
140. HEMMERT W, ZENNER HP, AND GUMMER AW. Characteristics of thetravelling wave in the low-frequency region of a temporal-bonepreparation of the guinea-pig cochlea. Hear Res 142: 184–202, 2000.
141. HEMMERT W, ZENNER HP, AND GUMMER AW. Three-dimensional mo-tion of the organ of Corti. Biophys J 78: 2285–2297, 2000.
142. HILL KG. Basilar membrane motion in relation to two-tone suppres-sion. Hear Res 115: 129–142, 1998.
143. HILLERY C AND NARINS P. Frequency and time domain comparison oflow-frequency auditory fiber responses in two anuran amphibians.Hear Res 25: 233–248, 1987.
144. HILLERY CM AND NARINS PM. Neurophysiological evidence for atraveling wave in the amphibian inner ear. Science 225: 1037–1039,
1984.145. HOLLEY MC AND ASHMORE JF. A cytoskeletal spring in cochlear outer
hair cells. Nature 335: 635–637, 1988.146. HONERT VDC AND STYPULKOWSKI PH. Physiological properties of the
electrically stimulated auditory nerve. II. Single fiber recordings.
Hear Res 14: 225–244, 1984.147. HOWARD J AND HUDSPETH AJ. Mechanical relaxation of the hair
bundle mediates adaptation in mechanoelectrical transduction bythe bullfrog’s saccular hair cell. Proc Natl Acad Sci USA 84: 3064–3068, 1987.
148. HOWARD J AND HUDSPETH AJ. Compliance of the hair bundle associ-ated with gating of mechanoelectrical transduction channels in thebullfrog’s saccular hair cell. Neuron 1: 189–199, 1988.
149. HOWARD J, ROBERTS WM, AND HUDSPETH AJ. Mechanoelectrical trans-duction by hair cells. Annu Rev Biophys Biophys Chem 17: 99–124,
1988.150. HUBBARD A. A traveling-wave amplifier model of the cochlea. Sci-
ence 259: 68–71, 1993.151. HUBBARD AE AND MOUNTAIN DC. Alternating current delivered into
the scala media alters sound pressure at the eardrum. Science 222:510–512, 1983.
152. HUBBARD AE AND MOUNTAIN DC. Analysis and synthesis of cochlearmechanical function using models. In: Auditory Computation, ed-ited by Hawkins HL, McMullen TA, Popper AN, and Fay RR. NewYork: Springer-Verlag, 1996, p. 62–120.
153. HUDSPETH AJ. The cellular basis of hearing: the biophysics of haircells. Science 230: 745–752, 1985.
154. HUDSPETH AJ. Mechanical amplification of stimuli by hair cells.Curr Opin Neurobiol 7: 480–486, 1997.
155. HUDSPETH AJ AND COREY DP. Sensitivity, polarity, and conductancechange in the response of vertebrate hair cells to controlled me-chanical stimuli. Proc Natl Acad Sci USA 74: 2407–2411, 1977.
156. HUDSPETH AJ AND JACOBS R. Stereocilia mediate transduction invertebrate hair cells. Proc Natl Acad Sci USA 76: 1506–1509, 1979.
157. INTERNATIONAL TEAM FOR EAR RESEARCH Cellular vibration and mo-tility in the organ of Corti. Acta Oto-Laryngol Suppl 467: 1–279,1989.
158. JARAMILLO F, HOWARD J, AND HUDSPETH AJ. Calcium ions promoterapid mechanically evoked movements of hair bundles. In: The
Mechanics and Biophysics of Hearing, edited by Dallos P, GeislerCD, Matthews JW, Ruggero MA, and Steele CR. New York: Spring-er-Verlag, 1990, p. 26–33.
159. JARAMILLO F AND WIESENFELD K. Mechanoelectrical transductionassisted by Brownian motion: a role for noise in the auditorysystem. Nat Neurosci 1: 384–388, 1998.
160. JARBOE JK AND HALLWORTH R. The effect of quinine on outer hair cellshape, compliance and force. Hear Res 132: 43–50, 1999.
161. JASTREBOFF PJ AND SASAKI CT. An animal model of tinnitus: a decadeof development. Am J Otol 15: 19–27, 1994.
162. JAVEL E, GEISLER CD, AND RAVINDRAN A. Two-tone suppression inauditory nerve of the cat: rate-intensity and temporal analysis. J
Acoust Soc Am 69: 1735–1745, 1978.163. JOHNSTONE BM AND BOYLE AJ. Basilar membrane vibration exam-
ined with the Mossbauer technique. Science 158: 389–390, 1967.164. JOHNSTONE BM, PATUZZI R, AND YATES G. Basilar membrane measure-
ments and the travelling wave. Hear Res 22: 147–154, 1986.165. JOHNSTONE BM AND YATES GM. Basilar membrane tuning curves in
the guinea pig. J Acoust Soc Am 55: 584–587, 1974.166. JOHNSTONE JR, ALDER VA, JOHNSTONE BM, ROBERTSON D, AND YATES
GK. Cochlear action potential threshold and single unit thresholds.J Acoust Soc Am 65: 254–257, 1979.
167. KACHAR B, BROWNELL WE, ALTSCHULER RA, AND FEX J. Electrokineticshape changes of cochlear outer hair cells. Nature 322: 365–368,
1986.168. KALINEC F, HOLLEY MC, IWASA KH, LIM DJ, AND KACHAR B. A mem-
brane-based force generation mechanism in auditory sensory cells.Proc Natl Acad Sci USA 89: 8671–8675, 1992.
169. KANIS LJ AND DE BOER E. Self-suppression in a locally active non-linear model of the cochlea: a quasilinear approach. J Acoust Soc
Am 94: 3199–3206, 1993.170. KANIS LJ AND DE BOER E. Frequency dependence of acoustic dis-
tortion products in a locally active model of the cochlea. J Acoust
Soc Am 101: 1527–1531, 1997.171. KARAVITAKI KD, MOUNTAIN DC, AND CODY AR. Electrically evoked
micromechanical movements from the apical turn of the gerbilcochlea. In: Diversity in Auditory Mechanics, edited by Lewis ER,Long GR, Lyon RF, Narins PM, Steele CR, and Hecht-Poinar E.Singapore: World Scientific, 1997, p. 392–398.
172. KARLSSON K, ULFENDAHL M, KHANNA S, AND FLOCK Å. The effects ofquinine on the cochlear mechanics in the isolated temporal bonepreparation. Hear Res 53: 95–100, 1991.
173. KARLSSON KK AND FLOCK Å. Quinine causes isolated outer hair cellsto change length. Neurosci Lett 116: 101–105, 1990.
174. KEMP DT. Stimulated acoustic emissions from within the humanauditory system. J Acoust Soc Am 64: 1386–1391, 1978.
175. KEMP DT. Evidence of mechanical nonlinearity and frequency se-lective wave amplification in the cochlea. Arch Otorhinolaryngol
224: 37–45, 1979.176. KHANNA SM, FLOCK Å, AND ULFENDAHL M. Mechanical analysis in the
cochlea at the cellular level. In: Noise-Induced Hearing Loss,edited by Dancer AL, Henderson D, Salvi RJ, and Hamernik RP.New York: Mosby-Yearbook, 1992, p. 3–10.
177. KHANNA SM AND HAO LF. Nonlinearity in the apical turn of livingguinea pig cochlea. Hear Res 135: 89–104, 1999.
178. KHANNA SM AND HAO LF. Reticular lamina vibrations in the apicalturn of a living guinea pig cochlea. Hear Res 132: 15–33, 1999.
179. KHANNA SM AND LEONARD DGB. Basilar membrane tuning in the catcochlea. Science 215: 305–306, 1982.
180. KHANNA SM, ULFENDAHL M, AND STEELE CR. Vibration of reflectivebeads placed on the basilar membrane. Hear Res 116: 71–85, 1998.
181. KIANG NYS. Curious oddments of auditory-nerve studies. Hear Res
49: 1–16, 1990.182. KIANG NYS AND MOXON EC. Physiological considerations in artificial
stimulation of the inner ear. Ann Otol Rhinol Laryngol 81: 714–730, 1972.
183. KIANG NYS AND MOXON EC. Tails of tuning curves of auditory-nervefibers. J Acoust Soc Am 55: 620–631, 1974.
184. KIANG NYS, WATANABE T, THOMAS C, AND CLARK LF. Discharge Pat-
terns of Single Fibers in the Cat’s Auditory Nerve. Cambridge, MA:MIT Press, 1965.
185. KIM D. Active and nonlinear cochlear biomechanics and the role ofouter hair cell subsystem in the mammalian auditory system. Hear
Res 22: 105–114, 1986.186. KIM DO AND MOLNAR CE. Cochlear mechanics: measurements and
models. In: The Nervous System. Human Communication and Its
Disorders, edited by Tower DB. New York: Raven, 1975, vol. 3, p.57–68.
187. KIM DO AND MOLNAR CE. A population study of cochlear nervefibers: comparison of spatial distributions of average-rate andphase-locking measures of responses to single tones. J Neuro-
physiol 42: 16–30, 1979.188. KIM DO, MOLNAR CE, AND MATTHEWS JW. Cochlear mechanics: non-
linear behavior in two-tone responses as reflected in cochlear-nerve-fiber responses and in ear-canal sound pressure. J Acoust Soc
Am 67: 1704–1721, 1980.189. KIM DO, NEELY ST, MOLNAR CE, AND MATTHEWS JW. An active co-
chlear model with negative damping in the partition: comparisonwith Rhode’s ante- and postmortem observations. In: Psychophys-
ical, Physiological and Behavioural Studies in Hearing, edited byvan den Brink G and Bilsen FA. Delft, The Netherlands: Delft Univ.Press, 1980, p. 7–14.
190. KOELINK MH, SLOT M, DE MUL FF, WEIJERS AL, GREVE J, GRAAFF R,
July 2001 MECHANICS OF THE MAMMALIAN COCHLEA 1347

DASSEL AC, AND AARNOUDSE JG. Laser Doppler velocimeter based onthe self-mixing effect in a fibre-coupled semiconductor laser: the-ory. Appl Optics 18: 3401–3408, 1992.
191. KOHLLOFFEL LUE. A study of basilar membrane vibrations. II. Thevibratory amplitude and phase pattern along the basilar membrane(postmortem). Acustica 27: 66–81, 1972.
192. KOLSTON PJ. Sharp mechanical tuning in a cochlear model withoutnegative damping. J Acoust Soc Am 83: 1481–1487, 1988.
193. KOLSTON PJ. Comparing in vitro, in situ, and in vivo experimentaldata in a three-dimensional model of mammalian cochlear mechan-ics. Proc Natl Acad Sci USA 96: 3676–3681, 1999.
194. KOLSTON PJ AND VIERGEVER MA. Realistic basilar membrane tuningdoes not require active processes. In: Cochlear Mechanisms: Struc-
ture, Function and Models, edited by Wilson JP and Kemp DT. NewYork: Plenum, 1989, p. 415–422.
195. KOLSTON PJ, VIERGEVER MA, DE BOER E, AND DIEPENDAAL RJ. Realisticmechanical tuning in a micromechanical cochlear model. J Acoust
Soc Am 86: 133–140, 1989.196. KOSHIGOE S AND TUBIS A. Implications of causality, time-translation
invariance, linearity, and minimum-phase behavior for basilarmembrane response functions. J Acoust Soc Am 71: 1194–1200,
1982.197. KOSHIGOE S AND TUBIS A. A non-linear feedback model for outer-
hair-cell stereocilia and its implications for the response of theauditory periphery. In: Mechanics of Hearing, edited by de Boer Eand Viergever M. Delft, The Netherlands: Delft Univ. Press, 1983, p.127–134.
198. KOPPL C. Otoacoustic emissions as an indicator of active cochlearmechanics: a primitive property of vertebrate auditory organs. In:Advances in Hearing Research, edited by Manley GA, Clump GM,Koppl C, Fastl H, and Oeckinghaus H. Singapore: World Scientific,1995, p. 207–216.
199. KOPPL C AND MANLEY GA. Spontaneous otoacoustic emissions in thebobtail lizard. 1. General characteristics. Hear Res 71: 157–169,
1993.200. KOSSL M AND RUSSELL IJ. Basilar membrane resonance in the co-
chlea of the mustached bat. Proc Natl Acad Sci USA 92: 276–279,
1995.201. KROS CJ, LENNAN GWT, AND RICHARDSON GP. Transducer currents
and bundle movements in outer hair cells of neonatal mice. In:Active Hearing, edited by Flock Å, Ottoson D, and Ulfendahl M.Oxford, UK: Elsevier, 1995, p. 113–125.
202. KROS CJ, RUSCH A, AND RICHARDSON GP. Mechano-electrical trans-ducer currents in hair cells of the cultured neonatal mouse cochlea.Proc R Soc Lond B Biol Sci 249: 185–193, 1992.
203. LEPAGE EL. Frequency-dependent self-induced bias of the basilarmembrane and its potential for controlling sensitivity and tuning inthe mammalian cochlea. J Acoust Soc Am 82: 139–154, 1987.
204. LEPAGE EL. Functional role of the olivo-cochlear bundle. A motorunit control system in the mammalian cochlea. Hear Res 38: 177–198, 1989.
205. LEPAGE EL AND JOHNSTONE BM. Nonlinear mechanical behaviour ofthe basilar membrane in the basal turn of the guinea pig cochlea.Hear Res 2: 183–190, 1980.
206. LEWIS ER, LEVERENZ EL, AND BIALEK WS. The Vertebrate Inner Ear.Boca Raton, FL: CRC, 1985.
207. LIBERMAN MC. Auditory-nerve response from cats raised in a low-noise chamber. J Acoust Soc Am 63: 442–455, 1978.
208. LIBERMAN MC. The cochlear frequency map for the cat: labelingauditory-nerve fibers of known characteristic frequency. J Acoust
Soc Am 72: 1441–1449, 1982.209. LIBERMAN MC AND DODDS L. Acute ultrastructural changes in acous-
tic trauma. Serial-section reconstruction of stereocilia and cuticu-lar plates. Hear Res 26: 45–64, 1987.
210. LIBERMAN MC AND KIANG NY. Acoustic trauma in cats. Cochlearpathology and auditory-nerve activity. Acta Otolaryngol Suppl 358:1–63, 1978.
211. LIGHTHILL J. Energy flow in the cochlea. J Fluid Mech 106: 149–213,
1981.212. LIN T AND GUINAN JJ JR. Auditory-nerve-fiber responses to high-level
clicks: interference patterns indicate that excitation is due to thecombination of multiple drives. J Acoust Soc Am 107: 2615–2630,
2000.
213. LONSBURY-MARTIN BL AND MEIKLE MB. Neural correlates of auditoryfatigue: frequency-dependent changes in activity of single cochlearnerve fibers. J Neurophysiol 41: 987–1006, 1978.
214. LUKASHKIN AN AND RUSSELL IJ. Descriptive model of the receptorpotential nonlinearities generated by the hair cell mechanoelectri-cal transducer. J Acoust Soc Am 103: 973–980, 1998.
215. LUKASHKIN AN AND RUSSELL IJ. Analysis of the f2-f1 and 2f1-f2 distor-tion components generated by the hair cell mechanoelectricaltransducer: dependence on the amplitudes of the primaries andfeedback gain. J Acoust Soc Am 106: 2661–2668, 1999.
216. LYNCH TJ, NEDZELNITSKY V III, AND PEAKE WT. Input impedance of thecochlea in cat. J Acoust Soc Am 72: 108–130, 1982.
217. MAGNAN P, AVAN P, DANCER A, SMURZYNSKI J, AND PROBST R. Reversemiddle-ear transfer function in the guinea pig measured with cubicdifference tones. Hear Res 107: 41–45, 1997.
218. MAGNAN P, DANCER A, PROBST R, SMURZYNSKI J, AND AVAN P. Intraco-chlear acoustic pressure measurements: transfer functions of themiddle ear and cochlear mechanics. Audiol Neuro Otol 4: 123–128,
1999.219. MAMMANO F AND ASHMORE JF. Reverse transduction measured in the
isolated cochlea by laser Michelson interferometry. Nature 365:838–841, 1993.
220. MAMMANO F AND NOBILI R. Biophysics of the cochlea: linear approx-imation. J Acoust Soc Am 93: 3320–3332, 1993.
221. MANLEY GA. Peripheral Hearing Mechanisms in Reptiles and
Birds. Berlin: Springer-Verlag, 1990.222. MANLEY GA. Do non-mammals have a cochlear amplifier? In: Recent
Developments in Auditory Mechanics, edited by Wada H,Takasaka T, Ikeda K, Ohyama K, and Koike T. Singapore: WorldScientific, 2000, p. 499–505.
223. MANLEY GA AND JOHNSTONE BM. Middle-ear function in the guineapig. J Acoust Soc Am 56: 571–576, 1974.
224. MARKIN VS AND HUDSPETH AJ. Modeling the active process of thecochlea: phase relations, amplification, and spontaneous oscilla-tion. Biophys J 69: 138–147, 1995.
225. MARMARELIS PZ AND MARMARELIS VZ. Analysis of Physiological Sys-
tems: The White-Noise Approach. New York: Plenum, 1978.226. MARTIN P AND HUDSPETH AJ. Active hair-bundle movements can
amplify a hair cell’s response to oscillatory mechanical stimuli.Proc Natl Acad Sci USA 96: 14306–14311, 1999.
227. MASTERTON RB, HEFFNER HE, AND RAVIZZA R. The evolution of humanhearing. J Acoust Soc Am 45: 966–985, 1969.
228. MATTHEWS JW AND MOLNAR CE. Modeling intracochlear and earcanal distortion product (2f1-f2). In: Peripheral Auditory Mecha-
nisms, edited by Allen JB, Hall JL, Hubbard A, Neely ST, and TubisA. New York: Springer-Verlag, 1986, p. 258–265.
229. MILLER CE. Structural implications of basilar membrane compli-ance measurements. J Acoust Soc Am 77: 1465–1474, 1985.
230. MOORE BCJ AND OXENHAM AJ. Psychoacoustic consequences ofcompression in the peripheral auditory system. Psychol Rev 105:108–124, 1998.
231. MORIOKA I, REUTER G, REISS P, GUMMER AW, HEMMERT W, AND ZENNER
HP. Sound-induced displacement responses in the plane of theorgan of Corti in the isolated guinea-pig cochlea. Hear Res 83:142–150, 1995.
232. MOUNTAIN DC. Changes in endolymphatic potential and crossedolivocochlear bundle stimulation alter cochlear mechanics. Science
210: 71–72, 1980.233. MOUNTAIN DC AND CODY AR. Multiple modes of inner hair cell
stimulation. Hear Res 132: 1–14, 1999.234. MOUNTAIN DC AND HUBBARD AE. Rapid force production in the
cochlea. Hear Res 42: 195–202, 1989.235. MOUNTAIN DC, HUBBARD AE, AND MCMULLEN TA. Electromechanical
processes in the cochlea. In: Mechanics of Hearing, edited by deBoer E and Viergever MA. Delft, The Netherlands: Delft Univ.Press, 1983, p. 119–126.
236. MOXON EC. Neural and Mechanical Responses to Electric Stimu-
lation of the Cat’s Inner Ear (PhD thesis). Cambridge, MA: MITPress, 1971.
237. MURUGASU E AND RUSSELL I. Salicylate ototoxicity: the effects onbasilar membrane displacement, cochlear microphonics, and neu-ral responses in the basal turn of the guinea pig cochlea. Auditory
Neurosci 1: 139–150, 1995.
1348 LUIS ROBLES AND MARIO A. RUGGERO Volume 81

238. MURUGASU E AND RUSSELL IJ. The effect of efferent stimulation onbasilar membrane displacement in the basal turn of the guinea pigcochlea. J Neurosci 16: 325–332, 1996.
239. MURUGASU E AND RUSSELL IJ. The role of calcium on the effects ofintracochlear acetylcholine perfusion on basilar membrane dis-placement in the basal turn of the guinea pig cochlea. Auditory
Neurosci 2: 363–376, 1996.240. MULLER M. The cochlear place-frequency map of the adult and
developing mongolian gerbil. Hear Res 94: 148–156, 1996.241. MULLER M AND ROBERTSON D. Shapes of rate-versus-level functions
of primary auditory nerve fibres: test of the basilar membranemechanical hypothesis. Hear Res 57: 71–78, 1991.
242. NAIDU RC AND MOUNTAIN DC. Measurements of the stiffness mapchallenge, a basic tenet of cochlear theories. Hear Res 124: 124–131, 1998.
243. NARAYAN SS AND RUGGERO MA. Basilar-membrane mechanics at thehook region of the chinchilla cochlea. In: Recent Developments in
Auditory Mechanics, edited by Wada H, Takasaka T, Ikeda K,Ohyama K, and Koike T. Singapore: World Scientific, 2000, p.95–101.
244. NARAYAN SS, TEMCHIN AN, RECIO A, AND RUGGERO MA. Frequencytuning of basilar membrane and auditory nerve fibers in the samecochleae. Science 282: 1882–1884, 1998.
245. NEDZELNITSKY V. Measurements of sound pressure in the cochlea ofanesthetized cats. In: Facts and Models in Hearing, edited byZwicker E and Terhardt E. Berlin: Springer-Verlag, 1974, p. 45–53.
246. NEDZELNITSKY V. Sound pressures in the basal turn of the cat co-chlea. J Acoust Soc Am 68: 1676–1689, 1980.
247. NEELY ST. Finite difference solution of a two-dimensional mathe-matical model of the cochlea. J Acoust Soc Am 69: 1386–1393, 1981.
248. NEELY ST AND KIM DO. An active cochlear model showing sharptuning and high sensitivity. Hear Res 9: 123–130, 1983.
249. NEELY ST AND KIM DO. A model for active elements in cochlearbiomechanics. J Acoust Soc Am 79: 1472–1480, 1986.
250. NILSEN KE AND RUSSELL IJ. Timing of cochlear feedback: spatial andtemporal representation of a tone across the basilar membrane.Nat Neurosci 2: 642–648, 1999.
251. NOBILI R AND MAMMANO F. Biophysics of the cochlea. 2. Stationarynonlinear phenomenology. J Acoust Soc Am 99: 2244–2255, 1996.
252. NUTTALL AL. Influence of direct current on dc receptor potentialsfrom cochlear inner hair cells in the guinea pig. J Acoust Soc Am 77:165–175, 1985.
253. NUTTALL AL, BROWN MC, MASTA RI, AND LAWRENCE M. Inner hair cellresponses to the velocity of basilar membrane motion in the guineapig. Brain Res 211: 171–174, 1981.
254. NUTTALL AL AND DOLAN DF. Inner hair cell responses to the 2f1-f2
intermodulation distortion product. J Acoust Soc Am 87: 782–790,
1990.255. NUTTALL AL AND DOLAN DF. Basilar membrane velocity responses to
acoustic and intracochlear electric stimuli. In: Biophysics of Hair
Cell Sensory Systems, edited by Duifhuis H, Horst JW, Van Dijk P,and van Netten SM. Singapore: World Scientific, 1993, p. 288–293.
256. NUTTALL AL AND DOLAN DF. Intermodulation distortion (f2-f1) ininner hair cell and basilar membrane responses. J Acoust Soc Am
93: 2061–2068, 1993.257. NUTTALL AL AND DOLAN DF. Two-tone suppression of inner hair cell
and basilar membrane responses in the guinea pig. J Acoust Soc
Am 93: 390–400, 1993.258. NUTTALL AL AND DOLAN DF. Two-tone suppression of inner hair cell
and basilar membrane responses in the guinea pig: reply. J Acoust
Soc Am 94: 3511–3514, 1993.259. NUTTALL AL AND DOLAN DF. Steady-state sinusoidal velocity re-
sponses of the basilar membrane in guinea pig. J Acoust Soc Am 99:1556–1565, 1996.
260. NUTTALL AL, DOLAN DF, AND AVINASH G. Measurements of basilarmembrane tuning and distortion with laser velocimetry. In: The
Mechanics and Biophysics of Hearing, edited by Dallos P, GeislerCD, Matthews JW, Ruggero MA, and Steele CR. Berlin: Springer-Verlag, 1990, p. 288–295.
261. NUTTALL AL, DOLAN DF, AND AVINASH G. Laser Doppler velocimetryof basilar membrane vibration. Hear Res 51: 203–213, 1991.
262. NUTTALL AL, GUO MH, AND REN TY. The radial pattern of basilar
membrane motion evoked by electric stimulation of the cochlea.Hear Res 131: 39–46, 1999.
263. NUTTALL AL, GUO MH, REN TY, AND DOLAN DF. Basilar membranevelocity noise. Hear Res 114: 35–42, 1997.
264. NUTTALL AL, KONG WJ, REN TY, AND DOLAN DF. Basilar membranemotion and position changes induced by direct current stimulation.In: Active Hearing, edited by Flock Å, Ottoson D, and Ulfendahl M.Great Yarmouth, England: Pergamon/Elsevier, 1995, p. 283–294.
265. NUTTALL AL AND REN TY. Electromotile hearing: evidence frombasilar membrane motion and otoacoustic emissions. Hear Res 92:170–177, 1995.
266. OLSON ES. Observing middle and inner ear mechanics with novelintracochlear pressure sensors. J Acoust Soc Am 103: 3445–3463,
1998.267. OLSON ES. Direct measurement of intra-cochlear pressure waves.
Nature 402: 526–529, 1999.268. OLSON ES AND MOUNTAIN DC. Mapping the cochlear partition’s stiff-
ness to its cellular architecture. J Acoust Soc Am 95: 395–400, 1994.269. O’NEILL MP AND BEARDEN A. Laser-feedback measurements of turtle
basilar membrane motion using direct reflection. Hear Res 84:125–138, 1995.
270. PAPOULIS A. The Fourier Integral and Its Applications. New York:McGraw-Hill, 1962.
271. PATUZZI R. Cochlear micromechanics and macromechanics. In: The
Cochlea, edited by Dallos P, Popper AN, and Fay RR. New York:Springer-Verlag, 1996, p. 186–257.
272. PATUZZI R, JOHNSTONE BM, AND SELLICK PM. The alteration of thevibration of the basilar membrane produced by loud sound. Hear
Res 13: 99–100, 1984.273. PATUZZI R AND ROBERTSON D. Tuning in the mammalian cochlea.
Physiol Rev 68: 1009–1082, 1988.274. PATUZZI R AND SELLICK PM. The modulation of the sensitivity of the
mammalian cochlea by low frequency tones. II. Inner hair cellreceptor potentials. Hear Res 13: 9–18, 1984.
275. PATUZZI R, SELLICK PM, AND JOHNSTONE BM. The modulation of thesensitivity of the mammalian cochlea by low frequency tones: itsorigin and possible mechanism. In: Mechanisms of Hearing, editedby Webster WR and Aitkin LM. Clayton, Victoria, Australia: MonashUniv. Press, 1983, p. 17–20.
276. PATUZZI R, SELLICK PM, AND JOHNSTONE BM. The modulation of thesensitivity of the mammalian cochlea by low frequency tones. I.Primary afferent activity. Hear Res 13: 1–8, 1984.
277. PATUZZI R, SELLICK PM, AND JOHNSTONE BM. The modulation of thesensitivity of the mammalian cochlea by low frequency tones. III.Basilar membrane motion. Hear Res 13: 19–28, 1984.
278. PATUZZI R AND YATES G. The low-frequency response of inner haircells in the guinea pig cochlea. Implications for fluid coupling andresonance of the stereocilia. Hear Res 30: 83–98, 1987.
279. PATUZZI RB, YATES GK, AND JOHNSTONE BM. Outer hair receptorcurrents and sensorineural hearing loss. Hear Res 42: 47–72, 1989.
280. PETERSON LC AND BOGERT BP. A dynamical theory of the cochlea. J
Acoust Soc Am 22: 369–381, 1950.281. PFEIFFER RR AND MOLNAR CE. Cochlear nerve fiber discharge pat-
terns: relationship to the cochlear microphonic. Science 167: 1614–1616, 1970.
282. PICKLES JO AND COREY DP. Mechanoelectrical transduction by haircells. Trends Neurosci 15: 254–259, 1992.
283. PITCHFORD S AND ASHMORE J. An electrical resonance in hair cells ofthe amphibian papilla of the frog Rana temporaria. Hear Res 27:75–84, 1987.
284. POWERS NL, SALVI RJ, WANG J, SPONGR V, AND QIU CX. Elevation ofauditory thresholds by spontaneous cochlear oscillations. Nature
375: 585–587, 1995.285. PROBST R, LONSBURY-MARTIN B, AND MARTIN G. A review of otoacous-
tic emissions. J Acoust Soc Am 89: 2027–2067, 1991.286. PROSEN C, MOODY D, STEBBINS W, SMITH D, SOMMERS M, BROWN J,
ALTSCHULER RA, AND HAWKINS J. Apical hair cells and hearing. Hear
Res 44: 179–193, 1990.287. PUEL JL, BOBBIN RP, AND FALLON M. Salicylate, mefenamate,
meclofenamate, and quinine on cochlear potentials. Otolaryngol
Head Neck Surg 102: 66–73, 1990.288. RASMUSSEN GL. The olivary peduncle and other fiber connections of
the superior olivary complex. J Comp Neurol 84: 141–219, 1946.
July 2001 MECHANICS OF THE MAMMALIAN COCHLEA 1349

289. RECIO A, NARAYAN SS, AND RUGGERO MA. Wiener-kernel analysis ofbasilar-membrane responses to white noise. In: Diversity in Au-
ditory Mechanics, edited by Lewis ER, Long GR, Lyon RF, NarinsPM, Steele CR, and Hecht-Poinar E. Singapore: World Scientific,1997, p. 325–331.
290. RECIO A, RICH NC, NARAYAN SS, AND RUGGERO MA. Basilar-membraneresponses to clicks at the base of the chinchilla cochlea. J Acoust
Soc Am 103: 1972–1989, 1998.291. REUTER G, GITTER AH, THURM U, AND ZENNER HP. High frequency
radial movements of the reticular lamina induced by outer hair cellmotility. Hear Res 60: 236–246, 1992.
292. REUTER G AND ZENNER H. Active radial and transverse motile re-sponses of outer hair hells in the organ of Corti. Hear Res 43:219–230, 1990.
293. RHODE WS. Observations of the vibration of the basilar membranein squirrel monkeys using the Mossbauer technique. J Acoust Soc
Am 49: 1218–1231, 1971.294. RHODE WS. An investigation of postmortem cochlear mechanics
using the Mossbauer effect. In: Basic Mechanisms in Hearing,edited by Møller AR. New York: Academic, 1973, p. 49–63.
295. RHODE WS. Some observations on two-tone interaction measuredwith the Mossbauer effect. In: Psychophysics and Physiology of
Hearing, edited by Evans EF and Wilson JP. London: Academic,1977, p. 27–41.
296. RHODE WS. Some observation on cochlear mechanics. J Acoust Soc
Am 64: 158–176, 1978.297. RHODE WS. Cochlear partition vibration: recent views. J Acoust Soc
Am 67: 1696–1703, 1980.298. RHODE WS AND COOPER NP. Two-tone suppression and distortion
production on the basilar membrane in the hook region of cat andguinea pig cochleae. Hear Res 66: 31–45, 1993.
299. RHODE WS AND COOPER NP. Nonlinear mechanics in the apical turnof the chinchilla cochlea in vivo. Auditory Neurosci 3: 101–121,
1996.300. RHODE WS AND RECIO A. Study of mechanical motions in the basal
region of the chinchilla cochlea. J Acoust Soc Am 107: 3317–3332,
2000.301. RHODE WS AND ROBLES L. Evidence from Mossbauer experiments
for nonlinear vibration in the cochlea. J Acoust Soc Am 55: 588–596, 1974.
302. RICHARDSON GP, RUSSELL IJ, WASSERKORT R, AND HANS M. Aminogly-coside antibiotics and lectins cause irreversible increases in thestiffness of cochlear hair-cell stereocilia. In: Cochlear Mechanisms.
Structure, Function and Models, edited by Wilson JP and KempDT. New York: Plenum, 1989, p. 57–65.
303. RICHTER CP, EVANS BN, EDGE R, AND DALLOS P. Basilar membranevibration in the gerbil hemicochlea. J Neurophysiol 79: 2255–2264,
1998.304. ROBERTSON D. Correspondence between sharp tuning and two-tone
inhibition in primary auditory neurones. Nature 259: 477–478, 1976.305. ROBERTSON D AND JOHNSTONE BM. Primary auditory neurons: non-
linear responses altered without sharp tuning. J Acoust Soc Am 69:1096–1098, 1981.
306. ROBLES L, RHODE WS, AND GEISLER CD. Transient response of thebasilar membrane measured in squirrel monkey using the Moss-bauer effect. J Acoust Soc Am 59: 926–939, 1976.
307. ROBLES L, RUGGERO MA, AND RICH NC. Basilar membrane mechanicsat the base of the chinchilla cochlea. I. Input-output functions,tuning curves, and response phases. J Acoust Soc Am 80: 1364–1374, 1986.
308. ROBLES L, RUGGERO MA, AND RICH NC. Mossbauer measurements ofthe mechanical response to single-tone and two-tone stimuli at thebase of the chinchilla cochlea. In: Peripheral Auditory Mecha-
nisms, edited by Allen JB, Hall JL, Hubbard A, Neely ST, and TubisA. Berlin: Springer-Verlag, 1986, p. 121–128.
309. ROBLES L, RUGGERO MA, AND RICH NC. Nonlinear interactions in themechanical response of the cochlea to two-tone stimuli. In: Co-
chlear Mechanisms: Structure, Function and Models, edited byWilson JP and Kemp DT. London: Plenum, 1989, p. 369–375.
310. ROBLES L, RUGGERO MA, AND RICH NC. Two-tone distortion productsin the basilar membrane of the chinchilla cochlea. In: The Mechan-
ics and Biophysics of Hearing, edited by Dallos P, Matthews JW,
Geisler CD, Ruggero MA, and Steele CR. Berlin: Springer-Verlag,1990, p. 304–311.
311. ROBLES L, RUGGERO MA, AND RICH NC. Two-tone distortion in thebasilar membrane of the cochlea. Nature 349: 413–414, 1991.
312. ROBLES L, RUGGERO MA, AND RICH NC. Two-tone distortion on thebasilar membrane of the chinchilla cochlea. J Neurophysiol 77:2385–2399, 1997.
313. RUGGERO MA. Systematic errors in indirect estimates of basilarmembrane travel times. J Acoust Soc Am 67: 707–710, 1980.
314. RUGGERO MA. Physiology and coding of sound in the auditory nerve.In: The Mammalian Auditory Pathway: Neurophysiology, editedby Popper AN and Fay RR. New York: Springer-Verlag, 1992, p.34–93.
315. RUGGERO MA. Cochlear delays and traveling waves: comments on“Experimental look at cochlear mechanics.” Audiology 33: 131–142, 1994.
316. RUGGERO MA, KRAMEK B, AND RICH NC. Spontaneous otoacousticemissions in a dog. Hear Res 13: 293–296, 1984.
317. RUGGERO MA, NARAYAN SS, TEMCHIN AN, AND RECIO A. Mechanicalbases of frequency tuning and neural excitation at the base of thecochlea: comparison of basilar-membrane vibrations and auditory-nerve fiber responses in chinchilla. Proc Natl Acad Sci USA 97:11744–11750, 2000.
318. RUGGERO MA AND RICH NC. Chinchilla auditory-nerve responses tolow-frequency tones. J Acoust Soc Am 73: 2096–2108, 1983.
319. RUGGERO MA AND RICH NC. Timing of spike initiation in cochlearafferents: dependence on site of innervation. J Neurophysiol 58:379–403, 1987.
320. RUGGERO MA AND RICH NC. Systemic injection of furosemide altersthe mechanical response to sound of the basilar membrane. In: The
Mechanics and Biophysics of Hearing, edited by Dallos P, GeislerCD, Matthews JW, Ruggero MA, and Steele CR. New York: Spring-er-Verlag, 1990, p. 314–321.
321. RUGGERO MA AND RICH NC. Application of a commercially-manufac-tured Doppler-shift laser velocimeter to the measurement of basi-lar-membrane vibration. Hear Res 51: 215–230, 1991.
322. RUGGERO MA AND RICH NC. Furosemide alters organ of Corti me-chanics: evidence for feedback of outer hair cells upon the basilarmembrane. J Neurosci 11: 1057–1067, 1991.
323. RUGGERO MA, RICH NC, AND RECIO A. Basilar membrane responsesto clicks. In: Auditory Physiology and Perception, edited by CazalsY, Demany L, and Horner K. London: Pergamon, 1992, p. 85–91.
324. RUGGERO MA, RICH NC, AND RECIO A. Alteration of basilar membraneresponses to sound by acoustic overstimulation. In: Biophysics of
Hair Cell Sensory Systems, edited by Duifhuis H, Horst JW, VanDijk P, and van Netten SM. Singapore: World Scientific, 1993, p.258–264.
325. RUGGERO MA, RICH NC, AND RECIO A. The effect of intense acousticstimulation on basilar-membrane vibrations. Auditory Neurosci 2:329–345, 1996.
326. RUGGERO MA, RICH NC, RECIO A, NARAYAN SS, AND ROBLES L. Basilar-membrane responses to tones at the base of the chinchilla cochlea.J Acoust Soc Am 101: 2151–2163, 1997.
327. RUGGERO MA, RICH NC, ROBLES L, AND RECIO A. The effects ofacoustic trauma, other cochlear injury and death on basilar-mem-brane responses to sound. In: Scientific Basis of Noise-Induced
Hearing Loss, edited by Axelsson A, Horchgrevink H, HamernikRP, Hellstrom P-A, Henderson D, and Salvi RJ. New York: ThiemeMedical, 1996, p. 23–35.
328. RUGGERO MA, RICH NC, ROBLES L, AND SHIVAPUJA BG. Middle-earresponse in the chinchilla and its relationship to mechanics at thebase of the cochlea. J Acoust Soc Am 87: 1612–1629, 1990.
329. RUGGERO MA, RICH NC, SHIVAPUJA BG, AND TEMCHIN AN. Auditory-nerve responses to low-frequency tones: intensity dependence.Auditory Neurosci 2: 159–185, 1996.
330. RUGGERO MA, ROBLES L, AND RICH NC. Basilar membrane mechanicsat the base of the chinchilla cochlea. II. Responses to low-fre-quency tones and relationship to microphonics and spike initiationin the VIII nerve. J Acoust Soc Am 80: 1375–1383, 1986.
331. RUGGERO MA, ROBLES L, AND RICH NC. Cochlear microphonics andthe initiation of spikes in the auditory nerve: correlation of single-unit data with neural and receptor potentials recorded from theround window. J Acoust Soc Am 79: 1491–1498, 1986.
1350 LUIS ROBLES AND MARIO A. RUGGERO Volume 81

332. RUGGERO MA, ROBLES L, AND RICH NC. Two-tone suppression in thebasilar membrane of the cochlea: mechanical basis of auditory-nerve rate suppression. J Neurophysiol 68: 1087–1099, 1992.
333. RUSSELL IJ, CODY A, AND RICHARDSON G. The responses of inner andouter hair cells in the basal turn of the guinea pig cochlea and in themouse cochlea grown in vitro. Hear Res 22: 199–216, 1986.
334. RUSSELL IJ AND KOSSL M. Modulation of hair cell voltage responsesto tones by low-frequency biasing of the basilar membrane in theguinea pig cochlea. J Neurosci 12: 1587–1601, 1992.
335. RUSSELL IJ AND KOSSL M. Sensory transduction and frequency selec-tivity in the basal turn of the guinea-pig cochlea. Philos Trans R Soc
Lond B Biol Sci 336: 317–324, 1992.336. RUSSELL IJ, KOSSL M, AND RICHARDSON GP. Nonlinear mechanical
responses of mouse cochlear hair bundles. Proc R Soc Lond B Biol
Sci 250: 217–227, 1992.337. RUSSELL IJ AND MURUGASU E. Medial efferent inhibition suppresses
basilar membrane responses to near characteristic frequency tonesof moderate to high intensities. J Acoust Soc Am 102: 1734–1738,
1997.338. RUSSELL IJ AND NILSEN KE. The location of the cochlear amplifier:
spatial representation of a single tone on the guinea pig basilarmembrane. Proc Natl Acad Sci USA 94: 2660–2664, 1997.
339. RUSSELL IJ, RICHARDSON GP, AND KOSSL M. The responses of cochlearhair cells to tonic displacements of the sensory hair bundle. Hear
Res 43: 55–69, 1989.340. RUSSELL IJ AND SCHAUZ C. Salicylate ototoxicity: effects on the
stiffness and electromotility of outer hair cells isolated from theguinea pig cochlea. Auditory Neurosci 1: 309–319, 1995.
341. RUSSELL IJ AND SELLICK PM. Low frequency characteristics of intra-cellularly recorded receptor potentials in mammalian hair cells.J Physiol (Lond) 338: 179–206, 1983.
342. SACHS MB AND ABBAS PJ. Rate versus level functions for auditory-nerve fibers in cats: tone-burst stimuli. J Acoust Soc Am 56: 1835–1847, 1974.
343. SACHS MB AND HUBBARD AE. Responses of auditory-nerve fibers tocharacteristic-frequency tones and low-frequency suppressors.Hear Res 4: 309–324, 1981.
344. SACHS MB AND KIANG NYS. Two-tone inhibition in auditory-nervefibers. J Acoust Soc Am 43: 1120–1128, 1968.
345. SALVI RJ, HAMERNIK RP, AND HENDERSON D. Response patterns ofauditory nerve fibers during temporary threshold shift. Hear Res
10: 37–68, 1983.346. SALVI RJ, HENDERSON D, AND HAMERNIK RP. Single auditory nerve
fiber and action potential latencies in normal and noise. Hear Res
1: 237–252, 1979.347. SANTOS-SACCHI J. On the frequency limit and phase of outer hair cell
motility: effects of the membrane filter. J Neurosci 12: 1906–1916,
1992.348. SANTOS-SACCHI J. Harmonics of outer hair cell motility. Biophys J
65: 2217–2227, 1993.349. SANTOS-SACCHI J AND DALLOS P. Intercellular communication in the
supporting cells of the organ of Corti. Hear Res 9: 317–326, 1983.350. SANTOS-SACCHI J AND DILGER J. Whole cell currents and mechanical
responses of isolated outer hair cells. Hear Res 35: 143–150, 1988.351. SAUNDERS J, COHEN Y, AND SZYMKO Y. The structural and functional
consequences of acoustic injury in the cochlea and peripheralauditory system: a 5 year update. J Acoust Soc Am 90: 136–146,
1991.352. SCHMIEDT RA. Boundaries of two-tone rate suppression of cochlear
nerve activity. Hear Res 7: 335–352, 1982.353. SCHMIEDT RA. Acoustic injury and the physiology of hearing. J
Acoust Soc Am 76: 1293–1317, 1984.354. SCHMIEDT RA AND ZWISLOCKI JJ. Effects of hair cell lesions on re-
sponses of cochlear nerve fibers. II. Single- and two-tone intensityfunctions in relation to tuning curves. J Neurophysiol 43: 1390–1405, 1980.
355. SELLICK PM, PATUZZI R, AND JOHNSTONE BM. Measurement of basilarmembrane motion in the guinea pig using the Mossbauer technique.J Acoust Soc Am 72: 131–141, 1982.
356. SELLICK PM, PATUZZI R, AND JOHNSTONE BM. Modulation of responsesof spiral ganglion cells in the guinea pig cochlea by low frequencysound. Hear Res 7: 199–222, 1982.
357. SELLICK PM, PATUZZI R, AND JOHNSTONE BM. Comparison between the
tuning properties of inner hair cells and basilar membrane motion.Hear Res 10: 93–100, 1983.
358. SELLICK PM AND RUSSELL IJ. Two-tone suppression in cochlear haircells. Hear Res 1: 227–236, 1979.
359. SELLICK PM AND RUSSELL IJ. The responses of inner hair cells tobasilar membrane velocity during low frequency auditory stimula-tion in the guinea pig cochlea. Hear Res 2: 439–446, 1980.
360. SELLICK PM, YATES GK, AND PATUZZI R. The influence of Mossbauersource size and position on phase and amplitude measurements ofthe guinea pig basilar membrane. Hear Res 10: 101–108, 1983.
361. SEWELL WF. The effects of furosemide on the endocochlear poten-tial and auditory-nerve fiber tuning curves in cats. Hear Res 14:305–314, 1984.
362. SHERA CA AND GUINAN JJ. Evoked otoacoustic emissions arise bytwo fundamentally different mechanisms: a taxonomy for mamma-lian OAEs. J Acoust Soc Am 105: 782–798, 1999.
363. SIEGEL JH AND KIM DO. Efferent neural control of cochlear mechan-ics? Olivocochlear bundle stimulation affects cochlear biomechani-cal nonlinearity. Hear Res 6: 171–182, 1982.
364. SIEGEL JH, KIM DO, AND MOLNAR CE. Effects of altering organ ofCorti on cochlear distortion products f2-f1 and 2f1-f2. J Neuro-
physiol 47: 303–328, 1982.365. SLEPECKY NB. Structure of the mammalian cochlea. In: The Cochlea,
edited by Dallos P, Popper AN, and Fay RR. New York: Springer-Verlag, 1996, p. 44–129.
366. SMOORENBURG GF. Combination tones and their origin. J Acoust Soc
Am 52: 615–632, 1972.367. SMOORENBURG GF, GIBSON MM, KITZES LM, ROSE JE, AND HIND JE.
Correlates of combination tones observed in the response of neu-rons in the anteroventral cochlear nucleus of the cat. J Acoust Soc
Am 59: 945–962, 1976.368. SOKOLOWSKI B, SACHS M, AND GOLDSTEIN J. Auditory nerve rate-level
functions for two-tone stimuli. Possible relation to basilar-mem-brane nonlinearity. Hear Res 41: 115–124, 1989.
369. SPOENDLIN H. The Organization of the Cochlear Receptor. NewYork: Karger, 1966.
370. SRIDHAR TS, LIBERMAN MC, BROWN MC, AND SEWELL WF. A novelcholinergic “slow effect” of efferent stimulation on cochlear poten-tials in the guinea pig. J Neurosci 15: 3667–3678, 1995.
371. STEBBINS WC. The evolution of hearing in the mammals. In: Com-
parative Studies of Hearing in Vertebrates, edited by Popper ANand Fay RR. New York: Springer-Verlag, 1980, p. 421–436.
372. TABER LA AND STEELE CR. Cochlear model including three-dimen-sional fluid and four modes of partition flexibility. J Acoust Soc Am
70: 426–436, 1981.373. TALMADGE C, TUBIS A, WIT H, AND LONG G. Are spontaneous oto-
acoustic emissions generated by self-sustained cochlear oscilla-tors? J Acoust Soc Am 89: 2391–2399, 1991.
374. TASCHENBERGER G AND MANLEY GA. Spontaneous otoacoustic emis-sions in the barn owl. Hear Res 110: 61–76, 1997.
375. TEAS DC, KONISHI T, AND WERNICK JS. Effects of electrical currentapplied to cochlear partition on discharges in individual auditory-nerve fibers. II. Interaction of electrical polarization and acousticstimulation. J Acoust Soc Am 47: 1527–1537, 1970.
376. TEMCHIN AN, RICH NC, AND RUGGERO MA. Low-frequency suppres-sion of auditory nerve responses to characteristic frequency tones.Hear Res 113: 29–56, 1997.
377. THOMAS DE. Tables of phases associated with a semi-infinite unitslope of attenuation. Bell System Technical J 26: 870–899, 1947.
378. TONNDORF J AND KHANNA SM. Displacement pattern of the basilarmembrane: a comparison of experimental data. Science 160: 1139–1140, 1968.
379. ULFENDAHL M. Mechanical responses of the mammalian cochlea.Prog Neurobiol 53: 331–380, 1997.
380. ULFENDAHL M AND FLOCK Å. In vitro studies of cochlear excitation.Curr Opin Neurobiol 8: 475–479, 1998.
381. ULFENDAHL M, KHANNA SM, AND FLOCK Å. Effects of opening andresealing the cochlea on the mechanical response in the isolatedtemporal bone preparation. Hear Res 57: 31–37, 1991.
382. ULFENDAHL M, KHANNA SM, FRIDBERGER A, FLOCK Å, FLOCK B, AND
JAGER W. Mechanical response characteristics of the hearing organin the low-frequency regions of the cochlea. J Neurophysiol 76:3850–3862, 1996.
July 2001 MECHANICS OF THE MAMMALIAN COCHLEA 1351
383. ULFENDAHL M, KHANNA SM, AND HENEGHAN C. Shearing motion in thehearing organ measured by confocal laser heterodyne interferom-etry. Neuroreport 6: 1157–1160, 1995.
384. ULFENDAHL M, KHANNA SM, AND LOFSTRAND P. Changes in the me-chanical tuning characteristics of the hearing organ followingacoustic overstimulation. Eur J Neurosci 5: 713–723, 1993.
385. VAN DIJK P, WIT H, AND SEGENHOUT J. Spontaneous otoacousticemissions in the European edible frog (Rana esculenta): spectraldetails and temperature dependence. Hear Res 42: 273–282, 1989.
386. VERSNEL H, PRIJS VF, AND SCHOONHOVEN R. Single-fibre responses toclicks in relationship to the compound action potential in theguinea pig. Hear Res 46: 147–160, 1990.
387. VOLDRICH L. Mechanical properties of basilar membrane. Acta Oto-
Laryngol 86: 331–335, 1978.388. VON BEKESY G. uber die mechanische Frequenzanalyse in der
Schnecke verschiedener Tiere. Akust Zeits 9: 3–11, 1944.389. VON BEKESY G. The variation of phase along the basilar membrane
with sinusoidal vibration. J Acoust Soc Am 19: 452–460, 1947.390. VON BEKESY G. Current status of theories of hearing. Science 123:
779–783, 1956.391. VON BEKESY G. Experiments in Hearing. New York: McGraw-Hill,
1960.392. WARR WB AND GUINAN JJ JR. Efferent innervation of the organ of
Corti: two separate systems. Brain Res 173: 152–155, 1979.393. WEISS TF. Bidirectional transduction in vertebrate hair cells. A
mechanism for coupling mechanical and electrical processes. Hear
Res 7: 353–360, 1982.394. WEVER EG AND LAWRENCE M. Physiological Acoustics. New York:
1954.395. WEVER EG, LAWRENCE M, AND VON BEKESY G. A note on recent
developments in auditory theory. Proc Natl Acad Sci USA 40:508–512, 1954.
396. WIEDERHOLD ML. Variations in the effects of electric stimulation ofthe crossed olivocochlear bundle on cat single auditory-nerve-fiberresponses to tone bursts. J Acoust Soc Am 48: 966–977, 1970.
397. WILLEMIN JF, DANDLIKER R, AND KHANNA SM. Heterodyne interfero-meter for submicroscopic vibration measurements in the inner ear.J Acoust Soc Am 83: 787–795, 1988.
398. WILSON JP. Evidence for a cochlear origin for acoustic re-emissions,threshold fine structure and tonal tinnitus. Hear Res 2: 233–252,
1980.399. WILSON JP. Cochlear mechanics. In: Auditory Physiology and Per-
ception, edited by Cazals Y, Demany L, and Horner K. Oxford, UK:Pergamon, 1992, p. 71–84.
400. WILSON JP AND EVANS EF. Some observations on the “passive”mechanics of the cat basilar membrane. In: Mechanisms of Hear-
ing, edited by Webster WR and Aitkin LM. Clayton, Victoria, Aus-tralia: Monash Univ. Press, 1983, p. 30–35.
401. WILSON JP AND JOHNSTONE JR. Basilar membrane correlates of thecombination tone 2f 1-f 2. Nature 241: 206–207, 1973.
402. WILSON JP AND JOHNSTONE JR. Basilar membrane and middle-earvibration in guinea pig measured by capacitive probe. J Acoust Soc
Am 57: 705–723, 1975.403. WIT HP. Spontaneous otoacoustic emission generators behave like
coupled oscillators. In: The Mechanics and Biophysics of Hearing,edited by Dallos P, Geisler CD, Matthews JW, Ruggero MA, andSteele CR. Berlin: Springer-Verlag, 1990, p. 259–266.
404. XUE S, MOUNTAIN DC, AND HUBBARD AE. Direct measurement ofelectrically-evoked basilar membrane motion. In: Biophysics of
Hair Cell Sensory Systems, edited by Duifhuis H, Horst JW, VanDijk P, and van Netten SM. Singapore: World Scientific, 1993, p.361–368.
405. XUE SW, MOUNTAIN DC, AND HUBBARD AE. Acoustic enhancement ofelectrically-evoked otoacoustic emissions reflects basilar mem-brane tuning: experiment results. Hear Res 70: 121–126, 1993.
406. XUE SW, MOUNTAIN DC, AND HUBBARD AE. Electrically evoked basi-lar membrane motion. J Acoust Soc Am 97: 3030–3041, 1995.
407. XUE SW, MOUNTAIN DC, AND HUBBARD AE. Electrically-evoked oto-acoustic emissions: direct comparisons with basilar membranemotion. Auditory Neurosci 2: 301–308, 1996.
408. YATES GK. The basilar membrane nonlinear input-output function.In: Mechanics and Biophysics of Hearing, edited by Dallos P,Geisler CD, Matthews JW, Ruggero MA, and Steele C. New York:Springer-Verlag, 1990, p. 106–113.
409. YATES GK, JOHNSTONE BM, PATUZZI RB, AND ROBERTSON D. Mechan-ical preprocessing in the mammalian cochlea. Trends Neurosci 15:57–61, 1992.
410. YATES GK AND KIRK DL. Cochlear electrically evoked emissionsmodulated by mechanical transduction channels. J Neurosci 18:1996–2003, 1998.
411. YATES GK, WINTER I, AND ROBERTSON D. Basilar membrane nonlin-earity determines auditory nerve rate-intensity functions and co-chlear dynamic range. Hear Res 45: 203–219, 1990.
412. ZHENG J, SHEN W, HE DZ, LONG KB, MADISON LD, AND DALLOS P.Prestin is the motor protein of cochlear outer hair cells. Nature
405: 149–155, 2000.413. ZINN C, MAIER H, ZENNER HP, AND GUMMER AW. Evidence for active,
nonlinear, negative feedback in the vibration response of the apicalregion of the in vivo guinea-pig cochlea. Hear Res 142: 159–183,
2000.414. ZUREK PM AND CLARK WW. Narrow-band acoustic signals emitted by
chinchilla ears after noise exposure. J Acoust Soc Am 70: 446–450,
1981.415. ZWEIG G. Basilar membrane motion. Cold Spring Harb Symp
Quant Biol 40: 619–633, 1976.416. ZWEIG G. Finding the impedance of the organ of Corti. J Acoust Soc
Am 89: 1229–1254, 1991.417. ZWICKER E. Different behaviour of quadratic and cubic difference
tones. Hear Res 1: 283–292, 1979.418. ZWICKER E. Dependence of level and phase of the (2f1-f2)-cancella-
tion tone on frequency range, frequency difference, level of prima-ries and subject. J Acoust Soc Am 70: 1277–1288, 1981.
419. ZWICKER E. Der Ungewohnliche Amplitudengang der NichtlinearenVerzerrungen des Ohres. Acustica 5: 67–74, 1955.
420. ZWICKER E. A model describing nonlinearities in hearing by activeprocesses with saturation at 40 dB. Biol Cybern 35: 243–250, 1979.
421. ZWICKER E. A hardware cochlear nonlinear preprocessing modelwith active feedback. J Acoust Soc Am 80: 146–153, 1986.
422. ZWICKER E. Suppression and (2f1-f2)-difference tones in a nonlinearcochlear preprocessing model with active feedback. J Acoust Soc
Am 80: 163–176, 1986.423. ZWISLOCKI JJ. Theorie der Schneckenmechanik: qualitative und
quantitative analyse. Acta Oto-Laryngol Suppl 72: 1–76, 1948.424. ZWISLOCKI JJ. Analysis of some auditory characteristics. In: Hand-
book of Mathematical Psychology, edited by Luce RC, Bush RR,and Galanter E. New York: Wiley, 1965, p. 1–97.
425. ZWISLOCKI JJ. Analysis of cochlear mechanics. Hear Res 22: 155–169, 1986.
426. ZWISLOCKI JJ AND KLETSKY EJ. Tectorial membrane: a possible effecton frequency analysis in the cochlea. Science 204: 639–641, 1979.
427. ZWISLOCKI JJ AND KLETSKY EJ. What basilar membrane tuning saysabout cochlear micromechanics. Am J Otolaryngol 3: 48–52, 1982.
1352 LUIS ROBLES AND MARIO A. RUGGERO Volume 81