Maize response to different water, salinity and nitrogen levels: yield-water relation, water-use and...
32
International Journal of Plant Production 8 (2), April 2014 ISSN: 1735-6814 (Print), 1735-8043 (Online) www.ijpp.info GUASNR Maize response to water, salinity and nitrogen levels: yield-water relation, water-use efficiency and water uptake reduction function A. Azizian * , A.R. Sepaskhah Irrigation Department, Shiraz University, Shiraz, I.R of Iran (At present, faculty member of Ardakan University). *Corresponding author. E-mail: [email protected] Received 24 April 2013; Accepted after revision 22 November 2013; Published online 27 February 2014 Abstract Water, salinity and nitrogen are the major factors affecting maize production in arid and semi-arid areas. The objectives of this study were to investigate the effects of different water, salinity and nitrogen levels on yield-water relationships, water use, water productivity (WP), water use efficiency (WUE) and water uptake reduction function by maize hybrid SC-704 in a semi-arid area and silty clay loam soil. A split-split-plot design with three replications in two years of 2009 and 2010 was conducted. The different levels of irrigation water considered as main plot, salinity of irrigation water as sub-plot and nitrogen fertilizer rate as sub-sub-plot. Irrigation treatments consisted of I 1 (1.0ET c +0.25ET c as leaching), I 2 (0.75I 1 ) and I 3 (0.50I 1 ) applied at 7-day intervals. The salinity treatments of irrigation were 0.6 (fresh water), 2.0 and 4.0 dS m -1 . There were also three nitrogen (N) treatments including 0, 150 and 300 kg N ha -1 . Results showed that the actual crop ET and transpiration (T) were significantly less in I 3 as compared to I 1 treatments as 42 and 43%, respectively. Besides, T values under S 3 were statistically less than that in S 1 treatment as 12%. The soil evaporation (E) values were 26, 31 and 27% of ET at I 1 , I 2 and I 3 treatments, respectively and its values significantly increased with increasing salinity levels of irrigation water. The minimum and maximum amount of E occurred at I 3 S 1 N 3 and I 1 S 3 N 3 , respectively. The study showed that deficit irrigation as 0.50I 1 and 0.75 I 1 were the optimum levels of irrigation to access the highest WP and WUE for dry matter (DM) and grain yield (GY) respectively. Besides, S 1 was the optimum treatment for achievement of highest WP and WUE for DM and GY. Results also indicated that the optimum treatment for WP and WUE for GY was I 2 S 1 N 3 . Furthermore, N fertilization could not statistically improve WP and WUE beyond 150 kg N ha -1 . The yield response factor to water showed that maize GY was more sensitive to water than its DM. Results also
Transcript of Maize response to different water, salinity and nitrogen levels: yield-water relation, water-use and...
International Journal of Plant Production 8 (2), April 2014 ISSN: 1735-6814 (Print), 1735-8043 (Online)
www.ijpp.info GUASNR
Maize response to water, salinity and nitrogen levels: yield-water relation, water-use efficiency and water uptake reduction function A. Azizian*, A.R. Sepaskhah Irrigation Department, Shiraz University, Shiraz, I.R of Iran (At present, faculty member of Ardakan University). *Corresponding author. E-mail: [email protected] Received 24 April 2013; Accepted after revision 22 November 2013; Published online 27 February 2014
Abstract
Water, salinity and nitrogen are the major factors affecting maize production in arid and semi-arid areas. The objectives of this study were to investigate the effects of different water, salinity and nitrogen levels on yield-water relationships, water use, water productivity (WP), water use efficiency (WUE) and water uptake reduction function by maize hybrid SC-704 in a semi-arid area and silty clay loam soil. A split-split-plot design with three replications in two years of 2009 and 2010 was conducted. The different levels of irrigation water considered as main plot, salinity of irrigation water as sub-plot and nitrogen fertilizer rate as sub-sub-plot. Irrigation treatments consisted of I1 (1.0ETc+0.25ETc as leaching), I2 (0.75I1) and I3 (0.50I1) applied at 7-day intervals. The salinity treatments of irrigation were 0.6 (fresh water), 2.0 and 4.0 dS m-1. There were also three nitrogen (N) treatments including 0, 150 and 300 kg N ha-1. Results showed that the actual crop ET and transpiration (T) were significantly less in I3 as compared to I1 treatments as 42 and 43%, respectively. Besides, T values under S3 were statistically less than that in S1 treatment as 12%. The soil evaporation (E) values were 26, 31 and 27% of ET at I1, I2 and I3 treatments, respectively and its values significantly increased with increasing salinity levels of irrigation water. The minimum and maximum amount of E occurred at I3S1N3 and I1S3N3, respectively. The study showed that deficit irrigation as 0.50I1 and 0.75 I1 were the optimum levels of irrigation to access the highest WP and WUE for dry matter (DM) and grain yield (GY) respectively. Besides, S1 was the optimum treatment for achievement of highest WP and WUE for DM and GY. Results also indicated that the optimum treatment for WP and WUE for GY was I2S1N3. Furthermore, N fertilization could not statistically improve WP and WUE beyond 150 kg N ha-1. The yield response factor to water showed that maize GY was more sensitive to water than its DM. Results also
184 A. Azizian & A.R. Sepaskhah / International Journal of Plant Production (2014) 8(2): 183-214
indicated that the Homaee and Feddes (1999) equation was resulted in acceptable estimation of root-water uptake reduction function [α (h,ho)]. Furthermore, results showed that the FAO method underestimated the maize yield (DM/GY) at different N application rates: however, the Homaee and Feddes (1999) method resulted in acceptable prediction of the maize GY. Therefore, Homaee and Feddes (1999) equation is recommended for estimation of both α (h, ho) and maize GY. Keywords: Maize; Nitrogen levels; Root-water uptake reduction function; Salinity levels; Water use efficiency; Yield-water relationships. Introduction
Maize is one of the three most important cereal crops (after wheat and rice) and is grown in a wide range of climates. Maize is used as human food, animal feed and pharmaceutical and industrial materials. It is a C4 plant, which is more efficient in the use of CO2, solar radiation, water and N supply in photosynthesis than C3 crops. Even though maize makes efficient use of water, it is considered more susceptible to environmental stress than other crops because of its unusual floral structure with separate male and female floral organs and the near-synchronous development of florets on a (usually) single ear borne on each stem (Huang et al., 2006).
Water is an important factor for crop production. Water use efficiency (WUE) is a function of multiple factors, including physiological characteristics of crop, genotype, soil characteristics such as soil water holding capacity, meteorological conditions and agronomic practices. To improve WUE, integrative measures should aim to optimize cultivar selection and agronomic practices. Managing irrigation at the field scale can improve WUE. Deficit irrigation is one strategy for maximizing WUE for higher yields per unit of irrigation water applied. This is the way of more effective and economic use of limited water supplies. The crop, for example maize, can be exposed to a certain level of water stress either during a particular period or throughout the whole growing season, without significant reduction in yields (Sepaskhah and Ghahraman, 2004). Furthermore, success with deficit irrigation is more probable in fine texture soils.
The supply of nitrogen (N) is also important for crop production as much as water. Maize has a positive response to N fertilizer application (Mansouri-Far et al., 2010). Water and N deficit lead to reductions in crop production by reducing resource use efficiency. Furthermore, an interaction between N and water supply has been demonstrated. In other words, N uptake from soil is influenced by water supply (Ercoli et al., 2008). Therefore, an optimum amount of N based on the available amount of water is needed to improve crop yield.
A. Azizian & A.R. Sepaskhah / International Journal of Plant Production (2014) 8(2): 183-214 185
Water shortage and soil salinity are two important limitations for crop production in arid and semi-arid regions. The effects of salinity and water stress on saffron yield (Sepaskhah and Yarami, 2009; Sepaskhah and Kamgar-Haghighi, 2009), madder (Rubina tinctorum L.) growth (Sepaskhah and Beirouti, 2009), corn yield (Azizian and Sepaskhah, 2014; Amer, 2010) have been reported. Interaction effect of irrigation and salinity levels on maize was studied by Amer (2010). He reported that leaf temperature, transpiration rate and stomatal resistance of maize and also field water infiltration were significantly affected by irrigation and salinity levels and their interaction. The studies on interaction between salinity and N fertilizer for maize showed that optimum level of N was different under different salinity levels (Grattan and Grieve, 1999). However, data on the interaction effect of irrigation, salinity and N, are limited and needs to be known in the management of water, soil and crop.
Root water uptake is reduced by water and salinity stresses. In these conditions, during an irrigation interval, evapotranspiration depletes the soil water content and consequently the matric and osmotic potential of the soil solution are reduced and these factors reduce root water uptake. To quantify the root water uptake, the microscopic and macroscopic extraction approaches are used. The macroscopic approach readily used by many investigators (Feddes et al., 1978) that assumes the extraction term under non-stress conditions is simply equal to potential transpiration over root zone. As soon as the soil water pressure head reaches a critical value, the transpiration reduces linearly until the root-water uptake ceases completely (wilting point). This reduction is quantified by the so-called reduction function. The macroscopic models basically do not account for saline conditions. Van Genuchten (1987) and Dirksen et al. (1993) incorporated different nonlinear osmotic head dependent reduction functions in Feddes et al. (1978) model. Most of these are based upon the so-called multiplicative concept that uses the product of the separate reduction terms for soil water osmotic and pressure heads. Recently it is indicated that the proposed linear reduction function is neither additive nor multiplicative (Homaee and Feddes, 1999; Homaee et al., 2002) and it was assumed that both the intercept and slope of the reduction function increased with salinity. Homaee et al. (2002) verified their model by predicting the vegetative growth of alfalfa. It is indicated in the literature that the root water uptake function (α) is predicted accurately by Homaee and Feddes (1999) methods. However, the α may vary under deficient/sufficient/excess N fertilizer in the plant-soil-water-salinity-N complex system. Furthermore, it also may be

186 A. Azizian & A.R. Sepaskhah / International Journal of Plant Production (2014) 8(2): 183-214
expected that yield-water relationship vary under different salinity and nitrogen levels.
The purposes of this research were to evaluate the effects of different water, salinity and nitrogen levels on yield-water relationship, water-use efficiency by maize in a silty clay loam soil. Furthermore, root-water uptake reduction function of maize by different theoretical concepts was compared with measured values. The application of these coefficients in prediction of maize dry matter and grain yield was also evaluated. Materials and Methods Field experiment Site description
This study was conducted in 2009 and 2010 at the Bajgah Agricultural Experiment Station located at 29° 56’ N, 52° 02’ E and 1810 m above the mean sea level, in southwest of Iran with a semi-arid climate. Long-term mean air temperature, precipitation and relative humidity of the region are 13.4 °C, 387 mm and 52.2%, respectively. Soil of the experimental site was classified as silty clay loam for 0.60 m of soil profile. Physico-chemical properties of the soil are presented in Table 1. Chemical analysis of the fresh and saline irrigation water is also shown in Table 2. Table 1. Physico-chemical properties of the soil used in the experiment (average of two years).
Characteristic Amount Depth (cm) 0-30 30-60 Texture SCL* SCL % Caly 53.5 54.8 %Silt 33.0 34.5 Field capasity (-0.03 Mpa) (%) 31 30 Permanent wilting point (-1.5 Mpa) (%) 18 19 Bulk density (Mg m-3) 1460 1560 ECe (dS m-1) 0.65 0.55 pH (sturated past) 7.50 7.45 Organic matter (%) 0.7 0.5 Total nitrogen (%) 0.021 0.009 NO3-3 (mg L-1) 4.6 6.0 Available P (mg L-1) 21.0 11.0 Available K (mg L-1) 343.0 315.0
* Silty clay loam.
A. Azizian & A.R. Sepaskhah / International Journal of Plant Production (2014) 8(2): 183-214 187
Table 2. Chemical analysis of the fresh and saline irrigation water used in the experiment (average of two years).
Characteristic Fresh water Saline water EC (dS m-1) 0.60 2.00 4.00 pH 7.80 7.70 7.80 Cl-1 (meq L-1) 1.81 17.27 40.37 Na+ (meq L-1) 1.74 18.9 30.3 Ca2+ (meq L-1) 2.15 16.17 39.41 Mg2+ (meq L-1) 2.00 2.00 2.00 HCO3
- (meq L-1) 1.97 4.99 4.64
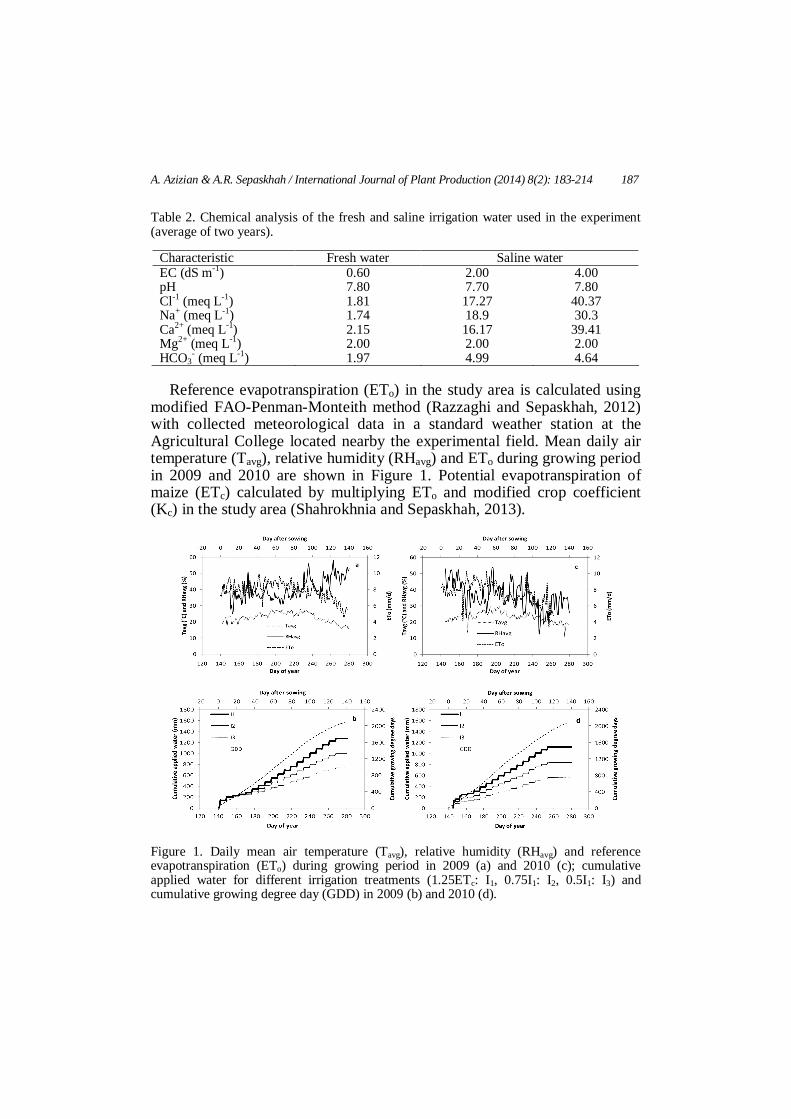
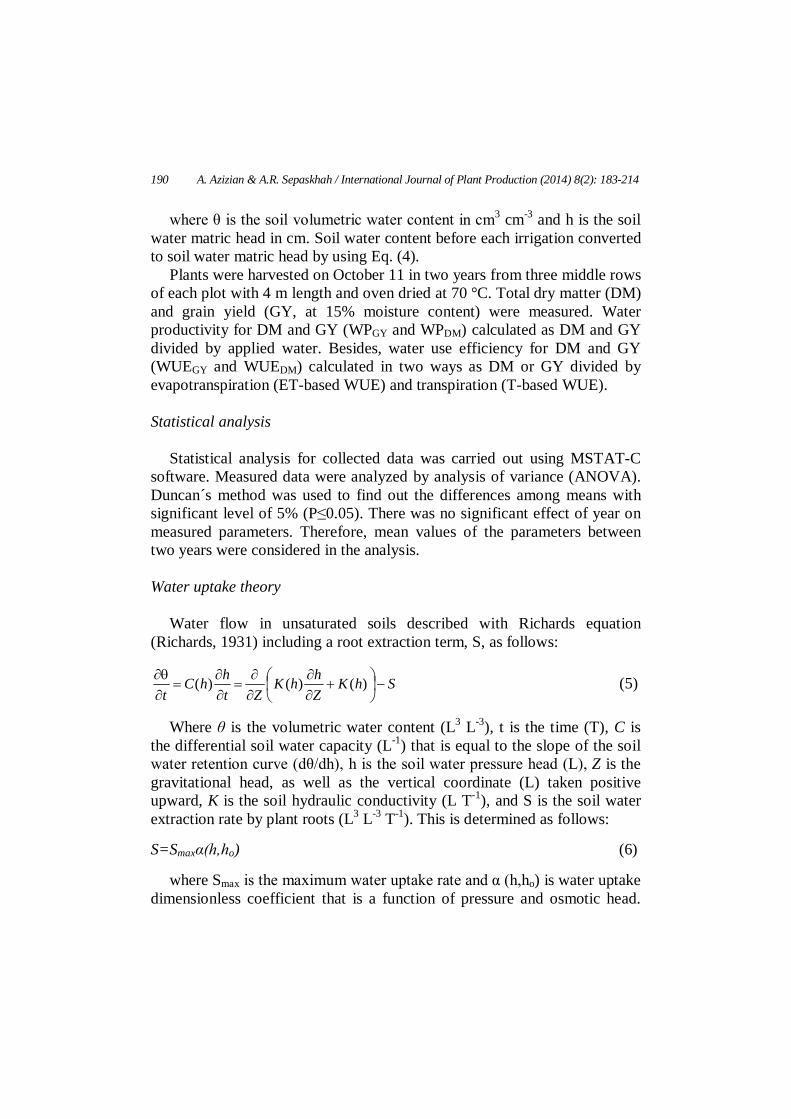
Reference evapotranspiration (ETo) in the study area is calculated using modified FAO-Penman-Monteith method (Razzaghi and Sepaskhah, 2012) with collected meteorological data in a standard weather station at the Agricultural College located nearby the experimental field. Mean daily air temperature (Tavg), relative humidity (RHavg) and ETo during growing period in 2009 and 2010 are shown in Figure 1. Potential evapotranspiration of maize (ETc) calculated by multiplying ETo and modified crop coefficient (Kc) in the study area (Shahrokhnia and Sepaskhah, 2013).
Figure 1. Daily mean air temperature (Tavg), relative humidity (RHavg) and reference evapotranspiration (ETo) during growing period in 2009 (a) and 2010 (c); cumulative applied water for different irrigation treatments (1.25ETc: I1, 0.75I1: I2, 0.5I1: I3) and cumulative growing degree day (GDD) in 2009 (b) and 2010 (d).
188 A. Azizian & A.R. Sepaskhah / International Journal of Plant Production (2014) 8(2): 183-214
Experimental design and treatments
Maize (cv SC704, a late maturity hybrid) was planted at furrow irrigation system on May 21, 2009 and May 25, 2010. The length and spacing of furrows were 5 and 0.75 m, respectively, and there were five furrows in each plot. Final maize density after thinning was 88888 plants ha-1 with 15 cm distance between plants on the rows. There was no precipitation or groundwater contribution during the growing seasons. Phosphorus in the form of triple superphosphate was applied at a rate of 200 kg ha-1 before planting.
Field adequately watered (as 200 mm) in first and second irrigation (three-leaf stage of plant). After first irrigation a 1.5 m length aluminum access tube was installed at the center of each plot of treatment in two replications for measuring soil water content using neutron scattering method. Simultaneously, PVC and bottom-perforated microlysimeters (with 10 cm diameter and 30 cm length) were installed in one replication in order to measure evaporation from soil surface (E) during the irrigation intervals by weighing them before and after each irrigation. Salinity and irrigation treatments were initiated at the third irrigation event. The treatments were three levels of irrigation water, salinity of irrigation water and nitrogen fertilizer rates. Irrigation was scheduled with 7-day interval (Sepaskhah et al., 1993) and ETc was considered as full plant water requirement for upcoming 7-day. Irrigation treatments were I1 (1.0ETc +0.25ETc as leaching fraction), I2 (0.75I1) and I1 (0.50I1). N levels consisted of N1, N2 and N1 were 0, 150 and 300 kg N ha-1, respectively as urea. 70% of the urea fertilizer was applied at 3rd week and the rest was applied at 10th week after planting in two years. Salinity treatments were S1, S2 and S3 equivalent to 0.6 (groundwater salinity), 2.0 and 4.0 dS m-1. The S3 and S2 treatments were made by adding NaCl and CaCl2 salts to the groundwater. Cumulative applied water for different irrigation treatments are shown in Figure 1. The experimental design was a split-split plot arrangement with three replications. Water, salinity and nitrogen treatments were considered as the main-, sub- and sub-sub- factor, respectively. Irrigation water was applied using volumetric measuring device. After first year the field was leached by two heavy irrigations for reducing soil profile salinity during winter season. The arrangement of the experimental treatments in the field in second year (2010) was the same as that in first year.
A. Azizian & A.R. Sepaskhah / International Journal of Plant Production (2014) 8(2): 183-214 189
Measurements and calculations
The actual crop evapotranspiration for irrigation intervals (ET, mm) was estimated by the water balance method as:
rZDPIET )( 21 (1)
where I is the irrigation amount (mm), P is the precipitation (mm), D is the deep percolation (mm) from the bottom of the root zone which was considered as the amount of soil water exceeded field capacity of the soil of root zone, Zr is the thickness of root zone soil layer (mm) and θ1 and θ2 are mean volumetric soil water contents (cm3 cm-3) in root zone before two consecutive irrigations. Root zone depth was estimated by the following equation (Borg and Grimes, 1986):
47.103.3sin5.05.0max
M
ASrr D
DZZ (2)
where Zr is the root depth (m), Zr max is the maximum root depth, 1.55 m, DAS is the number of days after sowing, DM is the number of days after sowing for maximum root depth, 90 days.
Volumetric soil water contents in different irrigation treatments were monitored by neutron scattering method (neutron meter, Model CPN, 503DR) up to 1.5 m depth with 0.30 m intervals before each irrigation event. Crop transpiration was calculated as evapotranspiration minus soil surface evaporation.
Soil samples of each 0.30 m increment up to 1.5 m depth, were taken at 30-day intervals, air dried and passed through 2 mm sieve for chemical analysis including electrical conductivity of soil saturation extract (ECe). Osmotic head of the soil water was estimated by the following equation (Richards, 1954):
ho=-360×ECe (3)
where ho is the osmotic potential in cm and ECe is the soil saturation extract salinity in dS m-1. Soil samples were also used to determine the soil water retention curve by hanging water column and pressure plate apparatus. The soil water retention equation was obtained as: θ=0.1+0.355(1+|0.0154h|1.279)-0.218 (4)
190 A. Azizian & A.R. Sepaskhah / International Journal of Plant Production (2014) 8(2): 183-214
where θ is the soil volumetric water content in cm3 cm-3 and h is the soil water matric head in cm. Soil water content before each irrigation converted to soil water matric head by using Eq. (4).
Plants were harvested on October 11 in two years from three middle rows of each plot with 4 m length and oven dried at 70 °C. Total dry matter (DM) and grain yield (GY, at 15% moisture content) were measured. Water productivity for DM and GY (WPGY and WPDM) calculated as DM and GY divided by applied water. Besides, water use efficiency for DM and GY (WUEGY and WUEDM) calculated in two ways as DM or GY divided by evapotranspiration (ET-based WUE) and transpiration (T-based WUE). Statistical analysis
Statistical analysis for collected data was carried out using MSTAT-C software. Measured data were analyzed by analysis of variance (ANOVA). Duncan´s method was used to find out the differences among means with significant level of 5% (P≤0.05). There was no significant effect of year on measured parameters. Therefore, mean values of the parameters between two years were considered in the analysis. Water uptake theory
Water flow in unsaturated soils described with Richards equation (Richards, 1931) including a root extraction term, S, as follows:
ShKZhhK
ZthhC
t
)()()( (5)
Where θ is the volumetric water content (L3 L-3), t is the time (T), C is
the differential soil water capacity (L-1) that is equal to the slope of the soil water retention curve (dθ/dh), h is the soil water pressure head (L), Z is the gravitational head, as well as the vertical coordinate (L) taken positive upward, K is the soil hydraulic conductivity (L T-1), and S is the soil water extraction rate by plant roots (L3 L-3 T-1). This is determined as follows: S=Smaxα(h,ho) (6)
where Smax is the maximum water uptake rate and α (h,ho) is water uptake dimensionless coefficient that is a function of pressure and osmotic head.
A. Azizian & A.R. Sepaskhah / International Journal of Plant Production (2014) 8(2): 183-214 191
The available macroscopic water uptake reduction functions for the combined stresses are divided into two categories: additive and multiplicative. The additive water uptake reduction function (van Genuchten, 1987) is as follows:
p
hhaha
hh
50
021
0
1
1),( (7)
where h50 is the soil water pressure head at which α(h) is reduced by
0.50, a1 and a2 are the weighting factors and just for simplicity they are generally assumed being 1.0 thus giving linear additivity, and p is an empirical parameter, the value of p was found to be about 3.0 when the S-shaped function was applied to salinity stress data. The multiplicative water uptake reduction function proposed by van Genuchten, (1987); Dirksen et al. (1993); Homaee et al. (2002); Mass and Hoffman (1977) and Homaee and Fedddes (1999). The multiplicative reduction function (van Genuchten, 1987) is as follows:
21
050
0
50
0
1
1
1
1),( pp
hh
hh
hh
(8)
where ho50 is the soil salinity at which water uptake is reduced by 0.50.
Homaee et al. (2002) proposed the following equation for the combined stresses:
21
max0*
0
0*
0
0
02
max*
*
0
01
011
1
11
1),( pp
hhhh
hhhh
hh
(9)
where hmax and homax is the soil water pressure head and soil osmotic head
beyond which the changes of h or ho no longer influence the relative transpiration significantly, h*
o is the threshold soil water osmotic head corresponding to the threshold soil water salinity, ho is the soil osmotic head corresponding to the soil water salinity, α01 and α02 is the relative transpiration at hmax and homax and p1 and p2 is given as follows:
192 A. Azizian & A.R. Sepaskhah / International Journal of Plant Production (2014) 8(2): 183-214
*max
max1 hh
hp
(10)
*0max0
max02 hh
hp
(11)
The multiplicative water uptake reduction function proposed by Dirksen
et al. (1993) is as follows:
21
050*
0
0*
0
50*
*0
1
1
1
1),( pp
hhhh
hhhh
hh
(12)
Maas and Hoffman (1977) proposed the following equation for the
macroscopic water uptake reduction function:
)(360
1),( 0*
043
40 hhb
hhhhhh (13)
where h3 is the soil water pressure head threshold value, h4 is the soil water
pressure head at wilting point, and b is the yield reduction as percent per unit increase salinity of soil water as dS m-1. Homaee and Feddes (1999) proposed another equation that is basically a combination of linear and non-linear and differs conceptually from additive and multiplicative theories. In their equation it is assumed that each dS m-1 salinity beyond the threshold value (EC*) shifts the wilting point 360 cm to the left, and the equation is as follows:
)(360
1)()(),( 0
*0
043
040 hhb
hhhhhhhh (14)
This equation is valid for ho≤ho
* and (h4−ho)≤h≤h3, respectively. The value of 360 cm is the conversion factor of soil water salinity to osmotic pressure head as suggested by Richards (1954). Yield estimation models
Stewart et al. (1977) proposed the following equation to obtain the yield in water stress conditions:
A. Azizian & A.R. Sepaskhah / International Journal of Plant Production (2014) 8(2): 183-214 193
n
i ic
adjcy
m
a
ETET
KYY
i1
11 (15)
where Ya is the actual crop yield (Mg ha-1), Ym is the maximum expected
crop yield (Mg ha-1), Ky is the relative yield response factor to water stress and vary over the growing season, i is the consecutive growing stages, n is the number of growing stages, ETc is the crop evapotranspiration (no water stress) (mm d-1) and ETc-adj is the adjusted crop evapotranspiration (mm d-1) that is calculated as:
csadjc ETKET (16)
where Ks is the transpiration reduction coefficient and it is dependent on available soil water that is varied between 0-1 under salinity and water stress condition and is given as follows (Allen et al., 1998):
RAWTAW
DTAWECECK
bK rthresholdee
ys )(
1001 (17)
where Dr is the root zone water depletion (mm), TAW is the total available
soil water in the root zone (mm), RAW is the readily available water (mm), ECe is the soil saturation extract electrical conductivity (dS m-1) and ECe-threshold is the threshold soil water electrical conductivity (dS m-1) and b is the growth reduction coefficient for maize GY/DM (% per unit increase in soil ECe). After rearranging Eq (15) and combining Eq (16) and Eq (6), the following equations for relative yield under combined water and salinity stresses were obtained:
c
cy
m
a
ETEThhK
YY ),(11 0 (18a)
c
csy
m
a
ETETKK
YY 11 (18b)
Application of Eq (18b) should usually be restricted to ECe<ECe-threshold
+50/b and Ky≤1.0. For Ky>1.0 it should predict Ya=0 at Ks=0. In addition, the Ky values are given for only 23 crops by Doorenbos and Kassam (1979) and
194 A. Azizian & A.R. Sepaskhah / International Journal of Plant Production (2014) 8(2): 183-214
where Ky is unknown, it is suggested to use Ky=1 or may select the Ky for a crop that has similar behavior. If Ks in Eq (16) is replaced by α(h, ho) Eq (18a) is obtained which is a different method for calculation of ETc-adj. Then, Eq (18a) is used to estimate relative yield and with knowing the maximum yield, Ym, the value of actual yield, Ya is estimated. Models evaluation
Finally, evaluation of predicted vs. measured α and yield was made by calculation of two statistics (Willmott, 1982): normalize root mean square error (NRMSE) and index of agreement (d) as:
m
ni ii O
NOP
NRMSE /)(1
2
(19a)
ni mimi
ni ii
OOOPOP
d1
21
2
)()(
1 (19b)
where Pi and Oi are the ith predicted and observed values of interest,
respectively and Om is the mean observed value of interest. The NRMSE is a measure of the average deviation of predicted from observed values and varies between 0.0 and 1.0. The zero value indicates no deviation. However, the value of d is an index of how well the predicted and observed deviations about Om correspond to each other, both in magnitude and sign. It varies between 0.0 and 1.0, with 1.0 represent perfect agreement. The two statistics (NRMSE and d index) in conjunction quantify the agreement on the mean observed value of interest between simulated and observed data. Results and Discussion Water use and soil water content
The two years averages of applied water for maize were 1189, 892 and 595 mm for I1, I2 and I3 treatments, respectively. The values of actual E, ET and T were weekly calculated using water balance method [Eq. (1)]. The seasonal amounts of maize actual ET and T under different irrigation, salinity and nitrogen levels are presented in Table 3. The values of ET in I2

A. Azizian & A.R. Sepaskhah / International Journal of Plant Production (2014) 8(2): 183-214 195
and I3 treatments were significantly less than that of I1 treatment as 19 and 42%, respectively. Similar trend was observed for T which its values in I2 and I3 treatments were 25 and 43% less than T values in I1 treatment. There was no significant difference between ET of maize under salinity levels of irrigation water, although it was slightly (1%) lower with higher salinity level (S3) relative to S1 treatment. However, the T values decreased significantly with increasing salinity level as 5 and 12% at S2 and S3 treatments relative to the control (S1=0.6 dS m-1). The variation of T values under irrigation and salinity treatments was in agreement with growth parameters including DM and GY (Azizian and Sepaskhah, 2014). There was also no significant difference between ET and T values under different N application rates. Although, the values of these parameters were slightly lower at the highest N rate (0.7 and 0.4% for ET and T, respectively) relative to N2 level which is in accordance to growth results of maize that the highest GY and DM were observed at N2=150 kg ha-1 (Azizian and Sepaskhah, 2014). The leaching fraction occurred in different irrigation treatments was calculated from the amounts of applied water and ET as 0.141, 0.088 and 0.0 in I1, I2 and I3 treatments, respectively. Table 3. Effect of irrigation and salinity levels and nitrogen application rates on two years average of evapotranspiration (ET), evaporation from soil surface (E), water productivity (WP) and use efficiency (WUE) for top dry matter (DM) and grain yield (GY) of maize.
Irrigation levels Salinity levels (dS m-1) Nitrogen levels (kg ha-1) Measured parameter I1=1.25ETc I2=0.75I1 I3=0.50I1 S1=0.6 S2=2 S3=4 N1=0 N2=150 N3=300 Applied water (mm) 1189 892 595 892 892 892 892 892 892
ET (mm) 952a* 768b 554c 761a 760a 754a 760a 760a 755a T (mm) 704a 528b 403c 578a 547b 510c 545a 546a 544a E (mm) 248a 240b 151c 183c 213b 244a 215a 214a 211a Water productivity (kg m-3)
WPDM 1.67c 1.90b 2.12a 2.10a 1.88b 1.71c 1.69b 2.01a 1.99a WPGY 0.83b 0.86a 0.79c 0.96a 0.81b 0.71c 0.66b 0.91a 0.91a ET-based WUE (kg m-3)
WUEDM 2.15c 2.32b 2.48a 2.58a 2.29b 2.09c 2.05b 2.45a 2.45a WUEGY 1.01a 1.02a 0.88b 1.15a 0.95b 0.81c 0.76b 1.07a 1.07a T-based WUE (kg m-3)
WUEDM 2.90b 3.35a 3.35a 3.35a 3.16b 3.09b 2.84b 3.41a 3.36a WUEGY 1.38a 1.50a 1.21b 1.51a 1.34b 1.23b 1.08b 1.52a 1.49a
* Means in each row under irrigation, salinity and nitrogen levels for different traits followed by the same letter are not statistically different at P≤0.05 by Duncan’s multiple range test.
196 A. Azizian & A.R. Sepaskhah / International Journal of Plant Production (2014) 8(2): 183-214
The E values were 26, 31 and 27% of ET at I1, I2 and I3 treatments, respectively. The corresponding values in S1, S2 and S3 treatments were 24, 28 and 32% and in N1, N2 and N3 treatments were 28, 28 and 28%, respectively. The E values were significantly decreased with decreasing irrigation level as 3 and 39% in I2 and I3 relative to I1 treatment, respectively. Increasing salinity levels of irrigation water resulted in a significantly higher E value as 16 and 33% in S2 and S3 compared to the S1 treatment, respectively. The E values were not statistically different among N rates.
The variation of ET, T and E values under interaction effect of irrigation and salinity levels and nitrogen application rate are presented in Table 4. Increasing nitrogen rate had a complex effect on ET and T. With fresh water application, a little increase in ET by 150 kg N ha-1 (0.6, 0.8 and 0.4% at I1, I2 and I3 treatment, respectively) and then a reduction (1.5, 1.1 and 0.9% at I1, I2 and I3 treatment, respectively) by 300 kg N ha-1 was observed. Increasing salinity level of irrigation water resulted in reduction of ET at full irrigation (I1). While, at other irrigation regime (I2 and I3) an increasing/ decreasing trend was observed in ET. A slight decrease in ET of madder at lower salinity levels of irrigation water was reported by Sepaskhah and Beirouti (2009). At I1 and I2 treatments, T values were significantly reduced by increasing salinity levels. While, at I3 treatment, T values at the highest salinity levels were statistically less than those values in other salinity levels. The average reduction of T value due to salinity in I1, I2 and I3 treatments were 17, 13 and 7%, respectively. The variation of ET and T were nearly similar to the variation of maize growth parameters that is formerly reported by Azizian and Sepaskhah (2014). The main trend in E at each irrigation treatments was that its value significantly increased with increasing salinity levels of irrigation water. The maximum increase in E due to salinity was observed at I1S3 treatment as 46% compared to the I1S1 treatment. The average increase of E value due to salinity in I1, I2 and I3 treatments were 36, 36 and 27%, respectively. These results support the fact that salinity could reduce the growth of plant, size and surface of canopy and root growth. Consequently, the ET and T would be reduced. On the other hand, smaller canopy size of plants results in higher evaporation from bare soil exposed to the radiation.
A. Azizian & A.R. Sepaskhah / International Journal of Plant Production (2014) 8(2): 183-214 197
Table 4. Interaction effect of irrigation and salinity levels and nitrogen application rates on evapotranspiration (ET), evaporation (E), water productivity (WP) and water use efficiency for grain yield (GY) of maize.
Irrigation levels I1=1.250ETc I2=0.75I1 I3=0.50I1
Nitogen Levels (kg ha-1)
N1=0 N2=150 N3=300 N1=0 N2=150 N3=300 N1=0 N2=150 N3=300 Salinity levels (dS m-1) ET (mm)
S1=0.6 969a* 976a 955b 767de 773d 759e 551g 553g 546g S2=2 947bc 956b 947bc 777d 763de 769de 559fg 564f 557fg S3=4 945bc 937c 936c 773d 765de 766de 553fg 552fg 560fg T (mm) S1=0.6 752a 757a 756a 559f 571e 562ef 420i 411i 416i S2=2 700b 703b 708b 531g 526g 526g 409i 412i 409i S3=4 659c 651cd 645d 493h 490h 495h 384j 384j 387j E (mm) S1=0.6 217f 218f 199g 208fg 202g 197g 131i 142ij 129j S2=2 248de 253d 239e 246de 237e 244de 149i 152i 148i S3=4 285ab 286ab 291a 280abc 275bc 271c 170h 168h 172h WPGY (kg m-3) S1=0.6 0.77jkl 0.99cde 1.10b 0.83hij 0.98cdef 1.18a 0.80ijk 0.95defg 1.05bc S2=2 0.59no 0.90gh 0.84hij 0.69lm 1.01cd 0.91efgh 0.67mn 0.85hi 0.81ijk S3=4 0.51p 0.91fgh 0.83hij 0.54op 0.88ghi 0.74klm 0.54op 0.73klm 0.70lm ET-based WUEGY(kg m-3) S1=0.6 0.93kl 1.21f 1.39cd 0.98jk 1.16fgh 1.43c 0.90e 1.08b 1.22a S2=2 0.73o 1.12ghi 1.06ij 0.79no 1.22f 1.08i 0.73ij 0.94de 0.90e S3=4 0.62p 1.07i 0.92klm 0.61p 1.04ij 0.87lm 0.58mn 0.82fg 0.75hi T-based WUEGY (kg m-3) S1=0.6 1.22m 1.57ijk 1.76gh 1.37l 1.58ijk 1.93def 1.18efg 1.45b 1.58a S2=2 1.02n 1.54ijk 1.43kl 1.18m 1.79fgh 1.60ij 1.01hi 1.29c 1.23cde S3=4 0.92n 1.56ijk 1.38l 1.01n 1.67hi 1.38l 0.86jkl 1.20cd 1.12efg
* Means within each plant parameter followed by the same letter are not statistically different at P≤0.05 by Duncan’s multiple range test.
Variation of soil water content in the root zone before irrigation is presented in Figure 2. Soil water content before cultivation was 0.165 cm3 cm-3 that is below the wilting point (0.18 cm3 cm-3, Table 1). This value was raised before 2nd irrigation to nearly 0.27 cm3 cm-3 at each irrigation treatments and reduced gradually during growing season. Figure 2 showed that soil water content in root zone was slightly higher at the highest salinity treatment relative to other salinity levels of irrigation water indicating lower water uptake by plant that is resulted in greater amount of evaporation from soil surface. The minimum amount of E occurred at deficit irrigation (I3 treatment) with fresh water application and 300 kg N ha-1. While, maximum amount occurred at full irrigation (I1=1.25ETc) with saline water application (S3=4.0 dS m-1) and 300 kg N ha-1.
198 A. Azizian & A.R. Sepaskhah / International Journal of Plant Production (2014) 8(2): 183-214
Figure 2. Variation of soil water content (cm3 cm-3) in root zone during growing season at different irrigation and salinity levels (I1=1.25ETc, I2=0.75I1, I3=0.50I1; S1=0.6, S2=2.0, S3=4.0 dS m-1).
A. Azizian & A.R. Sepaskhah / International Journal of Plant Production (2014) 8(2): 183-214 199
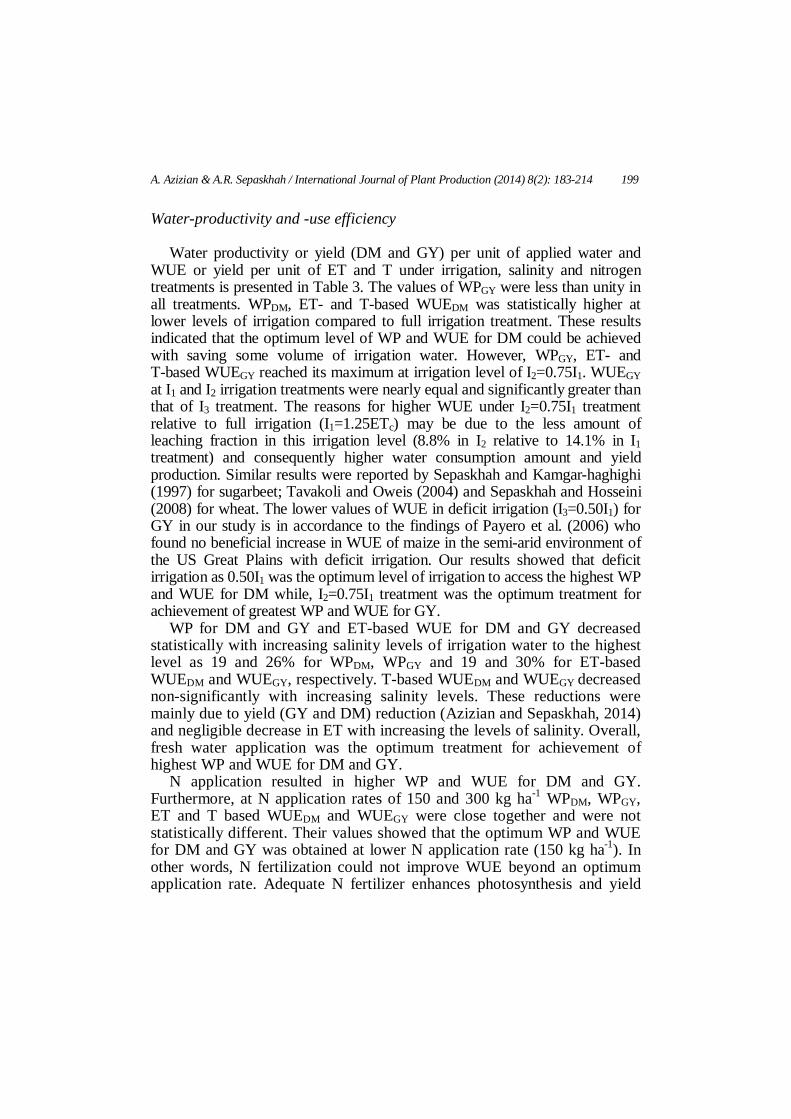
Water-productivity and -use efficiency
Water productivity or yield (DM and GY) per unit of applied water and WUE or yield per unit of ET and T under irrigation, salinity and nitrogen treatments is presented in Table 3. The values of WPGY were less than unity in all treatments. WPDM, ET- and T-based WUEDM was statistically higher at lower levels of irrigation compared to full irrigation treatment. These results indicated that the optimum level of WP and WUE for DM could be achieved with saving some volume of irrigation water. However, WPGY, ET- and T-based WUEGY reached its maximum at irrigation level of I2=0.75I1. WUEGY at I1 and I2 irrigation treatments were nearly equal and significantly greater than that of I3 treatment. The reasons for higher WUE under I2=0.75I1 treatment relative to full irrigation (I1=1.25ETc) may be due to the less amount of leaching fraction in this irrigation level (8.8% in I2 relative to 14.1% in I1 treatment) and consequently higher water consumption amount and yield production. Similar results were reported by Sepaskhah and Kamgar-haghighi (1997) for sugarbeet; Tavakoli and Oweis (2004) and Sepaskhah and Hosseini (2008) for wheat. The lower values of WUE in deficit irrigation (I3=0.50I1) for GY in our study is in accordance to the findings of Payero et al. (2006) who found no beneficial increase in WUE of maize in the semi-arid environment of the US Great Plains with deficit irrigation. Our results showed that deficit irrigation as 0.50I1 was the optimum level of irrigation to access the highest WP and WUE for DM while, I2=0.75I1 treatment was the optimum treatment for achievement of greatest WP and WUE for GY.
WP for DM and GY and ET-based WUE for DM and GY decreased statistically with increasing salinity levels of irrigation water to the highest level as 19 and 26% for WPDM, WPGY and 19 and 30% for ET-based WUEDM and WUEGY, respectively. T-based WUEDM and WUEGY decreased non-significantly with increasing salinity levels. These reductions were mainly due to yield (GY and DM) reduction (Azizian and Sepaskhah, 2014) and negligible decrease in ET with increasing the levels of salinity. Overall, fresh water application was the optimum treatment for achievement of highest WP and WUE for DM and GY.
N application resulted in higher WP and WUE for DM and GY. Furthermore, at N application rates of 150 and 300 kg ha-1 WPDM, WPGY, ET and T based WUEDM and WUEGY were close together and were not statistically different. Their values showed that the optimum WP and WUE for DM and GY was obtained at lower N application rate (150 kg ha-1). In other words, N fertilization could not improve WUE beyond an optimum application rate. Adequate N fertilizer enhances photosynthesis and yield
200 A. Azizian & A.R. Sepaskhah / International Journal of Plant Production (2014) 8(2): 183-214
production per unit evapotranspiration. Improved WUE for rapeseed and maize with N application reported by Sepaskhah and Tafteh (2012) and Tafteh and Sepaskhah (2012), respectively.
The variation of WP and WUE for GY under interaction effect of irrigation and salinity levels and nitrogen application rate are presented in Table 4. With saline water application WP and WUE first increased at 150 kg N ha-1 and then reduced at 300 kg N ha-1. However, with freshwater application these parameters reached their maximum values at 300 kg N ha-1. In other words, application of saline water in maize production was more efficient with 150 kg N ha-1. While, the efficiency of fresh water in maize production was higher at 300 kg N ha-1. Halvorson et al. (2006) reported that WUE can be increased by N application and it increased curvilinearly with increasing level of available N. In this study, higher salinity level of irrigation water generally decreased WPGY and WUEGY in each irrigation and nitrogen level. The highest WPGY and ET- and T-based WUEGY were observed at full fresh irrigation treatment (I1=1.25ETc) and nitrogen application rate of 300 kg ha-1 as 1.18 and 1.43 and 1.93 kg m-3, respectively. Yield-water relationship
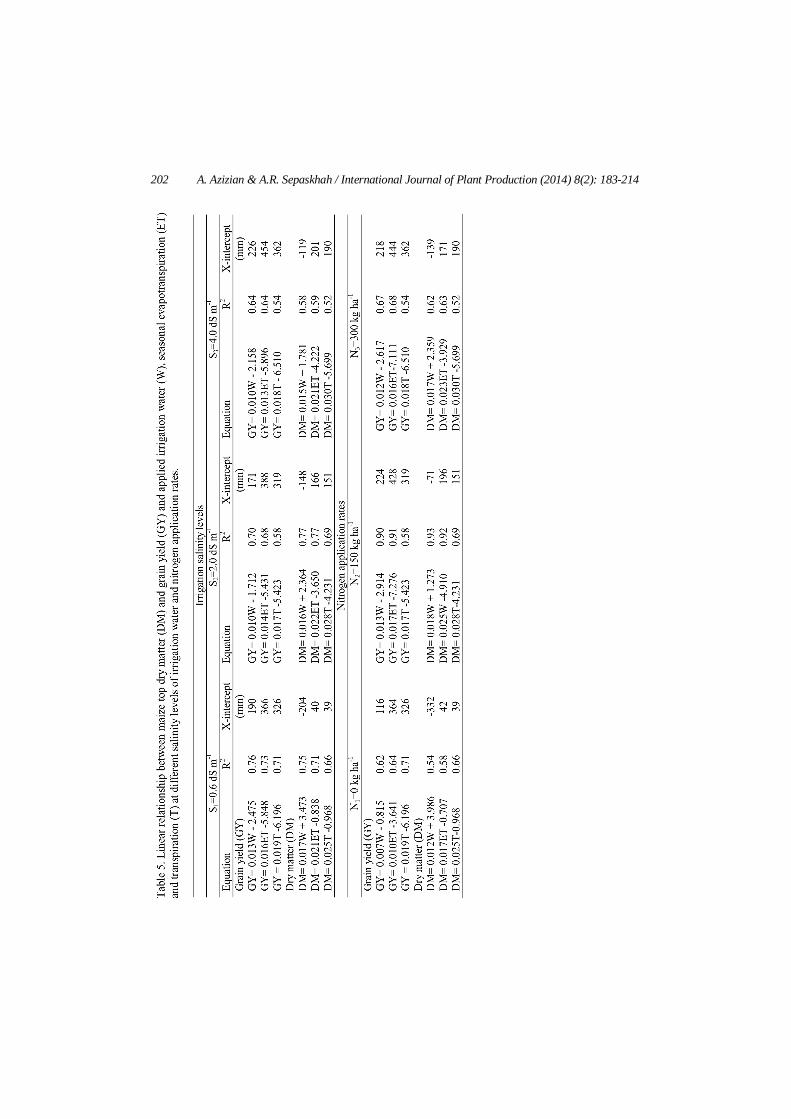
The linear relationship was found between maize yield (DM and GY) and seasonal applied water (W), ET and T at different salinity and nitrogen levels. Results are presented in Table 5. It was reported that the relationship between yield and irrigation water supply have been linear or curvilinear relationship, however, it was linear when all the applied water is consumed as ET (Payero et al., 2008). The slopes of regression lines represent the increment of yield (DM or GY) for unit increment of seasonal W, ET and T. The higher slope means the higher efficiency of applied water in yield production. Comparing the regression lines among salinity levels of irrigation water (Table 5) showed generally higher slope and R2 value at S1 relative to S2 and higher values at S2 relative to S3 treatment for maize GY. The higher water loses via soil surface evaporation and lower water consumption (T) by plant (Table 3) was probably the reasons for reduction of slope in GY-W, -ET and -T relationship at saline irrigation water treatment. The slopes of the regression lines were also different among N treatments. Their values for N2 (150 kg ha-1) were generally higher than those for N3 and N1. The conflicting data have been reported in the literature for the slope of linear relationship between yield and W, ET and T. Di Paolo and Rinaldi (2008) showed the slope of the regression line for the 300 kg N ha-1 was slightly higher than that of 150 kg N ha-1 treatment. While, Mansouri-Far et al. (2010) reported that the slope of the regression line for
A. Azizian & A.R. Sepaskhah / International Journal of Plant Production (2014) 8(2): 183-214 201
the 200 kg N ha-1 treatment was slightly lower than that of 100 kg N ha-1 treatment. This variation is likely due to differences in soil and crop characteristics and weather conditions in different locations. Furthermore, crop rooting pattern which affects water uptake would be different at various N application rates. The negative intercept in GY-W relationships means a minimum amount of water (X-intercept in Table 5) need to be applied for beginning GY production, while the positive intercept in DM-W relationship showed that some DM would even be produced with soil moisture storage with no water application. The negative intercept in GY/DM-ET and -T relationships also means that a minimum amount of water should be used via ET/T for starting yield production. Furthermore, the difference between calculated X-intercepts (Table 5) of DM/GY-ET and DM/GY-T relationships could be attributed to the soil surface evaporation. Yield response factor to water (Ky)
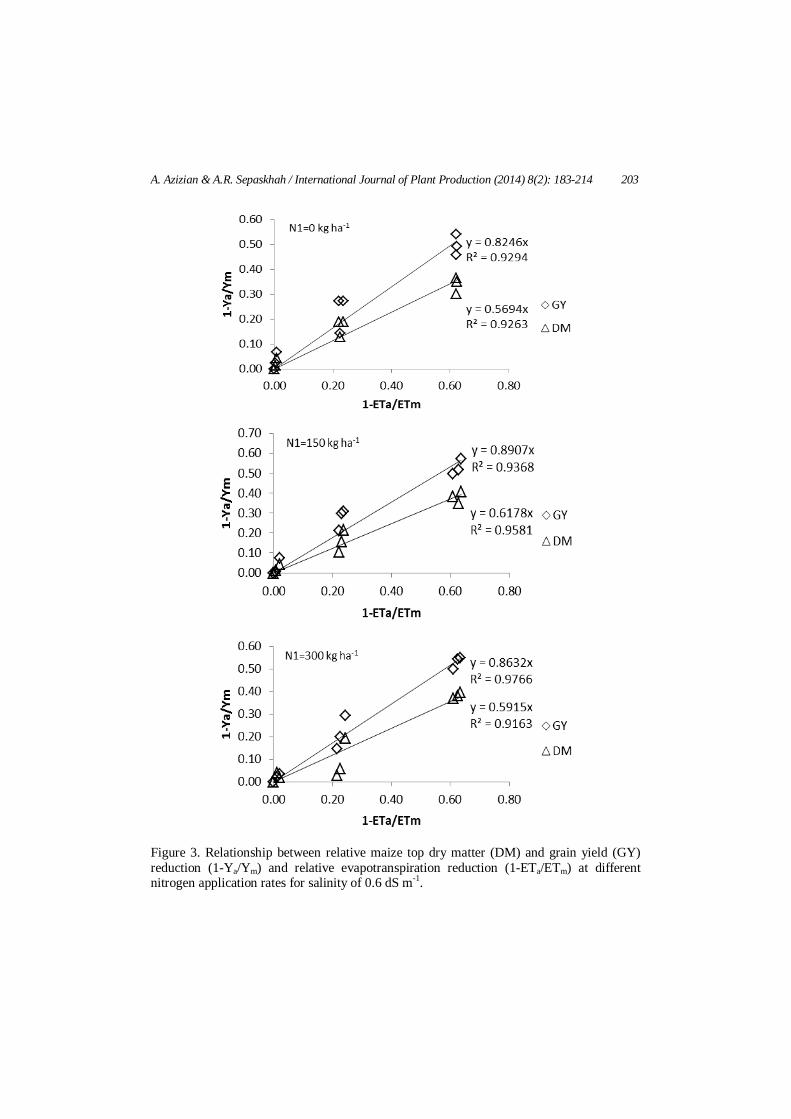
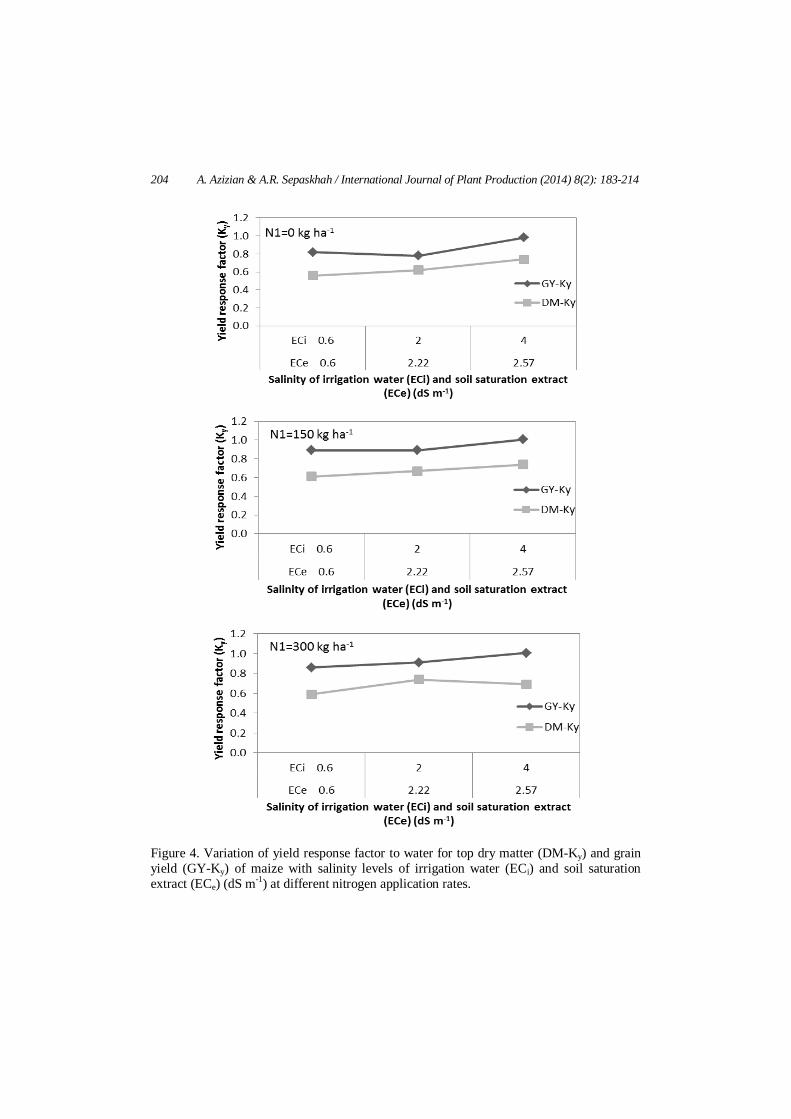
Relationship between relative DM and GY reduction of maize (relative to their maximum amounts obtained at I1 treatment, (1-Ya/Ym)) and relative evapotranspiration reduction (relative to the maximum ET obtained at I1 treatment, (1-ETa/ETm)) for water salinity of 0.6 dS m-1 was determined by regression analysis (Figure 3). Coefficient of regression lines represent the growth response factor to water for DM and GY. The maize DM response factors to water were 0.57, 0.62 and 0.59 at 0, 150 and 300 kg N ha-1, respectively. The corresponding values for maize GY were 0.83, 0.89 and 0.86, respectively. These values indicate that maize GY was more sensitive to water than maize DM. Also, both DM and GY were more affected under 150 kg N ha-1 compared to other N rates. The maize GY response factors to water obtained in this study were <1, while those seasonal values reported in the literature are generally are >1 (Doorenbos and Kassam, 1979). The reason may be due to the fact that in our study 25% excess water was considered as leaching fraction. Hence, this excess water mitigates the drought stress that plant might have faced with. In other words, irrigation treatments used in the study reflected the response of the maize to moderate water stress. Variation of DM and GY response factor to water (DM-Ky and GY-Ky) with different salinity levels of irrigation water at different N application rates was calculated (Figure 4). The results showed that increasing salinity levels of irrigation water and soil saturation extract generally promoted the Ky value for DM and GY. This means that sensitivity to water stress increased by salnity. Similar results for seed response factor of rapseed were reported by Shabani et al. (2013) up to salinity of 4 dS m-1 for irrigation water and soil saturation extract.
202 A. Azizian & A.R. Sepaskhah / International Journal of Plant Production (2014) 8(2): 183-214
A. Azizian & A.R. Sepaskhah / International Journal of Plant Production (2014) 8(2): 183-214 203
Figure 3. Relationship between relative maize top dry matter (DM) and grain yield (GY) reduction (1-Ya/Ym) and relative evapotranspiration reduction (1-ETa/ETm) at different nitrogen application rates for salinity of 0.6 dS m-1.
204 A. Azizian & A.R. Sepaskhah / International Journal of Plant Production (2014) 8(2): 183-214
Figure 4. Variation of yield response factor to water for top dry matter (DM-Ky) and grain yield (GY-Ky) of maize with salinity levels of irrigation water (ECi) and soil saturation extract (ECe) (dS m-1) at different nitrogen application rates.
A. Azizian & A.R. Sepaskhah / International Journal of Plant Production (2014) 8(2): 183-214 205
Root-water uptake reduction function
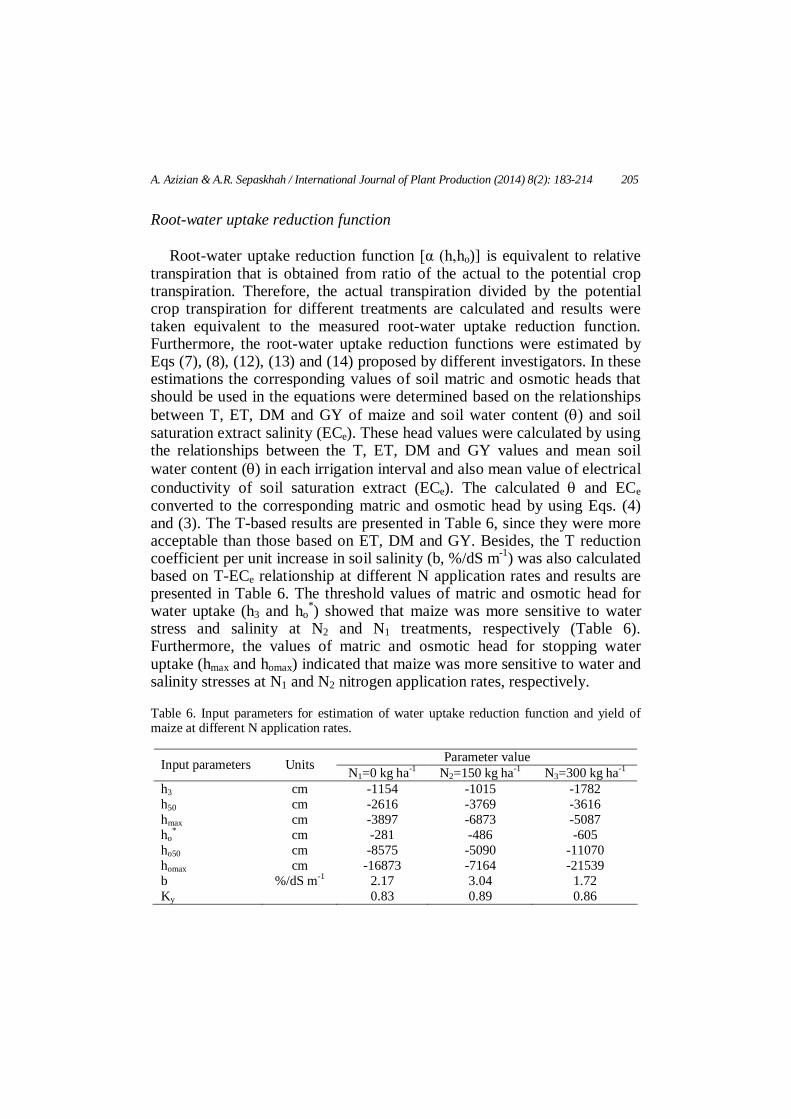
Root-water uptake reduction function [α (h,ho)] is equivalent to relative transpiration that is obtained from ratio of the actual to the potential crop transpiration. Therefore, the actual transpiration divided by the potential crop transpiration for different treatments are calculated and results were taken equivalent to the measured root-water uptake reduction function. Furthermore, the root-water uptake reduction functions were estimated by Eqs (7), (8), (12), (13) and (14) proposed by different investigators. In these estimations the corresponding values of soil matric and osmotic heads that should be used in the equations were determined based on the relationships between T, ET, DM and GY of maize and soil water content () and soil saturation extract salinity (ECe). These head values were calculated by using the relationships between the T, ET, DM and GY values and mean soil water content () in each irrigation interval and also mean value of electrical conductivity of soil saturation extract (ECe). The calculated and ECe converted to the corresponding matric and osmotic head by using Eqs. (4) and (3). The T-based results are presented in Table 6, since they were more acceptable than those based on ET, DM and GY. Besides, the T reduction coefficient per unit increase in soil salinity (b, %/dS m-1) was also calculated based on T-ECe relationship at different N application rates and results are presented in Table 6. The threshold values of matric and osmotic head for water uptake (h3 and ho
*) showed that maize was more sensitive to water stress and salinity at N2 and N1 treatments, respectively (Table 6). Furthermore, the values of matric and osmotic head for stopping water uptake (hmax and homax) indicated that maize was more sensitive to water and salinity stresses at N1 and N2 nitrogen application rates, respectively. Table 6. Input parameters for estimation of water uptake reduction function and yield of maize at different N application rates.
Parameter value Input parameters Units N1=0 kg ha-1 N2=150 kg ha-1 N3=300 kg ha-1 h3 cm -1154 -1015 -1782 h50 cm -2616 -3769 -3616 hmax cm -3897 -6873 -5087 ho
* cm -281 -486 -605 ho50 cm -8575 -5090 -11070 homax cm -16873 -7164 -21539 b %/dS m-1 2.17 3.04 1.72 Ky 0.83 0.89 0.86
206 A. Azizian & A.R. Sepaskhah / International Journal of Plant Production (2014) 8(2): 183-214
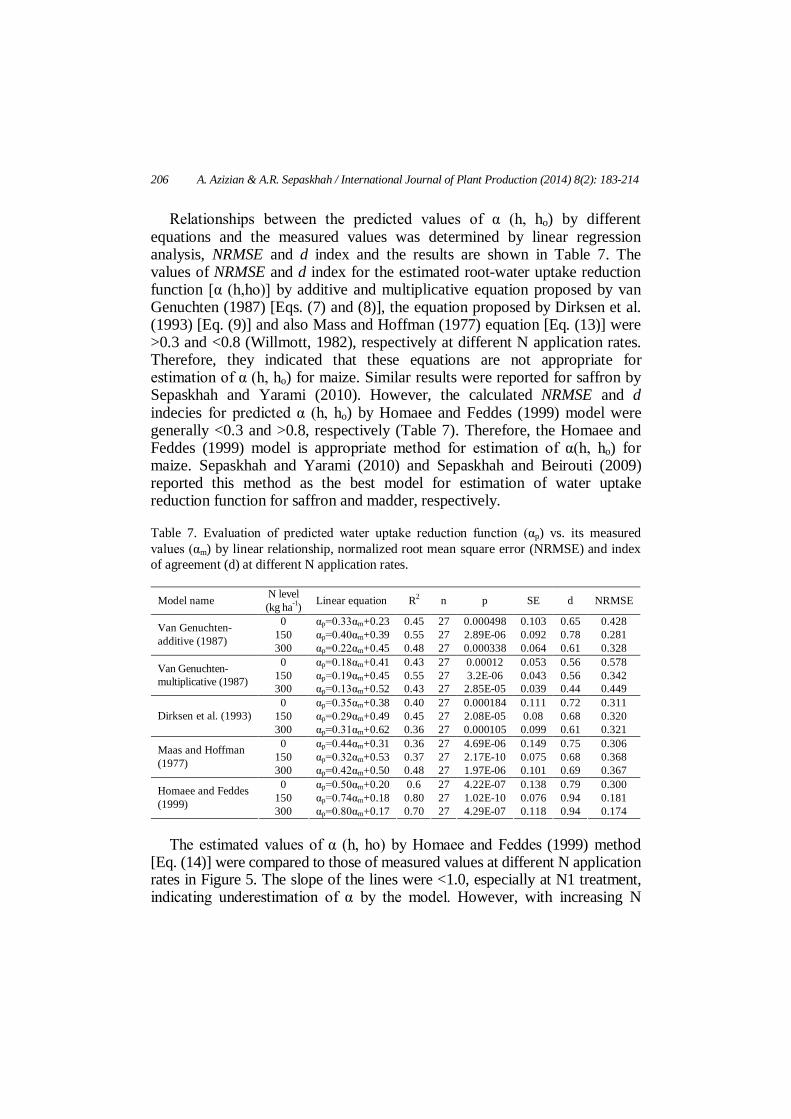
Relationships between the predicted values of α (h, ho) by different equations and the measured values was determined by linear regression analysis, NRMSE and d index and the results are shown in Table 7. The values of NRMSE and d index for the estimated root-water uptake reduction function [α (h,ho)] by additive and multiplicative equation proposed by van Genuchten (1987) [Eqs. (7) and (8)], the equation proposed by Dirksen et al. (1993) [Eq. (9)] and also Mass and Hoffman (1977) equation [Eq. (13)] were >0.3 and <0.8 (Willmott, 1982), respectively at different N application rates. Therefore, they indicated that these equations are not appropriate for estimation of α (h, ho) for maize. Similar results were reported for saffron by Sepaskhah and Yarami (2010). However, the calculated NRMSE and d indecies for predicted α (h, ho) by Homaee and Feddes (1999) model were generally <0.3 and >0.8, respectively (Table 7). Therefore, the Homaee and Feddes (1999) model is appropriate method for estimation of α(h, ho) for maize. Sepaskhah and Yarami (2010) and Sepaskhah and Beirouti (2009) reported this method as the best model for estimation of water uptake reduction function for saffron and madder, respectively. Table 7. Evaluation of predicted water uptake reduction function (αp) vs. its measured values (αm) by linear relationship, normalized root mean square error (NRMSE) and index of agreement (d) at different N application rates.
Model name N level (kg ha-1) Linear equation R2 n p SE d NRMSE
0 αp=0.33αm+0.23 0.45 27 0.000498 0.103 0.65 0.428 150 αp=0.40αm+0.39 0.55 27 2.89E-06 0.092 0.78 0.281 Van Genuchten-
additive (1987) 300 αp=0.22αm+0.45 0.48 27 0.000338 0.064 0.61 0.328 0 αp=0.18αm+0.41 0.43 27 0.00012 0.053 0.56 0.578
150 αp=0.19αm+0.45 0.55 27 3.2E-06 0.043 0.56 0.342 Van Genuchten- multiplicative (1987) 300 αp=0.13αm+0.52 0.43 27 2.85E-05 0.039 0.44 0.449
0 αp=0.35αm+0.38 0.40 27 0.000184 0.111 0.72 0.311 150 αp=0.29αm+0.49 0.45 27 2.08E-05 0.08 0.68 0.320 Dirksen et al. (1993) 300 αp=0.31αm+0.62 0.36 27 0.000105 0.099 0.61 0.321
0 αp=0.44αm+0.31 0.36 27 4.69E-06 0.149 0.75 0.306 150 αp=0.32αm+0.53 0.37 27 2.17E-10 0.075 0.68 0.368 Maas and Hoffman
(1977) 300 αp=0.42αm+0.50 0.48 27 1.97E-06 0.101 0.69 0.367 0 αp=0.50αm+0.20 0.6 27 4.22E-07 0.138 0.79 0.300
150 αp=0.74αm+0.18 0.80 27 1.02E-10 0.076 0.94 0.181 Homaee and Feddes (1999) 300 αp=0.80αm+0.17 0.70 27 4.29E-07 0.118 0.94 0.174
The estimated values of α (h, ho) by Homaee and Feddes (1999) method
[Eq. (14)] were compared to those of measured values at different N application rates in Figure 5. The slope of the lines were <1.0, especially at N1 treatment, indicating underestimation of α by the model. However, with increasing N
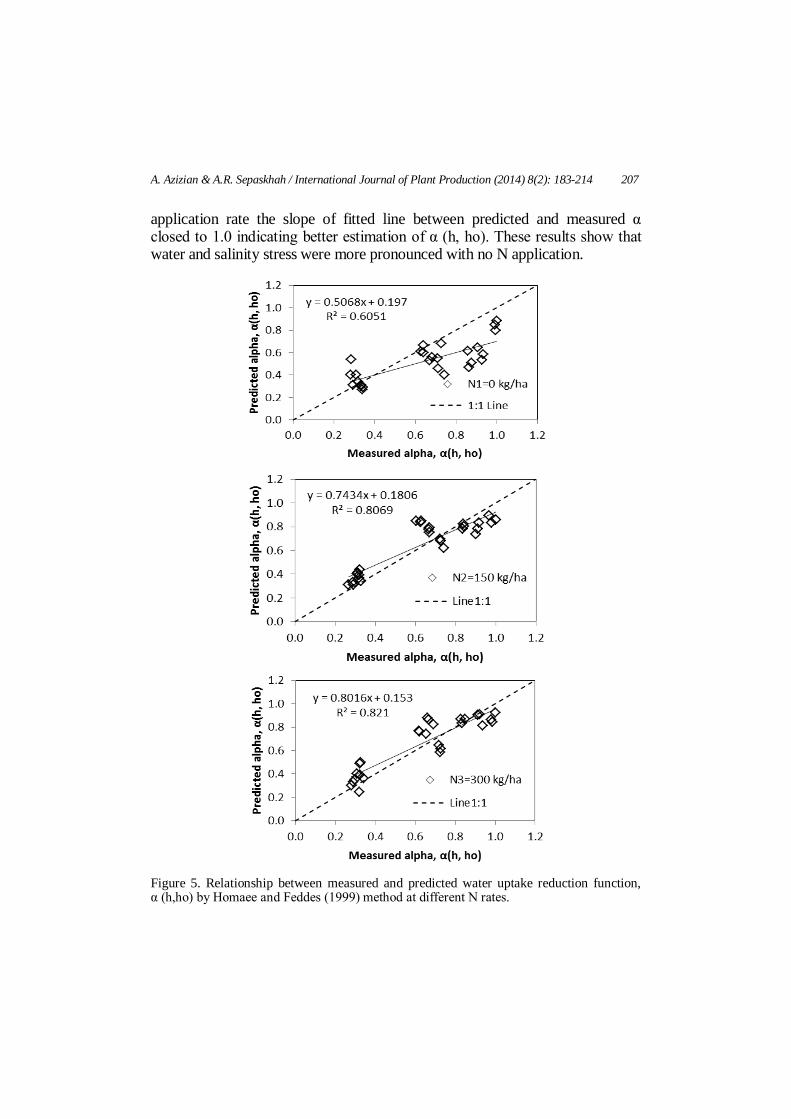
A. Azizian & A.R. Sepaskhah / International Journal of Plant Production (2014) 8(2): 183-214 207
application rate the slope of fitted line between predicted and measured α closed to 1.0 indicating better estimation of α (h, ho). These results show that water and salinity stress were more pronounced with no N application.
Figure 5. Relationship between measured and predicted water uptake reduction function, α (h,ho) by Homaee and Feddes (1999) method at different N rates.

208 A. Azizian & A.R. Sepaskhah / International Journal of Plant Production (2014) 8(2): 183-214
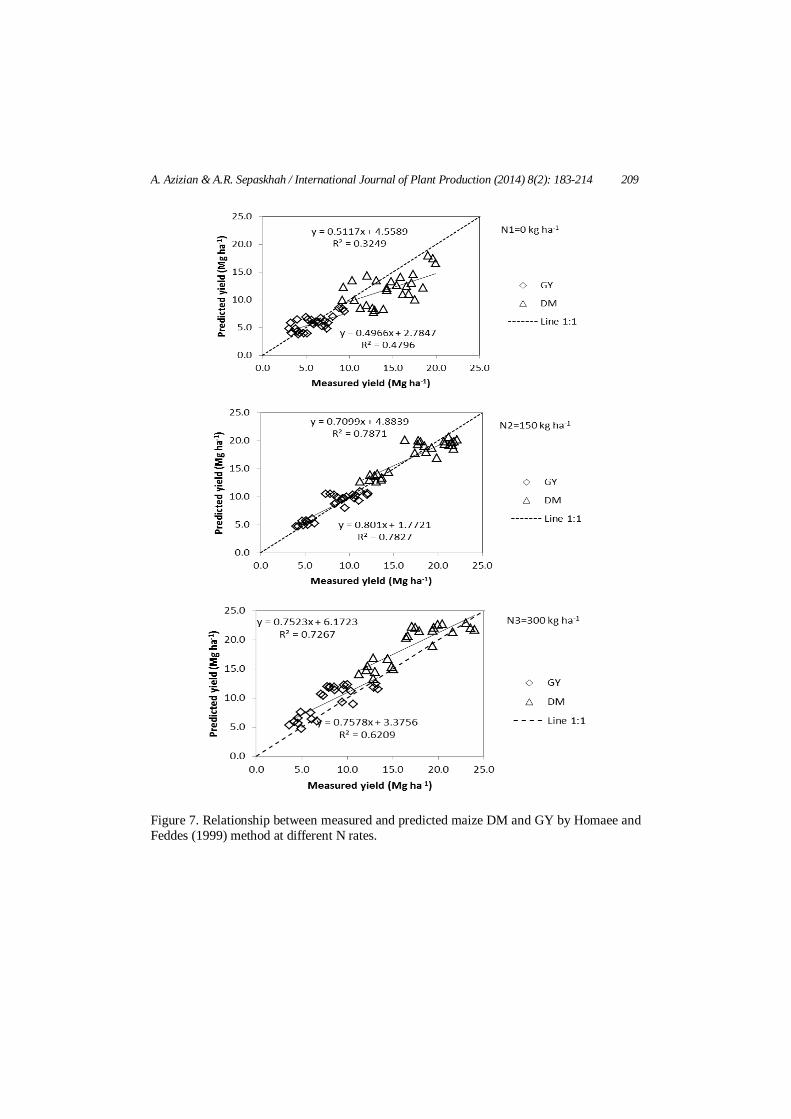
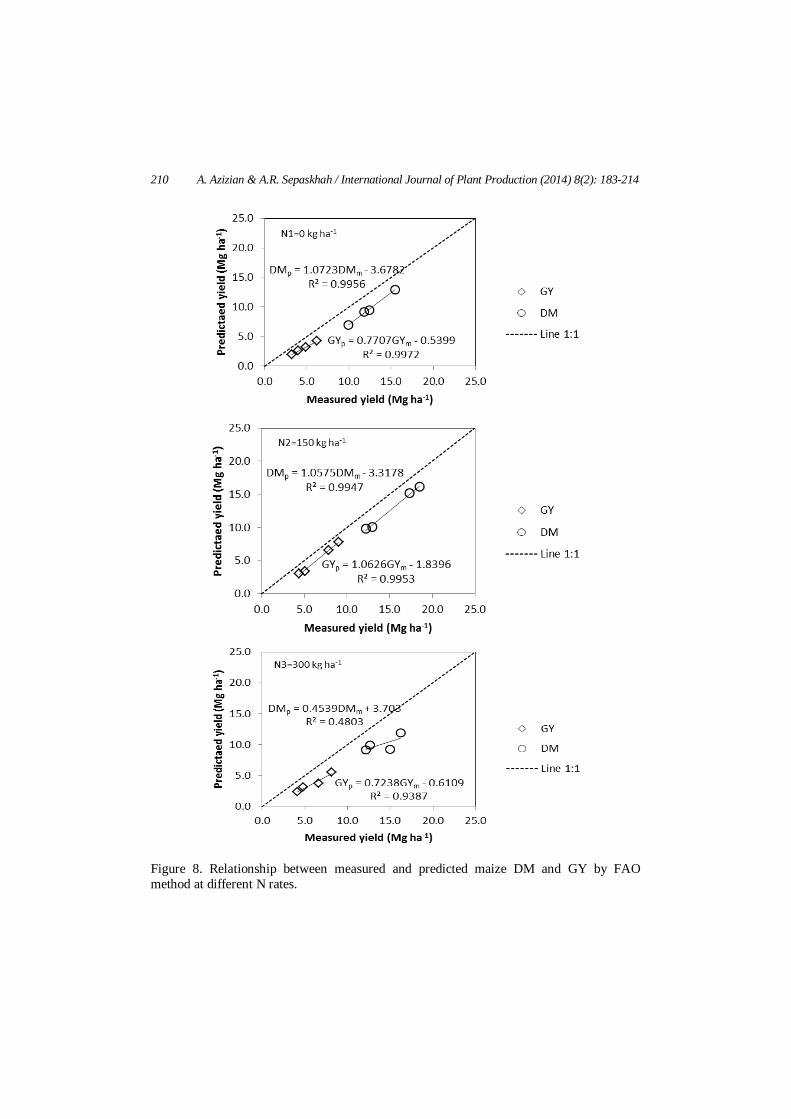
The variation of mean values of α(h,ho) at different nitrogen application rates are presented in Figure 6. Result showed that maize had higher α at higher N application rate. This is due to a higher water uptake from root zone that is attributed to root density and rooting pattern at different N application rates. Yield prediction
The maize GY and DM were predicted by using Eqs. (18a) and (18b). The relationships between the predicted maize DM and GY by Eqs. (18a) and (18b) and the measured values are shown in Figures 7 and 8, respectively and also Table 8. The values of α (h,ho) used in Eq (18a) are those obtained by Homaee and Feddes (1999). The values of NRMSE and d indices were also calculated with measured and predicted values (Table 8). According to Figure 8, the FAO method [Eq. (18b)] generally under predicted maize yields. However, the Homaee and Feddes (1999) method [Eq. (18a)] had an acceptable precision in maize yield prediction with N application, since the NRMSE and d indices for this model were <0.3 and >0.8, respectively (Willmott, 1982). Therefore, this method could be recommended under both salinity and water stress treatments at 150 and 300 kg N ha-1.
Figure 6. Variation of root water uptake reduction function [α(h,ho)] at different nitrogen application rates. Points represent mean plus standard deviation of 27 data.
wat
er u
ptak
e re
duct
ion
func
tion
A. Azizian & A.R. Sepaskhah / International Journal of Plant Production (2014) 8(2): 183-214 209
Figure 7. Relationship between measured and predicted maize DM and GY by Homaee and Feddes (1999) method at different N rates.
210 A. Azizian & A.R. Sepaskhah / International Journal of Plant Production (2014) 8(2): 183-214
Figure 8. Relationship between measured and predicted maize DM and GY by FAO method at different N rates.
A. Azizian & A.R. Sepaskhah / International Journal of Plant Production (2014) 8(2): 183-214 211
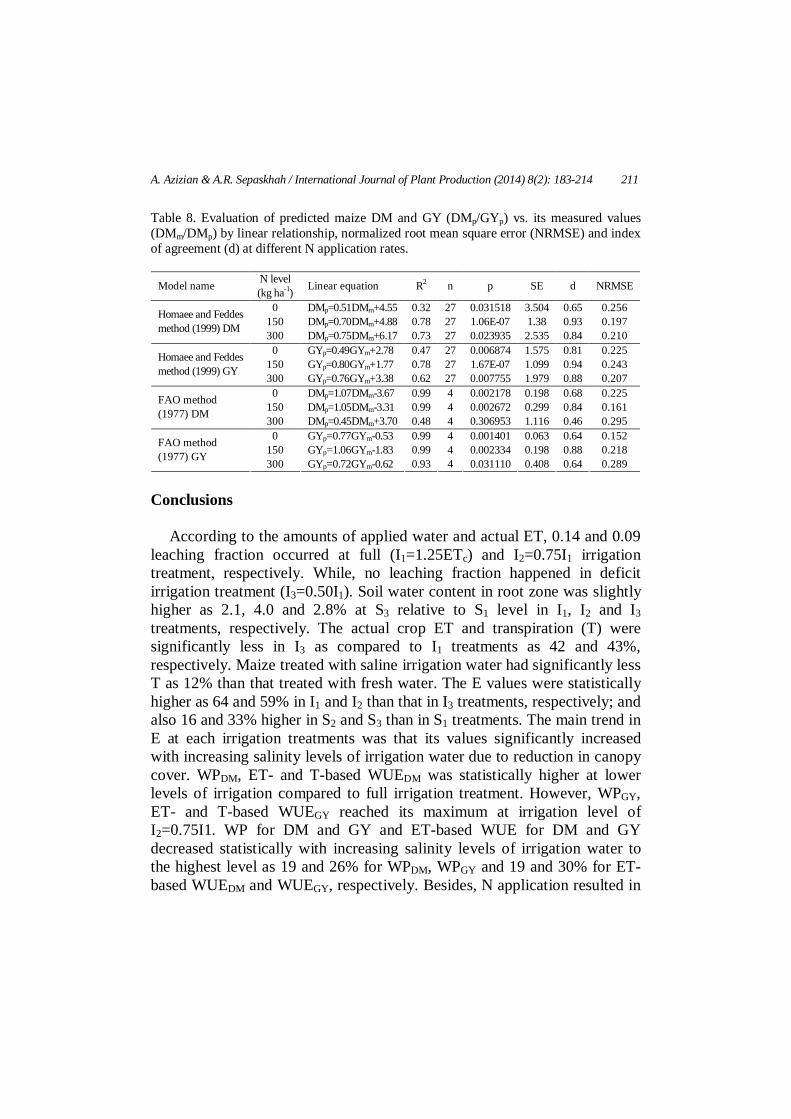
Table 8. Evaluation of predicted maize DM and GY (DMp/GYp) vs. its measured values (DMm/DMp) by linear relationship, normalized root mean square error (NRMSE) and index of agreement (d) at different N application rates.
Model name N level (kg ha-1) Linear equation R2 n p SE d NRMSE
0 DMp=0.51DMm+4.55 0.32 27 0.031518 3.504 0.65 0.256 150 DMp=0.70DMm+4.88 0.78 27 1.06E-07 1.38 0.93 0.197
Homaee and Feddes method (1999) DM
300 DMp=0.75DMm+6.17 0.73 27 0.023935 2.535 0.84 0.210 0 GYp=0.49GYm+2.78 0.47 27 0.006874 1.575 0.81 0.225
150 GYp=0.80GYm+1.77 0.78 27 1.67E-07 1.099 0.94 0.243 Homaee and Feddes method (1999) GY
300 GYp=0.76GYm+3.38 0.62 27 0.007755 1.979 0.88 0.207 0 DMp=1.07DMm-3.67 0.99 4 0.002178 0.198 0.68 0.225
150 DMp=1.05DMm-3.31 0.99 4 0.002672 0.299 0.84 0.161 FAO method (1977) DM
300 DMp=0.45DMm+3.70 0.48 4 0.306953 1.116 0.46 0.295 0 GYp=0.77GYm-0.53 0.99 4 0.001401 0.063 0.64 0.152
150 GYp=1.06GYm-1.83 0.99 4 0.002334 0.198 0.88 0.218 FAO method (1977) GY
300 GYp=0.72GYm-0.62 0.93 4 0.031110 0.408 0.64 0.289
Conclusions
According to the amounts of applied water and actual ET, 0.14 and 0.09 leaching fraction occurred at full (I1=1.25ETc) and I2=0.75I1 irrigation treatment, respectively. While, no leaching fraction happened in deficit irrigation treatment (I3=0.50I1). Soil water content in root zone was slightly higher as 2.1, 4.0 and 2.8% at S3 relative to S1 level in I1, I2 and I3 treatments, respectively. The actual crop ET and transpiration (T) were significantly less in I3 as compared to I1 treatments as 42 and 43%, respectively. Maize treated with saline irrigation water had significantly less T as 12% than that treated with fresh water. The E values were statistically higher as 64 and 59% in I1 and I2 than that in I3 treatments, respectively; and also 16 and 33% higher in S2 and S3 than in S1 treatments. The main trend in E at each irrigation treatments was that its values significantly increased with increasing salinity levels of irrigation water due to reduction in canopy cover. WPDM, ET- and T-based WUEDM was statistically higher at lower levels of irrigation compared to full irrigation treatment. However, WPGY, ET- and T-based WUEGY reached its maximum at irrigation level of I2=0.75I1. WP for DM and GY and ET-based WUE for DM and GY decreased statistically with increasing salinity levels of irrigation water to the highest level as 19 and 26% for WPDM, WPGY and 19 and 30% for ET-based WUEDM and WUEGY, respectively. Besides, N application resulted in

212 A. Azizian & A.R. Sepaskhah / International Journal of Plant Production (2014) 8(2): 183-214
statistically higher WP and WUE for DM and GY. The optimum WP and WUE for DM and GY was obtained at lower N application rate (150 kg ha-1). Overall, the results indicated that the optimum treatments for water productivity and water use efficiency for grain yield were I2S1N3. The efficiency of applied water was greater in yield production with lower salinity levels of irrigation water, and also in 150 kg N ha-1, as the slope of yield-W, -ET and -T relationship was higher in these conditions. The yield response factor to water showed that maize GY was more sensitive to water than maize DM. Also, both DM and GY were more affected under 150 kg N ha-1 compared to other N application rates. Results also showed that increasing salinity levels of irrigation water and soil saturation extract generally promoted the Ky value for DM and GY and consequently sensitivity of maize plant to water increased. Results indicated that the additive and multiplicative functions for root-water uptake presented by van Genuchten (1987) [Eqs. (7) and (8)], Dirksen et al. (1993) equation [Eq. (12)] and Mass and Hoffman (1977) [Eq. (13)] were not suitable for prediction of root-water uptake coefficient of maize to show the interaction effect of salinity and deficit irrigation on yield prediction at different N application rates. The Homaee and Feddes (1999) equation [Eq. (14)] resulted in acceptable estimation of α (h,ho). Furthermore, maize had higher α at higher N application rates. Besides, maize yield was predicted by using Homaee and Feddes (1999) equation and FAO method along with production function presented by Stewart et al. (1977). Results indicated that the FAO method predicted the maize DM and GY less that those of measured values. However, the Homaee and Feddes (1999) method resulted in acceptable prediction of the maize yield. Therefore, Homaee and Feddes (1999) equation is recommended for estimation of both α (h, ho) and maize yield. Acknowledgment
This research supported partly by a research project funded by Grant no. 92-GR-AGR 42 of Shiraz University Research Council, Drought National Research Institute and Center of Excellence for On-Farm water management. Further, scholarship granted to the first author by Higher Education Ministry of I.R. of Iran is acknowledged.
A. Azizian & A.R. Sepaskhah / International Journal of Plant Production (2014) 8(2): 183-214 213
References Allen, R.G., Pereira, L.S., Raes, D., Smith, M., 1998. Crop evapotranspiration. Irrigation
and Drainage Papers, FAO, Rome, Italy. No. 56. 300p. Amer, K.H., 2010. Corn crop response under managing different irrigation and salinity
levels. Agric. Water Manage. 97, 1553-1563. Azizian, A., Sepaskhah, A.R., 2014. Maize response to different water, salinity and
nitrogen levels: agronomic behavior. Int. J. Plant Prod. 8 (1), 107-130. Borg, H., Grimes, D.W., 1986. Depth development of roots with time: an empirical
description. Trans. of the ASAE. 29, 194-197. Di Paolo, E., Rinaldi, M., 2008. Yield response of maize to irrigation and nitrogen
fertilization in a Mediterranean environment. Field Crops Res. 105, 202-210. Dirksen, C., Kool, J.B., Koorevaar, P., Van Genuchten, M.Th., 1993. Hyswasor-Simulation
model of hysteretic water and solute transport in the root zone. In: Water flow and solute transport in soils. (Russo, D., and Dagan, G. Eds). Springer Verlag, pp. 99-122.
Doorenbos, J., Kassam, A.H., 1979. Yield response to water. Irrigation and Drainage Papers FAO, Rome, Italy. No. 33. 193p.
Ercoli, L., Lulli, L., Mariotti, M., Masoni, A., Arduini, I., 2008. Post-anthesis dry matter and nitrogen dynamics in durum wheat as affected by nitrogen supply and soil water availability. Eur. J. Agron. 28, 138-147.
Feddes, R.A., Kowalik, P., Zarandy, H., 1978. Simulation of field water use and crop yield. Pudoc. Wageningen, The Netherlands.
Grattan, S.R., Grieve, C.M., 1999. Salinity-mineral nutrient relations in horticultural crops. Sciatica Hortic. 78, 127-157.
Halvorson, A.D., Mosier, A.R., Reule, C.A., Bausch, W.C., 2006. Nitrogen and tillage effects on irrigated continuous corn yields. Agron. J. 98, 63-71.
Homaee, M., Feddes, R.A., 1999. Water uptake under nonuniform transient salinity and water stress. In: Modeling of Transport Processes in Soil at Various Scales in Time and Space. (Feyen, J., and Wiyo, K. Eds.). pp. 416-427.
Homaee, M., Feddes, R.A., Dirksen, C., 2002. A macroscopic water extraction model for nonuniform transient salinity and water stress. Soil Sci. Soc. Amer. J. 66, 1764-1772.
Huang, R., Brich, C.J., George, D.L., 2006. Water use efficiency in maize production-the challenge and improvement strategies. Proceeding of 6th Triennial Conference, Maize Association of Australia.
Mansouri-Far, C., Modarres Sanavy, S.A.M., Saberali, S.F., 2010. Maize yield response to deficit irrigation during low-sensitive growth stages and nitrogen rate under semi-arid climatic conditions. Agric. Water Manage. 97, 12-22.
Mass, E.V., Hoffman, G.J., 1977. Crop salt tolerance-current assessment. J. Irrig. Drain. Eng. Div. Am. Soc. Civ. Eng. 103, 115-134.
Payero, J.O., Melvin, S.R., Irmak, S., Tarkalson, D., 2006. Yield response of corn to deficit irrigation in a semi-arid climate. Agric. Water Manage. 84, 101-112.
Payero, J.O., Tarkalson, D.D., Irmak, S., Davison, D., Petersen, J.L., 2008. Effect of irrigation amounts applied with subsurface drip irrigation on corn evapotranspiration, yield, water use efficiency, and dry matter production in a semiarid climate. Agric. Water Manage. 95, 895-908.
214 A. Azizian & A.R. Sepaskhah / International Journal of Plant Production (2014) 8(2): 183-214
Razzaghi, F., Sepaskhah, A.R., 2012. Calibration and validation of four common ETo estimation equations by lysimeter data in a semi-arid environment. Arch. Agron. Soil Sci. 58 (3), 303-319.
Richards, L.A., 1931. Capillary conduction of liquids in porous medium. Physics, 1, 318-333.
Richards, L.A., 1954. Diagnosis and improvement of saline and alkali soils. U.S. Dept. of Agriculture. Agricultural Handbook, No. 60.
Sepaskhah, A.R., Beirouti, Z., 2009. Effect of irrigation interval and water salinity on growth of madder (Rubina tinctorum L.). Int. J. Plant Prod. 3 (3), 1-15.
Sepaskhah, A.R., Ghahraman, B., 2004. The effects of irrigation efficiency and uniformity coefficient on relative yield and profit for deficit irrigation. Biosys. Eng. 87 (4), 495-507.
Sepaskhah, A.R., Hosseini, S.N., 2008. Effects of alternate furrow irrigation and nitrogen application rates on yield and water-and nitrogen-use efficiency of winter wheat (Triticum aestivum L.). Plant Prod. Sci. 11 (2), 250-259.
Sepaskhah, A.R., Kamgar-Haghighi, A.A., 1997. Water use and yields of sugarbeet grown under every-other furrow irrigation with different irrigation intervals. Agric. Water Manage. 34, 71-79.
Sepaskhah, A.R., Kamgar-Haghighi, A.A., 2009. Saffron irrigation regime. Int. J. Plant Prod. 3 (1), 1-16.
Sepaskhah, A.R., Tafteh, A., 2012. Yield and nitrogen leaching in rapeseed field under different nitrogen rates and water saving irrigation. Agric. Water Manage. 112, 55-62.
Sepaskhah, A.R., Yarami, N., 2009. Interaction effects of irrigation regime and salinity on flower yield and growth of saffron. J. Hort. Sci. Biotech. 84 (2), 216-222.
Shabani, A., Sepaskhah, A.R., Kamgar-Haghighi, A.A., 2013. Responses of agronomic components of rapeseed (Brassica napus L.) as influenced by deficit irrigation, water salinity and planting method. Int. J. Plant Prod. 7 (2), 313-340.
Shahrokhnia, M.H., Sepaskhah, A.R., 2013. Single and dual crop coefficient and crop evapotranspiration for wheat and maize in a semi-arid region. Theoretical and Applied Climatology, 114 (3-4), D 495-510.
Tafteh, A., Sepaskhah, A.R., 2012. Yield and nitrogen leaching in maize field under different nitrogen rates and partial root drying irrigation. Int. J. Plant Prod. 6 (1), 93-114.
Tavakoli, A.R., Oweis, T.Y., 2004. The role of supplemental irrigation and nitrogen in producing bread wheat in the highlands of Iran. Agric. Water Manage. 65, 225-236.
Van Genuchten, M.Th., 1987. A numerical model for water and solute movement in and below the root zone. Research Project Report. U.S. Salinity Lab. Reverside. CA.
Willmott, C.J., 1982. Some comments on the evaluation of model performance. B. Am. Meteorol. Soc. 63 (11), 1309-1313.