Muddy Waters and the Multi-Layered Influences Associated ...

Pergamon Materials Research Bulletin, Vol. 32, No. 11, pp. 1515-1524, 1997
Copyright 0 1997 Elsevier Science Ltd Printed in the USA. All rights reserved
002%5408/97 $17.00 + .OO
PI1 SOOZS-5408(97)00133-5
MAGNETOCHEMICAL INVESTIGATION OF THE LAYERED SOLID SOLUTION KFe,Ti1_2xNbl+xOS: EVIDENCE OF Fe3+ AGGREGATION
I. Zvereva’, B. Besteiro*, F. Archaimbauit’, J.M. Bassat3+, and J. Choisnet** ‘Department of Inorganic Chemistry, Chemical Institute, St. Petersburg University,
198904 Petrodvorets, St. Petersburg, Russia 2Centre de Recherche sur la Mat&e Divisee, UMR CNRS-Universite, FacultC des
Sciences, Universite d’OrlCans, 45067 OrlCans, Cedex 2, France
3Centre d,e Recherche sur la Physique des Hautes Temperatures, CNRS, 45071 Orleans, Cedex 2, France
(Refereed)
(Received February 11, 1997; Accepted February 17, 1997)
ABSTRACT The results of a magnetochemical investigation of the solid solution KFe,Ti, _-2xNbl+x05, isotypic with layered KTiNbO,, are reported. The tem- perature dependence of the magnetic susceptibility points to a weak antifer- romagnetism (3 = -3 cm-‘); this is consistent with a fully ordered distribution of Fe3+ on one of the two sets of octahedra (Oc,), as deduced from
the XRD structure determination. Modeling the Fe-O-Fe exchange interac- tions in the diluted compositions (x 5 0.075), from the concentration and
temperature dependence of the magnetic susceptibility, gives evidence of Fe3+ aggregation phenomena. For the lowest concentrations, such clustering can be described in terms of only dimers. The as-calculated values of the amount of dimers, for example 34% for x = 0.045, are found to be much larger than that corresponding to a random distribution of Fe3+ on the Oc, site. 0 1997 Elsevier Science Ltd
KEYWORDS: A. layered compounds; A. oxides; D. crystal structure; D. magnetic properties
*To whom correspondence should be addressed. %esently at ICMCB, Chateau Brivazac, avenue Dr A. Schweitzer, F-33608 Pessac Cedex, France.
1515
1516 I. ZVEREVA et al. Vol. 32, No. 11
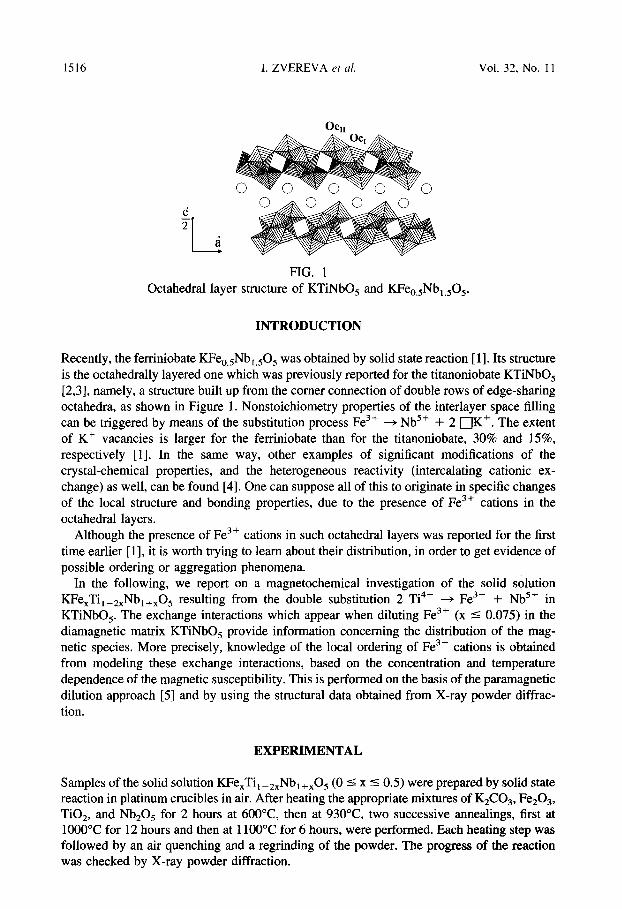
FIG. 1 Octahedral layer structure of KTiNbO, and KFe,,Nb,,50,.
INTRODUCTION
Recently, the ferriniobate KFe,,Nb,,,O, was obtained by solid state reaction [ 11. Its structure is the octahedrally layered one which was previously reported for the titanoniobate KTiNbO, [2,3], namely, a structure built up from the comer connection of double rows of edge-sharing octahedra, as shown in Figure 1. Nonstoichiometry properties of the interlayer space filling can be triggered by means of the substitution process Fe3+ + Nb5+ + 2 OK+. The extent of Kf vacancies is larger for the ferriniobate than for the titanoniobate, 30% and 15%,
respectively [l]. In the same way, other examples of significant modifications of the crystal-chemical properties, and the heterogeneous reactivity (intercalating cationic ex- change) as well, can be found [4]. One can suppose all of this to originate in specific changes of the local structure and bonding properties, due to the presence of Fe3+ cations in the
octahedral layers.
Although the presence of Fe3+ cations in such octahedral layers was reported for the first time earlier [ 11, it is worth trying to learn about their distribution, in order to get evidence of
possible ordering or aggregation phenomena. In the following, we report on a magnetochemical investigation of the solid solution
KFe,Ti, _,,Nb ,+x05 resulting from the double substitution 2 Ti4+ + Fe3+ + Nb5+ in
KTiNbOs. The exchange interactions which appear when diluting Fe3+ (x 5 0.075) in the diamagnetic matrix KTiNbO, provide information concerning the distribution of the mag- netic species. More precisely, knowledge of the local ordering of Fe3+ cations is obtained from modeling these exchange interactions, based on the concentration and temperature dependence of the magnetic susceptibility. This is performed on the basis of the paramagnetic
dilution approach [5] and by using the structural data obtained from X-ray powder diffrac- tion.
EXPERIMENTAL
Samples of the solid solution KFe,Ti, _,,Nb , +x05 (0 5 x 5 0.5) were prepared by solid state reaction in platinum crucibles in air. After heating the appropriate mixtures of K&O,, Fez03, TiO,, and Nb,O, for 2 hours at 6OO”C, then at 93O”C, two successive annealings, first at 1000°C for 12 hours and then at 1100°C for 6 hours, were performed. Each heating step was followed by an air quenching and a regrinding of the powder. The progress of the reaction was checked by X-ray powder diffraction.
Vol. 32, No. 11 POTASSIUM FERFUNIOBATE 1517
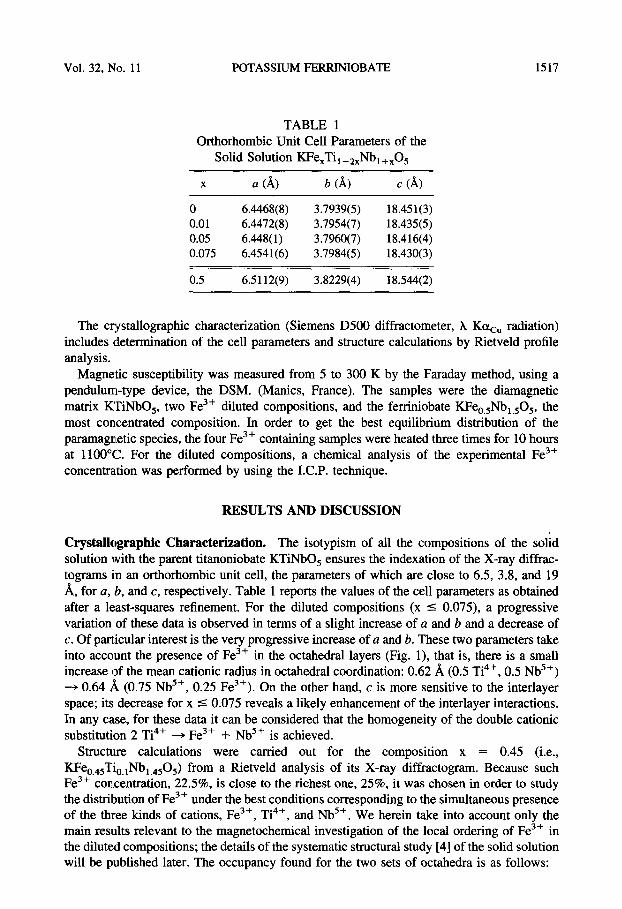
TABLE 1 Orthorhombic Unit Cell Parameters of the
Solid Solution KFe,Ti, _2,Nb, +xO5
X a (A> b (A) c (‘4 0 6.4468(8) 3.7939(5) 18.451(3) 0.01 6.4472(8) 3.7954(7) 18.435(5) 0.05 6.448( 1) 3.7960(7) 18.416(4) 0.075 6.4541(6) 3.7984(5) 18.430(3)
0.5 6.5112(9) 3.8229(4) 18.544(2)
The crystallographic characterization (Siemens D500 diffractometer, X Kc+” radiation) includes determination of the cell parameters and structure calculations by Rietveld profile analysis.
Magnetic susceptibility was measured from 5 to 300 K by the Faraday method, using a pendulum-type device, the DSM. (Manics, France). The samples were the diamagnetic matrix KTiNbO,, two Fe3+ diluted compositions, and the ferriniobate KFe,,Nb,,O,, the most concentrated composition. In order to get the best equilibrium distribution of the pammagnetic species, the four Fe3+ containing samples were heated three times for 10 hours at 1100°C. For the diluted compositions, a chemical analysis of the experimental Fe3+ concentra.tion was performed by using the I.C.P. technique.
RESULTS AND DISCUSSION
Crystallographic Characterization. The isotypism of all the compositions of the solid solution with the parent titanoniobate KTiNbO, ensures the indexation of the X-ray diffrac- tograms in an orthorhombic unit cell, the parameters of which are close to 6.5, 3.8, and 19 A, for Q, b, and c, respectively. Table 1 reports the values of the cell parameters as obtained after a le:ast-squares refinement. For the diluted compositions (x 5 0.075), a progressive variation of these data is observed in terms of a slight increase of a and b and a decrease of c. Of particular interest is the very progressive increase of a and b. These two parameters take into account the presence of Fe3+ in the octahedral layers (Fig. l), that is, there is a small increase of the mean cationic radius in octahedral coordination: 0.62 8, (0.5 Ti4+, 0.5 Nbsf) -+ 0.64 ,i (0.75 Nb5+, 0.25 Fe3+). On the other hand, c is more sensitive to the interlayer space; its decrease for x 5 0.075 reveals a likely enhancement of the interlayer interactions. In any case, for these data it can be considered that the homogeneity of the double cationic substitution 2 Ti4’ + Fe3+ + Nb5+ is achieved.
Structure calculations were carried out for the composition x = 0.45 (i.e., KFe,,,Ti,,Nb,,,O,) from a Rietveld analysis of its X-ray diffractogram. Because such Fe3+ concentration, 22.5%, is close to the richest one, 25%, it was chosen in order to study the distribution of Fe3’ under the best conditions corresponding to the simultaneous presence of the three kinds of cations, Fe3+, Ti4’, and Nb5+. We herein take into account only the main results relevant to the magnetochemical investigation of the local ordering of Fe3+ in the diluted compositions; the details of the systematic structural study [4] of the solid solution will be published later. The occupancy found for the two sets of octahedra is as follows:
1518 I. ZVEREVA et al.
0.08 i
Vol. 32, No. 11
0.06 * n x=O q x=o.o1 .
0.04 *+..* Ax= 0.05
=.. 0 x= 0.075
, 't. l x = 0.5
TO
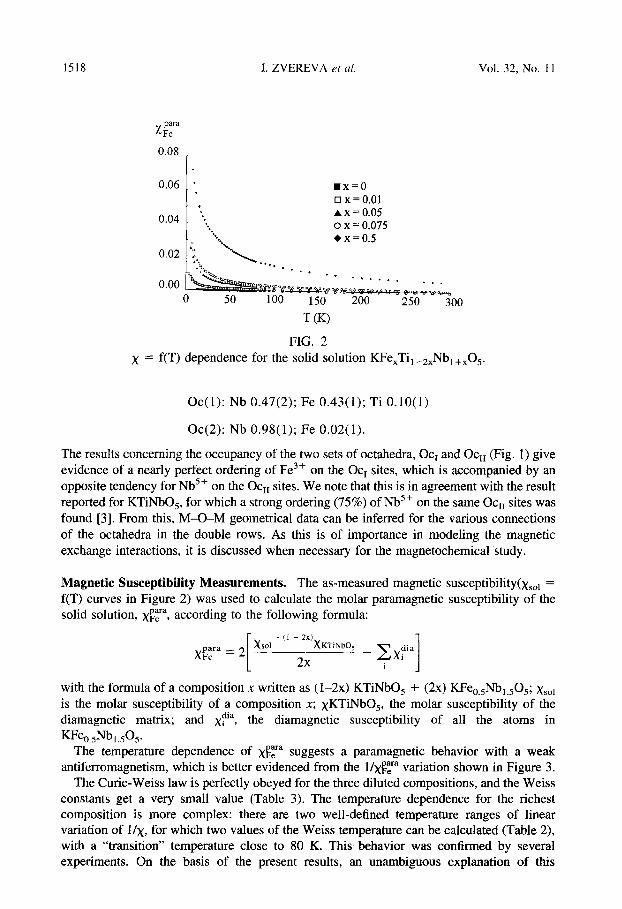
FIG. 2 x = f(T) dependence for the solid solution KFe,Ti,_,,Nb,+XO,.
Oc( 1): Nb 0.47(2); Fe 0.43( 1); Ti O.lO( 1)
Oc(2): Nb 0.98( 1); Fe 0.02( 1).
The results concerning the occupancy of the two sets of octahedra, Oc, and Oc,, (Fig. 1) give evidence of a nearly perfect ordering of Fe3+ on the Oc, sites, which is accompanied by an
opposite tendency for NbSf on the Oc,, sites. We note that this is in agreement with the result reported for KTiNbO,, for which a strong ordering (75%) of Nb5+ on the same Ocn sites was found [3]. From this, M-O-M geometrical data can be inferred for the various connections
of the octahedra in the double rows. As this is of importance in modeling the magnetic exchange interactions, it is discussed when necessary for the magnetochemical study.
Magnetic Susceptibility Measurements. The as-measured magnetic susceptibility(x,,, = f(T) curves in Figure 2) was used to calculate the molar paramagnetic susceptibility of the solid solution, J&Y, according to the following formula:
XSOI -(I -2x)
l&y=2 XKTiNh05
2X
with the formula of a composition x written as (1-2x) KTiNbO, + (2x) KFeu,,Nb,~,O,; xSO, is the molar susceptibility of a composition x; XKTiNbO,, the molar susceptibility of the diamagnetic matrix; and xdia, the diamagnetic susceptibility of all the atoms in
KFe0.,NlXSO,. The temperature dependence of $z suggests a paramagnetic behavior with a weak
antiferromagnetism, which is better evidenced from the l/xpera variation shown in Figure 3. The Curie-Weiss law is perfectly obeyed for the three diluted compositions, and the Weiss
constants get a very small value (Table 3). The temperature dependence for the richest composition is more complex: there are two well-defined temperature ranges of linear variation of I/x, for which two values of the Weiss temperature can be calculated (Table 2), with a “transition” temperature close to 80 K. This behavior was confirmed by several experiments. On the basis of the present results, an unambiguous explanation of this

Vol. 32, No. 11 POTASSIUM FERRINIOBATE 1519
l/x 80 .
. 70 . . . 0 60 . 0 . q
. 0
. 50 .flO .
.
40
30
20 D x=0.01
. x=0.5 10
0 0 50 100 150 200 250 300
T (K)
FIG. 3 l/xFy = f(T) variation for the solid solution KFe,Ti,_,,Nb,+,O,.
phenomenon cannot be proposed. Certainly, a sudden decrease of the antiferromagnetic exchange occurs below 80 K. This could possibly be related to an increase or, more likely, a change of some cooperative distortion of the Fe-O-Fe connect&s.
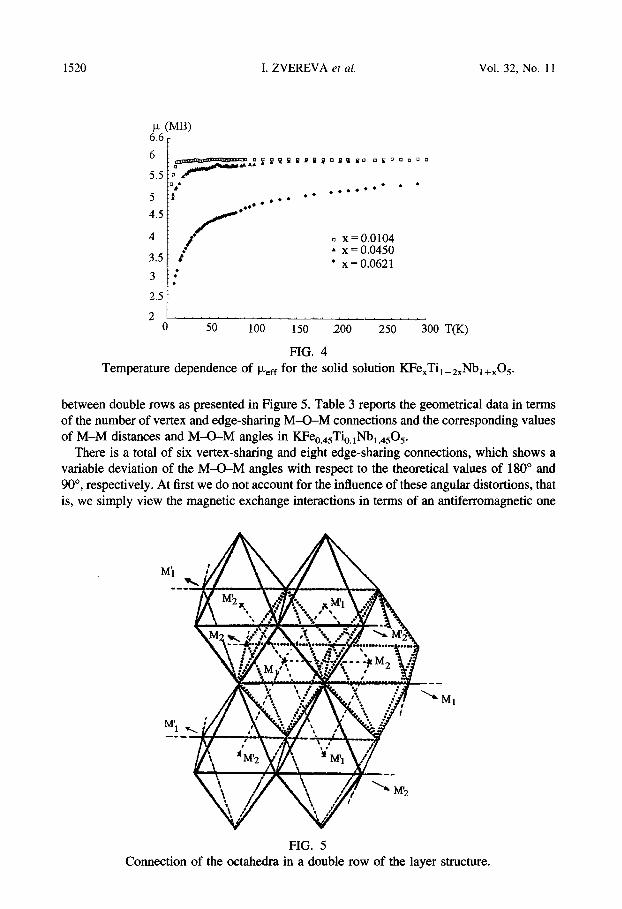
Figure 4 shows the dependence of the effective magnetic moment calculated from the expression p,,rr = m, on the Fe3+ composition.
The existence of a systematic decrease of the values of peff when the Fe3+ concentration of the diluted compositions indicates the presence of prevailing antiferromagnetic exchange interactions, which can be explained in terms of small clusters of pammagnetic species, but not in terms of single Fe3+ ions. Only the most diluted composition, x = 0.01, allows determination of the T > 20 K value of keff for a single Fe3+ ion (5.90 MB), which is comparable to the theoretical value (5.92 MB) for the ground state 6A,.
Fe-O-Fe Exchange Interactions and Distribution of Fe3’. In the following is proposed a tentative understanding of the weak antiferromagnetism which results from the Fe-O-Fe exchange interactions for the different connections of the octahedra in a double row and
TABLE 2 Curie and Weiss Constants for the Solid Solution KFe,TiI_2,NbI+,05
Amount of Fe - Curie constant Weiss constant As-prepared value Experimental value c 8
0.01 0.010(l) 4.50 -0.7 0.05 0.045(l) 4.49 -3.5 0.075 0.062( 1) 4.49 -3.4
0.5 T>80K 4.17 -43.5 T<80K 3.33 -18.1
1520 I. ZVEREVA et al. Vol. 32, No. 11
6
5.5
5
4.5
4
3.5
3
0 x=0.0104 A x=0.0450 l x=0.0621
2 ~............................., 0 50 100 300 150 200 250 T(K)
FIG. 4 Temperature dependence of pee for the solid solution KFeXTi,_-zXNbl+XOs.
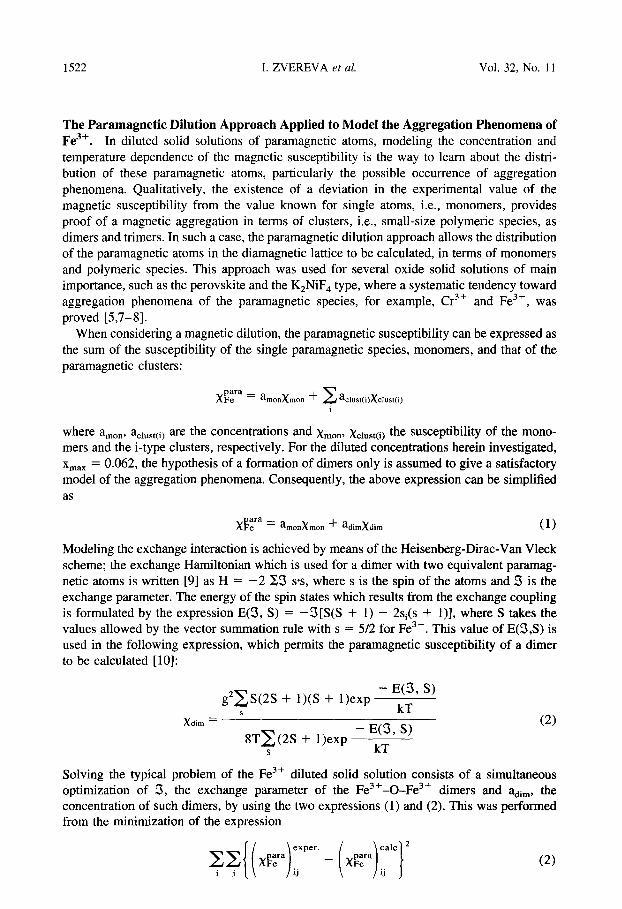
between double rows as presented in Figure 5. Table 3 reports the geometrical data in terms of the number of vertex and edge-sharing MUM connections and the corresponding values of M-M distances and M-O-M angles in KFe,,,,,Tia,Nb,,~,O,.
There is a total of six vertex-sharing and eight edge-sharing connections, which shows a variable deviation of the M-O-M angles with respect to the theoretical values of 180” and 90”, respectively. At first we do not account for the influence of these angular distortions, that is, we simply view the magnetic exchange interactions in terms of an antiferromagnetic one
FIG. 5 Connection of the octahedra in a double row of the layer structure.

Vol. 32, No. 11 POTASSIUM PERRINIOBATE 1521
TABLE 3 M-M Distances and M-O-M Angles in the Structure of KFeoasTi0,1~,,4505
Vertex-sharing ochtahedra
M-M Edge-sharing M-M n (A) M-O-M octahedra n (A) M-O-M
M,‘-M,‘(M,-M,) 2 3.82 146”2 Ml--M,‘(M,‘-M,) 2 3.34 lOl”9
M2’-M2’(M2-MJ 2 3.82 149”O M,‘-M,’ 1 3.28 116’3(0,) M,‘-M2’ 1 3.28 91”7(0,)
M,‘-M,‘(M,-M,) 2 3.83 178’9 M,-M,‘(M*-M,‘) 2 3.32 101”4(0,) IV&-M2’(M2-MJ 2 3.32 105”4(0,)
for 180” and a ferromagnetic one for 90”. As a result, the dependence of the exchange interactions on the distribution of Fe3+ obeys the two following main proposals:
1. There: are antiferromagnetic exchange interactions regardless of whether the distribution of Fe3+ is fully ordered, partially ordered, or random.
2. The existence of ferromagnetic exchange interactions is very sensitive to the distribution of Fe13+: the more ordering there is of Fe3+ on the Ocn sites, the less ferromagnetic will be the exchange interactions.
Complete ordering of Fe3+ on the Oc,, sites leads to the disappearance of any ferromag- netism. In such a case, only antiferromagnetism exists, due to the M&-M, exchange interactions. One can suppose this antiferromagnetism is stronger than the weak one deduced from the magnetic susceptibility measurements. As a matter of fact, the deviation from linearity, 149”, cannot significantly lower the intensity of the exchange. For example, in YFeO, perovskite, the value of 3, the exchange parameter, is calculated as being about 12.5 cm- ’ for a Fe-O-Fe angle equal to 141” [6]. Therefore, the distribution ofFe3+ on the Oc,,
sites has to be ruled out.
A random distribution of Fe3+ on the two octahedral sites tends to produce an overall compensation of the antiferromagnetic and ferromagnetic interactions. Still, the intensity of the ferromagnetic exchanges probably is not strong because of a significant distortion of the octahedra which results in Fe-O-Fe angles frequently larger than 90” (Table 3). Conse- quently, the prevailing interaction would be the nearly perfect antiferromagnetic one, M,- 0,-M, (179”), and, again, the intensity of the exchange would be stronger than observed. As a result, the random distribution of Fe3+ on the Oc, and Oc,, sites is rather unlikely to occur.
The pmence of Fe3+ only on the Oc, sites, as deduced from the structure determination of KFeo,lrsTi,,,~b,.,,O~, creates the lower level of antiferromagnetic interactions in the layers. Moreover, some weak ferromagnetism appears (Table 3). In such a case, the distri-
bution of Fe3+ on the Oc, sites well accounts for the weak antiferromagnetism of the solid
solution.
To summarize, the structural and magnetochemical information is consistent. This is important for going on to the next step of the magnetochemical investigation, namely, to determine the local ordering of Fe3+ in the diluted compositions.
1522 I. ZVEREVA et al. Vol. 32, No. 11
The Paramagnetic Dilution Approach Applied to Model the Aggregation Phenomena of
Fe3+. In diluted solid solutions of paramagnetic atoms, modeling the concentration and
temperature dependence of the magnetic susceptibility is the way to learn about the distri- bution of these paramagnetic atoms, particularly the possible occurrence of aggregation phenomena. Qualitatively, the existence of a deviation in the experimental value of the magnetic susceptibility from the value known for single atoms, i.e., monomers, provides proof of a magnetic aggregation in terms of clusters, i.e., small-size polymeric species, as
dimers and trimers. In such a case, the paramagnetic dilution approach allows the distribution of the paramagnetic atoms in the diamagnetic lattice to be calculated, in terms of monomers and polymeric species. This approach was used for several oxide solid solutions of main importance, such as the perovskite and the K,NiF, type, where a systematic tendency toward aggregation phenomena of the paramagnetic species, for example, Cr3+ and Fe3+, was proved [5,7-S].
When considering a magnetic dilution, the paramagnetic susceptibility can be expressed as
the sum of the susceptibility of the single paramagnetic species, monomers, and that of the paramagnetic clusters:
where amon acut are the concentrations and xmon, Xclust(i) the susceptibility of the mono- mers and the i-type clusters, respectively. For the diluted concentrations herein investigated,
X max = 0.062, the hypothesis of a formation of dimers only is assumed to give a satisfactory
model of the aggregation phenomena. Consequently, the above expression can be simplified
as
XK = amonxmon + adimXdim (1)
Modeling the exchange interaction is achieved by means of the Heisenberg-Dirac-Van Vleck scheme; the exchange Hamiltonian which is used for a dimer with two equivalent paramag-
netic atoms is written [9] as H = -2 23 s’s, where s is the spin of the atoms and 3 is the exchange parameter. The energy of the spin states which results from the exchange coupling is formulated by the expression E(3, S) = -3[S(S + 1) - 2Si(S + l)], where S takes the values allowed by the vector summation rule with s = 5/2 for Fe3+. This value of E(3,S) is used in the following expression, which permits the paramagnetic susceptibility of a dimer
to be calculated [ 101:
g2CS(2S + l)(S + 1)exp - E(9, S)
s kT
Xdim =
STx(2S + 1)exp - W3, S)
S kT
(2)
Solving the typical problem of the Fe3+ diluted solid solution consists of a simultaneous optimization of 3, the exchange parameter of the Fe3+-0-Fe3+ dimers and a,,, the concentration of such dimers, by using the two expressions (1) and (2). This was performed from the minimization of the expression
q( ( XK$yP”. - (xr);}* (2)
Vol. 32, No. 11 POTASSIUM FERRINIOBATE 1523
0.5 :
0.4 i
0.3 ;
0.2 i
0.1 ;
o.ot/ 0.00 0.02 0.04 0.06 0.08
Fe concentration
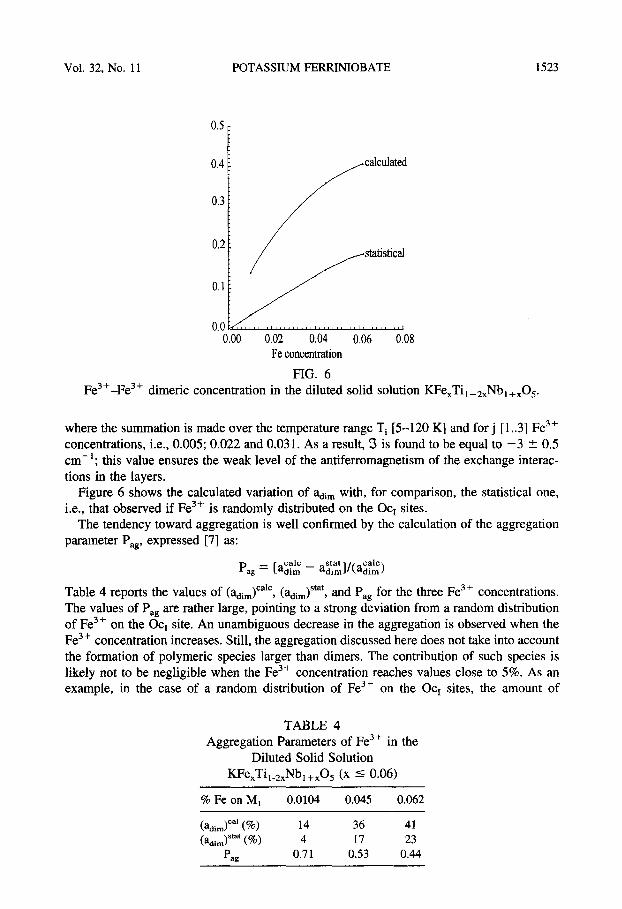
FIG. 6 Fe3+-Fe3+ dimeric concentration in the diluted solid solution KFe,Ti,_,,Nb,+,O,.
where the summation is made over the temperature range Ti [5-120 K] and for j [1..3] Fe3+ concentrations, i.e., 0.005; 0.022 and 0.031. As a result, 3 is found to be equal to -3 + 0.5 cm-‘; this value ensures the weak level of the antiferromagnetism of the exchange interac- tions in the layers.
Figure 6 shows the calculated variation of adi, with, for comparison, the statistical one, i.e., that observed if Fe3+ is randomly distributed on the Oc, sites.
The tendency toward aggregation is well confirmed by the calculation of the aggregation parameter P,, expressed [7] as:
P,, = [a$: - a~~~]/(a~~)
Table 4 reports the values of (adim)ca’c, (adJfat, and P, for the three Fe3+ concentrations. The values of Pas are rather large, pointing to a strong deviation from a random distribution of Fe3+ on the Oc, site. An unambiguous decrease in the aggregation is observed when the Fe3+ concentration increases. Still, the aggregation discussed here does not take into account the formation of polymeric species larger than dimers. The contribution of such species is likely not to be negligible when the Fe3+ concentration reaches values close to 5%. As an example, in the case of a random distribution of Fe3+ on the Oc, sites, the amount of
TABLE 4 Aggregation Parameters of Fe3+ in the
Diluted Solid Solution KFexTil_2xNbl+xOS (x I 0.06)
% Fe on M, 0.0104 0.045 0.062
(adim)ca’ (%) 14 36 41
(adiJtar (%) 4 17 23 P ag 0.71 0.53 0.44
1524 I. ZVEREVA et al. Vol. 32, No. 11
nondimeric clusters reaches 4% for x = 0.062. This confirms that the magnetic aggregation must be considered on the basis of the magnetic dilution, i.e., the paramagnetic concentration,
to obtain accurate results. In any case, the main result of this magnetochemical modeling, the dimeric aggregation of
Fe3+ on one of the two sets of octahedra of the layer, is unequivocal. In regards to the precise understanding of such dimers, one must keep in mind that on a local scale two different kinds
of dimers can occur, namely an antiferromagnetic one and a ferromagnetic one, as deduced from the structural analysis. No precise information is obtained about the kind of dimeric aggregation which exists. From the mean value of the exchange parameter calculated here,
-3 cm-‘, an overall compensation of the two types of interaction seems to be likely. This means that the respective contribution of each kind of dimer cannot be very different, due to
the near absence of preference for one of them.
CONCLUSION
Despite the complex topology of the 2D network of the layered solid solution
KFe,Ti, _a.@, +XO5, it is possible to ascribe the overall weak antiferromagnetism to a fully ordered distribution of Fe3+ on one of the two sets of octahedra. Furthermore, evidence of
aggregation of Fe3+ is obtained from the study of the local ordering of Fe3+ in the octahedra, by modeling the magnetic exchange interactions. A simplified use of the HDVV formalism for the magnetic clusters gives a satisfying picture of the strong tendency of Fe3+ aggrega- tion, in terms of the presence of only dimers, for concentrations not greater than 5%. Such dimeric aggregation of Fe3+ determines another example of local magnetic interactions even
of very low energy, in low dimensional and highly distorted structures.
ACKNOWLEDGMENTS
We are grateful to NATO for its financial support (Collaborative Research Grant reference HTECH.CRG 950381) and to the Russian Fund of Fundamental Research (Grant 96-03-
33991a).
REFERENCES
1. B. Besteiro, F. Archaimbault, A. Pineau and J. Choisnet, Eur. J. Solid State Inorg. Chem. 32, 345
(1995). 2. A.D. Wadsley, Acta Crystallogr. 17, 623 (1964). 3. H. Rebbah, G. Desgardin and B. Raveau, J. Solid State Chem. 31, 321 (1980). 4. B. Besteiro, Doctorate Thesis, University of Grl&ns (1996). 5. B. Bratch and I. Zvereva, Zh. Neorg. Khim. 23, 39 (1982).
6. S. Geller and E.A. Wood, Actu Crystallogr. 9, 563 (1956).
7. B. Bratch, N. Bobrysheva, I. Zvereva, and Yu. Riabkov, Vestn. Zoning. Univ. lC, 99 (1987). 8. F. Archaimbault, J. Choisnet, and I. Zvereva, Mat. Chem. Physics 34, 300 (1993).
9. J.H. Van Vleck, in The theory of electric and magnetic susceptibilities, Oxford University Press, London (1932).
10. E. Sin, Chem. Rev. 5, 313 (1970).
Copyright © 2022 FDOKUMEN