Magnetic structure of epitaxial self-assembled La $ _ {0.7} $ Sr $ _ {0.3} $ MnO $ _ {3} $...
9
Nanoscale magnetic structure and properties of solution-derived self- assembled La0.7Sr0.3MnO3 islands J. Zabaleta, M. Jaafar, P. Abellán, C. Montón, O. Iglesias-Freire et al. Citation: J. Appl. Phys. 111, 024307 (2012); doi: 10.1063/1.3677985 View online: http://dx.doi.org/10.1063/1.3677985 View Table of Contents: http://jap.aip.org/resource/1/JAPIAU/v111/i2 Published by the American Institute of Physics. Related Articles Particle-size effects on the suppression of charge ordering in Nd0.8Na0.2MnO3 J. Appl. Phys. 111, 013919 (2012) Phase dependent room-temperature ferromagnetism of Fe-doped TiO2 nanorods AIP Advances 2, 012107 (2012) Self organization of magnetic nanoparticles: A polarized grazing incidence small angle neutron scattering and grazing incidence small angle x-ray scattering study J. Appl. Phys. 110, 102207 (2011) Fabrication and magnetic properties of Fe and Co co-doped ZrO2 AIP Advances 1, 042138 (2011) Graphene magnet realized by hydrogenated graphene nanopore arrays Appl. Phys. Lett. 99, 183111 (2011) Additional information on J. Appl. Phys. Journal Homepage: http://jap.aip.org/ Journal Information: http://jap.aip.org/about/about_the_journal Top downloads: http://jap.aip.org/features/most_downloaded Information for Authors: http://jap.aip.org/authors Downloaded 30 Jan 2012 to 150.244.102.51. Redistribution subject to AIP license or copyright; see http://jap.aip.org/about/rights_and_permissions
-
Upload
independent -
Category
Documents
-
view
3 -
download
0
Transcript of Magnetic structure of epitaxial self-assembled La $ _ {0.7} $ Sr $ _ {0.3} $ MnO $ _ {3} $...
Nanoscale magnetic structure and properties of solution-derived self-assembled La07Sr03MnO3 islandsJ Zabaleta M Jaafar P Abellaacuten C Montoacuten O Iglesias-Freire et al Citation J Appl Phys 111 024307 (2012) doi 10106313677985 View online httpdxdoiorg10106313677985 View Table of Contents httpjapaiporgresource1JAPIAUv111i2 Published by the American Institute of Physics Related ArticlesParticle-size effects on the suppression of charge ordering in Nd08Na02MnO3 J Appl Phys 111 013919 (2012) Phase dependent room-temperature ferromagnetism of Fe-doped TiO2 nanorods AIP Advances 2 012107 (2012) Self organization of magnetic nanoparticles A polarized grazing incidence small angle neutron scattering andgrazing incidence small angle x-ray scattering study J Appl Phys 110 102207 (2011) Fabrication and magnetic properties of Fe and Co co-doped ZrO2 AIP Advances 1 042138 (2011) Graphene magnet realized by hydrogenated graphene nanopore arrays Appl Phys Lett 99 183111 (2011) Additional information on J Appl PhysJournal Homepage httpjapaiporg Journal Information httpjapaiporgaboutabout_the_journal Top downloads httpjapaiporgfeaturesmost_downloaded Information for Authors httpjapaiporgauthors
Downloaded 30 Jan 2012 to 15024410251 Redistribution subject to AIP license or copyright see httpjapaiporgaboutrights_and_permissions
Nanoscale magnetic structure and properties of solution-derivedself-assembled La07Sr03MnO3 islands
J Zabaleta1a) M Jaafar2 P Abellan1 C Monton1 O Iglesias-Freire2 F Sandiumenge1
C A Ramos3 R D Zysler3 T Puig1 A Asenjo2 N Mestres1 and X Obradors1
1Institut de Ciencia de Materials de Barcelona ICMAB-CSIC Campus de la UAB Bellaterra 08193 BarcelonaSpain2Instituto de Ciencia de Materiales de Madrid ICMM-CSIC Sor Juana Ines de la Cruz 3 Cantoblanco 28049Madrid Spain3Centro Atomico Bariloche and Instituto Balseiro Comision Nacional de Energıa Atomica and UniversidadNacional de Cuyo South Carolina de Bariloche 8400 Argentina
(Received 4 September 2011 accepted 16 December 2011 published online 24 January 2012)
Strain-induced self-assembled La07Sr03MnO3 nanoislands of lateral size 50150 nm and height
1040 nm have been grown on yttria-stabilized zirconia (001)-substrates from ultradiluted chemical
solutions based on metal propionates The nanoislands grow highly relaxed withstanding the epitaxial
relation 001eth THORNLSMO 110frac12 == 001eth THORNYSZ 010frac12 and show bulk-like average magnetic properties in terms of
Curie temperature and saturation magnetization The interplay of the magnetocrystalline and
shape anisotropy within the nanoisland ensemble results in an in-plane magnetic anisotropy with a
magnetocrystalline constant K1 150 Keth THORN frac14 561eth THORN kJ=m3 and in-plane easy axis along the 110frac12 La07Sr03MnO3 direction as measured for the first time through ferromagnetic resonance
experiments Magnetic force microscopy studies reveal the correlation between nanoisland size and its
magnetic domain structure in agreement with micromagnetic simulations In particular we have
established the required geometric conditions for single domain multidomain and vortex
configurations VC 2012 American Institute of Physics [doi10106313677985]
I INTRODUCTION
Nanoscale magnetism has been object of intense
research in the past years motivated by the new phenomena
and by the potential applications that arise at reduced size
and dimensionality12 Moreover the recent advances in
nanofabrication and characterization techniques have led to a
renewed interest in a wide variety of materials and to the dis-
covery of new magnetic behaviors34 The implementation of
such nanomagnetic structures in devices with novel function-
alities requires nevertheless controlling and understanding
the multiple factors influencing their magnetic properties
A substantial amount of work exists on the patterning of
magnetic metal thin films to submicron sizes1256 whereas
fewer studies have been devoted to complex magnetic
oxides78 Among these the mixed valence perovskite man-
ganite La1xSrxMnO3 LSMOeth THORN has triggered plenty of inter-
est due to the physical phenomena that it exhibits such as
colossal magnetoresistance910 In particular LSMO with Sr
doping of x frac14 03 displays ferromagnetic and metallic
behavior at room temperature and hence results especially
appealing from an application point of view In most cases
these LSMO nanostructures are attained by patterning con-
tinuous films into islands using optical and e-beam lithogra-
phy or by combining e-beam lithography and ion
milling81112 However it is in general difficult to process
oxides in such manner and to accomplish lateral sizes below
03 lm without radiation damage or ion implantation8 In
this context the bottom-up self-assembly approach based on
the chemical solution deposition (CSD) route used in this
work offers an effective route to overcome the shortcomings
of lithography-based techniques while uniformly covering
large areas (in the cm2 range) without vacuum environ-
ment requirements13ndash15
Inherent to heteroepitaxial growth lattice strain may lead
to relevant variations of the Curie temperature electrical re-
sistivity and magnetoresistance in nm thick films of mixed-
valence manganite grown on bulk single crystals16 Its effect
is further evidenced on the magnetic anisotropy and micro-
scopic magnetic domain configuration of eg LSMO films
and nanostructures111718 On the other hand the magnetic
properties of epitaxial strain-free nanometric LSMO nanois-
lands where the shape and magnetocrystalline anisotropy are
the key components remain unexplored The main reason for
this is the aforementioned fabrication procedure where nano-
structures are attained from previously formed epitaxial thin
films
In this work we report on the novel system of self-
assembled epitaxial La07SrMnO3 LSMOeth THORN nanoislands grown
through the CSD methodology onto (001)-oriented yttria sta-
bilized zirconia (YSZ) substrates In particular we undertake
the challenge of addressing the influence of key factors such
as size and morphology crystallographic structure and strain
on the magnetic properties of our LSMO nanoislands The
morphological and structural characterization we first present
is proved essential to be able to afterwards study the nanois-
land magnetic anisotropy and deduce the magnetocrystalline
anisotropy constant K1 A Curie temperature TC comparable
to bulk LSMO remarkable in nanostructures with lateral sizes
below 200 nm was measured using a superconducting quan-
tum interference device (SQUID) Finally local magnetic
force microscopy (MFM) measurements reveal a richa)Electronic mail jzabaletaicmabes
0021-89792012111(2)0243078$3000 VC 2012 American Institute of Physics111 024307-1
JOURNAL OF APPLIED PHYSICS 111 024307 (2012)
Downloaded 30 Jan 2012 to 15024410251 Redistribution subject to AIP license or copyright see httpjapaiporgaboutrights_and_permissions
landscape of magnetic structures hidden behind the averaged
magnetic behavior shown by the SQUID magnetization loops
II EXPERIMENTAL DETAILS
A Nanostructure growth
La07Sr03MnO3 nanoislands were obtained following the
CSD route from precursor solutions prepared by dissolving
metal propionates in the stoichiometric ratio in propionic
acid19 Solution concentrations of 003 M (with respect to the
Mn cation) were used The metalorganic solution was depos-
ited on 5 5 mm2 fluorite-structure (001)-YSZ single crystal
substrates and spin-coated at 6000 rpm for 2 min Finally wet
films were heated at high temperature 900 C 1000 Ceth THORNunder oxygen atmosphere 06 1min1eth THORN for 1 to 5 h During
this annealing process the organic matter decomposes and
crystalline structures buildup leading to self-assembled nano-
islands We estimated the amount of crystallized LSMO mate-
rial on the sample by distributing the totality of the island
volume calculated from atomic force microscopy (AFM)
image analysis into a hypothetical continuous film with a cer-
tain equivalent thickness Such calculation gives an equivalent
film thickness value that ranges from 3 to 4 605eth THORN nmThe growth process above described yields the self-
assembled LSMO nanoislands as a result of the interplay of
the thermodynamics and kinetics of the system We found a
general tendency toward wider nanoisland size distributions
and less homogeneous self-assemblies outside the ranges
established in the previous lines For instance at lower tem-
peratures and higher concentrations respectively crystalliza-
tion was not optimal and coalescence processes yielded
agglomerated islands In addition to growth temperature and
solution concentration the distinct interface energies and lat-
tice mismatches between LSMO and the chosen substrate also
proved to be critical We optimized the 3D growth on YSZ
substrates (59 lattice mismatch of LSMO with respect to
YSZ) after observing a 2D growth trend in initially tested
perovskite-type substrates displaying lower mismatches
B Morphological and structural characterization
AFM was performed in the dynamic mode at room tem-
perature and ambient atmosphere using an Agilent 5100
(Molecular Imaging) and a Cervantes system (Nanotec Elec-
tronica SL)20 X-ray diffraction measurements were done
with a GADDS D8 Advance system from Bruker with a
2D-detector Transmission electron microscopy (TEM)
images were obtained with a Jeol 2010 F electron micro-
scope while for electron diffraction pattern acquisition a
Philips CM30 electron microscope was used both of them
operating at 200 kV Cross-sectional samples for TEM ex-
amination were prepared using the mechanical tripod pol-
isher technique followed by an Arthorn milling step down to
perforation in a Precision Ion Polishing System
C Magnetic properties measurements
Macroscopic magnetization measurements were made in
a SQUID magnetometer (Quantum Design MPMS-XL7) at
temperatures between 10 to 300 K and varying magnetic
fields from 0 to 7 T Ferromagnetic resonance (FMR) meas-
urements were performed in a Bruker ESP 300 spectrometer
operated at 95 GHz in a rectangular x-band cavity operating
in the TE102 mode The FMR spectra reported here were
done at 150 K keeping the applied field H in the sample
plane MFM imaging was performed with a Cervantes sys-
tem (Nanotec Electronica SL) working in noncontact mode
and with the phase-locked loop (PLL) system activated
Experiments were carried out at room temperature and low
humidity environment A retrace distance of 30 nm was
proved optimal for a good magnetic sensitivity while avoid-
ing cross talk with the short-range topography signal The
probes were commercial Co-coated Nanosensors PPP-
MFMR and PPP-LM-MFMR cantilevers with kfrac14 28 N=m
and f frac14 75 kHz Although we observed slight changes in
some nanoislands in general the stray field of the tips does
not modify significantly the magnetic state of the sample21
Micromagnetic simulations were performed using the object
oriented micromagnetic framework 3D code (OOMMF
eXtensible Solver)22 with cell sizes of 2 nm 2 nm 1 nm
III RESULTS AND DISCUSSION
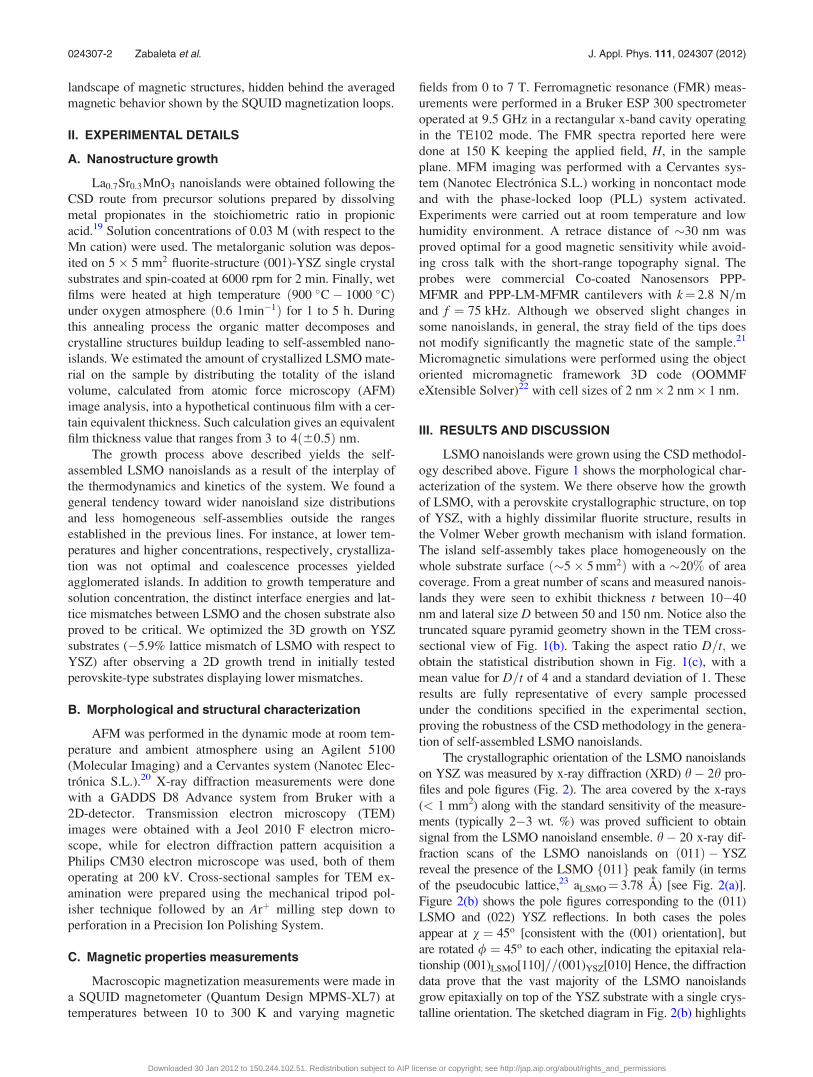
LSMO nanoislands were grown using the CSD methodol-
ogy described above Figure 1 shows the morphological char-
acterization of the system We there observe how the growth
of LSMO with a perovskite crystallographic structure on top
of YSZ with a highly dissimilar fluorite structure results in
the Volmer Weber growth mechanism with island formation
The island self-assembly takes place homogeneously on the
whole substrate surface 5 5 mm2eth THORN with a 20 of area
coverage From a great number of scans and measured nanois-
lands they were seen to exhibit thickness t between 1040
nm and lateral size D between 50 and 150 nm Notice also the
truncated square pyramid geometry shown in the TEM cross-
sectional view of Fig 1(b) Taking the aspect ratio D=t we
obtain the statistical distribution shown in Fig 1(c) with a
mean value for D=t of 4 and a standard deviation of 1 These
results are fully representative of every sample processed
under the conditions specified in the experimental section
proving the robustness of the CSD methodology in the genera-
tion of self-assembled LSMO nanoislands
The crystallographic orientation of the LSMO nanoislands
on YSZ was measured by x-ray diffraction (XRD) h 2h pro-
files and pole figures (Fig 2) The area covered by the x-rays
(lt 1 mm2) along with the standard sensitivity of the measure-
ments (typically 23 wt ) was proved sufficient to obtain
signal from the LSMO nanoisland ensemble h 20 x-ray dif-
fraction scans of the LSMO nanoislands on 011eth THORN YSZ
reveal the presence of the LSMO 011f g peak family (in terms
of the pseudocubic lattice23 aLSMOfrac14 378 A) [see Fig 2(a)]
Figure 2(b) shows the pole figures corresponding to the (011)
LSMO and (022) YSZ reflections In both cases the poles
appear at v frac14 45o [consistent with the (001) orientation] but
are rotated frac14 45o to each other indicating the epitaxial rela-
tionship (001)LSMO[110]==(001)YSZ[010] Hence the diffraction
data prove that the vast majority of the LSMO nanoislands
grow epitaxially on top of the YSZ substrate with a single crys-
talline orientation The sketched diagram in Fig 2(b) highlights
024307-2 Zabaleta et al J Appl Phys 111 024307 (2012)
Downloaded 30 Jan 2012 to 15024410251 Redistribution subject to AIP license or copyright see httpjapaiporgaboutrights_and_permissions
the nanoisland epitaxial relationship with respect to the YSZ
substrate along with its square-pyramid nanoisland morphol-
ogy with (001)LSMO top and (111)LSMO lateral facets The
LSMO[110]==YSZ[010] interface arrangement would corre-
spond to a nominal misfit e 59 between the [110]
direction of LSMOp
2aLSMOeth frac14 0547 nmTHORN and the [010]
direction of YSZ aYSZ frac14 0515 nmeth THORN This significant differ-
ence in lattice mismatch which initially suggests a highly
strained heteroepitaxy may however translate in an unfavor-
ably large building up of strain energy which could in turn
lead to the relaxation of the nanostructure As a matter of fact
the LSMO lattice parameter deduced from the h-2h scans corre-
sponds to the bulk LSMO value indicating a highly relaxed
structure
Further evidence of the nanoisland strain-state was
obtained using high resolution TEM and electron diffraction
(ED) measurements Figure 3(a) is an ED pattern of a selected
area simultaneously containing the YSZ substrate and a single
LSMO nanoisland The epitaxial relationship of the individual
island with respect to the YSZ substrate is in agreement with
the XRD measurements obtained for a large nanoisland en-
semble Notice also that the sublattices from substrate and
nanoisland can be easily distinguished with the naked eye
Furthermore a measure of the lattice spacing separation is
consistent with a complete relaxation of the lattice parameters
FIG 1 (Color online) (a) 5 5 lm2 AFM topography image of LSMO
nanoislands grown at 900 C during 1 h on (001)-YSZ (b) Cross-sectional
TEM image of an LSMO nanoisland with aspect ratio D=t 35 displaying
the typical truncated pyramid geometry (c) Distribution of the D=t values
displayed by the nanoisland ensemble
FIG 2 (Color online) (a) X-ray h 2h diffractogram of LSMO nanoislands
grown at 900 C for 1 h on (001)-YSZ (b) X-ray diffraction pole figures of
the (011) LSMO reflection and of the (022) YSZ reflection corresponding to
001eth THORNLSMO 110frac12 == 001eth THORNYSZ 010frac12 oriented nanoislands The epitaxial rela-
tionship and the island square-pyramid shape are sketched on the right
024307-3 Zabaleta et al J Appl Phys 111 024307 (2012)
Downloaded 30 Jan 2012 to 15024410251 Redistribution subject to AIP license or copyright see httpjapaiporgaboutrights_and_permissions
for LSMO A high resolution TEM (HRTEM) image of an
interfacial region is shown in Fig 3(b) Fourier filtering analy-
ses revealed that the strain contrast observed at the interface
corresponds to dislocations with Burgers vector
b frac14 aYSZ=2eth THORN 100frac12 (arrowed in the image) with the extra half
plane residing in the substrate in order to accommodate the
compressive lattice misfit in the island The average distance
measured in the image 40 nm coincides with the theoreti-
cal value bj j=e for a complete misfit relaxation Our results
thus confirm that the LSMO islands on YSZ are free of misfit
strains
Once the morphology crystal structure and strain-state of
our nanoislands are known we move on to investigate their
magnetic properties The temperature dependence of the spon-
taneous magnetization of the LSMO nanoisland ensemble
measured in a SQUID magnetometer at an applied field of
50 mT is shown in Fig 4(a) Note that a Curie temperature
TC 35063 K close to that of the bulk LSMO9 is attained
This high TC value can be correlated to the absence of strain
within the islandsmdashdeduced from XRD and TEM investiga-
tionsmdashand also linked to the noninvasive self-assembly
growth process which precludes magnetic properties to be
depressed from ion implantation or radiation damage Figure
4(b) displays the magnetization curves measured at 110 K
with in-plane and out-of-plane applied field and reveals that
the easy magnetization axis lies within the sample plane
However because of the small amount of material and thus
the low magnetic signal it was not possible to discern with
SQUID measurements which of the in-plane orientations cor-
responds to the easy magnetization direction Coercive fields
of 15 mT and a saturation magnetization value
Ms frac14 480650eth THORN kA=m at 35 Keth THORN somewhat below the value
for bulk LSMO (590 kA=m) were also obtained The large
error value in Ms stems from the uncertainty in the total
LSMO volume estimation (see Sec II) Because of this uncer-
tainty we cannot rule out the presence of a ferromagnetic dead
FIG 3 (Color online) (a) ED pattern taken across a LSMO island-substrate
interface showing the epitaxial relationship 001eth THORNLSMO 110frac12 == 001eth THORNYSZ 010frac12 The LSMO and YSZ lattices are marked by dashed and continuous lines
respectively (b) Cross-sectional HRTEM image of a (001)-oriented LSMO
nanoisland where the arrows indicate regularly spaced misfit dislocations at the
island=substrate interface The LSMO island and the YSZ substrate are viewed
along the [110] and [010] zone axes respectively
FIG 4 (Color online) (a) Temperature dependence of the magnetization
measured at 50 mT displaying a TC 350 K for the system of self-
assembled LSMO nanoislands on (001)-YSZ (b) The measured in-plane
(IP) and out-of-plane (OP) magnetic hysteresis loops (110 K) evidence the
in-plane anisotropy of the system (c) Results from the ferromagnetic reso-
nance measurements Open symbols represent the measured in-plane de-
pendence of the resonant field Hr at 150 K the solid line is the fitting to the
experimental data according to Eq (3) the inset shows the coordinate sys-
tem used
024307-4 Zabaleta et al J Appl Phys 111 024307 (2012)
Downloaded 30 Jan 2012 to 15024410251 Redistribution subject to AIP license or copyright see httpjapaiporgaboutrights_and_permissions
layer (12 nm) which has been subject of intense study and
no little controversy in manganite based systems24
From the factors that could influence the magnetic ani-
sotropy of the nanoislands ie the compressive strain that
could pull the magnetization out-of-plane their shape and
the magnetocrystalline anisotropy the first does not play a
role because of the relaxed nanoisland state while the flat
island shape D=t 4eth THORN appears to favor the in-plane magnet-
ization To reveal the role of the magnetocrystalline anisot-
ropy we carefully studied the nanoisland ensemble by
means of Ferromagnetic Resonance (FMR) Figure 4(c)
(open circles) shows the measured in-plane angular depend-
ence of the resonant field Hr This value is obtained at each
angle by fitting the FMR spectra with a Lorentzian line
shape Experimental data show a clear angular dependence
of Hr at 150 K Note that a minimum in Hr indicates an easy
magnetization axis in this case the [110] axis of the LSMO
nanoislands To obtain the cubic magnetic anisotropy con-
stant K1 we followed a standard formalism25 The energy
density function is defined as follows developing up to the
first order the magnetocrystalline anisotropy term
E frac14 l0~H ~M thorn l0
2M2 Nxa
2x thorn Nya
2y thorn Nza
2z
thorn K1 a2xa
2y thorn a2
xa2z thorn a2
ya2z
(1)
where the first term represents the Zeeman energy the second
is the magnetostatic contribution (Nx Ny Nz are the demagnet-
izing factors) and the third is the cubic crystalline anisotropy
with ai the direction cosines of the magnetization ~M In this
in-plane configuration no magnetoelastic contribution should
be expected when the strain exerted by the substrate on the
pseudocubic LSMO is isotropic26 Moreover we can rule out
any possible deviation from a truly isotropic in-plane strain
since nanoislands are fully relaxed Concerning the magneto-
static contribution we estimated the demagnetizing field of a
flat square-based pyramid magnetized perpendicularly to its
base and found N frac14 0706005 for D=t in the range of
461 Considering NXthornNYthornNfrac14 1 NX frac14 NY frac14 Nk 015
it turns out that the effective shape demagnetizing factor for
the applied field H parallel to the pyramid base depends
only on the difference N Nk
frac14 DN We rewrite Eq (1)
using the coordinate systems sketched in the inset of Fig 4(c)
E frac14 l0MH sin h cos Heth THORNfrac12 thorn l0
2M2DNcos2h
thorn K1
4sin4hsin22thorn sin22h
(2)
where heth THORN define the position of ~M [Fig 4(c)] and ~H is
applied in the xy plane at an angle H with respect to the
[100] axis From the conditions dE=dh frac14 0 and dE=d frac14 0
we reach the corresponding equilibrium positions h frac14 p=2
and by assuming K1=Mltltl0H frac14 H thus indicating
that ~M lies in the xy plane and that it is parallel to the applied
field Evaluating the second derivative of Eq (2) at the equi-
librium positions h frac14 p=2 and frac14 H and replacing the
result in the Smit-Beljers equation25 we obtain the FMR
condition for our system of nanoislands
xc
2
frac14 l0H thorn l0DN M thorn 2K1
M1 1
2sin22
l0H thorn 2K1
Mcos 4
(3)
where x=c frac14 034 Tx frac14 2p with frac14 95 GHz the x-band
microwave frequency used and c the gyromagnetic factor
for LSMO The fitting of the experimental data to
the Eq (3) [solid line in Fig 4(c)] yields the values
l0DNM 150 Keth THORN frac14 039360004eth THORN T and eth2K1=MTHORN 150 Keth THORNfrac14 002160002eth THORN T
Our numerical estimation of the flat pyramidsrsquo effective
demagnetizing field give l0DN M 150 Keth THORN frac14 03601eth THORN T
where we have introduced the measured saturation magnet-
ization at 150 K M frac14 09 480650eth THORN kA=m reduced a
10 from the low temperature value Thus both values com-
pare well and prove the validity of the assumptions made in
the treatment On the other hand the value for the magneto-
crystalline anisotropy constant K1 is deduced from 2K1=Mgiving K1 150 Keth THORN frac14 561eth THORN kJ=m3 This result is in the
order of what it is reported in literature for LSMO films
grown along the (001) plane which show the [110] in-plane
easy axis1727 To our knowledge this is the first reported
shape anisotropy study for LSMO nanoislands along with
the first measurement of K1 in such nanoscale systems
Upon the macroscopic analysis of the ferromagnetism of
the nanoisland ensemble we found of great interest to try to
unveil their individual nanoscale magnetic structure The tun-
ing of the measuring conditions was essential to be able to
image the magnetic response of such small nanostructures
Figure 5 displays the topography and corresponding magnetic
force images of the surface taken after saturating the tip and
the sample in opposite directions by applying an out-of-plane
magnetic field of 500 mT Bright and dark MFM contrasts
correspond to repulsive and attractive interactions respec-
tively We may observe three different magnetic configura-
tions as a function of the thickness t and the lateral size D of
the nanoislands (D being the average between the two in-
plane values) low contrast vortex state and multidomainconfigurations The average lateral size and thickness can be
used to calculate the average section Sa of every nanoisland
configuration Notice that due to the magnetic coating of the
MFM tips the radio of the probes increases and the quality of
the topographic images decreases The convolution between
the tip and the sample was taken into account to evaluate the
lateral dimensions of the islands The magnetic configuration
of the smaller islands Sa 075 103 nm2
cannot be deter-
mined due to the small interaction with the MFM tip The me-
dium size nanostructures Sa 133 103 nm2
present in-
plane anisotropy with vortex state showing the characteristic
out-of-plane magnetic contrast in the center of the nanoisland
Finally the larger structures Sa 250 103 nm2
present
multidomain magnetic configuration The nonzero out-
of-plane components of the magnetic moment within the
larger islands agrees with the macroscopic hysteresis loops
measured in the out-of-plane configuration which although
small still show remanence magnetization and non negligible
coercive field values [Fig 4(b)]
024307-5 Zabaleta et al J Appl Phys 111 024307 (2012)
Downloaded 30 Jan 2012 to 15024410251 Redistribution subject to AIP license or copyright see httpjapaiporgaboutrights_and_permissions
Statistical processing of the obtained MFM images
shows that the above mentioned configurations fall into three
distinct regions in the graph of Fig 6(a) In other words
there exists a clear correlation between the geometrical pa-
rameters of the nanoisland and its magnetic ground state In
particular nanoislands with t of the order of the exchange
length and with a lateral size below 110 nm display a vortex
state in good agreement with previous observations in mag-
netic metal nanostructures62829 Nanoislands with multido-
main contrast correspond to those with larger D and t values
while the smaller nanoislands present a low contrast that
seemingly corresponds to a homogeneous in-plane magnet-
ization Assuming a dead layer of thickness 2 nm the ferro-
magnetic section of this low contrast islands would be 8 nm
thick [the average t for these islands is 10 nm see Fig 6(a)]
Such nanoislands can be divided into elements 8 nm in height
that interact with the MFM tip The force gradient between
each element and the tip is about 38 105 N=m30 The total
magnetic interaction between the Co coated MFM tip and a
LSMO island has been estimated as the summation of the inter-
actions between each element and the Co tip giving
80 104 N=m However this estimation is valid for out-
of-plane magnetized low contrast islands and is one order of
magnitude above the measured experimental average MFM
value 8 105 N=m Such difference could be well explained
if nanoislands actually displayed an in-plane magnetization
Note also that the experimental value is a factor two higher than
the MFM signal noise for this particular kind of tip (evaluated
as the MFM signal fluctuation out of the islands) This points
out that the contrast of the so-called low contrast nanoislands is
in principle measurable with our MFM system however it is
also at the limit of detection Anyhow the observed diversity in
the magnetic configuration cannot be inferred from the SQUID
hysteresis loops In such macroscopic measurements the size-
dependent magnetic behaviors all add up and reflect the average
magnetic characteristics of the nanoisland ensemble
To confirm the feasibility of our MFM results interpreta-
tion we simulated the stable magnetization configurations
using micromagnetic elements22 taking a rectangular prism
shape in first approximation We introduced the experimental
saturation magnetization and magnetocrystalline anisotropy
constant values and the exchange stiffness A frac14 173
1012 J=m found in the literature31 Representative island
sizes of each of the three magnetic states were considered
small (D 50 nm t 10 nm) medium-size (D 100 nm
t 15 nm) and large (D 120 nm t 30 nm) nanoislands
The simulation results reveal three different magnetic states
consistent with the experimental observations small islands
[Fig 6(b)] exhibit a single domain configuration with in-plane
magnetization (in agreement with the measured signal lower
than the one estimated as previously explained) Large
islands show a complex magnetization configuration [Fig
6(d)] with out-of-plane magnetization components in differ-
ent regions of the island Feasibly by using more realistic
modeling of the larger islands a better agreement between the
magnetic configuration and the simulation could be reached
In between the counterbalance of magnetostatic exchange
and magnetocrystalline contributions results in the in-plane
curling of the magnetic moment with an out-of-plane singular-
ity at the center ie the so-called vortex state A vortex dis-
playing four independent and energetically equivalent states
has become an appealing memory unit candidate for data
FIG 5 (Color online) (a) Topographic
(AFM) and magnetic (MFM) images of
LSMO nanoislands at room temperature
taken from the same location (scan size
16 16 lm2) (b) Detailed topographic
and magnetic images of a smaller region of
LSMO nanoislands The dashed line dot-
ted line and solid line circles highlight
nanoislands with single domain vortex
and multidomain magnetic configurations
respectively
024307-6 Zabaleta et al J Appl Phys 111 024307 (2012)
Downloaded 30 Jan 2012 to 15024410251 Redistribution subject to AIP license or copyright see httpjapaiporgaboutrights_and_permissions
storage3233 To be able to confine the geometries at which the
vortex state is stable in LSMO nanoislands is hence of great
interest toward potential data storage applications
IV CONCLUSIONS
We have presented a comprehensive study of the struc-
tural and magnetic characteristics of a homogeneous system
of ferromagnetic LSMO nanoislands grown from chemical
methods This system features highly crystalline epitaxial
and strain-relaxed nanoislands below 200 nm in lateral size
and with a macroscopic Tc comparable to bulk LSMO Fur-
thermore we have calculated the magnetocrystalline anisot-
ropy constant K1 150 Keth THORN frac14 561eth THORN kJ=m3 of the nanoisland
ensemble which is seen to display a biaxial in-plane anisot-
ropy with the [110]LSMO in-plane easy axis Insight into the
local magnetic structure was given by MFM measurements
and micromagnetic simulations The MFM experiments
reveal the existence of three size-dependent magnetic struc-
tures and provide for the geometry required to stabilize the
vortex state in LSMO nanostructures at room temperature
ACKNOWLEDGMENTS
We acknowledge the financial support from MEC
(MAT2008-01022 Consolider NANOSELECT and FPU)
Comunidad Autonoma de Madrid (CAM S2009=MAT-1467)
Generalitat de Catalunya (Catalan Pla de Recerca 2009-SGR-
770 and XaRMAE) and EU (NESPA) R D Zysler and C
A Ramos acknowledge support from PIP-1333(2007) CONI-
CET and PICT 829 (2006) and PICT 832(2006) ANPCyT of
Argentina Serveis Cientıfic-Tecnics from Universitat de Bar-
celona and Servei de Microscopia from Universitat Autonoma
de Barcelona are acknowledged for TEM facilities
1M Hehn K Ounadjela J P Bucher F Rousseaux D Decanini B Bar-
tenlian and C Chappert Science 272 1782 (1996)2J I Martın J Nogues K Liu J L Vicent and I K Schuller J Magn
Magn Mater 256 449 (2003)3R Beaulac L Schneider P I Archer G Bacher and D R Gamelin Sci-
ence 325 973 (2009)
4X S Gao L F Liu B Birajdar M Ziese W Lee M Alexe and D
Hesse Adv Funct Mater 19 3450 (2009)5C A Ross R Chantrell M Hwang M Farhoud T A Savas Y Hao
H I Smith F M Ross M Redjdal and F B Humphrey Phys Rev B
62 14252 (2000)6T Shinjo T Okuno R Hassdorf K Shigeto and T Ono Science 289
930 (2000)7E Folven T Tybell A Scholl A Young S T Retterer Y Takamura
and J K Grepstad Nano Lett 10 45788Y Takamura R V Chopdekar A Scholl A Doran J A Liddle B Har-
teneck and Y Suzuki Nano Lett 6 1287 (2006)9J M D Coey M Viret and S von Molnar Adv Phys 48 167 (1999)
10A Urushibara Y Moritomo T Arima A Asamitsu G Kido and Y
Tokura Phys Rev B 51 14103 (1995)11M Mathews R Jansen G Rijnders J C Lodder and D H A Blank
Phys Rev B 80 064408 (2009)12E J Kim J L R Watts B Harteneck A Scholl A Young A Doran
and SYuri J Appl Phys 109 07D712 (2011)13M Gibert T Puig X Obradors A Benedetti F Sandiumenge and R
Huhne Adv Mater 19 3937 (2007)14C Moreno P Abellan A Hassini A Ruyter A Perez del Pino F San-
diumenge M J Casanove J Santiso T Puig and X Obradors Adv
Funct Mater 19 2139 (2009)15J Zabaleta N Mestres P Abellan M Gibert F Sandiumenge T Puig
and X Obradors Nanotechnology 21 025302 (2010)16C Adamo X Ke H Q Wang H L Xin T Heeg M E Hawley
W Zander J Schubert P Schiffer D A Muller L Maritato and
D G Schlom Appl Phys Lett 95 112504 (2009)17K Steenbeck and R Hiergeist Appl Phys Lett 75 1778 (1999)18Y Suzuki H Y Hwang S W Cheong T Siegrist R B van Dover A
Asamitsu and Y Tokura J Appl Phys 83 7064 (1998)19U Hasenkox C Mitze R Waser R R Arons J Pommer and G Gun-
therodt J Electroceram 3 255 (1999)20I Horcas R Fernandez J M Gomez-Rodriguez J Colchero J Gomez-
Herrero and A M Baro Rev Sci Instrum 78 013705 (2007)21M Jaafar A Asenjo and M Vazquez IEEE Trans Nanotechnol 7 245
(2008)22See http==mathnistgov=oommf= for more information on the micromag-
netic simulations23M C Martin G Shirane Y Moritomo and Y Tokura Phys Rev B 53
14285 (1996)24J Curiale M Granada H E Troiani R D Sanchez A G Leyva
P Levy and K Samwer Appl Phys Lett 95 043106 (2009)25J Smit and H G Beljers Philips Res Rep 10 113 (1955)26S Chikazumi Physics of Magnetism (Wiley New York 1964)27K Steenbeck T Habisreuther C Dubourdieu and J P Senateur Appl
Phys Lett 80 3361 (2002)28R P Cowburn D K Koltsov A O Adeyeye M E Welland and D M
Tricker Phys Rev Lett 83 1042 (1999)
FIG 6 (Color) (a) Phase diagram extracted from MFM measurements showing the magnetic configuration of the self-assembled LSMO nanoislands as a func-
tion of nanoisland dimensions (dashed lines represent a guide to the eye) Micromagnetic simulation results for (b) small (c) medium-size and (d) large nanois-
lands The data scale for all the simulated images is 25 kA=m The blue and red colors correspond to the out of plane magnetization (outwards and inwards
respectively) The magnetization configurations correspond to the islands after saturating along thethornZ (outwards) direction
024307-7 Zabaleta et al J Appl Phys 111 024307 (2012)
Downloaded 30 Jan 2012 to 15024410251 Redistribution subject to AIP license or copyright see httpjapaiporgaboutrights_and_permissions
29A Wachowiak J Wiebe M Bode O Pietzsch M Morgenstern and R
Wiesendanger Science 298 577 (2002)30We have estimated the interaction between a Co coated tip [radius 10
nm and Ms (Co) = 1440 kA=m] and a LSMO nanoisland divided into 8 nm
size elements with Ms (LSMO at 300 K) = 240 kA=m using F=z =P
i
(l06mtipmi)=(pz) where mtip and mi are the magnetic moment of the tip
and the magnetic moment of one of the elements of the nanoisland respec-
tively and z is the distance between the tip and each nanoelement
31R Akiyama H Tanaka T Matsumoto and T Kawai Appl Phys Lett
79 4378 (2001)32B Pigeau G De Loubens O Klein A Riegler F Lochner G Schmidt
L W Molenkamp V S Tiberkevich and A N Slavin Appl Phys Lett
96 132506 (2010)33A Ruotolo V Cros B Georges A Dussaux J Grollier C Deranlot R
Guillemet K Bouzehouane S Fusil and A Fert Nat Nanotechnol 4
528 (2009)
024307-8 Zabaleta et al J Appl Phys 111 024307 (2012)
Downloaded 30 Jan 2012 to 15024410251 Redistribution subject to AIP license or copyright see httpjapaiporgaboutrights_and_permissions
Nanoscale magnetic structure and properties of solution-derivedself-assembled La07Sr03MnO3 islands
J Zabaleta1a) M Jaafar2 P Abellan1 C Monton1 O Iglesias-Freire2 F Sandiumenge1
C A Ramos3 R D Zysler3 T Puig1 A Asenjo2 N Mestres1 and X Obradors1
1Institut de Ciencia de Materials de Barcelona ICMAB-CSIC Campus de la UAB Bellaterra 08193 BarcelonaSpain2Instituto de Ciencia de Materiales de Madrid ICMM-CSIC Sor Juana Ines de la Cruz 3 Cantoblanco 28049Madrid Spain3Centro Atomico Bariloche and Instituto Balseiro Comision Nacional de Energıa Atomica and UniversidadNacional de Cuyo South Carolina de Bariloche 8400 Argentina
(Received 4 September 2011 accepted 16 December 2011 published online 24 January 2012)
Strain-induced self-assembled La07Sr03MnO3 nanoislands of lateral size 50150 nm and height
1040 nm have been grown on yttria-stabilized zirconia (001)-substrates from ultradiluted chemical
solutions based on metal propionates The nanoislands grow highly relaxed withstanding the epitaxial
relation 001eth THORNLSMO 110frac12 == 001eth THORNYSZ 010frac12 and show bulk-like average magnetic properties in terms of
Curie temperature and saturation magnetization The interplay of the magnetocrystalline and
shape anisotropy within the nanoisland ensemble results in an in-plane magnetic anisotropy with a
magnetocrystalline constant K1 150 Keth THORN frac14 561eth THORN kJ=m3 and in-plane easy axis along the 110frac12 La07Sr03MnO3 direction as measured for the first time through ferromagnetic resonance
experiments Magnetic force microscopy studies reveal the correlation between nanoisland size and its
magnetic domain structure in agreement with micromagnetic simulations In particular we have
established the required geometric conditions for single domain multidomain and vortex
configurations VC 2012 American Institute of Physics [doi10106313677985]
I INTRODUCTION
Nanoscale magnetism has been object of intense
research in the past years motivated by the new phenomena
and by the potential applications that arise at reduced size
and dimensionality12 Moreover the recent advances in
nanofabrication and characterization techniques have led to a
renewed interest in a wide variety of materials and to the dis-
covery of new magnetic behaviors34 The implementation of
such nanomagnetic structures in devices with novel function-
alities requires nevertheless controlling and understanding
the multiple factors influencing their magnetic properties
A substantial amount of work exists on the patterning of
magnetic metal thin films to submicron sizes1256 whereas
fewer studies have been devoted to complex magnetic
oxides78 Among these the mixed valence perovskite man-
ganite La1xSrxMnO3 LSMOeth THORN has triggered plenty of inter-
est due to the physical phenomena that it exhibits such as
colossal magnetoresistance910 In particular LSMO with Sr
doping of x frac14 03 displays ferromagnetic and metallic
behavior at room temperature and hence results especially
appealing from an application point of view In most cases
these LSMO nanostructures are attained by patterning con-
tinuous films into islands using optical and e-beam lithogra-
phy or by combining e-beam lithography and ion
milling81112 However it is in general difficult to process
oxides in such manner and to accomplish lateral sizes below
03 lm without radiation damage or ion implantation8 In
this context the bottom-up self-assembly approach based on
the chemical solution deposition (CSD) route used in this
work offers an effective route to overcome the shortcomings
of lithography-based techniques while uniformly covering
large areas (in the cm2 range) without vacuum environ-
ment requirements13ndash15
Inherent to heteroepitaxial growth lattice strain may lead
to relevant variations of the Curie temperature electrical re-
sistivity and magnetoresistance in nm thick films of mixed-
valence manganite grown on bulk single crystals16 Its effect
is further evidenced on the magnetic anisotropy and micro-
scopic magnetic domain configuration of eg LSMO films
and nanostructures111718 On the other hand the magnetic
properties of epitaxial strain-free nanometric LSMO nanois-
lands where the shape and magnetocrystalline anisotropy are
the key components remain unexplored The main reason for
this is the aforementioned fabrication procedure where nano-
structures are attained from previously formed epitaxial thin
films
In this work we report on the novel system of self-
assembled epitaxial La07SrMnO3 LSMOeth THORN nanoislands grown
through the CSD methodology onto (001)-oriented yttria sta-
bilized zirconia (YSZ) substrates In particular we undertake
the challenge of addressing the influence of key factors such
as size and morphology crystallographic structure and strain
on the magnetic properties of our LSMO nanoislands The
morphological and structural characterization we first present
is proved essential to be able to afterwards study the nanois-
land magnetic anisotropy and deduce the magnetocrystalline
anisotropy constant K1 A Curie temperature TC comparable
to bulk LSMO remarkable in nanostructures with lateral sizes
below 200 nm was measured using a superconducting quan-
tum interference device (SQUID) Finally local magnetic
force microscopy (MFM) measurements reveal a richa)Electronic mail jzabaletaicmabes
0021-89792012111(2)0243078$3000 VC 2012 American Institute of Physics111 024307-1
JOURNAL OF APPLIED PHYSICS 111 024307 (2012)
Downloaded 30 Jan 2012 to 15024410251 Redistribution subject to AIP license or copyright see httpjapaiporgaboutrights_and_permissions
landscape of magnetic structures hidden behind the averaged
magnetic behavior shown by the SQUID magnetization loops
II EXPERIMENTAL DETAILS
A Nanostructure growth
La07Sr03MnO3 nanoislands were obtained following the
CSD route from precursor solutions prepared by dissolving
metal propionates in the stoichiometric ratio in propionic
acid19 Solution concentrations of 003 M (with respect to the
Mn cation) were used The metalorganic solution was depos-
ited on 5 5 mm2 fluorite-structure (001)-YSZ single crystal
substrates and spin-coated at 6000 rpm for 2 min Finally wet
films were heated at high temperature 900 C 1000 Ceth THORNunder oxygen atmosphere 06 1min1eth THORN for 1 to 5 h During
this annealing process the organic matter decomposes and
crystalline structures buildup leading to self-assembled nano-
islands We estimated the amount of crystallized LSMO mate-
rial on the sample by distributing the totality of the island
volume calculated from atomic force microscopy (AFM)
image analysis into a hypothetical continuous film with a cer-
tain equivalent thickness Such calculation gives an equivalent
film thickness value that ranges from 3 to 4 605eth THORN nmThe growth process above described yields the self-
assembled LSMO nanoislands as a result of the interplay of
the thermodynamics and kinetics of the system We found a
general tendency toward wider nanoisland size distributions
and less homogeneous self-assemblies outside the ranges
established in the previous lines For instance at lower tem-
peratures and higher concentrations respectively crystalliza-
tion was not optimal and coalescence processes yielded
agglomerated islands In addition to growth temperature and
solution concentration the distinct interface energies and lat-
tice mismatches between LSMO and the chosen substrate also
proved to be critical We optimized the 3D growth on YSZ
substrates (59 lattice mismatch of LSMO with respect to
YSZ) after observing a 2D growth trend in initially tested
perovskite-type substrates displaying lower mismatches
B Morphological and structural characterization
AFM was performed in the dynamic mode at room tem-
perature and ambient atmosphere using an Agilent 5100
(Molecular Imaging) and a Cervantes system (Nanotec Elec-
tronica SL)20 X-ray diffraction measurements were done
with a GADDS D8 Advance system from Bruker with a
2D-detector Transmission electron microscopy (TEM)
images were obtained with a Jeol 2010 F electron micro-
scope while for electron diffraction pattern acquisition a
Philips CM30 electron microscope was used both of them
operating at 200 kV Cross-sectional samples for TEM ex-
amination were prepared using the mechanical tripod pol-
isher technique followed by an Arthorn milling step down to
perforation in a Precision Ion Polishing System
C Magnetic properties measurements
Macroscopic magnetization measurements were made in
a SQUID magnetometer (Quantum Design MPMS-XL7) at
temperatures between 10 to 300 K and varying magnetic
fields from 0 to 7 T Ferromagnetic resonance (FMR) meas-
urements were performed in a Bruker ESP 300 spectrometer
operated at 95 GHz in a rectangular x-band cavity operating
in the TE102 mode The FMR spectra reported here were
done at 150 K keeping the applied field H in the sample
plane MFM imaging was performed with a Cervantes sys-
tem (Nanotec Electronica SL) working in noncontact mode
and with the phase-locked loop (PLL) system activated
Experiments were carried out at room temperature and low
humidity environment A retrace distance of 30 nm was
proved optimal for a good magnetic sensitivity while avoid-
ing cross talk with the short-range topography signal The
probes were commercial Co-coated Nanosensors PPP-
MFMR and PPP-LM-MFMR cantilevers with kfrac14 28 N=m
and f frac14 75 kHz Although we observed slight changes in
some nanoislands in general the stray field of the tips does
not modify significantly the magnetic state of the sample21
Micromagnetic simulations were performed using the object
oriented micromagnetic framework 3D code (OOMMF
eXtensible Solver)22 with cell sizes of 2 nm 2 nm 1 nm
III RESULTS AND DISCUSSION
LSMO nanoislands were grown using the CSD methodol-
ogy described above Figure 1 shows the morphological char-
acterization of the system We there observe how the growth
of LSMO with a perovskite crystallographic structure on top
of YSZ with a highly dissimilar fluorite structure results in
the Volmer Weber growth mechanism with island formation
The island self-assembly takes place homogeneously on the
whole substrate surface 5 5 mm2eth THORN with a 20 of area
coverage From a great number of scans and measured nanois-
lands they were seen to exhibit thickness t between 1040
nm and lateral size D between 50 and 150 nm Notice also the
truncated square pyramid geometry shown in the TEM cross-
sectional view of Fig 1(b) Taking the aspect ratio D=t we
obtain the statistical distribution shown in Fig 1(c) with a
mean value for D=t of 4 and a standard deviation of 1 These
results are fully representative of every sample processed
under the conditions specified in the experimental section
proving the robustness of the CSD methodology in the genera-
tion of self-assembled LSMO nanoislands
The crystallographic orientation of the LSMO nanoislands
on YSZ was measured by x-ray diffraction (XRD) h 2h pro-
files and pole figures (Fig 2) The area covered by the x-rays
(lt 1 mm2) along with the standard sensitivity of the measure-
ments (typically 23 wt ) was proved sufficient to obtain
signal from the LSMO nanoisland ensemble h 20 x-ray dif-
fraction scans of the LSMO nanoislands on 011eth THORN YSZ
reveal the presence of the LSMO 011f g peak family (in terms
of the pseudocubic lattice23 aLSMOfrac14 378 A) [see Fig 2(a)]
Figure 2(b) shows the pole figures corresponding to the (011)
LSMO and (022) YSZ reflections In both cases the poles
appear at v frac14 45o [consistent with the (001) orientation] but
are rotated frac14 45o to each other indicating the epitaxial rela-
tionship (001)LSMO[110]==(001)YSZ[010] Hence the diffraction
data prove that the vast majority of the LSMO nanoislands
grow epitaxially on top of the YSZ substrate with a single crys-
talline orientation The sketched diagram in Fig 2(b) highlights
024307-2 Zabaleta et al J Appl Phys 111 024307 (2012)
Downloaded 30 Jan 2012 to 15024410251 Redistribution subject to AIP license or copyright see httpjapaiporgaboutrights_and_permissions
the nanoisland epitaxial relationship with respect to the YSZ
substrate along with its square-pyramid nanoisland morphol-
ogy with (001)LSMO top and (111)LSMO lateral facets The
LSMO[110]==YSZ[010] interface arrangement would corre-
spond to a nominal misfit e 59 between the [110]
direction of LSMOp
2aLSMOeth frac14 0547 nmTHORN and the [010]
direction of YSZ aYSZ frac14 0515 nmeth THORN This significant differ-
ence in lattice mismatch which initially suggests a highly
strained heteroepitaxy may however translate in an unfavor-
ably large building up of strain energy which could in turn
lead to the relaxation of the nanostructure As a matter of fact
the LSMO lattice parameter deduced from the h-2h scans corre-
sponds to the bulk LSMO value indicating a highly relaxed
structure
Further evidence of the nanoisland strain-state was
obtained using high resolution TEM and electron diffraction
(ED) measurements Figure 3(a) is an ED pattern of a selected
area simultaneously containing the YSZ substrate and a single
LSMO nanoisland The epitaxial relationship of the individual
island with respect to the YSZ substrate is in agreement with
the XRD measurements obtained for a large nanoisland en-
semble Notice also that the sublattices from substrate and
nanoisland can be easily distinguished with the naked eye
Furthermore a measure of the lattice spacing separation is
consistent with a complete relaxation of the lattice parameters
FIG 1 (Color online) (a) 5 5 lm2 AFM topography image of LSMO
nanoislands grown at 900 C during 1 h on (001)-YSZ (b) Cross-sectional
TEM image of an LSMO nanoisland with aspect ratio D=t 35 displaying
the typical truncated pyramid geometry (c) Distribution of the D=t values
displayed by the nanoisland ensemble
FIG 2 (Color online) (a) X-ray h 2h diffractogram of LSMO nanoislands
grown at 900 C for 1 h on (001)-YSZ (b) X-ray diffraction pole figures of
the (011) LSMO reflection and of the (022) YSZ reflection corresponding to
001eth THORNLSMO 110frac12 == 001eth THORNYSZ 010frac12 oriented nanoislands The epitaxial rela-
tionship and the island square-pyramid shape are sketched on the right
024307-3 Zabaleta et al J Appl Phys 111 024307 (2012)
Downloaded 30 Jan 2012 to 15024410251 Redistribution subject to AIP license or copyright see httpjapaiporgaboutrights_and_permissions
for LSMO A high resolution TEM (HRTEM) image of an
interfacial region is shown in Fig 3(b) Fourier filtering analy-
ses revealed that the strain contrast observed at the interface
corresponds to dislocations with Burgers vector
b frac14 aYSZ=2eth THORN 100frac12 (arrowed in the image) with the extra half
plane residing in the substrate in order to accommodate the
compressive lattice misfit in the island The average distance
measured in the image 40 nm coincides with the theoreti-
cal value bj j=e for a complete misfit relaxation Our results
thus confirm that the LSMO islands on YSZ are free of misfit
strains
Once the morphology crystal structure and strain-state of
our nanoislands are known we move on to investigate their
magnetic properties The temperature dependence of the spon-
taneous magnetization of the LSMO nanoisland ensemble
measured in a SQUID magnetometer at an applied field of
50 mT is shown in Fig 4(a) Note that a Curie temperature
TC 35063 K close to that of the bulk LSMO9 is attained
This high TC value can be correlated to the absence of strain
within the islandsmdashdeduced from XRD and TEM investiga-
tionsmdashand also linked to the noninvasive self-assembly
growth process which precludes magnetic properties to be
depressed from ion implantation or radiation damage Figure
4(b) displays the magnetization curves measured at 110 K
with in-plane and out-of-plane applied field and reveals that
the easy magnetization axis lies within the sample plane
However because of the small amount of material and thus
the low magnetic signal it was not possible to discern with
SQUID measurements which of the in-plane orientations cor-
responds to the easy magnetization direction Coercive fields
of 15 mT and a saturation magnetization value
Ms frac14 480650eth THORN kA=m at 35 Keth THORN somewhat below the value
for bulk LSMO (590 kA=m) were also obtained The large
error value in Ms stems from the uncertainty in the total
LSMO volume estimation (see Sec II) Because of this uncer-
tainty we cannot rule out the presence of a ferromagnetic dead
FIG 3 (Color online) (a) ED pattern taken across a LSMO island-substrate
interface showing the epitaxial relationship 001eth THORNLSMO 110frac12 == 001eth THORNYSZ 010frac12 The LSMO and YSZ lattices are marked by dashed and continuous lines
respectively (b) Cross-sectional HRTEM image of a (001)-oriented LSMO
nanoisland where the arrows indicate regularly spaced misfit dislocations at the
island=substrate interface The LSMO island and the YSZ substrate are viewed
along the [110] and [010] zone axes respectively
FIG 4 (Color online) (a) Temperature dependence of the magnetization
measured at 50 mT displaying a TC 350 K for the system of self-
assembled LSMO nanoislands on (001)-YSZ (b) The measured in-plane
(IP) and out-of-plane (OP) magnetic hysteresis loops (110 K) evidence the
in-plane anisotropy of the system (c) Results from the ferromagnetic reso-
nance measurements Open symbols represent the measured in-plane de-
pendence of the resonant field Hr at 150 K the solid line is the fitting to the
experimental data according to Eq (3) the inset shows the coordinate sys-
tem used
024307-4 Zabaleta et al J Appl Phys 111 024307 (2012)
Downloaded 30 Jan 2012 to 15024410251 Redistribution subject to AIP license or copyright see httpjapaiporgaboutrights_and_permissions
layer (12 nm) which has been subject of intense study and
no little controversy in manganite based systems24
From the factors that could influence the magnetic ani-
sotropy of the nanoislands ie the compressive strain that
could pull the magnetization out-of-plane their shape and
the magnetocrystalline anisotropy the first does not play a
role because of the relaxed nanoisland state while the flat
island shape D=t 4eth THORN appears to favor the in-plane magnet-
ization To reveal the role of the magnetocrystalline anisot-
ropy we carefully studied the nanoisland ensemble by
means of Ferromagnetic Resonance (FMR) Figure 4(c)
(open circles) shows the measured in-plane angular depend-
ence of the resonant field Hr This value is obtained at each
angle by fitting the FMR spectra with a Lorentzian line
shape Experimental data show a clear angular dependence
of Hr at 150 K Note that a minimum in Hr indicates an easy
magnetization axis in this case the [110] axis of the LSMO
nanoislands To obtain the cubic magnetic anisotropy con-
stant K1 we followed a standard formalism25 The energy
density function is defined as follows developing up to the
first order the magnetocrystalline anisotropy term
E frac14 l0~H ~M thorn l0
2M2 Nxa
2x thorn Nya
2y thorn Nza
2z
thorn K1 a2xa
2y thorn a2
xa2z thorn a2
ya2z
(1)
where the first term represents the Zeeman energy the second
is the magnetostatic contribution (Nx Ny Nz are the demagnet-
izing factors) and the third is the cubic crystalline anisotropy
with ai the direction cosines of the magnetization ~M In this
in-plane configuration no magnetoelastic contribution should
be expected when the strain exerted by the substrate on the
pseudocubic LSMO is isotropic26 Moreover we can rule out
any possible deviation from a truly isotropic in-plane strain
since nanoislands are fully relaxed Concerning the magneto-
static contribution we estimated the demagnetizing field of a
flat square-based pyramid magnetized perpendicularly to its
base and found N frac14 0706005 for D=t in the range of
461 Considering NXthornNYthornNfrac14 1 NX frac14 NY frac14 Nk 015
it turns out that the effective shape demagnetizing factor for
the applied field H parallel to the pyramid base depends
only on the difference N Nk
frac14 DN We rewrite Eq (1)
using the coordinate systems sketched in the inset of Fig 4(c)
E frac14 l0MH sin h cos Heth THORNfrac12 thorn l0
2M2DNcos2h
thorn K1
4sin4hsin22thorn sin22h
(2)
where heth THORN define the position of ~M [Fig 4(c)] and ~H is
applied in the xy plane at an angle H with respect to the
[100] axis From the conditions dE=dh frac14 0 and dE=d frac14 0
we reach the corresponding equilibrium positions h frac14 p=2
and by assuming K1=Mltltl0H frac14 H thus indicating
that ~M lies in the xy plane and that it is parallel to the applied
field Evaluating the second derivative of Eq (2) at the equi-
librium positions h frac14 p=2 and frac14 H and replacing the
result in the Smit-Beljers equation25 we obtain the FMR
condition for our system of nanoislands
xc
2
frac14 l0H thorn l0DN M thorn 2K1
M1 1
2sin22
l0H thorn 2K1
Mcos 4
(3)
where x=c frac14 034 Tx frac14 2p with frac14 95 GHz the x-band
microwave frequency used and c the gyromagnetic factor
for LSMO The fitting of the experimental data to
the Eq (3) [solid line in Fig 4(c)] yields the values
l0DNM 150 Keth THORN frac14 039360004eth THORN T and eth2K1=MTHORN 150 Keth THORNfrac14 002160002eth THORN T
Our numerical estimation of the flat pyramidsrsquo effective
demagnetizing field give l0DN M 150 Keth THORN frac14 03601eth THORN T
where we have introduced the measured saturation magnet-
ization at 150 K M frac14 09 480650eth THORN kA=m reduced a
10 from the low temperature value Thus both values com-
pare well and prove the validity of the assumptions made in
the treatment On the other hand the value for the magneto-
crystalline anisotropy constant K1 is deduced from 2K1=Mgiving K1 150 Keth THORN frac14 561eth THORN kJ=m3 This result is in the
order of what it is reported in literature for LSMO films
grown along the (001) plane which show the [110] in-plane
easy axis1727 To our knowledge this is the first reported
shape anisotropy study for LSMO nanoislands along with
the first measurement of K1 in such nanoscale systems
Upon the macroscopic analysis of the ferromagnetism of
the nanoisland ensemble we found of great interest to try to
unveil their individual nanoscale magnetic structure The tun-
ing of the measuring conditions was essential to be able to
image the magnetic response of such small nanostructures
Figure 5 displays the topography and corresponding magnetic
force images of the surface taken after saturating the tip and
the sample in opposite directions by applying an out-of-plane
magnetic field of 500 mT Bright and dark MFM contrasts
correspond to repulsive and attractive interactions respec-
tively We may observe three different magnetic configura-
tions as a function of the thickness t and the lateral size D of
the nanoislands (D being the average between the two in-
plane values) low contrast vortex state and multidomainconfigurations The average lateral size and thickness can be
used to calculate the average section Sa of every nanoisland
configuration Notice that due to the magnetic coating of the
MFM tips the radio of the probes increases and the quality of
the topographic images decreases The convolution between
the tip and the sample was taken into account to evaluate the
lateral dimensions of the islands The magnetic configuration
of the smaller islands Sa 075 103 nm2
cannot be deter-
mined due to the small interaction with the MFM tip The me-
dium size nanostructures Sa 133 103 nm2
present in-
plane anisotropy with vortex state showing the characteristic
out-of-plane magnetic contrast in the center of the nanoisland
Finally the larger structures Sa 250 103 nm2
present
multidomain magnetic configuration The nonzero out-
of-plane components of the magnetic moment within the
larger islands agrees with the macroscopic hysteresis loops
measured in the out-of-plane configuration which although
small still show remanence magnetization and non negligible
coercive field values [Fig 4(b)]
024307-5 Zabaleta et al J Appl Phys 111 024307 (2012)
Downloaded 30 Jan 2012 to 15024410251 Redistribution subject to AIP license or copyright see httpjapaiporgaboutrights_and_permissions
Statistical processing of the obtained MFM images
shows that the above mentioned configurations fall into three
distinct regions in the graph of Fig 6(a) In other words
there exists a clear correlation between the geometrical pa-
rameters of the nanoisland and its magnetic ground state In
particular nanoislands with t of the order of the exchange
length and with a lateral size below 110 nm display a vortex
state in good agreement with previous observations in mag-
netic metal nanostructures62829 Nanoislands with multido-
main contrast correspond to those with larger D and t values
while the smaller nanoislands present a low contrast that
seemingly corresponds to a homogeneous in-plane magnet-
ization Assuming a dead layer of thickness 2 nm the ferro-
magnetic section of this low contrast islands would be 8 nm
thick [the average t for these islands is 10 nm see Fig 6(a)]
Such nanoislands can be divided into elements 8 nm in height
that interact with the MFM tip The force gradient between
each element and the tip is about 38 105 N=m30 The total
magnetic interaction between the Co coated MFM tip and a
LSMO island has been estimated as the summation of the inter-
actions between each element and the Co tip giving
80 104 N=m However this estimation is valid for out-
of-plane magnetized low contrast islands and is one order of
magnitude above the measured experimental average MFM
value 8 105 N=m Such difference could be well explained
if nanoislands actually displayed an in-plane magnetization
Note also that the experimental value is a factor two higher than
the MFM signal noise for this particular kind of tip (evaluated
as the MFM signal fluctuation out of the islands) This points
out that the contrast of the so-called low contrast nanoislands is
in principle measurable with our MFM system however it is
also at the limit of detection Anyhow the observed diversity in
the magnetic configuration cannot be inferred from the SQUID
hysteresis loops In such macroscopic measurements the size-
dependent magnetic behaviors all add up and reflect the average
magnetic characteristics of the nanoisland ensemble
To confirm the feasibility of our MFM results interpreta-
tion we simulated the stable magnetization configurations
using micromagnetic elements22 taking a rectangular prism
shape in first approximation We introduced the experimental
saturation magnetization and magnetocrystalline anisotropy
constant values and the exchange stiffness A frac14 173
1012 J=m found in the literature31 Representative island
sizes of each of the three magnetic states were considered
small (D 50 nm t 10 nm) medium-size (D 100 nm
t 15 nm) and large (D 120 nm t 30 nm) nanoislands
The simulation results reveal three different magnetic states
consistent with the experimental observations small islands
[Fig 6(b)] exhibit a single domain configuration with in-plane
magnetization (in agreement with the measured signal lower
than the one estimated as previously explained) Large
islands show a complex magnetization configuration [Fig
6(d)] with out-of-plane magnetization components in differ-
ent regions of the island Feasibly by using more realistic
modeling of the larger islands a better agreement between the
magnetic configuration and the simulation could be reached
In between the counterbalance of magnetostatic exchange
and magnetocrystalline contributions results in the in-plane
curling of the magnetic moment with an out-of-plane singular-
ity at the center ie the so-called vortex state A vortex dis-
playing four independent and energetically equivalent states
has become an appealing memory unit candidate for data
FIG 5 (Color online) (a) Topographic
(AFM) and magnetic (MFM) images of
LSMO nanoislands at room temperature
taken from the same location (scan size
16 16 lm2) (b) Detailed topographic
and magnetic images of a smaller region of
LSMO nanoislands The dashed line dot-
ted line and solid line circles highlight
nanoislands with single domain vortex
and multidomain magnetic configurations
respectively
024307-6 Zabaleta et al J Appl Phys 111 024307 (2012)
Downloaded 30 Jan 2012 to 15024410251 Redistribution subject to AIP license or copyright see httpjapaiporgaboutrights_and_permissions
storage3233 To be able to confine the geometries at which the
vortex state is stable in LSMO nanoislands is hence of great
interest toward potential data storage applications
IV CONCLUSIONS
We have presented a comprehensive study of the struc-
tural and magnetic characteristics of a homogeneous system
of ferromagnetic LSMO nanoislands grown from chemical
methods This system features highly crystalline epitaxial
and strain-relaxed nanoislands below 200 nm in lateral size
and with a macroscopic Tc comparable to bulk LSMO Fur-
thermore we have calculated the magnetocrystalline anisot-
ropy constant K1 150 Keth THORN frac14 561eth THORN kJ=m3 of the nanoisland
ensemble which is seen to display a biaxial in-plane anisot-
ropy with the [110]LSMO in-plane easy axis Insight into the
local magnetic structure was given by MFM measurements
and micromagnetic simulations The MFM experiments
reveal the existence of three size-dependent magnetic struc-
tures and provide for the geometry required to stabilize the
vortex state in LSMO nanostructures at room temperature
ACKNOWLEDGMENTS
We acknowledge the financial support from MEC
(MAT2008-01022 Consolider NANOSELECT and FPU)
Comunidad Autonoma de Madrid (CAM S2009=MAT-1467)
Generalitat de Catalunya (Catalan Pla de Recerca 2009-SGR-
770 and XaRMAE) and EU (NESPA) R D Zysler and C
A Ramos acknowledge support from PIP-1333(2007) CONI-
CET and PICT 829 (2006) and PICT 832(2006) ANPCyT of
Argentina Serveis Cientıfic-Tecnics from Universitat de Bar-
celona and Servei de Microscopia from Universitat Autonoma
de Barcelona are acknowledged for TEM facilities
1M Hehn K Ounadjela J P Bucher F Rousseaux D Decanini B Bar-
tenlian and C Chappert Science 272 1782 (1996)2J I Martın J Nogues K Liu J L Vicent and I K Schuller J Magn
Magn Mater 256 449 (2003)3R Beaulac L Schneider P I Archer G Bacher and D R Gamelin Sci-
ence 325 973 (2009)
4X S Gao L F Liu B Birajdar M Ziese W Lee M Alexe and D
Hesse Adv Funct Mater 19 3450 (2009)5C A Ross R Chantrell M Hwang M Farhoud T A Savas Y Hao
H I Smith F M Ross M Redjdal and F B Humphrey Phys Rev B
62 14252 (2000)6T Shinjo T Okuno R Hassdorf K Shigeto and T Ono Science 289
930 (2000)7E Folven T Tybell A Scholl A Young S T Retterer Y Takamura
and J K Grepstad Nano Lett 10 45788Y Takamura R V Chopdekar A Scholl A Doran J A Liddle B Har-
teneck and Y Suzuki Nano Lett 6 1287 (2006)9J M D Coey M Viret and S von Molnar Adv Phys 48 167 (1999)
10A Urushibara Y Moritomo T Arima A Asamitsu G Kido and Y
Tokura Phys Rev B 51 14103 (1995)11M Mathews R Jansen G Rijnders J C Lodder and D H A Blank
Phys Rev B 80 064408 (2009)12E J Kim J L R Watts B Harteneck A Scholl A Young A Doran
and SYuri J Appl Phys 109 07D712 (2011)13M Gibert T Puig X Obradors A Benedetti F Sandiumenge and R
Huhne Adv Mater 19 3937 (2007)14C Moreno P Abellan A Hassini A Ruyter A Perez del Pino F San-
diumenge M J Casanove J Santiso T Puig and X Obradors Adv
Funct Mater 19 2139 (2009)15J Zabaleta N Mestres P Abellan M Gibert F Sandiumenge T Puig
and X Obradors Nanotechnology 21 025302 (2010)16C Adamo X Ke H Q Wang H L Xin T Heeg M E Hawley
W Zander J Schubert P Schiffer D A Muller L Maritato and
D G Schlom Appl Phys Lett 95 112504 (2009)17K Steenbeck and R Hiergeist Appl Phys Lett 75 1778 (1999)18Y Suzuki H Y Hwang S W Cheong T Siegrist R B van Dover A
Asamitsu and Y Tokura J Appl Phys 83 7064 (1998)19U Hasenkox C Mitze R Waser R R Arons J Pommer and G Gun-
therodt J Electroceram 3 255 (1999)20I Horcas R Fernandez J M Gomez-Rodriguez J Colchero J Gomez-
Herrero and A M Baro Rev Sci Instrum 78 013705 (2007)21M Jaafar A Asenjo and M Vazquez IEEE Trans Nanotechnol 7 245
(2008)22See http==mathnistgov=oommf= for more information on the micromag-
netic simulations23M C Martin G Shirane Y Moritomo and Y Tokura Phys Rev B 53
14285 (1996)24J Curiale M Granada H E Troiani R D Sanchez A G Leyva
P Levy and K Samwer Appl Phys Lett 95 043106 (2009)25J Smit and H G Beljers Philips Res Rep 10 113 (1955)26S Chikazumi Physics of Magnetism (Wiley New York 1964)27K Steenbeck T Habisreuther C Dubourdieu and J P Senateur Appl
Phys Lett 80 3361 (2002)28R P Cowburn D K Koltsov A O Adeyeye M E Welland and D M
Tricker Phys Rev Lett 83 1042 (1999)
FIG 6 (Color) (a) Phase diagram extracted from MFM measurements showing the magnetic configuration of the self-assembled LSMO nanoislands as a func-
tion of nanoisland dimensions (dashed lines represent a guide to the eye) Micromagnetic simulation results for (b) small (c) medium-size and (d) large nanois-
lands The data scale for all the simulated images is 25 kA=m The blue and red colors correspond to the out of plane magnetization (outwards and inwards
respectively) The magnetization configurations correspond to the islands after saturating along thethornZ (outwards) direction
024307-7 Zabaleta et al J Appl Phys 111 024307 (2012)
Downloaded 30 Jan 2012 to 15024410251 Redistribution subject to AIP license or copyright see httpjapaiporgaboutrights_and_permissions
29A Wachowiak J Wiebe M Bode O Pietzsch M Morgenstern and R
Wiesendanger Science 298 577 (2002)30We have estimated the interaction between a Co coated tip [radius 10
nm and Ms (Co) = 1440 kA=m] and a LSMO nanoisland divided into 8 nm
size elements with Ms (LSMO at 300 K) = 240 kA=m using F=z =P
i
(l06mtipmi)=(pz) where mtip and mi are the magnetic moment of the tip
and the magnetic moment of one of the elements of the nanoisland respec-
tively and z is the distance between the tip and each nanoelement
31R Akiyama H Tanaka T Matsumoto and T Kawai Appl Phys Lett
79 4378 (2001)32B Pigeau G De Loubens O Klein A Riegler F Lochner G Schmidt
L W Molenkamp V S Tiberkevich and A N Slavin Appl Phys Lett
96 132506 (2010)33A Ruotolo V Cros B Georges A Dussaux J Grollier C Deranlot R
Guillemet K Bouzehouane S Fusil and A Fert Nat Nanotechnol 4
528 (2009)
024307-8 Zabaleta et al J Appl Phys 111 024307 (2012)
Downloaded 30 Jan 2012 to 15024410251 Redistribution subject to AIP license or copyright see httpjapaiporgaboutrights_and_permissions
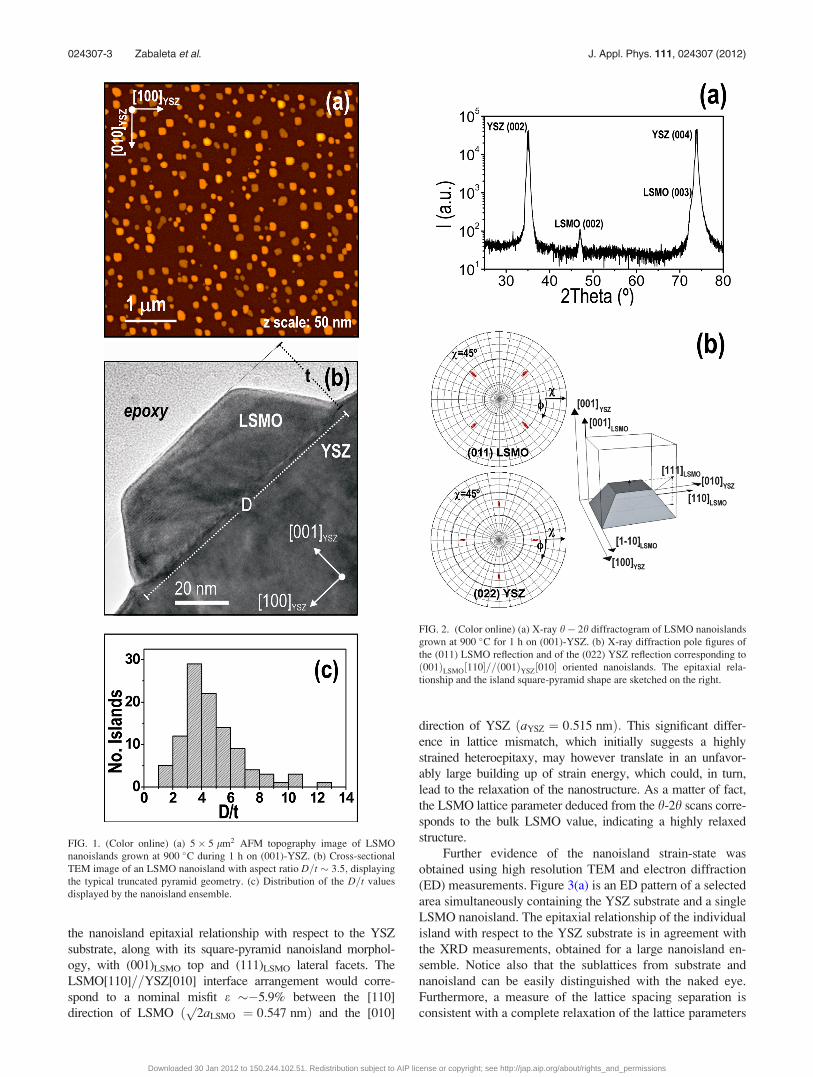
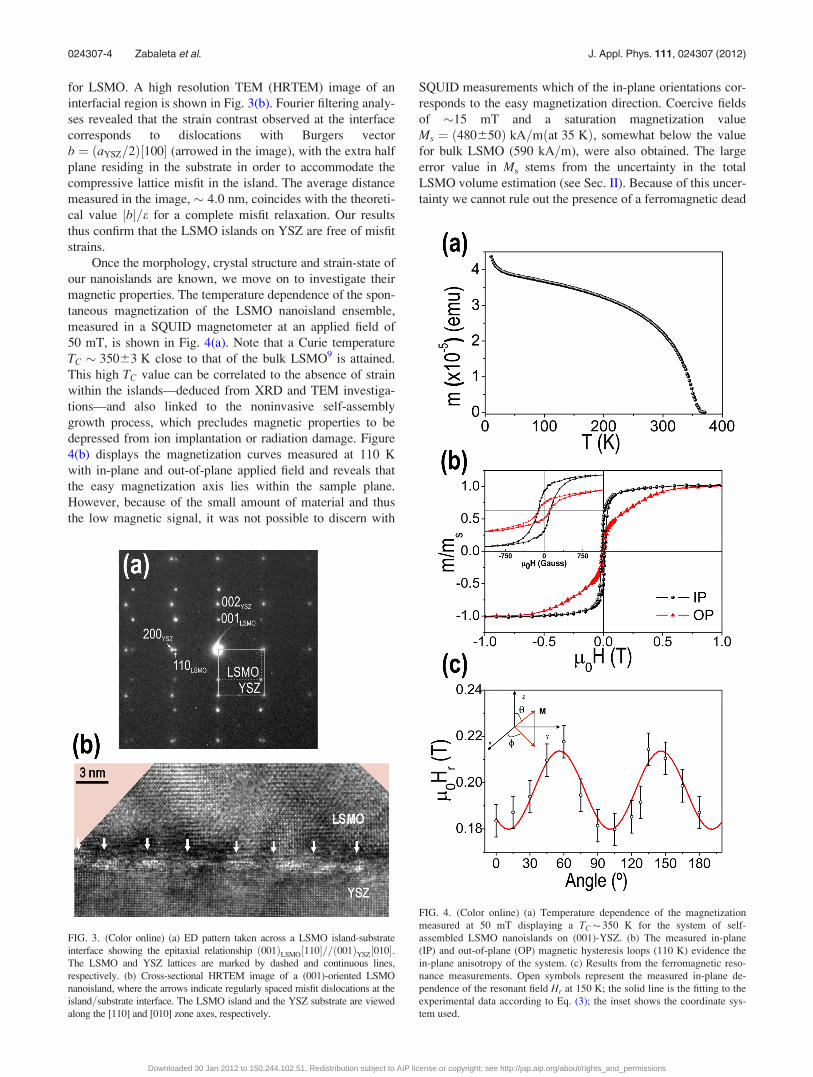
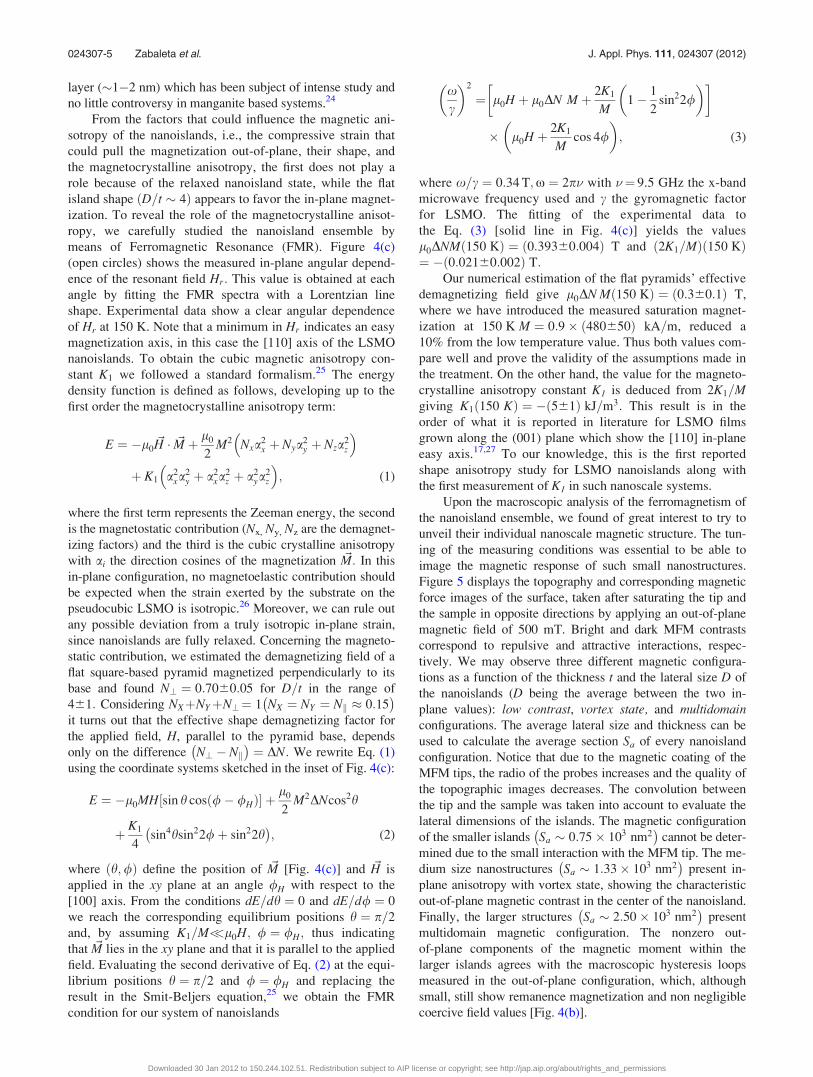
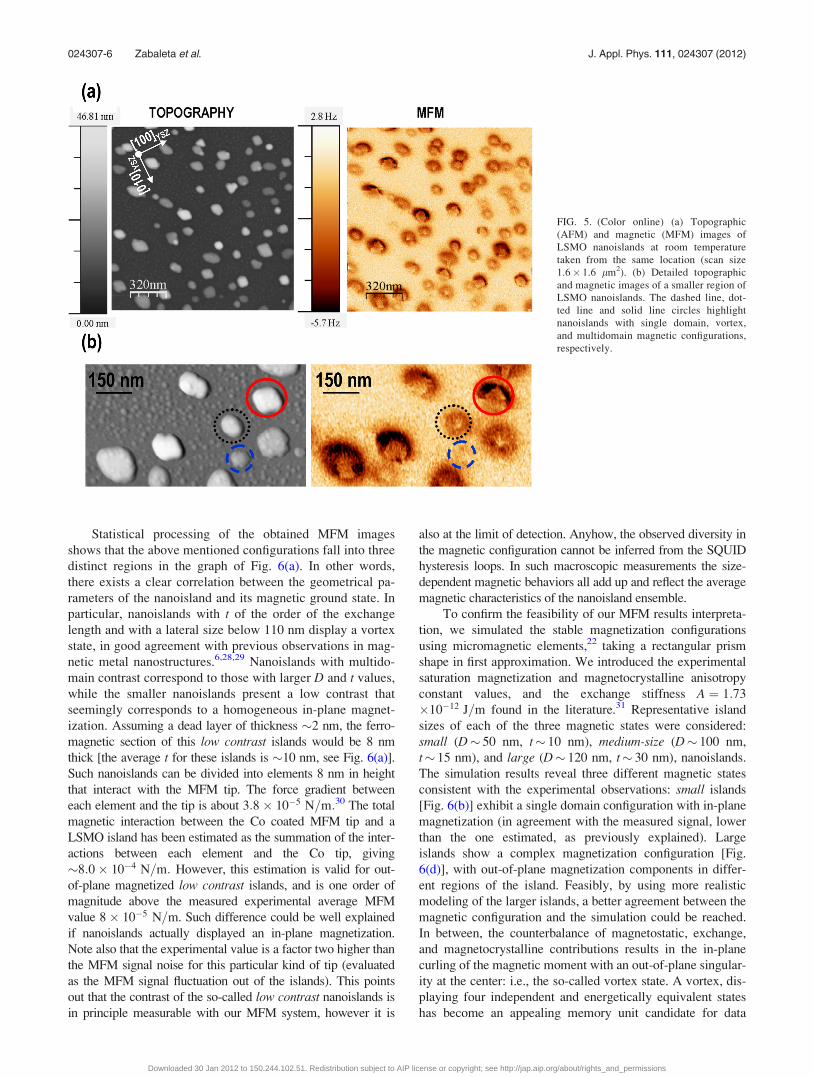