![Storia dell'Arco 2 - [Brovelli] - Dispensa didattica Corso OPS Storico parte seconda- Archi dell'Età del ferro - VI sec.](https://static.fdokumen.com/doc/165x107/63203b9100d668140c0ceeb9/storia-dellarco-2-brovelli-dispensa-didattica-corso-ops-storico-parte-seconda-.jpg)
MNO 3701 Production & Ops Management - StudyNotesUnisa
105
1 MNO 3701 Production & Ops Management Chapter 1 Effective production & Operations Management Operations management is about how organisations produce goods and services. Operations management is the activity of managing the resources which are devoted to the production and delivery of products and services. The operations function is the part of the organisation that is responsible for this activity. Operations managers are the people who have a particular responsibility for managing some, or all, of the resources which comprises operations function See page four of the textbook for the definitions Operations in the organization Operations function is one of the three core functions of any organisation. These are: Marketing function – responsible for communicating the organization’s products and services to market Product/service development function – creating new and modified products and services Operations function – responsible for fulfilling customer requests for service throughout the production and delivery process Support function – enables the core functions to operate effectively. Includes: o Accounting and finance function o Human resources function There is not always a clear division between the three core functions or between core and support functions Working effectively with other parts of the organisation is one of the most important responsibilities of operations management. It is a fundamental of modern management that functional boundaries should not hinder efficient internal processes. The support functions have a different relationship with operations than the other core functions. Operation managements responsibility to support functions is primarily to make sure that they understand operations needs and help them to satisfy these needs See table 1.1 on page five – activities of core functions in some organisations. See figure 1.1 on page six of the textbook Operations management in the small organisation Managing operations in a small or medium sized organisations has its own set of problems. Large companies may have the resources to dedicate individuals to specialized tasks but smaller companies often cannot And informal structure can allow the company to respond quickly as opportunities or problems arise. Operations management in not-for-profit organisations Operations management is also relevant to organisations whose purpose is not primarily to earn profits. Operations have to take the same decisions – how to produce products and services, invest in technology, contract out activities, devise performance measures, improve operations performance etc. The strategic objectives of not-for-profit organisations may be more complex They may be a greater chance of operations decisions being made under conditions of conflicting objectives. www.studynotesunisa.co.za
-
Upload
khangminh22 -
Category
Documents
-
view
0 -
download
0
Transcript of MNO 3701 Production & Ops Management - StudyNotesUnisa

1
MNO 3701 Production & Ops Management
Chapter 1
Effective production & Operations Management
Operations management is about how organisations produce goods and services.
Operations management is the activity of managing the resources which are devoted to the production and
delivery of products and services. The operations function is the part of the organisation that is responsible for this
activity.
Operations managers are the people who have a particular responsibility for managing some, or all, of the
resources which comprises operations function
See page four of the textbook for the definitions
Operations in the organization Operations function is one of the three core functions of any organisation. These are:
Marketing function – responsible for communicating the organization’s products and services to market
Product/service development function – creating new and modified products and services
Operations function – responsible for fulfilling customer requests for service throughout the production and
delivery process
Support function – enables the core functions to operate effectively. Includes:
o Accounting and finance function
o Human resources function
There is not always a clear division between the three core functions or between core and support functions
Working effectively with other parts of the organisation is one of the most important responsibilities of operations
management. It is a fundamental of modern management that functional boundaries should not hinder efficient
internal processes.
The support functions have a different relationship with operations than the other core functions. Operation
managements responsibility to support functions is primarily to make sure that they understand operations needs
and help them to satisfy these needs
See table 1.1 on page five – activities of core functions in some organisations.
See figure 1.1 on page six of the textbook
Operations management in the small organisation
Managing operations in a small or medium sized organisations has its own set of problems. Large companies may
have the resources to dedicate individuals to specialized tasks but smaller companies often cannot
And informal structure can allow the company to respond quickly as opportunities or problems arise.
Operations management in not-for-profit organisations
Operations management is also relevant to organisations whose purpose is not primarily to earn profits.
Operations have to take the same decisions – how to produce products and services, invest in technology,
contract out activities, devise performance measures, improve operations performance etc.
The strategic objectives of not-for-profit organisations may be more complex
They may be a greater chance of operations decisions being made under conditions of conflicting objectives.
www.studynotesunisa.co.za

2
Inputs and outputs
All operations produce products and services by changing inputs into outputs. They do this by using the input
transformation output process.
Transformation process model – describes operations in terms of their input resources, transforming processes and
outputs of goods and services.
Input Resources – transforming and transformed resources that form the input to operations
See figure 1.2 on page nine of the textbook
Inputs to the process
One set of inputs to any operations processes are transformed resources – resources that are treated, transformed
or converted in the process.
Materials
Transformation of the physical properties. Other operations process materials to change their location.
Some retailer operators change the possession of the materials. Some operations store materials i.e.
wharehouse.
Information
Transformation of the informational properties of the inputs – accountants.
Changing the position of the information – marketing and research companies
Store the information – libraries
The location of the information – telecommunication companies
Customers
Changing the physical properties in a similar way to materials – hair stylist or cosmetic surgeon
Accommodating customers – hotels
Transportation and bus companies - transforming the location of customers
Hospitals – transformation of the customer physiological state
Entertainment Centres – music, theatre, television and radio transformations – transforming the
psychological state of the customer.
The other set of inputs to any operations process are transforming resources. These are the resources which act
upon the transformed resources.
The are two types which form the building blocks of all operations:
Facilities – buildngs, equipment, transforming resources, plant and process technology of the operation
Staff –the people who operate, maintain, plan and manage the operation
The exact nature of both facilities and staff would differ between operations.
See table 1.2 on page 10 of the textbook
www.studynotesunisa.co.za

3
Outputs from the process
All processes exist to produce products and services.
The most obvious difference is their respective tangibility – the main characteristic that distinguishes products from
services.
Services may have a shorter stored life. Products can be stored for a time, some Food Products only a few days.
The life of the service is much shorter.
Most operations produce both products and services
Many operations are positioned in the spectrum from pure products producers to pure service producers.
Crude oil – concerned almost exclusively with the product.
Aluminium smelters – may also produce some services such as technical advice (called facilitating services)
An information systems provider may produce software products but primarily it is providing a service to its
customers, with facilitating products.
See figure 1.3 on page 11 of the textbook
Services and products are merging
The distinction between services and products is both difficult to define and not particularly useful. Information
and Communications Technologies are even overcoming some of the consequences of the intangibility of
services.
All operations are service providers who may produce products as a means of serving their customers.
Operations management is about managing processes
Process: an arrangement of resources that produces some mixture of goods and services.
The mechanisms that transform inputs to outputs are called processes.
Any operation is made up of a collection of processes, interconnecting with each other.
See table 1.3 on page 13 of the textbook.
Three levels of operations analysis
Operations management can use the idea of the input-transformation-output model to analyse businesses at
three levels:
Any operation could have several suppliers, several customers and may be in competition with other operations
producing similar services. This collection of operations is called the supply network
Processes are smaller versions of operations, they form an internal network in the same way as whole operations
form a supply network. Each process is, at the same time, an internal supplier and an internal customer for other
processes.
Even within individual processes, materials, information or customers will flow between individuals staff and
resources – hierarchy of operations.
See definitions on page 13 of the textbook.
In reality the relationship between groups and individuals is significantly more complex than that between
commercial entities. One cannot treat internal customers and suppliers exactly as we do external customers and
suppliers.
www.studynotesunisa.co.za

4
The operations management is relevant to all parts of the business
All functions manage processes.
Processes in the other functions also need managing using similar principles to manage the process within the
operations function.
Each will also have an operations ‘process management’ role of producing plans, policies, reporting and services.
All managers have some responsibility for managing processes.
Operations management is relevant for all functions
We must distinguish between two meanings of operations:
Operations as a function – part of the organisation which produces the products and services for external
customers.
Operations as an activity – management of the processes within any of the organization’s functions.
Business processes
End to end business process – customer needs for each product are entirely fulfilled.
Often cuts across conventional organizational boundaries.
Reorganising process boundaries an organization responsibilities around his business processes is the philosophy
behind business process reengineering (BPR)
See definitions on page 15 of the textbook.
Operations processes have different characteristics
Although all operations are similar to do differ in a number of ways:
Volume of the output
Variety of the output
Variation in the demand for their output
The degree of visibility which customers have of the production
Volume
Volume has important implications for the way operations organized, repeatability lot of the tasks people are
doing and the systemization of the work where standard procedures are set down in a manual.
Provides low unit costs
All is standardized and regular which result in relatively low cost.
Variation
The operation must change its capacity in some way by hiring extra staff to cope with the variation in demand.
Visibility
Means process exposure.
How much of the operations activities its customers experience, or how much the operation is exposed.
The bricks and mortar shop operation is a higher visibility operation – custom here have a relatively short waiting
tolerance. They will walk out if not served in a reasonable time
Higher visibility operations require staff with good customer contact skills.
High received variety – customers request goods which are clearly are not sold in a shop but because they are in
the operation they can ask what they like.
In contrast, Internet based shops – far lower visibility. Can be more factory like.
Customer contracts skills – skills and knowledge that operation staff need to meet customer expectations
www.studynotesunisa.co.za

5
Mixed high and low visibility operations
Some operations have both high and low visibility processes within the same operation – airports.Some activities
are totally visible to customers.
There can be a front office environment i.e. ticket sales
Or a back office environment –ie baggage handling
The implications of the four V’s of operations
All four dimensions have implications for the cost of creating the products and services.
Higher volume, low variety, low variation and lower customer contact all help to keep down processing costs.
Conversely, low volume, how variety, high variation and higher customer contact generally carry some kind of
cost penalty for the operation.
The volume dimension is always drawn with its low end at the left.
The position of an operation in the four dimensions is determined by the demand of the market’s it is serving. Most
operations have some discretion in moving themselves on the dimensions.
See figure 1.6 on page 19 of the textbook
The activities of operations management Operations managers have some responsibility for all the activities. The exact nature of the operations functions
responsibilities will, to some extent, depend on the way the organisation has chosen to define the boundaries of
the function. Some general classes of activities that apply to all types of operation:
Understanding the operations strategic objectives
The first responsibility of any operations management team. Developing a clear vision of how the
operations should help the organisation achieve its long-term goals.
Developing an operations strategy for the organization
It is vital the operations managers have a set of general principles which can guide decision-making
towards long-term goals
Designing the operations products, services and processes
The activity of determining the physical form, shape and composition of products, services and processes.
Direct responsibility for the design of products and services may not be part of the operations function.
Planning and controlling the operation
The activity of deciding what the operations resources should be doing and then making sure that they
really do it
www.studynotesunisa.co.za

6
Improving the performance of the operation
Continuing responsibility of all operations managers is to improve the performance of the operation.
The broad responsibilities of operations management
Five the are of particular relevance to operations managers are:
o Effects of globalization
o Pressures for environmental protection
o Increasing relevance of social responsibility
o The need for technology awareness
o How knowledge management is becoming an important part of ops management
Why is operations management so important?
An effective operation can give four types of advantage to the business:
Can reduce the costs of producing products and services
It can increase revenue
It can reduce the amount of investment (capital employed) required to produce the products and
services
Can provide the basis for future innovation through a solid base of operations skills.
The new operations agenda
The four advantages from well run operations have always been important in giving any organisation the means
to for its long-term strategic goals.
Business pressures – operations responses now form a major part of a new agenda for operations. Part of this
agenda of trains which have always existed but have accelerated in recent years such as globalization and
increased cost pressures. Part of the agenda involves seeking ways to exploit new technologies i.e. the Internet
How operations can affect profits
The way operations management performs its activities and have a significant effect on the profitability of any
company.
See table 1. File on page 22 of the textbook
The model operations management
Begin a combined two ideas to develop a model of operations management.
Input – transformation – output model: operations strategy
Categorisation of operations management’s activity areas: operations management
MNO 2601 Production & Ops Management
Chapter 2
Performance objectives of production/operations management
Operations performance objectives
All operations have a range of stakeholders. Stakeholders are the people and groups who may be influenced by,
or may influence, the operations activities.
Some stakeholders are:
www.studynotesunisa.co.za

7
internal – operations employees
External – customers, society, community groups
The five performance objectives
Apply to all types of operations
Quality – satisfying customers by providing error free goods and services
Speed – do things fast
Dependability – do things on time and keep the delivery promise
Flexibility – change far enough and fast enough to meet customer requirements
The quality objective
Quality is consistent conformance to customers’ expectations. Doing things right.
The things which the operation needs to do right will vary according to the kind of operation. Quality is the most
visible part of what an operation does and something the customer finds easy to judge about the operation.
Quality is a major influence on customer satisfaction or dissatisfaction
Quality inside the operation
Satisfying internal customers can be as important as satisfying external customers.
Quality reduces costs – the fewer mistakes, the less time needed to correct them. Less confusion and irritation
Quality increases dependability – the performance objectives of quality has both an external impact which
influences customer satisfaction and an internal impact which leads to stable and efficient processes.
The speed objective
Speed means the elapsed time between customers requesting products and services and the receipt of them.
The main benefit of speedy delivery of goods and services lies in the way it enhances the operations offering to
the customer. The faster customers can have the product or service, the more likely they are to buy it or the more
they will pay for it or the greater the benefit they receive.
Speed increases value for some customers
Speed inside the operation
Fast response to external customers is greatly helped by speedy decision making and speedy movement of
materials and information inside the operation.
Speed reduces inventories – the longer items take to move to a process, the more time they will be waiting and
the higher the inventory will be
Speed reduces risks – the further ahead companies forecast, the more likely they are to get it wrong. The faster
throughput time of the process, the later forecasting can be left.
The dependability objective
Dependability is valued by most customers.
Dependability means doing things in time for customers to receive the goods or services exactly when they are
needed, or at least when they were promised.
Customers might judge the dependability of an operation only after the product or service has been delivered.
Dependability can override all other criteria.
Dependability inside the operation
Internal customers will judge each other’s performance partly by how reliable the other processes are in delivering
material or information on time. Operations where internal dependability is high are more effective than those
which are not.
www.studynotesunisa.co.za

8
Dependability saves time – a manager should always have a plan of a center’s activities devised to keep the
center’s facilities has fully utilized as possible.
Dependability saves money – ineffective use of time will translate into extra cost.
Dependability give stability – the disruption caused you operations by lack of dependability goes beyond time
and cost. It affects the quality of the operations time.
The flexibility objective
Flexibility means being able to change the operation in some way. Changing what the operation does, how it is
doing it or when it is doing it.
Customers will need the operation to change so that it can provide four types of requirements:
Product/service flexibility – operations ability to introduce new or modified products and services
Mix flexibility – operations ability to produce a wide range or mix of products and services
Volume flexibility – operations ability to changes level of output or activities to produce different quantities
or volumes of products and services over time.
Delivery flexibility – the operations ability to change the timing of the delivery of its services or products.
Mass customization
One of the beneficial external effects of flexibility is the increased ability of an operation to do different things for
different customers.
High flexibility is the ability to produce a higher variety of products or services. Normally however it means high
cost.
Higher variety operations do not usually produce in higher volume.
Mass customization – achieved through flexibility in design ie Dell. The ability to produce products or services in
higher volumes, yet vary the specification to the needs of the individual.
Agility
The ability of an operation to respond quickly and at lower cost as market requirements change.
Agility is really a combination of all the five performance objectives but particularly flexibility and speed.
Agility implies that an operation, and the supply chain of which it is a part, can respond to the uncertainty in the
market
Flexibility inside the operation
Flexibility speeds up response – fast service often depends on the operation being flexible
Flexibility saves time
Flexibility maintains dependability – internal flexibility can help to keep the operation on schedule when an
unexpected event disrupt plans.
The cost objective
The lower the cost of producing the goods and services, the lower the price to Customerss.
Low-cost is a universally attractive objective.
The way in which operations management can influence cost will depend largely on where the operation costs
are incurred. The operation will spend its money on staff facilities, technology and equipment and materials.
Keeping operations costs down
Productivity: the ratio of what is produced by an operation or process to what is required to produce it.
www.studynotesunisa.co.za

9
All operations have an interest in keeping the cost as low as he is compatible with the levels of quality, speed,
dependability and flexibility that their customers require. The measure that is most frequently used to indicate how
successful and operation is at doing this is productivity.
Productivity = output from the operation
one input to the operation
This allows different operations to be compared excluding the effects of input costs.
Single factor productivity can include the effects of input costs if the single input factor is expressed in cost terms,
such as labour costs. Total factor productivity is a measure that includes all input factors.
Multi factor productivity = output from the operation
All inputs to the operation
Improving productivity
One obvious way of improving an operations productivity is to reduce the cost of its inputs while maintaining a
level of its outputs. This means reducing the costs of some or all of its transformed and transforming resource
inputs.
Productivity can also be improved by making better use of the inputs to the operation.
All operations are increasingly concerned with cutting out waste.
Cost reduction through internal the effectiveness.
Each of the various performance objectives has several internal effects, but all of them affect cost.
One important way to improve cost performance is to improve the performance of the other operations
objectives.
Fast operations reduce the level of In-process inventory between micro operations, as well as reducing
administrative overheads. Dependable operations do not spring any unwelcome surprises on the internal
customers.
Flexible operation to adapt to changing circumstances quickly and with a disrupting the rest of the operation.
Fixable micro operations can also change over between tasks quickly and without wasting time and capacity.
External effects of the five performance objectives – see figure 2.9 on page 50 of the textbook
The polar representation of performance objectives
A useful way of representing the relative importance of performance objectives for a product and service – see
figure 2.10 A
www.studynotesunisa.co.za

10
This is called the polar representation because the scales which represent the importance of each performance
objectives have the same origin.
The closer the line is to the common origin, the less important is the performance objectives to the operation.
MNO 3701 Production & Ops Management
Chapter 3
What this strategy and what is operations strategy?
Strategic decisions usually mean those decisions which:
Are widespread in their effect on the organization to which the strategy refers
Define the position of the organization related to its environment
Move the organization closer to its long-term goals
Strategy is more than a single decision , it is the total pattern of decisions and actions that influence the long term
direction of the business.
Operations strategy
Operation strategy concerns the pattern of strategic decisions and actions which set the role, objectives and
activities of the Operation
Operations is not the same as operational
Operations are the resources’ that create products and services. Operational is the opposite of strategic,
meaning day-to-day and detailed.
It also convenient to distinguish between the content and process of operation strategy.
The content of operation strategy is the specific decisions and actions which set the operations role, objectives
and activities.
The process of operation strategy is the method that is used to make the specific content decisions
Between them, four perspectives emerge:
Operation strategy is a top down reflection of what the whole group of business wants to do
Operations strategy is a bottom up the activity where operations improvements cumulatively build
strategy.
Operation strategy involves translating market requirements into operations decisions
Operating strategy involves exploiting the capabilities of operations resources in chosen markets
See table 3.1 on page 22 of the study guide
www.studynotesunisa.co.za

11
In strategy formulation, the content school focuses on what the overall strategy of the business or organization
should be.
The process school, is concerned with how the strategy was formulated
The process is also generally referred to as ‘formulating’
Schellenberg – the focus of strategic management in the past has been almost entirely on strategy formulation,
strategy implementation has been ignored.
While the impact of gritty formulating strategies should not be dismissed, this by itself is an insufficient condition for
success.
The strategy must be accomplished before the organizations full potential can be realized.
The contents School perspective focuses on what the implementation is, or on the specific design for the
implementation. The design is the vehicle through which the strategy is translated into reality.
The design can further be seen as the physical reflection of the formulated strategy.
The three most commonly identified tools for implementation are as follows:
The organization or configuration will formal structure
The administrative systems and processes sector is by Jude, rewards and information systems
The leadership characteristics which include top level leadership, interpersonal behavior, participation
and commitment
The process school Perspective is concerned with how the strategy is implemented. It concerns:
The cognitive process of the individuals involved
The social and organizational processes which constrain the choice of structure
The political processes through which power is used to improve the implementation
Organisationalbehaviour is relevant here. Organisationalbehaviourrefers to:
resistance to change
Management by objectives
Personality characteristics
This process is generally referred to as implementing
It may also be worth considering applying the reasoning behind such an analysis to production and operations
strategies.
The top down perspective
A large corporation will need a strategy to position itself in its global, economic, political and social environment.
This will consist of decisions about what types of business the group wants to be in, where it wants to operate and
how to allocate its cash.
These decisions are part of the corporate strategy.
The business strategy guides the business in relation to its customers, markets and competitors.
www.studynotesunisa.co.za

12
Within the business, functional strategies need to consider what part each functions should play in contributing to
the strategic objectives of the business.
See figure 3.2 on page 61 of the textbook
One perspective on operations strategy is that it should take its place in the hierarchy of strategies. Its main
influence will be whatever the business sees as its strategic direction.
Different business objectives would probably result in a very different operations strategy. The role of operations is
largely one of implementing or Operationalising business strategy.
The bottom up perspective
The top-down perspective provides an orthodox view of how functional strategies should be put together.
Although it a convenient way of thinking about strategy, the hierarchial model is not intended to represent the
way strategies are always formulated.
Businesses, when reviewing the strategies, will consult the individual functions within the business about the
constraints and Capabilities.
They may also incorporate the ideas which come from each functions day to day experience.
An alternative view to the top down perspective is that many strategic ideas emerge over time from Operational
experience.
Sometimes company’s move in a particular strategic direction because the ongoing experience of providing
products and services to customers at an operational level convinces them that it is the right thing to do.
They may be no higher level decisions examining alternative strategic options.
Instead, the general consensus emerges from the operational level of the organization. The high level strategic
decision making, may confirm the consensus and provide the resources to make it happen.
This idea of strategy being shaped by operational level experience overtime is sometimes called the concept of emergent strategies
Strategy is credited six over time and based on real life experience rather than theoretical positioning.
While emergent strategies are less easy to categorise, the principle governing a bottom up perspective is clear:
Shape the operations objectives and action by the knowledge it gains from its day to day activities
The virtues required for shaping strategy from the bottom up are:
And ability to learn from experience
The philosophy of continual and incremental improvements
See figure 3.4 on page 63 of the textbook
www.studynotesunisa.co.za

13
The market requirements perspective
Although understanding marketing is usually thought of as the domain of the marketing function, it also of
importance to operations management.
Customer influence on performance objectives
Operations seek to satisfy customers through developing the five performance objectives - called competitive
factors.
Whatever competitive factors are important to customers should influence the priority of each performance
objectives.
See figure 3.5 and page 64 of the textbook
Order winning in qualifying objectives
Are particularly useful way of determining the relative importance of competitive factors is to distinguish between
order winning and qualifying factors.
Order winning factors are those which to reach the and significantly contribute to winning business – regarded by
customers as the key reasons for purchasing the product or service.
Qualifying factors are not the major competitive determinants of success but also critical.
By include those aspects of competitiveness with the operations performance has to be above a particular level
just to be considered by the customer. Performance below the qualifying level will possibly disqualify the
company from being considered by many customers
Any further improvement above the qualifying level will be unlikely to gain the company any more competitive
benefit.
Order winning factors show significant increase in their contribution to competitiveness.
Qualifying factors of Givens – they are expected by customers and can severely disadvantaged the competitive
position if they cannot rise above the qualifying level.
See figure 3.6 on page 66 of the textbook
www.studynotesunisa.co.za

14
The product/Service Life cycle influence on performance objectives
One way of generalizing the behaviour of both customers and competitors is to link it to the life cycle of the
products or services that the operation is producing.
The form of product or Services Life cycles will vary but generally they are shown as the sales volume passing
through four stages.
Introduction
Growth
Maturity
Decline
Introduction stage
When a product or service is introduced it is likely to be offering something new in terms of its design or
performance.
Needs of customers are unlikely to be well understood, so the operations management needs to develop the
flexibility to cope with any changes and provide quality
Growth stage
Is volume grows, competitors may move into the growing market. Keeping up with demand could prove to be
the main operations preoccupation.
Rapid and dependable response to demand will help to keep demand buoyant while quality levels ensure that
the company keeps its share of the market as competition starts to increase.
See figure 3.7 on page 69 of the textbook
Maturity stage
Demand starts to level off. Early competitors may have left the market and the industry is probably dominated by
a few large players.
Operations will be expected to get the cost down in order to maintain profits or allow price cutting.
Cost and productivity issues, together with dependable supply are likely to be the operations main concerns
Decline stage
After time, sales will decline with more competitors dropping onto the market. There might be a residual market
but only if the shortage of capacity develops the market will continue to be dominated by price competition.
Operations objectives continue to be dominated by cost
The operations resources perspective RBV holds that firms with an 'above average' strategic performance are likely to have gainedtheir sustainable
competitive advantage because pf the core competences (or capabilities) of their resource. This means that the
way an organisation inherits, or acquires, or develops its operations resources will, over the long term, have a
www.studynotesunisa.co.za

15
significant impact on its strategic success furthermore, the impact pi its 'operations resource' capabilities will be at
least as great, if not greater, than that which it gets from its market position.
Resource constraints and capabilities I
No organisation can merely choose which part of the market it wants to be in without considering its ability to
produce products and services in a way that will satisfy that marker In other words, the constraints imposed by its
operations must be taken into account
However^ the operations resource perspective is not always so negative.This perspective may identify constraintsto
satisfying some markets but it can also identify capabilitieswhich can be exploited in other markets.
Intangible resources
An operationsresource perspective must start with an understanding of the resource capabilities and constraints
within the operation.
ltmust answer the simple questions 'what do we have and 'what can we do'
A starting point here is to examine the transforming and transformed resource, inputs to the operation.
These, are the 'building blocks' of the operation. However, merely listing the type of resourcesan operation has
does not give a complete picture of what it can do.
Trying to understand an operation by listing its resources alone is like trying to understand a motor car by listing its
component parts.
Within the operation, the equivalent of these mechanisms is its processes
In addition, the operation has some intangible resources. An operation's intangible resources
include such things as its relationship with suppliers, the reputation it has with its customers, its knowledge
of its process technologies and the way Its staff can work together
Structural and infrastructural decisions
A distinction is often drawn between the strategic decisions which determine an operation's structure and those
which determine its infrastructure,
An operation's structural decisionsare those which we have classed as primarily influencing design activities, while
infrastructuraldecisions are those which influence the workforce organisation and the planning and control, and
improvement activities
The best and most costly facilities and technology will be effective only if the operation also has an appropriate
infrastructure which governs the way it will work on a day-to-day basis
Structural strategic
decisions
Typical questions which the strategy should help to answer
New product/service
design
How should the operation decide which products or services to develop and how to manage the development process?
Supply network
design
How should it develop the capabilities of its customers and suppliers?
What capacity should each operation in the network have?
What number of geographically separate sites should the operation have and where
should they be located?
What activities and capacity should be allocated to each plant?
Process Technology What types of process technology should the operation be using?
Should it be at the leading edge of technology or wait until the technology is established?
www.studynotesunisa.co.za
16
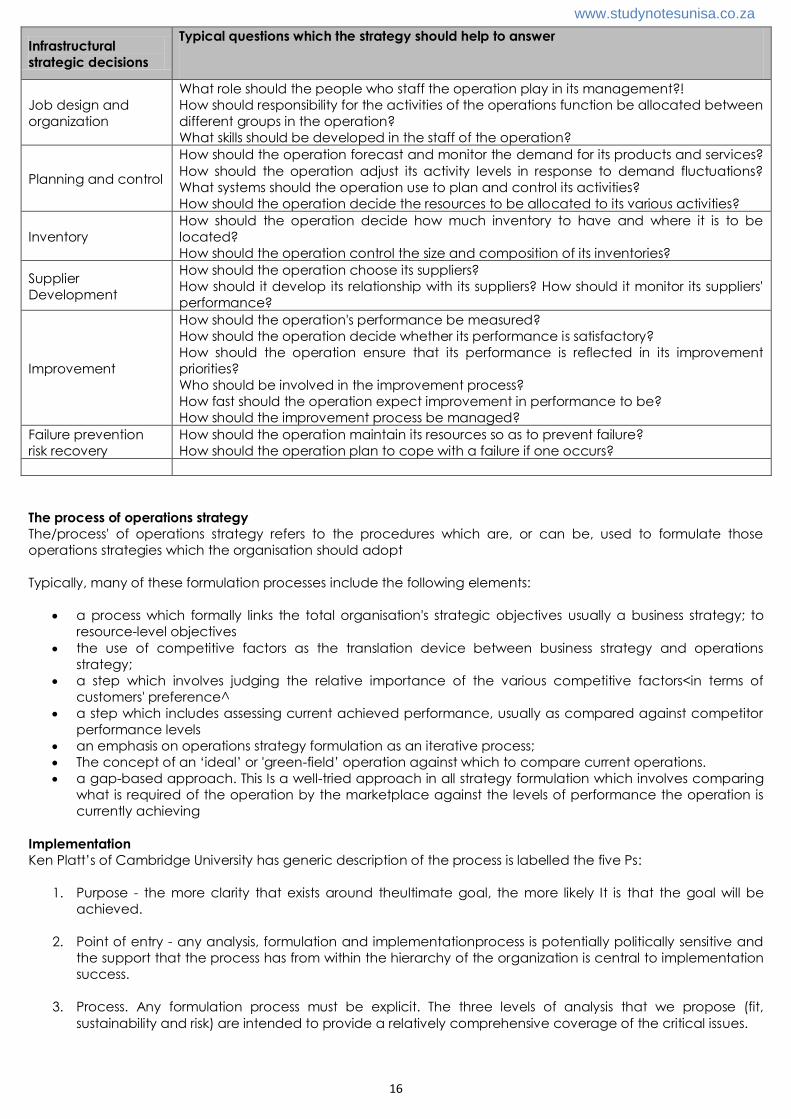
Infrastructural
strategic decisions
Typical questions which the strategy should help to answer
Job design and
organization
What role should the people who staff the operation play in its management?!
How should responsibility for the activities of the operations function be allocated between
different groups in the operation?
What skills should be developed in the staff of the operation?
Planning and control
How should the operation forecast and monitor the demand for its products and services?
How should the operation adjust its activity levels in response to demand fluctuations?
What systems should the operation use to plan and control its activities?
How should the operation decide the resources to be allocated to its various activities?
Inventory
How should the operation decide how much inventory to have and where it is to be
located?
How should the operation control the size and composition of its inventories?
Supplier
Development
How should the operation choose its suppliers?
How should it develop its relationship with its suppliers? How should it monitor its suppliers'
performance?
Improvement
How should the operation's performance be measured?
How should the operation decide whether its performance is satisfactory?
How should the operation ensure that its performance is reflected in its improvement
priorities?
Who should be involved in the improvement process?
How fast should the operation expect improvement in performance to be?
How should the improvement process be managed?
Failure prevention
risk recovery
How should the operation maintain its resources so as to prevent failure?
How should the operation plan to cope with a failure if one occurs?
The process of operations strategy
The/process' of operations strategy refers to the procedures which are, or can be, used to formulate those
operations strategies which the organisation should adopt
Typically, many of these formulation processes include the following elements:
a process which formally links the total organisation's strategic objectives usually a business strategy; to
resource-level objectives
the use of competitive factors as the translation device between business strategy and operations
strategy;
a step which involves judging the relative importance of the various competitive factors<in terms of
customers' preference^
a step which includes assessing current achieved performance, usually as compared against competitor
performance levels
an emphasis on operations strategy formulation as an iterative process;
The concept of an ‘ideal’ or 'green-field’ operation against which to compare current operations.
a gap-based approach. This Is a well-tried approach in all strategy formulation which involves comparing
what is required of the operation by the marketplace against the levels of performance the operation is
currently achieving
Implementation
Ken Platt’s of Cambridge University has generic description of the process is labelled the five Ps:
1. Purpose - the more clarity that exists around theultimate goal, the more likely It is that the goal will be
achieved.
2. Point of entry - any analysis, formulation and implementationprocess is potentially politically sensitive and
the support that the process has from within the hierarchy of the organization is central to implementation
success.
3. Process. Any formulation process must be explicit. The three levels of analysis that we propose (fit,
sustainability and risk) are intended to provide a relatively comprehensive coverage of the critical issues.
www.studynotesunisa.co.za

17
4. Project management - one of the reasons why operations have traditionally not had explicit strategies
relates to the difficulty of releasing sufficient managerial time. The basic disciplines of project
management such as resource and time planning, controls, communication mechanisms, reviews and so
on should be in place
5. Participation - selection of staff to participate in the implementation process is also critical. The use of line
managers can provide ‘real-world' experience and the inclusion of cross-functional managers (and
suppliers, can help to integrate the finished strategy.
The process of operations strategy guides the trade-offs between performance objectives
An important part of operations strategy implementation is how the strategy should address the relative priority of
the operation's performance objectives.
It must consider the possibility of improving its performance in one objective bv sacrificing performance in
another,
But there are two views of trade-offs. The first emphasizes 'repositioning' performance objectives by trading off
improvements in some objectives for a reduction in performance in others.
The other emphasises increasing the 'effectiveness' of the operation by overcoming trade-offs so that
improvements in one or more aspects of performance can be achieved without any reduction in the
performance of others.
Trade-offs and the efficient frontier
The increased complexity that a high variety of product or service offerings brings will generally reduce the
operation's ability to operate efficiently.
Conversely, one way of improving cost efficiency is to severely limit the variety on offer to customers.
The convex line on which operations A, B, C and D lie is known as the efficient frontier'. They may choose to
position themselves differently (presumably because of different market strategies) but they cannot be criticized
for being ineffective'
See figure 3.8 on page 75 of the text book
A strategy that emphasises increasing effectiveness is not confined to those operations that are dominated, such
as operation X
Suppose operation B in Figure 3.8(b) wants to improve both its variety and its cost efficiency simultaneously and
move to position B1 It may be able to do this, but only if it adopts operations improvements that extend the
efficient frontier.
This distinction between positioning on the efficient frontier and increasing operations effectiveness by extending
the frontier is an important one. Any operations strategy- must make clear the extent to which it is expecting the
operation to reposition itself in terms of its performance objectives and the extent to which it is expecting the
operation to improve its effectiveness.
Focus and trade-offs
www.studynotesunisa.co.za

18
An option for some operations is to push their repositioning on the trade-off curve to an extreme in order to ‘focus'
their operations. Operations 'focus' means dedicating each operation to a limited, concise, manageable set of
objectives, products, technologies, or markets, then structuring policies and support services so they focus on one
explicit task rather than on a variety of inconsistent or conflicting tasks.
Concentrating on one or two specific objectives and focusing the operations equipment, systems and
procedures on achieving a more limited range of tasks results in a substantially superior performance in those few
objectives.
'This concept of focus is both powerful and proven because at its heart lies a very simple notion, that many
operations are carrying out too many (often conflicting) tasks. The obvious result is that they are unable to perform
them all with any real degree of success.
The Idea of 'focus' is very similar to the process of market segmentation
The 'operation-within-an-operation' concept
Any decision to focus an operation might appear to carry with it the need to set up completely new operations if
further products/services are added to the range and it is true that in some cases a failure to do this has
undermined successful operations. However, it is not always feasible, necessary or desirable to do this and the
'operation-within-an-operation concept is a practical response that allows an organisation to accrue the benefits
of focus without the considerable expense of setting up independent operations.
The physical separation of products/services will allow the introduction of independent work forces, control
systems, quality standards, etc. In addition, this approach allows for easier supervision, motivation and
accounting.
MNO 3701 Production & Ops Management
Chapter 4
Design of processes for Products & Services
The design activity
The design is to conceive the looks, arrangement and workings of something before is constructed.
At the start of the process design activity, it is important to understand the design objectives.
It is often the only through getting to grips with the detail of a design that the feasibility of its overall shape can be
assessed.
The process design and product/service design are interrelated.
The design of products and services and the design of the processes which make them are clearly interrelated.
The design of a process can constrain the freedom of product and service designers to operate as they wish
The overlap between the two design activities is generally greater and operations which produced services.
Overlapping product and process designs has implications for the organization of the design activity.
See figure 4.2 on page 84 of the textbook.
www.studynotesunisa.co.za

19
Process design objectives
The whole point of process design is to make sure that the performance of the process is appropriate for whatever
it is trying to achieve.
Some kind of logic should link what the operation as a whole is attempting to achieve and the performance
objectives of its individual processes.
Operations performance objectives translate directly to process design objectives – see table 4.1
The time that the units spends in the process (throughput time) will be longer than the sum of all the transforming
activities that it passes through.
Also the resources that perform the process activities may not be used all the time because not all units will
necessarily require the same activities and the capacity of each resource may not match the demands placed
upon it.
Table 4.1 the impact of strategic performance objectives and process design objectives and performance
Quality, speed, dependability, flexibility, cost
It is common for more micro performance flow objectives to be used to describe process flow performance. E.g.
Throughput rate – the rate at which units emerge from the process
Throughput time – averaged elapsed time taken for inputs to move through the process
Number of units in the process – ‘work in process’
Utilization – proportion of available time that the resources with in the process of performing useful work
Environmentally sensitive design
Process and product/Service designers have to take account of green issues
Interest has focused on some fundamental issues:
Sources of inputs
Quantities and sources of energy consumed in the process
The amounts and types of waste material created in the process
The life of the product itself
The end of life of the product – disposal in an environmentally friendly way or recycled for energy
Life cycle analysis: analysis of all the production inputs, life cycle use of a product and its final disposal in terms of
total energy used and waste emitted.
To help make more rational decisions in the design activity, some industries are experimenting with life cycle
analysis. Inputs and wastes are evaluated at every stage in the creation of the product or service
Process’ types - the volume – variety effect on process’ design Usually the two dimensions of volume and variety go together.
Low volume operation processes often have a higher variety of products and services.
High volume operation processes often have a narrow variety of products and services.
There is a continuum from low volume – high variety through to high volume - low variety on which we can
position operations.
www.studynotesunisa.co.za

20
Different operations may adopt different types of processes.
The differences are explained largely by the different volume – variety positions of the operations.
Process types
The position of a process on the volume-variety continuum shapes its overall design and the general approach to
managing its activities.
These general approaches are called process types. Different terms are used to identify process types depending
on whether they are predominantly manufacturing or service processes.
Project processes
Those which deal with discreet, usually highly customized products.
The timescale of making the product or service is relatively long.
Low volume and higher varietion characteristics of project processes. Activities in making the product can be ill
defined and uncertain.
Examples include: shipbuilding, construction companies, movie production
The essence of project processes is that each job has a well defined start and finish, the time interval between
starting different jobs is relatively long and the transforming resource which makes the product will probably have
been organized especially for each product.
The process map for project processes will almost certainly be complex.
See figure 4.3 on page 88 of the textbook
Jobbing processes
Deal with very high variety and lower volumes.
Each product has to share the operations resources with many others.
Examples of jobbing processes: specialist tool makers, furniture restorers, bespoke tailors, special ticket production
The jobbing processes produces usually smaller items than the project processes and the degree of repetition is
lower. Many jobs will be ‘one offs.’
Any process map for a jobbing process will be relatively complex.
Jobbing processes usually produce physically smaller products with possibly considerable skill but such processes
often involve fewer unpredictable circumstances.
The process maps are usually less complex than those for project process.
Batch processes
Often looked like jobbing processes but each time batch processes produce a product they produce more than
one.
The size of the batch could be just two or three but can also be very large. Batch processes can be very
repetitive.
The batch type of process can be found over a wide range of volume and variety levels.
Examples include: machine tool manufacturing, special gourmet frozen foods, component parts in mass
produced assembly lines i.e. cars
Mass processes
Produced goods in the high volume and variety is very low. Example: vehicle assembly plant, DVD production
Continuous processes
One step beyond mass processes – operate at even higher volume and even lower variety for longer periods
www.studynotesunisa.co.za

21
They literally continuous in the by products are inseparable. Associated with relatively inflexible, capital intensive
technologies
Examples: petrochemical refineries, electricity, steelmaking.
Professional services
High contract organisations where customers spend a considerable time in the service process.
High levels of customization.
Professional services tend to be people biased by rather than equipment based
Examples include: management consultants, lawyers, architects, doctors, auditors, IT consulting.
Service Shops
Characterised by levels of customer contact, customization, volumes of customers and staff discretion.
Services provided by mixes of front and back office activities.
Examples include: banks, shops, holiday tour operators, car rental companies, schools
The front office staff have some technical training and can advise customers during the process of selling the
product.
Mass services
Involves many customer transactions, limited contact time and but for customization
Services maybe equipment based and product oriented, with most value added in the back office and relatively
little judgment applied by a front office staff.
Examples include: supermarkets, rail networks, imports, Telecommunications Service, librarys
Textbook page 94 to 95?
High level process mapping – an aggregated process map that shows broad activities rather than detailed
activities.
At the highest level the process can be drawn simply ascan input – transformation – output process.
A slightly lower or more detailed level – outline process map – the sequence of activities are identified but only in
a general way.
See figure 4.15 on page 97 of the textbook
Using process maps to improve processes
One significant advantage of mapping processes is that each activity can be systematically challenged in an
attempt to improve the process.
Textbook page 98 to 99?
Little’s Law
www.studynotesunisa.co.za

22
The Little’s law relationship holds for a wide variety of arrival processes and service time distributions. You only
need to no two of the parameters to calculate the third.
WIP =Tt x Tr
WIP = work in progress
Tt = time available
Tr= throughput rate.
See page 100 and 101 of the textbook for the full calculation and formula
Throughput efficiency
The idea that the throughput time of the process is different from the work content of whatever it is processing has
important implications. This means that for significant amounts of time no useful work is being done to the
materials, information or customers progressing through the process.
Percentage throughput efficiency = Work content x 100
Throughput time
See example on page 101 of the textbook
Value added throughput efficiency
Work content is actually dependent upon the methods and technology used to perform the task. It may also be
the individual elements of a task may not be considered in value added
Value added throughput efficiency restricts the concept of work content to only those tasks that are literary
adding value to whatever is being processed. This often eliminates activities such as movement, delays and some
inspections.
The effects of process variability
It is important to look at the variability that can affect processes and take account of it.
There are many reasons why variability occurs and processes. They can include:
www.studynotesunisa.co.za

23
Later or poorly arrival of material
Information or customers
The temporary malfunction or breakdown of process technology
All these sources of variation interact with each other, the result in two fundamental types of variability:
Variability in the demand for processing-individual stage within the process. Expressed in terms of variation
in the inter arrival times of units to be processed
Variation in the time taken to perform the activities
To understand the effect of arrival variability on process performance in his first useful to examine what happens
to process performance in a very simple process as arrival time changes under conditions of no variability.
See figure 4.17 on page 103 of the textbook.
Relationship between process utilization and number of units waiting to be processed.
However when arrival and process times are variable, sometimes the process will have units waiting to be
processed, while at other times the process will be waiting for unity to arrive.
If the average arrival time we are to be changed with the same variability, the curved line in figure was 4.17
would show the relationship between average waiting time and process utilization
The only way to guarantee very low waiting times is for the units to suffer no process utilization.
The greater the variability in the process, the more the waiting time
See figure 4.18 in the textbook – curves for a typical process. Presents three options to process designers wishing
to improve the waiting time for utilization performance of a process.
Accept long average waiting times and achieve high utilization –point x
Accepting low utilization and achieve short average waiting times – point Y
Reduce the variability in arrival times, activity times or both and achieve high utilization and shorter waiting
times – point Z
An important choice in process design that could have strategic implications: Which is more important to a
business, faster throughput time or high utilization of its resources?
Simulation in design
To increase confidence in the design decision - try to simulate how the process might work in practice.
Simulation is one of the most fundamental approaches to decision making.
Simulation models can take many forms.
www.studynotesunisa.co.za

24
Simulation models: the use of a model of a process, product or service to explore its characteristics before
creation
MNO 3701 Production & Ops Management
Chapter 4
Design of processes for Products & Services
The design activity
The design is to conceive the looks, arrangement and workings of something before is constructed.
At the start of the process design activity, it is important to understand the design objectives.
It is often the only through getting to grips with the detail of a design that the feasibility of its overall shape can be
assessed.
The process design and product/service design are interrelated.
The design of products and services and the design of the processes which make them are clearly interrelated.
The design of a process can constrain the freedom of product and service designers to operate as they wish
The overlap between the two design activities is generally greater and operations which produced services.
Overlapping product and process designs has implications for the organization of the design activity.
See figure 4.2 on page 84 of the textbook.
Process design objectives
The whole point of process design is to make sure that the performance of the process is appropriate for whatever
it is trying to achieve.
Some kind of logic should link what the operation as a whole is attempting to achieve and the performance
objectives of its individual processes.
Operations performance objectives translate directly to process design objectives – see table 4.1
The time that the units spends in the process (throughput time) will be longer than the sum of all the transforming
activities that it passes through.
www.studynotesunisa.co.za

25
Also the resources that perform the process activities may not be used all the time because not all units will
necessarily require the same activities and the capacity of each resource may not match the demands placed
upon it.
Table 4.1 the impact of strategic performance objectives and process design objectives and performance
Quality, speed, dependability, flexibility, cost
It is common for more micro performance flow objectives to be used to describe process flow performance. E.g.
Throughput rate – the rate at which units emerge from the process
Throughput time – averaged elapsed time taken for inputs to move through the process
Number of units in the process – ‘work in process’
Utilization – proportion of available time that the resources with in the process of performing useful work
Environmentally sensitive design
Process and product/Service designers have to take account of green issues
Interest has focused on some fundamental issues:
Sources of inputs
Quantities and sources of energy consumed in the process
The amounts and types of waste material created in the process
The life of the product itself
The end of life of the product – disposal in an environmentally friendly way or recycled for energy
Life cycle analysis: analysis of all the production inputs, life cycle use of a product and its final disposal in terms of
total energy used and waste emitted.
To help make more rational decisions in the design activity, some industries are experimenting with life cycle
analysis. Inputs and wastes are evaluated at every stage in the creation of the product or service
Process’ types - the volume – variety effect on process’ design Usually the two dimensions of volume and variety go together.
Low volume operation processes often have a higher variety of products and services.
High volume operation processes often have a narrow variety of products and services.
There is a continuum from low volume – high variety through to high volume - low variety on which we can
position operations.
Different operations may adopt different types of processes.
The differences are explained largely by the different volume – variety positions of the operations.
Process types
The position of a process on the volume-variety continuum shapes its overall design and the general approach to
managing its activities.
These general approaches are called process types. Different terms are used to identify process types depending
on whether they are predominantly manufacturing or service processes.
Project processes
Those which deal with discreet, usually highly customized products.
The timescale of making the product or service is relatively long.
Low volume and higher varietion characteristics of project processes. Activities in making the product can be ill
defined and uncertain.
www.studynotesunisa.co.za

26
Examples include: shipbuilding, construction companies, movie production
The essence of project processes is that each job has a well defined start and finish, the time interval between
starting different jobs is relatively long and the transforming resource which makes the product will probably have
been organized especially for each product.
The process map for project processes will almost certainly be complex.
See figure 4.3 on page 88 of the textbook
Jobbing processes
Deal with very high variety and lower volumes.
Each product has to share the operations resources with many others.
Examples of jobbing processes: specialist tool makers, furniture restorers, bespoke tailors, special ticket production
The jobbing processes produces usually smaller items than the project processes and the degree of repetition is
lower. Many jobs will be ‘one offs.’
Any process map for a jobbing process will be relatively complex.
Jobbing processes usually produce physically smaller products with possibly considerable skill but such processes
often involve fewer unpredictable circumstances.
The process maps are usually less complex than those for project process.
Batch processes
Often looked like jobbing processes but each time batch processes produce a product they produce more than
one.
The size of the batch could be just two or three but can also be very large. Batch processes can be very
repetitive.
The batch type of process can be found over a wide range of volume and variety levels.
Examples include: machine tool manufacturing, special gourmet frozen foods, component parts in mass
produced assembly lines i.e. cars
Mass processes
Produced goods in the high volume and variety is very low. Example: vehicle assembly plant, DVD production
Continuous processes
One step beyond mass processes – operate at even higher volume and even lower variety for longer periods
They literally continuous in the by products are inseparable. Associated with relatively inflexible, capital intensive
technologies
Examples: petrochemical refineries, electricity, steelmaking.
Professional services
High contract organisations where customers spend a considerable time in the service process.
High levels of customization.
Professional services tend to be people biased by rather than equipment based
Examples include: management consultants, lawyers, architects, doctors, auditors, IT consulting.
Service Shops
Characterised by levels of customer contact, customization, volumes of customers and staff discretion.
Services provided by mixes of front and back office activities.
www.studynotesunisa.co.za

27
Examples include: banks, shops, holiday tour operators, car rental companies, schools
The front office staff have some technical training and can advise customers during the process of selling the
product.
Mass services
Involves many customer transactions, limited contact time and but for customization
Services maybe equipment based and product oriented, with most value added in the back office and relatively
little judgment applied by a front office staff.
Examples include: supermarkets, rail networks, imports, Telecommunications Service, librarys
Textbook page 94 to 95?
High level process mapping – an aggregated process map that shows broad activities rather than detailed
activities.
At the highest level the process can be drawn simply ascan input – transformation – output process.
A slightly lower or more detailed level – outline process map – the sequence of activities are identified but only in
a general way.
See figure 4.15 on page 97 of the textbook
Using process maps to improve processes
One significant advantage of mapping processes is that each activity can be systematically challenged in an
attempt to improve the process.
Textbook page 98 to 99?
Little’s Law
The Little’s law relationship holds for a wide variety of arrival processes and service time distributions. You only
need to no two of the parameters to calculate the third.
WIP =Tt x Tr
WIP = work in progress
Tt = time available
Tr= throughput rate.
See page 100 and 101 of the textbook for the full calculation and formula
www.studynotesunisa.co.za
28
Throughput efficiency
The idea that the throughput time of the process is different from the work content of whatever it is processing has
important implications. This means that for significant amounts of time no useful work is being done to the
materials, information or customers progressing through the process.
Percentage throughput efficiency = Work content x 100
Throughput time
See example on page 101 of the textbook
Value added throughput efficiency
Work content is actually dependent upon the methods and technology used to perform the task. It may also be
the individual elements of a task may not be considered in value added
Value added throughput efficiency restricts the concept of work content to only those tasks that are literary
adding value to whatever is being processed. This often eliminates activities such as movement, delays and some
inspections.
The effects of process variability
It is important to look at the variability that can affect processes and take account of it.
There are many reasons why variability occurs and processes. They can include:
Later or poorly arrival of material
Information or customers
The temporary malfunction or breakdown of process technology
All these sources of variation interact with each other, the result in two fundamental types of variability:
Variability in the demand for processing-individual stage within the process. Expressed in terms of variation
in the inter arrival times of units to be processed
Variation in the time taken to perform the activities
To understand the effect of arrival variability on process performance in his first useful to examine what happens
to process performance in a very simple process as arrival time changes under conditions of no variability.
See figure 4.17 on page 103 of the textbook.
Relationship between process utilization and number of units waiting to be processed.
www.studynotesunisa.co.za

29
However when arrival and process times are variable, sometimes the process will have units waiting to be
processed, while at other times the process will be waiting for unity to arrive.
If the average arrival time we are to be changed with the same variability, the curved line in figure was 4.17
would show the relationship between average waiting time and process utilization
The only way to guarantee very low waiting times is for the units to suffer no process utilization.
The greater the variability in the process, the more the waiting time
See figure 4.18 in the textbook – curves for a typical process. Presents three options to process designers wishing
to improve the waiting time for utilization performance of a process.
Accept long average waiting times and achieve high utilization –point x
Accepting low utilization and achieve short average waiting times – point Y
Reduce the variability in arrival times, activity times or both and achieve high utilization and shorter waiting
times – point Z
An important choice in process design that could have strategic implications: Which is more important to a
business, faster throughput time or high utilization of its resources?
Simulation in design
To increase confidence in the design decision - try to simulate how the process might work in practice.
Simulation is one of the most fundamental approaches to decision making.
Simulation models can take many forms.
Simulation models: the use of a model of a process, product or service to explore its characteristics before
creation
MNO 3701 Production & Ops Management
Chapter 6 (same as Chap 10 in MNO270-1 + Chap 10 in TB)
General Nature of Planning and Control in Operations: A Review
www.studynotesunisa.co.za

30
Study Notes Wiki MNO 3701 - Study Unit 10: General nature of planning and control in operations
What is planning and control o Planning and control is the reconciliation of the potential of the operation to supply products and services, and the
demand of its customers on the operation. It is the set of day to day activities that runs the operation on an ongoing basis
What is the difference between planning and control o A plan is a formalization of what is intended to happen at some time in the future. Control is the process of coping
with changes to the plan and the operation to which it relates. Although planning and control are theoretically separable they are usually treated together
o The balance between planning and control changes over time. Planning dominates in the long term and is usually done on an aggregated basis. At the other extreme in the short term, control usually operates within the resource constraints of the operation but makes interventions into the operation in order to cope with short term changes in circumstances
How does the nature of demand affect planning and control o The degree of uncertainty in demand affects the balance between planning and control. The greater the uncertainty
the more difficult it is to plan and greater emphasis must be placed on control o This idea of uncertainty is linked with the concepts of dependent and independent demand. Dependent demand is
relatively predictable because it is dependent on some known factor. Independent demand is less predictable because it depends on the changes of the market or customer behaviour
o The different ways of responding to demand can be characterized by differences in the P:D ratio of the operation. This is the ration of total throughput time of goods or services to demand time
What is involved in planning and controlling o Loading – dictates the amount of work allocated to each part of the operation o Sequencing – decides the order of work o Scheduling – detailed timetable of activities o Monitoring and control – push/pull control
Nature of supply and demand in operations o some operations are reasonably predictable and run to plan, so the need for control is minimal. In others, supply
and/or demand may be unpredictable and it may, therefore, become necessary to rethink plans quite often and to increase control activities.
o Dependent and independent demand dependent demand is relatively predictable because it is dependent upon some factor which is known, so
dependent demand planning and control concentrate on the consequences of the demand within the operation.
independent demand operations will supply demand without having any firm idea of customers' orders. The business/organisation therefore runs the risk of being out of stock of items because demand may exceed the available stock. This is normal for independent demand planning and control where, by means of inventory, the operation attempts to respond quickly by putting resources in place to satisfy demand.
o Difference in planning activities for Resource to order – operations that buy in resources and produce only when there is a demand Create to order or make to order – operations that produce products only when they are demanded Made to stock – operations that produce products prior to there being demand
o P:D ratios Determining the P:D ratios (P for ``total throughput time'' and D for ``demand time'') for various operations is
another way of characterising the relationship between the time when a customer/client ``asks'' for a product/service and the time it takes the operation to obtain the resources and produce and/or deliver the product/service.
High P:D ratios generally mean that the operations need a long time before they can respond to customers/clients needs. These operations normally also have a higher degree of uncertainty in their planning and control activities as the result of the longer time span involved in ``order-by-customer/client-to-production/delivery-by-operation''
Planning and control tasks o Planning and control require the reconciliation of supply and demand in terms of
(a) loading, whichmeans determining the amount of work allocated to the work centre. (b) sequencing, whichmeans determining the order in which work will be performed. (c) scheduling, whichmeans deciding on detailed timetables of start and finish dates
o loading In working out the loading the difference between maximum available time and valuable operating time (eg
of a machine) takes into consideration certain unavoidable losses in time (public holidays, weekends, equipment idling, set-up and changeover - planned times of unproductivity, etc) and avoidable losses in time
www.studynotesunisa.co.za

31
(quality losses, slow running equipment, breakdown, failure - unplanned times of unproductivity, etc) in well-run operations.
finite loading is ``an approach which only allocates work to a work centre up to a set limit'', which is the estimate of the capacity of the work centre. Infinite loading is ``an approach to loading work which does not limit accepting work, but tries to cope with it''
o sequencing when priorities are given to work in an operation, some predefined set of rules may apply, or physical
constraints (physical nature of materials being processed) may determine the priority. This predefined set of sequencing rules includes:
Customer/client priority sequencing is when important or aggrieved customers/clients are processed prior to others, irrespective of the order of arrival
DD sequencing is when work is sequenced according to the due date for delivery, irrespective of the size of each job or importance of the customer/client.
LIFO sequencing is when work is selected for practical reasons ,meaning those last in move out first.
With FIFO sequencing customers/clients are served as they arrive - this is also known as first-come-first-served.
LOT sequencing is when jobs that take the longest are done first
SOT is usually when cash constrained operations do the shortest jobs first to invoice, receive payment quicker and improve cash £low
the five performance objectives may also be used to judge the effectiveness of the sequencing rules. These performance objectives include dependability (meeting dues dates promised), speed (minimizing the time a job spends in process) and cost minimizing work-in-process inventory and minimizing idle time at work centres).
o scheduling scheduling activity is considered to be one of the most complex tasks in production/operations management,
because it deals with several different types of resources simultaneously (eg machines with different capabilities and capacities) and the number of possible schedules increase rapidly as the number of activities and processes increase.
forward scheduling involves starting work as soon as it arrives, while backward scheduling involves starting the jobs at the last possible moment. In theory both MRP (material requirements planning) and JIT (just-in-time) use backward scheduling, which means that the work is only started when it is required.
o after a plan has been created for the operation through loading, sequencing and scheduling, each part of the operation has to be monitored to ensure that the planned activities do take place. Any deviation from the plans must be rectified through some kind of intervention and may involve replanning.
o An important distinction is made between intervention signals that push work through the process within the operation (work is pushed out without considering whether the succeeding work centre can use it and idle time occurs - inventory build-up and queues may result) and intervention signals that pull work only when it is required (the customer works as trigger to pull the work from the preceding work station).
MNO 3701 Production & Ops Management
Chapter 7(same as Chap 112 in MNO270-1 + Chap 14 in TB)
Enterprise Resource Planning Study Notes Wiki MNO 3701 Study Unit 12: Enterprise resource planning
what is ERP o an enterprise wide info system that integrates all the info from many functions that is needed for planning and
controlling operations activities. This integration around a common database allows for transparency
how did ERP develop o latest development from the original planning and control approach called materials requirements planning (MRP)
what is MRP o a dependent demand system which calculates materials requirements and production plans to satisfy known and
forecast sales orders o it is a master production schedule which summarizes volume and timing of end products or services
What is MRP II
www.studynotesunisa.co.za

32
o Systems that integrate many processes that are related to MRP but which are located outside the operations function
How is ERP developing o It is becoming increasingly competent at the integration of internal systems but there is significant potential for
integrations with other organization’s ERPs o The internet has opened up the possibility of a web-based integration
The concept of enterprise resource and planning o ERP stands for Enterprise Resource Planning and is the most recent development that evolved from the original
material requirements planning (MRP), which as a system helped calculate the quantity and types of materials required (or volume calculations) and the times when they are required (or the timing calculations).
o To ``make sure that the right materials in the right quantities arrive at the right place at the right time'' requires ``planning and control, not only of materials but also finance, purchasing, people, equipment and many other activities''. ERP helps organizations to plan ahead for these types of decisions and to understand the implications of any changes to the plan. It integrates information from all parts of the organization
o In ERP systems, the same principle of MRP applies on a much wider scale, because all the parts of the organisation are integrated on the same databases. As the result, the consequences of any
o Decisions affecting the planning and control in one part of the organization will be reflected throughout the rest or other parts of the organization.
o The internet has opened up the possibility of a web-based integration (cross-organizational)
Information inputs and outputs of MRP o The inputs to MRP I are the
(a) master production schedule (MPS),which provides information on demand, has as its inputs customer/client orders, which provide information on firm orders scheduled and the demand forecast, which provides information on realistic estimates of the quantity
and timing of future orders (b) bills of materials, which provide information on the product structure (level, part number, description and
quantity) (c) inventory records, which provide information on the parts or items that are already in stock in the form of
finished goods, work in progress or rawmaterials, components, etc o The outputs of MRP I are
(a) purchase orders, which show the quantity and time required for the net requirements of items, raw materials, components, parts, etc, that are bought from suppliers
(b) materials plans, which show the material requirements at each level and part or component of the bill ofmaterials for each product
(c) work orders, which show the net requirements for items, components, parts, etc, that aremade in-house o Demand management
Demand management combines the management of customer orders and sales forecasts, which feeds into the MPS and encompasses the set of processes that interface with customer andmarket.
confirmed customer orders reflect the records of exactly what each customer has ordered, how many they have ordered and when they require delivery (known orders)
The forecast of demand tries to predict what the likely orders (forecast orders) will be. The combination of confirmed customer orders and forecast of demand is used to represent demand for the organization.
The mix of known orders and forecast orders will also be different for different types of operations.
In a make-to-order business, the visibility of known orders over timewillbegreater than for themake-for-stockbusiness.
For the purchase-to-order business, most raw materials will only be ordered once confirmed customer orders are received.
In a resource-to-order business, raw materials will not be ordered, and the business will not enter into contracts for labour and equipment.
o The master production schedule Inputs into the MPS include
Forecast demand
Known orders
Key capacity constraints inventory levels
Spares demand
Safety stock requirements
Exhibition/promotion requirements
R&D Demand
Sister plant demand Chase or level MPSs
www.studynotesunisa.co.za

33
The MPS increases as demand increases and aims to keep available inventory at 0 – in this way the MPS is chasing demand
An alternative level MPS involves averaging the amount to be required to be completed to smooth out peaks and troughs
APT is the stock available to promise – in the chase level this is 0 as there is no additional stock; in level MPS, this is what ever is left over
Refer to page 442 in txt and 105 in SG for calcs o Product structure and the levels of assembly
The product structure will show the various parts that go into making the final or end product and, in MRP terms, it will break down the finished product into different levels of assembly with
level 0 - being the finished product,
level1 - the parts and subassemblies that go into making the finished product, level 2 - the parts and subassemblies that go into level 1
the shape of the component structure
the nature of the product structure is closely related to the design of the product. This is reflected in the component structure shape
the shape is determined by the number of components and parts used at each level as well as the amount of the item made in-house
o ``A'' shape - only one finished product which goes into a greaternumberof components (low variety);
o ``T'' shape – small number of raw materials and a standard process with a very wide range of highly customized end products;
o ``V'' shape - like the ``T'' shape, but with less standardization; o ``X'' shape - a wide range of finished products with economies and stability of large volume
production of modularized manufactured components). o Bills of material
single-level bills of materials provide the details of the relationships between parts and subassemblies at one single level at a time (All of 0;then 1;then 2)
indented bills of materials provide the details of the relationships between parts and subassemblies at several levels at a time (all together 0;1; 2). It is indented as .1 or ..2.
o inventory management Three files kept in the MRP system help manage inventory, namely
the item master file (contains the unique standard identification code for each part or component),
the transaction file (which tracks the quantity of inventory of each part kept)
the location file (identifies where the parts of inventory are physically kept
or stored).
MPR calculations o the core of the MRP procedure involves calculating the volume of (how much) and timing (when or at which time)
requirements of materials that will satisfy the demand for the finished or end products o MPR Netting Process
This is the process for calculating net requirements using the MPS and bills of material The MRP netting process takes the master production schedule and ``explodes'' the schedule through a
single-level bill of materials to determine how many subassemblies or parts are required. Before moving down to the next level of the product structure, it checks to see how many of the required
parts are already in stock. Then it generates work orders or requests for the net requirements of items made in-house and/or purchase orders for the net requirements for items that are bought from suppliers.
o Back scheduling (lead time) in addition to calculating the volume of materials required, the MRP must also consider when these parts are
required, or the time and scheduling of thematerials. This is done by back-scheduling from the time when the finished or end products are required. It means that
the lead times (time allowed for the completion of each stage of the process) for each part that goes into the assembly are taken into account.
See pg 450 txt and 209 SG for example o The MRP process needs checking to determine whether a plan is achievable. The ``closed-loop'' MRP thus includes a
feedback loop that facilitates the checking of production plans against available resources. Should the plans not be achievable at any level, they are revised through three planning routines.
o These are resource requirements plans (RRP), rough-cut capacity plans (RCCP) and capacity requirements plans (CRP). RRP focus on the long term to predict the requirements for large structural parts of the operation and are referred to as infinite capacity plans as they assume an almost infinite ability to set
up production capacity if demand warrants it.
www.studynotesunisa.co.za

34
RCCP are referred to as ¢nite capacity plans because they have to operate within certain constraints. In the medium to short term, the MPS must use the capacity that is vailable and RCCP check the levels of capacity against known bottlenecks.
CRP are infinite capacity plans in that they do not take the capacity constraints of each machine or work area into account. With CRP, the work orders may have a variable effect on the loading of particular machines and individual workers on a day to day basis.
o the difference between material requirements planning (MRP I), manufacturing resource planning (MRP II) and enterprise resource planning (ERP)
MRP was essentially aimed at the planning and control of production and inventory in manufacturing organizations.
It was extended to MRP II, which is one integrated system containing a database that could be accessed by the whole business, including marketing, finance and engineering.
ERP is a further development of MRP II. Its aimis to ``integrate themanagement of the different functions within the business as a whole in order to improve the performance of all the interrelated
processes in a business''.
Enterprise resource planning o ERP and benefits and disadvantages
ERP is a complete system of software support modules that integrates marketing, sales, product design, production and inventory control, procurement, distribution, process design and development, manufacturing, quality, human resource, finance and accounting, etc and enables the sharing of information among these functions.
The ERP discipline of a much enhanced visibility that information integration gives, is seen as a ``double-edged'' sword. On one hand it keeps the management of every process within the organization ``on their toes'' and allows for best practices, but on the other, the rigidity of this discipline is both difficult to achieve and possibly not appropriate for all parts of the business.
Generally, accepted benefits include: absolute visibility of what is happening in all parts of the business; business process-based changes that are used to make all parts of the organisation more efficient; a better ``sense of control'' of operations as the basis for continuous improvement; more sophisticated and accurate communicationwith customers, sup-
pliers and other business partners; and the integration of whole supply chains including suppliers' suppliers and customers' customers.
ERP is further considered to be a powerful planning and control tool because it is based on client/server architecture (the information systems are open to all stakeholders whose computers are linked to the central computer); it includes decision support facilities (decision makers have access to the latest company information); it can be linked to external extranet systems (the company's supply chain partners through electronic data interchange [EDI]); it can interface with other standard application programmes (programmes which are widely used by managers like spreadsheets, etc); and it is able to operate on most common platforms (operating systems like Windows, etc)
the implementation of ERP can result in a negative or even zero return on investment in some companies because of the high expense of the software and associated expenses of consulting, training, etc.
In addition the implementation of ERP may have a very disruptive impact on the existing organisation. o Further developments
an ERP system gives the organization the potential to link up with the ``outside world'' (its customers/clients and suppliers).
It would therefore be much easier for an organization to move to Internet-based trading (e-commerce) if it could integrate its external Internet systems with its internal ERP systems. While problems resulting from different information requirements (internal users, external customers/clients, suppliers, etc) may lead to increased ERP complexity, the next step is to integrate all ERP systems along thewhole supply chain (``supply chain ERP'').
o Acknowledging constraints The OPT (optimized production technology) approach recognizes the importance of planning to known
capacity constraints. It is based on the Theory of Constraints (TOC),which entails focusing on the capacity constraints or
bottlenecks in an operation, working to remove them, and then looking for the next constraint, etc to improve the pace of output or throughput
Principles of OPT
Balance flow not capacity
The level of utilization of a non-bottle neck is determined by some other constraint in the system no by its own capacity
Utilization and activation of a resource are not the same – utilization is only if it contributes to the entire process
One hour lost in a bottleneck is an hour lost forever out of the entire system
www.studynotesunisa.co.za

35
Bottlenecks govern throughput and inventory in the system
You do not have to transfer batches in the same quantities that you produce them
The size of the process batch should be variable not fixed
Fluctuations in sequence dependent processes add to each other rather than averaging out
Schedules should be established by looking at all constraints simultaneously o To what extent are OPTand MRP/ERP compatible
OPT should not be viewed as a replacement for MRP/ERP, and they can run together, though conflict may arise in practice.
MRP/ERP does not prescribe fixed lead times and batch sizes, though the systems are usually run that way. The focus on bottlenecks (which may change their location and severity because of the dynamic nature of unplanned variations in demand, supply and the process of manufacture) necessitates that lead times and batch sizes change throughout the operation (depending on whether a particular work centre is a bottleneck or not).
See text book for all calculations…
MNO 3701 Production & Ops Management
Chapter 8
Lean Operations & JIT
What is lean and just-in-time?
The key principle of lean operations is relatively straightforward to understand - it means moving towards the
elimination of all waste in order to develop an operation that is faster, more dependable, produces higher-quality
products and services and, above all, operates at low cost.
Often used interchangeably with 'lean' - just-in-time or sometimes lean synchronisation. At its most basic, JIT can
be taken literally. It means producing goods and services exactly when they are needed: not before they are
needed so that they wait as inventory, nor after they are needed so that it is the customers who have to wait.
JIT aims to meet demand instantaneously, with perfect quality and no waste.
The main argument against this traditional approach lies in the very conditions it seeks to promote, namely the
insulation of the stages from one another. When a problem occurs at one stage, the problem will not immediately
be apparent elsewhere in the process
Here items are worked on and then passed directly to the next stage 'just-in-time'. Problems at any stage have a
very different effect in such a process.
One result of this is that the responsibility for solving the problem is no longer confined to the staff at stage A but is
now shared by everyone.
By preventing inventory from accumulating between stages, the operation has increased the chances of the
intrinsic efficiency of the plant being improved.
Although simplified, this example highlights the differences between a traditional and a JIT approach.
Traditional approaches seek to encourage efficiency by protecting each part of the operation from disruption.
Long, uninterrupted runs are its ideal state. The JIT approach takes the opposite view.
Exposure of processes to problems can both make them more evident and change the 'motivation structure' of
the whole system towards solving the problems.
JIT sees inventory as a 'blanket of obscurity' which lies over the processes and prevents problems being noticed
www.studynotesunisa.co.za

36
(b) JIT approach
JIT and capacity utilisation
Even in advanced lean operations, achieving high standards in all performance objectives demands some
sacrifice. In JIT the main sacrifice is capacity utilisation.
When stoppages occur in the traditional system, the buffers allow each stage to continueworking and thus
achieve high capacity utilisation. The high utilisation does not necessarily make the process as a whole produce
more. Often extra 'production' goes into buffer inventories.
In a lean process, any stoppage will affect the whole process. This will necessarily lead to lower capacity
utilisation, at least in the short term.
There is no point in producing output just for its own sake. Unless the output is useful and causes the operation as a
whole to produce saleable products, there is no point in producing it anyway. In fact, producing just to keep
utilisation high is not only pointless, it is counter-productive because the extra inventory produced merely serves to
make improvements less likely
See figure 15.4 on page 437 of the text book
Lean - a philosophy and a set of JIT techniques
Lean can be viewed as a philosophy of operations management.
It gives a clear view which can be used to guide the way operations are managed in many different contexts.
Within this philosophy there is a collection of many tools and techniques that both implement and support the
lean philosophy. These techniques are more generally called just-in-time techniques.
The lean philosophy
The lean approach to managing operations is founded on doing the simple things well, on gradually doing them
better and on squeezing out waste every step of the way.
Three key issues define the lean philosophy that in turn underpins the techniques of JIT:
the elimination of waste,
the involvement of staff in the operation
the drive for continuous improvement.
See Figure 15.5 on page 438 of the text book
www.studynotesunisa.co.za

37
Eliminate waste
Waste can be defined as any activity which does not add value. Two simple devices are commonly used in lean
improvement. One, 'the seven forms of waste', is concerned with identifying waste as the first step towards
eliminating it; the other, 'the 5Ss', is a simple set of principles for reducing waste.
The seven forms of waste
Toyota has identified seven forms of waste, which have been found to apply in many different types of operations
- both service and production - and which form the core of lean philosophy.
Over-production. Producing more than is immediately needed by the next process in the operation is the
greatest source of waste according to Toyota.
Waiting time. Equipment efficiency and labour efficiency are two popular measures which are widely used
to measure equipment and labour waiting time, respectively.
Transport. Moving items around the operation, together with the double and triple handling of WIP, does
not add value..
Process. The process itself may be a source of waste..
Inventory. All inventory should become a target for elimination.
Motion. An operator may look busy but sometimes no value is being added by the work.
Defectives. Quality waste is often very significant in operations.
The 5Ss
The 5-S terminology comes originally from Japan and although the translation into English is
approximate, they are generally taken to represent the following:
1. Sort (Seiri). Eliminate what is not needed and keep what is needed.
2. Straighten (Seiton). Position things in such a way that they can be easily reached whenever they are
needed.
3. Shine (Seiso). Keep things clean and tidy; no refuse or dirt in the work area.
4. Standardise (Seiketsu). Maintain cleanliness and order - perpetual neatness.
5. Sustain (Shitsuke). Develop a commitment and pride in keeping to standards.
The 5Ss can be thought of as a simple housekeeping methodology to organise work areas that focuses on visual
order, organisation, cleanliness and standardisation.
Helps to eliminate all types of waste relating to uncertainty, waiting, searching for relevant information, creating
variation and so on.
By eliminating what is unnecessary and making everything clear and predictable, clutter is reduced, needed
items are always in the same place and work is made easier and faster.
Throughput time
Throughput time is often taken as a surrogate measure for waste in a process.
The longer that items being processed are held in inventory, moved, checked or subject to anything else that
does not add value, the longer they take to progress through the process
Value stream mapping
Value stream mapping is a simple but effective approach to understanding the flow of material and information
as a product or service has value added as it progresses through a process, operation or supply chain.
It visually maps a product or services 'production' path from start to finish. It records not only the direct activities of
creating products and services but also the 'indirect' information systems that support the direct process.
www.studynotesunisa.co.za

38
It is called 'value stream' mapping because it focuses on value-adding activities and distinguishes between value-
adding and non-value-adding activities. It is similar to process mapping but different in four ways:
it uses a broader range of information than most process maps;
it is usually at a higher level (5-10 activities) than most process maps;
it often has a wider scope, frequently spanning the whole supply chain;
It can be used to identify where to focus future improvement activities.
A value stream perspective involves working on (and improving) the 'big picture' rather than just optimising
individual processes. Value stream mapping is seen by many practitioners as a starting point to help recognise
waste and identify its causes.
It is a four-step technique that identifies waste and suggests ways in which activities can be streamlined.
First, it involves identifying the value stream (the process, operation or supply chain) to map.
Second, it involves physically mapping a process, then above it mapping the information flow that enables the
process to occur. This is the so-called 'current state' map.
Third, problems are diagnosed and changes suggested making a future state map that represents the improved
process, operation or supply chain. Finally, the changes are implemented.
The type of data collected here does vary, but all types of value stream map compare the total throughput time
with the amount of value added time within the larger process.
See FIGURE 15.6 Value stream map for an industrial air-conditioning installation service – page 441
The involvement of everyone
Lean philosophy is often put forward as a 'total' system. Its aim is to provide guidelines which embrace everyone
and every process in the organisation.
An organisation's culture is seen as being important in supporting these objectives through an emphasis on
involving all of the organisation's staff.
New culture is sometimes seen as synonymous with 'total quality. The lean (and JIT) approach to people
management has also been called the respect-for-humans system.
It encourages team-based problem solving, job enrichment, job rotation and multiskilling.
The intention is to encourage a high degree of personal responsibility, engagement and 'ownership' of the job.
Continuous improvement - Kaizen
Lean objectives are often expressed as ideals, such as our previous definition: 'to meet demand instantaneously
with perfect quality and no waste'.
Without such beliefs to drive progress, lean proponents claim improvement is more likely to be transitory than
continuous. This is why the concept of continuous improvement is such an important part of the lean philosophy.
If its aims are set in terms of ideals which individual organisations may never fully achieve, then the emphasis must
be on the way in which an organistaion moves closer to the ideal state.
JIT Techniques
Adopt basic working practices
www.studynotesunisa.co.za

39
Basic working practices can be considered as the method of operationalising the ‘involvement of everyone' lean
principle. They are held to be the basic preparation of the operation and its staff for implementing JIT. They
include the following:
Discipline - Work standards must be followed by everyone all the time.
Flexibility - should be possible to expand responsibilities to the extent of people's capabilities.
Equality - Unfair and divisive personnel policies should be discarded.
Autonomy- Delegate increasing responsibility to people involved in direct activities of the business, so that
management's task becomes one of supporting the shop floor. Delegation means such things as giving
direct line staff the responsibility for stopping processes in the event of problems, scheduling work and
materials arrival, gathering performance-monitoring data and general problem solving.
Development of personnel - to create more company members who can support the rigours of being
competitive.
Quality of working life (QWL) - involvement in decision making, security of employment, enjoyment and
working area facilities.
Creativity - one of the indispensable elements of motivation.
Total people involvement - Staff take on much more responsibility to use their abilities to the benefit of the
company as a whole.
Design for ease of processing Design improvements can dramatically reduce product cost through changes in the number of components and
sub-assemblies and better use of materials and processing techniques.
Emphasise operations focus
The concept behind operations focus is that simplicity, repetition and experience breed competence.8 Focus
within operations means:
learning to focus each process on a limited, manageable sets of products, technologies, volumes and
markets
learning to structure operations objectives and those of all supporting services so that they are focused
and coherent rather than being inconsistent and conflicting.
Use small, simple machines
Small machines have several advantages over large ones.
They can process different products and services simultaneously.
The system is also more robust. If one large machine breaks down the whole system ceases to operate. If one of
the three smaller machines breaks down, it is still operating at two-thirds effectiveness. Small machines are also
easily moved
Layout for smooth flow
The smooth flow of materials, data and people in the operation is important in JIT.
Long process routes around an operation provide opportunities for delay and inventory build-up, add no value to
the products and slow down the throughput time of products.
www.studynotesunisa.co.za

40
Typical lean layout techniques include placing workstations close together so that inventory cannot build up,
placing workstations in such a way that all those who contribute to a common activity are in sight of each other,
using U-shaped lines.
Adopt total productive maintenance (TPM)
Total productive maintenance aims to eliminate the variability in operations processes caused by the effect of
unplanned breakdowns.
Achieved by involving everyone in the search for maintenance improvements.
Process owners are encouraged to assume ownership of their machines and to undertake routine maintenance
and simple repair tasks. By so doing, maintenance specialists can then be freed to develop higher-order skills for
improved maintenance systems.
Reduce setup times
Defined as the time taken to change over the process from one activity to the next
Setup reduction can be achieved by a variety of methods such as cutting out time taken to search for tools and
equipment, the pre-preparation of tasks which delay changeovers and the constant practice of setup routines.
Setup time reduction is also called single minute exchange of dies (SMED)
The other common approach to setup time reduction is to convert work which was previously performed while the
machine was stopped (called internal work) to work that is performed while the machine is running (called
external work).
There are three major methods of achieving the transfer of internal setup work to external work:
pre-set tools so that a complete unit is fixed to the machine instead of having to be built up while the
machine is stopped.
All adjustment should be carried out externally, so that the Internal setup is an assembly operation only
attach the different tools to a standard fixture. Enables the internal setup to consist of a simple and
standardised assembly operation.
facilitate the loading and unloading of new tools by using simple devices such as roller conveyors.
Ensure visibility
The more transparent an operation is, the easier it is for all staff to share in its management and improvement.
A particularly important technique used to ensure visibility of quality problems is the use of visual signals to indicate
when a problem occurs and usually stops the process.
See Table 15.1 in the TB - 447
Operation The lean/JIT approach management activities
Operations strategy Be clear about operations objectives and adopt a 'focus' strategy
where possible so that processes concentrate on a narrow set of
products, services or objectives.
Process design Ensure smooth flow along processes and fast throughput by
working on small batches and balancing capacity and flow.
www.studynotesunisa.co.za

41
Product/service design Design for ease of processing (called design for manufacturability
in many industries).
Supply strategy and supply Encourage other parts of the supply chain to adopt lean principles,
despatch small consignments frequently rather than largereceive
andconsignments infrequently.
Layout Reduce the distance travelled along a process route as much as
possible and make routes obvious.
Process technology Use small flexible process equipment, preferably that can be
moved into different configurations.
Job design Concentrate on equipping staff with necessary skills, being clear
what is expected and encourage autonomy.
Process planning and
control
Use pull control principles, produce nothing until it is needed.
Inventory Minimiseinventory wherever possible because it obscures problems
and slows throughput.
Improvement Improvement must be continuous. It is the momentum of
improvement which is more important than the rate of
improvement. Maintenance All unexpected breakdown is waste; concentrate on preventing
disruption through total productive maintenance (Chapter 19).
Quality management All errors are further sources of waste; everyone in the operation
must be involved in reaching an error-free state.
JIT planning and control
PoorInventory timing causes unpredictability in an operation which, in turn, causes waste because people
hold stock, capacity or time to protect themselves Inventory timing is governed by the two schools of
thought: push planning and control, and pull planning and control.
JIT planning and control Is based on the principle of a pull system’, while the MRP approach to planning
and control, described in the previous chapter. Is a 'push system'.
Kanban control
Kanban has sometimes been used as being equivalent to 'JIT planning and control' i which It is not) or
even to the whole of JIT.
Kanban control is one method of operationalising a pull-based planning and control system. Kanban is
the Japanese for card or signal.
In its simplest form, it is a card used by a customer stage to instruct its supplier stage to send more
materials. Kanbans can also take other forms. In some Japanese companies, they are solid plastic
markers or even colouredping-pong balls,
There are also different types of kanban:
The move or conveyance kanban. A move kanban is used to signal to a previous stage that
material can be withdrawn from inventory and transferred to a specific destination.
www.studynotesunisa.co.za

42
The production kanban. This is a signal to a production process that it can start producing a part or
item to be placed in an inventory. The information contained on this type of kanban usually
includes the particular part's name and number, a description of the process itself, the materials
required for the production of the part and the destination to which the part or parts need to be
sent when they are produced.
The vendor kanban. These are used to signal to a supplier to send material or parts to a stage. In
this way. it is similar to a move kanban but it is usually used with external suppliers.
Whichever kind of kanban is being used, the principle is always the same; that is, that the receipt of a
kanban triggers the movement, production or supply of one unit or a standard container of units.
Other variants include container-as-kanban and colour-coded tokens
There are two procedures which can govern the use of kanbans.
Known as the singlecard system and the dual-card system.
The single-card system is most often used because it is by far the simplest system to operate. Uses only
move kanbans (or vendor kanbans when receiving supply of material from an outside source).
The dual-card system uses both move and production kanbans
The single-card system
At each stage there is a work centre and an area for holding inventory. All production and inventory are
contained In standard containers, all of which contain exactly the same number of parts.
The arrival of the empty containers at stage A's work centre is the signal for production to take place at
work centre A. The move kanban is taken from the holding box back to the output stock point of stage A.
This acts as authorisation for the collection of a further full container to be moved from the output stock of
stage
A through to the work centre at stage B. Two closed loops effectively control the flow of materials
between the stages.
The move kanban loop keeps materials circulating between the stages, and the container loop connects
the work centres with the stock point between them and circulates the containers, full from A to B and
empty back from B to A
See figure 15.8 on page 449 of the TB
The number of kanbans put into the loops between the stages or between the stock points and the work
centres is equal to the number of containers in the system and therefore the inventory which can
accumulate. Taking a kanban out of the loop has the effect of reducing the inventory.
Levelled scheduling
Heijunka is the Japanese word for levelled scheduling so that mix and volume are even over time
The principle of levelled scheduling is straightforward but the requirements to put it into practice are quite
severe, although the benefits resulting from it can be substantial
The batch of Bs is started but is not finished until day 4. The remainder of day 4 is spent making the batch
of Cs and both batches are despatched at the end of that day. The cycle then repeats itself. The
consequence of using large batches is, first, that relatively large amounts ofinventory accumulate within
and between the units, and second, that most days are different from one another in terms of what they
are expected to produce
If the flexibility of the unit could be increased so the batch sizes were reduced to a quarter of their
previous levels a batch of each product can now be completed in a single day.
Synchronisation
www.studynotesunisa.co.za

43
Very similar to levelled scheduling and means the pacing of output at each stage in the production
process to ensure the same flow characteristics for each part or product as it progresses through each
stage. To do this, parts need to be classified according to the frequency with which they are demanded.
One method of doing this distinguishes between runners, repeaters and strangers:"
• Runners are products or parts which are produced frequently, such as every week.
• Repeaters are products or parts which are produced regularly, but at longer time intervals.
• Strangers are products or parts which are produced at irregular and possibly unpredictable time
intervals.
There are advantages in trying to reduce the variability of timing intervals.
The aim for producing runners and repeaters is to synchronise processes so that production appears to
take place on a 'drum beat' pulse.
It might even be better to slow down faster operations than to have themproduce more than can be
handled in the same time by the next process. In this way, output is
made regular and predictable
Mixed modelling
Also related to levelled scheduling is mixed modelling or the repeated mix of parts.
It means that ultimately processes can be made so flexible that they achieve the JIT ideal of a 'batch size
of one'.
The sequence of individual items emerging from a process could be reduced progressively until it
produced a steady stream of each item flowing continuously.
Levelled delivery schedules
A similar concept to levelled scheduling can be applied to many transportation processes. For example,
a chain of convenience stores may need to make deliveries of all the different types of products it sells
every week.
An alternative would be to despatch smaller quantities of all products in a single truck more frequently.
Then each store would receive smaller deliveries more frequently, inventory levels would be lower and the
system could respond to trends in demand more readily because more deliveries means more
opportunity to change the quantity delivered to a store.
JIT in service operations
Inventory
Of material (queue of
material)
Of information (queue
of information)
Of customers
(queue of people)
Cost Ties up working capital Less current information
and so worth less
Wastes customer's
time
Space Needs storage space Needs memory
capacity Needs waiting area
Quality Defects hidden,
possible damage
Defects hidden,
possible data
corruption
Gives negative
perception
Decoupling Makes stages
independent
Makes stages
independent
Promotes job
specialization/
fragmentation
Utilization Stages kept busy by
work- in-progress
Stages kept busy be
work in data queues
Servers kept busy by
waiting customers
www.studynotesunisa.co.za

44
Coordination Avoids need for
synchronization
Avoids need for
straight- through
processing
Avoids having to
match supply and
demand
JIT and MRP
The operating philosophies of MRP and JIT do seem to be fundamentally opposed. JIT encourages a 'pull'
system of planning and control, whereas MRP is a 'push' system.
JIT has aims which are wider than the operations planning and control activity, whereas MRP is essentially
a planning and control 'calculation mechanism'.
Yet the two approaches can reinforce each other in the same operation, provided their respective
advantages are preserved.
Key characteristics of MRP
MRP is generally used as a push system.
MRP uses orders derived from the master schedule as the unit of control.
MRP systems usually need a complex, centralised computer-based organisation to support the
necessary hardware, software and systems. This can make the needs of the customer appear
remote to staff whose responsibilities lie two or three levels down the organisation structure.
MRP is highly dependent on the accuracy of data derived from bills of materials, stock records
and so on.
MRP systems assume a fixed operations environment, with fixed lead times which are used to
calculate when materials should arrive at the next operation
Key characteristics of JIT
The flow between each stage in the manufacturing process is 'pulled' by demand from the
previous stage.
The control of the pull between stages is accomplished by using simple cards, tokens or empty
squares to trigger movements and production. This results in simple, visual and transparent control.
Decision making for operations control is largely decentralised; tactical decisions do not rely on
computer-based information processing.
JIT scheduling is 'rate-based'
JIT assumes (and encourages) resource flexibility and minimised lead times.
JIT planning and control concepts are only one part of a wider and explicit JIT philosophy of
operations
JIT and MRP similarities and differences
JIT scheduling aims to connect the new network of internal and external supply processes by means of
invisible conveyors so that parts move only in response to coordinated and synchronised signals derived
from end-customer demand.
MRP seeks to meet projected customer demand by directing that items are produced only as needed to
meet that demand.
MRP is driven by the master production schedule, which identifies future end-item demand.
Its output is in the form of time-phased requirements plans that are centrally calculated and coordinated.
While MRP is excellent at planning, it is weak at control.
www.studynotesunisa.co.za

45
455
JIT scheduling aims to meet demand instantaneously through simple control systems based on kanban.
If the total throughput time (P) is less than the demand lead time (D), then JIT systems should be capable
of meeting that demand. But if the P:D ratio is greater than 1, some speculative production will be
needed.
MRP is also better at dealing with complexity, as measured by numbers of items being processed..
JIT pull scheduling is less capable of responding instantaneously to changes in demand as the part count,
options and colours increase.
JIT production systems favour designs based on simpler product structures with high parts commonality.
Such disciplines challenge needless complexity.
Separate systems for different products
MRP is then necessary only for strangers, for which works orders are issued to identify what must be done
at each stage, and then the work itself is monitored to push materials through manufacturing stages.
Advantage of this is that by increasing responsiveness and reducing inventories, it makes it worthwhile to
increase their number by design simplification.
MRP for overall control and JIT for internal control
MRP planning of supplier materials aims to ensure that sufficient parts are in the pipeline to enable them
to be called up 'just-in-time'.
Master production schedule is broken down by means of MRP for supplier schedules, while actual
materials requirements for supplies are signalled by means of kanban to facilitate JIT delivery.
Within the factory, all materials movements are governed by kanban loops between operations. The
'drum beat' for the factory is set by the factory assembly schedule.
The complexity determinant
Simple product structures which have routings with high repeatability are prime candidates for pull
control. JIT can easily cope with their relatively straightforward requirements.
Prime candidates for pull control are materials which are used regularly each week or each month. Their
number can be increased by design standardization.
As structures and routings become even more complex and parts usages become more irregular, so the
opportunities for using pull scheduling decrease. Very complex structures require networking methods like
PERT.
See figure 15.11 on page 455 of the textbook
MNO 3701 Production & Ops Management
Chapter 9
Assuring Quality in Production and Operations Management Systems
What is quality and why is it so important?
Professor David Garvin2 has categorised many of the various definitions into 'five approaches' to quality: the
transcendent approach, the manufacturing-based approach, the user-based approach, the product-based
approach and the value-based approach.
www.studynotesunisa.co.za

46
The transcendent approach - views quality as synonymous with innate excellence. Quality is being defined
as the absolute - the best possible, in terms of the product's or service's specification.
The manufacturing-based approach - is concerned with making products or providing services that are
free of errors and that conform precisely to their design specification.
The user-based approach - is concerned with making sure that the product or service is fit for its purpose.
This definition demonstrates concern not only for its adherence to specification but also for the
appropriateness of that specification for the customer.
The product-based approach - views quality as a precise (and measurable) set of the characteristics
which will satisfy customers.
The value-based approach - takes the manufacturing definition a stage further and defines quality in
terms of cost and price.
Quality - the operation's view
Quality is consistent conformance to customers' expectations.
The word 'conformance' implies that there is a need to meet a clear specification ensuring a product or service
conforms to specification is a key operations task. '
Consistent' implies that conformance to specification is not an ad hoc event but that the materials, facilities and
processes have been designed and then controlled to ensure that the product or service meets the specification
using a set of measurable product or service characteristics.
The use of 'customers' expectations' attempts to combine the user- and value-based approaches.4 It recognises
that the product or service must meet the expectations of customers, which may indeed be influenced by price.
The use of the word 'expectations' in this definition, rather than needs or wants, is important. 'Wants' would imply
that anything the customer desires should be provided by the organisation. 'Needs' implies only the meeting of a
basic requirement
Quality - the customer's view
One problem with basing our definition of quality on customer expectations is that an individual customer's
expectations may be different. Past experiences, individual knowledge and history will all shape their
expectations.
Customers, on receiving the product or service, mayeach perceive it in different ways.
Quality needs to be understood from a customer's point of view because, to the customer, the quality of a
particular product or service is whatever he or she perceives it to be.
In some situations, customers may be unable to judge the 'technical' operational specification of the service or
product. They may then use surrogate measures as a basis for their perception of quality.
Customer may in reality perceive quality in terms of such things as the dress and demeanor of the dentist and
technician and how they were treated.
Reconciling the operation's and the customer's views of quality
The operation's view of quality is concerned with trying to meet customer expectations.
The customer's view of quality is what he or she perceives the product or service to be. To create a unified view,
quality can be defined as the degree of fit between customers' expectations and customer perception of the
product or service.
If the product or service experience was better than expected then the customer Is satisfied and quality is
perceived to be high.
www.studynotesunisa.co.za

47
If the product or service was less than his or her expectations then quality is low and the customer may be
dissatisfied. If the product or service matches expectations then the perceived quality of the product or service is
seen to be acceptable.
Both customers' expectations and perceptions are influenced by a number of factors, some of which cannot be
controlled by the operation and some of which, to a certain extent, can be managed.
This model of customer-perceived quality can help us understand how operations can manage quality and
identifies some of the problems in so doing.
These two domains meet in the actual product or service, which is provided by the organisation and experienced
by the customer. Within the operation's domain, management is responsible for designing the product or service
and providing a specification of the quality to which the product or service has to be created.
Within the customer's domain, his or her expectations are shaped by such factors as previous experiences with the
particular product or service, the marketing image provided by the organisation and word-of-mouth information
from other users.
These expectations are internalised as a set of quality characteristics.
Diagnosing quality problems
If the perceived quality gap is such that customers' perceptions of the product or service fail to match their
expectations of it, then the reason/s must lie in other gaps elsewhere in the model. Four other gaps could explain
a perceived quality gap between customers' perceptions and expectations.
In South Africa, in particular, there is a focus on 'service delivery' in the public sector
Gap 1: The customer's speciflcation-operation's specification gap
May be a mismatch between the organisation’s own internal quality specification and the specification which is
expected by the customer
Gap 2: The concept-specification gap
Pticrtvcd quality could be poor because there is a mismatch between the product or service concept (see
Chapter Si and the way the organisation has specified the quality of the product or service internally
Gap 3: The quality specification-actual quality gap
Perceived quality could be poor because there is a mismatch between the actual quality of the service or
product provided by the operation and its internal quality specification.
This may be the result, eg, an inappropriate or unachievable specification, or of poorly trained or inexperienced
personnel, or because effective control systems are not in place to ensure the provision of defined levels of
quality.
Gap 4: The actual quality-communicated image gap
Perceived quality could also be poor because there is a gap between the organisation's external
communications or market image and the actual quality of the service or product delivered to the customer.
This may be the result of either the marketing function setting unachievable expectations in the minds of
customers or operations not providing the level of quality expected by the customer.
The organisational responsibility for closing the gaps
The existence of any one of these gaps is likely to result in a mismatch between expectations and perceptions
and, consequently, in poor perceived quality. It is therefore important that managers take action to prevent
quality gaps.
The organisational responsibility for closing quality gaps
Gap Action required to ensure high perceived quality Main organisational
responsibility
www.studynotesunisa.co.za

48
Cap 1
Ensure that there is consistency between the internal quality
specification of the product or service and the expectations of
customers
Marketing
Operations
Product/service development
Cap 2 Ensure that the internal specification of the product or service
meets its intended concept or design
Marketing
Operations
Product/service development
Cap 3 Ensure that the actual product or service conforms to its
internally specified quality level Operations
Cap 4 Ensure that the promises made to customers concerning the
product or service can in reality be delivered by the operation Marketing
Conformance to specification
Conformance to specification means producing a product or providing a service to its design specification.
During the design of any product or service, its overall concept, purpose, package of components and the
relationship between the components will have been specified
Step 1 Define the quality characteristics of the product or service.
Step 2 Decide how to measure each quality characteristic.
Step 3 Set quality standards for each quality characteristic.
Step 4 Control quality against those standards.
Step S Find and correct causes of poor quality.
Step 6 Continue to make improvements.
Step 1 - Define the quality characteristics
Much of the 'quality' of a product or service will have been specified in its design. But not all the design details are
useful in controlling quality.
Consequences for quality planning and control of the design are called the quality characteristics of the product
or service.
Functionality means how well the product or service does its job. This includes its performance and features.
Appearance refers to the sensory characteristics of the product or service:.
Reliability is the consistency of the product's or service's performance over time, or the average time for which it
performs within its tolerated band of performance. Durability means the total useful life of the product or service,
assuming occasional repair or modification. Recovery means the ease with which problems with the product or
service can be rectified or resolved. Contact refers to the nature of the person-to-person contact which might
take place
Quality characteristics of the total package
Many services are a whole package of several elements, each of which will have their own quality characteristics.
Some aspects of quality may be influenced by two or more elements within the total package. To understand the
quality characteristics of the whole package.
Step 2 - Decide how to measure each characteristic
These characteristics must be defined in such a way as to enable them to be measured and then controlled. This
involves taking a very general quality characteristic such as 'appearance' and breaking it down, as far as one
can, into its constituent elements.
Appearance' is difficult to measure as such, but 'colour match', 'surface finish' and 'number of visible scratches'
are all capable of being described in a more objective manner. They may even be quantifiable.
www.studynotesunisa.co.za

49
The process of disaggregating quality characteristics into their measurable sub-components, however, can result
in the characteristics losing some of their meaning.
Customers will react to more factors than these: for example, the shape and character of a product.
Many of the factors lost by disaggregating 'appearance' into its measurable parts are those which are
embedded in the design of the product rather than the way it is produced.
Some of the quality characteristics of a product or service cannot themselves be measured at all.
Variables and attributes
The measures used by operations to describe quality characteristic* are of two types: variables and attributes
Variable measures are those that can be measured on a continuously variable scale
Attributes are those which are assessed by judgement and are dichotomous, i.e. have two states
Step 3 - Set quality standards
When operations managers have identified how any quality characteristic can be measured, they need a quality
standard against which it can be checked: otherwise they will not know whether it indicates good or bad
performance
While it might seem to be appropriate to have an absolute standard - that is, perfection - and indeed strive for it,
to use perfection as an operational standard could be both demoralising and expensive.
Most manufactured products and delivered services are not 'perfect'
The quality standard is that level of quality which defines the boundary between acceptable and unacceptable.
Such standards may well be constrained by operational factors such as the state of technology in the factory,
and the cost limits of making the product. At the same time, however, they need to be appropriate to the
expectations of customers.
Step 4 - Control quality against those standards
After setting up appropriate standards the operation will then need to check that the products or services
conform to those standards.
As far as operations managers are concerned, this involves three decisions:
1. Where in the operation should they check that it is conforming to standards?
2. Should they check every product or service or take a sample?
3. How should the checks be performed?
Where should the checks take place?
The key task for operations managers is to identify the critical control points at which the service, products or
processes need to be checked to ensure that the product or services will conform to specification.
There are three main places where checks may be carried out: at the start of the process, during the process and
after the process.
At the start of the process the incoming transformed resources could be inspected to make sure that they are to
the correct specification.
During the process checks may take place at any stage, or indeed all stages, but there are a number of
particularly critical points in the process where inspection might be important:
• before a particularly costly part of the process;
• before a series of processes during which checking might be difficult;
• immediately after part of the process with a high defective rate or a fail point;
• before a part of the process that might conceal previous defects or problems;
• before a 'point of no return', after which rectification and recovery might be impossible;
• before potential damage or distress might be caused before a change in functional responsibility
www.studynotesunisa.co.za

50
Checks may also take place after the process itself to ensure that the product or service conforms to its
specification or that customers are satisfied with the service they have received.
Check every product and service or take a sample?
Next decision is how many of the products or services to sample.
While it might seem ideal to check every single product being produced or every service being delivered, there
are many good reasons why this might not be sensible:
It might be dangerous to inspect the whole item or every constituent part.
The checking of every single product or every customer might destroy the product or interfere with the
service.
Checking every product or service can be both time-consuming and costly.
The use of 100 per cent checking, moreover, does not guarantee that all defects or problems will be identified, for
a number of reasons.
Making the checks may be inherently difficult.
Staff may become fatigued over a period of time when inspecting repetitive items where it is easy to
make mistakes
Quality measures may be unclear and staff making the checks may not know precisely what to look for
Wrong information may be given
Type I and type II errors
Using a sample to make a decision about the quality of products or services, although requiring less time than 100
per cent checking, does have its own inherent problems
Type I errors are those which occur when a decision was made to do something and the situation did not warrant
it.
Type II errors are those which occur when nothing was done, yet a decision to do something should have been
taken as the situation did indeed warrant it
How should the checks be performed?
In practice most operations will use some form of sampling to check the quality of their products or services. The
decision then is what kind of sample procedure to adopt.
There are two different methods in common use for checking the quality of a sample product or service so as to
make inferences about all the output from an operation.
Both methods take into account the statistical risks involved in sampling. The first, and by far the best known, is the
procedure called statistical process control (SPC). SPC is concerned with sampling the process during the
production of the goods or the delivery of service,
Decisions are made as to whether the process is 'in control', that is, operating as it should be.
The second method is called acceptance sampling and is more concerned with whether to regard an incoming
or outgoing batch of materials or customers as acceptable or not
www.studynotesunisa.co.za

51
MNO 3701 Production & Ops Management
Chapter 10
Statistical Process Control (SPC), Six Sigma & Acceptance Sampling
SPC
Concerned with checking a product or service during its creation.
Control charts
The significant value of SPC, however, is not just to make checks of a single sample but to monitor i the results of
many samples over a period of time.
Does this by using control charts, to see whether the process looks as though it is performing as it should, or
alternatively whether it isgoing out of control. If the process does seem to be going out of control, steps can be
taken beforethere is a problem.
Most operations chart their quality performance in some way
The control chart is plotting an attribute measure of quality (satisfied or not).
Alternatively, the chart could just as easily represent the average impact resistance of samples.
If the impact resistance is moving above the 'necessary' level, it could indicate that too much material is being
used in the process.
If the reasons for the upward trend are unknown, the management of the operation should want to investigate
the causes.
Looking for trends is an important use of control charts. If the trend suggests the process is getting steadily worse, it
will be worth investigating the process.
If the trend is steadily improving, it may still be worthy of investigation to try to identify what is happening that is
making the process better.
Variation in process quality
Common causes
All processes vary to some extent.
All materials vary a little
Even the environment in which the processing takes place will vary. Given this, it is not surprising that the measure
of quality (whether attribute or variable) will also vary.
Variations which derive from these common causes can never be entirely eliminated
Usually this type of variation can be described by a normal distribution with 99.7 per cent of the variation lying
within ± 3 standard deviations.
The obvious question for any operations manager would be: 'Is this variation in the process performance
acceptable?'
The answer will depend on the acceptable range of weights which can be tolerated by the operation.
This range is called the specification range. If the weight of rice in the box is too small then the organisation might
infringe labelling regulations; if it is too large, the organisation is 'giving away' too much of its product for free.
www.studynotesunisa.co.za

52
See Figure 17.7 on page 518
Process capability
Process capability is a measure of the acceptability of the variation of the process. The simplest measure of
capability (Cp) is given by the ratio of the specification range to the 'natural' variation of the process (i.e. ± 3
standard deviations):
Cp= UTL x LTL
6s
Where:
UTL = the upper tolerance limit
LTL = the lower tolerance limit
s = the standard deviation of the process variability.
Generally, if the Cp of a process is greater than 1, it is taken to indicate that the process is 'capable', and a Cp of
less than 1 indicates that the process is not 'capable', assuming that the distribution is normal
The simple Cp measure assumes that the average of the process variation is at the mid-point of the specification
range. Often the process average is offset from the specification range, however
In such cases, one-sided capability indices are required to understand the capability of the process:
See figure 17.8 on page 519
Assignable causes of variation
Not all variation in processes is the result of common causes.
There may be something wrong with the process which is assignable to a particular and preventable cause.
Machinery may have worn or been set up badly.
An untrained member of staff may not be following the prescribed procedure for the process.
The causes of such variation are called assignable causes.
The question for operations management is whether the results from any particular sample, when plotted on the
control chart, simply represent the variation due to common causes or due to some specific and correctable,
assignable cause.
www.studynotesunisa.co.za

53
Question is whether this is natural variation or the symptom of some more serious cause. Is the variation the result
of common causes or does it indicate assignable causes in the process?
See figure 17.9 on page 520
To help make this decision, control limits can be added to the control chart (the dotted lines) which indicates the
expected extent of 'common-cause' variation.
If any points lie outside these control limits (the shaded zone) then the process can be deemed out of control in
the sense that variation is likely to be due to assignable causes.
These control limits could be set intuitively by examining past variation during a period when the process was
thought to be free of any variation which could be due to assignable causes.
Control limits can be set in a more statistically revealing manner, however, based on the probability that the
mean of a particular sample will differ by more than a set amount from themean of the population from which it is
taken.
Eg if the process which tests door panels had been measured to determine the normal distribution which
represents its common-cause variation, then control limits can be based on this distribution.
From this evidence alone, however, we cannot be absolutely certain that the process is out of control.
There is a small but finite chance that the (seemingly out of limits) point is just one of the rare but natural results at
the tail of the distribution which describes perfectly normal behaviour.
Stopping the process under these circumstances would represent a type I error because the process is actually in
control.
Alternatively, ignoring a result which in reality is due to an assignable cause is a type II error
Control limits are usually set at three standard deviations either side of the population mean.
Means that there is only a 0.3 per cent chance of any sample mean falling outside these limits by chance causes
(that is, a chance of a type I error of 0.3 per cent).
The control limits may be set at any distance from the population mean, but the closer the limits are to the
population mean, the higher the likelihood of investigating and trying to rectify a process which is actually
problem- free.
If the control limits are set at two standard deviations, the chance of a type I error increases control to about 5
per cent.
If the limits are set at one standard deviation then the chance of a type I errorincreases to 32 per cent.
When the control limits are placed at ±3 standard deviations away from control the mean of the distribution
which describes 'normal' variation in the process, they are called theupper control limit (UCL) and lower control
limit (LCL).
www.studynotesunisa.co.za

54
See table 17.5 on page 521
The Tagutchi loss function
Geiuchi Taguchi proposed a resolution of both the criticisms of SPC described in the critical commentary box.
Suggested that the central issue was the first problem - namely that the consequences of being off target
were inadequatly described by simple control limits.
He proposed a quality loss function (QLF) - a mathematical function which includes all the costs of poor quality.
These include wastage, repair, inspection, service, warranty and generally what he termed 'loss to society costs’.
This loss function is expressed as follows:
L=D2C
L = loss to society costs
D = deviation from target performance
C = a constant
Figure 17.10 illustrates the difference between the conventional and Taguchi approaches to interpreting process
variability.
The more graduated approach of the QLF also answers the second problem raised in the critical commentary
box.
With losses increasing quadratically as performance deviates from target, there is a natural tendency to
progressively reduce process variability.
This is sometimes called a target-oriented quality philosophy
See figure 17.10 on page 522
Why variability is a bad thing
Although the prime purpose of SPC is to distinguish between common causes of variation and assignable causes
of variation, it is increasingly seen as a mechanism for reducing both types of variation. .
Assignable variation is a signal that something has changed in the process which therefore must be investigated.
But normal variation is itself a problem because it masks any changes in process behaviour.
www.studynotesunisa.co.za

55
The process on the loft has such a wide natural variation that it is not immediately apparent that any change has
taken place. Eventually it will become apparent because the likelihood of process performance violating the
lower (in this case) control limit has increased, but this may take some time.
By contrast, the process on the right has a far narrower band of natural variation.
Because of this, the same change in average performance is more easily noticed.
The narrower the natural variation of a process, the more obvious are changes in the behaviour of that process.
Accepting any variation in any process is admitting to ignorance of how that process works.
See Figure 17.11 on page 523
Control charts for attributes
Attributes have only two states - 'right' or 'wrong', for example - so the statistic calculated is the proportion of
wrongs (p) in a sample.
Control charts using p are called 'p-charts'.
In calculating the limits, the population mean (p) - the actual, normal or expected proportion of 'defectives' or
wrongs to rights - may not be known.
In such cases the population mean can be estimated from the average of the proportion of 'defectives' (p), from
m samples each of n items, where m should be at least 30 and n should be at least 100:
p1+p2+p3...pn
m
One standard deviation can then be estimated from:
The upper and lower control limits can then be set as:
UCL = p + 3 standard deviations
LCL = p-3 standard deviations
Control chart for variables
The most commonly used type of control chart employed to control variables is the X-R chart.
This is really two charts in one.
One chart is used to control the sample average or mean (X).
The other is used to control the variation within the sample by measuring the range (R).
The range is used because it is simpler to calculate than the standard deviation of the sample.
The means (X) chart can pick up changes in the average output from the process being charted.
Changes in the means chart would suggest that the process is drifting generally away from its supposed process
average, although the variability inherent in the process may not have changed
www.studynotesunisa.co.za

56
The range (R) chart plots the range of each sample, that is the difference between the largest and the smallest
measurement in the samples.
Monitoring sample range gives an indication of whether the variability of the process is changing, even when the
process average remains constant.
see Figure 17.13 on page 525
Control limits for variables control chart
As with attributes control charts, a statistical description of how the process operates under normal conditions can
be used to calculate control limits.
The first task in calculating the control limits is to estimate the grand average or population mean (X) and average
range (/?) using m samples each of sample size n.
The population mean is estimated from the average of a large number (m) of sample means: (See page 526)
The average range is estimated from the ranges of the large number of samples:
R = R1 + R2 +…. Rm
m
The control limits for the sample means chart are:
Upper control limit (UCL) = X + A2 R
Lower control limit (LCL) = X -A2R
The control limits for the range charts are:
Upper control limit (UCL) = D4R
Lower control limit (LCL) = D3R
Interpreting control charts
Plots on a control chart which fall outside control limits are an obvious reason for believing that the process might
be out of control and therefore for investigating the process.
Process control, learning and knowledge
In recent years the role of process control, and SPC in particular, has changed.
www.studynotesunisa.co.za

57
It is seen not just as a convenient method of keeping processes in control but also as an activity which is
fundamental to the acquisition of competitive advantage. This is a remarkable shift in the status of SPC.
Traditionally it was seen as one of the most operational, immediate and 'hands-on' operations management
techniques. Yet it is now being connected with an operation's strategic capabilities.13
This is how the logic of the argument goes:
1. SPC is based on the idea that process variability indicates whether a process is in control or not.
2. Processes are brought into control and improved by progressively reducing process variability. Involves
eliminating the assignable causes of variation.
3. Cannot eliminate assignable causes of variation without gaining a better understanding of how the
process operates. This involves learning about the process, where its nature is revealed at an increasingly
detailed level.
4. Learning means that process knowledge is enhanced, which means that operations managers are able to
predict how the process will perform under different circumstances. Also means that the process has a
greater capability to carry out its tasks at a higher level of performance.
5. Increased process capability is particularly difficult for competitors to copy. Cannot be bought 'off-the-
shelf'. It comes only from time and effort being invested in controlling operations processes. Process
capability leads to strategic advantage.
The Six Sigma approach
The power of process control, and in particular the importance of reducing variation in process performance, has
provided the basis for what has become an important improvement concept.
The Six Sigma quality approach was first popularised by Motorola.
Six Sigma quality concept was so named because it required the natural variation of processes (± 3 standard
deviations) should be half their specification range.
The specification range of any part of a product or service should be ± 6 the standard deviation of the process.
The Greek letter sigma (a) is often used to indicate the standard deviation of a process
The defects per million measure is used within the Six Sigma approach to emphasise the drive towards a virtually
zero defect objective.
Measuring performance
The Six Sigma approach uses a number of related measures to assess the performance of operations
processes.
A defect is a failure to meet customer required performance
A defect unit or item is any unit of output that contains a defect
A defect opportunity is the number of different ways a unit of output can fail to meet customer
requirements
Proportion defective is the percentage or fraction of units that have one or more defects.
Process yield is the percentage or fraction of total units produced by a process that are defect free
Defects per unit (DPU) is the average number of defects on a unit of output
Defects per opportunity is the proportion or percentage of defects divided by the total number of defect
opportunities
www.studynotesunisa.co.za

58
Defects per million opportunities (DPMO) is exactly what it says, the number of defects which the process
will produce if there were 1 million opportunities to do so.
The Sigma measurement is derived from the DPMO and is the number of standard deviations of the
process variability that will fit within the customer specification limits.
Acceptance sampling
Process control is usually the preferred method of controlling quality because quality is being 'built in' to the
process rather than being inspected afterwards.
Sometimes it may be necessary to inspect batches of products or services either before or after a process.
The purpose of acceptance sampling is to decide whether, on the basis of a sample, to accept or reject the
whole batch.
Examples include incoming component parts from a supplier, a batch of finished products or a large number of
examination scripts from an internal examiner. Acceptance sampling is usually carried out on attributes rather
than variables. It uses the proportion ofwrongs to rightsor defectives to acceptable.
In acceptance sampling, like process control, it is important to understand the risks inherent in using a sample to
make a judgement about a far larger batch.
In acceptance sampling the type I risk is often referred to as the producer's risk because it is the risk that the
operation rejects a batch that is actually of good quality.
The type II risk is usually called the consumer's risk because it is the risk of accepting a batch that is actually poor
and sending it to the consumer of the product or service
See Table 17.8 on page 532
Sampling plans
Acceptance sampling involves a sample being taken from a batch and a decision to accept or reject the batch
being made by comparing the number of 'defects' found in the sample to a predetermined acceptable number.
The sampling plan which describes this procedure is defined by two factors,n and c, where:
n = the sample size
c = the acceptance number of defects in the sample.
If x = number of defects actually found in the sample, a decision is made based on the followingsimple decision
rule:
If x < or = toc then accept the whole batch.
If x > c then reject the whole batch.
Unlike control charts it is not necessary for organisations to create their own acceptance plans.
A set of tables called the Dodge-Romig Sampling Inspection Tables provides values for n and c for a given set of
risks.
The ability of this plan to discriminate between good batches and bad ones is based upon the binomial
distribution and is described by an operating characteristic (OC) curve.
The OC curve for a sampling plan shows the probability of accepting a batch as the actual percentage of
defects varies.
An ideal OC curve is shown in Figure 17.17 – page 533
www.studynotesunisa.co.za

59
In this example the level of defects which is regarded as acceptable is 0.4 per cent and the sampling plan is
perfect at discriminating between acceptable and unacceptable batches.
In practice, no procedure based on sampling, and therefore carrying risk, could ever deliver such an ideal curve.
Only 100 per cent inspection using a perfect inspector could do so.
Any use of sampling will have to accept the existence of type I and type II errors.
What is not known is the actual percentage of defective items in any one batch, and because the procedure
relies on a sample, there will always be a probability of rejecting a good batch because the number of defects in
the sample is two or more despite the batch in fact being acceptable
There is also a probability that in spite of accepting a batch, the actual number of defects in the whole batch
might be greater than 0.04 per cent (type II risk shown in the lower area of Figure 17.17).
If the sizes of these risks are felt to be too great, the sample size can be increased, which will move the shape of
the curve towards the ideal. However, this implies increased time and cost in inspecting the batch.
To create an appropriate sampling plan the levels of four factors need to be specified.
These have been identified on the operating characteristic curve in Figure 17.17.
These four factors are then fed into the Dodge-Romig tables to give the respective values for c and n. (Using these
tables is beyond the scope of this book.) The four factors are type I error, type II error, acceptable quality level
(AQL) and lot tolerance percentage defective (LTPD):
Type I error. The usual value used for producer's risk (type I error) is often set with a probability of 0.05.
Means that management is willing to take a 5 per cent chance that a batch of good quality will be
rejected when it is actually acceptable.
Type II error. The value for the consumer's risk. Means that management is willing to risk at most a 10 per
cent chance that a poor- quality batch will be accepted, implying that there is a 90 per cent chance that
a poor-quality batch will actually be rejected.
AQL. The acceptable quality level is the actual percentage of defects in a batch which the organisation is
willing to reject mistakenly) 5 per cent of the time
LTPD. The lot tolerance percentage defective is the actual percentage of defects in a batch that
management is willing to accept mistakenly 10 per cent of the time
MNO 3701 Production & Ops Management
Chapter 11
Project Planning & Control (Not including Network Planning) What is a project?
www.studynotesunisa.co.za

60
A project is a set of activities with a defined start point and a defined end state, which pursues a defined goal
and uses a defined set of resources.
Projects come in many and various forms, including the following:
• organising emergency aid to earthquake victims;
• producing a television programme;
• constructing the Channel Tunnel;
• designing an aircraft;
The care with which one prioritises capital expenditure is crucial. The most important point is that projects are an
investment and there should always be a strong case made for the value added by the execution of any project.
No matter how difficult, some form of diligent evaluation of project benefits should always be undertaken and the
time frames of this evaluation are often longer than for other forms of decision makingdecisions can only be
enhanced by the quality of the arguments that lead up to those decisions.
Good decisions lead to the creation of value and bad decisions lead to the destruction of value. Many projects
fail not because of the way they were planned and controlled, but because the decision was a bad one in the
first place.
What do projects have in common?
All the projects listed above have some elements in common. They all have an objective, a definable end result
or output that is typically defined in terms of cost, quality and timing.
They are all unique.
A project is usually a 'one-off', not a repetitive undertaking.
They are all of a temporary nature.
Projects have a defined beginning and end, so a temporary concentration of resources is needed to carry out
the undertaking. Once their contribution to the project objectives has been completed, the resources are usually
redeployed.
They will all have some degree of complexity.
Many different tasks are required to be undertaken to achieve a project's objectives.
The relationship between all these tasks can be complex, especially when the number of separate tasks in the
project is large. Finally, all projects have to cope with some uncertainty.
All projects are planned before they are executed and therefore carry an element of risk.
It is worth pointing out the distinction between 'projects' and 'programmes'. A programme, such as a continuous
improvement programme, has no defined end point; rather it is an ongoing process of change
Programme management will overlay and integrate the individual projects.
A typology of projects
Figure 16.2 illustrates a typology for projects according to their complexity - in terms of size, value and the number
of people involved in the project - and their uncertainty of achieving the project objectives of cost, time and
quality.
Typology helps to give a rational presentation of the vast range of undertakings where project management
principles can be applied.Also gives a clue to the nature of the projects and the difficulties of managing them.
Uncertainty particularly affects project planning and complexity particularly affects project control.
www.studynotesunisa.co.za

61
Projects with high uncertainty are likely to be especially difficult to define and set realistic objectives for. If the
exact details of a project are subject to change during the course of its execution, the planning process is
particularly difficult.
When uncertainty is high, the whole project planning process needs to be sufficiently flexible to cope with the
consequences of change.
A typology of projects
Projects with high levels of complexity need not necessarily be difficult to plan, although they might involve
considerable effort; controlling them can be problematic, however.
As projects become more detailed with many separate activities, resources and groups of people involved, the
scope for things to go wrong increases.
As the number of separate activities in a project grows, the ways in which they can impact on each other
increases exponentially. This increases the effort involved in monitoring each activity.
It also increases the chances of overlooking some part of the project which is deviating from the plan. Most
significantly, it increases the 'knock-on' effect of any problem.
Successful project management
There are some points of commonality in project success and failure, which allow us to identify some general
points which seem to minimise the chances of a project failing to meet its objectives.
The following factors are particularly important:
Clearly defined goals: including the general project philosophy or general mission of the project and a
commitment to those goals on the part of the project team members.
Competent project manager
Top-management support
Competent project team members
Sufficient resource allocation
Adequate communications channels
Control mechanisms
Feedback capabilities
Responsiveness to clients
Troubleshooting mechanisms
Project staff continuity
Project managers
Many of a project manager's activities are concerned with managing human resources.
Controlling an uncertain project environment requires the rapid exchange of relevant information with the project
stakeholders, both within and outside the organisation.
People, equipment and other resources must be identified and allocated to the various tasks.
Undertaking these tasks successfully makes the management of a project a particularly challenging operations
activity.
Five characteristics in particular are seen as important in an effective project manager:
See page 466 for the 5 points
www.studynotesunisa.co.za

62
The project planning and control process
The stages in project management, four of which are relevant to project planning and control:
Stage I Understanding the project environment - internal and external factors which may influence
the project.
Stage 2 Defining the project - setting the objectives, scope and strategy for the project.
Stage 3 Project planning - deciding how the project will be executed.
Stage 4 Technical execution - performing the technical aspects of the project.
Stage 5 Project control - ensuring that the project is carried out according to plan.
Stage 1 - Understanding the project environment
The project environment comprises all the factors which may affect the project during its life.
Understanding the project environment is important because the environment affects the way in which a project
will need to be managed and the possible dangers that may cause the project to fail.
Environmental factors can be considered under the following four headings.
Geo-social environment - geographical, climatic and cultural factors
Econo-political environment - the economic, governmental and regulatory factors
The business environment - industrial, competitive, supply network and customer expectation factors
The internal environment
Stakeholders
The stakeholders in any project are the individuals and groups who have an interest in the project process or
outcome.,
Different stakeholders are likely to stress different aspects of a project.
There can be significant direct benefits from using a stakeholder-based approach. Project managers can use the
opinions of powerful stakeholders to shape the project at an early stage.
Makes it more likely that they will support the project and also can improve its quality. Communicating with
stakeholders early and frequently can ensure that they fully understand the project and understand potential
benefits.
Stakeholder support may even help to win more resources, making it more likely that projects will be successful.
Some project managers are reluctant to include stakeholders in the project management process, preferring to
'manage them at a distance' rather than allow them to interfere with the project.
For some, the benefits of stakeholder management are too great to ignore and many of the risks can be
moderated by emphasising the responsibilities as well as the rights of project stakeholders
Managing stakeholders
Managing stakeholders can be a subtle and delicate task, requiring significant social and, sometimes, political
skills.
Based on three basic activities: identifying, prioritising and understanding the stakeholder group.
www.studynotesunisa.co.za

63
Identify stakeholders.
Prioritise stakeholders.
Understand key stakeholders
The power-interest grid
To distinguish between their power to influence the project and their interest in doing so.
Stakeholders who have the power to exercise a major influence over the project should never be ignored.
At the very least, the nature of their interest, and their motivation, should be well understood.
Not all stakeholders who have the power to exercise influence over a project will be interested in doing so, and
not everyone who is interested in the project has the power to influence it.
The power-interest gridclassifies stakeholders simply in terms of these two dimensions
Stake Holder
Power
Keep Satisfied Manage Closely
Monitor Keep Informed
Stakeholder Interest
Stakeholders' positions on the grid give an indication of how they might be managed. High-power, interested
groups must be fully engaged, with the greatest efforts made to satisfy them.
High- power, less interested groups require enough effort to keep them satisfied, but not so much that they
become bored or irritated with the message.
Low-power, interested groups need to be kept adequately informed, with checks to ensure that no major issues
are arising; these groups may be very helpful with the detail of the project.
Low-power less interested groups need monitoring, but without excessive communication.
Some key questions that can help to understand high-priority stakeholders include the following:
What is the best way of communicating with them?
What is their current opinion of the project?
Who influences their opinions? Do some of these influencers therefore become important stakeholders in
their own right?
If they are not likely to be positive, what will win them round to support the project?
If you don't think you will be able to win them round, how will you manage their opposition?
Stage 2 - Project definition
It is necessary to be dear about exactly what the project is - its definition.
Three different elements define a project:
its objectives: the end state that project management is trying to achieve;
its scope: the exact range of the responsibilities taken on by project management;
its strategy: how project management is going to meet its objectives.
Project objectives
Objectives help to provide a definition of the end point which can be used to monitor progress and identify when
success has been achieved.
www.studynotesunisa.co.za
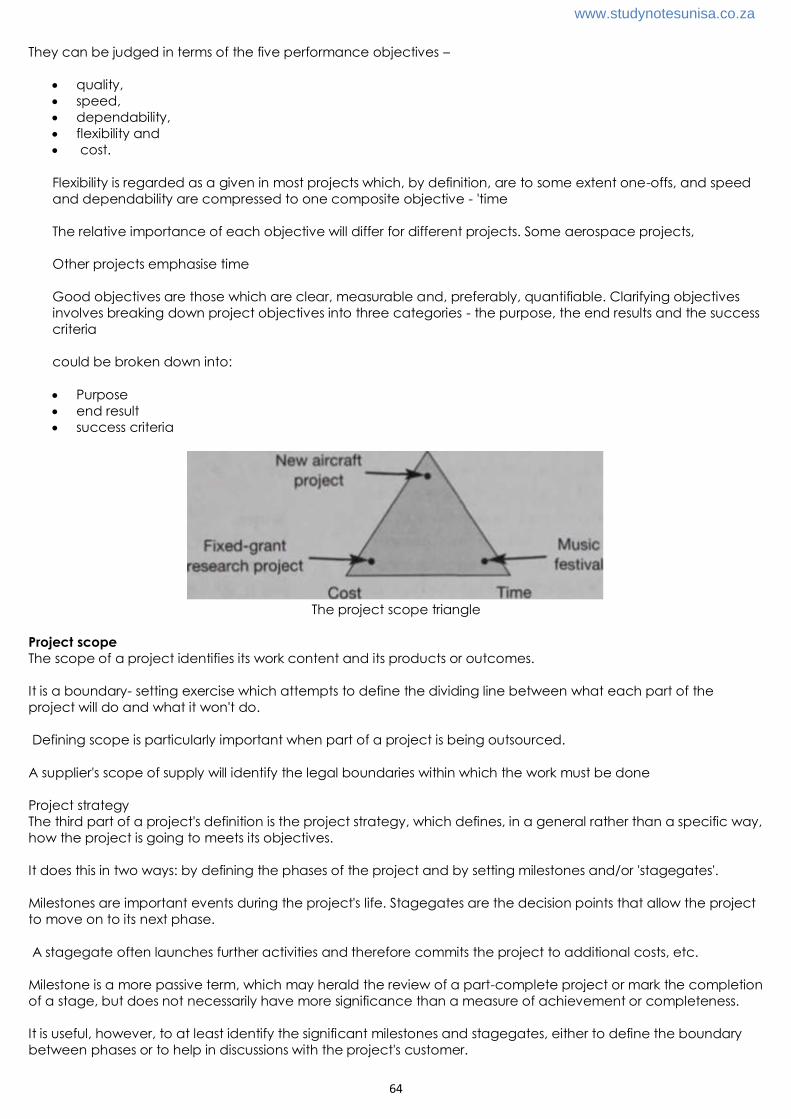
64
They can be judged in terms of the five performance objectives –
quality,
speed,
dependability,
flexibility and
cost.
Flexibility is regarded as a given in most projects which, by definition, are to some extent one-offs, and speed
and dependability are compressed to one composite objective - 'time
The relative importance of each objective will differ for different projects. Some aerospace projects,
Other projects emphasise time
Good objectives are those which are clear, measurable and, preferably, quantifiable. Clarifying objectives
involves breaking down project objectives into three categories - the purpose, the end results and the success
criteria
could be broken down into:
Purpose
end result
success criteria
The project scope triangle
Project scope
The scope of a project identifies its work content and its products or outcomes.
It is a boundary- setting exercise which attempts to define the dividing line between what each part of the
project will do and what it won't do.
Defining scope is particularly important when part of a project is being outsourced.
A supplier's scope of supply will identify the legal boundaries within which the work must be done
Project strategy
The third part of a project's definition is the project strategy, which defines, in a general rather than a specific way,
how the project is going to meets its objectives.
It does this in two ways: by defining the phases of the project and by setting milestones and/or 'stagegates'.
Milestones are important events during the project's life. Stagegates are the decision points that allow the project
to move on to its next phase.
A stagegate often launches further activities and therefore commits the project to additional costs, etc.
Milestone is a more passive term, which may herald the review of a part-complete project or mark the completion
of a stage, but does not necessarily have more significance than a measure of achievement or completeness.
It is useful, however, to at least identify the significant milestones and stagegates, either to define the boundary
between phases or to help in discussions with the project's customer.
www.studynotesunisa.co.za

65
Stage 3 - Project planning
The planning process fulfils four distinct purposes:
It determines the cost and duration of the project.
It determines the level of resources which will be needed.
It helps to allocate work and to monitor progress.
It helps to assess the impact of any changes to the project
Stages in the planning process
Planning is not a one-off process; it may be repeated several times during the project's life as circumstances
change.
The process of project planning involves five steps.
Identify activities - the work breakdown structure
Most projects are too complex to be planned and controlled effectively unless they are first broken down into
manageable portions.
Achieved by structuring the project into a 'family tree', along similar lines to the component structure but which
specifies major tasks or sub- projects.
These in turn are divided up into smaller tasks until a defined, manageable series of tasks, called a work package,
is arrived at.
Each work package can be allocated its own objectives in terms of time, cost and quality.
The output from this is called the work breakdown structure (WBS). The WBS brings clarity and definition to the
project planning process. It shows 'how the jigsaw fits together'.7
It also provides a framework for building up information for reporting purposes.
Estimate times and resources
The next stage in planning is to identify the time and resource requirements of the work packages.
Without some idea of how long each part of a project will take and how many resources it will need, it is
impossible to define what should be happening at any time during the execution of the project.
Estimates are just that, - a systematic best guess, not a perfect forecast of reality.
Estimates may never be perfect but they can be made with some idea of how accurate they might be.
Probabilistic estimates
The amount of uncertainty in a project has a major bearing on the level of confidence which can be placed on
an estimate.
The impact of uncertainty on estimating times leads some project managers to use a probability curve to describe
the estimate.
In practice, this is usually a positively skewed distribution, The greater the risk, the greater the range of the
distribution.
The natural tendency of some people is to produce optimistic estimates, but these will have a relatively low
probability of being correct because they represent the time which would be taken if everything went well.
Most likely estimates have the highest probability of proving correct.
www.studynotesunisa.co.za

66
Pessimistic estimates assume that almost everything which could go wrong does go wrong
See Figure 16.8. – 475
Identify relationships and dependencies
All the activities which are identified as comprising a project will have some relationship with each other that will
depend on the logic of the project.
Some activities will, by necessity, need to be executed in a particular order
These activities have a dependent or series relationship. Other activities do not have any such dependence on
each other.
These two activities have an independent or parallel relationship.
Identify schedule constraints
Once estimates have been made of the time and effort involved in each activity and their dependencies
identified, it is possible to compare project requirements with the available resources.
The finite nature of critical resources - such as special skills - means that they should be taken into account in the
planning process. This often has the effect of highlighting the need for more detailed replanning.
There are essentially two fundamental approaches:
Resource-constrained. Only the available resource levels are used in resource scheduling and are never
exceeded.
Time-constrained. The overriding priority is to complete the project within a given time
Fix the schedule
Project planners should ideally have a number of alternatives to choose from. The one which best fits project
objectives can then be chosen or developed.
It may be appropriate to examine both resource-limited and time-limited options.
It is not always possible to examine several alternative schedules, especially in very large or very uncertain
projects, as the computation could be prohibitive.
Modern computer-based project management software is making the search for the best schedule more
feasible.
Stage 5 - Project control
Stage deals with the management activities which take place during the execution of the project.
Project control is the essential link between planning and doing.
It involves three sets of decisions:
how to monitor the project in order to check on its progress;
how to assess the performance of the project by comparing monitored observations of the project with
the project plan;
how to intervene in the project in order to make the changes that will bring it back to plan
Project monitoring
Project managers have first to decide what they should be looking for as the project progresses. Usually a variety
of measures is monitored.
www.studynotesunisa.co.za

67
The measures used will depend on the nature of the project.
Common measures include:
current expenditure to date,
supplier price changes,
amount of overtime authorised,
technical changes to project,
inspection failures,
number and length of delays,
activities not started on time,
missed milestones
Some of these monitored measures affect mainly cost, some mainly time.
When something affects the quality of the project, there are also time and cost implications.
Assessing project performance
The monitored measures of project performance at any point in time need to be assessed so that project
management can make a judgement concerning overall performance.
A typical planned cost profile of a project through its life
At the beginning of a project some activities can be started, but most activities will be dependent on finishing.
Eventually, only a few activities will remain to be completed.
This pattern of a slow start followed by a faster pace with an eventual tail-off of activity holds true for almost all
projects, which is why the rate of total expenditure follows an S-shaped pattern.
See Figure 16.12 on page 479
Earned value control
The earned-value control method assesses performance of the project by combining cost and time. Rather than
measure the progress of the project in days, it measures it in the value of the work done.
Because the work done is measured in monetary units, the line which represents the project plan will be at 45
degrees. That means that when RIO,000
These three figures each have terms to describe them:
The budgeted cost of work scheduled (BCWS) is the amount of work which should have been completed
by a particular time (R60,000 in our example).
The budgeted cost of work performed (BCWP) is the actual amount of work which has been completed by
a particular time (R50,000 in our example).
The actual cost of work performed (ACWP) is the actual expenditure which has been spent on doing the
work completed by a particular time (R65,000 in our example).
See page 497 example
See Figure 16.13 on page 480
www.studynotesunisa.co.za

68
Intervening to change the project
If the project is obviously out of control in the sense that its costs, quality levels or times are significantly different
from those planned, some kind of intervention is almost certainly likely to be required.
The exact nature of the intervention will depend on the technical characteristics of the project, but it is likely to
need the advice of all the people who would be affected.
Given the interconnected nature of projects - a change to one part of the project will have knock-on effects
elsewhere - this means that interventions often require wide consultation.
Sometimes intervention is needed even if the project looks to be proceeding according to plan.
MNO 3701 Production & Ops Management
Chapter 11
Project Planning & Control (Not including Network Planning)
What is a project?
A project is a set of activities with a defined start point and a defined end state, which pursues a defined goal
and uses a defined set of resources.
Projects come in many and various forms, including the following:
• organising emergency aid to earthquake victims;
• producing a television programme;
• constructing the Channel Tunnel;
• designing an aircraft;
The care with which one prioritises capital expenditure is crucial. The most important point is that projects are an
investment and there should always be a strong case made for the value added by the execution of any project.
No matter how difficult, some form of diligent evaluation of project benefits should always be undertaken and the
time frames of this evaluation are often longer than for other forms of decision makingdecisions can only be
enhanced by the quality of the arguments that lead up to those decisions.
Good decisions lead to the creation of value and bad decisions lead to the destruction of value. Many projects
fail not because of the way they were planned and controlled, but because the decision was a bad one in the
first place.
www.studynotesunisa.co.za

69
What do projects have in common?
All the projects listed above have some elements in common. They all have an objective, a definable end result
or output that is typically defined in terms of cost, quality and timing.
They are all unique.
A project is usually a 'one-off', not a repetitive undertaking.
They are all of a temporary nature.
Projects have a defined beginning and end, so a temporary concentration of resources is needed to carry out
the undertaking. Once their contribution to the project objectives has been completed, the resources are usually
redeployed.
They will all have some degree of complexity.
Many different tasks are required to be undertaken to achieve a project's objectives.
The relationship between all these tasks can be complex, especially when the number of separate tasks in the
project is large. Finally, all projects have to cope with some uncertainty.
All projects are planned before they are executed and therefore carry an element of risk.
It is worth pointing out the distinction between 'projects' and 'programmes'. A programme, such as a continuous
improvement programme, has no defined end point; rather it is an ongoing process of change
Programme management will overlay and integrate the individual projects.
A typology of projects
Figure 16.2 illustrates a typology for projects according to their complexity - in terms of size, value and the number
of people involved in the project - and their uncertainty of achieving the project objectives of cost, time and
quality.
Typology helps to give a rational presentation of the vast range of undertakings where project management
principles can be applied.Also gives a clue to the nature of the projects and the difficulties of managing them.
Uncertainty particularly affects project planning and complexity particularly affects project control.
Projects with high uncertainty are likely to be especially difficult to define and set realistic objectives for. If the
exact details of a project are subject to change during the course of its execution, the planning process is
particularly difficult.
When uncertainty is high, the whole project planning process needs to be sufficiently flexible to cope with the
consequences of change.
A typology of projects
Projects with high levels of complexity need not necessarily be difficult to plan, although they might involve
considerable effort; controlling them can be problematic, however.
As projects become more detailed with many separate activities, resources and groups of people involved, the
scope for things to go wrong increases.
As the number of separate activities in a project grows, the ways in which they can impact on each other
increases exponentially. This increases the effort involved in monitoring each activity.
It also increases the chances of overlooking some part of the project which is deviating from the plan. Most
significantly, it increases the 'knock-on' effect of any problem.
Successful project management
www.studynotesunisa.co.za

70
There are some points of commonality in project success and failure, which allow us to identify some general
points which seem to minimise the chances of a project failing to meet its objectives.
The following factors are particularly important:
Clearly defined goals: including the general project philosophy or general mission of the project and a
commitment to those goals on the part of the project team members.
Competent project manager
Top-management support
Competent project team members
Sufficient resource allocation
Adequate communications channels
Control mechanisms
Feedback capabilities
Responsiveness to clients
Troubleshooting mechanisms
Project staff continuity
Project managers
Many of a project manager's activities are concerned with managing human resources.
Controlling an uncertain project environment requires the rapid exchange of relevant information with the project
stakeholders, both within and outside the organisation.
People, equipment and other resources must be identified and allocated to the various tasks.
Undertaking these tasks successfully makes the management of a project a particularly challenging operations
activity.
Five characteristics in particular are seen as important in an effective project manager:
See page 466 for the 5 points
The project planning and control process
The stages in project management, four of which are relevant to project planning and control:
Stage I Understanding the project environment - internal and external factors which may influence
the project.
Stage 2 Defining the project - setting the objectives, scope and strategy for the project.
Stage 3 Project planning - deciding how the project will be executed.
Stage 4 Technical execution - performing the technical aspects of the project.
Stage 5 Project control - ensuring that the project is carried out according to plan.
www.studynotesunisa.co.za

71
Stage 1 - Understanding the project environment
The project environment comprises all the factors which may affect the project during its life.
Understanding the project environment is important because the environment affects the way in which a project
will need to be managed and the possible dangers that may cause the project to fail.
Environmental factors can be considered under the following four headings.
Geo-social environment - geographical, climatic and cultural factors
Econo-political environment - the economic, governmental and regulatory factors
The business environment - industrial, competitive, supply network and customer expectation factors
The internal environment
Stakeholders
The stakeholders in any project are the individuals and groups who have an interest in the project process or
outcome.,
Different stakeholders are likely to stress different aspects of a project.
There can be significant direct benefits from using a stakeholder-based approach. Project managers can use the
opinions of powerful stakeholders to shape the project at an early stage.
Makes it more likely that they will support the project and also can improve its quality. Communicating with
stakeholders early and frequently can ensure that they fully understand the project and understand potential
benefits.
Stakeholder support may even help to win more resources, making it more likely that projects will be successful.
Some project managers are reluctant to include stakeholders in the project management process, preferring to
'manage them at a distance' rather than allow them to interfere with the project.
For some, the benefits of stakeholder management are too great to ignore and many of the risks can be
moderated by emphasising the responsibilities as well as the rights of project stakeholders
Managing stakeholders
Managing stakeholders can be a subtle and delicate task, requiring significant social and, sometimes, political
skills.
Based on three basic activities: identifying, prioritising and understanding the stakeholder group.
Identify stakeholders.
Prioritise stakeholders.
Understand key stakeholders
The power-interest grid
To distinguish between their power to influence the project and their interest in doing so.
Stakeholders who have the power to exercise a major influence over the project should never be ignored.
At the very least, the nature of their interest, and their motivation, should be well understood.
Not all stakeholders who have the power to exercise influence over a project will be interested in doing so, and
not everyone who is interested in the project has the power to influence it.
The power-interest gridclassifies stakeholders simply in terms of these two dimensions
Stake Holder
Power
Keep Satisfied Manage Closely
www.studynotesunisa.co.za

72
Monitor Keep Informed
Stakeholder Interest
Stakeholders' positions on the grid give an indication of how they might be managed. High-power, interested
groups must be fully engaged, with the greatest efforts made to satisfy them.
High- power, less interested groups require enough effort to keep them satisfied, but not so much that they
become bored or irritated with the message.
Low-power, interested groups need to be kept adequately informed, with checks to ensure that no major issues
are arising; these groups may be very helpful with the detail of the project.
Low-power less interested groups need monitoring, but without excessive communication.
Some key questions that can help to understand high-priority stakeholders include the following:
What is the best way of communicating with them?
What is their current opinion of the project?
Who influences their opinions? Do some of these influencers therefore become important stakeholders in
their own right?
If they are not likely to be positive, what will win them round to support the project?
If you don't think you will be able to win them round, how will you manage their opposition?
Stage 2 - Project definition
It is necessary to be dear about exactly what the project is - its definition.
Three different elements define a project:
its objectives: the end state that project management is trying to achieve;
its scope: the exact range of the responsibilities taken on by project management;
its strategy: how project management is going to meet its objectives.
Project objectives
Objectives help to provide a definition of the end point which can be used to monitor progress and identify when
success has been achieved.
They can be judged in terms of the five performance objectives –
quality,
speed,
dependability,
flexibility and
cost.
Flexibility is regarded as a given in most projects which, by definition, are to some extent one-offs, and speed
and dependability are compressed to one composite objective - 'time
The relative importance of each objective will differ for different projects. Some aerospace projects,
Other projects emphasise time
Good objectives are those which are clear, measurable and, preferably, quantifiable. Clarifying objectives
involves breaking down project objectives into three categories - the purpose, the end results and the success
criteria
could be broken down into:
Purpose
www.studynotesunisa.co.za

73
end result
success criteria
The project scope triangle
Project scope
The scope of a project identifies its work content and its products or outcomes.
It is a boundary- setting exercise which attempts to define the dividing line between what each part of the
project will do and what it won't do.
Defining scope is particularly important when part of a project is being outsourced.
A supplier's scope of supply will identify the legal boundaries within which the work must be done
Project strategy
The third part of a project's definition is the project strategy, which defines, in a general rather than a specific way,
how the project is going to meets its objectives.
It does this in two ways: by defining the phases of the project and by setting milestones and/or 'stagegates'.
Milestones are important events during the project's life. Stagegates are the decision points that allow the project
to move on to its next phase.
A stagegate often launches further activities and therefore commits the project to additional costs, etc.
Milestone is a more passive term, which may herald the review of a part-complete project or mark the completion
of a stage, but does not necessarily have more significance than a measure of achievement or completeness.
It is useful, however, to at least identify the significant milestones and stagegates, either to define the boundary
between phases or to help in discussions with the project's customer.
Stage 3 - Project planning
The planning process fulfils four distinct purposes:
It determines the cost and duration of the project.
It determines the level of resources which will be needed.
It helps to allocate work and to monitor progress.
It helps to assess the impact of any changes to the project
Stages in the planning process
Planning is not a one-off process; it may be repeated several times during the project's life as circumstances
change.
The process of project planning involves five steps.
Identify activities - the work breakdown structure
www.studynotesunisa.co.za

74
Most projects are too complex to be planned and controlled effectively unless they are first broken down into
manageable portions.
Achieved by structuring the project into a 'family tree', along similar lines to the component structure but which
specifies major tasks or sub- projects.
These in turn are divided up into smaller tasks until a defined, manageable series of tasks, called a work package,
is arrived at.
Each work package can be allocated its own objectives in terms of time, cost and quality.
The output from this is called the work breakdown structure (WBS). The WBS brings clarity and definition to the
project planning process. It shows 'how the jigsaw fits together'.7
It also provides a framework for building up information for reporting purposes.
Estimate times and resources
The next stage in planning is to identify the time and resource requirements of the work packages.
Without some idea of how long each part of a project will take and how many resources it will need, it is
impossible to define what should be happening at any time during the execution of the project.
Estimates are just that, - a systematic best guess, not a perfect forecast of reality.
Estimates may never be perfect but they can be made with some idea of how accurate they might be.
Probabilistic estimates
The amount of uncertainty in a project has a major bearing on the level of confidence which can be placed on
an estimate.
The impact of uncertainty on estimating times leads some project managers to use a probability curve to describe
the estimate.
In practice, this is usually a positively skewed distribution, The greater the risk, the greater the range of the
distribution.
The natural tendency of some people is to produce optimistic estimates, but these will have a relatively low
probability of being correct because they represent the time which would be taken if everything went well.
Most likely estimates have the highest probability of proving correct.
Pessimistic estimates assume that almost everything which could go wrong does go wrong
See Figure 16.8. – 475
Identify relationships and dependencies
All the activities which are identified as comprising a project will have some relationship with each other that will
depend on the logic of the project.
Some activities will, by necessity, need to be executed in a particular order
These activities have a dependent or series relationship. Other activities do not have any such dependence on
each other.
These two activities have an independent or parallel relationship.
Identify schedule constraints
www.studynotesunisa.co.za

75
Once estimates have been made of the time and effort involved in each activity and their dependencies
identified, it is possible to compare project requirements with the available resources.
The finite nature of critical resources - such as special skills - means that they should be taken into account in the
planning process. This often has the effect of highlighting the need for more detailed replanning.
There are essentially two fundamental approaches:
Resource-constrained. Only the available resource levels are used in resource scheduling and are never
exceeded.
Time-constrained. The overriding priority is to complete the project within a given time
Fix the schedule
Project planners should ideally have a number of alternatives to choose from. The one which best fits project
objectives can then be chosen or developed.
It may be appropriate to examine both resource-limited and time-limited options.
It is not always possible to examine several alternative schedules, especially in very large or very uncertain
projects, as the computation could be prohibitive.
Modern computer-based project management software is making the search for the best schedule more
feasible.
Stage 5 - Project control
Stage deals with the management activities which take place during the execution of the project.
Project control is the essential link between planning and doing.
It involves three sets of decisions:
how to monitor the project in order to check on its progress;
how to assess the performance of the project by comparing monitored observations of the project with
the project plan;
how to intervene in the project in order to make the changes that will bring it back to plan
Project monitoring
Project managers have first to decide what they should be looking for as the project progresses. Usually a variety
of measures is monitored.
The measures used will depend on the nature of the project.
Common measures include:
current expenditure to date,
supplier price changes,
amount of overtime authorised,
technical changes to project,
inspection failures,
number and length of delays,
activities not started on time,
missed milestones
Some of these monitored measures affect mainly cost, some mainly time.
When something affects the quality of the project, there are also time and cost implications.
Assessing project performance
The monitored measures of project performance at any point in time need to be assessed so that project
management can make a judgement concerning overall performance.
A typical planned cost profile of a project through its life
www.studynotesunisa.co.za

76
At the beginning of a project some activities can be started, but most activities will be dependent on finishing.
Eventually, only a few activities will remain to be completed.
This pattern of a slow start followed by a faster pace with an eventual tail-off of activity holds true for almost all
projects, which is why the rate of total expenditure follows an S-shaped pattern.
See Figure 16.12 on page 479
Earned value control
The earned-value control method assesses performance of the project by combining cost and time. Rather than
measure the progress of the project in days, it measures it in the value of the work done.
Because the work done is measured in monetary units, the line which represents the project plan will be at 45
degrees. That means that when RIO,000
These three figures each have terms to describe them:
The budgeted cost of work scheduled (BCWS) is the amount of work which should have been completed
by a particular time (R60,000 in our example).
The budgeted cost of work performed (BCWP) is the actual amount of work which has been completed by
a particular time (R50,000 in our example).
The actual cost of work performed (ACWP) is the actual expenditure which has been spent on doing the
work completed by a particular time (R65,000 in our example).
See page 497 example
See Figure 16.13 on page 480
Intervening to change the project
If the project is obviously out of control in the sense that its costs, quality levels or times are significantly different
from those planned, some kind of intervention is almost certainly likely to be required.
The exact nature of the intervention will depend on the technical characteristics of the project, but it is likely to
need the advice of all the people who would be affected.
Given the interconnected nature of projects - a change to one part of the project will have knock-on effects
elsewhere - this means that interventions often require wide consultation.
Sometimes intervention is needed even if the project looks to be proceeding according to plan.
www.studynotesunisa.co.za

77
MNO 3701 Production & Ops Management
Chapter 12
Network Analysis (TB Network Planning – 481 to end) Network Planning
The process of project planning and control is greatly aided by the use of techniques which help project
managers to handle its complexity and time-based nature. The simplest of these techniques is the Gantt chart
Gantt charts are the simplest way to exhibit an overall project plan because they have excellent visual impact
and are easy to understand. They are also useful for communicating project plans and status to senior managers
as well as for day-to-day project control.
The two network analysis methods we will examine are the critical path method (CPM) or analysis (CPA) and
programme evaluation and review technique (PERT).
Critical path method (CPM)
As project complexity increases, so it becomes necessary to identify the relationships between activities.
The critical path method models the project by clarifying the relationships between activities diagrammatically.
Can illustrate this is by using arrows to represent each activity.
The logic of these relationships is shown as an arrow diagram, where each activity is represented by an arrow (the
length of the arrows is not proportional to the duration of the activities).
This arrow diagram can be developed into a network diagram
Events are moments in time which occur at the start or finish of an activity.
They have no duration and are of a definite recognisable nature. Networks of this type are composed only of
activities and events
See figure 16.15 in TB
The rules for drawing this type of network diagram are fairly straightforward:
Rule 1 An event cannot be reached until all activities leading to it are complete.
Rule 2 No activity can start until its tail event is reached.
Rule 3 No two activities can have the same head and tail events. They must be drawn using a dummy activity.
These have no duration and are usually shown as a dotted-line arrow The critical path
In all network diagrams where the activities have some parallel relationships, there will be more than one
sequence of activities which will lead from the start to the end of the project.
These sequences of activities are called paths through the network.
www.studynotesunisa.co.za

78
Each path will have a total duration which is the sum of all its activities. The path which has the longest sequence
of activities is called the critical path of the network
It is called the critical path because any delay in any of the activities on this path will delay the whole project.
By drawing the network diagram we can:
identify which are the particularly important activities;
calculate the duration of the whole project
Calculating float
The flexibility to change the timings of activities, which is inherent in various parts of a project, as float.
We can use the network diagram to calculate this for each activity.
The procedure is relatively simple:
1. Calculate the earliest and latest event times for each event. The earliest event time (EET) is the very earliest
the event could possibly occur if all preceding activities are completed as early as possible. The latest
event time (LET) is the latest time that the event could possibly take place without delaying the whole
project.
2. Calculate the 'time window' within which an activity must take place. This is the time between the EET of its
tail event and the LET of its head event.
3. Compare the actual duration of the activity with the time window within which it must take place. The
difference between them is the float of the activity.
Consider again the simple network example.
The critical path is the sequence of activities a, b, c, f. We can calculate the EET and LET for each event as shown
in Figure 16.17. If activity a starts at time 0 then earliest it can finish is 1 because it is a one-day activity.
If activity b is started immediately, it will finish at day 3 (EET of tail event + duration, 1 + 2).
Activity e can then start at day 3 and because it is of three days' duration it will finish at day 6. Activity e also has
event number 5 as its head event so we must also calculate the EET of activity e's tail event.
The LETs can be calculated by using the reverse logic. If event number 6 must occur no later than day 7, the LET
for event number 5 is day 6.
Any later than this and the whole project will be delayed.
Activity on node networks
The network we have described so far uses arrows to represent activities and circles at the junctions or nodes of
the arrows to represent events.
This method is called the activity on arrow (AoA) method.
An alternative method of drawing networks is the activity on node (AoN) method.
In the AoN representation, activities are drawn as boxes and arrows are used to define the relationships between
them.
There are three advantages to the AoN method:
it is often easier to move from the basic logic of a project's relationships to a network diagram using AoN
rather than using the AoA method
AoN diagrams do not need dummy activities to maintain the logic of relationships
most of the computer packages which are used in project planning and control use an AoN format.
www.studynotesunisa.co.za

79
An AoN network of the 'apartment decorating' project is shown in Figure 16.19
Programme evaluation and review technique (PERT)
The programme evaluation and review technique.
Recognises that activity durations and costs in project management are not deterministic (fixed) and that
probability theory can be applied to estimates, as was mentioned earlier.
In this type of network each activity duration is estimated on an optimistic, a most likely and a pessimistic basis
If it is assumed that these time estimates are consistent with a beta probability distribution, the mean and variance
of the distribution can be estimated as follows:
See figure 16.21 in TB
where
te = the expected time for the activity
to = the optimistic time for the activity
tl = the most likely time for the activity
tp = the pessimistic time for the activity
The variance of the distribution (V) can be calculated as follows:
The time distribution of any path through a network will have a mean which is the sum of the means of the
activities that make up the path and a variance which is a sum of their variances.
The mean of the first activity = 2 + (4 x 3) + 5 = 3.17
6
The variance of the first activity = (5-212= 0.25
36
The mean of the second activity =
www.studynotesunisa.co.za

80
The variance of the second activity =
The mean of the network distribution = 3.17 + 4.33 = 7.5
The variance of the network distribution = 0.25 + 0.44 = 0.69
It is generally assumed that the whole path will be normally distributed. The advantage of this extra information is
that we can examine the 'riskiness' of each path through a network as well as its duration.
The top path is the critical one; the distribution of its duration is 10.5 with a variance of 0.06 (therefore a standard
deviation of 0.245). The distribution of the non-critical path has a mean of 9.67 and a variance of 0.66
The implication of this is that there is a chance that the non-critical path could in reality be critical. Although we
will not discuss the probability calculations here, it is possible to determine the probability of any sub-critical path
turning out to be critical when the project actually takes place.
On a practical level, even if the probability calculations are judged not to be worth the effort involved, it is useful
to be able to make an approximate assessment of the riskiness of each part of a network.
Introducing resource constraints
The logic which governs network relationships is primarily derived from the technical details of the project as we
have described.
The availability of resources may impose its own constraints, which can materially affect the relationships between
activities
The resource schedule in Figure 16.23 has the non-critical activities starting as soon as possible. This results in a
resource profile which varies from seven staff down to three.
Even if seven staff are available, the project manager might want to even out the loading for organisational
convenience.
FIGURE 16.24 Resource profile of a network with non-critical activities delayed to fit resource constraints; in this
case this effectively changes the network logic to make all activities critical
In order to achieve this it is necessary to require activity b to start only when activity a is completed.
This is a logic constraint which, if it were included in the network, would change it.
Crashing networks
Crashing networks is the process of reducing time spans on critical path activities so that the project is completed
in less time. Usually, crashing activities incurs extra cost.
This can be as a result of:
www.studynotesunisa.co.za
81
overtime working;
additional resources, such as manpower;
sub-contracting.
See Figure 16.25. on 491 of the TB
For each activity the duration and normal cost are specified, together with the (reduced) duration and
(increased) cost of crashing them.
Not all activities are capable of being crashed; here activity e cannot be crashed. The critical path is the
sequence of activities a, b, c, e. If the total project time is to be reduced, one of the activities on the critical path
must be crashed. In order to decide which activity to crash, the 'cost slope' of each is calculated.
This is the cost per time period of reducing durations.
The most cost- effective way of shortening the whole project then is to crash the activity on the critical path which
has the lowest cost slope.
The shape of the time-cost curve in Figure 16.25 is entirely typical.
Initial savings come relatively inexpensively if the activities with the lowest cost slope are chosen.
Later in the crashing sequence the more expensive activities need to be crashed and eventually two or more
paths become jointly critical. Inevitably by that point, savings in time can come only from crashing two or more
activities on parallel paths.
Computer-assisted project management
For many years, since the emergence of computer-based modelling, increasingly sophisticated software for
project planning and control has become available.
Tedious computation necessary in network planning can relatively easily be performed by project planning
models. All they need are the basic relationships between activities together with timing and resource
requirements for each activity.
Earliest and latest event times, float and other characteristics of a network can be presented, often in the form of
a Gantt chart.
The speed of computation allows for frequent updates to project plans.
If updated information is both accurate and frequent, such computer-based system can also provide effective
project control data.
The potential for using computer-based project management systems for communication within large and
complex projects has been developed in so-called enterprise project management (EPM) systems.
Project control includes simple budgeting and cost management together with more sophisticated earned value
control.
EPM also includes other elements.
Project modelling involves the use of project planning methods to:
explore alternative approaches to a project,
www.studynotesunisa.co.za
82
identifying where failure might occur and exploring the changes to the project which may have to be
made under alternative future scenarios.
Project portfolio analysis acknowledges that, for many organisations, several projects have to be
managed simultaneously. Usually these share common resources. Delays in one activity within a project
may not only affect other activities in that project, they may also have an impact on completely different
projects which are relying on the same resource.
Integrated EPM systems can help to communicate, both within a project and to outside organisations
which may be contributing to the project. Much of this communication facility is web-based.
Project portals can allow all stakeholders to transact activities and gain a clear view of the current status of a
project. Automatic notification of significant milestones can be made by email.
At a very basic level, the various documents that specify parts of the project can be stored in an on-line library.
Some argue that it is this last element of communication capabilities that is the most useful part of EPM systems.
` MNO 3701 Production & Ops Management
Chapter 13
Measuring and improving performance
All operations therefore need some kind of performance measurement as a prerequisite for improvement.
Performance measurement
Performance measurement is the process of quantifying action, where measurement means the process of
quantification and the performance of the operation is assumed to derive from actions taken by its
management.2
Some kind of performance measurement is a prerequisite for judging whether an operation is good, bad or
indifferent. Without performance measurement, it would be impossible to exert any control over an operation on
an on-going basis. A performance measurement system that gives no help to on-going improvement is only
partially effective.
The polar diagrams in Figure 18_2 illustrate this concept The five performance objectives which we have used
throughout this book can be regarded as the dimensions of overall performance that satisfy customers. The
market's needs and expectations of each performance objective will vary.
The extent to which an operation meets market requirements will also vary
Performance measurement, as we are treating it here, concerns three generic issues:
What factors to include as performance measures?
Which are the most important performance measures?
What detailed measures to use?
What factors to include as performance measures?
The five generic performance objectives - quality, speed, dependability, flexibility and cost - can be broken down
into more detailed measures, or they can be aggregated into 'composite' measures, such as 'customer
satisfaction', 'overall service level' or 'operations agility'.
These composite measures may be further aggregated by using measures such as 'achieve market objectives',
'achieve financial objectives', 'achieve operations objectives' even 'achieve overall strategic objectives'.
www.studynotesunisa.co.za

83
The more aggregated performance measures have greater strategic relevance insomuch as they help to draw a
picture of the overall performance of the business, although by doing so they necessarily include many influences
outside those that operations performance improvement would normally address.
The more detailed performance measures are usually monitored more closely and more often, and although they
provide a limited view of an operation's performance, they do provide a more descriptive and complete picture
of what should be and what is happening within the operation.
In practice, most organisations will choose to use performance targets from throughout the range
What are the most important performance measures?
A compromise is leached by making sure that there is a dear link between the operation's overall strategy, the
most important or 'key’ performance indicators (KPIs) that reflect strategic objectives, and the bundle of detailed
measures that are used to ‘flesh out each key performance indicator:
Obviously, unless strategy is well defined, it is difficult to ‘target’ a narrow range of key performance indicators.
What detailed measures to use?
The five performance objectives - quality, speed, dependability, flexibility and cost - are really composites of
many smaller measures
All of these measures Individually give a partial view of the operation’s cost performance and many of them
overlap In terms of the Information they include.
Each of them does give a perspective on the cost performance of an operation that could be useful either to
Identify areas for improvement or to monitor the extent of improvement.
If an organisation regards Its ‘cost’ performance as unsatisfactory, disaggregating It into ‘purchasing efficiency’,
‘operations efficiency’, staff productivity’, etc. might explain the root cause of the poor performance.
See table 18.1
The balanced scorecard approach
'The balanced scorecard retains traditional financial measures.
Financial measures tell the story of past events, an adequate story for industrial age companies for which
investments in long-term capabilities are customer relationships were not critical for success.
These financial measures are inadequate, however, for guiding and evaluating the journey that information age
companies must make to create future value through investment in customers, suppliers, employees, processes,
technology, and innovation.'
Generally operations performance measures have been broadening in their scope. It is now generally accepted
that the scope of measurement should, at some level, include external as well as internal, long-term as well as
short-term, and 'soft' as well as ‘hard’ measures.
The best- known manifestation of this trend is the balanced scorecard' approach
In the same way as traditional performance measurement systems, the balanced scorecard approach attempts
to provide the important information that is required to allow the overall strategy of an organisation to be
reflected adequately in specific performance measures.
It includes more operational measures of customer satisfaction, internal processes, innovation and other
improvement activities.
In doing so it measures the factors behind financial performance which are seen as the key drivers of future
financial success. In particular, it is argued that a balanced range of measures enables managers to address the
following questions (see Figure 18.4):
• How do we look to our shareholders (financial perspective)?
• What must we excel at (internal process perspective)?
• How do our customers see us (the customer perspective)?
www.studynotesunisa.co.za

84
• How can we continue to improve and build capabilities (the learning and growth perspective)?
The balanced scorecard attempts to bring together the elements that reflect a business's strategic position,
including product or service quality measures, product and service development times, customer complaints,
labour productivity and so on. At the same time it attempts to avoid performance reporting becoming unwieldy
by restricting the number of measures and focusing especially on those seen to be essential.
The advantages of the approach are that it presents an overall picture of the organisation's performance in a
single report, and by being comprehensive in the measures of performance it uses, encourages companies to
take decisions in the interests of the whole organisation rather than sub-optimising around narrow measures.
Developing a balanced scorecard is a complex process and is now the subject of considerable debate. One of
the key questions that has to be considered is how specific measures of performance should be designed.
Inadequately designed performance measures can result in dysfunctional behaviour, so teams of managers are
often used to develop a scorecard which reflects their organisation's specific needs.
Setting target performance
A performance measure means relatively little until it is compared against some kind of target. Knowing that only
one document in 500 containing an error is sent out to customers tells us relatively little unless we know whether
this is better or worse than we were achieving previously, and whether it is better or worse than other similar
operations (especially competitors) are achieving. Setting performance targets transforms performance measures
into performance 'judgments'. Several approaches to setting targets can be used, including the following:
historically-based targets –
strategic targets
external performance-based targets –
absolute performance targets - targets.
One of the problems in setting targets is that different targets can give very different messages regarding the
improvement being achieved.
The company may also be concerned with how it performs against competitors' performance.
Benchmarking
Benchmarking is 'the process of learning from others' and involves comparing one's own performance or methods
against other comparable operations.
It is a broader issue than setting performance targets and includes investigating other organisations’ operations
practice in order to derive ideas that could contribute to performance improvement.
Its rationale is based on the idea that (a) problems in managing processes are almost certainly shared by
processes elsewhere, and (b) there is probably another operation somewhere that has developed a better way
of doing things.
Benchmarking is essentially about stimulating creativity in improvement practice.
Types of benchmarking
There are many different types of benchmarking (which are not necessarily mutually exclusive) some of which are
listed below:
Internal benchmarking is a comparison between operations or parts of operations which are within the
same total organisation.
External benchmarking is a comparison between an operation and other operations which are part of a
different organisation.
Non-competitive benchmarking is benchmarking against external organisations which do not compete
directly in the same markets.
Competitive benchmarking is a comparison directly between competitors in the same, or similar, markets.
Performance benchmarking is a comparison between the levels of achieved performance in different
operations.
www.studynotesunisa.co.za

85
Practice benchmarking is a comparison between an organisation's operations practices, or way of doing
things, and those adopted by another operation.
Benchmarking as an improvement tool
Although benchmarking has become popular, some businesses have failed to derive maximum benefit from it.
Partly this may be because there are some misunderstandings as to what bench¬marking actually entails. First, it is
not a 'one-off' project; it is best practised as a continuous process of comparison.
Second, it does not provide 'solutions'; rather, it provides ideas and information that can lead to solutions.
Third, it does not involve simply copying or imitating other operations; it is a process of learning and adapting in a
pragmatic manner. Fourth, it means devoting resources to the activity; benchmarking cannot be done without
some investment, but this does not necessarily mean allocating exclusive responsibility to a set of highly paid
managers.
There can be advantages in organising staff at all levels to investigate and collate information from
benchmarking targets.
There are also some basic rules about how benchmarking can be organised:
A prerequisite for benchmarking success is to understand thoroughly your own processes.
Look at the information that is available in the public domain.
Do not discard information because it seems irrelevant.
Be sensitive in asking for information from other companies
The consideration of customers' needs has particular significance in shaping the objectives of all operations. The
fundamental purpose of operations is to create goods and services in such a way as to meet the needs of their
customers..
If customers for a particular product or service prefer low prices to wide range, then the operation should devote
more energy to reducing its costs than to increasing the flexibility which enables it to provide a range of products
or services.
The needs and preferences of customers shape the importance of operations objectives within the operation.
The role of competitors is different from that of customers. Competitors are the points of comparison against which
the operation can judge its performance.
From a competitive viewpoint, as operations improve their performance, the improvement which matters most is
that which takes the operation past the performance levels achieved by its competitors.
The role of competitors then is in determining achieved performance.
Both importance and performance have to be brought together before any judgement can be made as to the
relative priorities for improvement. Just because something is particularly important to its customers does not
mean that an operation should necessarily give it immediate priority for improvement.
It may be that the operation is already considerably better than its competitors at serving customers in this
respect.
Just because an operation is not very good at something when compared with its competitors' performance, it
does not necessarily mean that it should be immediately improved.
Judging importance to customers
www.studynotesunisa.co.za
86
Order-winning competitive factors are those which directly win business for the operation.
Qualifying competitive factors are those which may not win extra business if the operation improves its
performance but can certainly lose business if performance falls below a particular point, known as the qualifying
level.
Less important competitive factors, as their name implies, are those which are relatively unimportant compared
with the others.
Judging performance against competitors
At its simplest, a competitive performance standard would consist merely of judging whether the achieved
performance of an operation is better than, the same or worse than that of its competitors.
In much the same way as the nine-point importance scale was derived, we can derive a more discriminating
nine-point performance scale.
The Importance-performance matrix
The priority for improvement which each competitive factor should be given can be assessed from a companion
of their importance and performance. This can be shown on an importance- performance aatrik which, as its
name implies, positions each competitive factor according to Its scores 09 ratings on these criteria.
Figure 18.6 shows an importance-performance matrix divided Intoaunrs of improvement priority. The fast tone
boundary is the 'lower bound of acceptability'
This is the boundary between acceptable and unacceptable performance.
Most operations are prepared to tolerate performance levels which are ‘in the same ball-park as their competitors
for unimportant competitive factors. They become concerned only when performance levels are clearly below
those of their competitors.
When judging competitive factors which are rated highly they will be markedly less sanguine at poor or mediocre
levels of performance.
Minimum levels of acceptability for these competitive factors will usually be at the lower end of the *better than
competitors' class.
However, not all competitive factors falling below the minimum line will be seen as having the same degree of
improvement priority.
A boundary approximately represented by line CD represents a distinction between an urgent priority zone and a
less urgent improvement zone. Similarly, above the line AB, not all competitive factors are regarded as having the
same priority.
The line EF can be seen as the approximate boundary between performance levels which are regarded as 'good'
or 'appropriate' on one hand and those regarded as too good' or 'excess' on the other.
Segregating the matrix in this way results in four zones which imply very different priorities:
the 'appropriate' zone
the 'improve' zone
the 'urgent-action' zone - these factors are important to customers but performance is below that of
competitors. They must be considered as candidates for immediate improvement;
the 'excess?' zone - factors in this area are 'high performing' but not important to customers. The question
must be asked, therefore, whether the resources devoted to achieving such a performance could be
used better elsewhere.
See Figure 18.7
www.studynotesunisa.co.za

87
The sandcone theory
A generic 'best' sequence of improvement.
The best- known theory is called the sandcone theory, so called because the sand is analogous to
management effort and resources. Building a stable sandcone needs a stable foundation of quality, upon
which one can build layers of dependability, speed, flexibility and cost
Building up improvement is thus a cumulative process, not a sequential one.
According to the sandcone theory, the first priority should be quality, since this is a precondition to all lasting
improvement. Only when the operation has reached a minimally acceptable level in quality should it then
tackle the next issue, that of internal dependability.
Once a critical level of dependability is reached, enough to provide some stability to the operation, the next
stage is to improve the speed of internal throughput
The most effective way to improve speed is through improvements in response flexibility that is, changing
things within the operation faster.
Including flexibility in the improvement process should not divert attention from continuing to work further on
quality, dependability and speed.
Only now, according to the sandcone theory, should cost be tackled head on.
See figure 18.10
Approaches to improvement
Breakthrough improvement
Breakthrough improvement assumes that the main vehicle of improvement is major and dramatic change in
the way the operation works.
The introduction of a new, more efficient machine in a factory, the total redesign of a computer-based hotel
reservation system and the introduction of a new and better degree programme at a university are all
examples of breakthrough improvement.
The impact of these improvements is relatively sudden, abrupt and represents a step change in practice (and
hopefully performance).
www.studynotesunisa.co.za

88
Such improvements are rarely inexpensive, usually calling for high investment of capital, often disrupting the
ongoing workings of the operation and frequently involving changes in the product/service or process
technology.
The improvement pattern is regarded by some as being more representative of what really occurs when
operations rely on pure breakthrough improvement.
See Figure 18.11
Continuous improvement
Continuous improvement, adopts an approach to improving performance which assumes more and smaller
incremental improvement steps.
While there is no guarantee that such small steps towards better performance will be followed by other steps,
the whole philosophy of continuous improvement attempts to ensure that they will be.
Continuous improvement is not concerned with promoting small improvements per se. It does see small
improvements, however, as having one significant advantage over large ones - they can be followed
relatively painlessly by other small improvements
Continuous improvement is also known as kaizen. Kaizen is a Japanese word, the definition of which is given
by Masaaki Imai
In continuous improvement it is not the rate of improvement which is important, it is the momentum of
improvement. It does not matter if successive improvements are small; what does matter is that every month
some kind of improvement has actually taken place.
Building a continuous improvement capability
The ability to improve on a continuous basis is not something which always comes naturally to operations
managers and staff.
There are specific abilities, behaviours and actions which need to be consciously developed if continuous
improvement is to sustain over the long term.
The improvement pattern is regarded by some as being more representative of what really occurs when
operations rely on pure breakthrough.
Caffyn distinguish between what they call
'organisational abilities' (the capacity or aptitude to adopt a particular approach to continuous
improvement),
'constituent behaviours' (the routines of behaviour which staff adopt and which reinforce the
approach to continuous improvement) and
enablers' (the procedural devices or techniques used to progress the continuous improvement effort).
They identify six generic organisational abilities, each with its own set of constituent behaviours.
www.studynotesunisa.co.za

89
Organisational ability Constituent behaviours
Getting the Cl habit Developing
the ability to generate sustained
involvement in Cl
People use formal problem-finding and solving cycles People use
simple tools and techniques
People use simple measurement to shape the improvement
process
Individuals and/or groups initiate and carry through Cl activities 1
they participate in the
process
Ideas are responded to in a timely fashion — either implemented
or otherwise dealt with
Managers support the Cl process through allocation of resources
Managers recognise in formal ways the contribution of employees
to Cl
Managers lead by example, becoming actively involved in design
and implementation of Cl
Managers support experiment by not punishing mistakes, but
instead encouraging learning
from them Focussing on Cl Generating and
sustaining the ability to link Cl
activities to the strategic goals of
the company
Individuals and groups use the organisation's strategic objectives
to prioritise improvements Everyone is able to explain what the
operation's strategy and objectives are Individuals and groups
assess their proposed changes against the operation's objectives
Individuals and groups monitor/measure the results of their
improvement activity Cl activities are an integral part of the
individual's or group's work, not a parallel activity
Spreading the word
Generating the ability to move
activity across organisational
People cooperate in cross-functional groups
People understand and share an holistic view (process
understanding and ownership) People are oriented towards
internal and external customers in their Cl activity Specific Cl
projects with outside agencies (customers, suppliers, etc.) take
place Relevant Cl activities involve representatives from different
organisational levels Q on the Cl system I Generating
the ability to f manage
strategically the development of
Cl
The Cl system is continually monitored and developed
There is a cyclical planning process whereby the Cl system is
regularly reviewed and amended There is a periodic review of the
Cl system in relation to the organisation as a whole Senior
management make available sufficient resources (time, money,
personnel) to support the continuing development of the Cl system
The Cl system itself is designed to fit within the current structure and
infrastructure When a major organisational change is planned, its
potential impact on the O system is assessed
Wafting the talk Generating the
ability to articulate and
demonstrate Cl's values
Building the learning organisation
Generating the ability to learn
through Cl activity
The 'management style' reflects commitment to O values
When something goes wrong, people at all levels look for reasons
why, rather than blame individuals
People at all levels demonstrate a shared belief in the value of
small steps and that everyone can contribute, by themselves
being actively involved in making and recognising incremental
improvements
Everyone learns from their experiences, both good and bad
Individuals seek out opportunities for learning/personal
development
Individuals and groups at all levels share their learning
The organisation captures and shares the learning of individuals
and groups
Managers accept and act on all the learning that takes place
Organisational mechanisms are used to deploy what has been
learned across the organisation
www.studynotesunisa.co.za

90
The differences between breakthrough and continuous improvement
Breakthrough improvement places a high value on creative solutions. It encourages free thinks and
individualism.
It is a radical philosophy insomuch as it fosters an approach to improvement which does not accept many
constraints on what is possible. 'Starting with a clean sheet of paper.
Continuous improvement is less ambitious, at least in the short term.
It stresses adaptability, teamwork and attention to detail. It is not radical; rather it builds upon the wealth of
accumulated experience within the operation itself, often relying primarily on the people who operate the
system to improve it.
One analogy which helps to understand the difference between breakthrough and continuous improvement
is that of the sprint and the marathon.
Notwithstanding the fundamental differences between the two approaches, it is possible to combine the two,
albeit at different times
Breakthrough improvement Continuous improvement
Effect Short-term but dramatic Long-term and long-lasting
but undramatic
Pace Big steps Small steps
Time frame Intermittent and non-incremental Continuous and incremental
Change Abrupt and volatile Gradual and constant
Involvement Select a few 'champions' Everybody
Approach Individualism, individual ideas and efforts Collectivism, group efforts,
systems approach
Stimulus Technological breakthroughs, new
inventions, new theories
Conventional know-how
and state of theart
Risks Concentrated - 'all eggs in one basket' Spread - many projects
simultaneously
Practical
requirements
Requires large investment but little effort
to maintain it
Requires little investment but
great effort
to maintain it
Effort
orientation
Technology People
Evaluation
criteria
Results for profit Process and efforts for better
results
Improvement cycle models
An important element within the concept of continuous improvement is the idea that improvement can be
represented by a literally never-ending process of repeatedly questioning and requisitioning the detailed
working of a process or activity.
www.studynotesunisa.co.za

91
This repeated and cyclical nature of continuous improvement Is usually summarised by the idea of the
improvement cycle.
There are many improvement cycles used in practice, some of them are proprietary models owned by
consultancy companies.
The PDCA cycle
The PDCA cycle model involves an examination of the current method or the problem area being studied. This
involves collecting and analysing data so as to formulate a plan of action which is intended to improve
performance.
Once a plan for improvement has been agreed, the next step is the D (for do) stage. This is the
implementation stage during which the plan is tried out
This stage may itself involve amlnl-PDCA cycle as the problems of implementation are resolved.
Next comes the C (for check) stage where the new implemented solution is evaluated to see whether it has
resulted in the expected performance improvement.
Finally, at least for this cycle, comes the A (for act) stage. During this stage the change is consolidated or
standardised if jt has been successful.
The Deming improvement cycle
The DMAIC cycle
The DMAIC cycle starts with defining the problem or problems, partly to understand the scope of what needs
to be done and partly to define exactly the requirements of the process improvement.
After definition comes the measurement stage. This is an important point in the cycle, and the Six Sigma
approach generally, which emphasises the importance of working with hard evidence rather than opinion.
This stage involves validating the problem to make sure that it really is a problem worth solving, using data to
refine the problem and measuring exactly what is happening.
Once these measurements have been established, they can be analysed. The analysis stage is sometimes
seen as an opportunity to develop hypotheses as to what the root causes of the problem really are. Such
hypotheses are validated (or not) by the analysis and the main root causes of the problem identified.
Once the causes of the problem are identified, work can begin on improving the process. Ideas are
developed to remove the root causes of problems, solutions are tested and those solutions that seem to work
are implemented, formalised and results measured.
www.studynotesunisa.co.za

92
The improved process needs then to be continually monitored and controlled to check that the improved
level of performance is sustaining.
After this point the cycle starts again and defines the problems which are preventing further improvement.
Remember though, it is the last point about both cycles that is the most important - the cycle starts again. It is
only by accepting that in a continuous improvement philosophy these cycles quite literally never stop that
improvement becomes part of every person's job.
The business process re-engineering approach
Typical of the radical breakthrough way of tackling improvement is the business process re¬engineering (BPR)
approach. BPR is a blend of a number of ideas which have been current in operations management for some
time.
Just-in-time concepts, process flow charting, critical examination in method study, operations network
management and customer-focused operations all contribute to the BPR concept.
It was the potential of information technologies to enable the fundamental redesign of processes, however,
which acted as the catalyst in bringing these ideas together. BPR has been defined as:
‘the fundamental rethinking and radical redesign of business processes to achieve dramatic improvements in
critical, contemporary measures of performance, such as cost, quality, service and speed.’
Process versus functions
Underlying the BPR approach is the belief that operations should be organised around the total process which
adds value for customers rather than the functions or activities which perform the various stages of the value-
adding activity
The core of BPR is a redefinition of the processes within an operation to reflect the business processes which satisfy
customer needs.
The principles of BPR
The main principles of BPR have been summarised as follows:
Rethink business processes in a cross-functional manner which organises work around the natural flow of
information. Means organising around outcomes of a process rather than the tasks which go into it.
Strive for dramatic improvements in the performance by radically rethinking and redesigning the process.
Have those who use the output from a process perform the process. Check to see whether all internal
customers can be their own supplier rather than depending on another function in the business to supply
them
Put decision points where the work is performed. Do not separate those who do the work from those who
control and manage the work
The Techniques of Imrpovement
Scatter diagrams
Scatter diagrams Scatter diagrams provide a quick and simple method of identifying whether there is evidence of
a connection between two sets of data
Scatter diagrams can be treated in a far more sophisticated manner by quantifying how strong the relationship
between the sets of data is.
If the scatter diagram shows a very strong connection between the sets of data, it is important evidence of a
cause-effect fe, relationship, but not proof positive. It could be coincidence!
Example - KastonPyral Services Ltd (A)
KastonPyral Services Ltd (KPS) installs and maintains environmental control, heating and air- conditioning systems.
It has set up an improvement team to suggest ways in which it might improve its levels of customer service. The
www.studynotesunisa.co.za

93
improvement team had completed its first customer satisfaction survey. The survey asked customers to score the
service they received from KPS in several ways
Process maps (flow charts)
Process maps can be used to give a detailed understanding prior to improvement
The act of recording each stage in the process quickly shows up poorly organised flows. Process maps can also
clarify improvement opportunities and shed further light on the internal mechanics or workings of an operation.
Finally, and probably most importantly, they highlight problem areas where no procedure exists to cope with a
particular set of circumstances
Cause-effect diagrams
Cause-effect diagrams are a particularly effective method of helping to search for the root causes of problems.
They do this by asking what, when, where, how and why questions, but also add some possible 'answers' in an
explicit way. They can also be used to identify areas where further data are needed.
Cause-effect diagrams (which are also known as Ishikawa diagrams) have become extensively used in
improvement programmes. This is because they provide a way of structuring group brainstorming sessions.
Often the structure involves identifying possible causes under the headings of machinery, manpower, materials,
methods and money.
Yet in practice, any categorisation that comprehensively covers all relevant possible causes could be used.
Pareto diagrams
The purpose of the Pareto diagram (that was introduced in Chapter 12) is to distinguish between the ‘vital few'
issues and the 'trivial many'. It is a relatively straightforward technique which involves arranging items of
information on the types of problem or causes of problem into their order of
This can be used to highlight areas where further decision making will be useful.
Pareto analysis is based on the phenomenon of relatively few causes explaining the majority of effects. For
example, most revenue for any company is likely to come from relatively few of the company's customers.
See text book for these diagrams
Why-why analysis
Why-why analysis starts by stating the problem and asking why that problem has occurred.
Once the reasons for the problem occurring have been identified, each of the reasons is taken in turn and again
the question is asked why those reasons have occurred, and so on.
This procedure is continued until either a cause seems sufficiently self-contained to be addressed by itself or no
more answers to the question 'why?' can be generated.
MNO 3701 Production & Ops Management
Chapter 13
Measuring and improving performance
All operations therefore need some kind of performance measurement as a prerequisite for improvement.
www.studynotesunisa.co.za

94
Performance measurement
Performance measurement is the process of quantifying action, where measurement means the process of
quantification and the performance of the operation is assumed to derive from actions taken by its
management.2
Some kind of performance measurement is a prerequisite for judging whether an operation is good, bad or
indifferent. Without performance measurement, it would be impossible to exert any control over an operation on
an on-going basis. A performance measurement system that gives no help to on-going improvement is only
partially effective.
The polar diagrams in Figure 18_2 illustrate this concept The five performance objectives which we have used
throughout this book can be regarded as the dimensions of overall performance that satisfy customers. The
market's needs and expectations of each performance objective will vary.
The extent to which an operation meets market requirements will also vary
Performance measurement, as we are treating it here, concerns three generic issues:
What factors to include as performance measures?
Which are the most important performance measures?
What detailed measures to use?
What factors to include as performance measures?
The five generic performance objectives - quality, speed, dependability, flexibility and cost - can be broken down
into more detailed measures, or they can be aggregated into 'composite' measures, such as 'customer
satisfaction', 'overall service level' or 'operations agility'.
These composite measures may be further aggregated by using measures such as 'achieve market objectives',
'achieve financial objectives', 'achieve operations objectives' even 'achieve overall strategic objectives'.
The more aggregated performance measures have greater strategic relevance insomuch as they help to draw a
picture of the overall performance of the business, although by doing so they necessarily include many influences
outside those that operations performance improvement would normally address.
The more detailed performance measures are usually monitored more closely and more often, and although they
provide a limited view of an operation's performance, they do provide a more descriptive and complete picture
of what should be and what is happening within the operation.
In practice, most organisations will choose to use performance targets from throughout the range
What are the most important performance measures?
A compromise is leached by making sure that there is a dear link between the operation's overall strategy, the
most important or 'key’ performance indicators (KPIs) that reflect strategic objectives, and the bundle of detailed
measures that are used to ‘flesh out each key performance indicator:
Obviously, unless strategy is well defined, it is difficult to ‘target’ a narrow range of key performance indicators.
What detailed measures to use?
The five performance objectives - quality, speed, dependability, flexibility and cost - are really composites of
many smaller measures
All of these measures Individually give a partial view of the operation’s cost performance and many of them
overlap In terms of the Information they include.
Each of them does give a perspective on the cost performance of an operation that could be useful either to
Identify areas for improvement or to monitor the extent of improvement.
If an organisation regards Its ‘cost’ performance as unsatisfactory, disaggregating It into ‘purchasing efficiency’,
‘operations efficiency’, staff productivity’, etc. might explain the root cause of the poor performance.
See table 18.1
www.studynotesunisa.co.za

95
The balanced scorecard approach
'The balanced scorecard retains traditional financial measures.
Financial measures tell the story of past events, an adequate story for industrial age companies for which
investments in long-term capabilities are customer relationships were not critical for success.
These financial measures are inadequate, however, for guiding and evaluating the journey that information age
companies must make to create future value through investment in customers, suppliers, employees, processes,
technology, and innovation.'
Generally operations performance measures have been broadening in their scope. It is now generally accepted
that the scope of measurement should, at some level, include external as well as internal, long-term as well as
short-term, and 'soft' as well as ‘hard’ measures.
The best- known manifestation of this trend is the balanced scorecard' approach
In the same way as traditional performance measurement systems, the balanced scorecard approach attempts
to provide the important information that is required to allow the overall strategy of an organisation to be
reflected adequately in specific performance measures.
It includes more operational measures of customer satisfaction, internal processes, innovation and other
improvement activities.
In doing so it measures the factors behind financial performance which are seen as the key drivers of future
financial success. In particular, it is argued that a balanced range of measures enables managers to address the
following questions (see Figure 18.4):
• How do we look to our shareholders (financial perspective)?
• What must we excel at (internal process perspective)?
• How do our customers see us (the customer perspective)?
• How can we continue to improve and build capabilities (the learning and growth perspective)?
The balanced scorecard attempts to bring together the elements that reflect a business's strategic position,
including product or service quality measures, product and service development times, customer complaints,
labour productivity and so on. At the same time it attempts to avoid performance reporting becoming unwieldy
by restricting the number of measures and focusing especially on those seen to be essential.
The advantages of the approach are that it presents an overall picture of the organisation's performance in a
single report, and by being comprehensive in the measures of performance it uses, encourages companies to
take decisions in the interests of the whole organisation rather than sub-optimising around narrow measures.
Developing a balanced scorecard is a complex process and is now the subject of considerable debate. One of
the key questions that has to be considered is how specific measures of performance should be designed.
Inadequately designed performance measures can result in dysfunctional behaviour, so teams of managers are
often used to develop a scorecard which reflects their organisation's specific needs.
Setting target performance
A performance measure means relatively little until it is compared against some kind of target. Knowing that only
one document in 500 containing an error is sent out to customers tells us relatively little unless we know whether
this is better or worse than we were achieving previously, and whether it is better or worse than other similar
operations (especially competitors) are achieving. Setting performance targets transforms performance measures
into performance 'judgments'. Several approaches to setting targets can be used, including the following:
historically-based targets –
strategic targets
external performance-based targets –
absolute performance targets - targets.
One of the problems in setting targets is that different targets can give very different messages regarding the
improvement being achieved.
The company may also be concerned with how it performs against competitors' performance.
Benchmarking
www.studynotesunisa.co.za

96
Benchmarking is 'the process of learning from others' and involves comparing one's own performance or methods
against other comparable operations.
It is a broader issue than setting performance targets and includes investigating other organisations’ operations
practice in order to derive ideas that could contribute to performance improvement.
Its rationale is based on the idea that (a) problems in managing processes are almost certainly shared by
processes elsewhere, and (b) there is probably another operation somewhere that has developed a better way
of doing things.
Benchmarking is essentially about stimulating creativity in improvement practice.
Types of benchmarking
There are many different types of benchmarking (which are not necessarily mutually exclusive) some of which are
listed below:
Internal benchmarking is a comparison between operations or parts of operations which are within the
same total organisation.
External benchmarking is a comparison between an operation and other operations which are part of a
different organisation.
Non-competitive benchmarking is benchmarking against external organisations which do not compete
directly in the same markets.
Competitive benchmarking is a comparison directly between competitors in the same, or similar, markets.
Performance benchmarking is a comparison between the levels of achieved performance in different
operations.
Practice benchmarking is a comparison between an organisation's operations practices, or way of doing
things, and those adopted by another operation.
Benchmarking as an improvement tool
Although benchmarking has become popular, some businesses have failed to derive maximum benefit from it.
Partly this may be because there are some misunderstandings as to what bench¬marking actually entails. First, it is
not a 'one-off' project; it is best practised as a continuous process of comparison.
Second, it does not provide 'solutions'; rather, it provides ideas and information that can lead to solutions.
Third, it does not involve simply copying or imitating other operations; it is a process of learning and adapting in a
pragmatic manner. Fourth, it means devoting resources to the activity; benchmarking cannot be done without
some investment, but this does not necessarily mean allocating exclusive responsibility to a set of highly paid
managers.
There can be advantages in organising staff at all levels to investigate and collate information from
benchmarking targets.
There are also some basic rules about how benchmarking can be organised:
A prerequisite for benchmarking success is to understand thoroughly your own processes.
Look at the information that is available in the public domain.
Do not discard information because it seems irrelevant.
Be sensitive in asking for information from other companies
www.studynotesunisa.co.za

97
The consideration of customers' needs has particular significance in shaping the objectives of all operations. The
fundamental purpose of operations is to create goods and services in such a way as to meet the needs of their
customers..
If customers for a particular product or service prefer low prices to wide range, then the operation should devote
more energy to reducing its costs than to increasing the flexibility which enables it to provide a range of products
or services.
The needs and preferences of customers shape the importance of operations objectives within the operation.
The role of competitors is different from that of customers. Competitors are the points of comparison against which
the operation can judge its performance.
From a competitive viewpoint, as operations improve their performance, the improvement which matters most is
that which takes the operation past the performance levels achieved by its competitors.
The role of competitors then is in determining achieved performance.
Both importance and performance have to be brought together before any judgement can be made as to the
relative priorities for improvement. Just because something is particularly important to its customers does not
mean that an operation should necessarily give it immediate priority for improvement.
It may be that the operation is already considerably better than its competitors at serving customers in this
respect.
Just because an operation is not very good at something when compared with its competitors' performance, it
does not necessarily mean that it should be immediately improved.
Judging importance to customers
Order-winning competitive factors are those which directly win business for the operation.
Qualifying competitive factors are those which may not win extra business if the operation improves its
performance but can certainly lose business if performance falls below a particular point, known as the qualifying
level.
Less important competitive factors, as their name implies, are those which are relatively unimportant compared
with the others.
Judging performance against competitors
At its simplest, a competitive performance standard would consist merely of judging whether the achieved
performance of an operation is better than, the same or worse than that of its competitors.
In much the same way as the nine-point importance scale was derived, we can derive a more discriminating
nine-point performance scale.
The Importance-performance matrix
The priority for improvement which each competitive factor should be given can be assessed from a companion
of their importance and performance. This can be shown on an importance- performance aatrik which, as its
name implies, positions each competitive factor according to Its scores 09 ratings on these criteria.
Figure 18.6 shows an importance-performance matrix divided Intoaunrs of improvement priority. The fast tone
boundary is the 'lower bound of acceptability'
This is the boundary between acceptable and unacceptable performance.
Most operations are prepared to tolerate performance levels which are ‘in the same ball-park as their competitors
for unimportant competitive factors. They become concerned only when performance levels are clearly below
those of their competitors.
www.studynotesunisa.co.za

98
When judging competitive factors which are rated highly they will be markedly less sanguine at poor or mediocre
levels of performance.
Minimum levels of acceptability for these competitive factors will usually be at the lower end of the *better than
competitors' class.
However, not all competitive factors falling below the minimum line will be seen as having the same degree of
improvement priority.
A boundary approximately represented by line CD represents a distinction between an urgent priority zone and a
less urgent improvement zone. Similarly, above the line AB, not all competitive factors are regarded as having the
same priority.
The line EF can be seen as the approximate boundary between performance levels which are regarded as 'good'
or 'appropriate' on one hand and those regarded as too good' or 'excess' on the other.
Segregating the matrix in this way results in four zones which imply very different priorities:
the 'appropriate' zone
the 'improve' zone
the 'urgent-action' zone - these factors are important to customers but performance is below that of
competitors. They must be considered as candidates for immediate improvement;
the 'excess?' zone - factors in this area are 'high performing' but not important to customers. The question
must be asked, therefore, whether the resources devoted to achieving such a performance could be
used better elsewhere.
See Figure 18.7
The sandcone theory
A generic 'best' sequence of improvement.
The best- known theory is called the sandcone theory, so called because the sand is analogous to
management effort and resources. Building a stable sandcone needs a stable foundation of quality, upon
which one can build layers of dependability, speed, flexibility and cost
Building up improvement is thus a cumulative process, not a sequential one.
According to the sandcone theory, the first priority should be quality, since this is a precondition to all lasting
improvement. Only when the operation has reached a minimally acceptable level in quality should it then
tackle the next issue, that of internal dependability.
Once a critical level of dependability is reached, enough to provide some stability to the operation, the next
stage is to improve the speed of internal throughput
The most effective way to improve speed is through improvements in response flexibility that is, changing
things within the operation faster.
www.studynotesunisa.co.za

99
Including flexibility in the improvement process should not divert attention from continuing to work further on
quality, dependability and speed.
Only now, according to the sandcone theory, should cost be tackled head on.
See figure 18.10
Approaches to improvement
Breakthrough improvement
Breakthrough improvement assumes that the main vehicle of improvement is major and dramatic change in
the way the operation works.
The introduction of a new, more efficient machine in a factory, the total redesign of a computer-based hotel
reservation system and the introduction of a new and better degree programme at a university are all
examples of breakthrough improvement.
The impact of these improvements is relatively sudden, abrupt and represents a step change in practice (and
hopefully performance).
Such improvements are rarely inexpensive, usually calling for high investment of capital, often disrupting the
ongoing workings of the operation and frequently involving changes in the product/service or process
technology.
The improvement pattern is regarded by some as being more representative of what really occurs when
operations rely on pure breakthrough improvement.
See Figure 18.11
Continuous improvement
Continuous improvement, adopts an approach to improving performance which assumes more and smaller
incremental improvement steps.
While there is no guarantee that such small steps towards better performance will be followed by other steps,
the whole philosophy of continuous improvement attempts to ensure that they will be.
www.studynotesunisa.co.za
100
Continuous improvement is not concerned with promoting small improvements per se. It does see small
improvements, however, as having one significant advantage over large ones - they can be followed
relatively painlessly by other small improvements
Continuous improvement is also known as kaizen. Kaizen is a Japanese word, the definition of which is given
by Masaaki Imai
In continuous improvement it is not the rate of improvement which is important, it is the momentum of
improvement. It does not matter if successive improvements are small; what does matter is that every month
some kind of improvement has actually taken place.
Building a continuous improvement capability
The ability to improve on a continuous basis is not something which always comes naturally to operations
managers and staff.
There are specific abilities, behaviours and actions which need to be consciously developed if continuous
improvement is to sustain over the long term.
The improvement pattern is regarded by some as being more representative of what really occurs when
operations rely on pure breakthrough.
Caffyn distinguish between what they call
'organisational abilities' (the capacity or aptitude to adopt a particular approach to continuous
improvement),
'constituent behaviours' (the routines of behaviour which staff adopt and which reinforce the
approach to continuous improvement) and
enablers' (the procedural devices or techniques used to progress the continuous improvement effort).
They identify six generic organisational abilities, each with its own set of constituent behaviours.
Organisational ability Constituent behaviours
Getting the Cl habit Developing
the ability to generate sustained
involvement in Cl
People use formal problem-finding and solving cycles People use
simple tools and techniques
People use simple measurement to shape the improvement
process
Individuals and/or groups initiate and carry through Cl activities 1
they participate in the
process
Ideas are responded to in a timely fashion — either implemented
or otherwise dealt with
Managers support the Cl process through allocation of resources
Managers recognise in formal ways the contribution of employees
to Cl
Managers lead by example, becoming actively involved in design
and implementation of Cl
Managers support experiment by not punishing mistakes, but
instead encouraging learning
from them Focussing on Cl Generating and
sustaining the ability to link Cl
activities to the strategic goals of
the company
Individuals and groups use the organisation's strategic objectives
to prioritise improvements Everyone is able to explain what the
operation's strategy and objectives are Individuals and groups
assess their proposed changes against the operation's objectives
Individuals and groups monitor/measure the results of their
improvement activity Cl activities are an integral part of the
individual's or group's work, not a parallel activity
www.studynotesunisa.co.za

101
Spreading the word
Generating the ability to move
activity across organisational
People cooperate in cross-functional groups
People understand and share an holistic view (process
understanding and ownership) People are oriented towards
internal and external customers in their Cl activity Specific Cl
projects with outside agencies (customers, suppliers, etc.) take
place Relevant Cl activities involve representatives from different
organisational levels Q on the Cl system I Generating
the ability to f manage
strategically the development of
Cl
The Cl system is continually monitored and developed
There is a cyclical planning process whereby the Cl system is
regularly reviewed and amended There is a periodic review of the
Cl system in relation to the organisation as a whole Senior
management make available sufficient resources (time, money,
personnel) to support the continuing development of the Cl system
The Cl system itself is designed to fit within the current structure and
infrastructure When a major organisational change is planned, its
potential impact on the O system is assessed
Wafting the talk Generating the
ability to articulate and
demonstrate Cl's values
Building the learning organisation
Generating the ability to learn
through Cl activity
The 'management style' reflects commitment to O values
When something goes wrong, people at all levels look for reasons
why, rather than blame individuals
People at all levels demonstrate a shared belief in the value of
small steps and that everyone can contribute, by themselves
being actively involved in making and recognising incremental
improvements
Everyone learns from their experiences, both good and bad
Individuals seek out opportunities for learning/personal
development
Individuals and groups at all levels share their learning
The organisation captures and shares the learning of individuals
and groups
Managers accept and act on all the learning that takes place
Organisational mechanisms are used to deploy what has been
learned across the organisation
The differences between breakthrough and continuous improvement
Breakthrough improvement places a high value on creative solutions. It encourages free thinks and
individualism.
It is a radical philosophy insomuch as it fosters an approach to improvement which does not accept many
constraints on what is possible. 'Starting with a clean sheet of paper.
Continuous improvement is less ambitious, at least in the short term.
It stresses adaptability, teamwork and attention to detail. It is not radical; rather it builds upon the wealth of
accumulated experience within the operation itself, often relying primarily on the people who operate the
system to improve it.
One analogy which helps to understand the difference between breakthrough and continuous improvement
is that of the sprint and the marathon.
Notwithstanding the fundamental differences between the two approaches, it is possible to combine the two,
albeit at different times
www.studynotesunisa.co.za
102
Breakthrough improvement Continuous improvement
Effect Short-term but dramatic Long-term and long-lasting
but undramatic
Pace Big steps Small steps
Time frame Intermittent and non-incremental Continuous and incremental
Change Abrupt and volatile Gradual and constant
Involvement Select a few 'champions' Everybody
Approach Individualism, individual ideas and efforts Collectivism, group efforts,
systems approach
Stimulus Technological breakthroughs, new
inventions, new theories
Conventional know-how
and state of theart
Risks Concentrated - 'all eggs in one basket' Spread - many projects
simultaneously
Practical
requirements
Requires large investment but little effort
to maintain it
Requires little investment but
great effort
to maintain it
Effort
orientation
Technology People
Evaluation
criteria
Results for profit Process and efforts for better
results
Improvement cycle models
An important element within the concept of continuous improvement is the idea that improvement can be
represented by a literally never-ending process of repeatedly questioning and requisitioning the detailed
working of a process or activity.
This repeated and cyclical nature of continuous improvement Is usually summarised by the idea of the
improvement cycle.
There are many improvement cycles used in practice, some of them are proprietary models owned by
consultancy companies.
The PDCA cycle
The PDCA cycle model involves an examination of the current method or the problem area being studied. This
involves collecting and analysing data so as to formulate a plan of action which is intended to improve
performance.
Once a plan for improvement has been agreed, the next step is the D (for do) stage. This is the
implementation stage during which the plan is tried out
This stage may itself involve amlnl-PDCA cycle as the problems of implementation are resolved.
Next comes the C (for check) stage where the new implemented solution is evaluated to see whether it has
resulted in the expected performance improvement.
Finally, at least for this cycle, comes the A (for act) stage. During this stage the change is consolidated or
standardised if jt has been successful.
www.studynotesunisa.co.za
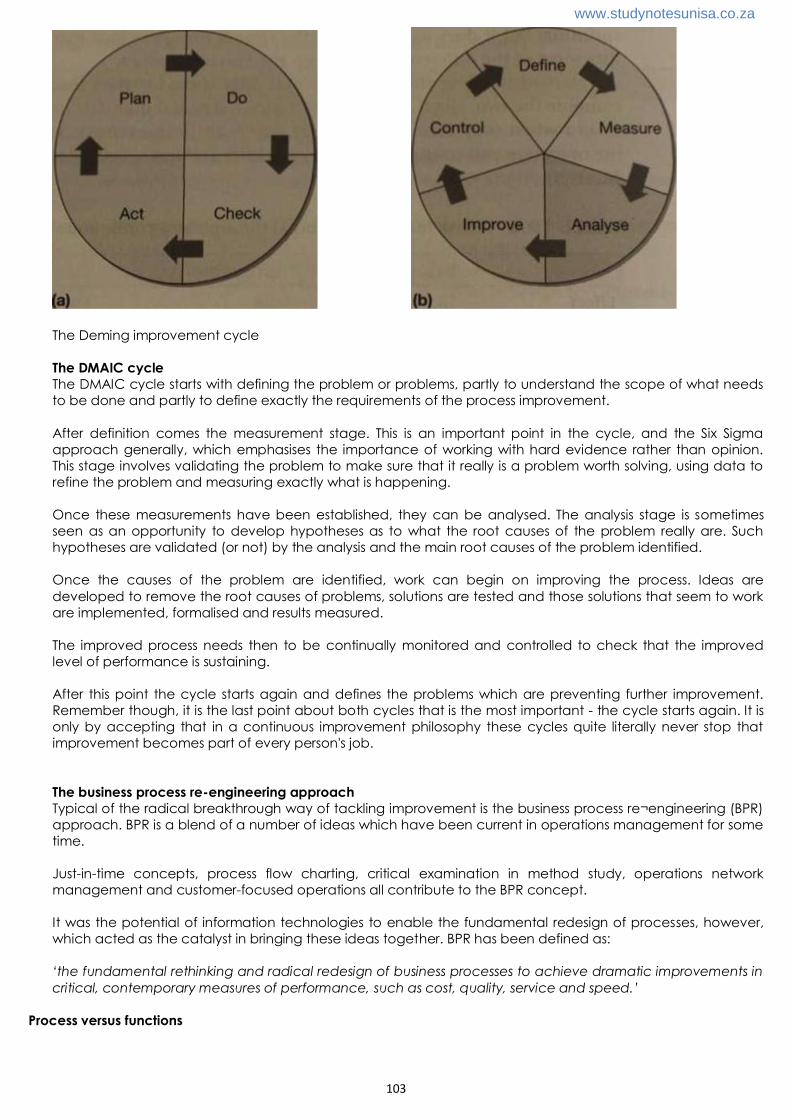
103
The Deming improvement cycle
The DMAIC cycle
The DMAIC cycle starts with defining the problem or problems, partly to understand the scope of what needs
to be done and partly to define exactly the requirements of the process improvement.
After definition comes the measurement stage. This is an important point in the cycle, and the Six Sigma
approach generally, which emphasises the importance of working with hard evidence rather than opinion.
This stage involves validating the problem to make sure that it really is a problem worth solving, using data to
refine the problem and measuring exactly what is happening.
Once these measurements have been established, they can be analysed. The analysis stage is sometimes
seen as an opportunity to develop hypotheses as to what the root causes of the problem really are. Such
hypotheses are validated (or not) by the analysis and the main root causes of the problem identified.
Once the causes of the problem are identified, work can begin on improving the process. Ideas are
developed to remove the root causes of problems, solutions are tested and those solutions that seem to work
are implemented, formalised and results measured.
The improved process needs then to be continually monitored and controlled to check that the improved
level of performance is sustaining.
After this point the cycle starts again and defines the problems which are preventing further improvement.
Remember though, it is the last point about both cycles that is the most important - the cycle starts again. It is
only by accepting that in a continuous improvement philosophy these cycles quite literally never stop that
improvement becomes part of every person's job.
The business process re-engineering approach
Typical of the radical breakthrough way of tackling improvement is the business process re¬engineering (BPR)
approach. BPR is a blend of a number of ideas which have been current in operations management for some
time.
Just-in-time concepts, process flow charting, critical examination in method study, operations network
management and customer-focused operations all contribute to the BPR concept.
It was the potential of information technologies to enable the fundamental redesign of processes, however,
which acted as the catalyst in bringing these ideas together. BPR has been defined as:
‘the fundamental rethinking and radical redesign of business processes to achieve dramatic improvements in
critical, contemporary measures of performance, such as cost, quality, service and speed.’
Process versus functions
www.studynotesunisa.co.za

104
Underlying the BPR approach is the belief that operations should be organised around the total process which
adds value for customers rather than the functions or activities which perform the various stages of the value-
adding activity
The core of BPR is a redefinition of the processes within an operation to reflect the business processes which satisfy
customer needs.
The principles of BPR
The main principles of BPR have been summarised as follows:
Rethink business processes in a cross-functional manner which organises work around the natural flow of
information. Means organising around outcomes of a process rather than the tasks which go into it.
Strive for dramatic improvements in the performance by radically rethinking and redesigning the process.
Have those who use the output from a process perform the process. Check to see whether all internal
customers can be their own supplier rather than depending on another function in the business to supply
them
Put decision points where the work is performed. Do not separate those who do the work from those who
control and manage the work
The Techniques of Imrpovement
Scatter diagrams
Scatter diagrams Scatter diagrams provide a quick and simple method of identifying whether there is evidence of
a connection between two sets of data
Scatter diagrams can be treated in a far more sophisticated manner by quantifying how strong the relationship
between the sets of data is.
If the scatter diagram shows a very strong connection between the sets of data, it is important evidence of a
cause-effect fe, relationship, but not proof positive. It could be coincidence!
Example - KastonPyral Services Ltd (A)
KastonPyral Services Ltd (KPS) installs and maintains environmental control, heating and air- conditioning systems.
It has set up an improvement team to suggest ways in which it might improve its levels of customer service. The
improvement team had completed its first customer satisfaction survey. The survey asked customers to score the
service they received from KPS in several ways
Process maps (flow charts)
Process maps can be used to give a detailed understanding prior to improvement
The act of recording each stage in the process quickly shows up poorly organised flows. Process maps can also
clarify improvement opportunities and shed further light on the internal mechanics or workings of an operation.
Finally, and probably most importantly, they highlight problem areas where no procedure exists to cope with a
particular set of circumstances
Cause-effect diagrams
Cause-effect diagrams are a particularly effective method of helping to search for the root causes of problems.
They do this by asking what, when, where, how and why questions, but also add some possible 'answers' in an
explicit way. They can also be used to identify areas where further data are needed.
Cause-effect diagrams (which are also known as Ishikawa diagrams) have become extensively used in
improvement programmes. This is because they provide a way of structuring group brainstorming sessions.
Often the structure involves identifying possible causes under the headings of machinery, manpower, materials,
methods and money.
Yet in practice, any categorisation that comprehensively covers all relevant possible causes could be used.
www.studynotesunisa.co.za

105
Pareto diagrams
The purpose of the Pareto diagram (that was introduced in Chapter 12) is to distinguish between the ‘vital few'
issues and the 'trivial many'. It is a relatively straightforward technique which involves arranging items of
information on the types of problem or causes of problem into their order of
This can be used to highlight areas where further decision making will be useful.
Pareto analysis is based on the phenomenon of relatively few causes explaining the majority of effects. For
example, most revenue for any company is likely to come from relatively few of the company's customers.
See text book for these diagrams
Why-why analysis
Why-why analysis starts by stating the problem and asking why that problem has occurred.
Once the reasons for the problem occurring have been identified, each of the reasons is taken in turn and again
the question is asked why those reasons have occurred, and so on.
This procedure is continued until either a cause seems sufficiently self-contained to be addressed by itself or no
more answers to the question 'why?' can be generated.
www.studynotesunisa.co.za

![Storia dell'Arco 5 - [Brovelli] - Dispensa didattica Corso OPS Storico parte quinta- Iconografia dell'arco 1](https://static.fdokumen.com/doc/165x107/63203bb018429976e4061c8b/storia-dellarco-5-brovelli-dispensa-didattica-corso-ops-storico-parte-quinta-.jpg)


![Storia dell'Arco 7 - [Brovelli] - Dispensa didattica Corso OPS Storico parte settima - Iconografia dell'arco 3](https://static.fdokumen.com/doc/165x107/63203c17c5de3ed8a70da2a3/storia-dellarco-7-brovelli-dispensa-didattica-corso-ops-storico-parte-settima.jpg)