Magnetic Behavior of Single La$_{0.67}$Ca$_{0.33}$MnO$_3$ Nanotubes: Surface and Shape Effects
12
arXiv:0709.1707v2 [cond-mat.mes-hall] 14 Mar 2008 Magnetic Behavior of Single La 0.67 Ca 0.33 MnO 3 Nanotubes: Surface and Shape Effects M. I. Dolz, W. Bast, D. Antonio, H. Pastoriza, J. Curiale, and R. D. S´anchez Centro At´ omico Bariloche, Comisi´ on Nacional de Energ´ ıa At´ omica, Av. Bustillo 9500, R8402AGP S. C. de Bariloche, Argentina A. G. Leyva Centro At´ omico Constituyentes, Comisi´ on Nacional de Energ´ ıa At´ omica, Av. Gral Paz 1499 (1650) San Mart´ ın, Argentina (Dated: December 25, 2013) Abstract We report magnetization experiments in two magnetically isolated ferromagnetic nanotubes of perovskite La 0.67 Ca 0.33 MnO 3 . The results show that the magnetic anisotropy is determined by the sample shape although the coercive field is reduced by incoherent magnetization reversal modes. The temperature dependence of the magnetization reveals that the magnetic behavior is dominated by grain surface properties. These measurements were acquired using a Silicon micro-mechanical oscillator working in its resonant mode. The sensitivity was enough to measure the magnetic properties of these two samples with a mass lower than 14 picograms and to obtain for the first time the magnetization loop for one isolated nanotube. PACS numbers: 75.75.+a,85.85.+j,75.47.Lx Keywords: manganite, nanotube, MEMS 1
Transcript of Magnetic Behavior of Single La$_{0.67}$Ca$_{0.33}$MnO$_3$ Nanotubes: Surface and Shape Effects
arX
iv:0
709.
1707
v2 [
cond
-mat
.mes
-hal
l] 1
4 M
ar 2
008
Magnetic Behavior of Single La0.67Ca0.33MnO3 Nanotubes: Surface
and Shape Effects
M. I. Dolz, W. Bast, D. Antonio, H. Pastoriza, J. Curiale, and R. D. Sanchez
Centro Atomico Bariloche, Comision Nacional de Energıa Atomica,
Av. Bustillo 9500, R8402AGP S. C. de Bariloche, Argentina
A. G. Leyva
Centro Atomico Constituyentes, Comision Nacional de Energıa Atomica,
Av. Gral Paz 1499 (1650) San Martın, Argentina
(Dated: December 25, 2013)
Abstract
We report magnetization experiments in two magnetically isolated ferromagnetic nanotubes of
perovskite La0.67Ca0.33MnO3. The results show that the magnetic anisotropy is determined by the
sample shape although the coercive field is reduced by incoherent magnetization reversal modes.
The temperature dependence of the magnetization reveals that the magnetic behavior is dominated
by grain surface properties. These measurements were acquired using a Silicon micro-mechanical
oscillator working in its resonant mode. The sensitivity was enough to measure the magnetic
properties of these two samples with a mass lower than 14 picograms and to obtain for the first
time the magnetization loop for one isolated nanotube.
PACS numbers: 75.75.+a,85.85.+j,75.47.Lx
Keywords: manganite, nanotube, MEMS
1

I. INTRODUCTION
Manganites are complex oxides that adopt a pseudo-cubic perovskite crystal structure.
The discovery of colossal magnetoresistance in films of these materials [1] was a great leap
for the field of spintronics. The first impact was its use as electrodes in magnetic tunnel
junctions [2], giving tunnel magnetoresistance ratios one order of magnitude larger than of
those obtained with transition-metal electrodes. The fabrication of manganite nanotubes
are nowadays on the rise due to their several possible technological applications. These
nanotubes could impact on technology in different ways. One possible application is in
solid-oxide fuel cells. Manganites nanotubes make good cathodes thanks to their granular
structure where gases may be efficiently distributed and because they conduct both elec-
trons and oxygen ions, and are resistant to high-temperature oxidizing environments [3].
Another very important possible application of metallic manganites nanotubes in the field
of nanotechnology is as highly localized sources of electrons possessing spins of a particular
orientation, which can be perfectly aligned [4]. Manganite also exhibit challenging electronic
and magnetic properties because of their tendency to present coexistence of different phases
in a wide range of scale lengths [5]. The relative quantity of phases coexisting can be mod-
ified by means of small external forces due to the strong competition between the present
interactions. The ability to fabricate nanotubes (NT) of these compounds has recently
been demonstrated [6]. These nanostructures are usually studied by measurements in large
sets where the intrinsic response of individual structures is clouded by the global response.
Given the necessity of having a good characterization and knowledge of each of these com-
plex nanostructures this work is oriented towards the study of individual La0.67Ca0.33MnO3
(LCMO) NT magnetic properties.
In this paper, we show that the saturation magnetization temperature dependence ob-
tained for two isolated NT is clearly different from the bulk sample. We observe a lineal
temperature dependence. This behavior is explained having in mind the predominating sur-
face effects of each grain that constitutes a NT [7, 8, 9]. This granular structure favors the
existence of weak collective modes for the magnetization reversal that depress NT coercive
fields (Hc) respect to that expected by the shape anisotropy constant. But, the complete
magnetization loop obtained for one single NT shows a little increment of Hc respect to
those measured in a powder of NT and in a bulk sample [10]. One of the main achievements
2
of our work has been to obtain for the first time the complete loop of magnetization of one
isolated NT.
On the subject of measuring magnetic properties of small samples, several approaches
have been reported in the literature: microSQUIDs [11], which are very sensitive but con-
strained to low fields and low temperatures; Alternate Gradient Magnetometers (AGM) [12]
have also demonstrated high sensitivity [13] but quantitative measurements are difficult to
obtain since the measured signal strongly depends on the sample shape and on the exact
location of the sample in the field gradient [14]. Central to our approach is the use of Micro-
mechanical torsional oscillators as magnetometers. These systems fabricated with MEMS
technology, extend all the advantages of high-Q mechanical oscillators measurements [15] to
the microscopic scale and, before focusing on the results of this paper, we will explain how
it is possible to measure magnetic properties with these MEMS.
II. EXPERIMENTAL
In our experiments we used a variant of the micro-torsional oscillators presented by
Bolle et al. [16]. These poly-silicon oscillators were fabricated in the MEMSCAP [17]
foundry using its Multiuser process (MUMPS). Each oscillator consists of a 44 × 106 µm2
released plate anchored to the substrate by two serpentine springs. Fixed to the substrate,
underneath the plate, two electrodes are used for the driving and motion detection. A
100 mV peak-to-peak ac voltage is applied between one electrode and the plate to induce
the motion, and the change in capacitance is detected in the other electrode using a Phase
Sensitive Detection scheme tuned at twice the driving frequency. A more detailed description
of the experimental detection setup can be found elsewhere [18].
A powder of NT of LCMO was fabricated by the pore-filling method [19]. With this
procedure NT are build from grains of 25 nm in diameter [10]. A small amount of the
obtained conglomerated NT was placed on a lithographically patterned substrate where
individual NT were identified and selected using a scanning electron microscope (SEM).
The chosen NT were placed on top of a silicon micro-oscillator [18] using hydraulic micro-
manipulators under an optical microscope, and were glued to it with a sub-micrometer
drop of Apiezon c© N grease. In Fig. 1(b) we show a scanning electron micrograph of
the two NT glued on top of the MEMS oscillator. All the results reported in this paper
3

correspond to measurements done in two NT of 700 nm in diameter and 9.5 µm in length
placed perpendicular to the rotation axis of the oscillator and separated 40 µm (See Fig.
1(b)). At this distance the interaction between the NT is negligible as the dipolar magnetic
field, estimated from the expected maximum magnetization value, is slightly larger than the
earth magnetic field and two orders of magnitude lower than the necessary field to reverse
the magnetization of the NT. The measurements were taken in vacuum inside a closed-cycle
cryogenerator where the temperature can be varied between 14 and 300 K. The magnetic
field was provided by a split electromagnet that can be rotated in the plane perpendicular
to the axis of rotation of the oscillators with an accuracy of 1 ◦.
The experiment consists in measuring the oscillator‘s torsional mode resonant frequency
as a function of magnetic field and temperature. This is accomplished by sweeping the
driving frequency and detecting the oscillator amplitude. The measured amplitude is squared
and fitted with a lorentzian function, from which the resonant frequency and quality factor
are obtained. The natural resonant frequency (ν0) of an oscillator in the torsional mode is
given by: 2πν0 =√
ke
I, where ke ≃ 7.82 × 10⁻³ dyn · cm is the elastic restorative constant
of the serpentine springs and I = 3.8 × 10⁻¹⁴ g · cm2 is the plate’s moment of inertia. In
our oscillators this mode has a resonant frequency close to 72200 Hz and a quality factor Q
greater than 5 × 10⁴, which means that the width of the resonant peak is less than 2 Hz.
When we attach a magnetic sample to the oscillator the resonant frequency νr changes
to:
2πνr =
√
ke + kM
I, (1)
where kM is the variation in the effective elastic constant originated by the magnetic interac-
tion between the sample and the external magnetic field. For the experimental conditions I
does not change during the measurements and ∆ν << ν0. Therefore it is possible to express
kM ≃ 8π2Iν0∆ν, (2)
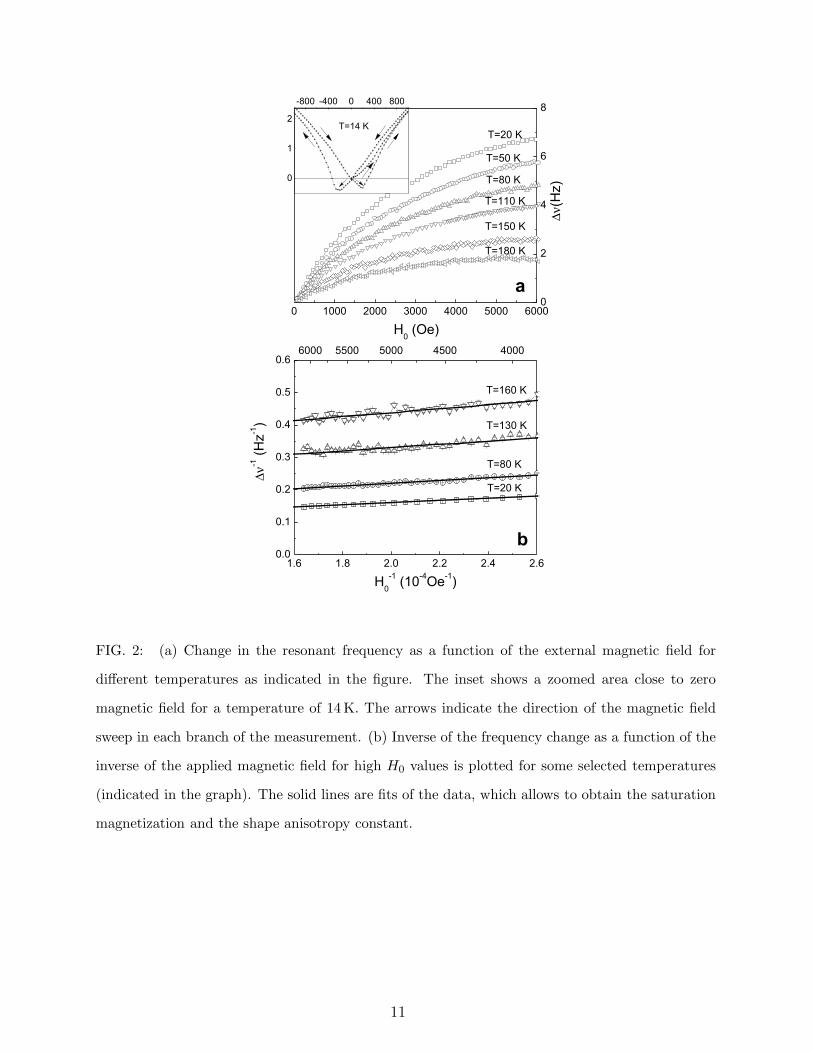
where ∆ν is the change in the resonant frequency. This change as a function of a magnetic
field applied parallel to the principal axis of the NT at different temperatures is showed
in Fig. 2(a). These results show that the oscillator is sensitive enough to detect the NT
magnetic response.
In our experiment the oscillatory motion produces a tilt between the fixed magnetic field
and the NT axis. At high magnetic fields, when the magnetization of the sample is saturated,
4
M = Ms and dMdH
= 0, the change in the resonant frequency can be written as [20]:
1
8π2Iν0∆ν≃
1
kM
=1
2KV+
1
MSV H0
(3)
where ∆ν is the change in the resonant frequency at a given magnetic field, V is the sample
volume, and K = 1
2NM2
S is the shape anisotropy energy density. From a linear square fit
of the high magnetic fields data the values for MSV and K are obtained. In Fig. 2(b) we
plot ∆ν−1 vs H−1
0for the data taken at some selected temperatures showing the excellent
correlation obtained with this linear fit in a wide range of fields. K depends on temperature
and its extrapolated value at T = 0K is 1.24 × 10⁻⁶ erg.
III. RESULTS AND DISCUSSION
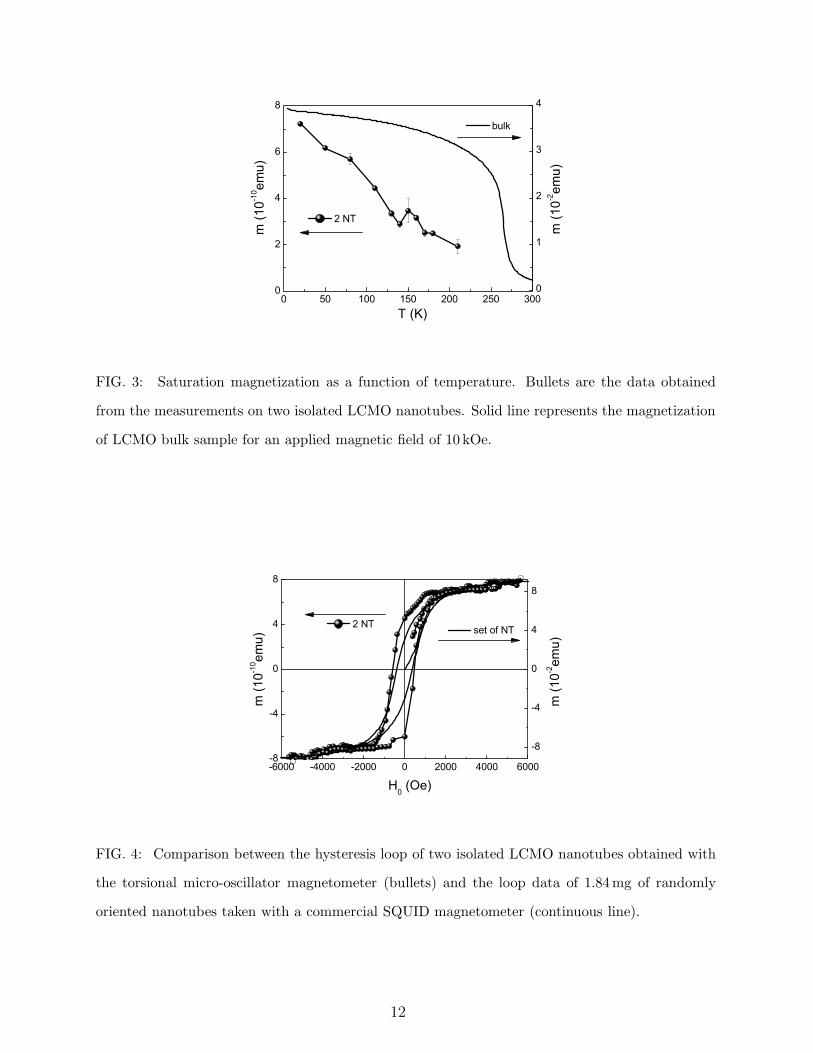
The saturation magnetization temperature dependence of our NT obtained with the
described procedure is plotted in Fig. 3. For comparison we have plotted in the same graph
the results obtained for a 0.40 mg piece of sintered LCMO taken in a commercial SQUID
magnetometer with an applied field of 10 kOe. Clearly the temperature dependence of the
individual NT magnetization differs from the bulk ferromagnet.
Magnetization measurements done in samples of varying sizes [7] have shown that the
diminution of grain size is associated with a decrease on the magnetization and a change in
the temperature dependence. The sample size reduction implies an increase on the surface
to volume ratio which means that surface effects become more relevant to describe the phys-
ical behavior of the sample. At the surface of crystalline grains the atomic coordination is
reduced and atomic disorder is much more important than in the bulk. In Manganese-based
perovskites the magnetic properties result from the interplay of many complex phenomena.
The ferromagnetic double-exchange spin–spin coupling competes with an anti-ferromagnetic
super exchange. Both are very sensitive to the Mn-O-Mn bond angle and distance. This
implies that the magnetization at the surface of these compounds is highly susceptible to sur-
face conditions. The magnetic modifications at the surface are usually argued as the origin of
a magnetic dead layer, but in general it affects in a more complex way the magnetic proper-
ties. The detailed description of the surface magnetism temperature dependence is strongly
dependent on the surface local conditions. In a mean field calculation it has been shown
[8] that the surface magnetization has a linear temperature dependence. Photo-emission
5
measurements of the surface magnetization performed in other manganese perovskite com-
pounds [9] show this linear temperature dependence, as obtained in our experiments. Taking
into account that our NT are built-up from grains of 25 nm in diameter [10] and the surface
magnetism could extend 2 nm in depth, approximately 50 % of the magnetic moments are
weakly correlated on the surface and dominate the global magnetic behavior.
The volume for the two NT is 2.32 × 10⁻¹² cm3, it was estimated from the external
dimensions measured in a SEM and assuming a nominal wall thickness of 60 nm [10]. Con-
sidering this volume and the bulk manganite density 6.03 g/cm3 [21], their total mass is
about 14 × 10−12 g. In consequence, the saturation magnetization per mass extrapolated
to 0 K is 52 emu/g (See Fig. 3) which is greater than the value obtained for a powder of
these NT [10] and is less than the bulk LCMO value (98 emu/g). The difference with the
bulk‘s value can be assumed by the existence of a magnetic dead layer in each grain that
constitutes the wall of the NT. Considering that the ratio between the obtained saturation
magnetization and the bulk value (0.53) should be equal to the ratio between the magnetic
core and the total grain volume (with an average diameter of 26 nm [10]), we can estimate
the width of this magnetic dead layer. Its estimated value is around 2 nm and is very close to
the 1.6± 0.4 nm value obtained from the saturation magnetization of a powder of randomly
oriented NT. Due to the granular morphology of the NT, the dead layer thickness obtained
from our results must be taken as a superior limit. The NT density is smaller than the bulk,
which means that the real mass of the NT is lower than calculated and the dead layer is
smaller.
In order to obtain the full magnetization loop in our experiments it must be noted that
the restorative constant kM generated by the magnetic sample has to be evaluated through
the second derivative of the magnetic free energy respect to the displacement angle θ between
the sample and the magnetic field. The magnetic energy density for a ferromagnetic sample
with uniaxial anisotropy in a magnetic field can be described by:
E = − ~M · ~H0 +1
2N | ~M|2 sin2(ϕ)
= −MH0 cos(θ − ϕ) +NM2
2sin2(ϕ) (4)
where ~M is the sample magnetization, ~H0 is the external magnetic field, N is the difference
between the demagnetization factors of the magnetic hard and easy directions, and ϕ is the
angle between the magnetization vector and the easy direction of the sample (See Fig. 1(a)).
6
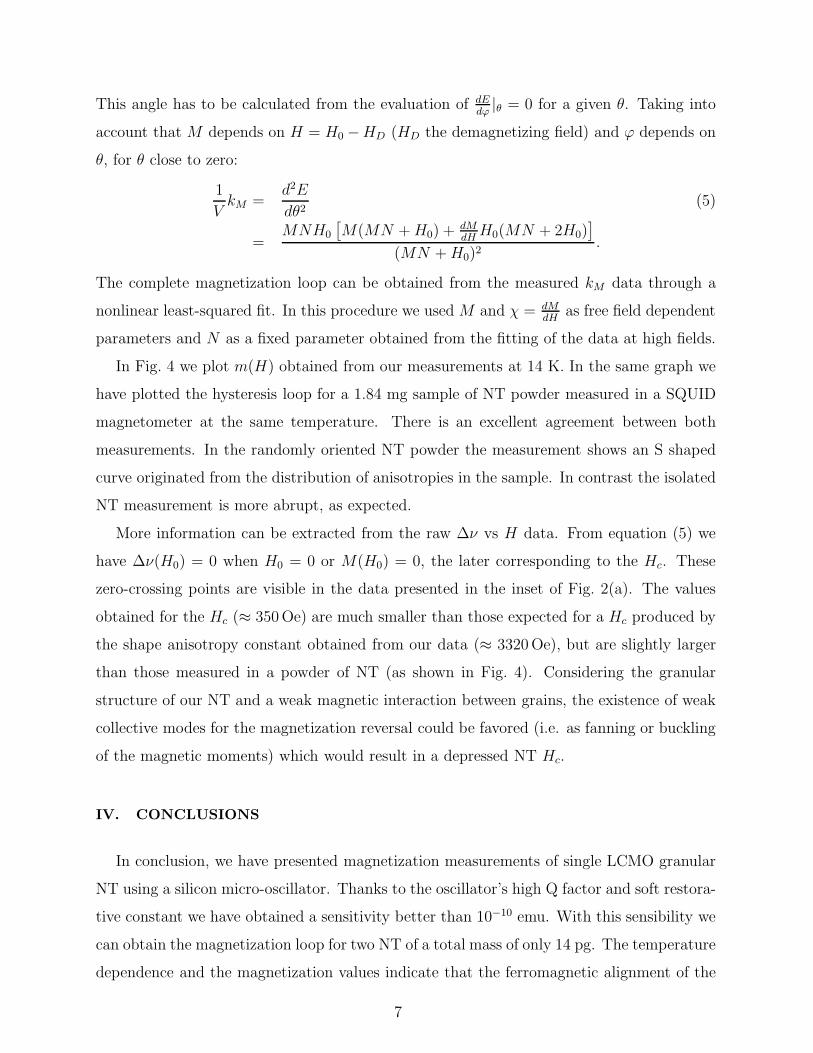
This angle has to be calculated from the evaluation of dEdϕ|θ = 0 for a given θ. Taking into
account that M depends on H = H0 −HD (HD the demagnetizing field) and ϕ depends on
θ, for θ close to zero:
1
VkM =
d2E
dθ2(5)
=MNH0
[
M(MN + H0) + dMdH
H0(MN + 2H0)]
(MN + H0)2.
The complete magnetization loop can be obtained from the measured kM data through a
nonlinear least-squared fit. In this procedure we used M and χ = dMdH
as free field dependent
parameters and N as a fixed parameter obtained from the fitting of the data at high fields.
In Fig. 4 we plot m(H) obtained from our measurements at 14 K. In the same graph we
have plotted the hysteresis loop for a 1.84 mg sample of NT powder measured in a SQUID
magnetometer at the same temperature. There is an excellent agreement between both
measurements. In the randomly oriented NT powder the measurement shows an S shaped
curve originated from the distribution of anisotropies in the sample. In contrast the isolated
NT measurement is more abrupt, as expected.
More information can be extracted from the raw ∆ν vs H data. From equation (5) we
have ∆ν(H0) = 0 when H0 = 0 or M(H0) = 0, the later corresponding to the Hc. These
zero-crossing points are visible in the data presented in the inset of Fig. 2(a). The values
obtained for the Hc (≈ 350 Oe) are much smaller than those expected for a Hc produced by
the shape anisotropy constant obtained from our data (≈ 3320 Oe), but are slightly larger
than those measured in a powder of NT (as shown in Fig. 4). Considering the granular
structure of our NT and a weak magnetic interaction between grains, the existence of weak
collective modes for the magnetization reversal could be favored (i.e. as fanning or buckling
of the magnetic moments) which would result in a depressed NT Hc.
IV. CONCLUSIONS
In conclusion, we have presented magnetization measurements of single LCMO granular
NT using a silicon micro-oscillator. Thanks to the oscillator’s high Q factor and soft restora-
tive constant we have obtained a sensitivity better than 10−10 emu. With this sensibility we
can obtain the magnetization loop for two NT of a total mass of only 14 pg. The temperature
dependence and the magnetization values indicate that the ferromagnetic alignment of the
7
moments are affected by the grain surface, where the spin coupling is reduced from that at
the core of each particle. The results are consistent with those of a ferromagnetic material
with the shape anisotropy given by a cylindrical geometry. The measured Hc suggests the
existence of magnetization reversal processes that can overcome the energy barrier given by
this anisotropy constant.
V. ACKNOWLEDGMENTS
This work was partially supported by ANPCyT grant PICT04-03-21372. M. I. D., D.
A. and J. C. fellowship holders of CONICET. R. D. S. and H. P. research members of
CONICET. We thank F. de la Cruz for a careful reading of the manuscript.
[1] S. Jin, T. H. Tiefel, M. McCormack, R. A. Fastnacht, R. Ramesh, and L. H. Chen, Science
264, 413 (1994).
[2] Y. Lu, W. Li, G. Gong, G. Xiao, A. Gupta, P. Lecoeur, J. Sun, Y. Wang, and V. Dravid,
Phys. Rev. B 54, R8357 (1996).
[3] A. G. Leyva, J. Curiale, H. Troiani, M. Rosenbusch, P. Levy, and R. D. Sanchez, Advances
and Science and Technology 51, 54 (2006).
[4] M. Bowen, M. Bibes, A. Barthlmy, J. P. Contour, A. Anane, and Y. Lemaitre, Appl. Phys.
Lett. 82, 233 (2003).
[5] N. Mathur and P. Littlewood, Physics Today 56, 25 (2003).
[6] P. Levy, A. G. Leyva, H. Troiani, and R. D. Sanchez, Appl. Phys. Lett. 83, 5247 (2003).
[7] R. D. Sanchez, J. Rivas, C. Vazquez-Vazquez, A. Lopez-Quintela, M. T. Causa, M. Tovar,
and S. Oseroff, Appl. Phys. Lett. 68, 134 (1996).
[8] T. Kaneyoshi, Introduction to Surface Magnetism (CRC Press, Inc., Boca Raton, Florida,
USA, 1990), ISBN 0-8493-6687-9.
[9] J.-H. Park, E. Vescovo, H.-J. Kim, C. Kwon, R. Ramesh, and T. Venkatesan, Phys. Rev. Lett
81, 1953 (1998).
[10] J. Curiale, R. D. Sanchez, H. E. Troiani, C. Ramos, H. Pastoriza, A. G. Leyva, and P. Levy,
Phys. Rev. B 75, 224410 (2007).
8
[11] W. Wernsdorfet, B. Doudin, D. Mailly, K. Hasselbach, A. Benoit, J. Meier, J.-P. Ansermet,
and F. Barbara, Phys. Rev. Lett. 77, 1873 (1996).
[12] H. Zijlstra, Rev. Sci. Instrum. 41, 1241 (1970).
[13] M. Todorovic and S. Schultz, Appl. Phys. Lett. 73, 3595 (1998).
[14] M. Barbic, Rev. Sci. Instrum. 75, 5016 (2004).
[15] R. N. Kleiman, G. K. Kaminsky, J. D. Reppy, R. Pindak, and D. J. Bishop, Rev. Sci. Intrum.
56, 2088 (1985).
[16] C. A. Bolle, V. Aksyuk, F. Pardo, P. L. Gammel, E. Zeldov, E. Bucher, R. Boie, D. J. Bishop,
and D. R. Nelson, Nature 399, 43 (1999).
[17] MEMSCAP Inc., 4021 Stirrup Creek Drive, Durham, NC 27703, USA, URL
http://www.memscap.com.
[18] M. Dolz, D. Antonio, and H. Pastoriza, Physica B 398, 329 (2007).
[19] A. G. Leyva, P. Stoliar, M. Rosenbusch, V. Lorenzo, P. Levy, C. Albonetti, M. Cavallini,
F. Biscarini, H. E. Troiani, J. Curiale, et al., J. Solid State Chem. 177, 3949 (2004).
[20] J. Morillo, Q. Su, B. Panchapakesan, M. Wuttig, and D. Novotny, Rev. Sci. Instrum. 69, 3908
(1998).
[21] M. C. Sanchez, J. Blasco, J. Garca, J. Stankiewicz, J. M. D. Teresa, and M. R. Ibarra, J.
Solid State Chem. 138, 226 (1998).
9
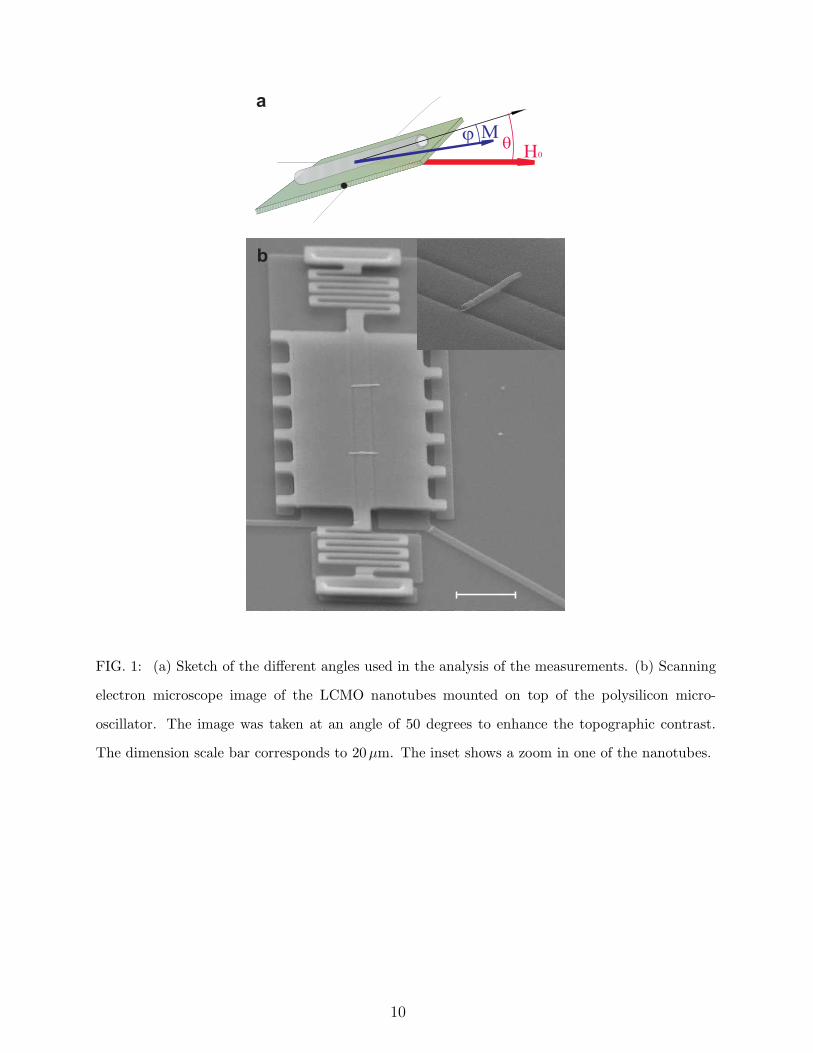
FIG. 1: (a) Sketch of the different angles used in the analysis of the measurements. (b) Scanning
electron microscope image of the LCMO nanotubes mounted on top of the polysilicon micro-
oscillator. The image was taken at an angle of 50 degrees to enhance the topographic contrast.
The dimension scale bar corresponds to 20µm. The inset shows a zoom in one of the nanotubes.
10
0 1000 2000 3000 4000 5000 60000
2
4
6
8
1.6 1.8 2.0 2.2 2.4 2.60.0
0.1
0.2
0.3
0.4
0.5
0.66000 5500 5000 4500 4000
0
1
2
-800 -400 0 400 800
T=14 K
T=50 K
∆ν(H
z)
T=180 K
T=150 K
T=110 K
T=80 K
T=20 K
a
b
T=20 K
T=80 K
T=130 K
H0 (Oe)
T=160 K
H0
-1 (10
-4Oe
-1)
∆ν
-1 (
Hz
-1)
FIG. 2: (a) Change in the resonant frequency as a function of the external magnetic field for
different temperatures as indicated in the figure. The inset shows a zoomed area close to zero
magnetic field for a temperature of 14 K. The arrows indicate the direction of the magnetic field
sweep in each branch of the measurement. (b) Inverse of the frequency change as a function of the
inverse of the applied magnetic field for high H0 values is plotted for some selected temperatures
(indicated in the graph). The solid lines are fits of the data, which allows to obtain the saturation
magnetization and the shape anisotropy constant.
11
0 50 100 150 200 250 3000
2
4
6
8
0
1
2
3
4
T (K)
2 NT
m (
10
-2em
u)
m (
10
-10em
u)
bulk
FIG. 3: Saturation magnetization as a function of temperature. Bullets are the data obtained
from the measurements on two isolated LCMO nanotubes. Solid line represents the magnetization
of LCMO bulk sample for an applied magnetic field of 10 kOe.
-6000 -4000 -2000 0 2000 4000 6000-8
-4
0
4
8
-8
-4
0
4
8
m (
10
-2em
u)
m (
10
-10em
u)
2 NT
H0 (Oe)
set of NT
FIG. 4: Comparison between the hysteresis loop of two isolated LCMO nanotubes obtained with
the torsional micro-oscillator magnetometer (bullets) and the loop data of 1.84mg of randomly
oriented nanotubes taken with a commercial SQUID magnetometer (continuous line).
12