Hitachi Ops Center Analyzer User Guide
184
Hitachi Ops Center Analyzer 10.8.1 User Guide MK-99ANA002-02 February 2022
-
Upload
khangminh22 -
Category
Documents
-
view
1 -
download
0
Transcript of Hitachi Ops Center Analyzer User Guide
Hitachi Ops CenterAnalyzer10.8.1
User Guide
MK-99ANA002-02February 2022

© 2016, 2022 Hitachi, Ltd. All rights reserved.
No part of this publication may be reproduced or transmitted in any form or by any means, electronic or mechanical, including copying and recording,or stored in a database or retrieval system for commercial purposes without the express written permission of Hitachi, Ltd., or Hitachi Vantara LLC(collectively “Hitachi”). Licensee may make copies of the Materials provided that any such copy is: (i) created as an essential step in utilization of theSoftware as licensed and is used in no other manner; or (ii) used for archival purposes. Licensee may not make any other copies of the Materials.“Materials” mean text, data, photographs, graphics, audio, video and documents.
Hitachi reserves the right to make changes to this Material at any time without notice and assumes no responsibility for its use. The Materials containthe most current information available at the time of publication.
Some of the features described in the Materials might not be currently available. Refer to the most recent product announcement for information aboutfeature and product availability, or contact Hitachi Vantara LLC at https://support.hitachivantara.com/en_us/contact-us.html.
Notice: Hitachi products and services can be ordered only under the terms and conditions of the applicable Hitachi agreements. The use of Hitachiproducts is governed by the terms of your agreements with Hitachi Vantara LLC.
By using this software, you agree that you are responsible for:
1. Acquiring the relevant consents as may be required under local privacy laws or otherwise from authorized employees and other individuals; and
2. Verifying that your data continues to be held, retrieved, deleted, or otherwise processed in accordance with relevant laws.
Notice on Export Controls. The technical data and technology inherent in this Document may be subject to U.S. export control laws, including theU.S. Export Administration Act and its associated regulations, and may be subject to export or import regulations in other countries. Reader agrees tocomply strictly with all such regulations and acknowledges that Reader has the responsibility to obtain licenses to export, re-export, or import theDocument and any Compliant Products.
Hitachi and Lumada are trademarks or registered trademarks of Hitachi, Ltd., in the United States and other countries.
AIX, AS/400e, DB2, Domino, DS6000, DS8000, Enterprise Storage Server, eServer, FICON, FlashCopy, GDPS, HyperSwap, IBM, Lotus, MVS, OS/390, PowerHA, PowerPC, RS/6000, S/390, System z9, System z10, Tivoli, z/OS, z9, z10, z13, z14, z/VM, and z/VSE are registered trademarks ortrademarks of International Business Machines Corporation.
Active Directory, ActiveX, Bing, Edge, Excel, Hyper-V, Internet Explorer, the Internet Explorer logo, Microsoft, the Microsoft corporate logo, theMicrosoft Edge logo, MS-DOS, Outlook, PowerPoint, SharePoint, Silverlight, SmartScreen, SQL Server, Visual Basic, Visual C++, Visual Studio,Windows, the Windows logo, Windows Azure, Windows PowerShell, Windows Server, the Windows start button, and Windows Vista are registeredtrademarks or trademarks of Microsoft Corporation. Microsoft product screen shots are reprinted with permission from Microsoft Corporation.
All other trademarks, service marks, and company names in this document or website are properties of their respective owners.
Copyright and license information for third-party and open source software used in Hitachi Vantara products can be found at https://www.hitachivantara.com/en-us/company/legal.html.
Hitachi Ops Center Analyzer User Guide 2

Contents
Preface......................................................................................................9Product version....................................................................................................9Intended audience............................................................................................... 9Release notes......................................................................................................9Related documents..............................................................................................9Document conventions........................................................................................ 9Conventions for storage capacity values........................................................... 11Accessing product documentation.....................................................................12Getting help........................................................................................................12Comments..........................................................................................................12
Chapter 1: Ops Center Analyzer overview..............................................13Product overview............................................................................................... 13
Features of Ops Center Analyzer.................................................................14Unified infrastructure monitoring dashboard........................................... 14Advanced reporting.................................................................................15SLO management...................................................................................16End-to-end monitoring.............................................................................16Problem identification and root cause analysis.......................................17Storage I/O controls................................................................................ 17Hitachi Ops Center Automator integration.............................................. 17Risk management capability................................................................... 18
Getting started in your Ops Center Analyzer environment................................ 18Logging on to Ops Center Analyzer ............................................................ 18Accessing Ops Center Analyzer detail view.................................................19Launching Ops Center Automator from Ops Center Analyzer..................... 19Setting up a monitoring environment for your infrastructure resources........19
Chapter 2: Quick access to vital performance reports............................ 21Dashboard overview.......................................................................................... 21System Status Summary for Consumers and User Resources.........................23
System Status Summary for Consumers..................................................... 23System Status Summary for User Resources..............................................24
System Resource Status report.........................................................................24Event Trends report........................................................................................... 25
ContentsHitachi Ops Center Analyzer User Guide 3

Resource Events report..................................................................................... 26System and Resource Events...................................................................... 26
Sending dashboard reports to users..................................................................27Customizing the dashboard............................................................................... 28
Chapter 3: Creating custom reports........................................................30Custom reports overview................................................................................... 30Creating custom reports.....................................................................................31Managing custom reports.................................................................................. 33Examples of creating custom reports................................................................ 33
Creating a line graph.................................................................................... 34Creating a table report..................................................................................37Sample queries.............................................................................................39
Chapter 4: Analyzing performance problems..........................................40Identifying performance problems..................................................................... 40Infrastructure components and key performance metrics..................................41Analytics workflow..............................................................................................43Detecting performance problems.......................................................................43Analyzing performance bottlenecks...................................................................44
Identifying the bottleneck in E2E view..........................................................45Comparing performance trends in Sparkline view........................................48
Identifying affected resources............................................................................49Analyzing the cause of the bottleneck............................................................... 49
Analyzing shared resources......................................................................... 50Analyzing configuration changes..................................................................51
Checking recovery plans....................................................................................52Executing actions...............................................................................................53Submitting services through Ops Center Automator......................................... 55Granular data collection.....................................................................................55
Collecting granular data............................................................................... 56Using Hitachi Ops Center Analyzer for data analysis: from deep dive torecovery planning...............................................................................................59
Chapter 5: Analyzing performance trends with predictive analyticsrisk reporting........................................................................................... 68
Predictive analytics risk reporting overview....................................................... 68Anticipate performance trends .................................................................... 68About predictive risk profiles.........................................................................69About predictive risk report definitions......................................................... 69Predictive analytics risk reporting workflow..................................................70
Adding the Predictive Analytics license............................................................. 70Creating a predictive risk profile.........................................................................71
ContentsHitachi Ops Center Analyzer User Guide 4

Creating risk report definitions........................................................................... 71Generating a risk report..................................................................................... 72Understanding performance trend projections in risk reports............................ 73Enhancing infrastructure management capabilities........................................... 74
Periodic analysis with predictive analytics risk reporting..............................77E2E View analysis with predictive analytics risk reporting........................... 79Preventive actions and predictive analytics risk reporting............................81
Chapter 6: Optimizing infrastructure resources with storage I/Ocontrols....................................................................................................83
I/O control overview........................................................................................... 83I/O control operations................................................................................... 83Requirements............................................................................................... 84Search capabilities for target volumes......................................................... 84Upper limit setting metrics............................................................................ 84
Use cases for setting upper limits......................................................................84I/O control settings for an SLO..................................................................... 85I/O controls for optimizing infrastructure resources......................................85I/O controls for optimizing performance after the bottleneck analysis..........85
Performing storage I/O control tasks in Ops Center Analyzer with OpsCenter Automator...............................................................................................87
Setting I/O control limits................................................................................87Clearing I/O control limits............................................................................. 88
Chapter 7: Configuring resource monitoring........................................... 89Overview of managing and monitoring infrastructure resources....................... 89Resource monitoring settings............................................................................ 90Dynamic thresholds........................................................................................... 91
Advantages of dynamic thresholds.............................................................. 91Determining if the computed value is correct............................................... 91Automatic calculation of baseline values......................................................91Monitoring using a dynamic threshold..........................................................93
Dynamic threshold monitoring margins...................................................94Selecting the dynamic threshold margin................................................. 94
Static thresholds................................................................................................ 95Setting static thresholds using monitoring profiles....................................... 96
................................................................................................................ 97Monitoring using a static threshold...............................................................98
About default profiles for volumes (user) and arrays (system).......................... 98Setting thresholds for user resources.............................................................. 101Creating a user resource assignment rule.......................................................102Changing user resource assignment rule priority............................................ 102
ContentsHitachi Ops Center Analyzer User Guide 5

Running a user resource assignment rule....................................................... 103Setting thresholds for system resources..........................................................103Removing monitored resources.......................................................................104
Chapter 8: Managing consumers..........................................................107Consumer settings...........................................................................................107Creating a consumer........................................................................................108Creating a resource assignment rule...............................................................108Changing a resource assignment rule priority................................................. 109Running a resource assignment rule............................................................... 109
Chapter 9: Setting notifications............................................................. 110Email notification settings.................................................................................110Configuring the mail server.............................................................................. 110Creating a condition profile...............................................................................111Enabling or disabling email addresses.............................................................111
Chapter 10: Managing users.................................................................112User management............................................................................................112User permissions for Hitachi Ops Center Automator services ........................114Configuring external authentication for users...................................................114Configuring external authentication for groups................................................ 115Security............................................................................................................ 116
Chapter 11: Additional dashboard reports.............................................117System Status Summary for Storage Resources.............................................117
System Status Summary for Volumes........................................................ 117System Status Summary for System Resources........................................118
System Status Summary for Infrastructure Resources....................................118System Status Summary for User Resources............................................ 118System Resource Status report..................................................................119
Consumer reports............................................................................................ 120Consumer Summary report........................................................................ 120Consumers report.......................................................................................120Consumers - Critical report.........................................................................121Consumers - Critical Each Grade report.................................................... 121
VM reports....................................................................................................... 122VM Summary report................................................................................... 122VMs report..................................................................................................123VMs - Critical.............................................................................................. 123VM CPU Ready report................................................................................124VM NIC Dropped report..............................................................................124VM Disk Latency report.............................................................................. 125
ContentsHitachi Ops Center Analyzer User Guide 6

Total VMs report......................................................................................... 125Volume reports.................................................................................................126
Volume Summary report.............................................................................126Volumes report........................................................................................... 126Volumes - Critical report............................................................................. 127Volume IO Rate report................................................................................127Volume IOPS report....................................................................................128Volume Response Time report................................................................... 128Total Volumes report...................................................................................129
Host reports..................................................................................................... 129Hosts report................................................................................................129Hosts - Critical report..................................................................................129Total Hosts report....................................................................................... 130
User resource reports...................................................................................... 130Total User Resources report.......................................................................130
Hypervisor reports............................................................................................131Hypervisors report...................................................................................... 131Total Hypervisors report..............................................................................132
Switch reports.................................................................................................. 132Switches report...........................................................................................132Total Switches report.................................................................................. 133
Storage system reports....................................................................................133Storage Systems report..............................................................................133Total Storage Systems report..................................................................... 134
System resource reports..................................................................................134System Resource Summary report............................................................ 134System Resources - Critical report.............................................................135System Resources report...........................................................................135Total System Resources report.................................................................. 135
Event reports....................................................................................................136System Event Status report........................................................................136Resource Event Status report.................................................................... 136
Capacity reports...............................................................................................137Capacity of VMware Datastores report...................................................... 137Capacity of VMware Datastores with Usage Exceeding 80% report..........137Capacity by Storage System report............................................................138Capacity by Storage System report (HUS 100 Storage Systems)............. 139Saving Ratio by Storage System report..................................................... 139Total Efficiency by Storage System report..................................................140Capacity of Drive Types by Storage System report (HDP).........................141Capacity of Drive Types by Storage System report (HDT).........................143
ContentsHitachi Ops Center Analyzer User Guide 7

Capacity of Drive Types by Storage System report (HUS 100 StorageSystems).....................................................................................................145Capacity by Pool report.............................................................................. 147Capacity by Pool report (HUS 100 Storage Systems)................................148Total Efficiency by Pool report.................................................................... 149Capacity by Consumer report.....................................................................150Capacity by Consumer in the Past 6 Months report...................................150Capacity by Consumer report (HUS 100 Storage Systems)...................... 151Capacity by Consumer in the Past 6 Months report (HUS 100 StorageSystems).....................................................................................................151
Chapter 12: Performance analytics and best practices........................ 153Understanding utilization................................................................................. 153Utilization metrics.............................................................................................154Performance analysis...................................................................................... 155Performance analysis example........................................................................156Performance troubleshooting best practices................................................... 157
Appendix A: Definition file templates.................................................... 159Setting event actions....................................................................................... 159
Defining a file for running an event action.................................................. 159Event action definition file format............................................................... 160
Format of the email template definition file...................................................... 161Command template definition files formats......................................................166
Appendix B: Troubleshooting................................................................ 172Solving performance problems........................................................................ 172Troubleshooting granular data collection error codes......................................176
Index..................................................................................................181
ContentsHitachi Ops Center Analyzer User Guide 8

Preface
Product version
This document revision applies to Hitachi Ops Center Analyzer v10.8.1 or later.
Intended audience
This document provides an overview of the Hitachi Ops Center Analyzer software. Thisdocument is intended for storage administrators and infrastructure administrators.
Release notesRead the release notes before installing and using this product. They may containrequirements or restrictions that are not fully described in this document or updates orcorrections to this document. Release notes are available on the Hitachi Vantara SupportWebsite: https://knowledge.hitachivantara.com/Documents.
Related documentsThe following documents are referenced or contain more information about the featuresdescribed in this manual.■ Hitachi Ops Center Analyzer Installation and Configuration Guide, MK-99ANA001-00■ Hitachi Ops Center Analyzer Detail View Query Language User Guide, MK-99ANA006-00■ Hitachi Ops Center Analyzer Detail View Metrics Reference Guide, MK-99ANA005-00
Document conventionsThis document uses the following typographic conventions:
PrefaceHitachi Ops Center Analyzer User Guide 9

Convention Description
Bold ■ Indicates text in a window, including window titles, menus, menuoptions, buttons, fields, and labels. Example:
Click OK.■ Indicates emphasized words in list items.
Italic ■ Indicates a document title or emphasized words in text.■ Indicates a variable, which is a placeholder for actual text provided
by the user or for output by the system. Example:
pairdisplay -g group
(For exceptions to this convention for variables, see the entry forangle brackets.)
Monospace Indicates text that is displayed on screen or entered by the user.Example: pairdisplay -g oradb
< > anglebrackets
Indicates variables in the following scenarios:■ Variables are not clearly separated from the surrounding text or
from other variables. Example:
Status-<report-name><file-version>.csv
■ Variables in headings.
[ ] squarebrackets
Indicates optional values. Example: [ a | b ] indicates that you canchoose a, b, or nothing.
{ } braces Indicates required or expected values. Example: { a | b } indicates thatyou must choose either a or b.
| vertical bar Indicates that you have a choice between two or more options orarguments. Examples:
[ a | b ] indicates that you can choose a, b, or nothing.
{ a | b } indicates that you must choose either a or b.
This document uses the following icons to draw attention to information:
Icon Label Description
Note Calls attention to important or additional information.
Document conventions
PrefaceHitachi Ops Center Analyzer User Guide 10
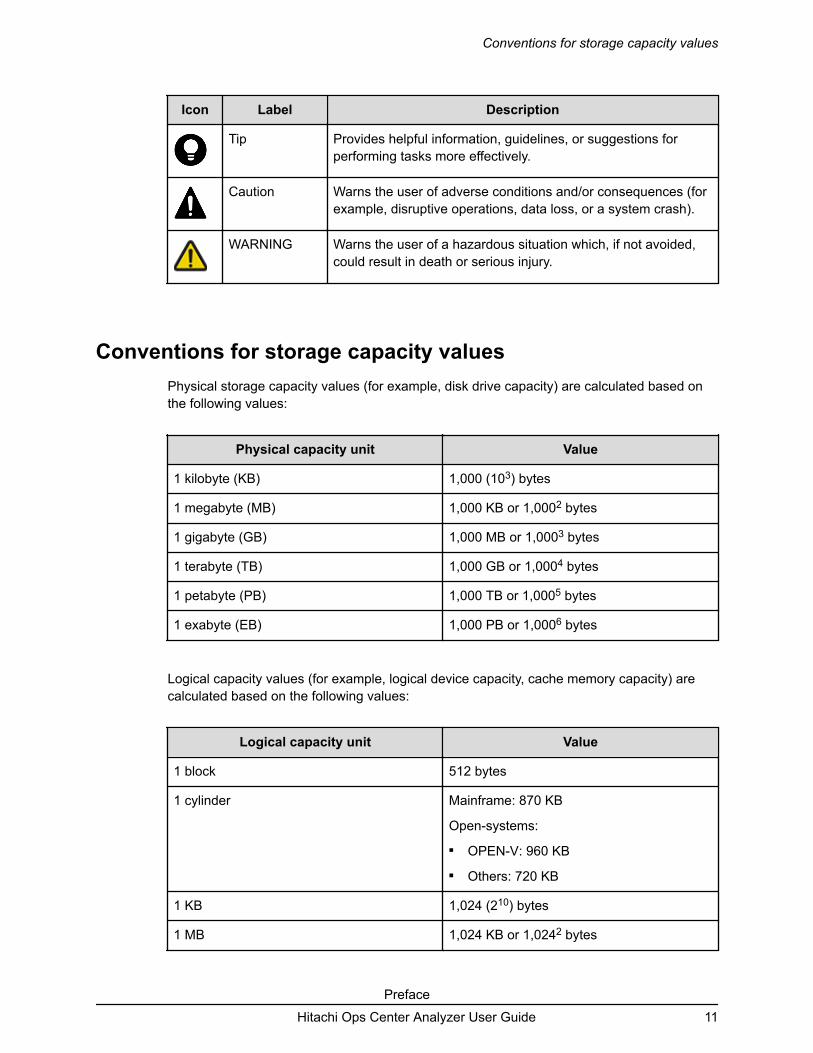
Icon Label Description
Tip Provides helpful information, guidelines, or suggestions forperforming tasks more effectively.
Caution Warns the user of adverse conditions and/or consequences (forexample, disruptive operations, data loss, or a system crash).
WARNING Warns the user of a hazardous situation which, if not avoided,could result in death or serious injury.
Conventions for storage capacity valuesPhysical storage capacity values (for example, disk drive capacity) are calculated based onthe following values:
Physical capacity unit Value
1 kilobyte (KB) 1,000 (103) bytes
1 megabyte (MB) 1,000 KB or 1,0002 bytes
1 gigabyte (GB) 1,000 MB or 1,0003 bytes
1 terabyte (TB) 1,000 GB or 1,0004 bytes
1 petabyte (PB) 1,000 TB or 1,0005 bytes
1 exabyte (EB) 1,000 PB or 1,0006 bytes
Logical capacity values (for example, logical device capacity, cache memory capacity) arecalculated based on the following values:
Logical capacity unit Value
1 block 512 bytes
1 cylinder Mainframe: 870 KB
Open-systems:■ OPEN-V: 960 KB■ Others: 720 KB
1 KB 1,024 (210) bytes
1 MB 1,024 KB or 1,0242 bytes
Conventions for storage capacity values
PrefaceHitachi Ops Center Analyzer User Guide 11

Logical capacity unit Value
1 GB 1,024 MB or 1,0243 bytes
1 TB 1,024 GB or 1,0244 bytes
1 PB 1,024 TB or 1,0245 bytes
1 EB 1,024 PB or 1,0246 bytes
Accessing product documentationProduct user documentation is available on the Hitachi Vantara Support Website: https://knowledge.hitachivantara.com/Documents. Check this site for the most currentdocumentation, including important updates that may have been made after the release ofthe product.
Getting helpThe Hitachi Vantara Support Website is the destination for technical support of products andsolutions sold by Hitachi Vantara. To contact technical support, log on to the Hitachi VantaraSupport Website for contact information: https://support.hitachivantara.com/en_us/contact-us.html.
Hitachi Vantara Community is a global online community for Hitachi Vantara customers,partners, independent software vendors, employees, and prospects. It is the destination toget answers, discover insights, and make connections. Join the conversation today! Go tocommunity.hitachivantara.com, register, and complete your profile.
CommentsPlease send us your comments on this document to [email protected] the document title and number, including the revision level (for example, -07), andrefer to specific sections and paragraphs whenever possible. All comments become theproperty of Hitachi Vantara LLC.
Thank you!
Accessing product documentation
PrefaceHitachi Ops Center Analyzer User Guide 12

Chapter 1: Ops Center Analyzer overviewOps Center Analyzer is data center management software for monitoring and reporting end-to-end performance from hosts through shared storage resources.
Product overviewWith Hitachi Ops Center Analyzer, you can define and monitor storage service-levelobjectives (SLOs) for resource performance. You can identify and analyze historicalperformance trends to optimize storage system performance and plan for capacity growth.
Using Ops Center Analyzer, you register resources (storage systems, hosts, servers, andvolumes) and set service-level thresholds. You are alerted to threshold violations andpossible performance problems (bottlenecks). Using analytics tools, you find which resourcehas a problem and analyze its cause to help solve the problem.
The following figure shows how Ops Center Analyzer ensures the performance of yourstorage environment based on real-time SLOs.
Chapter 1: Ops Center Analyzer overviewHitachi Ops Center Analyzer User Guide 13

The system administrator uses Ops Center Analyzer to manage and monitor the ITinfrastructure based on SLOs, which match the service-implementation guidelines that arenegotiated under a service-level agreement (SLA) with consumers.
Ops Center Analyzer monitors the health of the IT infrastructure using performance indicatorsand generates alerts when SLOs are at risk.
Having data center expertise, the service administrator uses Ops Center Analyzer to assignresources, such as VMs and storage capacity from registered storage systems, to consumerapplications. This manages critical SLO violations and ensures that service performancemeets the SLAs.
Features of Ops Center AnalyzerOps Center Analyzer provides IT analytics capabilities and business benefits.
Unified infrastructure monitoring dashboard
Ops Center Analyzer dashboards are visual representations of the performance metrics ofyour infrastructure resources. The consolidated view allows you to quickly interpret theperformance metrics and identify performance problems.
Features of Ops Center Analyzer
Chapter 1: Ops Center Analyzer overviewHitachi Ops Center Analyzer User Guide 14

The consolidated dashboard view allows for the unified management of the server, storage,and network infrastructure resources. You can ensure the health of your data center byproactively monitoring the consumer groups, storage components, volumes, VMs, servers,and network devices. The advanced visual analytics aid in visualizing the performance datain easy-to-use graphs and charts. The visual cues allow for intuitive performancemanagement.
The functions of the Ops Center Analyzer dashboard are as follows:■ Displays performance metrics summaries for the monitored resources.■ Displays warnings and critical alerts that need immediate action.■ Displays performance trends.■ Allows you to drill down from summary reports to detailed reports.■ Provides the ability to navigate to the E2E topology view for detailed analysis.
Advanced reporting
Ops Center Analyzer reporting capabilities enable you to monitor the infrastructure resourcesand assess their current performance, capacity, and utilization. Reporting data provides youthe information you need to make informed business decisions and plan for future growth.
Ops Center Analyzer supports both standard and custom reporting capabilities.
In-depth reporting
Standard reports■ Default reports: The first time you log on to Ops Center Analyzer, the dashboard shows
the following reports by default: System Status Summary for Consumers and UserResources, Event Trends, System Resource Status, and Resource Events. You cancustomize which reports display by default.
■ Critical reports: Critical reports show resources in your storage infrastructure that haveexceeded their thresholds. Critical reports are available for consumers, VMs, volumes,hosts, and system resources.
Advanced reporting
Chapter 1: Ops Center Analyzer overviewHitachi Ops Center Analyzer User Guide 15

■ Summary reports: Summary reports give you a high-level view of storage infrastructureresources. These reports are available for consumers, VMs, volumes, and systemresources. Each summary report shows the number of resources with critical and warningalerts.
■ Capacity reports: Capacity reports give you a measure of the capacity consumption ofyour data center resources and enable you to optimize the capacity usage of the existingstorage resources. By monitoring the capacity reports, you can forecast future capacityrequirements of your data center.
■ Other reports: Ops Center Analyzer provides additional reports about hypervisors,switches, and system and resource events.
Custom reports
Ops Center Analyzer supports creating custom reports by running queries or by using anexisting template for monitoring capacity and configuration data. You can also access thereport builder from the Analyzer detail view UI to build custom reports for monitoringperformance data.
In-context launch of Analyzer detail view Reports
You can access Analyzer detail view reports at any time directly from the E2E View. Simplyclick any resource icon and select Show Report in Analyzer detail view.
SLO management
SLOs are measurable parameters that are defined for monitoring the performance of userresources. With Ops Center Analyzer, you can evaluate, define, and customize the service-level objectives defined for the monitored resources such as volumes and VMs. Bymonitoring the SLOs, you can determine whether your infrastructure provides enoughperformance to meet the end user requirements specified in the service-level agreement.
Ops Center Analyzer lets you establish and monitor storage service-level objectives forbusiness-critical applications and logical storage devices. When a service-level threshold isexceeded, integrated diagnostics facilitate in identifying the root cause. For storageoperations, you can use the I/O control settings feature to set upper limits as a long-termsolution across a range of users by consumer grade based on an SLO.
End-to-end monitoring
The E2E topology view provides detailed configuration of the infrastructure resources andlets you view the relationship between the infrastructure components. You can manuallyanalyze the dependencies between the components in your environment and identify theresource causing performance problems. By using the topology maps, you can easily monitorand manage your resources. You can use this view to monitor resources in your data center:applications, virtual machines, servers, networks, and storage.
In the E2E view, each node represents a resource, and the connecting links represent therelationship between the infrastructure components. You can analyze a resource that is thetarget of analysis and all the associated resources. You can also view the alerts associatedwith all the related resources and trace the problem at the root level. The node-based E2Eview helps you analyze the problem on the affected node and its impact on the rest of theinfrastructure resources.
SLO management
Chapter 1: Ops Center Analyzer overviewHitachi Ops Center Analyzer User Guide 16

Problem identification and root cause analysis
Performance problems might occur because of varying system loads, applications updates,capacity upgrades, configuration changes, and inefficient management of resources in theshared infrastructure.
The Ops Center Analyzer advanced diagnostic engine aids in rapidly diagnosing,troubleshooting, and finding the root cause of performance bottlenecks.
Storage I/O controls
Storage I/O controls allow you to set and modify limits on volumes.
In the Data Center, some types of resources often require higher performance than others.For example, production servers such as database and application servers used to performdaily tasks of business organizations usually require high performance. However, ifproduction servers experience decreased performance, productivity in business activities isnegatively affected.
To prevent this from happening, the storage administrator needs to maintain the highperformance of production servers. A drop in development server performance does not haveas much of a negative effect on the entire organization as a drop in production serverperformance. In this case, you set upper limits to give higher priority to I/O activity from theproduction server over I/O activity from the development server to manage and control theimpact of development activities.
Storage I/O controls are available in Ops Center Analyzer when Server Priority Manager isinstalled on your storage systems. You can invoke this function through Ops CenterAutomator after establishing a connection between the two servers. Alternatively, if OpsCenter Automator is not installed on your storage system, you can use the CM REST API tocreate a script, which serves as a template that you modify for selected volumes to run theServer Priority Manager operation.
Using the I/O control setting, you can enable upper limits for the storage I/O activity ofvolumes that belong to consumers. The storage administrator clears the I/O control settingwhen the traffic between the server and storage system drops to acceptable levels.Furthermore, you have the option of limiting the data transfer rate on volumes affecting criticalresources.
Set I/O control limits for the following:■ To achieve overall optimization of infrastructure resources during periods of I/O-intensive
activity■ To maintain a quality-of-service benchmark for an SLO■ To prioritize I/O activity to optimize performance
Hitachi Ops Center Automator integration
Ops Center Analyzer supports integration with Ops Center Automator.
This support allows users to directly access the service templates in Ops Center Automatorfrom the Execute Action window in the Ops Center Analyzer UI. When you notice aperformance problem in your shared infrastructure, you can run the appropriate action orservice template to resolve it.
Problem identification and root cause analysis
Chapter 1: Ops Center Analyzer overviewHitachi Ops Center Analyzer User Guide 17

Risk management capability
Ops Center Analyzer allows users to analyze trend projections in their infrastructure throughpredictive analytics risk reporting.
■ Near-term trending: Define target metrics and predict performance over time tounderstand utilization trends.
■ Capacity planning: View long-term capacity projections to plan resource allocation.
Note: The predictive analytics risk reporting capability is a licensed feature.Consult your Hitachi Vantara representative to obtain a license.
Getting started in your Ops Center Analyzer environmentGetting started tasks include logging on, accessing Analyzer detail view, and setting up yourenvironment to monitor consumers and resources.
Logging on to Ops Center Analyzer
You can access the Ops Center Analyzer from a supported browser as follows:■ When Analyzer is registered with the Ops Center Common Services you can log in
through the Ops Center portal from which you can launch Ops Center Analyzer as well asother Ops Center products using single sign-on. For information about how to configuresingle sign-on, see the Hitachi Ops Center Analyzer Installation and Configuration Guide.
■ Log in directly using the Ops Center Analyzer URL.
Log in to Ops Center Analyzer directly as follows:
Procedure
1. Open a web browser.2. Enter the URL for Ops Center Analyzer in the address bar:
http://host-where-Ops-Center-Analyzer-is-installed:port-number/Analytics/login.htm
where port-number is the port number of the Ops Center Analyzer management server.The default port number is 22015.
To access Ops Center Analyzer in secure mode, use https.
The default port number for secure mode is 22016.
3. Type a user ID and password.4. Click Log In.
Risk management capability
Chapter 1: Ops Center Analyzer overviewHitachi Ops Center Analyzer User Guide 18

Accessing Ops Center Analyzer detail viewUse Ops Center Analyzer detail view to conduct historical trend analysis across a wide set ofinfrastructure statistics, create advanced monitoring custom reports, and perform additionaltroubleshooting and diagnostics.
You can access Analyzer detail view reports at any time directly from the E2E View. Simplyclick any resource icon and select Show Report in Analyzer detail view. The Analyzer detailview UI is launched in a separate browser window. The resource tree opens to the selectedresource along with the latest available report in the Performance view.
You can also access Ops Center Analyzer detail view from the More Actions menu.
Note: Certain management tasks require logging directly on to the Analyzer detailview server as the admin user instead of using the More Actions menu (whichlogs on to the server as a general user). The management tasks documented inthis guide state when it is necessary to log on as the admin user.
Use the Analyzer detail view online help to view details about reporting tasks and features.
Note: When you select one of the following resources to open in Analyzer detailview, the parent resource appears instead:■ VMware ESXi: CPU, Memory, NIC, HBA■ Hyper-V: Memory, HBA■ Storage: Others
This is because these parent and child resources are not considered independententities in Analyzer detail view.
Launching Ops Center Automator from Ops Center AnalyzerUse Hitachi Ops Center Automator to run service templates and monitor action templates.
You can access Ops Center Automator when using the Execute Action window, typically tomonitor the status of a service template you have just initiated. Selecting Launch Ops CenterAutomator opens the UI in a separate browser tab.
To perform administrative tasks in Ops Center Automator, such as setting permissions forOps Center Analyzer users, launch the Ops Center Automator UI in a separate browser tabfrom the Tools menu on the main dashboard. Quick access to Ops Center Automator fromthe main dashboard makes the workflow convenient in that after troubleshooting performanceproblems in your infrastructure, you can invoke Ops Center Automator and create or edit anexisting service template as a response measure to a recurring problem.
Setting up a monitoring environment for your infrastructure resourcesSet up notification profiles for email alerts, create consumers to represent applications orworkgroups, and establish thresholds for your infrastructure resources.
Use the following workflow to set up your monitoring environment.
Accessing Ops Center Analyzer detail view
Chapter 1: Ops Center Analyzer overviewHitachi Ops Center Analyzer User Guide 19

■ To understand consumers, resources, and thresholds, see:● Overview of managing and monitoring infrastructure resources (on page 89)● Consumer settings (on page 107)● Resource monitoring settings (on page 90)
■ To set up email and notification profiles, see:● Configure the email server (on page 110)● Create a condition profile (on page 111)
■ To create consumers and resources, see:● Creating a consumer (on page 108)● Creating a resource assignment rule (on page 108)● Running a resource assignment rule (on page 109)
■ To monitor resources, see:● Configuring resource monitoring (on page 89)● Monitoring using a static threshold (on page 98)● Monitoring using a dynamic threshold (on page 93)● Setting thresholds for user resources (on page 101)● Creating user resources assignment rule (on page 103)● Running a user resource assignment rule (on page 103)
Setting up a monitoring environment for your infrastructure resources
Chapter 1: Ops Center Analyzer overviewHitachi Ops Center Analyzer User Guide 20

Chapter 2: Quick access to vital performancereports
Ops Center Analyzer communicates various types of information to you about the resourcesin your data center through vital performance reports.
Monitoring performance is crucial to effective data center management. Systemadministrators require access to resource information at any moment, displayed to helpunderstand the complex processes in the data center.
Ops Center Analyzer offers numerous gauges and reports for instant recognition of problemsand long-term tracking of resource usage and events. You can also customize the display ofthe dashboard, charts, and reports.
Dashboard overview
The Ops Center Analyzer dashboard provides reports that display the performance status ofsystem resources (hypervisors, storage systems, and switches), user resources (volumes,hosts, and VMs) and consumers (user resources such as virtual machines or volumesgrouped by company name or business system consumer).
The dashboard shows IT infrastructure health based on real-time service-level objective(SLO) information, and provides status reports that display the capacity and performancedata of all your monitored system and user resources.
When you first log on after the product is installed, the dashboard is unavailable and you areprompted for setup tasks. If you click OK, the Analyzer detail view Server window opens, andyou can begin the initial setup by clicking Edit Settings.
After the initial setup, the dashboard displays the following reports by default:■ System Status Summary for Consumers and User Resources report: Displays the
performance and status summary of monitored consumers, and gauges of the number ofVMs, hosts, and volumes with alerts.
■ Event Trends report: Displays the changes in the number of critical, warning, andinformation alerts for the past 72 hours.
■ System Resource Status report: Displays the status of monitored server, SAN, andstorage components.
■ Resource Events report: Displays a list of resource events based on the time of eventoccurrence. The most recent events appear at the top of the list.
You can customize the dashboard to display reports that you prefer to monitor. To reset thedashboard to display the default reports, click Restore Default Settings.
Chapter 2: Quick access to vital performance reportsHitachi Ops Center Analyzer User Guide 21
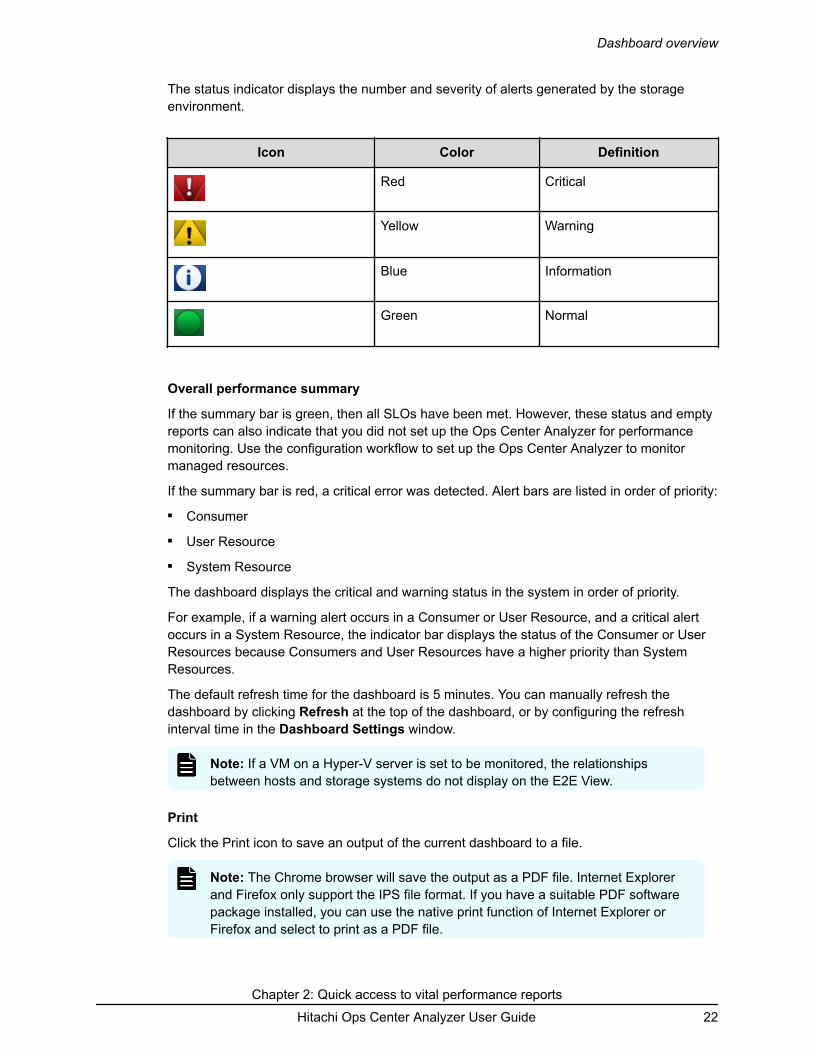
The status indicator displays the number and severity of alerts generated by the storageenvironment.
Icon Color Definition
Red Critical
Yellow Warning
Blue Information
Green Normal
Overall performance summary
If the summary bar is green, then all SLOs have been met. However, these status and emptyreports can also indicate that you did not set up the Ops Center Analyzer for performancemonitoring. Use the configuration workflow to set up the Ops Center Analyzer to monitormanaged resources.
If the summary bar is red, a critical error was detected. Alert bars are listed in order of priority:■ Consumer■ User Resource■ System Resource
The dashboard displays the critical and warning status in the system in order of priority.
For example, if a warning alert occurs in a Consumer or User Resource, and a critical alertoccurs in a System Resource, the indicator bar displays the status of the Consumer or UserResources because Consumers and User Resources have a higher priority than SystemResources.
The default refresh time for the dashboard is 5 minutes. You can manually refresh thedashboard by clicking Refresh at the top of the dashboard, or by configuring the refreshinterval time in the Dashboard Settings window.
Note: If a VM on a Hyper-V server is set to be monitored, the relationshipsbetween hosts and storage systems do not display on the E2E View.
Click the Print icon to save an output of the current dashboard to a file.
Note: The Chrome browser will save the output as a PDF file. Internet Explorerand Firefox only support the IPS file format. If you have a suitable PDF softwarepackage installed, you can use the native print function of Internet Explorer orFirefox and select to print as a PDF file.
Dashboard overview
Chapter 2: Quick access to vital performance reportsHitachi Ops Center Analyzer User Guide 22

Search
The search feature on the home page lets you search for a resource in the Consumers,Servers, Storage Systems, and Volumes categories. From the returned search results, selectthe resources you need to analyze, and launch the E2E view or Sparkline view for furtheranalysis.
System Status Summary for Consumers and User Resources
The System Status Summary for Consumers and User Resources report displays theperformance status summary of monitored consumers, VMs, hosts, and volumes.
System Status Summary for ConsumersConsumers are business management units under which user resources such as virtualmachines, hosts, or volumes can be grouped by company name or business systemconsumer, and assigned grades based on their importance.
The Consumer pane displays the consumer grades, the total number of alerts for each, and abar graph of the highest alert severity in each grade, as follows:■ Consumer grades are listed from the highest to the lowest grade. Consumers with a
bronze grade are grouped under Others.■ The total number of critical or warning alerts displays above the total number of
consumers for each consumer grade. If there are critical and warning alerts for a specificconsumer grade, then the alert for the highest severity displays.
System Status Summary for Consumers and User Resources
Chapter 2: Quick access to vital performance reportsHitachi Ops Center Analyzer User Guide 23

■ The number of alerts for each grade is a link that opens the Consumers - Critical/Warning window.
■ If more than one alert exists for any specific grade, a bar graph appears. A red barindicates critical errors, and a yellow bar is a warning. If the number of resources withcritical and warning alerts exceeds 10, only the critical alerts display.
■ If there are no consumers associated with a specific type of grade, - / - displays for thenumber of alerts.
■ If no consumers are associated with a grade, or if no data is available, No Data displaysinstead of a bar graph.
System Status Summary for User Resources
The System Status Summary - VM/Host and Volume reports display the status of allmonitored VMs, hosts, and volumes.
Both the VM/Host pane and the Volume pane display a Resource Status information gauge,where the top number is the total critical or warning alerts received from the VMs and hosts,or volumes that exceeded the critical or warning thresholds for any monitored metric. Thebottom number indicates the total number of VMs, hosts, or volumes in the system.
Under Metrics, a bar graph displays the total number of VMs and hosts with critical andwarning alerts for any monitored metric.
For the Volume summary, Metrics displays a bar graph of the total number of volumes withcritical and warning alerts for any metrics. In the bar graph, red is the total number of criticalalerts and yellow is the number of warning alerts.
For example, if there are 3 critical alerts and 5 warning alerts, then both critical and warningdisplay in the gauge. If the number of critical alerts is greater than 9, only the red bar (critical)displays because the maximum value of the gauge is 10.
To view details about the resources that exceed the defined critical or warning thresholds,click the number link in the information gauge chart or bar graph. A list of affected resourcesappears in a new window. Select the resource and then click Show E2E View to view the datacenter topology and review the system configuration to analyze the performance problem.
System Resource Status report
System Status Summary for User Resources
Chapter 2: Quick access to vital performance reportsHitachi Ops Center Analyzer User Guide 24

The System Resource Status report is one of the default reports that appears on the OpsCenter Analyzer dashboard. It provides a heat map of the current status of system resourcessuch as server (CPU, memory, NIC, HBA, and disk), SAN (switches), and storage (ports,processors, cache, pools, and parity groups) components.
Each red tile shows a critical alert, and each yellow tile shows a warning alert. Unknownresources are considered Normal and are represented by green tiles.
To view details about the resources that exceeded the defined thresholds, click the numberlink. A list of affected resources appears in a new window. Select the resource and then clickShow E2E View to view the data center topology and review the system configuration.
Event Trends report
The Event Trends report is one of the default reports that appears on the Ops CenterAnalyzer dashboard. It provides a trend report of all critical and warning alerts in yourenvironment for the past 72 hours. It is useful in comparing the change history and thenumber of critical alerts, especially for an administrator who manages the entire system.■ When you hover over a specific bar in the trend report, a tool tip displays the total number
of alerts, the number of critical alerts, and the number of warning alerts for a specific timeperiod. Each bar represents an hour.
■ Blue blocks at the bottom of the trend report indicate configuration changes for a specifictime period. The darker the shade of blue, the larger the configuration change from onetime period to the next.
■ When you hover over a change history at the bottom of the trend report, the tool tipdisplays the number of changes in a specific time period. The date is in the format yyyy-mm-dd, and the time hh:mm.
Event Trends report
Chapter 2: Quick access to vital performance reportsHitachi Ops Center Analyzer User Guide 25

If you see a spike on the trend report, navigate to the E2E View from the System StatusSummary report to view the data center topology and review the configuration and statusinformation. You can then use the Sparkline View and analytics workflow to solve theproblem.
Resource Events report
The Resource Events report table on the Ops Center Analyzer dashboard lists the mostcurrent resource events in descending order, based on the Date Time column. You can viewa maximum of 500 critical and warning events that occurred in the past 24 hours.
To view details about the resources that exceeded the defined thresholds, click theassociated message link. Click Show E2E View from the Event Detail tab to view the datacenter topology and review the configuration and status information.
System and Resource EventsYou can view the latest events in one place and manage the events based on the status.
The Events tab displays details about significant events in your monitored environment.
Resource Events report
Chapter 2: Quick access to vital performance reportsHitachi Ops Center Analyzer User Guide 26
There are two categories of events:■ System Events
The System Events tab displays Management and Event Action events generated whensystem settings must be verified or configured.
■ Resource Events
The Resource Events tab displays Performance events generated when a device orcomponent (server, storage system, network device, and so on) does not performoptimally.
You can analyze the Resource events by using the end-to-end network topology view toidentify the resource that generated the event.
The All Events tab displays both System and Resource events. Each event indicates the levelof the alert, the date and time of the alert message, category, device name, and componentname. Click a message in the Message column to open the Event Detail window.
Use the Event Detail window to display more event details, such as the device type andcomponent type. You can scroll through the list for more events. For Resource events, youcan click Show E2E View to view the network topology.
The Event levels classifications are as follows:■ Critical: Event that requires immediate attention■ Warning: Event that might become critical in the future■ Informational: No immediate action required
Sending dashboard reports to usersYou can schedule the delivery of dashboard reports to users. All current dashboard reportsare sent as an email attachment.
Before you begin
Make sure the mail server and the sender address are set up as described in Configuring themail server (on page 110).
Procedure
1. Click Dashboard Settings.2. Set Send Reports to ON.3. Choose to deliver the report Daily, Weekly (Sun-Sat), or Monthly, and set the Time of
day when they are to be sent.4. Enter one or more email recipients in the To field.5. Click OK.
Sending dashboard reports to users
Chapter 2: Quick access to vital performance reportsHitachi Ops Center Analyzer User Guide 27

Customizing the dashboardCustomize the dashboard settings to display the reports you prefer to see when you log in.You can also schedule the email distribution of reports.
User permissions for managing dashboard settings
The dashboard settings that you can configure depend on the user permissions assigned toyou.■ System account user
A system account is a fully privileged built-in account used to log on after the product isinstalled. After the initial setup, the dashboard by default displays built-in reports. Asystem account user can make changes to the default dashboard and manage thedashboard organization for all user accounts. The changes made to the default dashboardis reflected on the dashboards of other users using the default dashboard.
■ Admin or modify users
When users with admin or modify permissions log on for the first time, they see the defaultdashboard configured by the system account user. The users with admin or modifypermissions cannot edit the default dashboard settings, but can create their own customdashboard.
Configuring dashboard settings
Configure the following settings using the Dashboard Settings window:■ Toggle between default and custom dashboards
Users with admin or modify permissions can toggle between default and customdashboards.
■ Set refresh interval
To set the data refresh interval, enter the time period in the Refresh Interval text box. Thedefault refresh interval is 5 minutes. The reports refresh automatically at the set intervalwhen the autorefresh option is enabled. The built-in reports are enabled for autorefresh bydefault. You can either enable or disable the autorefresh function for custom reports.Check whether reports are enabled for autorefresh in the Refresh column.
■ Restore default settings
To reset the dashboard to display the default settings, click Restore Default Settings. (Thiswill not affect Send Reports settings.)
■ Schedule delivery of reports
To deliver a copy of the dashboard reports on a scheduled basis to users, set SendReports to ON. You can then choose the date and time and one or more recipients.
■ Display reports
To display the reports you want to view on your dashboard, set the ON or OFF options.
Customizing the dashboard
Chapter 2: Quick access to vital performance reportsHitachi Ops Center Analyzer User Guide 28

■ Create and manage custom reports
Create custom reports for monitoring capacity and configuration data by clicking theCreate Report option. Only the system account user can create, edit, and delete publicreports that are accessible by all users. Users with admin or modify permissions cancreate private reports for display on their dashboard.
■ Notification of new reports
When a system account user creates a new custom report, it is made available for allusers. The New indicator appears next to the report name.
Customizing the dashboard
Chapter 2: Quick access to vital performance reportsHitachi Ops Center Analyzer User Guide 29

Chapter 3: Creating custom reportsOps Center Analyzer enables you to create custom reports for monitoring capacity andconfiguration data. Select the report metrics that you want to monitor, pick the report format,and set the report definitions for displaying your data.
Custom reports overviewOps Center Analyzer allows you to create your own reports for monitoring capacity andconfiguration data.
Public and Private reports
Ops Center Analyzer supports creating public and private report types:■ Built-in reports: Ops Center Analyzer provides a collection of default reports that are
referred to as built-in reports. Built-in reports cannot be edited.■ Public reports: Public reports can be accessed by all users. Only the system account user
can create, edit, or delete public reports. Other users have only view access.■ Private reports: Private reports are accessible only by the users who create them. Users
with admin or modify permissions can create, edit, and delete private reports.
User permissions for creating custom reports
Ops Center Analyzer user roles and permissions for creating custom reports are as follows:■ System: A system account user can create, edit, and delete public reports.■ Admin or Modify: A user with admin or modify permissions can create, edit, and delete
custom reports created for private access. In addition to the default reports, these userscan also view the public reports created by the system account user.
Chapter 3: Creating custom reportsHitachi Ops Center Analyzer User Guide 30

Custom report creation methods
Create a custom report using any of following methods:■ By entering a query: Write a query to create a report. For information about how to write a
query, see the Hitachi Ops Center Analyzer Detail View Query Language User Guide. Forinformation about capacity and configuration attributes, see the Hitachi Ops CenterAnalyzer Detail View Metrics Reference Guide.
■ By using a report template: Select a report template and customize the report definitionsto create a new report. A system account user can access the private report templatescreated by users with admin or modify permissions. In addition to the built-in reporttemplates, users with admin or modify permissions can access the public report templatescreated by the system account user.
Custom report format
View your report data in the following formats:■ Line graphs display the data trends over a selected time period. Create combination
graphs using the primary and secondary y-axis and a common x-axis. Use thecombination graphs to display data for one or more data series.
■ Table graphs display data in tabular format for the selected metrics over a selected timeperiod.
Custom report preview
Preview the report before publishing and make necessary modifications.
Custom report notification
When a system account user creates a new custom report, other users are notified by thefollowing methods:■ On the Dashboard tab, the New status indicator appears next to the Dashboard Settings
button.■ In the Dashboard Settings window, under Reports, you can view the newly added reports
marked as New.
Creating custom reportsCreate custom reports for monitoring capacity and configuration data.
Creating custom reports
Chapter 3: Creating custom reportsHitachi Ops Center Analyzer User Guide 31

Before you begin■ Only a system account user can create public reports that are accessible by all users.
Public reports can only be edited or deleted by a system account user. In addition to thebuilt-in report templates, a system account user can access the private report templatescreated by users with admin or modify permissions.
■ Users with admin or modify permissions can only create reports for private access. Privatereports can be edited or deleted by users who create them. In addition to the built-in reporttemplates, users with admin or modify permissions can access the public report templatescreated by the system account user.
Procedure
1. From the Dashboard tab, click Dashboard Settings.2. In the Dashboard Settings window, click Create Report.3. In the Create Report window, either enter a query or select a report template for
creating reports.4. To create a custom report by selecting a report template:
a. Browse the report templates from the Copy From list. When you hover over thereport names in the Copy From list, the details such as report name, description,size, query, and target time period of analysis are displayed to help you select anappropriate template.
b. Select a report template from the Copy From list. The report properties areautofilled with predefined values from the selected template.
c. Edit the predefined report properties such as report name, description, size, query,and other report properties.
5. To create a custom report by entering a query:a. Enter the report name and description.b. Select the report type and size. View the report results using Line Graphs or
Table.c. In the Query text box, enter a query.
■ For information about how to write queries, see the Hitachi Ops Center AnalyzerDetail View Query Language User Guide.
■ For information about Hitachi Enterprise Storage system capacity andconfiguration metrics and attributes, see the Hitachi Ops Center Analyzer DetailView Metrics Reference Guide.
■ For information about all other resource attributes, go to the Analyzer detailview UI, and from the application bar, click the Manage icon. UnderAdministration, click Show Schema. The Show Schema window displays thedetails of all metrics, resource definitions, and relationships.
d. Select the Time Period of Analysis.
6. Select Auto Refresh to enable autorefresh for the report.Reports refresh automatically at the set refresh interval time. If you disable this option,you must manually refresh the report by using the refresh icon at the top of thedashboard, or the refresh icon at the top of each report.
Creating custom reports
Chapter 3: Creating custom reportsHitachi Ops Center Analyzer User Guide 32

7. To view the query results, click Set Report Definitions. Set the report definitions fordisplaying your data either using line graph or table format.
Note: For tabular data, you can use the Default Sort column to set thesorting behavior for each metric (ascending or descending) in dashboardreports that are sent to users.
8. To review the report fields, report design, and other details before publishing, clickPreview.
9. Click OK.The report appears on the dashboard.
Managing custom reportsEdit or delete the custom reports, depending on your access permissions.
Before you begin■ Only a system account user can create public reports that are accessible by all users.
Public reports can only be edited or deleted by a system account user.■ Users with admin or modify permissions can only create reports for private access. Private
reports can be edited or deleted by the users who create them.
Procedure
1. From the Dashboard tab, click Dashboard Settings.2. In the Dashboard Settings window, you can create, edit, and delete custom reports.
■ To edit a custom report, select the report, and then click Edit Report. Modify thereport definitions such as report name, description, query, size, type, time period, andother details.
■ To delete custom reports, select the reports, and then click Delete Report.
If you are a system account user, before deleting the public reports, check how manyusers are viewing this report on their custom dashboard by verifying the number ofusers in the Users column. Hover over the number of users to see details aboutusers viewing this report. Make sure you notify the users before deleting customreports.
Examples of creating custom reportsOps Center Analyzer enables you to write queries and build your own reports. Use the querystatements to retrieve information from the Analyzer detail view database and createconfiguration and capacity reports.
Managing custom reports
Chapter 3: Creating custom reportsHitachi Ops Center Analyzer User Guide 33
Creating a line graphPlot a line graph to visualize the data patterns over time. You can plot line graphs for one ormore data series.
Before you begin■ Only a system account user can create public reports that are accessible by all users.
Public reports can only be edited or deleted by a system account user.■ Users with admin or modify permissions can only create reports for private access. Private
reports can be edited or deleted by the users who create them.
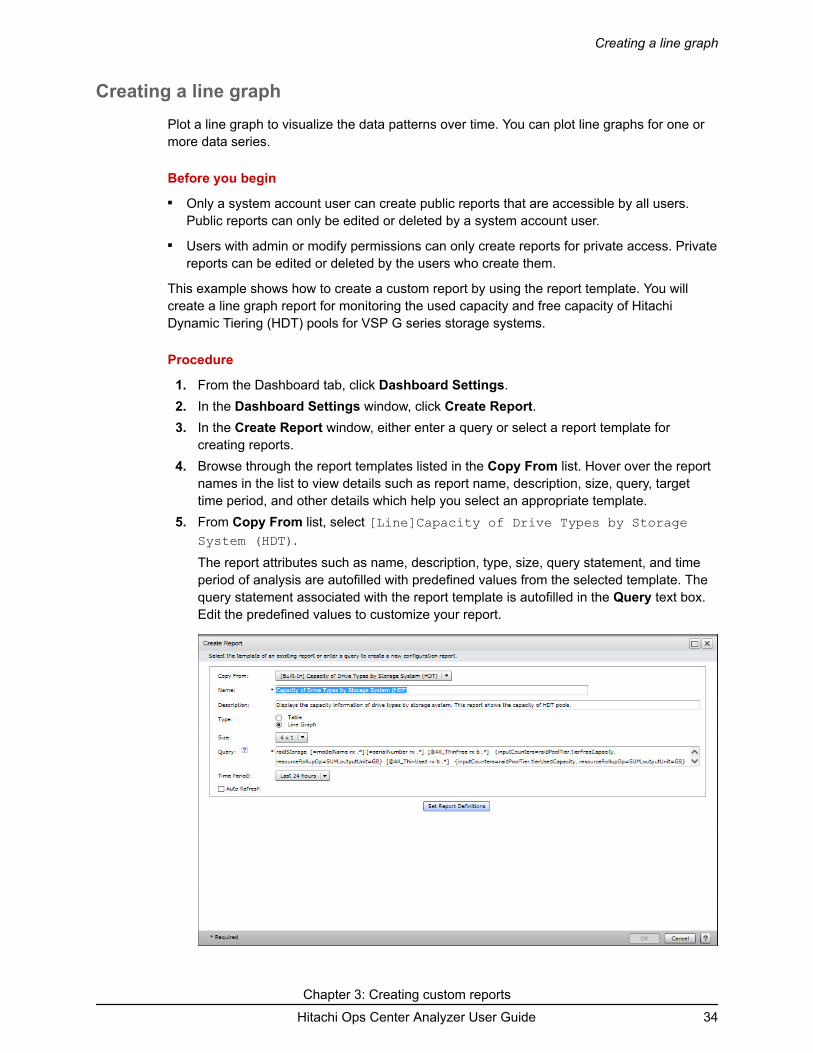
This example shows how to create a custom report by using the report template. You willcreate a line graph report for monitoring the used capacity and free capacity of HitachiDynamic Tiering (HDT) pools for VSP G series storage systems.
Procedure
1. From the Dashboard tab, click Dashboard Settings.2. In the Dashboard Settings window, click Create Report.3. In the Create Report window, either enter a query or select a report template for
creating reports.4. Browse through the report templates listed in the Copy From list. Hover over the report
names in the list to view details such as report name, description, size, query, targettime period, and other details which help you select an appropriate template.
5. From Copy From list, select [Line]Capacity of Drive Types by StorageSystem (HDT).The report attributes such as name, description, type, size, query statement, and timeperiod of analysis are autofilled with predefined values from the selected template. Thequery statement associated with the report template is autofilled in the Query text box.Edit the predefined values to customize your report.
Creating a line graph
Chapter 3: Creating custom reportsHitachi Ops Center Analyzer User Guide 34

The sample query for creating a line graph for monitoring the capacity of HDT pools ofraidstorage systems is as follows:
raidStorage [=modelName rx .*] [=serialNumber rx .*] [@All_ThinFree rx b .*] {inputCounters=raidPoolTier.tierFreeCapacity, resourceRollupOp=SUM,outputUnit=GB} [@All_ThinUsed rx b .*] {inputCounters=raidPoolTier.tierUsedCapacity, resourceRollupOp=SUM,outputUnit=GB} [@All_ThinTotal rx b .*] {inputCounters=raidPoolTier.tierTotalCapacityMB, resourceRollupOp=SUM,outputUnit=MB} [@Flash_ThinFree rx b .*] {inputCounters=raidPoolTier[=tierType rx FMC|FMD|SSD].tierFreeCapacity, resourceRollupOp=SUM,outputUnit=GB} [@Flash_ThinUsed rx b .*] {inputCounters=raidPoolTier[=tierType rx FMC|FMD|SSD].tierUsedCapacity, resourceRollupOp=SUM,outputUnit=GB} [@Flash_ThinTotal rx b .*]{inputCounters=raidPoolTier[=tierType rx FMC|FMD|SSD].tierTotalCapacityMB, resourceRollupOp=SUM,outputUnit=MB} [@HDD_ThinFree rx b .*] {inputCounters=raidPoolTier[=tierType rx SAS|SATA].tierFreeCapacity, resourceRollupOp=SUM,outputUnit=GB} [@HDD_ThinUsed rx b .*] {inputCounters=raidPoolTier[=tierType rx SAS|SATA].tierUsedCapacity, resourceRollupOp=SUM,outputUnit=GB} [@HDD_ThinTotal rx b .*] {inputCounters=raidPoolTier[=tierType rx SAS|SATA].tierTotalCapacityMB, resourceRollupOp=SUM,outputUnit=MB} [@FMC_ThinFree rx b .*] {inputCounters=raidPoolTier[=tierType rx FMC].tierFreeCapacity, resourceRollupOp=SUM,outputUnit=GB} [@FMC_ThinUsed rx b .*] {inputCounters=raidPoolTier[=tierType rx FMC].tierUsedCapacity, resourceRollupOp=SUM,outputUnit=GB} [@FMC_ThinTotal rx b .*] {inputCounters=raidPoolTier[=tierType rx FMC].tierTotalCapacityMB, resourceRollupOp=SUM,outputUnit=MB} [@FMD_ThinFree rx b .*] {inputCounters=raidPoolTier[=tierType rx FMD].tierFreeCapacity, resourceRollupOp=SUM,outputUnit=GB} [@FMD_ThinUsed rx b .*] {inputCounters=raidPoolTier[=tierType rx FMD].tierUsedCapacity, resourceRollupOp=SUM,outputUnit=GB} [@FMD_ThinTotal rx b .*] {inputCounters=raidPoolTier[=tierType rx FMD].tierTotalCapacityMB, resourceRollupOp=SUM,outputUnit=MB} [@SSD_ThinFree rx b .*] {inputCounters=raidPoolTier[=tierType rx SSD].tierFreeCapacity, resourceRollupOp=SUM,outputUnit=GB} [@SSD_ThinUsed rx b .*] {inputCounters=raidPoolTier[=tierType rx SSD].tierUsedCapacity, resourceRollupOp=SUM,outputUnit=GB} [@SSD_ThinTotal rx b .*] {inputCounters=raidPoolTier[=tierType rx SSD].tierTotalCapacityMB, resourceRollupOp=SUM,outputUnit=MB} [@SAS_ThinFree rx b .*] {inputCounters=raidPoolTier[=tierType rx SAS].tierFreeCapacity, resourceRollupOp=SUM,outputUnit=GB} [@SAS_ThinUsed rx b .*] {inputCounters=raidPoolTier[=tierType rx SAS].tierUsedCapacity, resourceRollupOp=SUM,outputUnit=GB} [@SAS_ThinTotal rx b .*] {inputCounters=raidPoolTier[=tierType rx SAS].tierTotalCapacityMB, resourceRollupOp=SUM,outputUnit=MB} [@SATA_ThinFree rx b .*] {inputCounters=raidPoolTier[=tierType rx SATA].tierFreeCapacity, resourceRollupOp=SUM,outputUnit=GB} [@SATA_ThinUsed rx b .*] {inputCounters=raidPoolTier[=tierType rx SATA].tierUsedCapacity, resourceRollupOp=SUM,outputUnit=GB} [@SATA_ThinTotal rx b .*] {inputCounters=raidPoolTier[=tierType rx
Creating a line graph
Chapter 3: Creating custom reportsHitachi Ops Center Analyzer User Guide 35

SATA].tierTotalCapacityMB, resourceRollupOp=SUM,outputUnit=MB} [@External_ThinFree rx b .*] {inputCounters=raidPoolTier[=tierType rx External].tierFreeCapacity, resourceRollupOp=SUM,outputUnit=GB} [@External_ThinUsed rx b .*] {inputCounters=raidPoolTier[=tierType rx External].tierUsedCapacity, resourceRollupOp=SUM,outputUnit=GB} [@External_ThinTotal rx b .*] {inputCounters=raidPoolTier[=tierType rx External].tierTotalCapacityMB, resourceRollupOp=SUM,outputUnit=MB} [@Mixed_ThinFree rx b .*] {inputCounters=raidPoolTier[=tierType rx Mixed].tierFreeCapacity, resourceRollupOp=SUM,outputUnit=GB} [@Mixed_ThinUsed rx b .*] {inputCounters=raidPoolTier[=tierType rx Mixed].tierUsedCapacity, resourceRollupOp=SUM,outputUnit=GB} [@Mixed_ThinTotal rx b .*] {inputCounters=raidPoolTier[=tierType rx Mixed].tierTotalCapacityMB, resourceRollupOp=SUM,outputUnit=MB}
6. Click Set Report Definitions to add graph data and legend entries.The query results display the key metrics for monitoring the enterprise-wide HDT totalpool capacity, used capacity, and free capacity details.
7. In the Graph Data tab, select the key metrics to represent on the left and right axes.
Creating a line graph
Chapter 3: Creating custom reportsHitachi Ops Center Analyzer User Guide 36

a. Select the performance metric for the left-axis. Select raidstorage.All_ThinUsedto represent used capacity of the HDT pool on the left-axis. Specify a displayname, and from the Axis list, select Left.
b. Select the performance metric for the right-axis. Select raidstorage.All_ThinFreeto represent free capacity of the HDT pool on the right-axis. Specify a displayname, and from the Axis list, select Right.
8. Enter the axis labels:
■ Left Axis: Thin Free■ Right Axis: Thin Used
9. In the Legend tab, select the legend entries to appear in the graph.10. To review the graph data, layout, legend entries, and other details before publishing,
click Preview.11. To preview the original size of the graph, click Size Preview.
12. Click OK.The new report appears on your dashboard.
Creating a table reportCreate custom reports in table format to display configuration and capacity data.
This example shows how to create a table report by using the report template. You will createa table report for monitoring the capacity consumption of the monitored storage systems inyour data center.
Before you begin■ Only a system account user can create public reports that are accessible by all users.
Public reports can only be edited or deleted by a system account user.■ Users with admin or modify permissions can only create reports for private access. Private
reports can be edited or deleted by the users who create them.
Procedure
1. From the Dashboard tab, click Dashboard Settings.2. In the Dashboard Settings window, click Create Report.3. In the Create Report window, either enter a query or select a report template for
creating reports.4. Browse through the report templates listed in the Copy From list. Hover over the report
names in the list to view details such as report name, description, size, query, and targettime period to help you select an appropriate template.
5. From Copy From list, select [Table]Capacity by Storage System.
Creating a table report
Chapter 3: Creating custom reportsHitachi Ops Center Analyzer User Guide 37
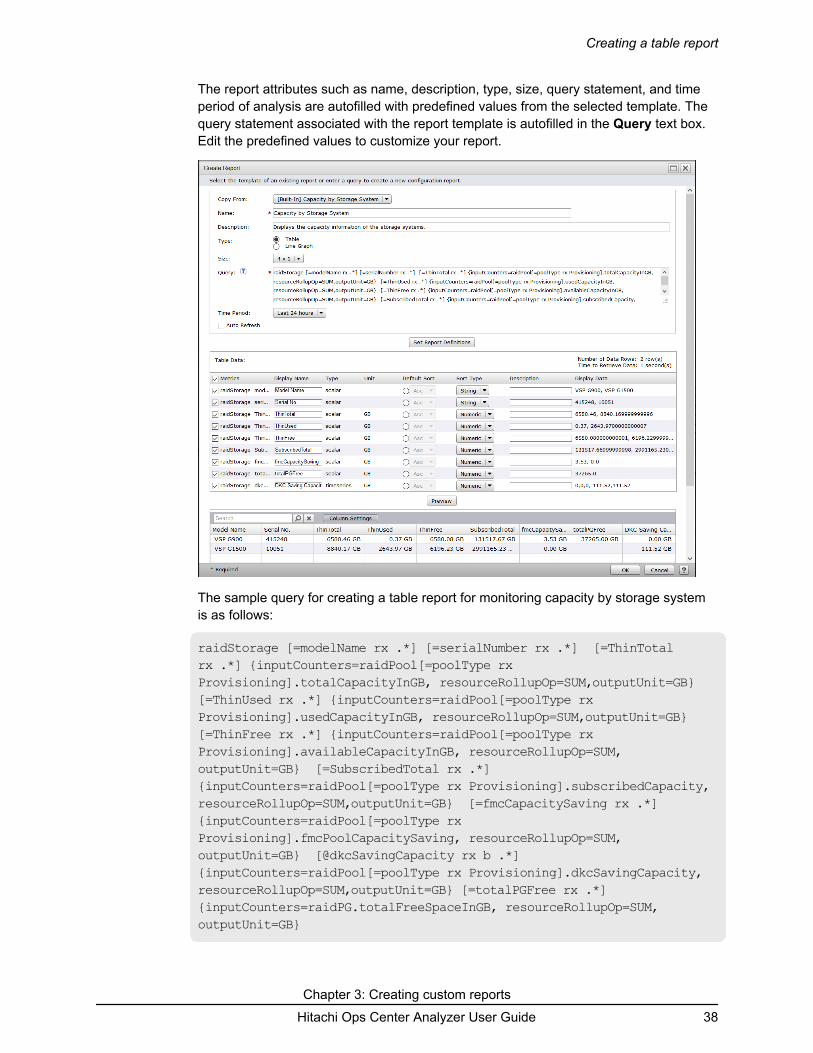
The report attributes such as name, description, type, size, query statement, and timeperiod of analysis are autofilled with predefined values from the selected template. Thequery statement associated with the report template is autofilled in the Query text box.Edit the predefined values to customize your report.
The sample query for creating a table report for monitoring capacity by storage systemis as follows:
raidStorage [=modelName rx .*] [=serialNumber rx .*] [=ThinTotal rx .*] {inputCounters=raidPool[=poolType rx Provisioning].totalCapacityInGB, resourceRollupOp=SUM,outputUnit=GB} [=ThinUsed rx .*] {inputCounters=raidPool[=poolType rx Provisioning].usedCapacityInGB, resourceRollupOp=SUM,outputUnit=GB} [=ThinFree rx .*] {inputCounters=raidPool[=poolType rx Provisioning].availableCapacityInGB, resourceRollupOp=SUM,outputUnit=GB} [=SubscribedTotal rx .*] {inputCounters=raidPool[=poolType rx Provisioning].subscribedCapacity, resourceRollupOp=SUM,outputUnit=GB} [=fmcCapacitySaving rx .*] {inputCounters=raidPool[=poolType rx Provisioning].fmcPoolCapacitySaving, resourceRollupOp=SUM,outputUnit=GB} [@dkcSavingCapacity rx b .*] {inputCounters=raidPool[=poolType rx Provisioning].dkcSavingCapacity, resourceRollupOp=SUM,outputUnit=GB} [=totalPGFree rx .*] {inputCounters=raidPG.totalFreeSpaceInGB, resourceRollupOp=SUM,outputUnit=GB}
Creating a table report
Chapter 3: Creating custom reportsHitachi Ops Center Analyzer User Guide 38

6. Click Set Report Definitions to add table data.The query results display the key metrics for monitoring the capacity consumption of allmonitored storage systems.
7. In the Table Data tab, select the key performance metrics that you want to monitor.8. To review the table report details before publishing, click Preview.9. Click OK.
The new report appears on your dashboard.
Sample queriesExample queries for creating custom reports for monitoring capacity and configuration dataare as follows:
To monitor unallocated capacity:
raidStorage[=name rx .*]&[=unAllocatedCapacity rx .+]{resourceRollupOp=sum,inputCounters=raidStorage.unAllocatedCapacityInGB}
To monitor capacity in GB:
raidStorage[=name rx .*]&[=capacity rx .+]{resourceRollupOp=sum,inputCounters=raidStorage.capacityInGB}
To show capacity data in GB and monitor unallocated capacity:
raidStorage[=name rx .*]&[=capacity rx .+] {resourceRollupOp=sum,inputCounters=raidStorage.capacityInGB}&[=unAllocatedCapacity rx .+]{resourceRollupOp=sum,inputCounters=raidStorage.unAllocatedCapacityInGB}
To monitor the storage used capacity, unallocated capacity, allocated capacity, free capacity,and reserved capacity:
raidStorage[=name rx .*]&{resourceRollupOp=sum,inputCounters=raidStorage.capacityInGB}&{resourceRollupOp=sum,inputCounters=raidStorage.unAllocatedCapacityInGB} [=capacityInGB rx .+]&[=allocatedCapacityInGB rx .+]&[=unAllocatedCapacityInGB rx .+]&[=totalFreeSpaceInGB rx .+]&[=openReservedCapacityGB rx .+]&[=otherCapacityGB rx .+]
To monitor the total capacity, used capacity, and available capacity for all pools:
raidStorage/raidPool[=name rx .*]&[=availableCapacityInGB rx .+]&[=totalCapacityInGB rx .+]&[=usedCapacityInGB rx .+]
Sample queries
Chapter 3: Creating custom reportsHitachi Ops Center Analyzer User Guide 39

Chapter 4: Analyzing performance problemsOps Center Analyzer provides analytical diagnostics to quickly identify, isolate, and determinethe root cause of problems.
The traditional approach of troubleshooting performance problems in the unified infrastructureposes several challenges. For example, it can be difficult to identify performance problem in astorage infrastructure environment that includes various virtual machines, servers, network,and storage.
Ops Center Analyzer offers an out-of-the-box analytics solution which lets you identify andtroubleshoot performance problems at the node level. The topology view shows the graphicalrepresentation of the infrastructure components and their dependencies. This view is crucialfor troubleshooting performance problems and helps achieve efficient root cause analysis.
Identifying performance problemsThe IT infrastructure is becoming more complex each day with rapidly emerging convergedinfrastructures. Performance problems occur due to various factors in your environment.Identifying the performance problems and troubleshooting the problems quickly is crucial.
As part of your performance management strategy, you define performance goals and criteriafor monitoring your environment. The performance problems occur when these predefinedgoals are not met. Use Ops Center Analyzer advanced troubleshooting features to quickly fixproblems.
The following situations indicate a performance problem in your environment:■ An SLO violation occurs
Typically, SLAs define the SLOs to evaluate the quality of service. SLO profiles define thethreshold values for the performance parameters that you use to evaluate the quality ofservice. When the threshold values are exceeded, an SLO violation occurs.
■ A sharp deviation from the baseline data occurs
When no SLOs are defined for your environment, you can use the baseline values toevaluate your system performance. The current performance is compared to the pastperformance trends, and when there is a significant deviation from the baseline values,Ops Center Analyzer sends an alert to notify you of a potential performance problem soyou have enough time to troubleshoot.
■ The customer notifies you of an application performance degradation and slowdown of theinfrastructure.
Chapter 4: Analyzing performance problemsHitachi Ops Center Analyzer User Guide 40

The common causes for performance problems are as follows:■ Increased load in an otherwise stable operating environment■ Inefficient load balancing strategy, which might cause underutilization of resources■ Changes in the system configuration■ Resource management in a shared infrastructure
Infrastructure components and key performance metricsYou must analyze the key performance metrics relevant to the problem and the workloadbeing analyzed.
The components and key performance metrics available in Ops Center Analyzer formonitoring performance are listed in the following tables:
Component
Performanceproblem
Key performance metrics
Identify theresources with
SLO violations orperformance
problems
Identify therelated
resources usedby the affected
resources
Identify theresources that
might be the rootcause
Server CPUcontention
VM■ vCPU Ready■ vCPU usage
ESX■ pCPU usage■ Host CPU
Ready1
ESX■ pCPU usage■ Host CPU
Ready1
VM■ vCPU Ready■ vCPU usage
Memory swap VM■ Usage %■ Active memory■ Swap in/out
rate
ESX■ Swap in/out
rate1
ESX■ Usage %■ Active
memory1
■ Swap in/outrate1
VM■ Usage %■ Active memory■ Swap in/out rate1
Infrastructure components and key performance metrics
Chapter 4: Analyzing performance problemsHitachi Ops Center Analyzer User Guide 41

Component
Performanceproblem
Key performance metrics
Identify theresources with
SLO violations orperformance
problems
Identify therelated
resources usedby the affected
resources
Identify theresources that
might be the rootcause
Memorycontention
VM■ Balloon
VM■ Balloon1
ESX■ Usage %■ Balloon1
VM■ Usage %■ Active memory■ Balloon
Responsetimedecrement
ESX■ pCPU usage■ Device Latency
(R/W)1
Storage Responsetimedecrement
VM■ Latency (R/W)
Hypervisor■ Latency (T)1
LU (Volume)■ Response time
(R/W/T)
Port■ usage
Processor■ MPB
utilization1
Cache■ Write Pending
%■ Side file %
Pool■ Utilization
Parity Group■ Utilization %■ Read Hit %
VM■ Read (KBps)■ Write (KBps)■ Read Operations■ Write Operations
LU (Volume)■ IOPS (R/W/T)
Network Error packet VM■ droppedRx■ droppedTx■ Transmitted/
received(KBps)
VM■ Transmitted/
received (KBps)■ PacketsTx1
■ Packets Rx1
1 The performance metric is available in Analyzer detail view.
Infrastructure components and key performance metrics
Chapter 4: Analyzing performance problemsHitachi Ops Center Analyzer User Guide 42

Analytics workflow
The workflow for analyzing performance problems and identifying the root cause is asfollows:
1. Detect performance problems (on page 43)2. Identify the bottleneck (on page 44)3. Identify the root cause of the bottleneck (on page 49)4. Set I/O controls5. Check recovery plans (on page 52)
Detecting performance problemsView the threshold violations using the Dashboard tab and Events tab. You can configure thesystem to send email notifications when the threshold values are exceeded. You can also usethe search feature in the Analytics tab to find the target resources for performance analysis.
Dashboard
The dashboard displays when you log on to Ops Center Analyzer. You can create a customdashboard, and choose to view the reports of monitored resources.
The dashboard displays summary reports for the monitored resources, system and resourceevents, event trends, and consumer groups. The report widgets display the thresholdviolations and critical alerts detected on all monitored resources when threshold values areexceeded.
Analytics workflow
Chapter 4: Analyzing performance problemsHitachi Ops Center Analyzer User Guide 43

In the following dashboard view, the warnings display on the monitored VMs and volumes.From the report widgets, click links to access the E2E view and analyze the cause of thethreshold violations.
Events tab
The Events tab displays a list of resource and system events. View the severity of eachevent, date and time of the occurrence, category, device, and the component name. You cannavigate from the Events tab to the E2E view for further analysis.
Email notifications
Ops Center Analyzer allows you to configure email notifications. When the threshold valuesare exceeded, the system sends an email to notify you of the potential performance problem.
Search
Use the search feature on the Dasboard tab to search for a resource in the Consumers,Servers, Switches, Storage Systems, and Volumes categories. From the returned searchresults, select the resources to analyze, and launch the E2E view or Sparkline view for furtheranalysis.
Analyzing performance bottlenecks
The performance degradation in the user resources is caused by a performance bottleneckon the server, network, or storage components.
Analyzing performance bottlenecks
Chapter 4: Analyzing performance problemsHitachi Ops Center Analyzer User Guide 44

A performance bottleneck can occur for various reasons, such as CPU contention, inefficientload balancing, applications sharing storage pools, port and parity group utilization in sharedinfrastructure, cache utilization, changes in dynamic tiering policies, and configurationchanges.
Identify and analyze the component causing the bottleneck in any of the following views:■ E2E view■ Analyze bottleneck window■ Sparkline view■ Detail view
Identifying the bottleneck in E2E viewAnalyze the configuration of the infrastructure components in the E2E topology view.
The following procedure describes the workflow of tasks for troubleshooting the problem thatoccurred in a VM component.
Procedure
1. Navigate to the E2E view in one of the following ways:
■ On the Analytics tab, perform a search for the target resources, and from thereturned search results, select the target resource for analysis and click Show E2EView.
■ On the dashboard, the report widgets display the number of affected resources thatexceeded the threshold values. For example, the VMs/Host report displays thenumber of affected VMs, and when you click the number link, a new window displaysa list of monitored VMs. Select the resources to analyze and click Show E2E View.
Identifying the bottleneck in E2E view
Chapter 4: Analyzing performance problemsHitachi Ops Center Analyzer User Guide 45

2. In the E2E View, analyze the server-related and storage-related components to identifythe resources causing performance problems.
■ Click Server View to get a server-oriented view of the business systemconfiguration. The key components to monitor while analyzing the serverperformance are:
● CPU
● Memory
● NIC
● HBA
● Disk
■ Click Storage View to get a storage-oriented view of the business systemconfiguration. The key components to monitor while analyzing the storageperformance are:
● Port
● Processor
● Cache
● Pool
● Parity Group
In the following example, the alert indicators display on the VMs. When you analyze theVMs in the Server View, you can view alerts associated with the CPU servercomponents.
Note: The E2E View does not show component information such as CPU,memory, and disk space for Windows and Linux hosts.
Identifying the bottleneck in E2E view
Chapter 4: Analyzing performance problemsHitachi Ops Center Analyzer User Guide 46

3. To analyze the resource associated with an alert, click the resource icon and selectVerify Bottleneck.For example, to check whether CPU is the bottleneck candidate, click the CPU icon andselect Verify Bottleneck.
4. The Analyze Bottleneck window displays the performance trend reports of thebottleneck candidate and the resource used as the base point of analysis. If theperformance charts display similar trend patterns in the same time period, you canassume that the selected resource is the bottleneck candidate. If not, repeat theanalysis for other resources with alerts in the Verify Bottleneck window.
For example, in the Verify Bottleneck window, the bottleneck candidate (CPU) appearsin a graph in the upper pane, and the VM where the problem occurred appears in agraph in the lower pane. The performance charts display similar trend patterns in thesame time period, which confirms that the CPU is the bottleneck candidate.
5. You can also use the resource sharing percentage to identify the bottleneck in theshared infrastructure. On the E2E view tool bar, from the Configuration Informationmenu, select an option that displays the highest resource sharing percentage. Hoverover the icons in the E2E view to see the shared percentage of each resource.Resources with a high sharing rate are the potential bottleneck candidates.For example, when no alerts display on the dashboard, or in the E2E view, and whenyou cannot identify the bottleneck candidate using the Analyze Bottleneck window, usethe resource sharing percentage to identify the affected resources in the sharedinfrastructure.Select Configuration Status from the Configuration Information menu, to seeinformation about the drives in the parity group, such as Drive Status and Used SpareCount. This tool is useful for parity groups with flash drives. Click on the Parity Groupresource icon from the E2E View and select Show Detail to see details for the SSDUsed Endurance Indicator and the FMD Battery Life Indicator.
Identifying the bottleneck in E2E view
Chapter 4: Analyzing performance problemsHitachi Ops Center Analyzer User Guide 47

Comparing performance trends in Sparkline viewUse the Sparkline view to analyze the health and performance of the resources in yourmonitoring environment. The Sparkline view displays performance reports for multiple nodesin the same pane for a quick comparison between different nodes. Display detailedperformance metrics for each node and find the correlation with other nodes.
The following procedure describes the workflow of tasks for troubleshooting the problem thatoccurred in a VM component.
Procedure
1. Navigate to the Sparkline view in one of the following ways:
■ On the Analytics tab, search for the target resources, and from the returned searchresults, select the target resources for analysis and click Show Sparkline View.
■ From the E2E View, select a resource, and then from the tool bar, click SparklineView.
2. In the Sparkline view, analyze and compare the performance trends of the target andrelated resources. You can select more than one target resource for analysis.In the following example, analyze the performance trends of the VM and the associatedserver components. The VM and CPU display similar trends in the same time period,which confirms that the CPU is the component affecting the performance of the VM.
Comparing performance trends in Sparkline view
Chapter 4: Analyzing performance problemsHitachi Ops Center Analyzer User Guide 48

Note:
■ The Sparkline view does not display the overall performance trends ofHypervisors and Storage Systems. However, you can analyze theperformance of all associated components of hypervisors (such as, CPU,Memory, NIC, HBA, Disk) and storage systems (such as, port, processor,cache, pool, parity group) in the sparkline view.
■ You can add a maximum of 20 target resources (base point resources) inthe Sparkline view, and display a maximum of 200 graphs.
3. To analyze data with finer granularity, select the graph, and click Show Performancefrom the menu.The performance window displays trends for the selected components.
Identifying affected resources
In the Analyze Bottleneck window, click the Identify affected resources tab. In this window,you can identify the consumers, hosts, VMs, and volumes that use the bottleneck candidate.You can also verify the status of each resource. Based on the severity level displayed, youcan troubleshoot the performance problems associated with the resources.
Analyzing the cause of the bottleneckThe root bottleneck cause can be resource contention issues in the shared infrastructure, orconfiguration changes in the environment.
Identifying affected resources
Chapter 4: Analyzing performance problemsHitachi Ops Center Analyzer User Guide 49

Analyzing shared resourcesPerformance problems arise when an application or a resource uses most of the availableresources in the shared infrastructure. Ops Center Analyzer supports efficient optimization ofthe shared infrastructure by quickly identifying the resource contention problems.
Procedure
1. In the Analyze Bottleneck window, click Analyze Shared Resources.2. In the Analyze Shared Resources window, the performance charts appear for the
bottleneck candidate and the resources using the bottleneck candidate.3. Compare the performance trends of the bottleneck candidate with the resources that
use it. If the compared resources display similar trends, then you can assume that theresource in the shared infrastructure is causing the bottleneck.
If you cannot determine the cause of the bottleneck from the displayed graphs, checkthe graphs of different metrics. To view the graph of a different metric, select it from theMetric list. You can also add a performance graph of a different component from theAdd Graph menu.
In the following example, the CPU utilization value of a virtual machine is compared withthe CPU utilization of other virtual machines and volumes. The performance trendsconfirm that one of the VMs in the shared infrastructure is overutilizing the CPU.The CPU bottlenecks occur when several VMs run on the same physical machine, andend up sharing the same CPU. If the VMs (logical resources) share the same CPU(physical resource) and if one of the VMs utilizes the CPU more than the others, thetotal efficiency of the shared resource is degraded and the CPU utilization rateincreases. The CPU might become saturated with requests because of resourcecontention problems.
Analyzing shared resources
Chapter 4: Analyzing performance problemsHitachi Ops Center Analyzer User Guide 50
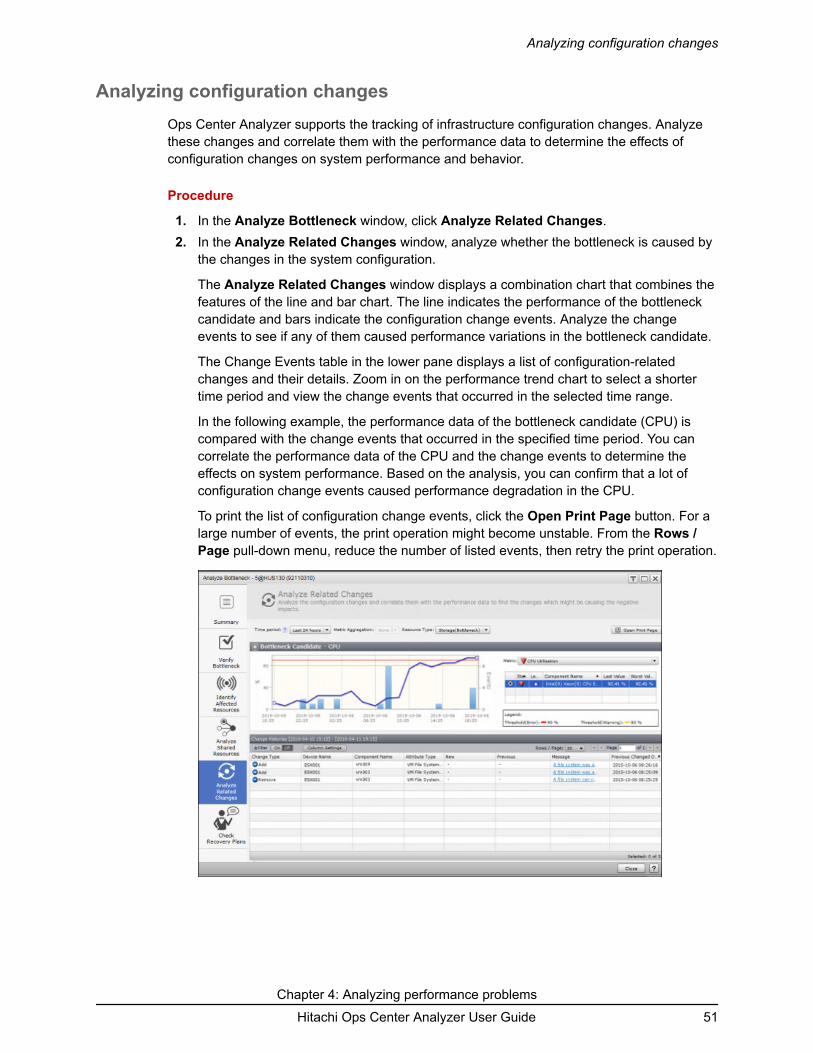
Analyzing configuration changesOps Center Analyzer supports the tracking of infrastructure configuration changes. Analyzethese changes and correlate them with the performance data to determine the effects ofconfiguration changes on system performance and behavior.
Procedure
1. In the Analyze Bottleneck window, click Analyze Related Changes.2. In the Analyze Related Changes window, analyze whether the bottleneck is caused by
the changes in the system configuration.
The Analyze Related Changes window displays a combination chart that combines thefeatures of the line and bar chart. The line indicates the performance of the bottleneckcandidate and bars indicate the configuration change events. Analyze the changeevents to see if any of them caused performance variations in the bottleneck candidate.
The Change Events table in the lower pane displays a list of configuration-relatedchanges and their details. Zoom in on the performance trend chart to select a shortertime period and view the change events that occurred in the selected time range.
In the following example, the performance data of the bottleneck candidate (CPU) iscompared with the change events that occurred in the specified time period. You cancorrelate the performance data of the CPU and the change events to determine theeffects on system performance. Based on the analysis, you can confirm that a lot ofconfiguration change events caused performance degradation in the CPU.
To print the list of configuration change events, click the Open Print Page button. For alarge number of events, the print operation might become unstable. From the Rows /Page pull-down menu, reduce the number of listed events, then retry the print operation.
Analyzing configuration changes
Chapter 4: Analyzing performance problemsHitachi Ops Center Analyzer User Guide 51

Checking recovery plansOps Center Analyzer supports generating recovery plans for the processor and cachebottlenecks. The recovery plans provide guidance for solving performance problems. Therecovery plan generation is supported for VSP 5000 series, VSP E series, VSP F series, VSPG series, VSP N series, VSP, and HUS VM series storage systems.
Procedure
1. From the E2E View, select a resource you want to analyze and click AnalyzeBottleneck.
2. In the Analyze Bottleneck window, click the Check Recovery Plans tab.3. Select one of the following options to generate a recovery plan:
■ Auto-Fill by Selecting an Event:
● Click Browse Events to select an event. The metric that exceeded the thresholdvalue and the event date and time are auto-filled when you select a bottleneckevent.
● Specify the target value for the metric.
■ Specify Manually:
You must specify the following options manually:
● Select the metric that exceeded the threshold.
● Specify the date and time of the occurrence.
● Specify the target value for the metric.
Note: Ops Center Analyzer supports generating recovery plans only for thefollowing components and associated key performance metrics:
■ Processor: Utilization (MPB)
■ Cache: Write Pending Rate (CLPR)
4. (Optional) Select Generate recovery plans for other resources used by the sameconsumer to generate recovery plans for the bottleneck resource, and other resourcesused by the same consumer.
5. Click Generate Recovery Plans.View the system-generated recovery plans for the selected resource.
Checking recovery plans
Chapter 4: Analyzing performance problemsHitachi Ops Center Analyzer User Guide 52

6. Review the recovery plans and apply an appropriate plan to solve performanceproblems.
Executing actionsExecute predefined actions on a resource node. These predefined actions allow you to notifythe appropriate IT administrators to troubleshoot the resource node problems.
Access the Execute Action window at any point during analysis from the following windows:■ E2E View■ Sparkline View■ Analyze Shared Resources■ Predictive analytics risk reports■ Check Recovery Plans■ Tools
Executing actions
Chapter 4: Analyzing performance problemsHitachi Ops Center Analyzer User Guide 53

Configure the system to perform the following actions:■ Send email notifications
For example, if a problem arises on a resource node, configure the system to send emailnotifications to the concerned administrator to troubleshoot the problem. Include theresource node information, troubleshooting methodology, and other information in theemail template.
■ Run a command
For example, if a problem arises on a resource node, execute the command action toautomatically register the problem in a trouble-ticketing system, so that the concerned ITadministrator can troubleshoot the node.
■ Submit a service through Ops Center Automator.
For example, submit a service based on a template from Ops Center Automator to resolvea recurring problem.
■ Start granular data collection.
For example, if your analysis requires data collection in intervals less than a minute, runthe command for granular data collection.
Procedure
1. From one of the entry points, click a resource icon, and then select Execute Action.2. In the Execute Action window, view the list of defined actions.
The Actions list will be empty if you have not defined any actions previously. Following isthe high-level procedure for creating event actions:
a. Create an event action definition file and save it to the Ops Center Analyzerinstallation folder.
Ops-Center-Analyzer-installation-folder/Analytics/confThe default installation folder is /opt/hitachi.
b. Restart Ops Center Analyzer, or run the reloadtemplate command to view thedefined actions.
3. Under Actions, select an action.
■ To send email notifications, select the action type Mail and then click Launch Editor.
The email template is launched in the email editor. Alter the email template to suityour requirements.
■ To run a command, select the action type Command.
The details of the command are displayed. Edit the Command Arguments field,then click Execute Command. If you want to run more than one command at thesame time, you can create a batch or shell command. In the Execute Commandwindow, review the details of the command and then click OK.
■ To collect data at shorter time intervals, select Granular Data Collection orGranular Data Collection with Volume.
Executing actions
Chapter 4: Analyzing performance problemsHitachi Ops Center Analyzer User Guide 54
Submitting services through Ops Center AutomatorSubmit a service in Ops Center Analyzer based on built-in action templates or Ops CenterAutomator service templates.
In addition to running actions (such as email and CLI commands) through the Execute Actionfeature, you can submit services through Ops Center Automator when it is linked to OpsCenter Analyzer. Some action templates already exist in Ops Center Analyzer. You can alsoaccess service templates available in Ops Center Automator.
Before you begin■ Ops Center Automator must be linked to Ops Center Analyzer through the Common
Component.■ User permissions must be set for both Ops Center Analyzer and Ops Center Automator
user accounts.■ The definitions in the Ops Center Analyzer action templates must match those in the
corresponding Ops Center Automator service names and service group names.
Procedure
1. Click on the target resource and select Execute Action.2. In the Execute Action window, select the action or service template you want to submit,
then do the following:
■ Scroll through the list of default action templates.
■ Check the box to see available service templates in Ops Center Analyzer
3. Click Launch service execution, review the parameters in the Settings field, then clickSubmit:
■ If you are running a preexisting action, the parameters are autopopulated.
■ If you are running a service, you might need to enter the parameters manually.
4. To monitor the task, click Launch Ops Center Automator from the Execute Actionwindow.
Granular data collectionUse the granular data collection feature to analyze second-level data.
Ops Center Analyzer provides numerous reports on system and user resources. Typically,system administrators manage resources for application data, and dashboard reports givesufficient information on system resources (such as volumes) that support a widely usedapplication. When a bottleneck occurs, system administrators look for data spikes. However,this data might not available on the dashboard because of the time delay between monitoringand reporting. While this report data displayed on the dashboard is collected and deliveredwithin minutes of the events, in this situation, system administrators require second-leveldata. This data is collected in intervals of seconds, providing the granularity necessary tosearch for data spikes.
Submitting services through Ops Center Automator
Chapter 4: Analyzing performance problemsHitachi Ops Center Analyzer User Guide 55
When analyzing storage resource bottlenecks, the root cause might be one of the following:■ Port saturation■ MPB utilization■ High response times for volumes
Depending on the way granular data collection is run, the CSV files from the resulting outputconsist of performance statistics for all ports, volumes, processor data (MP), and activity-rateranking for each processor allocated to an MP blade and volumes of that storage system.
Persistent performance issue
A critical event occurs multiple times throughout the day, but you do not know whatcomponent in storage resources is affecting the user resource, such as an application. Thefollowing workflow shows the stages of analysis you follow to determine the root cause:■ Start searching through candidate volumes or the volume listed in an SLO warning.■ Analyze the E2E View to identify the resources associated with the Consumer.■ Analyze the Sparkline view to identify the spike in the trend patterns.■ Identify affected resources to determine the bottleneck resource.■ Run granular data collection for that resource, for example, from 15 minutes to an hour.■ Analyze CSV output.
Typically, this use case requires that you run granular data collection for a longer durationsince the spikes might not occur predictably.
Performance issue that occurs consistently during a specific time
If you notice a performance problem in storage resources consistently at the same time, forexample, from 1 to 3 PM during the week, you can run granular data collection on variouscomponents for as long as duration of the period in which the problem occurs (in thisexample, two hours).
Typically, you run granular data collection many times for shorter periods in this use case.
Collecting granular dataThe Granular Data Collection tool enables you to collect data in intervals as short as onesecond for analysis.
In cases where detecting spikes in trend patterns is necessary, data collection in intervals ofminutes might not provide sufficient granularity of data. To collect data in intervals of seconds,invoke the Granular Data Collection tool, which generates output to CSV files. You canupload this data to a spreadsheet or charting application for graphical analysis of data spikesin the trend patterns.
Collecting granular data
Chapter 4: Analyzing performance problemsHitachi Ops Center Analyzer User Guide 56

Before you begin■ Verify the following OS support:
● The Ops Center Analyzer server is running Linux OS.● The RAID Agent (or Tuning Manager - Agent for RAID) host server is running a version
of Linux OS supported by Ops Center Analyzer.■ The target storage system is a model in the VSP 5000 series, VSP E series, VSP F
series, VSP G series, VSP N series, VSP, and HUS VM families.■ The version of Tuning Manager - Agent for RAID is 8.5.1 or later.
Procedure
1. Select a storage resource or storage component, and then select the Execute Actionoption from the menu.During analysis, select any of the following resources and components:
■ storage system
■ volume
■ port
■ processor
■ pool
■ parity group
■ cache
Note: Other action templates similar to the Granular Data Collection toolmight display in the Execute Action window.
2. On the Execute Action window, select Granular Data Collection. To run the tool on aspecified volume, select Granular Data Collection with Volume. After selecting eithertool, specify the following arguments and click Execute Command.All arguments are optional except where indicated that they are mandatory.
a. Interval of data collection, in seconds (1-60):-intervalInSecDefault value: 1
b. Period of data collection, in seconds (1-3600), for one file:-periodInSecDefault value: 300
c. Number of times (1-24) data collection runs:-repeatTimesDefault value: 1
d. Starting time of data collection using any time expression (supported by datecommand usage in Linux OS), such as, 13:00, tomorrow 13:00, 1 PM, or now:-startTimeDefault value: now
Collecting granular data
Chapter 4: Analyzing performance problemsHitachi Ops Center Analyzer User Guide 57

e. Timezone offset (-2359 to -0000 and +0000 to +2359) between the user client andUTC:-timezoneDefault value: +0000
f. (Mandatory) The DKC model name of the target storage system:-modelDefault value: Specified automatically by the selected resource.
g. (Mandatory) Serial number of the target storage system:-serialNumberDefault value: Specified automatically by the selected resource.
h. Number of the volume that you selected at the entry point. This parameter onlydisplays when the action is Granular Data Collection with Volume:-ldevDefault value: Specified automatically by the selected resource.You can run granular data collection on multiple volumes (128 maximum) byconcatenating volume numbers with commas.
i. The folder name that is the destination folder of the output files:-pathLabelDefault value: result
Example of arguments in one string:
-intervalInSec 1 -periodInSec 300 -repeatTimes 1 -startTime "now"-timezone "+0000" -model "VSP G1000" -serialNumber "345678" -ldev"01:23:45" -pathLabel "result"Guidelines for granular data collection:
■ For the first second, the acquisition period is less than 1 second, and if there is noI/O in that period, the performance value is 0.
■ Granular data collection cannot be cancelled once you run the command.
■ You can only run the command for granular data collection one instance at a time.
■ Running granular data collection might affect the performance of storage resources ifoverused. When running granular data collection, monitor the following:
● The duration in which the MP blades and MP units are used exclusively dependson the number of volumes for which the data is obtained and on the collectioninterval. Therefore, keep the number of volumes to a minimum.
● Because a small collection interval increases the load on the MP blade and MPunit, specify an appropriate value for the collection interval option. If a loadproblem on the MP blade or MP unit persists, consider allocating the commanddevice that the RAID Agent (or Tuning Manager - Agent for RAID) accesses toother MP blades or MP units.
3. View the results of the granular data collection task in CSV files located in the followingdirectory: /Ops-Center-Analyzer-installation directory/Analytics/webapps/webroot/Analytics/result/GranularData/start_date/label/storage_id/secdata/yymmdd/.
Collecting granular data
Chapter 4: Analyzing performance problemsHitachi Ops Center Analyzer User Guide 58

Where:
■ start_date with timezone offset is the date that the data is collected with the timezone offset in the yyyymmdd[+/-]hhmm format.
■ label is the label defined by the user in the pathLabel option.
■ storage_id is the target storage system identifier: model-name_serial-number.
■ yyyymmdd is the date that the granular data collection is run.
Output path example:
/Ops-Center-Analyzer-installation directory/webapps/webroot/Analytics/result/GranularData/20170119+0000/result/VSP_G1000_345678/secdata/20170119/You can also view the results on a web browser:
http://host-name or IP-address of Ops-Center-Analyzer:port ofOps-Center-Analyzer server/Analytics/result/GranularData/index.htmlOutput web address example:
http://172.0.0.1:22015/Analytics/result/GranularData/20170119+0000/result/VSP_G1000_345678/secdata/20170119/index.html
4. CSV output is not deleted automatically. You can delete it manually. You can also set uproutine file deletion, as shown in the following example.
Delete output after 3 days at 1:00 PM:
$crontab -e
01*** product installation folder/Analytics/sample/rmOldExportData.sh 3
Using Hitachi Ops Center Analyzer for data analysis: fromdeep dive to recovery planning
Hitachi Ops Center Analyzer provides an intuitive UI for performance monitoring,management, and troubleshooting. The Analyzer detail view collects data from monitoredtargets (such as storage systems, hosts, and switches) using software probes that supporteach device or environment. Analyzer detail view also provides historical trend analysis andextensive report generation capabilities.
Using Hitachi Ops Center Analyzer for data analysis: from deep dive to recovery planning
Chapter 4: Analyzing performance problemsHitachi Ops Center Analyzer User Guide 59

This analytics solution provides end-to-end monitoring and troubleshooting capabilities foryour infrastructure resources, from host to storage system. The basic workflow forPerformance Analytics troubleshooting is called the MAPE loop:■ Monitor■ Analyze■ Plan■ Execute
When reviewing and evaluating reports and event information on the Ops Center AnalyzerDashboard, you can also perform a deep dive analysis by launching the Analyzer detail viewUI. The deep dive is part of the Analyze segment of the MAPE loop workflow.
The following workflow is an example of how to use this troubleshooting methodology as aninfrastructure administrator who manages user resources (such as consumers, VMs, andvolumes) and system resources (such as cache, ports, CPUs, and disks).
Viewing the dashboard
As an infrastructure administrator, you set up dynamic thresholds on the user resources youare monitoring. After seeing nine critical alerts on VM/Host resource gauge, you becomeinterested in troubleshooting a threshold violation.
You browse the resources with critical alerts and select the target VM to analyze in the E2EView.
Using Hitachi Ops Center Analyzer for data analysis: from deep dive to recovery planning
Chapter 4: Analyzing performance problemsHitachi Ops Center Analyzer User Guide 60

Using E2E or Sparkline views
The E2E view represents the topology of infrastructure resources: from host, to fabric switch,to storage system. The infrastructure administrator sets the base point of analysis on thetarget resource for analysis. This view enables you to see the relationship betweenresources.
To move deeper into the underlying resources, you can launch the Sparkline view, whichpresents multiple charts that track performance by component. Use this view to correlateperformance trends between user and system resources.
Using Hitachi Ops Center Analyzer for data analysis: from deep dive to recovery planning
Chapter 4: Analyzing performance problemsHitachi Ops Center Analyzer User Guide 61

Using additional troubleshooting tools
Ops Center Analyzer offers multiple troubleshooting tools for isolating a bottleneck candidateand identifying the root cause. You can launch any of the following tools for further analysis:■ Verify Bottleneck: Use at the initial stage of analysis to compare performance charts of
the base point of analysis with the bottlenecked candidate.■ Identify Affected Resources: Use to display the user resources that rely on the
bottlenecked resource.■ Analyze Shared Resources: Use if you suspect that the root cause of the problem is
resource contention, a noisy neighbor that disrupts the balance of resource usage. Youcompare performance charts of the bottleneck candidate to the resources using thebottleneck. After comparing performance across a number of resources with AnalyzeShared Resources, you isolate the actual bottleneck.
■ Analyze Related Changes: Use if Analyze Shared Resources does not reveal theactual bottleneck (noisy neighbor), or if you suspect that the root cause of the problem is arecent configuration change. In this view, you compare performance charts withconfiguration events. The bar graph portion of the chart represents the configurationchanges made at a particular time. You can click on a bar to list those changes.
Performing a deep dive analysis
Regardless of which tool you use, after you have isolated the bottleneck candidate andvalidated the root cause, you can collect more information to understand its origin. Forexample, you have identified a storage system as the bottleneck. Subsequently, you want tounderstand how the problem affects other resources or vice versa. This phase of thetroubleshooting analysis is called the deep dive. In a deep dive analysis, you can comparethe data of various components from the resource tree, which displays all the resources andtheir components in your infrastructure, and run a customized report against that data.
To proceed with the deep dive for information, launch the Analyzer detail view UI, whichprovides detailed reports at the component level. You can launch this component-level viewfrom the following windows in the Ops Center Analyzer UI during analysis:■ E2E view■ Sparkline view■ Performance tab of the Show detail window for a resource■ Analyze Shared Resources■ Analyze Related Changes
When analyzing system resources in Analyzer detail view, you can view performance chartsbased on various metrics to correlate components with resource performance. For example,you have validated the root cause of the storage system bottleneck, but you want to performfurther analysis in Analyzer detail view.
The following figure examines the performance of the volume from the VM side. This report,LDEV IOPS versus Response Time, displays spikes at specific times, which you can thenuse as reference points for when the I/O activity was particularly intensive during otherwisetypical workloads.
Using Hitachi Ops Center Analyzer for data analysis: from deep dive to recovery planning
Chapter 4: Analyzing performance problemsHitachi Ops Center Analyzer User Guide 62
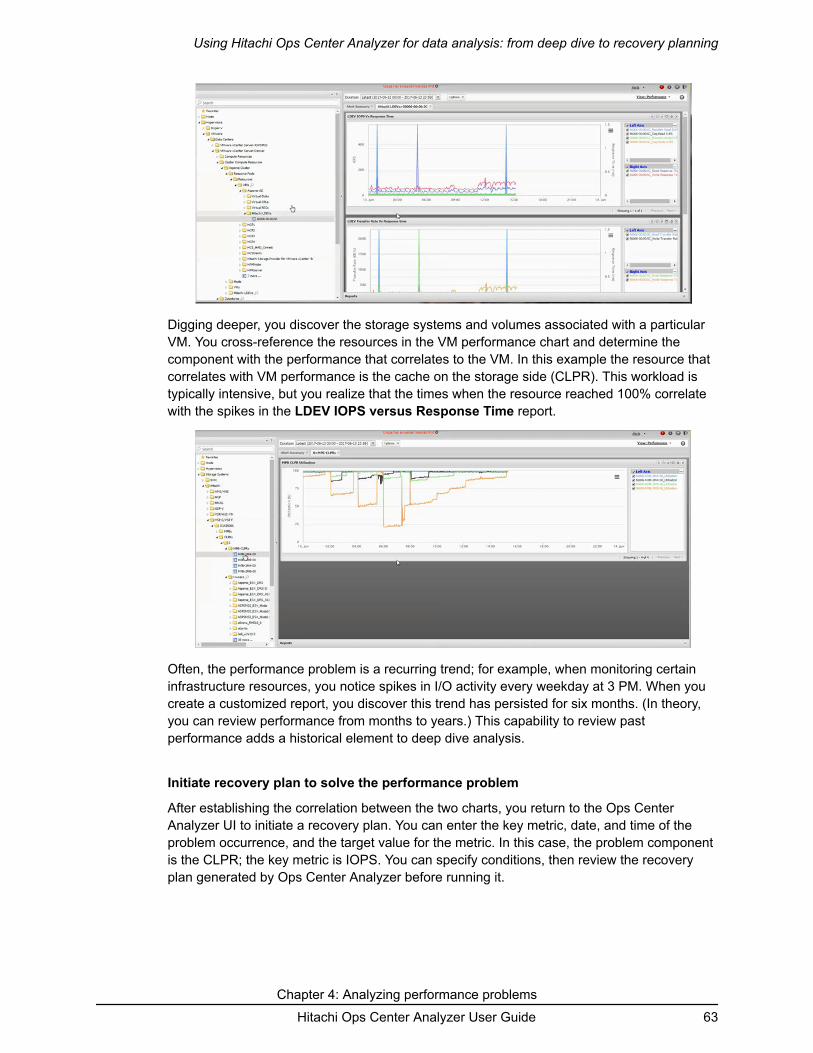
Digging deeper, you discover the storage systems and volumes associated with a particularVM. You cross-reference the resources in the VM performance chart and determine thecomponent with the performance that correlates to the VM. In this example the resource thatcorrelates with VM performance is the cache on the storage side (CLPR). This workload istypically intensive, but you realize that the times when the resource reached 100% correlatewith the spikes in the LDEV IOPS versus Response Time report.
Often, the performance problem is a recurring trend; for example, when monitoring certaininfrastructure resources, you notice spikes in I/O activity every weekday at 3 PM. When youcreate a customized report, you discover this trend has persisted for six months. (In theory,you can review performance from months to years.) This capability to review pastperformance adds a historical element to deep dive analysis.
Initiate recovery plan to solve the performance problem
After establishing the correlation between the two charts, you return to the Ops CenterAnalyzer UI to initiate a recovery plan. You can enter the key metric, date, and time of theproblem occurrence, and the target value for the metric. In this case, the problem componentis the CLPR; the key metric is IOPS. You can specify conditions, then review the recoveryplan generated by Ops Center Analyzer before running it.
Using Hitachi Ops Center Analyzer for data analysis: from deep dive to recovery planning
Chapter 4: Analyzing performance problemsHitachi Ops Center Analyzer User Guide 63

After the recovery plan runs successfully, you can adjust your thresholds with new metricsettings to monitor the user resources (in this case, the VM and the affected volume). At thisstage, you have completed the MAPE loop.
E2E infrastructure topology viewThe E2E topology view provides the detailed configuration of the infrastructure resources andlets you view the relationship between the infrastructure components. You can manuallyanalyze the dependencies between the components in your environment and identify theresource causing performance problems. By using the topology maps, you can easily monitorand manage your resources. Use this view to monitor resources in your data center, includingapplications, virtual machines, servers, networks, and storage systems.
In the E2E view, each node represents a resource, and the connecting links represent therelationship between the infrastructure components. You can analyze a target resource andall associated resources. You can also view alerts associated with all related resources andtrace the problem at the root level. The node-based E2E view helps you analyze the problemon the affected node and its impact on other resources. You can also open the Analyzerdetail view UI to view a detailed performance report for a selected resource.
Topology view components
The E2E view displays the topology related to the selected resources under the followingdefault infrastructure groups:■ Consumer: The name of the consumer group to which the selected resource belongs and
the details about the consumer grade level.■ Server: The associated server components, such as VMs and hosts.■ Network: The associated network components, such as switches.■ Storage: The associated storage components, such as volumes.
E2E infrastructure topology view
Chapter 4: Analyzing performance problemsHitachi Ops Center Analyzer User Guide 64

A number link is shown next to each resource icon. For example, when you select a storagesubsystem as a target resource for analysis, and if 50 volumes belong to this storagesubsystem, the value Volumes 50 is shown under the Storage infrastructure group. Click theVolumes link to open the Volumes - Storage window, which displays details about thevolumes in the storage subsystem. From the Volumes list, select the priority of volumes thatyou want to analyze in the E2E view.
E2E view tool bar
The tool bar provides quick access to frequently used menu options and icons:
Options Description
Sparkline View Navigate to the Sparkline view to analyzethe performance of the base point resourceand the related resources to identify thebottleneck.
Critical Number of critical alerts in the topology view.
Warning Number of warnings in the topology view.
Configuration Information Number of indicators for configurationinformation.
Configuration Status Information about drives, such as availabilityor the battery life of an SSD drive.
Copy Pair Information Copy pair information for volumes.
VSM Information Virtual storage machine information for copypair volumes.
High Share Rate Resource sharing percentage of a sharedresource. Hover over the resource icons todisplay the share percentage for eachresource. Resources with high share rateare potential bottleneck candidates.
The Share Rate value is not displayed whenyou set a Hypervisor or Storage System asthe base point of analysis.
Select OFF to turn off this feature.
Configuration Status Information about drives, such as availabilityor the battery life of an SSD drive.
E2E infrastructure topology view
Chapter 4: Analyzing performance problemsHitachi Ops Center Analyzer User Guide 65

Options Description
Storage and Server Views The following topology views are supported:■ Storage View: Maps the storage-related
components, such as ports, processors,cache, pools, and parity groups.
■ Server View: Maps the server-relatedcomponents, such as CPU, memory,NIC, HBA, and disk.
Lock Highlight Select a resource node and click LockHighlight to highlight all related componentsin the topology view. The resourceconfiguration remains highlighted until yourelease the lock on the resource node. Thisfeature helps you understand the linksbetween components and analyze thesystem configuration in detail.
To release the lock, click Lock Highlightagain.
Repaint Select a resource node and click Repaint tomove the resource from bottom-to-top orright-to-left to the prime position. Use thisoption to change the display order ofresources.
E2E view menu bar
Menu bar items Menu items and description
Show Detail button Select a resource and click Show Detail. Theperformance summary report of the resource opens ina new window. You can also view the events relatedto the resource in the Events tab.
Show Report in Analyzer detailview
Click a resource icon and select Show Report inAnalyzer detail view. The Analyzer detail view UIopens in a separate browser window. The resourcetree opens to the selected resource, along with thelatest available report in the Performance view.
E2E infrastructure topology view
Chapter 4: Analyzing performance problemsHitachi Ops Center Analyzer User Guide 66

Menu bar items Menu items and description
Analyze Bottleneck menu Select a resource and click Analyze Bottleneck. TheAnalyze Bottleneck Summary window opens. Fromthe summary window, you can display the followingtabs for the detailed analysis:■ Verify Bottleneck■ Identify Affected Resources■ Analyze Shared Resources■ Analyze Related Changes■ Check Recovery Plans
Action menu ■ Change Base Point: Select a resource and clickChange Base Point to change the node ofanalysis. The topology view opens for the selectedresource in a new window.
■ Execute Actions: Select a resource and clickExecute Actions to run predefined actions on aresource node. The event actions allow you tosend notifications to your administrator fortroubleshooting performance problems.
Set Flag menu Select a resource and click Set Flag to flag aresource so you can analyze the flagged resource ata later point. To remove the flag, click Unset Flag.
Show Prediction Select a resource and click Show Prediction togenerate a report showing the predicted performancetrend for that resource. The report is based on the riskprofiles that you select. After the report is generated,go to the Predictive Analytics tab to view the results.
E2E infrastructure topology view
Chapter 4: Analyzing performance problemsHitachi Ops Center Analyzer User Guide 67

Chapter 5: Analyzing performance trends withpredictive analytics risk reporting
Use predictive analytics risk reporting tools to predict performance and utilization ofinfrastructure resources.
Predictive analytics risk reporting overviewWith predictive analytics risk reporting, Ops Center Analyzer allows you to generate riskanalysis reports based on infrastructure performance trends.
Predictive analytics risk reporting uses several predictive models to calculate the predictedperformance trend. Once the predictive analytics license is enabled, the analytics engineuses historical data collected by the Analyzer probe server to calculate performance trendsfor your risk reports.
Anticipate performance trendsAnticipate performance trends across your infrastructure by generating risk reports fromsystem-defined report definitions, which are available for immediate use.
Use risk reports to report on the affected resources in your system. These resources are atrisk of threshold violations. Ops Center Analyzer automatically tracks risk in affectedresources and consumers by periodically calculating performance data trends.
Note: The calculation for selecting affected resources and consumers is executedwhen the Ops Center Analyzer starts. You can also set the time for these reportsto run. The default starting time is 23:23 hours. It might take some time tocomplete the calculation after a fresh installation.
Chapter 5: Analyzing performance trends with predictive analytics risk reportingHitachi Ops Center Analyzer User Guide 68

Generate risk reports on the following:■ Capacity shortages■ Capacity planning (growth)■ Slow response times■ Anticipated performance bottlenecks■ Risk for platinum consumers■ Growing workloads for user and system resources
About predictive risk profilesRisk profiles specify the target metrics and time span for the predicted performance trend inyour risk reports.
Ops Center Analyzer features default risk profiles for immediate use. These system-definedprofiles cover a variety of use cases. On Profiles Settings, click on a profile and view thedetails provided on the Profile Information and Target Metrics tabs.
Note: Users cannot edit or delete system-defined risk profiles.
The Create Risk Profile function allows you to choose the parameters manually. You canalso use the Copy From option to copy an existing profile from the menu, and then modifythe settings according to your risk assessment goals. You can edit and delete user-createdrisk profiles from Profile Settings.
About predictive risk report definitionsRisk report definitions specify the target resources and risk profiles for generating a riskreport.
You can select hypervisors, VMs, hosts, FC switches, storage systems, and volumes astarget resources for the report. Use Report Definitions to choose a report definition, andview the details on the Report Information, Profile Information, and Target Resourcestabs.
Note: Users cannot edit or delete system-defined report definitions.
You can also create your own risk report definitions. Use the Create Risk Report Definitionfunction to choose the parameters manually. You can also use the Copy From option to copy
About predictive risk profiles
Chapter 5: Analyzing performance trends with predictive analytics risk reportingHitachi Ops Center Analyzer User Guide 69

an existing report definition, and then modify the settings according to your risk assessmentgoals. You can edit and delete user-created risk report definitions from the Report Definition.
Predictive analytics risk reporting workflowCalculate performance trend projections by choosing a report definition and adding riskprofiles.
In the report definition, select resources for the predictive modeling calculations. Use the riskprofile to define the target metrics and time period. The end result is a trend chart withperformance trend projections for the selected resources. The reports are similar to theperformance-by-metric reports in the Analytics tab. Ops Center Analyzer provides system-defined risk profiles and report definitions for immediate use. Follow the steps in this workflowto begin:
1. Verify licenses. Check the Ops Center Analyzer Licenses window to verify that thelicenses are valid.
2. Set up risk profiles. These profiles establish the time period and the target metrics forthe performance trend projection.
3. Select a risk definition. This definition instantiates the output for a performance trendprojection by combining multiple risk profiles for target resources.
4. Generate a report. On the Predictive Analytics tab, choose a report definition. ClickPredict Result to calculate the trend projection for that report definition.
5. Analyze the report. On the Report Results tab, choose a report. The selected reportopens in a new tab.
6. Avert the risk. If the performance trend projection shows a potential threshold violationor degraded performance, access the More Actions menu to mark a resource forfollow-up analysis, send an email, or run a script. Likewise, you can take correctiveaction by using available tools in Ops Center Analyzer, such as assigning resources,setting I/O controls, or generating recovery plans.
Adding the Predictive Analytics licenseTo use risk reporting in Ops Center Analyzer, you must have a valid Predictive Analyticslicense for each storage system in your environment.
Obtain a Predictive Analytics license from your Hitachi Vantara representative.
Procedure
1. In the logon window, click Licenses.2. Use either of the following methods to register the license:
■ Enter the license key.
■ Specify the license file.
3. Click Save.The license is added to the list.
Predictive analytics risk reporting workflow
Chapter 5: Analyzing performance trends with predictive analytics risk reportingHitachi Ops Center Analyzer User Guide 70

Creating a predictive risk profileCreate a risk profile for projecting performance trends from 24 hours to 6 months in thefuture.
Before you begin
You must have a valid Predictive Analytics license to use the predictive analytics riskreporting feature.
Procedure
1. Click the Administration tab, then select Predictive Analytics Settings > ProfileSettings.
2. Click Create Risk Profile.3. On the Copy From menu, do one of the following:
■ Select a system-defined or an existing user-defined profile. You can rename it, thenmodify the parameters according to your risk assessment goals.
■ Select a blank profile (-), the default option in the menu, and construct a new profileby manually selecting the parameters.
4. Name the profile (required) and provide a description (optional).5. Select a time period.
For example, select 24 hours or 7 days for near-term performance trends. For a long-term projection to determine utilization trends, select 1 month or 6 Months.
6. In the Target Metrics table, add or remove performance metrics to or from the profile.Click Add Metric, make the following choices, and click OK:
a. Use the Resource Type menu to display a list of metrics by resource type.b. Select target metrics in the Available Metrics field, then click Add. When the
Selected Metrics field is complete, click OK.
7. When the Target Metric table is populated, add a monitoring threshold for each targetmetric by adjusting the Monitoring setting (ON/OFF) and entering a threshold value.Some threshold values have predefined settings, which are adjustable.
8. Click Save.
Creating risk report definitionsCreate risk report definitions to view performance projections for selected target resources.
Before you begin
You must have a valid license to use the Predictive Analytics risk reporting feature.
Procedure
1. Click the Administration tab, then select Predictive Analytics > Report Settings.
Creating a predictive risk profile
Chapter 5: Analyzing performance trends with predictive analytics risk reportingHitachi Ops Center Analyzer User Guide 71

2. On the Copy From menu, do one of the following:
■ Select a system-defined or an existing user-created report definition. Rename it, thenmodify the parameters according to the risk assessment goals.
■ Select a blank profile (-), the default option, and construct a new profile by manuallyselecting the parameters.
3. Name the report definition (required) and provide a description (optional).4. Select one or more risk profiles.5. Specify the resource scope:
■ To include only selected target resources, choose Selected.
■ To include all resources associated with the selected target resources, choose AllAssociated.
6. Click Add Resources.a. On the Add Resources window, select Resource Type from the menu.b. Select Available Resources and add Selected Resources. You can also remove
resources from the list.c. Click OK.
7. Go to the Predictive Analytics tab to generate the report.
Generating a risk reportSpecify risk profiles in a report definition to generate performance trend projections.
Generating a risk report
Chapter 5: Analyzing performance trends with predictive analytics risk reportingHitachi Ops Center Analyzer User Guide 72

Before you begin■ You must have a valid Predictive Analytics license for the predictive analytics risk reporting
feature.
Procedure
1. Generate a report in any of the following ways:
■ From the Predictive Analytics tab, click the Report Definition subtab, select one ormore report definitions, then click Predict Result.
■ From the Predictive Analytics tab, click the Search subtab. Select a target resourcecategory, such as consumers, servers, switches, storage systems, or volumes, thenenter a resource name. Click Show Predictive Report.
■ From the E2E View window, select one or more consumers and resources, then clickShow Predictive Report. The Select Profiles dialog opens.
a. Specify the Target Resource scope:
■ Selected resources includes only the resources you select.
■ All resources associated with the selected resources includes allassociated resources in addition to resources you select.
b. Select one or more profiles from the Predictive Risk Profile menu, then clickOK.
The generated report opens in a new subtab on the Predictive Analytics tab. Viewreport execution status on the Report Results tab.
2. On the Report Results subtab, select the generated report to be opened, and clickShow Result.If you generated a report from the E2E View window or Search subtab, the report namebegins with OnDemand followed by the timestamp.
3. On the left pane of the report, click a metric to view the predicted performance trend.
Understanding performance trend projections in risk reportsYou can gain insight into near-term trends and long-term usage of your infrastructureresources from predictive analytics reports.
Report contents
The report is similar to other performance reports in Ops Center Analyzer and includes twingraphs. The left side represents current performance, and the right side represents thepredicted performance trend. Zoom in on the graph by clicking and then dragging the cursorover an area. Double-click the graph to return to the normal view.
Understanding performance trend projections in risk reports
Chapter 5: Analyzing performance trends with predictive analytics risk reportingHitachi Ops Center Analyzer User Guide 73

Place the cursor on any part of the performance trend to view the timestamp, theperformance at that point in time, and the difference between the predicted performance andthe threshold value defined for that resource. Because each target metric typically coversmultiple resources (selected in the Report Definitions), you can isolate any given resourceperformance trend by selecting the resource from the list to the right of the graph. To checkmore resources, click Select Component and add target resources.
Sort by
The report is organized by target metric. View a target metric performance graph by clickingthe metric on the left pane. You can select and view multiple graphs.
Sort the list of metrics on the left pane by selecting either Status (default) or Metric. Statusorganizes by severity of the potential alerts.
Additional actions
When you select resources from the resource list, you can make a note for further tracking.Additionally, click Execute Action to send an email message, run a script, or invoke theAction Template menu.
Report options
Select Save the report as a Report Definition to save the profile and target resourceselections.
If conditions have changed or if you have run corrective actions in response to the initialperformance trend projection, click Re-run to generate a new report using the same profileand report definitions. Then assess whether your response has averted the risk.
All generated risk reports are listed on the Report Result tab, where they can be sorted,viewed, or deleted.
Enhancing infrastructure management capabilitiesYou can analyze predicted data in the following contexts to understand performance trends inyour infrastructure and allow for better decision making.
Enhancing infrastructure management capabilities
Chapter 5: Analyzing performance trends with predictive analytics risk reportingHitachi Ops Center Analyzer User Guide 74

Analyzing near-term capacity trends
You can use predictive analytics risk reporting to analyze near-term capacity trends in yourinfrastructure. Infrastructure administrators know that keeping up with the growing capacityneeds of application users is an ongoing effort. By using predictive analytics risk reporting,you can identify capacity needs on a weekly or daily basis by analyzing short-term trendprojections. Use the following report definitions to analyze capacity usage trends:■ Top 5 Pools - Least Available Space■ Top 5 Pools Consuming Capacity (Free Space)■ Top 5 System Resources with the Growing Workloads■ Top 5 User Resources with the Growing Workloads
After you identify the affected storage resources, you can take the following actions:■ Assign more volumes manually.■ Create resource assignment rules based on your evaluation of the risk report data.■ Develop a plan for redistributing storage resources by moving storage pools to different
volumes.
Long-term capacity planning
You can plan for future growth by estimating long-term capacity usage trend projections withpredictive analytics risk reporting. Capacity planning poses several challenges forinfrastructure administrators. Estimates for growth can fluctuate depending on the time of theestimate. When you use predictive analytics risk reporting, you can continually generateestimates for capacity growth. Begin by analyzing near-term trends. Use the followingsystem-defined report definitions to collect data:■ Top 5 Pools Consuming Capacity■ Top 5 User Resources with the Busiest Workloads■ Top 5 System Resources with the Busiest Workloads■ Top 5 Growing Busy System Resources
Once you get an idea for the trend pattern for the various consumers or application users,create a risk profile that specifies capacity metrics. To maximize the information shown in thetrend projection, create one profile for one month, one for three months, and one for sixmonths. Use these profiles in conjunction with report definition that includes consumers.
Near-term performance tuning
You can use predictive analytics risk reporting to fine-tune overall system performance overtime to achieve optimization. Because most large-scale IT infrastructures are heterogenous,the task of fine-tuning performance is ongoing. Infrastructure administrators might have thetwin goals to make the most of the existing IT equipment (all system resources), whilemanaging resources to achieve stability in performance. With the predictive analytics riskreporting feature in Ops Center Analyzer, you can generate reports with trend projections toanticipate performance fluctuations and adjust resource monitoring.
In this workflow, infrastructure administrators can fine-tune system resource performance anduser resource allocation on a weekly or monthly basis.
Enhancing infrastructure management capabilities
Chapter 5: Analyzing performance trends with predictive analytics risk reportingHitachi Ops Center Analyzer User Guide 75

1. Set up dynamic thresholds for user and system resources. Use the base dynamicthreshold profile or edit it for the following:
■ Metrics: If you want to track performance at a granular level, select more metrics.
■ Plan: You can adjust the profile to monitor during peak times during the week andmonth
2. Set up event notifications.3. Create risk profiles and report definitions to the corresponding metrics and resources in
the profiles.4. Generate a risk report along with standard reports to compare past and current trends
with the trend projections in the risk report.5. Make adjustments in resource allocation, and modify both threshold profiles as needed.6. Generate the next round of risk reports and determine if the adjustments averted
overutilization of resources.
As an ongoing process, infrastructure administrators have several options on how to act onthe information in these risk reports. Ops Center Analyzer offers the following tools to aid infine-tuning:■ You can develop a script that is invoked when certain performance events and threshold
violations occur, and use the Execute Action function to run that script.■ You can use Execute Action to invoke a service from Ops Center Automator.■ If the magnitude of your infrastructure requires thorough analysis of data to avoid service
interruptions, you can do the following:● To analyze minute-level data, adjust the collection time in Analyzer detail view to track
events in finer granularity.● To analyze second-level data in Hitachi resources from Ops Center Analyzer, run
granular data collection.
Damage Control
You can use the predictive analytics risk reporting feature to evaluate near-term trends andtake preventive measures against performance degradation in your infrastructure.
Performance degradation can affect infrastructure with sudden bottlenecks. or worse,extended outages. Consumers might experience I/O problems with lagging response times,an annoying occurrence to application users, and a headache for IT. However, in an extendedoutage, the application is no longer available for use, causing a work stoppage. This situationcan be more than a headache to IT and might result in escalating support calls.
In this workflow description, an infrastructure administrator uses predictive risk reporting inOps Center Analyzer to respond preemptively to a sudden decrease in performance:
1. Monitor near-term trends across your infrastructure by using the following reportdefinitions.
■ Top 5 Resources with Worst Response-times and Related Workloads
■ Top 5 Pools - Least Available Space
Enhancing infrastructure management capabilities
Chapter 5: Analyzing performance trends with predictive analytics risk reportingHitachi Ops Center Analyzer User Guide 76

■ Top 5 User Resources with the Highest Resources
■ Top 5 Platinum Consumers at Risk
2. When you isolate which resources consistently appear in these reports, create a newrisk profile and risk report definition to analyze trend projections for those resources.
3. Use the new profile and report definition to run risk reports projecting when theperformance degradation will occur.
4. Initiate immediate action to avert performance degradation:
■ Assign resources
■ Set up resource assignment rules
5. If you determine that the performance trends are recurring, develop a response plan:
■ Adjust thresholds or create a new threshold profile for the resources
■ Set up notifications to track and alert other system administrators
■ Execute a script
■ Run Execute Action
Use risk reporting as an extra layer of monitoring
You can add an extra layer of resource monitoring to give a 10% margin outside your normalthreshold limits during day-do-day operations by using predictive analytics risk reporting. Tomanage performance risks on a daily level, you can generate risk reports to establish a bufferfor certain thresholds. Doing so allows infrastructure administrators to predict whenthresholds violations will occur. This buffer makes it easier to react to performance problems.
Periodic analysis with predictive analytics risk reportingYou can generate predictive analytics risk reports for the same target resources and metricsto analyze near-term or long-term trends by using risk report definitions periodically.
The following workflow diagram illustrates how to use predictive analytics risk reporting forperiodic analysis.
Periodic analysis with predictive analytics risk reporting
Chapter 5: Analyzing performance trends with predictive analytics risk reportingHitachi Ops Center Analyzer User Guide 77

Periodic analysis with predictive analytics risk reporting
Chapter 5: Analyzing performance trends with predictive analytics risk reportingHitachi Ops Center Analyzer User Guide 78

1. On Predictive Analytics > Report Definition, select a risk report definition, then clickPredict Result.
2. On the Report Results tab, select the risk report and click Show Result.3. The predictive analytics risk report opens in a new tab.
Recurring analysis
Place the cursor on any part of the performance trend to view the timestamp, theperformance at that point in time, and the difference between the predicted performance andthe threshold value defined for that resource. When you select resources from the resourcelist, you can make a note for further tracking.
E2E View analysis with predictive analytics risk reportingYou can generate predictive analytics risk reports from the E2E View tab or Search fields toexamine the relationship of resources to the target resource based on current conditions.
The following workflow illustrates how to use predictive analytics risk reporting from the E2EView.
E2E View analysis with predictive analytics risk reporting
Chapter 5: Analyzing performance trends with predictive analytics risk reportingHitachi Ops Center Analyzer User Guide 79

1. On the E2E View tab, select a resource for which you want to view predictedperformance data.
2. When the Select Profiles dialog appears, select a Target Resources option andPredictive Risk Profiles, then click OK.
3. The predictive analytics risk report opens in a new tab.
Target resource analysis
You can choose to analyze only selected resources from the E2E View or all resourcesassociated with those selected resources.
E2E View analysis with predictive analytics risk reporting
Chapter 5: Analyzing performance trends with predictive analytics risk reportingHitachi Ops Center Analyzer User Guide 80

Preventive actions and predictive analytics risk reportingYou can generate predictive analytics risk reports to check on the effects of corrective orpreventive actions by comparing actual performance data with predicted data.
The following workflow diagram illustrates how to use predictive analytics risk reporting forfollow-up analysis after taking corrective or preventive actions.
1. On Predictive Analytics > Report Definition, select a risk report definition, then clickPredict Result.
2. On the Report Results tab, select the risk report and click Show Result.
Preventive actions and predictive analytics risk reporting
Chapter 5: Analyzing performance trends with predictive analytics risk reportingHitachi Ops Center Analyzer User Guide 81

3. The predictive analytics risk report opens in a new tab.
■ Select a resource, then Execute Action to do any of the following:
● Send an email
● Run a user-defined script
● Start a service using Ops Center Automator
■ If conditions have changed or if you have run corrective actions in response to theinitial performance trend projection, click Re-run to generate a new report, using thesame profile and report definitions.
Preventive actions and predictive analytics risk reporting
Chapter 5: Analyzing performance trends with predictive analytics risk reportingHitachi Ops Center Analyzer User Guide 82

Chapter 6: Optimizing infrastructure resourceswith storage I/O controls
Ops Center Analyzer provides storage I/O controls to optimize infrastructure resources.
This feature works in many contexts to improve the efficient usage of resources in yourinfrastructure.
I/O control overviewI/O controls are available in Ops Center Analyzer when your storage systems have theServer Priority Manager function enabled.
Invoke this functionality through the Configuration Manager REST API and Hitachi OpsCenter Automator, which runs the storage I/O control service. Configuration tasks includeregistering storage systems on the Configuration Manager REST API server and setting up aconnection between Ops Center Analyzer and Ops Center Automator management servers.Alternately, if you do not have Ops Center Automator installed in your environment, you candevelop a script to run the I/O control service. To use the script, specify the file path in thetemplate files. Both tasks must be completed by the user.
I/O control operationsIn Ops Center Analyzer, use I/O controls to set upper limits on either the I/Os per second orthe data transfer rates across multiple storage systems at the volume level.
In the Ops Center Analyzer Operations window, search for and set limits on target volumes.The Operations window includes a History tab that displays a list of tasks created for each I/Ocontrol setting enabled in Ops Center Analyzer. This tab allows storage administrators toconfirm that the upper limit setting is processed and to track the status of multiple tasks.
Although Server Priority Manager allows upper limits to be set on I/O activity at the port andWWN level, Ops Center Analyzer does not currently support these operations.
Note: Review and record any existing Server Priority Manager performancetuning settings on your storage systems before you set up I/O controls in OpsCenter Analyzer. I/O upper limits set on volumes through Server Priority Managerare overwritten by upper limits set on Ops Center Analyzer. For details aboutServer Priority Manager, see the Performance Monitoring Guide available withyour storage system.
Chapter 6: Optimizing infrastructure resources with storage I/O controlsHitachi Ops Center Analyzer User Guide 83

RequirementsOps Center Analyzer I/O control settings depend on the following requirements:■ The Configuration Manager REST API and Ops Center Automator must be installed.■ The target storage systems must have the Server Priority Manager function enabled.■ You must have an Administrator account on the storage system service processor (SVP)
with Create permissions to connect the storage system and Ops Center Automator.■ You must register the target storage systems on the Configuration Manager REST API
server.■ The StorageOps permissions must be set in Ops Center Analyzer to allow you to set,
modify, or clear an upper limit on I/O traffic from the server to storage system.
Search capabilities for target volumesOps Center Analyzer provides search capabilities for finding target volumes on which youwant to set upper limits.
In the Operations window, search for volumes by keyword using the following categories:■ Tasks: name or description of the task entered in the Set IO Control window.■ Consumers: consumer names, grades, or descriptions.■ Volumes: volume names, storage systems, or host groups.
If you leave the search field empty and click Search, the tab displays all consumers, volumes,and tasks. When selecting targets to set the upper limit, you can view all the associatedvolumes for the consumer or task. This feature is useful when you need to modify I/O controllimits that have already been set.
Upper limit setting metricsChoose a metric for which to set an upper limit.
When setting upper limits, the I/O control settings dialog gives you the option of applying oneof the following metrics:■ IOPS: Use if the target volume is issuing a high number of I/O requests. The maximum
value is 65,535 IOPS.■ Transfer Rate [MBps]: Use if the target consumer's I/O requests are small in number but
large in data size. The maximum value is 31 MBps.
To confirm the result after setting upper limits, track the task status in the History tab in theOperations window.
Use cases for setting upper limitsUse I/O controls to optimize infrastructure resources.
Requirements
Chapter 6: Optimizing infrastructure resources with storage I/O controlsHitachi Ops Center Analyzer User Guide 84

Set upper limits for the following use cases:■ To achieve overall optimization of infrastructure resources during periods of I/O-intensive
activity. In this use case, set temporary limits as a preemptive solution. Modify the upperlimit according to known patterns in resource usage.
■ To maintain a quality-of-service benchmark for a service-level objective (SLO). In this usecase, set the upper limits as a long-term solution.
■ To prioritize I/O activity for high-grade consumers after detecting bottlenecks that areaffecting their performance. Disable the I/O control settings when the traffic between theserver and storage system decreases to acceptable levels.
I/O control settings for an SLOI/O controls enable you to meet the goals of your SLO.
SLAs specify a quality-of-service benchmark for an SLO. For storage I/O throughput, thisbenchmark is typically measured in IOPS or MBps. As a preemptive measure, Ops CenterAnalyzer enables you to set limits on storage I/O activity for applications on servers that issuetoo many I/O requests, and therefore provide sufficient resources in the infrastructure to meetthe SLOs. After identifying the consumers with a specific SLO, select the volumes and set anupper limit to guarantee the quality-of-service benchmark for that SLO. You can set differentstorage I/O upper limits for consumers based on grade.
I/O controls for optimizing infrastructure resourcesOps Center Analyzer features I/O controls for planning the optimization of the resources inyour infrastructure as usage patterns of critical and noncritical applications dictate.
Optimize your infrastructure resources by setting limits on I/O for noncritical applications.Setting upper limits on noncritical applications is similar to applying caps on I/O usage to freeup more resources in the infrastructure. When you foresee increased I/O activity, set upperlimits on volumes associated with applications or host servers issuing I/O requests.
When development or testing efforts require more resources than usual, set I/O control limitson the volumes associated with the I/O-intensive applications for that period. This I/O controlsetting then allows the business-critical applications sufficient access to storage resources.
When I/O activity decreases to acceptable levels, clear the I/O control limits from thosevolumes. By establishing these temporary limits on storage I/O, the infrastructure achievesoverall optimization during periods of increased I/O activity.
I/O controls for optimizing performance after the bottleneck analysisTo prevent an increased workload from affecting critical resources, set upper limits for serversissuing many I/O requests and affecting critical resources.
Storage administrators must respond quickly to sudden changes in I/O traffic. Sharedinfrastructure resources can degrade in performance at unpredictable times. If the bottleneckanalysis detects a spike in total IOPS, as shown in the following figure, the root cause is aninsufficient amount of resources available.
I/O control settings for an SLO
Chapter 6: Optimizing infrastructure resources with storage I/O controlsHitachi Ops Center Analyzer User Guide 85

Because adding resources cannot be performed quickly, or might not be possible, the mostefficient solution is to manage the I/O traffic. For a storage administrator, this situation mustbe treated as an emergency. In the Set IO Control window, set an upper limit for the volumesoverusing resources immediately when you detect them.
You might use the upper limit setting as a temporary measure to manage the resources asplanned for daily operations. If critical resources require less I/O prominence, remove theupper limit setting. All I/O control tasks are saved to the History tab.
Continue checking the History tab to monitor the upper limit settings by searching for tasks.
Preventing noncritical resources from causing performance degradation
When you are notified of performance degradation through an alert, perform the bottleneckanalysis to detect the disruptive resource:■ Review the trend charts through E2E or Sparkline View to compare performance of
selected resources.■ Use the Analyze Shared Resources window to identify the noncritical resources that are
disrupting I/O traffic.■ When the Resources using the bottleneck window opens, you see a list of volumes that
correspond to the trend chart.■ Identify the target volumes issuing many I/O requests.■ Select the target volume and then click More Actions to select Set IO Control. For your
reference, give the task an appropriate name in the description field.■ Continue monitoring the History tab. When I/O control is no longer needed, select the
target volumes of the task in IO Control Settings and click Off, or modify those limits asneeded and resubmit.
I/O controls for optimizing performance after the bottleneck analysis
Chapter 6: Optimizing infrastructure resources with storage I/O controlsHitachi Ops Center Analyzer User Guide 86

Performing storage I/O control tasks in Ops Center Analyzerwith Ops Center Automator
Use I/O controls to set, modify, or delete upper limits on I/O activity.
Setting I/O control limitsSet I/O control limits on volumes associated with a consumer. Use this procedure to set newor modify current I/O tasks.
Before you begin■ You must be logged on as a user with StorageOps permissions.■ The Server Priority Manager function must be enabled in the storage system.■ The connection between Ops Center Analyzer and Ops Center Automator is set with SSL
communication.■ Check for existing Server Priority Manager settings in the I/O operations tab after you
search for target volumes. You can see in the resulting list of volumes existing ServerPriority Manager upper limit settings. If another administrator has set upper limits throughServer Priority Manager at the volume level, running I/O control tasks in Ops CenterAnalyzer will overwrite the Server Priority Manager settings on the target volumes.However, if an upper limit has been set in Server Priority Manager at the port or WWNlevel, the I/O control task submitted on Ops Center Analyzer will not overwrite the previousServer Priority Manager upper limit setting.
■ Review the list of upper limit tasks in the Operations > History > History tab, to verifywhether any active tasks are in progress for the same target volumes for which you wantto set I/O controls. If there are any tasks with the status (In Progress), wait for the taskto complete (Complete) before you set new I/O control settings.
■ The maximum number of WWNs associated with a target volume is 32. You cannot setupper limits on volumes that exceed this number.
Procedure
1. From the Operations tab, search for and select the volumes, and click Set IO Control.Alternatively, if you are troubleshooting a performance bottleneck in the AnalyzeShared Resources window, select the target volumes, and click Set IO Control.
Note: If you are modifying the Target Volumes list, click Remove Volumes.A window opens where you can add or remove volumes from the Set IOControl task.
2. In the Set IO Control window, make the following selections:a. In Upper Limit Setting, select ON.b. In Collective Settings, select the metric and enter the limit in Upper limit for each
volume.
Performing storage I/O control tasks in Ops Center Analyzer with Ops Center Automator
Chapter 6: Optimizing infrastructure resources with storage I/O controlsHitachi Ops Center Analyzer User Guide 87
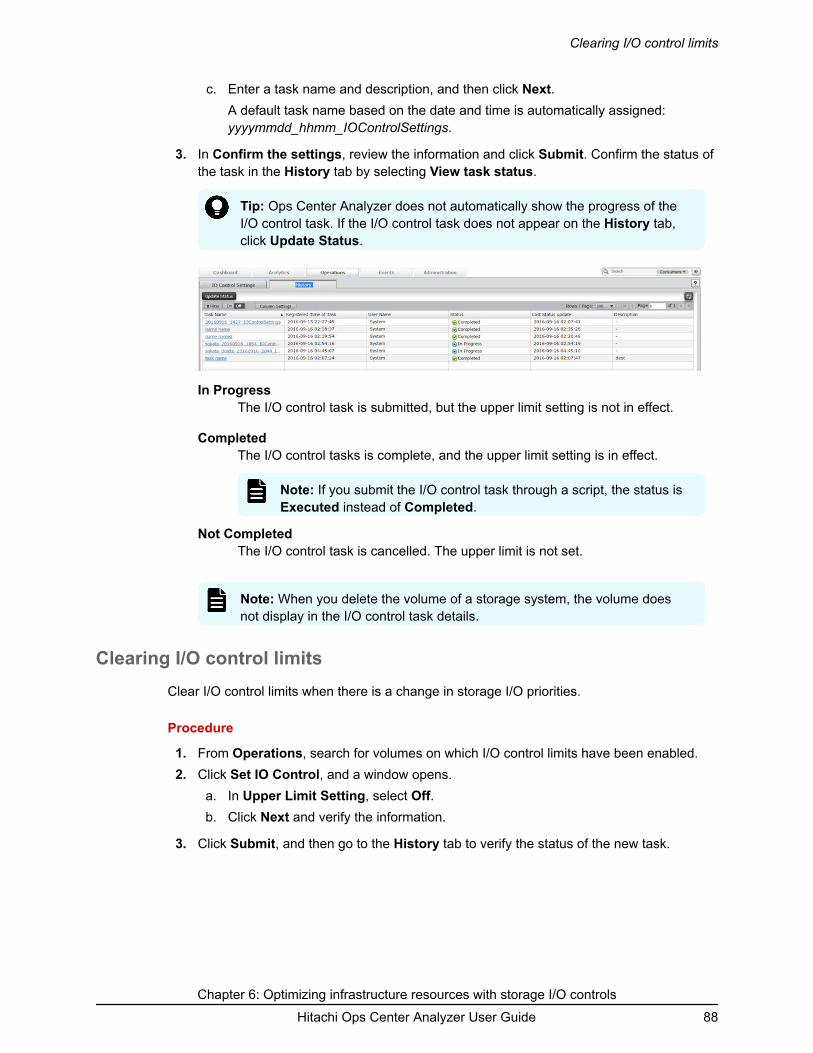
c. Enter a task name and description, and then click Next.A default task name based on the date and time is automatically assigned:yyyymmdd_hhmm_IOControlSettings.
3. In Confirm the settings, review the information and click Submit. Confirm the status ofthe task in the History tab by selecting View task status.
Tip: Ops Center Analyzer does not automatically show the progress of theI/O control task. If the I/O control task does not appear on the History tab,click Update Status.
In ProgressThe I/O control task is submitted, but the upper limit setting is not in effect.
CompletedThe I/O control tasks is complete, and the upper limit setting is in effect.
Note: If you submit the I/O control task through a script, the status isExecuted instead of Completed.
Not CompletedThe I/O control task is cancelled. The upper limit is not set.
Note: When you delete the volume of a storage system, the volume doesnot display in the I/O control task details.
Clearing I/O control limitsClear I/O control limits when there is a change in storage I/O priorities.
Procedure
1. From Operations, search for volumes on which I/O control limits have been enabled.2. Click Set IO Control, and a window opens.
a. In Upper Limit Setting, select Off.b. Click Next and verify the information.
3. Click Submit, and then go to the History tab to verify the status of the new task.
Clearing I/O control limits
Chapter 6: Optimizing infrastructure resources with storage I/O controlsHitachi Ops Center Analyzer User Guide 88

Chapter 7: Configuring resource monitoringOps Center Analyzer ensures the health of your data center by measuring, monitoring, andoptimizing the performance of your infrastructure resources.
Overview of managing and monitoring infrastructureresources
You can set up consumers associated with user groups or applications. You can then assignresources to those consumers and set up threshold profiles for monitoring those resources.
1. Create a consumer profile and set the grade: Creating a consumer (on page 108).
Chapter 7: Configuring resource monitoringHitachi Ops Center Analyzer User Guide 89

2. Add resources to the consumer automatically: Creating a resource assignment rule (onpage 108).
3. Create threshold profiles to manage monitored resources: Setting thresholds for systemresources (on page 103).
You can choose from two types of resource monitoring:
■ For monitoring SLOs, see Monitoring using a static threshold (on page 98).
■ For stability focused monitoring, see Monitoring using a dynamic threshold (onpage 93).
You can also add resources either manually or configure user resource assignment rulesbased on threshold profiles: Creating a user resource assignment rule (on page 102).
Resource monitoring settingsTo monitor management targets, define the following conditions:■ User Resource Threshold Profiles
Define the monitoring conditions for detecting deterioration in the service performance ofvirtual machines and volumes. You can monitor using dynamic thresholds or staticthresholds.
You can create rules and conditions to automate resource assignment to monitoringprofiles. Using these rules, the newly discovered user resources are automaticallyassigned to the user resource threshold profiles. When you do not create monitoringthreshold profiles or define assignment rules, the newly discovered resources areautomatically registered to the default threshold profiles.
■ System Resource Threshold Profiles
Define monitoring conditions for detecting performance bottlenecks in infrastructuredevices such as switches, hypervisors and storage systems. You can monitor using staticthresholds.
For monitoring profiles, the following conditions occur:■ When static thresholds are used, the measured values collected from the monitoring
target are evaluated based on whether they are greater than or equal to the warningthreshold.
Result: An event occurs when the measured value of the metric reaches the warningthreshold.
■ When you use static or dynamic thresholds, measured values from the monitoring targetare evaluated based on whether they are greater than or equal to the critical threshold.
Result: An event occurs when the measured value of the metric reaches the criticalthreshold.
When you restart the Ops Center Analyzer service, the status of monitored resources can bedelayed for 5 minutes or longer. During this period, the status displays as Unknown.
Resource monitoring settings
Chapter 7: Configuring resource monitoringHitachi Ops Center Analyzer User Guide 90

Dynamic thresholdsDynamic thresholds are calculated automatically by analyzing the load pattern from thehistorical data. These values are adaptive in nature and change over a period of timedepending on the performance of your resources, workload changes, and so on. You usedynamic thresholds to monitor the user resources, such as volumes, VMs, and hosts.
The scenarios for using dynamic thresholds to monitor your environment are as follows:■ When SLOs and other performance parameters are not established with the customer
■ When you want to monitor your environment for stable performance and detect irregularbehavior
For details about dynamic threshold monitoring, see Dynamic Threshold Storage ResourceMonitoring With Performance Analytics.
Advantages of dynamic thresholds
With changing business requirements and performance goals, monitoring performance ofyour environment using predefined static thresholds might not be a feasible solution. Thestatic values are calculated through trial and error, which is often time-consuming. Thesevalues become out of context in the long-term and the settings must be re-evaluated toensure compliance.
By automating the threshold setting you gain better visibility into your environment andperformance trend patterns. Dynamic thresholds adapt to your environment and proactivelysends alerts before the performance bottleneck occurs.
For more information about dynamic threshold monitoring, see Dynamic Threshold StorageResource Monitoring With Performance Analytics.
Determining if the computed value is correct
If the computed values match your requirements, you can continue to use the dynamicthresholds for monitoring your environment. If you receive too many false alerts, you canmanually edit the dynamic threshold values. For example, during migration process, aresource might temporarily have a large number of disk I/Os, and you might receive anumber of false alerts. In this situation, you can manually edit the baseline value to accountfor the temporary increase in the load, and then allow the system to dynamically adjust thebaseline values when the stable operation is restored.
Automatic calculation of baseline valuesDetermining an appropriate threshold is essential while monitoring business-criticalapplications. Ops Center Analyzer analyzes the peak, normal, and low volume phases basedon the historical data and adjusts the monitoring thresholds accordingly. Automating thethreshold calculation eliminates false alerts and reduces the number of alerts to investigate,which might otherwise become a management overhead.
Dynamic thresholds
Chapter 7: Configuring resource monitoringHitachi Ops Center Analyzer User Guide 91

The application workloads might vary at different times of the day or week. For example, theworkload pattern of an OLTP application might be different on weekdays and weekends. Youcan manage varying workloads that occur at different time periods for an application bycreating monitoring plans. The system analyzes the performance data accumulated in thescheduled baseline period for computing the dynamic threshold values.
The following example shows the response time metrics of a business-critical applicationmonitored over time and how the system derives the automatic threshold values based onthe past performance. The high-level steps the system uses to calculate the automaticbaseline values are as follows:■ Analyzes historical data for identifying the performance patterns in the specified baseline
period.
■ Detects and removes the occasional outliers: In the following example, the data points thatdeviate from the norm represent the outliers. The system ignores the outliers appearing atirregular intervals to calculate an appropriate threshold value.
Automatic calculation of baseline values
Chapter 7: Configuring resource monitoringHitachi Ops Center Analyzer User Guide 92

■ Calculates the maximum value: The upper limit of the values in the normal range is usedto calculate the maximum value. After determining the maximum value, the system addsthe margin of error to the computed value.
■ Determines the weighted average: The weighted average derives the threshold valuesbased on the past performance trends over a specified time period.
Monitoring using a dynamic thresholdWhen monitoring using dynamic thresholds, the thresholds are automatically calculated andset based on performance information collected from monitored user resources over aspecific time period. This type of monitoring is useful when you want to detect degradation inservice performance or when, for example, you have not established a service-levelagreement with customers. The appropriate thresholds are automatically set according to theresource configuration and changes in the load status. For this reason, system administratorsdo not need to manage the threshold values. In addition, based on the importance of theapplicable system, you can set the margin levels for the calculated thresholds.
To monitor using dynamic thresholds, create threshold profiles for user resources and thenassign the resources you want to monitor. You can set more than one monitoring plan foreach user resource threshold profile. For the monitoring plan, specify threshold values for themonitoring schedule or for each monitoring item. By creating multiple monitoring plans, youcan schedule changes to the threshold values or items to be monitored.
By creating assignment rules for user resources, the discovered user resources areautomatically assigned to threshold profiles in accordance with the assignment rules. You canalso edit and delete the created threshold profiles or assignment rules for user resources.
Monitoring using a dynamic threshold
Chapter 7: Configuring resource monitoringHitachi Ops Center Analyzer User Guide 93

Note: Changing the monitoring mode of a profile to Dynamic or Off may result inthe Threshold: Could not get the value error message when aperformance event of a resource monitored by that profile occurs.
Dynamic threshold monitoring margins
Dynamic thresholds are based on computed values, allowing system administrators to detectperformance degradation and take preemptive action.
This setting only affects the threshold profile with a dynamic monitoring mode. The thresholdis automatically calculated based on the performance information, and a safety margin isadded to the calculated value to avoid false alerts. The higher the safety margin, the lowerthe total number of alerts generated. Likewise, the lower the safety margin, the higher thetotal number of alerts.
The following graphs illustrate the differences between the three type of margins.
Selecting the dynamic threshold margin
Select the margin for dynamic thresholds and create a monitoring plan when creating athreshold profile.
Dynamic thresholds are automatically calculated based on performance information.
Choose the margin type based on your monitoring objectives:■ Standard: This is the recommended margin.■ High: Use this margin to generate a lower number of alerts.■ Low: Use this margin to generate a higher number of alerts.
You can change the margin on the dynamic threshold profile as performance trends change.
You can also create a monitoring plan if your environment requires flexible monitoring.
Dynamic threshold monitoring margins
Chapter 7: Configuring resource monitoringHitachi Ops Center Analyzer User Guide 94

Create a plan by choosing a schedule and setting threshold values for various metrics:■ Select a resource that you plan to monitor.■ Devise a schedule and set threshold values for each metric.■ Select the dynamic threshold margin type.
The dynamic threshold values depend on the performance data of the monitored resources.
Static thresholdsStatic thresholds are user-defined thresholds that you manually configure for use at differenttimes of the day or week depending on the workload in your environment.
You use predefined static threshold values in the following scenarios:■ You have a well-defined service-level objective which clearly establishes the performance
goals.
For example, if you have a service-level agreement with the customer to support onlinetransactions at a response time of less than 1 second for a business-critical application,then you can create a User resource threshold profile to establish the response time andother performance requirements for the application, and then assign the target resourcesfor monitoring. If there is an SLO violation, the system sends a critical alert or a warningand notifies the user before the problem becomes serious. You can also generate a reportthat compares the actual response time of the business-critical application to the SLO andsee if your objectives are in compliance, then take necessary measures to fix the problem.
■ You can assess the workload patterns in your environment and know what values toassign.
For example, define the threshold for a system resource based on the architecture of thestorage system. If the storage system is VSP G1000, then the recommended MPB (MPBlade) usage is under 60%.
Static thresholds
Chapter 7: Configuring resource monitoringHitachi Ops Center Analyzer User Guide 95

Setting static thresholds using monitoring profilesYou can create monitoring profiles with static thresholds for managing user and systemresources. The performance parameters defined in the threshold profile determine when analert is triggered.
Create threshold profiles for user or system resources based on the resource type, and thenassign the resources you want to monitor.
For user resources
The procedure for setting static thresholds for user resources is as follows:
Procedure
1. On the Administration tab, from the navigation pane, select Monitoring Settings >User Resource Threshold Profiles > Create Threshold Profile.
2. In the Create User Resource Threshold Profile window, enter the profile name,description, and select the resource type.
3. On the Monitoring Plans tab, click Create Plan to create new monitoring plans. Youcan either edit the base plan or create a new plan.
4. In the Create Plan window, set the target period for monitoring. Under Target metric,click Static to enable static monitoring mode. You must manually enter the thresholdvalues for the target metrics when you enable static monitoring mode.
5. To save the profile, click OK.After you save the profile, you are navigated to the profile detail window, where you canassign target resources, or create resource assignment rules.
Setting static thresholds using monitoring profiles
Chapter 7: Configuring resource monitoringHitachi Ops Center Analyzer User Guide 96

6. In the profile detail window you can do the following:
■ On the Assignment Rules tab, you can create rules for assigning resources to themonitoring profile automatically.
■ On the Target Resources tab, you can assign the resources to the profile manually.You can also view the existing target resources associated with the monitoringprofile.
For system resources
The procedure for setting static thresholds for system resources is as follows:
Procedure
1. On the Administration tab, from the navigation pane select Monitoring settings >System Resource Threshold Profiles > Create Threshold Profile.
2. In the Create System Resource Threshold Profile window, enter the profile name,description, and select the resource type. If required, copy the settings from the defaultprofile or an existing system resource profile.
3. Under threshold values, manually enter the threshold values for the performancemetrics.
Chapter 7: Configuring resource monitoringHitachi Ops Center Analyzer User Guide 97
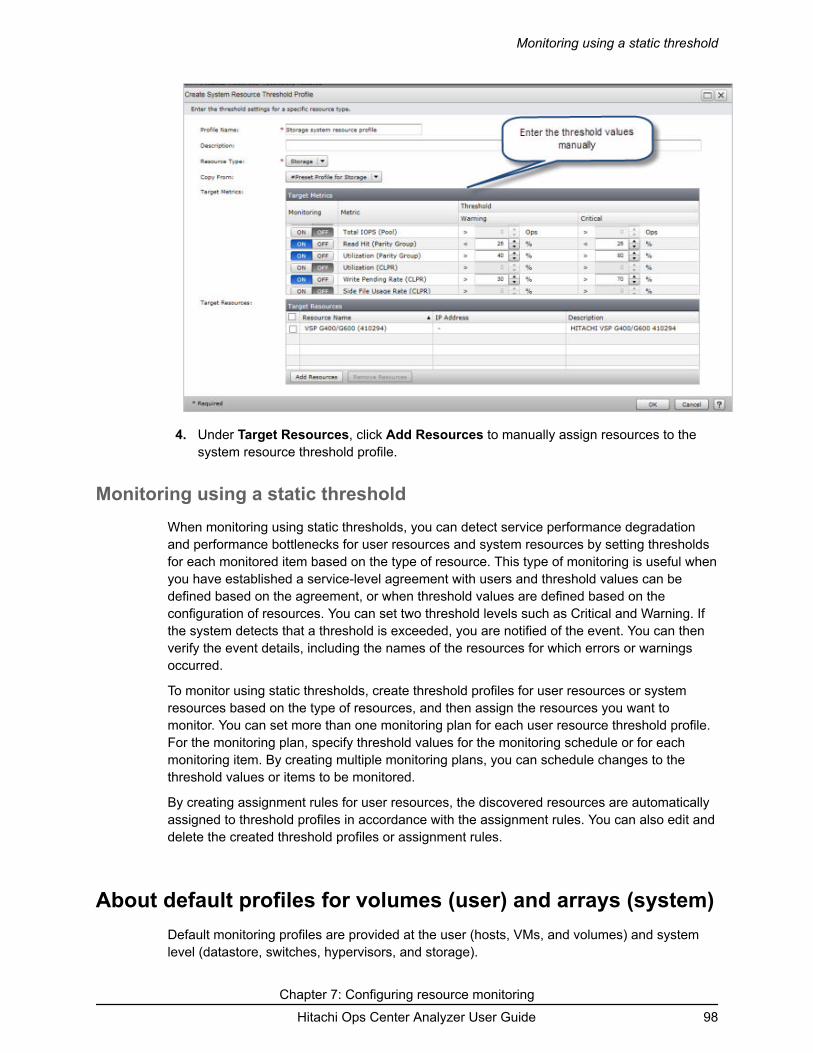
4. Under Target Resources, click Add Resources to manually assign resources to thesystem resource threshold profile.
Monitoring using a static thresholdWhen monitoring using static thresholds, you can detect service performance degradationand performance bottlenecks for user resources and system resources by setting thresholdsfor each monitored item based on the type of resource. This type of monitoring is useful whenyou have established a service-level agreement with users and threshold values can bedefined based on the agreement, or when threshold values are defined based on theconfiguration of resources. You can set two threshold levels such as Critical and Warning. Ifthe system detects that a threshold is exceeded, you are notified of the event. You can thenverify the event details, including the names of the resources for which errors or warningsoccurred.
To monitor using static thresholds, create threshold profiles for user resources or systemresources based on the type of resources, and then assign the resources you want tomonitor. You can set more than one monitoring plan for each user resource threshold profile.For the monitoring plan, specify threshold values for the monitoring schedule or for eachmonitoring item. By creating multiple monitoring plans, you can schedule changes to thethreshold values or items to be monitored.
By creating assignment rules for user resources, the discovered resources are automaticallyassigned to threshold profiles in accordance with the assignment rules. You can also edit anddelete the created threshold profiles or assignment rules.
About default profiles for volumes (user) and arrays (system)Default monitoring profiles are provided at the user (hosts, VMs, and volumes) and systemlevel (datastore, switches, hypervisors, and storage).
Monitoring using a static threshold
Chapter 7: Configuring resource monitoringHitachi Ops Center Analyzer User Guide 98

The User and System Resource Threshold Profiles are located in the Administration tabunder Monitoring Settings. Each profile includes a list of metrics and values. The defaults forvolumes (user) and arrays (system) are described here for reference. The User SystemResource Threshold Profiles support Dynamic thresholds (on page 91). The default valuesare general recommendations and should be customized based on your environment.
Note: For best results, do not modify the default profiles; make a copy instead.(When creating a new threshold profile, use the Copy From option.)
Default Profile for Volumes
The default user profile for volumes are listed in the following table. The metrics can be set toDynamic, Static, or OFF. Dynamic means the thresholds are calculated automatically basedon historical data. Metrics that are set to Dynamic or OFF have no set values, hence the tabledoes not include Threshold values.
Monitoring (OFF, Static/Dynamic) Metric
Dynamic Total IOPS (Port)
OFF Read Hit (LDEV)
OFF Read Hit Count (LDEV)
OFF Write Hit Count (LDEV)
OFF Write Hit (LDEV)
OFF Read IOPS (LDEV)
OFF Random Read Hit (LDEV)
OFF Random Read IOPS (LDEV)
OFF Random Write IOPS (LDEV)
OFF Seq Read Hit (LDEV)
OFF Seq Read IOPS (LDEV)
OFF Seq Write IOPS (LDEV)
OFF Write IOPS (LDEV)
OFF Backend Transfers (LDEV)
OFF Cache to Drive Transfers (LDEV)
OFF Random Drive to Cache Transfers (LDEV)
OFF Seq Drive to Cache Transfers (LDEV)
OFF Read Transfer Rate (LDEV)
About default profiles for volumes (user) and arrays (system)
Chapter 7: Configuring resource monitoringHitachi Ops Center Analyzer User Guide 99
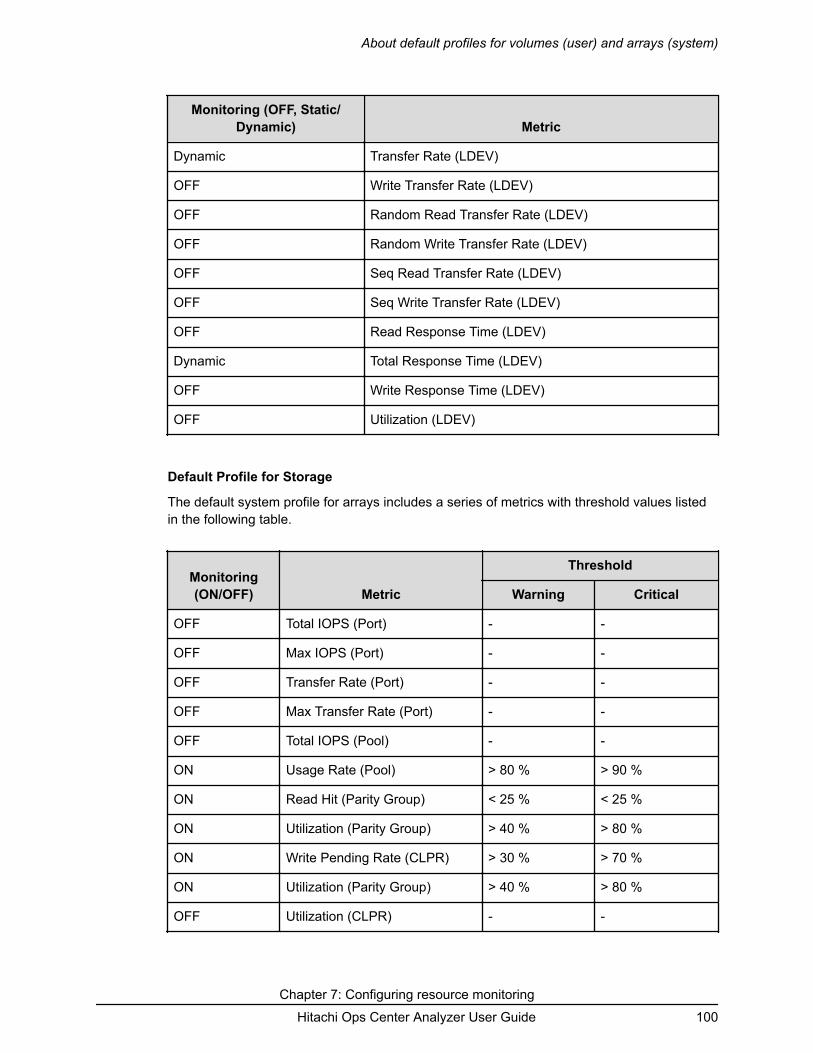
Monitoring (OFF, Static/Dynamic) Metric
Dynamic Transfer Rate (LDEV)
OFF Write Transfer Rate (LDEV)
OFF Random Read Transfer Rate (LDEV)
OFF Random Write Transfer Rate (LDEV)
OFF Seq Read Transfer Rate (LDEV)
OFF Seq Write Transfer Rate (LDEV)
OFF Read Response Time (LDEV)
Dynamic Total Response Time (LDEV)
OFF Write Response Time (LDEV)
OFF Utilization (LDEV)
Default Profile for Storage
The default system profile for arrays includes a series of metrics with threshold values listedin the following table.
Monitoring(ON/OFF) Metric
Threshold
Warning Critical
OFF Total IOPS (Port) - -
OFF Max IOPS (Port) - -
OFF Transfer Rate (Port) - -
OFF Max Transfer Rate (Port) - -
OFF Total IOPS (Pool) - -
ON Usage Rate (Pool) > 80 % > 90 %
ON Read Hit (Parity Group) < 25 % < 25 %
ON Utilization (Parity Group) > 40 % > 80 %
ON Write Pending Rate (CLPR) > 30 % > 70 %
ON Utilization (Parity Group) > 40 % > 80 %
OFF Utilization (CLPR) - -
About default profiles for volumes (user) and arrays (system)
Chapter 7: Configuring resource monitoringHitachi Ops Center Analyzer User Guide 100

Monitoring(ON/OFF) Metric
Threshold
Warning Critical
ON Write Pending Rate (CLPR) > 30 % > 70 %
OFF Side File Usage rate (CLPR) - -
ON Utilization (MP) > 40 % > 80 %
ON Write Pending Rate (MPBCLPR)
> 30 % > 60 %
ON Utilization (MPB) > 40 % > 80 %
ON Access Path Usage (CHAESW)
> 20 % > 50 %
ON Access Path Usage (DKA ESW) > 20 % > 50 %
ON Access Path Usage (MPBESW)
> 20 % > 50 %
ON Access Path Usage (CacheESW)
> 20 % > 50 %
ON Access Path Usage (CachePath)
> 20 % > 50 %
ON Physical Capacity Usage Rate(Pool)
> 80 % > 90 %
Setting thresholds for user resourcesTo detect service performance degradation of a virtual machine or volume, create a profileand assign rules.
Procedure
1. In the Administration tab, select Monitoring Settings > User Resource ThresholdProfiles.
2. Click Create Threshold Profile.3. In the Create User Resource Threshold Profile window, define the Profile Name and
Resource Type.4. Select a resource to be monitored from Resource Type, and then click Create Plan.5. In the displayed box, create a monitoring plan.
Define the necessary items, and then click OK.
6. For Target Metric, select a monitoring mode for each monitoring item. If you selectStatic, define a threshold. If you select Dynamic, go to the next step.
Setting thresholds for user resources
Chapter 7: Configuring resource monitoringHitachi Ops Center Analyzer User Guide 101

7. In the Create User Resource Threshold Profile window, click OK.
The window automatically switches to the detailed window for the user resourcethreshold profile that was created.
8. Click the Assignment Rules tab to create resource assignment rules.9. Click Create Rule, and then specify the necessary items in the displayed box.
10. Define conditions for Condition, and then click Preview.
A list appears with the resources that match the specified conditions and are notassigned to the threshold profiles of other user resources.
11. Click OK.
The user resource threshold profile is associated with the resource, and thresholds areset for the resource.
Verify which resources are associated with a user resource threshold profile by clickingthe Target Resources tab.
Result
The created profile appears in the user resource threshold profiles list.
Creating a user resource assignment ruleWhen you create a user resource assignment rules, the discovered user resources areautomatically registered in a threshold profile 24 hours after discovery.
Procedure
1. In the Administration tab, select Monitoring Settings > User Resource AssignmentRules.
2. Select the tab for the user resource you are creating, and then click Create Rule.3. Define the assignment conditions and the assignment destination.4. Click OK.
Result
The created user resource assignment rule appears in the user resource assignment ruleslist.
Changing user resource assignment rule priorityChange the order of priority for the user resource assignment rule.
Procedure
1. In the Administration tab, select Monitoring Settings > User Resource AssignmentRules.
Creating a user resource assignment rule
Chapter 7: Configuring resource monitoringHitachi Ops Center Analyzer User Guide 102

2. Select the tab for the resource assignment rule whose priority you want to change, andthen click Change Priority.
3. In the box, change the priority.4. Click OK.
Running a user resource assignment ruleFor resources that have yet to be assigned to a threshold profile, run a user resourceassignment rule to assign these resources to threshold profiles according to the assignmentrule.
Procedure
1. In the Administration tab, select Monitoring Settings > User Resource AssignmentRules.
2. Select the tab for the resource for which you want to run the assignment rule, and thenassign the target resource by clicking Apply All Rules.
3. Verify user resources to which threshold profiles have been set. Select MonitoringSettings > User Resource Threshold Profiles. Select the target threshold profile, andthen click the Target Resources tab to display the resources list.
Setting thresholds for system resourcesTo detect hardware bottlenecks in system resources such as hypervisors and storagesystems, create a profile and set thresholds.
Procedure
1. Go to the Administration tab, then from the navigation pane select Monitoringsettings > System Resource Threshold Profiles > Create Threshold Profile.
2. In the Create System Resource Threshold Profile window, enter the profile name,description, and select the resource type. If required, copy the settings from the defaultprofile or existing system resource profiles.
3. Under threshold values, manually enter the threshold values for the performancemetrics.
Running a user resource assignment rule
Chapter 7: Configuring resource monitoringHitachi Ops Center Analyzer User Guide 103

4. Under Target Resources, click Add Resources to manually assign resources to thesystem resource threshold profile.
Removing monitored resourcesIf you remove resources from the environment or no longer require monitoring, you have theoption of deleting the resources along with the collected performance data. In this case, allassociated components displayed in the Ops Center Analyzer UI (such as CPU, memory,NIC, HBA, Disk, and VM for hypervisors) are removed, along with the performance datastored in the Analyzer detail view database.
When you remove the monitored resources, you must also delete the related probe instance.Otherwise, the resources are eventually detected and added back to the probe instance.
Removing monitored resources
Chapter 7: Configuring resource monitoringHitachi Ops Center Analyzer User Guide 104

Caution:■ When a probe instance monitors multiple resources and you selectively
remove a specific monitored resource, you must still delete the probeinstance. When you delete the probe instance, the probe stops the datacollection of all other associated resources. To resume the data collection ofother associated resources, you must recreate the probe instance and add theresources.
■ Ensure that you choose the correct resources to remove; the monitoringconfiguration and performance data is deleted and you cannot restore. If youremove the wrong resources by mistake and the probe instance is still inplace, the resources are eventually detected and added again, but thehistorical performance data is lost, and you must redefine the consumer andthreshold configuration. (Depending on the size of the configuration, theprocess of detecting and adding these resources may take a few hours.)
■ Removing a probe instance and all the associated resources reduces theAnalyzer detail view license node count.
To remove resources, you must first stop the probe, wait until the data transmission iscomplete, remove the monitored resources, and then delete the probe.
Procedure
1. Log on to the Analyzer probe server UI, and stop the probe from the Status window.2. Wait until the data transmission is complete, which takes about 30 minutes. Verify the
data import status of the probe instance that you want to delete on both Analyzer probeserver and Analyzer detail view.
a. From the Analyzer probe server Status window, verify the last data collection timeof Performance Data and Configuration Data for the probe.
b. From the Analyzer detail view dashboard, click the Server Status icon. From theStatus window, verify the Last Configuration Import Time and LastPerformance Import Time for the probe.
3. From the Ops Center Analyzer UI, click the Administration tab and select ResourceManagement.
4. Select the resource tab you want.5. Select the check boxes for the resources you want to remove and click Remove.
Removing monitored resources
Chapter 7: Configuring resource monitoringHitachi Ops Center Analyzer User Guide 105

6. The list of resources to be deleted appears in a new window. Click OK.7. Because the removal cannot be undone, you are prompted to confirm your choice. Click
OK.8. To delete the probe, go to the Analyzer probe server UI, from the Status window, search
for the probe that you want to delete, select the probe and then click Delete.
Result
The resources are removed in the background. If you have deleted a probe instance and theassociated resources to reduce a license node count, you do not need to wait until theinformation has been updated to configure additional resources. You can later confirm that alicense node has been released, as described in "Viewing and updating the Analyzer detailview license" in the Hitachi Ops Center Analyzer Installation and Configuration Guide.
Removing monitored resources
Chapter 7: Configuring resource monitoringHitachi Ops Center Analyzer User Guide 106
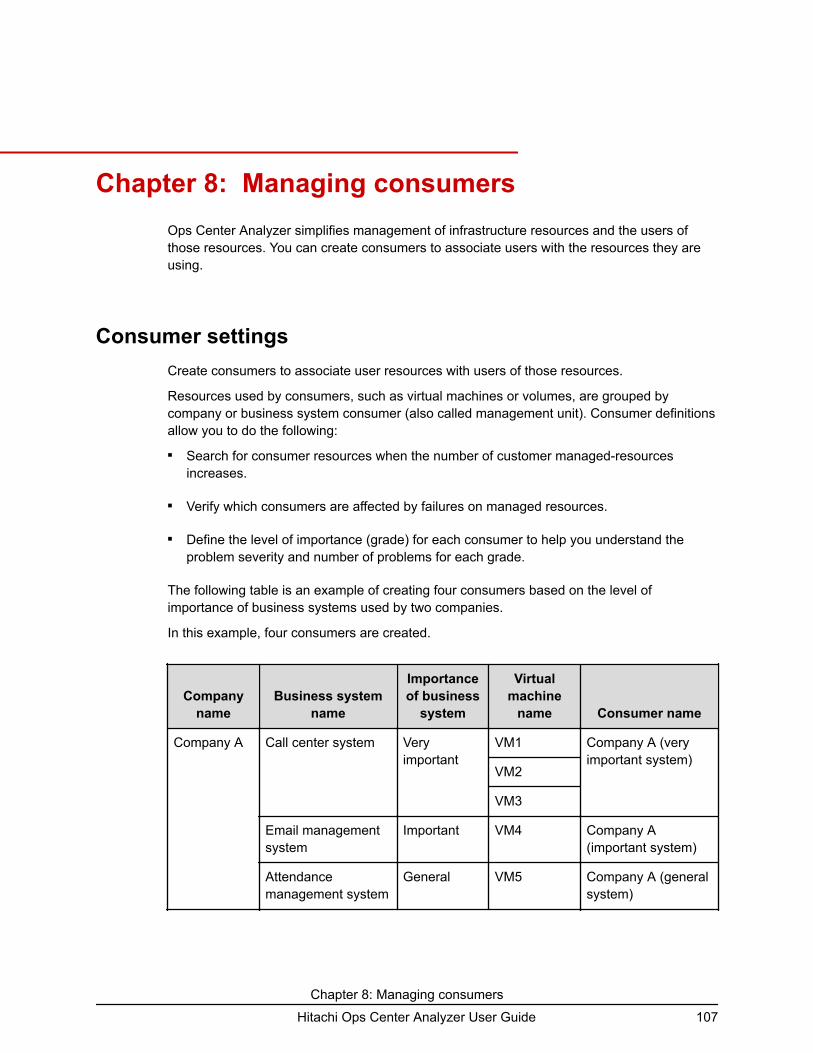
Chapter 8: Managing consumersOps Center Analyzer simplifies management of infrastructure resources and the users ofthose resources. You can create consumers to associate users with the resources they areusing.
Consumer settingsCreate consumers to associate user resources with users of those resources.
Resources used by consumers, such as virtual machines or volumes, are grouped bycompany or business system consumer (also called management unit). Consumer definitionsallow you to do the following:■ Search for consumer resources when the number of customer managed-resources
increases.
■ Verify which consumers are affected by failures on managed resources.
■ Define the level of importance (grade) for each consumer to help you understand theproblem severity and number of problems for each grade.
The following table is an example of creating four consumers based on the level ofimportance of business systems used by two companies.
In this example, four consumers are created.
Companyname
Business systemname
Importanceof business
system
Virtualmachine
name Consumer name
Company A Call center system Veryimportant
VM1 Company A (veryimportant system)
VM2
VM3
Email managementsystem
Important VM4 Company A(important system)
Attendancemanagement system
General VM5 Company A (generalsystem)
Chapter 8: Managing consumersHitachi Ops Center Analyzer User Guide 107

Companyname
Business systemname
Importanceof business
system
Virtualmachine
name Consumer name
Company SNSsystem
General VM6
Company B Email managementsystem
Important VM7 Company B
Sales managementsystem
Important VM8
Creating a consumerCreate consumers to associate managed devices with the customers who use those devices.
Procedure
1. In the Administration tab, select Consumer Settings > Consumers.2. Click Create Consumer.3. Define the consumer name and grade, and then click OK.
The four default grades to assign consumers, in order of importance, are Platinum,Gold, Silver, and Bronze.
Creating a resource assignment ruleBy creating resource assignment rules, the discovered resources are automatically registeredto consumers 24 hours after discovery.
Procedure
1. In the Administration tab, select Consumer Settings > Resource Assignment Rules.
Creating a consumer
Chapter 8: Managing consumersHitachi Ops Center Analyzer User Guide 108

2. Select the tab for the resource for which you want to create an assignment rule, andthen click Create Rule.
3. Define the assignment conditions and assignment destination.
4. Click OK.
Result
The created resource assignment rule appears in the resource assignment rules list.
Changing a resource assignment rule priorityChange the priority for a created resource assignment rule.
Procedure
1. In the Administration tab, select Consumer Settings > Resource Assignment Rules.2. Select the tab for the resource assignment rule for which you want to change the priority,
and then click Change Priority.3. In the box, change the priority.4. Click OK.
Running a resource assignment ruleRun a resource assignment rule to automatically assign resources to consumers.
Procedure
1. In the Administration tab, select Consumer Settings > Resource Assignment Rules.2. Select the tab for the resource for which you want to run the assignment rule, and then
assign the target resource by clicking Assign VMs, Assign Hosts, or Assign Volumes.3. To verify that resources are assigned to consumers, select Consumer Settings >
Consumers. Select a consumer, and then click the tab for the resource to display theresources list.
Changing a resource assignment rule priority
Chapter 8: Managing consumersHitachi Ops Center Analyzer User Guide 109

Chapter 9: Setting notificationsSetting notifications is an easy way to stay informed on the status of infrastructure resourcesand events.
Monitoring resources is both an active and passive activity for IT administrators. Ops CenterAnalyzer allows you to configure email notifications that provide detailed information aboutproblems with resource management. If multiple administrators rely on the Ops CenterAnalyzer service, you can create different profiles to deliver different types of informationbased on the profile settings.
Email notification settingsYou can define who receives email notifications and when to send the notifications. Configureemail notification settings to notify administrators about problems with managementresources and provide details.
To enable email notifications, set up an email server, and then create condition profiles. Youcan edit and delete the created condition profiles.
Configuring the mail serverConfigure the mail server and the email address of the sender to send emails in the followingcases:■ To notify the administrator of problems that occur in monitored resources and information
related to Analyzer server operations.■ To periodically send dashboard reports to users.
Before you begin
Make sure you have the Admin permission of Ops Center Analyzer.
Procedure
1. In the Administration tab, select Notification Settings > Email Server.2. Click Edit Settings to specify information about the mail server.3. To verify that the mail server is configured correctly, click Send Test Mail.4. Confirm that the test email arrives, and then click Save Settings.
Chapter 9: Setting notificationsHitachi Ops Center Analyzer User Guide 110

Creating a condition profileTo receive emails from Ops Center Analyzer, create a condition profile and register emailaddresses.
Before you begin
You must have Admin permission of Ops Center Analyzer.
Procedure
1. In the Administration tab, select Notification Settings > Notification Conditions.2. Select the Condition Settings tab, and then click Create Notification Profile.3. Define the necessary items.4. To add email addresses to which notifications are to be sent, click Add Email Address
and then specify the email addresses. Select the check boxes for the email addressesfor which you want to enable email notifications.
Change the status or descriptions of Delivery Address in the Email Addresses tab ofthe Notification Conditions window.
5. Click OK.
Enabling or disabling email addressesEnable or disable registered email addresses to start or stop receiving email notifications.
Procedure
1. In the Administration tab, select Notification Settings > Notification Conditions.2. Select the Email Addresses tab, and then select the check boxes for the email
addresses to enable or disable the email notifications.3. To enable email notifications, click Activate. To disable email notifications, click
Suspend. Verify that the specified content is correct, and then click OK.
Creating a condition profile
Chapter 9: Setting notificationsHitachi Ops Center Analyzer User Guide 111

Chapter 10: Managing usersAdd multiple user accounts to Ops Center Analyzer and set permissions based on predefinedroles.
Ops Center Analyzer allows you to create multiple user accounts with different permissions.For security, enable user account locking and password protection.
User managementCreate a user account in Ops Center Analyzer, and then set permissions by the user role.When you configure Ops Center Common Services for Ops Center Analyzer, you canmanage users from the Ops Center portal. For more information about how to configureCommon Services for single sign-on, see the Hitachi Ops Center Analyzer Installation andConfiguration Guide.
User account types
After installation, a default system account is set up. The system account (user name:system; default password: manager) is a fully privileged, built-in administrator account usedto manage all the functions in Ops Center Analyzer. Use the system account to do all tasksand manage users in Ops Center Analyzer. You cannot delete or change the default user ID.
When registering new user accounts, set permissions for the types of tasks each user can dobased on the user role.
After adding basic user information such as username, password, email, and description, setpermissions for available applications, such as:■ User Management
■ IAA
Chapter 10: Managing usersHitachi Ops Center Analyzer User Guide 112

User permissions
There are four types of user permissions:■ Admin
Users with Administrator permissions can perform all management tasks in Ops CenterAnalyzer except those related to managing users, configuring security options, andmodifying I/O control settings.
■ Modify
Users with Modify permissions can perform all management tasks in Ops Center Analyzerexcept those related to managing users, configuring security options, setting up emailnotifications, configuring the connection settings for the Analyzer detail view server, andmodifying I/O control settings.
■ User Management
Users with User Management permissions can perform all tasks related to managingusers and configuring security options. You can use this type of permission with othertypes of permissions.
■ StorageOps
Users with StorageOps permissions can perform all tasks related to the I/O controlsettings on the Operations tab. These users can monitor and regulate the I/O rate of themonitored volumes. Only users with Admin or Modify permissions can be assignedStorageOps permissions.
User account administration
You can do the following tasks on the User Management window. Select User Management> Users and Permissions.■ Add or delete user accounts.■ Set permissions for user accounts.■ Reference or edit user account profiles.■ Change the password of a user account.■ Change the status of a locked user account.
Note: Before deleting the users from the User Management window, make sureyou delete the custom reports created by those users.
User account authentication
If you have configured Ops Center common services for using single sign-on, you canmanage Ops Center Analyzer user accounts from the Ops Center portal.
You can also manage user accounts by linking to an external authentication server, such asan Active Directory server, LDAP directory server, RADIUS server, or Kerberos server.
User management
Chapter 10: Managing usersHitachi Ops Center Analyzer User Guide 113
However, the built-in accounts (system) cannot be authenticated on an externalauthentication server. The Ops Center Analyzer user account used to connect to externalauthentication/authorization servers is managed as an Active Directory (Authorization) group.Permissions that are specified for authorized groups are also applied to users who belong tonested groups.
User permissions for Hitachi Ops Center Automator servicesIf you have Ops Center Automator in your infrastructure environment, you can assign accessprivileges to Ops Center Analyzer users.
To run action and service templates, you need to set up permission in the commoncomponent for each product. Ops Center Analyzer users need to be in the Ops CenterAutomator User Group and Service Group. Likewise, Ops Center Automator users needmodify or admin permissions in Ops Center Analyzer.
Note: While you can assign the Ops Center Analyzer account users to any usergroup in Ops Center Automator, the best practice is to assign Ops CenterAnalyzer account users to the SubmitGroup.
Configuring external authentication for usersYou can set up external authentication systems for user logins.
Before you begin■ The Ops Center Analyzer server must be linked to an external authentication server.■ The Ops Center Analyzer server must be configured to support user authentication, which
activates the Change Auth button in the GUI, and which presents authentication optionssuch as Internal for a local account, or LDAP for external authentication.
■ The Ops Center Analyzer user ID must exist on the external authentication server. It isrecommended that user ID information be acquired from the external authentication serveradministrator before creating accounts.
Procedure
1. From the Administration tab, select Users and Permissions.2. Select the Users folder, then select one or more users (using the check box) whose
authentication method you want to change, or click Add User to create a new account.
User permissions for Hitachi Ops Center Automator services
Chapter 10: Managing usersHitachi Ops Center Analyzer User Guide 114
Note:
When creating a new account, only the User ID is required for externalauthentication, and must match a user ID on the external authenticationserver. For a local (internal) account, a User ID and Password are bothrequired. When external authentication is available, new user accountscreated without a password value are automatically configured to useexternal authentication (for example, LDAP is selected for you). Fill in thedesired fields, and click OK to create the user account.
If you are completing an external authentication in a multiple-domainconfiguration or by using realms, specify a user ID that includes the domainname or realm name for the User ID. Example: user-name@domain-nameor realm-name.
When you log in, also specify your user ID in this format.
3. If you have selected existing users, click Change Auth. From the list, select theauthentication method (for example, LDAP) and click OK. The user list is redisplayed.
4. Review the Authentication column to verify the authentication method.
Result
On the next login attempt by each user, the users' login credentials (user ID and password)will be validated using the external authentication server.
Configuring external authentication for groupsSet up external authentication systems for user groups.
When linking with an external authentication server, if using together with Active Directory asan external authorization server, user permissions can be managed by using the ActiveDirectory groups (authorization groups) registered on the external authorization server. In thiscase, user permissions are specified for each group.
Before you begin■ The server must be linked to an external authentication (authorization) server.■ The Ops Center Analyzer server must be configured to support group authentication,
which activates the Groups folder in the GUI.■ The Ops Center Analyzer user group must exist on the external authentication
(authorization) server. It is recommended that domain and group information be acquiredfrom the external authentication server administrator.
Procedure
1. From the Administration tab, select Users and Permissions.2. Click the Groups folder to display the Domain List. This is a list of external
authentication servers listed by domain name, and host name or IP address. If theGroups folder is not displayed, see the prerequisites above.
Configuring external authentication for groups
Chapter 10: Managing usersHitachi Ops Center Analyzer User Guide 115

3. Select the desired Domain Name to display the Group List, which may be empty ('NoGroups' is displayed). Click Add Groups.
4. Enter the Distinguished Name for the group. Use Check DN to verify a correct DNentry. Click Ok to save your group and redisplay the Group List. Note that the GroupName is derived from the entered DN. To specify multiple groups, note that:
■ You can add multiple DNs at the same time using the "+" button.
■ If multiple DNs are listed, you can remove an entry with the "-" button.
■ Reset clears all DN entries.
5. From the Group List, click the Group Name link, then click Change Permission andset the Ops Center Analyzer permissions for the group (repeat this step for each newgroup).
6. Your groups will now be visible from the Administration tab, User Groups. You canaffiliate the groups with resource groups and roles, just like Ops Center Analyzer usergroups. If you delete external authentication groups from Users and Permissions at alater time, the groups are also removed from the User Groups list.
Result
On the next login attempt by each group member, the login credentials (user ID andpassword) will be validated using the external authentication (authorization) server.
Tip:
To delete registered authorization groups, select the check boxes of the groups tobe deleted, and then click Delete Groups.
SecuritySet the appropriate security options for user logon.
You can do the following operations in Ops Center Analyzer :■ Set a password policy
To prevent third parties from guessing passwords, define conditions such as a minimumnumber of characters required for a password and the type of characters to include in apassword.
■ Configure settings to automatically lock accounts
If repeated attempts are made to log on to a user account using an incorrect password,the user account is locked to prevent unauthorized access.
■ Set warning banners
As a security measure for logon, you can customize the message (warning banner) todisplay in the logon window.
When you are in the Administration tab, you can do these operations in the window thatopens when you select User Management > Security.
Security
Chapter 10: Managing usersHitachi Ops Center Analyzer User Guide 116

Chapter 11: Additional dashboard reportsUse additional dashboard reports to collect information for statistical analysis andperformance trends.
Ops Center Analyzer offers numerous types of reports that provide information on variousresources.
System Status Summary for Storage ResourcesThe System Status Summary for Storage Resources report displays the performance statussummary of your monitored volumes and system resources, such as SAN and storagecomponents.
System Status Summary for VolumesThe Volume pane displays an information gauge chart using three colors to depict theseverity levels of alerts. Green indicates normal status, red indicates critical status, andyellow indicates warning status. The chart also displays the number of volumes that triggeredalerts out of the total number of monitored volumes.
Aanalyze the status of monitored volumes based on the key performance metrics such asResponse Time, IO Rate, and IOPS. The bar graph displays the number of volumes thattriggered critical or warning alerts when the value of any monitored metric exceeds thedefined threshold values.
Chapter 11: Additional dashboard reportsHitachi Ops Center Analyzer User Guide 117
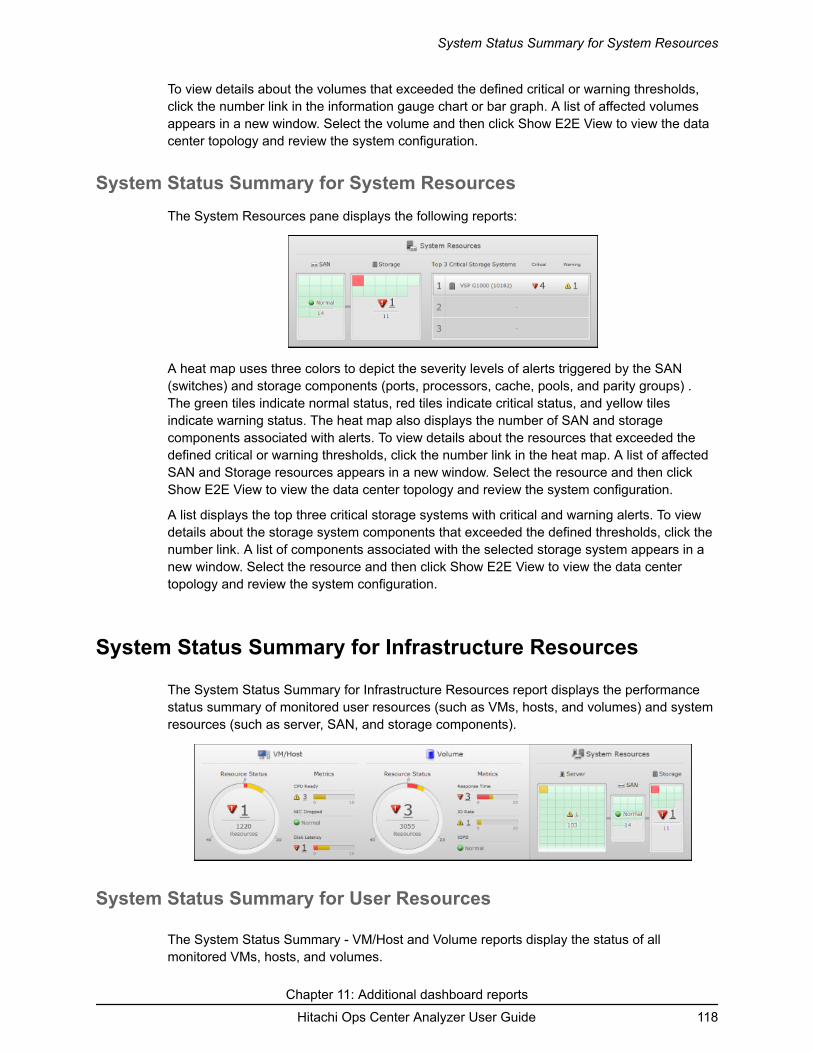
To view details about the volumes that exceeded the defined critical or warning thresholds,click the number link in the information gauge chart or bar graph. A list of affected volumesappears in a new window. Select the volume and then click Show E2E View to view the datacenter topology and review the system configuration.
System Status Summary for System ResourcesThe System Resources pane displays the following reports:
A heat map uses three colors to depict the severity levels of alerts triggered by the SAN(switches) and storage components (ports, processors, cache, pools, and parity groups) .The green tiles indicate normal status, red tiles indicate critical status, and yellow tilesindicate warning status. The heat map also displays the number of SAN and storagecomponents associated with alerts. To view details about the resources that exceeded thedefined critical or warning thresholds, click the number link in the heat map. A list of affectedSAN and Storage resources appears in a new window. Select the resource and then clickShow E2E View to view the data center topology and review the system configuration.
A list displays the top three critical storage systems with critical and warning alerts. To viewdetails about the storage system components that exceeded the defined thresholds, click thenumber link. A list of components associated with the selected storage system appears in anew window. Select the resource and then click Show E2E View to view the data centertopology and review the system configuration.
System Status Summary for Infrastructure Resources
The System Status Summary for Infrastructure Resources report displays the performancestatus summary of monitored user resources (such as VMs, hosts, and volumes) and systemresources (such as server, SAN, and storage components).
System Status Summary for User Resources
The System Status Summary - VM/Host and Volume reports display the status of allmonitored VMs, hosts, and volumes.
System Status Summary for System Resources
Chapter 11: Additional dashboard reportsHitachi Ops Center Analyzer User Guide 118
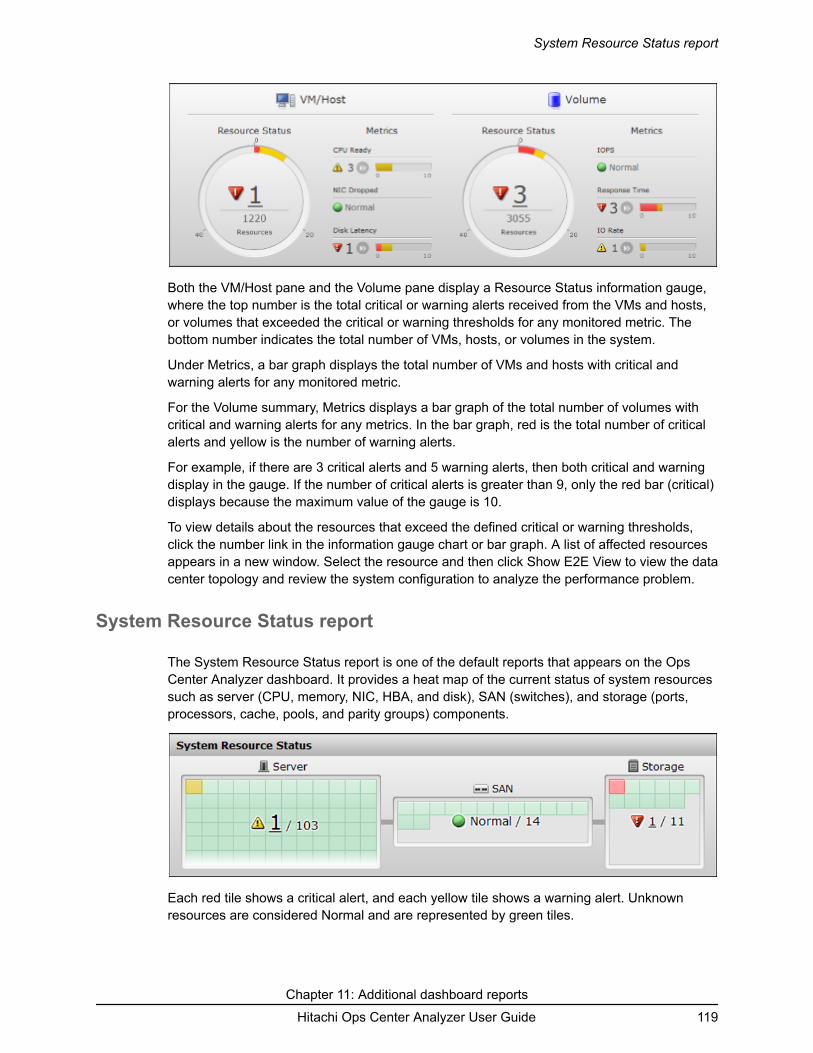
Both the VM/Host pane and the Volume pane display a Resource Status information gauge,where the top number is the total critical or warning alerts received from the VMs and hosts,or volumes that exceeded the critical or warning thresholds for any monitored metric. Thebottom number indicates the total number of VMs, hosts, or volumes in the system.
Under Metrics, a bar graph displays the total number of VMs and hosts with critical andwarning alerts for any monitored metric.
For the Volume summary, Metrics displays a bar graph of the total number of volumes withcritical and warning alerts for any metrics. In the bar graph, red is the total number of criticalalerts and yellow is the number of warning alerts.
For example, if there are 3 critical alerts and 5 warning alerts, then both critical and warningdisplay in the gauge. If the number of critical alerts is greater than 9, only the red bar (critical)displays because the maximum value of the gauge is 10.
To view details about the resources that exceed the defined critical or warning thresholds,click the number link in the information gauge chart or bar graph. A list of affected resourcesappears in a new window. Select the resource and then click Show E2E View to view the datacenter topology and review the system configuration to analyze the performance problem.
System Resource Status report
The System Resource Status report is one of the default reports that appears on the OpsCenter Analyzer dashboard. It provides a heat map of the current status of system resourcessuch as server (CPU, memory, NIC, HBA, and disk), SAN (switches), and storage (ports,processors, cache, pools, and parity groups) components.
Each red tile shows a critical alert, and each yellow tile shows a warning alert. Unknownresources are considered Normal and are represented by green tiles.
System Resource Status report
Chapter 11: Additional dashboard reportsHitachi Ops Center Analyzer User Guide 119

To view details about the resources that exceeded the defined thresholds, click the numberlink. A list of affected resources appears in a new window. Select the resource and then clickShow E2E View to view the data center topology and review the system configuration.
Consumer reportsConsumer reports displays the performance status of the consumers based on theperformance of the VMs and hosts as well as volumes assigned to them.
Consumer Summary report
The Consumer Summary report on the Ops Center Analyzer dashboard provides a summaryof the status of consumers. It displays the total number of consumers that are affected bycritical and warning alerts from VMs, hosts, or volumes assigned to consumers. This reportalso displays a table by consumer name, grade, and status for each alert.
To view details about the affected consumers, click the number link in the left pane.
The Consumers window lists the consumer name, consumer grade, overall status, and thedetailed status of each assigned user resource. To view details about the resources thatexceeded the defined thresholds, click the number link. A list of affected resources appears ina new window. Select the resource and then click Show E2E View to view the data centertopology and review the system configuration.
Consumers report
The Consumers report on the Ops Center Analyzer dashboard displays the total number ofconsumers that are affected when critical and warning thresholds are exceeded for VMs,hosts, or volumes assigned to consumers. To view details about the affected consumers, clickthe number link in the pane that shows the critical and warning alerts. A list of affectedresources appears in a new window. Select the resource and then click Show E2E View toview the data center topology and review the system configuration.
Consumer reports
Chapter 11: Additional dashboard reportsHitachi Ops Center Analyzer User Guide 120

The Consumers window lists the following:■ Grade: The grade associated with the consumer.■ Status: The most severe status for all user resources assigned to the consumer.■ Summary status: The most severe status for VMs, hosts, and volumes of the affected
consumer.
Consumers - Critical report
The Consumers - Critical report on the Ops Center Analyzer dashboard provides the totalnumber of consumers that are affected by critical thresholds exceeded by VMs, volumes, orhosts assigned to consumers.
To view details about the affected consumers, click the number link in the report. A list ofaffected resources appears in a new window. Select the resource and then click Show E2EView to view the data center topology and review the system configuration.
Consumers - Critical Each Grade report
The Consumers - Critical Each Grade report on the Ops Center Analyzer dashboarddisplays the number of platinum, gold, silver, and bronze, or others that are affected by criticalalerts in any of their managed resources, such as volumes, VMs, and hosts. This report isuseful if you want to know which consumers are affected by critical alerts based on grades.
Consumers - Critical report
Chapter 11: Additional dashboard reportsHitachi Ops Center Analyzer User Guide 121

To view more details about the affected consumers, click the number link next to the grade.The Consumer window lists the consumer name, consumer grade, overall status, anddetailed status of each assigned user resource.
To view details about the resources that exceeded the defined critical thresholds, click theE2E View on the Consumers window. You can view the data center topology, and review theconfiguration and status information.
VM reportsThe VM reports display the performance of the monitored VMs based on the keyperformance indicators such as, CPU ready, disk latency, and NIC dropped.
VM Summary report
The VM Summary report on the Ops Center Analyzer dashboard provides a summary of theperformance and status of your registered virtual machines.
If the numbers are above 0, VMs exceeded the critical and warning thresholds. Thehorizontal bar graph provides a breakdown of the overall VM status, which indicates the totalnumber of critical and warning alerts compared to the number of affected resources from thefollowing monitored metrics:■ CPU ready: The CPU metric SLO status of all your monitored VMs.■ NIC dropped: The NIC metric which measures the rate of IP packets drops sent or
received by the NIC.■ Disk latency: The read and write latency status of all your monitored VMs.
Hover over the bar graph to view the VM alert status. The status indicates how manyresources are affected by critical and warning alerts.
VM reports
Chapter 11: Additional dashboard reportsHitachi Ops Center Analyzer User Guide 122

To view details about the affected resources, click the number link in the report. A list ofaffected resources appears in a new window. Select the resource and then click Show E2EView to view the data center topology and review the system configuration.
Data is not collected from VMs on a hypervisor for the following metrics:■ CPU Ready■ NIC Dropped■ Disk Latency
As a result, data about VMs is not included in the aggregate results for the followingDashboard reports:■ System Status Summary■ VM Summary■ VM CPU Ready■ VM NIC Dropped■ VM Disk Latency
VMs report
The VMs report on the Ops Center Analyzer dashboard displays the total number of VMs withcritical and warning alerts.
To view details about the affected resources, click the number link in the report. A list ofaffected resources appears in a new window. Select the resource and then click Show E2EView to view the data center topology and review the system configuration.
VMs - Critical
The VMs - Critical report on the Ops Center Analyzer dashboard displays the number ofvirtual machines that exceeded the defined critical threshold for any monitored metric.
VMs report
Chapter 11: Additional dashboard reportsHitachi Ops Center Analyzer User Guide 123

To view details about the affected resources, click the number link in the report. A list ofaffected resources appears in a new window. Select the resource and then click Show E2EView to view the data center topology and review the system configuration.
VM CPU Ready report
The VM CPU Ready report on the Ops Center Analyzer dashboard displays the CPU metricSLO status of all your monitored virtual machines. The CPU metric refers to the ratio of timethat the virtual machine was ready but could not be scheduled to run on a physical CPU. Thenumbers indicate the total critical and warning alerts received based on the relevantthresholds set for the CPU metric.
All critical and warning alerts directly affect the SLO, so start analyzing the problem quickly.
To view details about the affected resources, click the number link in the report. A list ofaffected resources appears in a new window. Select the resource and then click Show E2EView to view the data center topology and review the system configuration.
VM NIC Dropped report
The VM NIC Dropped report on the Ops Center Analyzer dashboard displays the IP packetssent or received IP packets that were dropped for all your monitored virtual machines. Thenumbers indicate the total critical and warning alerts received compared to the relevantthresholds set for the NIC metric. The metric refers to sent or received packets that weredropped of the virtual NIC.
VM CPU Ready report
Chapter 11: Additional dashboard reportsHitachi Ops Center Analyzer User Guide 124

All critical or warning alerts directly affect the SLO, so start analyzing the problem quickly.
To view details about the affected resources, click the number link in the report. A list ofaffected resources appears in a new window. Select the resource and then click Show E2EView to view the data center topology and review the system configuration.
VM Disk Latency report
The VM Disk Latency report on the Ops Center Analyzer dashboard displays the disk readand write latency status of all your monitored virtual machines. The numbers indicate the totalcritical and warning alerts received compared to the relevant thresholds set for the disklatency metric. The disk latency metric refers to the read and write latency to and from thevirtual machine disk.
All critical or warning alerts directly affect the SLO, so start analyzing the problem quickly.
To view details about the affected resources, click the number link in the report. A list ofaffected resources appears in a new window. Select the resource and then click Show E2EView to view the data center topology and review the system configuration.
Total VMs report
The Total VMs report on the Ops Center Analyzer dashboard displays the total number ofmonitored virtual machines.
VM Disk Latency report
Chapter 11: Additional dashboard reportsHitachi Ops Center Analyzer User Guide 125

If you plan to register VMware vCenter server, then all VMs connected to this server aremonitored.
Volume reportsThe volume reports displays the performance of your storage system volumes based on thekey performance indicators such as IOPS, response times, and I/O rate.
Volume Summary report
The Volume Summary report on the Ops Center Analyzer dashboard provides an overviewof the performance of your storage system volumes. It shows the total number of volumeswith critical and warning alerts and also a summary of alerts received for the following threemonitored metrics:■ IOPS: I/O operations per second of the monitored volume.■ Response time: Average response time of the volume based on the I/O count.■ IO rate: I/O operations transfer rate.
Hover over the bar graph to view the alerts type and number of volumes with critical andwarning alerts for these three metrics.
To view details about the affected resources, click the number link in the report. A list ofaffected resources appears in a new window. Select the resource and then click Show E2EView to view the data center topology and review the system configuration.
Volumes report
Volume reports
Chapter 11: Additional dashboard reportsHitachi Ops Center Analyzer User Guide 126

The Volumes report on the Ops Center Analyzer dashboard displays the total number ofvolumes with critical and warning alerts.
To view details about the affected resources, click the number link in the report. A list ofaffected resources appears in a new window. Select the resource and then click Show E2EView to view the data center topology and review the system configuration.
Volumes - Critical report
The Volumes - Critical report on the Ops Center Analyzer dashboard displays the totalnumber of volumes that exceeded the critical threshold for any metric.
To view details about the affected resources, click the number link in the report. A list ofaffected resources appears in a new window. Select the resource and then click Show E2EView to view the data center topology and review the system configuration.
Volume IO Rate report
The Volume IO rate report on the Ops Center Analyzer dashboard displays the total numberof critical and warning alerts received from volumes that exceeded the critical and warningthresholds for the I/O rate metric.
Volumes - Critical report
Chapter 11: Additional dashboard reportsHitachi Ops Center Analyzer User Guide 127

To view details about the affected resources, click the number link in the report. A list ofaffected resources appears in a new window. Select the resource and then click Show E2EView to view the data center topology and review the system configuration.
Volume IOPS report
The Volume IOPS report on the Ops Center Analyzer dashboard displays the total number ofcritical and warning alerts received from volumes that exceeded the critical and warningthresholds for the IOPS metric.
To view details about the affected resources, click the number link in the report. A list ofaffected resources appears in a new window. Select the resource and then click Show E2EView to view the data center topology and review the system configuration.
Volume Response Time report
The Volume Response Time report on the Ops Center Analyzer dashboard displays theresponse time status for all monitored volumes. The numbers indicate the total number ofcritical and warning alerts received from volumes that exceeded the critical and warningthresholds for the response time metric.
Volume IOPS report
Chapter 11: Additional dashboard reportsHitachi Ops Center Analyzer User Guide 128

To view details about the affected resources, click the number link in the report. A list ofaffected resources appears in a new window. Select the resource and then click Show E2EView to view the data center topology and review the system configuration.
Total Volumes report
The Total Volumes report on the Ops Center Analyzer dashboard displays the total numberof volumes.
Host reportsThe host reports display the total number of hosts monitored and the status of the monitoredhosts.
Hosts report
The Hosts report on the Ops Center Analyzer dashboard displays the total number of hoststhat have critical and warning alerts.
To view details about the affected resources, click the number link in the report. A list ofaffected resources appears in a new window. Select the resource and then click Show E2EView to view the data center topology and review the system configuration.
Hosts - Critical report
Total Volumes report
Chapter 11: Additional dashboard reportsHitachi Ops Center Analyzer User Guide 129

The Hosts - Critical report on the Ops Center Analyzer dashboard displays the number ofhosts that exceeded the defined critical threshold for any monitored metric. The host ismonitored with the thresholds defined with Windows-based profiles in the user resourcethresholds.
To view details about the affected resources, click the number link in the report. A list ofaffected resources appears in a new window. Select the resource and then click Show E2EViewto view the data center topology and review the system configuration.
Total Hosts report
The Total Hosts report on the Ops Center Analyzer dashboard displays the total number ofhosts monitored in the environment.
User resource reportsThe user resource reports display the total number of monitored user resources such asvolumes, VMs, and hosts.
Total User Resources report
Total Hosts report
Chapter 11: Additional dashboard reportsHitachi Ops Center Analyzer User Guide 130

The Total User Resources report on the Ops Center Analyzer dashboard displays the totalnumber of monitored user resources. It also shows a breakdown of the total number for eachresource type:■ Volumes■ VMs■ Hosts
Hypervisor reportsThe hypervisor reports display the total number of monitored hypervisors and the status ofthe monitored hypervisors.
Hypervisors report
The Hypervisors report on the Ops Center Analyzer dashboard displays the total number ofmonitored hypervisors that have critical and warning alerts.
To view details about the affected hypervisors, click the number link in the critical and warningalerts pane to display the following on the Hypervisors window:■ Hypervisor Name: The name of the hypervisor.■ IP Address: The IP address of the hypervisor.■ Status: The most severe status for hypervisor.■ Cluster Name: The cluster name of the hypervisor.■ Description: A short description of the hypervisor.
Hypervisor reports
Chapter 11: Additional dashboard reportsHitachi Ops Center Analyzer User Guide 131

To view details about the affected resources, click the number link in the report. A list ofaffected resources appears in a new window. Select the resource and then click Show E2EView to view the data center topology and review the system configuration.
Total Hypervisors report
The Total Hypervisors report on the Ops Center Analyzer dashboard displays the totalnumber of monitored hypervisors.
Switch reportsSwitch reports display the total number of monitored switches and status of monitoredswitches.
Switches report
The Switches report on the Ops Center Analyzer dashboard displays the total number of FCswitches that have critical and warning alerts.
To view details about the affected switches, click the number link in the critical and warningalerts pane to display the following on the Switches window:■ Switch Name: The name of the switch.■ IP Address: The IP address of the switch.■ Status: The most severe status for the switch.■ Description: A short description of the switch.
Total Hypervisors report
Chapter 11: Additional dashboard reportsHitachi Ops Center Analyzer User Guide 132

To view details about the affected resources, click the number link in the report. A list ofaffected resources appears in a new window. Select the resource and then click Show E2EView to view the data center topology and review the system configuration.
Total Switches report
The Total Switches report on the Ops Center Analyzer dashboard displays the total numberof monitored FC switches.
Storage system reports
Storage Systems report
The Storage Systems report on the Ops Center Analyzer dashboard displays the totalnumber of storage systems that have critical and warning alerts.
To view details about the affected storage systems, click the number link in the critical andwarning alerts pane to display the following on the Storage Systems window:■ Storage System Name: The name of the storage system.■ IP Address: The IP address of the storage system.■ Status: The most severe status for the storage system resource.■ Description: A short description of the storage system.
To view details about the affected resources, click the number link in the report. A list ofaffected resources appears in a new window. Select the resource and then click Show E2EView to view the data center topology and review the system configuration.
Total Switches report
Chapter 11: Additional dashboard reportsHitachi Ops Center Analyzer User Guide 133

Total Storage Systems report
The Total Storage Systems report on the Ops Center Analyzer dashboard displays the totalnumber of monitored storage systems.
System resource reports
System Resource Summary report
The System Resource Summary report on the Ops Center Analyzer dashboard provides asummary of the performance and status of your registered system resources such ashypervisors, switches, and storage systems. The report provides the total number of criticaland warning alerts, and also includes these numbers in a bar graph.
If the numbers are higher than 0, the system resources exceeded the critical and warningthresholds. The bar graph provides a summary of the total number of resources with criticaland warning alerts, by each resource type:■ Server■ Network■ Storage
Hover over the bar graph to view the system resource alert status. The status indicates howmany system resources are affected by critical or warning alerts. To view details about theresources that exceeded the defined critical and warning thresholds, click the number link.
The System Resource window lists the resource name, IP address, status, device type, anddescription of each assigned system resource. On the System Resource window, click E2EView to view the data center topology and review the configuration and status information.
Total Storage Systems report
Chapter 11: Additional dashboard reportsHitachi Ops Center Analyzer User Guide 134

System Resources - Critical report
The System Resources - Critical report on the Ops Center Analyzer dashboard displays thenumber of system resources that exceeded the defined critical threshold for any monitoredmetric.
To view details about the affected resources, click the number link in the report. A list ofaffected resources appears in a new window. Select the resource and then click Show E2EView to view the data center topology and review the system configuration.
System Resources report
The System Resources report displays the total number of monitored system resources,such as hypervisors, switches, and storage systems, that have critical and warning alerts.
To view details about the affected system resources, click the number link in the pane thatshows the critical and warning alerts to open the System Resources window with thefollowing:■ Resource Name: The name of the system resource.■ IP Address: The IP address of the system resource.■ Status: The most severe status of the system resource.■ Description: A short description of the system resource.
To view details about the affected resources, click the number link in the report. A list ofaffected resources appears in a new window. Select the resource and then click Show E2EView to view the data center topology and review the system configuration.
Total System Resources report
System Resources - Critical report
Chapter 11: Additional dashboard reportsHitachi Ops Center Analyzer User Guide 135

The Total System Resources report on the Ops Center Analyzer dashboard displays thetotal number of monitored system resources. It also shows a breakdown of the total numberof each resource type:■ Hypervisors■ Storage systems■ Switches
Event reports
System Event Status report
The System Event Status report on the Ops Center Analyzer dashboard displays thenumber of critical, warning, and information events for Management or Event Action eventsthat occurred in the past 24 hours. An example of a Management event is a service startevent. An Event Action event is a return code notification of the executed action. Forexample, when launching an event action the command fails, a failure notification is sent.These types of events are generated when the system settings need to be verified orconfigured.
To view more details for each event, see the Events > System Events tab.
Resource Event Status report
Event reports
Chapter 11: Additional dashboard reportsHitachi Ops Center Analyzer User Guide 136

The Resource Event Status report on the Ops Center Analyzer dashboard displays thenumber of critical, warning, and informational events for resource events that were generatedin the past 24 hours. The events are generated when a device or component such as serversor network devices has a problem or does not perform optimally.
To view more details for each error, see the Events > Resource Events tab.
Capacity reportsOps Center Analyzer enables consolidated storage capacity reporting by consumers, drivetypes, and pools across all storage systems. By analyzing the storage capacity reports yougain insight into your storage capacity, identify unused capacity, and track storage usage.Monitor the capacity reports to forecast the capacity requirements for your data center andplan new purchases of storage systems, if necessary.
The capacity reports display the latest capacity information in the past 24 hours. You can alsoview the total capacity of multiple resources and all related resources in the past 24 hours.For example, the report Recent Capacity by Consumer aggregates not only volumes that arecurrently associated with a consumer, but also volumes that are removed from the consumerwithin the past 24 hours.
Capacity of VMware Datastores report
The Capacity of VMware Datastores report displays a list of all monitored VMwaredatastores along with capacity and usage.
Capacity of VMware Datastores with Usage Exceeding 80% report
Capacity reports
Chapter 11: Additional dashboard reportsHitachi Ops Center Analyzer User Guide 137

The Capacity of VMware Datastores with Usage Exceeding 80% report displays a list ofdatastores with high usage so that you can monitor the remaining capacity and allocateadditional storage.
Capacity by Storage System reportThe Capacity by Storage System report provides the breakdown of the overall storagecapacity indicating capacity from physical parity groups and DP pools. Using this report youcan monitor the capacity consumption by storage systems and optimize the use of storageresources. You can track the capacity savings achieved by using advanced data reductiontechnologies such as deduplication and compression, and FMD (Flash Module Drive)enabled for accelerated compression.
The report contains the following metrics:■ Model: The storage system type.■ Serial No: The serial number of the storage system.■ Thin Total: The sum of the capacity of DP pools in a storage system.■ Thin Used: The sum of the used capacity of DP pools in a storage system.■ Thin Free: The sum of the free capacity of DP pools in a storage system.■ Subscribed Total: The sum of the capacity of DP volumes in a storage system.■ FMC Capacity Saving: The total capacity savings of DP pools achieved by using FMD that
supports accelerated compression in a pool.■ DKC Comp/Dedupe Capacity Saving: The total capacity savings of DP pools achieved by
using the DKC capacity saving feature in the storage system.■ Total Parity Group Free: The sum of the free capacity of parity groups in a storage system.
Capacity by Storage System report
Chapter 11: Additional dashboard reportsHitachi Ops Center Analyzer User Guide 138

Note:
The following attributes are not displayed for concatenated parity groups. Fromthe Details windows, check the attributes of the individual parity groups that makeup a concatenated parity group.■ Capacity■ Drive Status■ Number of used spare drives■ SSD Used Endurance Indicator■ FMD Battery Life Indicator
Click the link to the storage system serial number to open theAnalyzer detail view UI in aseparate browser. You can analyze the storage system performance reports on the Reportspane.
Capacity by Storage System report (HUS 100 Storage Systems)The Capacity by Storage System report for Hitachi Unified Storage 100 (HUS 100) seriesprovides the breakdown of storage capacity indicating capacity from physical parity groupsand DP pools. Use this report to monitor the storage capacity consumption and optimize theuse of storage resources.
The report displays the following metrics:■ Model: The storage system type.■ Serial No: The serial number of the storage system■ Thin Total: The sum of the capacity of DP pools in a storage system.■ Thin Used: The sum of the used capacity of DP pools in a storage system.■ Thin Free: The sum of the free capacity of DP pools in a storage system.■ Subscribed Total: The sum of the capacity of DP volumes in a storage system.■ Total Parity Group Free: The sum of the free capacity of parity groups in a storage system.
Click the link to the storage system serial number to open the Analyzer detail view UI in aseparate browser. You can analyze the storage system performance reports on the Reportspane.
Saving Ratio by Storage System reportThe Saving Ratio by Storage System report provides a breakdown of the capacity savedthrough data reduction functions such as controller-based compression, deduplication, andaccelerated compression.
Capacity by Storage System report (HUS 100 Storage Systems)
Chapter 11: Additional dashboard reportsHitachi Ops Center Analyzer User Guide 139

Using this report, you can monitor the amount and ratio of capacity saving in a pool or perstorage system.
This report applies to VSP 5000 series, VSP E series, VSP G1x00, VSP Gx00 models, VSPF series, and VSP N series .
The report contains the following metrics:■ Model: The storage system type.■ Serial No: The serial number of the storage system.■ Saving Capacity: The amount of saved logical capacity against the used physical capacity.■ Saving Ratio: The ratio of used logical capacity to used physical capacity.
If any of the data reduction functions are enabled, the pool capacity categories (total capacity,used capacity, and free capacity) displayed in the capacity reports indicate the values aftercapacity saving. If the pool contains a parity group for which accelerated compression isenabled, then the values before compression are displayed.
To check the capacity of a pool containing an FMC drive, you typically also need to check thephysical capacity. However, if the pool is set up to automatically add pool volumes in thesestorage systems, you only need to check the physical capacity.
The supported storage systems also allow the addition of pool volumes automatically(according to the compression ratio of the parity group) when Autoexpansion is enabled.
Total Efficiency by Storage System reportThe Total Efficiency by Storage System report provides a summary of the capacity savedwithout system data through data reduction functions such as controller-based compression,deduplication, accelerated compression, snapshot efficiency, and provisioning efficiency.
Using this report, you can monitor the amount and ratio of capacity saving per storagesystem.
This report applies to VSP 5000 series, VSP E series,VSP Gx00 models, VSP Fx00 models,and VSP N series .
The report contains the following metrics:■ Model: The storage system type.■ Serial No: The serial number of the storage system.■ Total Efficiency Ratio: The ratio of the total saving effect achieved by accelerated
compression, capacity saving (compression and deduplication), snapshot, and DynamicProvisioning of storage systems, plus the start and end times for the calculation.
Note: Under certain circumstances, the Total Efficiency Ratio can display as99999 (for example: before data has been written to newly-created pool orvirtual volume).
■ Data Reduction Ratio: The data reduction ratio before and after accelerated compressionand capacity saving (compression and deduplication).
■ Software Saving Ratio: The capacity reduction ratio before and after capacity saving.
Total Efficiency by Storage System report
Chapter 11: Additional dashboard reportsHitachi Ops Center Analyzer User Guide 140

■ Software Compression Ratio: The capacity compression ratio before and after capacitysaving.
■ Software Deduplication Ratio: The capacity deduplication ratio before and after capacitysaving.
■ Software Pattern Matching Ratio: The capacity reduction ratio before and after patternmatching of capacity saving.
■ FMD Saving Ratio: The capacity reduction ratio before and after accelerated compression.■ FMD Compression Ratio: The capacity compression ratio before and after accelerated
compression.■ FMD Pattern Matching Ratio: The capacity reduction ratio before and after pattern
matching of accelerated compression.■ Snapshot Efficiency Ratio: The efficiency ratio achieved by snapshot.■ Provisioning Efficiency (%): The efficiency ratio achieved by Dynamic Provisioning.■ Calculation Time: The start date/time and the end date/time for the calculation.
Capacity of Drive Types by Storage System report (HDP)The Capacity of Drive Types by Storage System report shows the capacity usage of drivetypes for VSP 5000 series, VSP E series, VSP F series, VSP G series, VSP N series, VSP,and HUS VM series storage systems.
Use this report to monitor the enterprise-wide Hitachi Dynamic Provisioning (HDP) total poolcapacity, used capacity, and free capacity details.
The report contains the following metrics:■ HDP Total: The sum of the capacity of HDP pools in the storage system.■ HDP Used: The sum of the used capacity of HDP pools the storage system.■ HDP Free: The sum of the free capacity of HDP pools in the storage system.■ Parity Group Free: The sum of the free capacity of parity groups in the storage system .■ Flash HDP Total: The sum of the capacity of HDP pools with flash drive type in the storage
system.■ Flash HDP Used: The sum of the used capacity of HDP pools with flash drive type in the
storage system.■ Flash HDP Free: The sum of the free capacity of HDP pools with flash drive type in the
storage system.■ Flash Parity Group Free: The sum of the free space of parity groups with flash drive type
in the storage system.
Capacity of Drive Types by Storage System report (HDP)
Chapter 11: Additional dashboard reportsHitachi Ops Center Analyzer User Guide 141

■ HDD HDP Total: The sum of the capacity of HDP pools with HDD drive type in the storagesystem.
■ HDD HDP Used: The sum of the used capacity of HDP pools with HDD drive type in thestorage system.
■ HDD HDP Free: The sum of the free capacity of HDP pools with HDD drive type in thestorage system.
■ HDD Parity Group Free: The sum of the free space of parity groups with HDD drive type inthe storage system.
■ SCM HDP Total: The sum of the capacity of HDP pools with SCM drive type in the storagesystem.
■ SCM HDP Used: The sum of the used capacity of HDP pools with SCM drive type in thestorage system.
■ SCM HDP Free: The sum of the free capacity of HDP pools with SCM drive type in thestorage system.
■ SCM HDP Parity Group Free: The sum of the free capacity of parity groups with SCMdrive type in the storage system.
■ FMC HDP Total: The sum of the capacity of HDP pools with FMC drive type in the storagesystem.
■ FMC HDP Used: The sum of the used capacity of HDP pools with FMC drive type in thestorage system.
■ FMC HDP Free: The sum of the free capacity of HDP pools with FMC drive type in thestorage system.
■ FMC HDP Parity Group Free: The sum of the free capacity of parity groups with FMCdrive type in the storage system.
■ FMD HDP Total: The sum of the capacity of HDP pools with FMD drive type in the storagesystem.
■ FMD HDP Used: The sum of the used capacity of HDP pools with FMD drive type in thestorage system.
■ FMD HDP Free: The sum of the free capacity of HDP pools with FMD drive type in thestorage system.
■ FMD Parity Group Free: The sum of the free space of parity groups with FMD drive type inthe storage system.
■ SSD HDP Total: The sum of the capacity of HDP pools with SSD drive type in the storagesystem.
■ SSD HDP Used: The sum of the used capacity of HDP pools with SSD drive type in thestorage system.
■ SSD HDP Free: The sum of the free capacity of HDP pools with SSD drive type in thestorage system.
■ SSD Parity Group Free: The sum of the free space of parity groups with SSD drive type inthe storage system.
■ SAS HDP Total: The sum of the capacity of HDP pools with SAS drive type in the storagesystem.
Capacity of Drive Types by Storage System report (HDP)
Chapter 11: Additional dashboard reportsHitachi Ops Center Analyzer User Guide 142

■ SAS HDP Used: The sum of the used capacity of HDP pools with SAS drive type in thestorage system.
■ SAS HDP Free: The sum of the free capacity of HDP pools with SAS drive type in thestorage system.
■ SAS Parity Group Free: The sum of the free space of parity groups with SAS drive type inthe storage system.
■ SATA HDP Total: The sum of the capacity of HDP pools with SATA drive type in thestorage system.
■ SATA HDP Used: The sum of the used capacity of HDP pools with SATA drive type in thestorage system.
■ SATA HDP Free: The sum of the free capacity of HDP pools with SATA drive type in thestorage system.
■ SATA Parity Group Free: The sum of the free space of parity groups with SATA drive typein the storage system.
Click the link to the storage system serial number to open the Analyzer detail view UI in aseparate browser. You can analyze the storage system performance reports on the Reportspane.
Capacity of Drive Types by Storage System report (HDT)The Capacity of Drive Types by Storage System report shows the capacity usage of drivetypes for VSP 5000 series, VSP E series, VSP F series, VSP G series, VSP N series, VSP,and HUS VM series storage systems.
This report provides a breakdown of the enterprise-wide Hitachi Dynamic Tiering (HDT) totalpool capacity, used capacity, and free capacity details. If an HDT pool has tiers from multipledrive types, then all the capacity in this pool is accounted for under the "Mixed" drive type.
The report contains the following metrics for the supported drive types:■ HDT Total: The sum of the capacity of HDT tiers in a storage system.■ HDT Used: The sum of the used capacity of HDT tiers in a storage system.■ HDT Free: The sum of the free capacity of HDT tiers in a storage system.■ Flash HDT Total: The sum of the capacity of HDT tiers with flash drive type in a storage
system.■ Flash HDT Used: The sum of the used capacity of HDT tiers with flash drive type in a
storage system.■ Flash HDT Free: The sum of the free capacity of HDT tiers with flash drive type in a
storage system.■ HDD HDT Total: The sum of the capacity of HDT tiers with HDD drive type in a storage
system.
Capacity of Drive Types by Storage System report (HDT)
Chapter 11: Additional dashboard reportsHitachi Ops Center Analyzer User Guide 143

■ HDD HDT Used: The sum of the used capacity of HDT tiers with HDD drive type in astorage system.
■ HDD HDT Free: The sum of the free capacity of HDT tiers with HDD drive type in astorage system.
■ FMC HDT Total: The sum of the capacity of HDT tiers with FMC drive type in a storagesystem.
■ FMC HDT Used: The sum of the used capacity of HDT tiers with FMC drive type in astorage system.
■ FMC HDT Free: The sum of the free capacity of HDT tiers with FMC drive type in astorage system.
■ SCM HDT Total: The sum of the capacity of HDT tiers with SCM drive type in a storagesystem.
■ SCM HDT Used: The sum of the used capacity of HDT tiers with SCM drive type in astorage system.
■ SCM HDT Free: The sum of the free capacity of HDT tiers with SCM drive type in astorage system.
■ FMD HDT Total: The sum of the capacity of HDT tiers with FMD drive type in a storagesystem.
■ FMD HDT Used: The sum of the used capacity of HDT tiers with FMD drive type in astorage system.
■ FMD HDT Free: The sum of the free capacity of HDT tiers with FMD drive type in astorage system.
■ SSD HDT Total: The sum of the capacity of HDT tiers with SSD drive type in a storagesystem.
■ SSD HDT Used: The sum of the used capacity of HDT tiers with SSD drive type in astorage system.
■ SSD HDT Free: The sum of the free capacity of HDT tiers with SSD drive type in astorage system.
■ SAS HDT Total: The sum of the capacity of HDT tiers with SAS drive type in a storagesystem.
■ SAS HDT Used: The sum of the used capacity of HDT tiers with SAS drive type in astorage system.
■ SAS HDT Free: The sum of the free capacity of HDT tiers with SAS drive type in a storagesystem.
■ SATA HDT Total: The sum of the capacity of HDT tiers with SATA drive type in a storagesystem.
■ SATA HDT Used: The sum of the used capacity of HDT tiers with SATA drive type in astorage system.
■ SATA HDT Free: The sum of the free capacity of HDT tiers with SATA drive type in astorage system.
Capacity of Drive Types by Storage System report (HDT)
Chapter 11: Additional dashboard reportsHitachi Ops Center Analyzer User Guide 144

■ External HDT Total: The sum of the capacity of HDT tiers with External drive type in astorage system. External storage consists of drives or other storage devices that arephysically located in an externally connected storage system.
■ External HDT Used: The sum of the used capacity of HDT tiers with External drive type ina storage system. External storage consists of drives or other storage devices that arephysically located in an externally connected storage system.
■ External HDT Free: The sum of the free capacity of HDT tiers with External drive type in astorage system.
■ Mixed HDT Total: The sum of the capacity of HDT tiers with Mixed drive type in a storagesystem.
■ Mixed HDT Used: The sum of the used capacity of HDT tiers with Mixed drive type in astorage system.
■ Mixed HDT Free: The sum of the free capacity of HDT tiers with Mixed drive type in astorage system.
Click the link to the storage system serial number to open the Analyzer detail view UI in aseparate browser. You can analyze the storage system performance reports on the Reportspane.
Capacity of Drive Types by Storage System report (HUS 100 StorageSystems)
The Capacity of Drive Types by Storage System report shows the capacity usage of drivetypes for HUS 100 series.
Use this report to monitor the Hitachi Dynamic Provisioning (HDP) total pool capacity, usedcapacity, and free capacity details for HUS100 storage systems.
The report contains the following metrics:■ Thin Total: The sum of the capacity of HDP pools with the target drive type in the storage
system.■ Thin Used: The sum of the used capacity of HDP pools with the target drive type in the
storage system.■ Thin Free: The sum of the free capacity of HDP pools with the target drive type in the
storage system.■ Parity Group Free: The sum of the free space of parity groups with the target drive type in
the storage system.■ Flash Thin Total: The sum of the capacity of HDP pools with Flash drive type in the
storage system.■ Flash Thin Used: The sum of the used capacity of HDP pools with Flash drive type in the
storage system.
Capacity of Drive Types by Storage System report (HUS 100 Storage Systems)
Chapter 11: Additional dashboard reportsHitachi Ops Center Analyzer User Guide 145
■ Flash Thin Free: The sum of the free capacity of HDP pools with Flash drive type in thestorage system.
■ Flash Parity Group Free: The sum of the free space of parity groups with Flash drive typein the storage system.
■ HDD Thin Total: The sum of the capacity of HDP pools with HDD drive type in the storagesystem.
■ HDD Thin Used: The sum of the used capacity of HDP pools with HDD drive type in thestorage system.
■ HDD Thin Free: The sum of the free capacity of HDP pools with HDD drive type in thestorage system.
■ HDD Parity Group Free: The sum of the free space of parity groups with HDD drive type inthe storage system.
■ FMD Thin Total: The sum of the capacity of HDP pools with FMD drive type in the storagesystem.
■ FMD Thin Used: The sum of the used capacity of HDP pools with FMD drive type in thestorage system.
■ FMD Thin Free: The sum of the free capacity of HDP pools with FMD drive type in thestorage system.
■ FMD Parity Group Free: The sum of the free space of parity groups with FMD drive type inthe storage system.
■ SSD Thin Total: The sum of the capacity of HDP pools with SSD drive type in the storagesystem.
■ SSD Thin Used: The sum of the used capacity of HDP pools with SSD drive type in thestorage system.
■ SSD Thin Free: The sum of the free capacity of HDP pools with SSD drive type in thestorage system.
■ SSD Parity Group Free: The sum of the free space of parity groups with SSD drive type inthe storage system.
■ SAS Thin Total: The sum of the capacity of HDP pools with SAS drive type in the storagesystem.
■ SAS Thin Used: The sum of the used capacity of HDP pools with SAS drive type in thestorage system.
■ SAS Thin Free: The sum of the free capacity of HDP pools with SAS drive type in thestorage system.
■ SAS Parity Group Free: The sum of the free space of parity groups with SAS drive type inthe storage system.
Click the link to the storage system serial number to open the Analyzer detail view UI in aseparate browser. You can analyze the storage system performance reports on the Reportspane.
Capacity of Drive Types by Storage System report (HUS 100 Storage Systems)
Chapter 11: Additional dashboard reportsHitachi Ops Center Analyzer User Guide 146

Capacity by Pool reportThe Capacity by Pool report provides the breakdown of the total physical capacity, capacitysavings, subscribed capacity and consumed capacity of a pool. Use this report to monitor theconsumption and subscription rate of pools across all storage systems within your enterpriseand determine if you are at risk of oversubscribing pools. You can track the capacity savingsachieved by using data reduction technologies such as controller-based compression,deduplication, and accelerated compression.
This report applies to VSP 5000 series, VSP E series, VSP Gx00 models, VSP Fx00 models,and VSP N series:
The report contains the following metrics:■ Model: The storage system type to which the pool belongs.■ Serial No: The serial number of the storage system to which the pool belongs.■ Pool: The pool ID.■ Pool Type: The type of the pool.■ Logical Capacity: The logical capacity of the pool.■ Logical Used Capacity: The logical capacity used in a pool.■ % of Used Logical Capacity: The percentage of used logical capacity in a pool.■ Physical Capacity: The physical capacity of the pool.■ Physical Used Capacity: The physical capacity used in a pool.■ Subscribed Capacity: The sum of the capacity of DP volumes in a pool.■ Subscription %: The subscription percentage of a pool.■ Threshold Rate: The threshold set for capacity use in a storage system.■ Demand: The sum of the free capacity of allocated DP volumes in a pool.■ Auto Expansion: The capability of expanding the pool automatically.■ Data Volumes Used Capacity: Total used capacity of data volumes (DP-VOLs).■ Data Reduction Capacity: The storage capacity savings with the controller-based capacity
saving and accelerated compression functions in a pool.■ Data Reduction Ratio: The storage capacity savings ratio with the controller-based
capacity saving and accelerated compression functions in a pool.■ Deduplication Capacity: The saved capacity with the capacity saving (deduplication)
function in a pool.■ Deduplication Ratio: The saving ratio with the capacity saving (deduplication) function in a
pool.■ Compression Capacity: The saved capacity with the capacity saving (compression)
function in a pool.
Capacity by Pool report
Chapter 11: Additional dashboard reportsHitachi Ops Center Analyzer User Guide 147

■ Compression Ratio: The saving ratio with the capacity saving (compression) function in apool.
■ Dedupe/Comp Capacity: The saved capacity with the capacity saving function.■ Dedupe/Comp Ratio: The saving capacity ratio with the capacity saving function.■ Pattern Matching: The reclaimed capacity with the capacity saving function.■ System Data: The system data capacity (metadata capacity plus garbage data capacity)
saved with the capacity saving function.■ Preprocessed Data: The preprocessed data capacity with the capacity saving function.■ FMC Logical total: The total capacity with the accelerated compression function.■ FMC Logical Used: The total used capacity with the accelerated compression function.■ FMC Physical Total: The total physical capacity with the accelerated compression
function.■ FMC Physical Used: The used physical capacity with the accelerated compression
function.■ FMC Compression Capacity: The compressed capacity with the accelerated compression
function.■ FMC Compression Ratio: The saved capacity ratio with the accelerated compression
function.■ FMC Pattern Matching: The reclaimed capacity with the accelerated compression
function.
Click the links to the storage system serial number or pool ID to open the Analyzer detail viewUI in a separate browser. You can analyze the storage system performance reports and thepool performance reports on the Reports pane.
Capacity by Pool report (HUS 100 Storage Systems)The Capacity by Pool report for HUS 100 Storage Systems provides the breakdown of thetotal physical capacity, subscribed capacity, and consumed capacity of a pool. Use this reportto monitor the consumption, and subscription rate of pools that belong to the HUS 100 seriesand determine if you are at risk of oversubscribing pools.
The report displays the following metrics:■ Model: The storage system type to which the pool belongs.■ Serial No: The serial number of the storage system to which the pool belongs.■ Pool: The pool ID.■ Drive Type: The type and speed of the physical drives.■ Capacity: The capacity of the pool.
Capacity by Pool report (HUS 100 Storage Systems)
Chapter 11: Additional dashboard reportsHitachi Ops Center Analyzer User Guide 148

■ Used Capacity: The capacity used in a pool.■ Capacity Used %: The percentage of capacity used in a pool.■ Subscribed Capacity: The sum of the capacity of DP volumes in a pool.■ Demand: The sum of the free capacity of allocated DP volumes in a pool.
Click the links to storage system serial number or pool ID to open the Analyzer detail view UIin a separate browser. You can analyze the storage system performance reports and the poolperformance reports on the Reports pane.
Total Efficiency by Pool reportThe Total Efficiency by Pool report provides a summary of the capacity saved through datareduction features such as controller-based compression, deduplication, and acceleratedcompression at the pool level.
The report contains the following metrics:■ Model: The storage system type to which the pool belongs.■ Serial No: The serial number of the storage system.■ Pool: The pool ID.■ Pool Type: The type of pool.■ Total Efficiency Ratio: The ratio of the total saving effect achieved by accelerated
compression, capacity saving (compression and deduplication), snapshot, and DynamicProvisioning that belong to storage systems, followed by the start date and time and theend date and time for the calculation.
Note: Under certain circumstances, the Total Efficiency Ratio can display as99999 (for example: before data has been written to newly-created pool orvirtual volume).
■ Data Reduction Ratio: The data reduction ratio before and after accelerated compressionand capacity saving (compression and deduplication).
■ Software Saving Ratio: The capacity reduction ratio before and after capacity saving.■ Software Compression Ratio: The capacity compression ratio before and after capacity
saving.■ Software Deduplication Ratio: The capacity deduplication ratio before and after capacity
saving.■ Software Pattern Matching Ratio: The capacity reduction ratio before and after pattern
matching of capacity saving.■ FMD Saving Ratio: The capacity reduction ratio before and after accelerated compression.■ FMD Compression Ratio: The capacity compression ratio before and after accelerated
compression.■ FMD Pattern Matching Ratio: The capacity reduction before and after pattern matching of
accelerated compression.■ Snapshot Efficiency Ratio: The efficiency ratio achieved by snapshot.
Total Efficiency by Pool report
Chapter 11: Additional dashboard reportsHitachi Ops Center Analyzer User Guide 149

■ Provisioning Efficiency (%): The efficiency ratio achieved by Dynamic Provisioning.■ Calculation Time: The start date/time and the end date/time for the calculation.
Capacity by Consumer reportThe Capacity by Consumer report provides the current snapshot of the storage capacityused by the consumers. The report provides a breakdown of used capacity, free capacity, andother usage metrics for DP volumes and non-DP volumes. Use this report to monitor thecapacity consumption of resources allocated to a consumer group.
The report contains the following metrics:■ Consumer: The name of the consumer.■ Grade: The grade of the consumer.■ Thin Used: The sum of the used capacity of DP volumes assigned to the consumer.■ Thin Free: The sum of the free capacity of DP volumes assigned to the consumer.■ Thick: The sum of the capacity of non-DP volumes assigned to the consumer.
Capacity by Consumer in the Past 6 Months reportThe Capacity by Consumer in the Past 6 Months report displays the storage capacity usedby the consumers in the past 6 months. The report provides a breakdown of used capacity,free capacity, and other usage metrics for DP volumes and non-DP volumes. Use this reportto monitor the capacity consumption of resources allocated to a consumer group.
The report contains the following metrics:■ Consumer: The name of the consumer.■ Grade: The grade of the consumer.
Capacity by Consumer report
Chapter 11: Additional dashboard reportsHitachi Ops Center Analyzer User Guide 150

■ Thin Used: The sum of the used capacity of DP volumes assigned to the consumer.■ Thin Free: The sum of the free capacity of DP volumes assigned to the consumer.■ Thick: The sum of the capacity of non-DP volumes assigned to the consumer.
Capacity by Consumer report (HUS 100 Storage Systems)The Capacity by Consumer (HUS 100 Storage Systems) report provides details about thestorage capacity used by the consumers. The report provides a breakdown of used capacity,free capacity, and other usage metrics for DP volumes, and non-DP volumes. Use this reportto monitor the capacity consumption of resources allocated to a consumer group.
The report contains the following metrics:■ Consumer: The name of the consumer.■ Grade: The grade of the consumer.■ Thin Used: The sum of the used capacity of DP volumes assigned to the consumer.■ Thin Free: The sum of the free capacity of DP volumes assigned to the consumer.■ Thick: The sum of the capacity of non-DP volumes assigned to the consumer.
Capacity by Consumer in the Past 6 Months report (HUS 100 StorageSystems)
The Capacity by Consumer in the Past 6 Months (HUS 100 Storage Systems) reportprovides details about the storage capacity used by consumer in the past 6 months. Thereport provides a breakdown of used capacity, free capacity, and other usage metrics for DPvolumes and non-DP volumes. Use this report to monitor the capacity consumption ofresources allocated to a consumer group.
Capacity by Consumer report (HUS 100 Storage Systems)
Chapter 11: Additional dashboard reportsHitachi Ops Center Analyzer User Guide 151
The report contains the following metrics:■ Consumer: The name of the consumer.■ Grade: The grade of the consumer.■ Thin Used: The sum of the used capacity of DP volumes assigned to the consumer.■ Thin Free: The sum of the free capacity of DP volumes assigned to the consumer.■ Thick: The sum of the capacity of non-DP volumes assigned to the consumer.
Capacity by Consumer in the Past 6 Months report (HUS 100 Storage Systems)
Chapter 11: Additional dashboard reportsHitachi Ops Center Analyzer User Guide 152

Chapter 12: Performance analytics and bestpractices
Understanding utilization
The single, most important cause of performance problems is an end-to-end (E2E) data pathto a resource where the throughput capacity has been exceeded. In this case, infrastructurethat supports the large-scale movement of data is bound to experience issues withthroughput. To fulfill the promise of no single point of failure, all resources in the data pathmust have sufficient reserve capacity to carry increased load under failover conditions.
Performance analysis frequently begins with a determination of whether any E2E data pathresources are overloaded. By using E2E data analysis in Hitachi Ops Center Analyzer(Analyzer) you can determine the particular areas of concern.
To understand how utilization is measured, consider the categories capacity and workload.Capacity refers to the percentage of physical space occupied across storage resources.Using percentages allows you measure the space occupied on a disk or a parity group. Notso straightforward is the category of workload, which can be thought of as the percentage oftime it takes for the system to do an operation (for example, read or write). Another way ofexpressing workload is to measure the percentage of how busy a resource, such as aprocessor or cache, is.
These resources include those on the host and storage side, as well as the fabric. Becausethe whole system and its parts are affected by workload, the time and space aspect ofmeasuring utilization can be combined to focus on capacity throughput, which is used tomeasure port and path utilization. Throughput capacity combines both considerations bycalculating the percentage of I/O operations.
When monitoring infrastructure resource workload with Analyzer, use the following metrics tomeasure utilization:■ IOPS (I/O per second): the number of operations■ MBps (MB per second) : the amount of data transferred■ Response time (read/write operations): the sum of service and wait time.
Optimizing online versus batch workloads
Optimizing utilization of a storage resource for an online workload and a batch workload ismutually exclusive. Consequently, online and batch workloads generally do not share thesame storage access resource at the same time.
Chapter 12: Performance analytics and best practicesHitachi Ops Center Analyzer User Guide 153
The performance for online workloads is monitored on a minute by minute basis.Performance alerts us to such problems as, at the most pressing, lagging response times,and while less immediate but just as significant, inadequate reserves to support processingduring failures.
For batch workloads, the average performance over time is monitored. Since high utilizationis a design goal, the metrics for these values are not a cause for concern: maximizingutilization per resource maximizes throughput per resource. Consequently, high responsetime is not central to monitoring batch workloads. Instead, monitoring batch workloadsbecomes a question of whether there is adequate capacity to complete processing within thebatch workload window even after a component failure occurs.
Utilization metricsTo evaluate performance, track the percentage of utilization of active resources andthroughput.
You should baseline your I/O profile when all systems are operating in a normal state. Thevalues shown in the Normal Value column are planning estimates.
Metric Name
Analyzer
Name in detail view Normal Value
(in milliseconds)
Performance riskvalue
(in milliseconds)
Read response time Average disk reads/second
1 to 10 Greater than 10
Write response time Average disk reads/second
1 to 3 Greater than 3
Storage-area network considerations
Storage-area network (SAN) components are also part of the end-to-end data path analysis.Areas of concerns that need to be addressed could include inter-switch links (ISLs) andlatency issues due to throughput. The switch configuration might not be in line with thedesired infrastructure design, so we need to maintain the correct firmware and make sure wedo not have any issues with SFP.
For example, a 48-port board has 2 ASICs sharing ports:■ If communication is between ports on the same ASIC port, then you see a 700-
nanosecond latency.■ If communication is between ports of different ASICs, or between different boards, traffic
goes through the back panel, through core communication boards, and then at the end ofthe transfer goes through three ASICs which could take 2 microseconds.
Regarding throughput, each port can transfer the maximum capability of the ASIC (i.e., 16Gbps with Gen5, 32 Gbps with newer switch architectures. Most switches can sustain thenumber of IOPS necessary to offer maximum throughput with a normal frame size of 2048bytes. This might not be true with smaller frames.
Utilization metrics
Chapter 12: Performance analytics and best practicesHitachi Ops Center Analyzer User Guide 154

Performance analysisUse the following decision-making workflow to check performance in your infrastructure.
Performance analysis
Chapter 12: Performance analytics and best practicesHitachi Ops Center Analyzer User Guide 155

Performance analysis exampleUse the following workflow as an example of the troubleshooting sequence for analyzingperformance by metrics. In this scenario, performance degradation has caused a critical alertto be sent about a platinum grade consumer in Ops Center Analyzer.
Analyze response time
1. Check performance of the affected storage resources:
a. See performance metrics for parity groups, MPB, I/O paths, response time, andcache write pending.
b. If the storage system is modular, see performance metrics for UVM/VM responsetime, HDD operation rates, CPU core busy, cache write pending.
2. Consider the following components:
a. HBA queue depthb. HBA settingsc. Virtual queue depth settings on the ESX host
3. Check the following switch components:
a. Switch configurationb. Buffer-to-buffer credit hitsc. ISL linksd. Hardware failures (for example, an SFP module might not be properly connected)
Analyze IOPS
1. Check for workload issues.
■ Is the storage tier type incorrect?
■ Is the profile for this application correct?
■ Is there enough disk space to handle the workload?
2. Check the performance for Parity Groups, MPBs, I/O paths.
Check utilization
If throughput is high:
1. Check all associated data paths for high utilization.2. Check the CHA>ESX host paths.
If throughput is low:■ Check the host paths for high utilization.■ Check for port saturation on the host.■ Consider host-based striping.
Performance analysis example
Chapter 12: Performance analytics and best practicesHitachi Ops Center Analyzer User Guide 156

Performance troubleshooting best practicesUse the following best practices for infrastructure reporting.
Report timing
Most performance issues are analyzed using one-minute data intervals. However,performance problems do occur requiring shorter interval analysis. Analysis of one-minutedata is generally limited to one- or two-day durations. Short intervals avoid muting peaks byaveraging performance metric values.
Troubleshoot high response times
When you monitor your infrastructure resources, the most significant metric to watch in theonline transactions is the I/O rate. The application processes a large number of transactionswhen the I/O rates are higher. Maintain healthy response times in an OLTP environment,which mostly generates random access I/O. The read I/O response times should be higherthan the write response times. Use the following guidelines when considering response timethresholds:■ This threshold depends on the application requirements and the SLA.■ Since the LUN response time has a direct impact on applications, this indicator should be
monitored on key LUNs to determine deltas as loads increase.■ Look for the worst performing LUNs and correlate with the host disk.
Maximum recommended array group utilization
For online workloads:■ 50% during normal operations■ Utilization reserves are required to accommodate failure
For batch workloads:■ As high as possible, because batch metric is typically given in elapsed time■ Expect maximums of 70-80% (depending on the burst profile of initiator)■ Average utilization over time remaining in the batch window should not exceed 50%
Performance troubleshooting best practices
Chapter 12: Performance analytics and best practicesHitachi Ops Center Analyzer User Guide 157
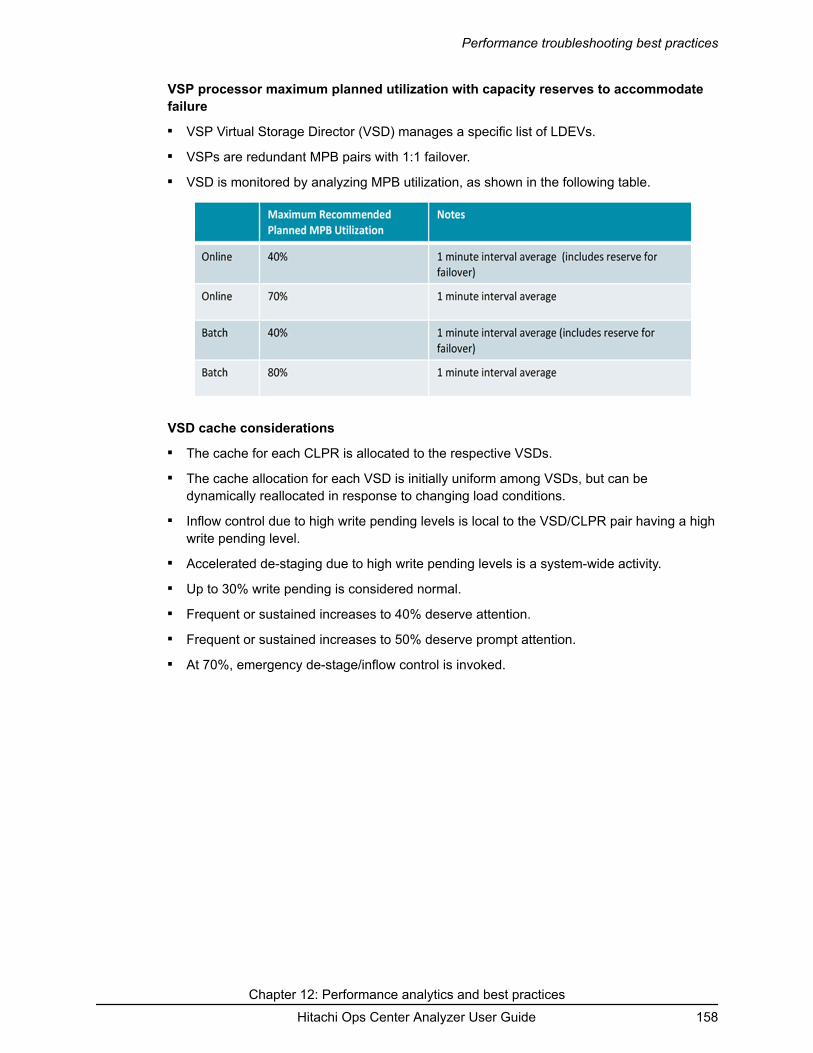
VSP processor maximum planned utilization with capacity reserves to accommodatefailure■ VSP Virtual Storage Director (VSD) manages a specific list of LDEVs.■ VSPs are redundant MPB pairs with 1:1 failover.■ VSD is monitored by analyzing MPB utilization, as shown in the following table.
VSD cache considerations■ The cache for each CLPR is allocated to the respective VSDs.■ The cache allocation for each VSD is initially uniform among VSDs, but can be
dynamically reallocated in response to changing load conditions.■ Inflow control due to high write pending levels is local to the VSD/CLPR pair having a high
write pending level.■ Accelerated de-staging due to high write pending levels is a system-wide activity.■ Up to 30% write pending is considered normal.■ Frequent or sustained increases to 40% deserve attention.■ Frequent or sustained increases to 50% deserve prompt attention.■ At 70%, emergency de-stage/inflow control is invoked.
Performance troubleshooting best practices
Chapter 12: Performance analytics and best practicesHitachi Ops Center Analyzer User Guide 158

Appendix A: Definition file templatesOps Center Analyzer provides users with definition file templates that can be customized torun actions based on specific events, along with email notifications.
Setting event actionsSetting event actions allows you to run a batch file for running an event action when an OpsCenter Analyzer event is registered. You can enable automatic notifications when an error isdetected by Ops Center Analyzer by defining commands to run when an event is registeredin the batch file for running an event action.
Defining a file for running an event actionTo run an event action, create a file that defines the commands to run when a specific eventis registered.
You can specify any file name. The files must have a file extension of .sh.
In the file for running an event action, you can view information about the event that triggeredan event action through environment variables. The following table shows the environmentvariables that you can specify in a file for running an event action.
Variable name Description
ANALYTICS_SOURCE Device name
ANALYTICS_DEVICE Device type
ANALYTICS_DESCRIPTION Message
ANALYTICS_CATEGORY Category
ANALYTICS_SEVERITY Level
ANALYTICS_DATE Registration date
ANALYTICS_EVENTID Event ID
ANALYTICS_GROUPSnnn Group name. Specify 000 for nnn.
ANALYTICS_NODEID Node ID
ANALYTICS_COMPONENTID Component ID
Appendix A: Definition file templatesHitachi Ops Center Analyzer User Guide 159

Variable name Description
ANALYTICS_PERFCOMPONENTID Performance
ANALYTICS_NAME Name of a host where Ops Center Analyzer isrunning
Example of specifying an environment variable in Linux: ${ANALYTICS_SOURCE}
Event action definition file formatThe following describes the format used to enter data and the settings to specify inEventAction.properties. The timing when the specified definitions are applied is alsodescribed.
Formatspecified-key-name=specified-value
FileEventAction.propertiesSave the file in UTF-8 format. When you save the file, prevent a BOM (byte ordermark) from being added to the file.
FolderOps-Center-Analyzer-installation-folder/Analytics/confThe default installation folder is /opt/hitachi.
Update frequencyOps Center Analyzer rereads the definition file if more than 5 minutes have elapsedsince the previous reading before executing the event action.
Content to specifySpecify each key name and value on a single line. When you create the event actiondefinition file, the following rules apply:■ A line starting with # is treated as a comment line
■ Blank lines are ignored
■ The entered values are case-sensitive
■ If the same key is specified more than once in the same file, the last specification isvalid
■ To specify a backslash (\), enter \\
■ To display %, specify %%
Event action definition file format
Appendix A: Definition file templatesHitachi Ops Center Analyzer User Guide 160

■ To specify an apostrophe ('), enter \'
■ To display a double quotation mark ("), specify \"
■ Specify only an absolute path. A path specified in an environment variable cannotbe set for the path
Setting description
Key nameSetting
descriptionSpecifiable
values Default valueOptional or
required
EventAction.cmd
Specifies theabsolute pathof the batchfile for runningan eventaction.
ASCIIcharacters andcharacters in260 bytes,excludingcontrolcharacters.
Note: Spacesare excluded.
Null character Optional
If this key isomitted, noevent actionwill be run.
This key alsoenables ordisables thefunction.
EventAction.maxCount
Specifies themaximumnumber ofevent actionsthat can berunsimultaneously.
1 to 100 10 Optional
If this key isomitted, thedefault valuewill be used.
EventAction.timeOut
Specifies thetimeout timefor eventactions (inmilliseconds).
1 to 3,600,000 300,000 Optional
If this key isomitted, thedefault valuewill be used.
Format of the email template definition fileTo create emails more efficiently, create an email template definition file and then use anemail template to create emails from the Execute Action window. You can also create emailsthat contain Ops Center Analyzer-managed resource data. For example, you can create anemail template that provides information on how to troubleshoot a resource failure. When afailure occurs, email templates allow you to create emails from the Execute Action windowto quickly notify the system administrator.
Format of the email template definition file
Appendix A: Definition file templatesHitachi Ops Center Analyzer User Guide 161

Prerequisite■ To send email messages from Ops Center Analyzer, configure the email server for
Ops Center Analyzer.
Formatspecified-key-name=specified-value
File■ Use any file.
■ Save the file in UTF-8 format.
■ A maximum of 1,000 files can be set in Ops Center Analyzer. Files are loaded inalphabetical order by file name, and any files after the 1,000th file are not loaded.
FolderOps-Center-Analyzer-installation-folder/Analytics/conf/template/mailThe default installation folder is /opt/hitachi.
Update frequencyWhen Ops Center Analyzer is started or the reloadtemplate command is run.
Content to specifySpecify each key name and value on a single line. When you create the emailtemplate definition file, the following rules apply:■ A line starting with # is treated as a comment line
■ Blank lines are ignored
■ The entered values are case-sensitive
■ If the same key is specified more than once in the same file, the last specification isvalid
■ To display \, specify \\
■ To display %, specify %%
■ If the filter condition SE.template.filter.xxxxxxx.string is specified more than once,settings will be displayed when all of the conditions are met
■ If you specify "LFCR" for the setting value, it displays in a new line in a previewwindow
Format of the email template definition file
Appendix A: Definition file templatesHitachi Ops Center Analyzer User Guide 162

Setting description
Key nameSetting
descriptionSpecifiable
values Default valueOptional or
required
SE.template.name.string
Specify theaction name.
Values of nomore than 127bytes that donot includecontrolcharacters
Null character Required
If this key isomitted, theprocessing toread files willfail.
The name ofthis key is thesame as thename specifiedin a commandtemplatedefinition file.
SE.template.description.string
Specify adescription ofthe action.
Values of nomore than 255bytes that donot includecontrolcharacters
Null character Optional
If this key isomitted, thedefault valuewill be used.
SE.mail.template.title.string
Specify thesubject of theemailtemplate.
Values of nomore than 255bytes that donot includecontrolcharacters
Null character Optional
If this key isomitted, thedefault valuewill be used.
SE.mail.template.body.string
Specify thebody of theemailtemplate.
Values of nomore than4,096 bytesthat do notinclude controlcharacters
Null character Optional
If this key isomitted, thedefault valuewill be used.
SE.mail.template.address.string
Specify theaddress of theemail template
Values of nomore than 255bytes that donot includecontrolcharacters
Null character Optional
If this key isomitted, thedefault valuewill be used.
Format of the email template definition file
Appendix A: Definition file templatesHitachi Ops Center Analyzer User Guide 163

Key nameSetting
descriptionSpecifiable
values Default valueOptional or
required
SE.template.filter.resourceName.string
Specifyconditions forthe names ofthe resourcesthat arestarting pointsand thatdisplay in theaction listduringresourceselection.1
Values of nomore than 255bytes that donot includecontrolcharacters
Null character Optional
If this key isomitted, thedefault valuewill be used,and the keywill not beused as a filtercondition.
SE.template.filter.resourceType.string
Specifyconditions forthe types ofresource thatare startingpoints and thatdisplay in theaction listduringresourceselection.1
Values of nomore than 32bytes that donot includecontrolcharacters
Null character Optional
If this key isomitted, thedefault valuewill be used,and the keywill not beused as a filtercondition.
SE.template.filter.vmHostname.string
Specifyconditions forthe virtualmachinenames thatdisplay in theaction listduringresourceselection.1
Values of nomore than 64bytes that donot includecontrolcharacters
Null character Optional
If this key isomitted, thedefault valuewill be used,and the keywill not beused as a filtercondition.
SE.template.filter.ipaddress.string
Specifyconditions forthe IPaddresses thatdisplay in theaction listduringresourceselection.1
Values of nomore than 255bytes that donot includecontrolcharacters
Null character Optional
If this key isomitted, thedefault valuewill be used,and the keywill not beused as a filtercondition.
Format of the email template definition file
Appendix A: Definition file templatesHitachi Ops Center Analyzer User Guide 164
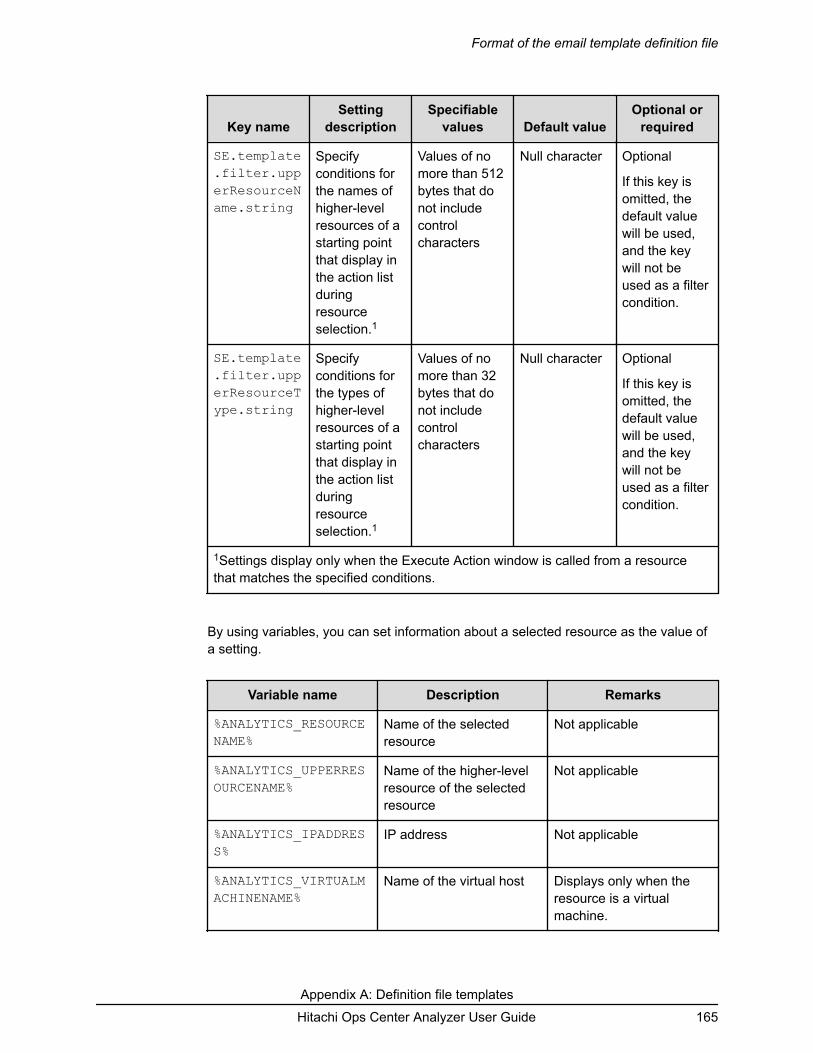
Key nameSetting
descriptionSpecifiable
values Default valueOptional or
required
SE.template.filter.upperResourceName.string
Specifyconditions forthe names ofhigher-levelresources of astarting pointthat display inthe action listduringresourceselection.1
Values of nomore than 512bytes that donot includecontrolcharacters
Null character Optional
If this key isomitted, thedefault valuewill be used,and the keywill not beused as a filtercondition.
SE.template.filter.upperResourceType.string
Specifyconditions forthe types ofhigher-levelresources of astarting pointthat display inthe action listduringresourceselection.1
Values of nomore than 32bytes that donot includecontrolcharacters
Null character Optional
If this key isomitted, thedefault valuewill be used,and the keywill not beused as a filtercondition.
1Settings display only when the Execute Action window is called from a resourcethat matches the specified conditions.
By using variables, you can set information about a selected resource as the value ofa setting.
Variable name Description Remarks
%ANALYTICS_RESOURCENAME%
Name of the selectedresource
Not applicable
%ANALYTICS_UPPERRESOURCENAME%
Name of the higher-levelresource of the selectedresource
Not applicable
%ANALYTICS_IPADDRESS%
IP address Not applicable
%ANALYTICS_VIRTUALMACHINENAME%
Name of the virtual host Displays only when theresource is a virtualmachine.
Format of the email template definition file
Appendix A: Definition file templatesHitachi Ops Center Analyzer User Guide 165

Variable name Description Remarks
%ANALYTICS_RESOURCETYPE%
Resource type Not applicable
%ANALYTICS_UPPERRESOURCETYPE%
Type of the higher-levelresource
Not applicable
If no value is set for the selected resource, a null character displays.
To display information about virtual hosts and IP addresses, VMware Tools must beinstalled on virtual hosts.
Note:
The email template definition file restricts the maximum number of characters thatcan be displayed in the email editor.
If the maximum number of specifiable characters is exceeded in an emailtemplate's address, subject, and body, clicking Launch Mailer in the ExecuteAction dialog box might not start the email editor normally.
If the email editor does not start normally, manually start the email editor, andthen copy the contents of the preview to use them.
The maximum number of specifiable characters depends on the web browser. Asa guideline, the maximum number of characters for web browsers is 2059 for theFirefox browser, and 200 for the Internet Explorer 11 browser.
Command template definition files formatsIf you create a command template definition file, use the Execute Action window to runcommands of other products, user programs, and resources on the Ops Center Analyzermanagement server. If you want to run more than one command at the same time, you cancreate a batch or shell command.
Formatspecified-key-name=specified-value
File■ Specify any file name and file extension.■ Save the file in UTF-8 format.■ The maximum number of files that can be set in Ops Center Analyzer (including the
number of email template definition files) is 1,000. Files load in alphabetical orderby file name, and any files after the 1,000th file are not loaded.
FolderOps-Center-Analyzer-installation-folder/Analytics/conf/template/command
Command template definition files formats
Appendix A: Definition file templatesHitachi Ops Center Analyzer User Guide 166

The default installation folder is /opt/hitachi.
Update frequencyWhen Ops Center Analyzer is started or the reloadtemplate command is run.
Content to specifySpecify each key name and value on a single line. The following rules apply whenspecifying settings in a command template definition file:■ A line starting with # is treated as a comment line.■ Blank lines are ignored.■ The entered values are case-sensitive.■ If you specify an invalid value, the default value is used.■ If you specify the same key more than once in the same file, the last specification is
valid.■ To display \, specify \\.
■ To display %, specify %%.
■ If you specify the filter condition SE.template.filter.xxxxxxx.string morethan once, settings display when all of the conditions are met.
Setting descriptions
Key nameSetting
descriptionSpecifiable
valuesDefaultvalue
Optionalor
required
SE.template.name.string
Specify the actionname.
Values of nomore than 127bytes that donot includecontrolcharacters
This settinghas nodefaultvalue,becausespecifyingthis settingis required.
Required
SE.template.description.string
Specify adescription of theaction.
Values of nomore than 255bytes that donot includecontrolcharacters
Nullcharacter
Optional
If this keyis omitted,the defaultvalue isused.
Command template definition files formats
Appendix A: Definition file templatesHitachi Ops Center Analyzer User Guide 167

Key nameSetting
descriptionSpecifiable
valuesDefaultvalue
Optionalor
required
SE.cmd.template.cmdName.string
Specify the nameof the command torun by specifyingthe absolute pathto the command. Acommandspecified by itsrelative path mightfail.
Values of nomore than 255bytes that donot includecontrolcharacters
Do not specifythe followingstrings:
& | ; $ > <` ! ../ ..\ ( ) { }
This settinghas nodefaultvalue,becausespecifyingthis settingis required.
Required
SE.cmd.template.cmdArgs.string
Specify argumentsfor the commandto run.
Values of nomore than4,096 bytesthat do notinclude controlcharacters
Do not specifythe followingstrings:
& | ; $ > <` ! ../ ..\ ( ) { }
Nullcharacter
Optional
If this keyis omitted,the defaultvalue isused.
SE.cmd.template.timeOut.num
Specify thetimeout period forthe command torun (inmilliseconds).
1 to2,147,483,647
30,000 Optional
If this keyis omitted,the defaultvalue isused.
SE.template.filter.resourceName.string
Specify conditionsfor the names ofthe resources thatare starting pointsand that display inthe action listduring resourceselection. 1
Values of nomore than 255bytes that donot includecontrolcharacters
Nullcharacter
Optional
If this keyis omitted,the defaultvalue isused.
Command template definition files formats
Appendix A: Definition file templatesHitachi Ops Center Analyzer User Guide 168

Key nameSetting
descriptionSpecifiable
valuesDefaultvalue
Optionalor
required
SE.template.filter.resourceType.string
Specify conditionsfor the types ofresources that arestarting points andthat display in theaction list duringresourceselection.1
Values of nomore than 32bytes that donot includecontrolcharacters
Nullcharacter
Optional
If this keyis omitted,the defaultvalue isused.
SE.template.filter.vmHostname.string
Specify conditionsfor the virtualmachine namesthat display in theaction list duringresourceselection.*
Values of nomore than 64bytes that donot includecontrolcharacters
Nullcharacter
Optional
If this keyis omitted,the defaultvalue isused.
SE.template.filter.ipaddress.string
Specify conditionsfor the IPaddresses thatdisplay in theaction list duringresourceselection.1
Values of nomore than 255bytes that donot includecontrolcharacters
Nullcharacter
Optional
If this keyis omitted,the defaultvalue isused.
SE.template.filter.upperResourceName.string
Specify conditionsfor the names ofhigher-levelresources of astarting point thatdisplay in theaction list duringresourceselection.1
Values of nomore than 512bytes that donot includecontrolcharacters
Nullcharacter
Optional
If this keyis omitted,the defaultvalue isused.
SE.template.filter.upperResourceType.string
Specify conditionsfor the types ofhigher-levelresources of astarting point thatdisplay in theaction list duringresourceselection.1
Values of nomore than 32bytes that donot includecontrolcharacters
Nullcharacter
Optional
If this keyis omitted,the defaultvalue isused.
Command template definition files formats
Appendix A: Definition file templatesHitachi Ops Center Analyzer User Guide 169

Key nameSetting
descriptionSpecifiable
valuesDefaultvalue
Optionalor
required
SE.template.filter.MultipleResources.boolean
Specify whether toexecute formultiple resources.
true orfalse
false Optional
If this keyis omitted,the defaultvalue isused.
SE.cmd.template.usage.string
Specify how to usethe command.
Values of nomore than4,096 bytesthat do notinclude controlcharacters
Nullcharacter
Optional
If this keyis omitted,the defaultvalue isused.
* Settings display only when the Execute Action window is called from a resourcethat matches the specified conditions.
By using variables, you can set information about a selected resource as the value ofa setting.
The following table lists the variables you can use.
Variable name Description Remarks
%ANALYTICS_RESOURCENAME%
Name of the selectedresource
N/A
%ANALYTICS_UPPERRESOURCENAME%
Name of the higher-levelresource of the selectedresource
N/A
%ANALYTICS_IPADDRESS%
IP address N/A
%ANALYTICS_VIRTUALMACHINENAME%
Name of the virtual host Displays only when theresource is a virtualmachine.
%ANALYTICS_RESOURCETYPE%
Resource type N/A
%ANALYTICS_UPPERRESOURCETYPE%
Type of the higher-levelresource
N/A
Command template definition files formats
Appendix A: Definition file templatesHitachi Ops Center Analyzer User Guide 170

If no value is set for the selected resource, a null character displays.
To display information about virtual hosts and IP addresses, VMware Tools must beinstalled on virtual hosts.
Definition example where the selected resource names are specified for commandarguments
SE.template.name.string=001_task-executionSE.template.description.string=Executes the scheduled tasksSE.cmd.template.cmdName.string=/root/commands/taskA.shSE.cmd.template.cmdArgs.string=%ANALYTICS_RESOURCENAME%
Command template definition files formats
Appendix A: Definition file templatesHitachi Ops Center Analyzer User Guide 171

Appendix B: TroubleshootingThe common performance problems and the possible solutions are described in thisappendix.
Solving performance problemsThe common performance problems and the possible solutions are described as follows. Thepossible causes and solutions are intended to provide guidance, and might not satisfy yourbusiness process performance requirements.
The following table lists the commonly observed storage-related problems and possiblesolutions.
Bottleneck metrics Root cause and possible solutions
Parity Group utilization ■ Root cause:
The usage rate of the Parity Groupincreases because of the followingpossible causes:■ Some volumes might be under heavy
load.■ Volumes (logical resources) might
belong to the same Parity Group(physical resource) which might causeresource contention issues in theshared infrastructure.
■ Possible solutions:● Consider moving some volumes to
another Parity Group with a lowerusage rate or higher performance.
● Consider increasing the number ofdrives (by concatenating ParityGroups).
● To manage a Parity Group that is partof a pool, consider adding anotherParity Group to the pool.
Appendix B: TroubleshootingHitachi Ops Center Analyzer User Guide 172

Bottleneck metrics Root cause and possible solutions
MPB utilization ■ Root cause:
The usage rate of the MP Blade (averageusage rate of the MP cores in the MPBlade) increases because of anincreased load. Too many busyresources such as internal volumes,external volumes, or journal groupsaccessing the same MP Blade mightcause performance degradation.
■ Possible solutions:● Consider allocating the busy
resources (internal volumes, externalvolumes, or journal groups) to anotherMP Blade (changing the MP Bladeownership).
● Limit I/O to the volumes using I/Ocontrols.
● Increase the size of cache memoryallocated to the MP Blade.
Port utilization ■ Root cause:
The usage rate of the port (amount ofdata forwarded by the port divided by theamount of data that can be forwarded bythe port) increases because of a numberof volumes accessing the same port.
■ Possible solutions:
Consider allocating some volumes (orhost groups) to a different port.
Note: When the connected port ischanged, the host might need to berestarted.
Solving performance problems
Appendix B: TroubleshootingHitachi Ops Center Analyzer User Guide 173
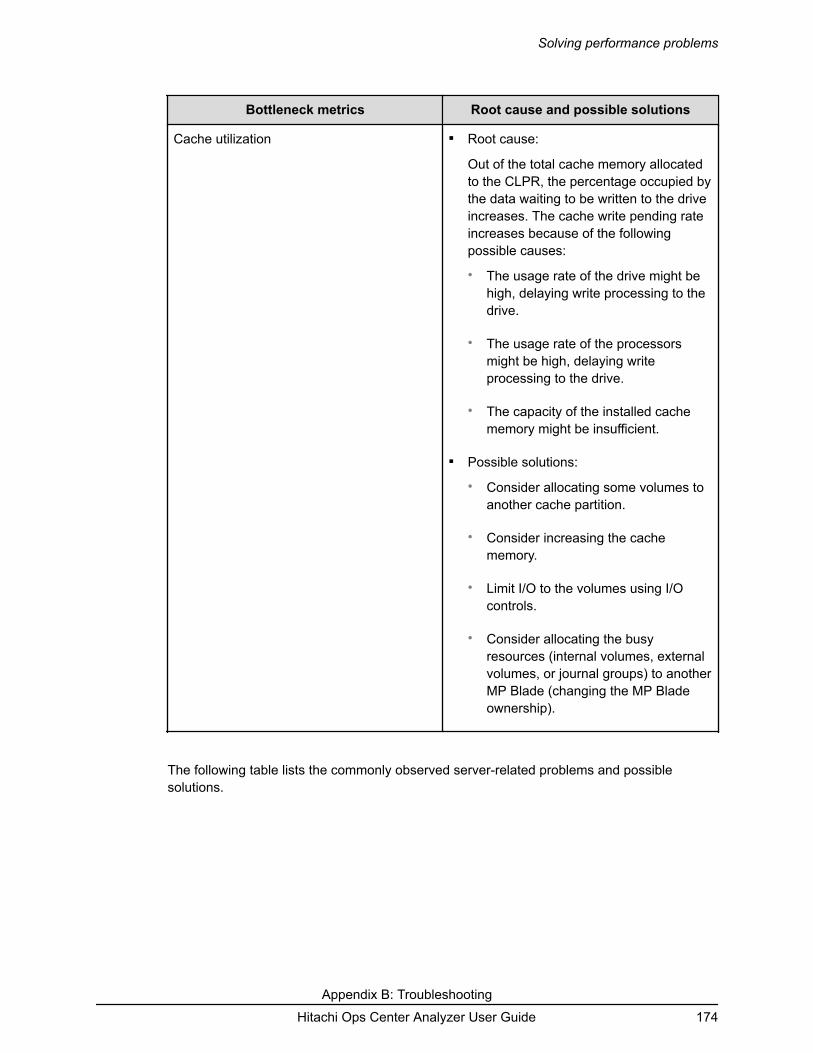
Bottleneck metrics Root cause and possible solutions
Cache utilization ■ Root cause:
Out of the total cache memory allocatedto the CLPR, the percentage occupied bythe data waiting to be written to the driveincreases. The cache write pending rateincreases because of the followingpossible causes:● The usage rate of the drive might be
high, delaying write processing to thedrive.
● The usage rate of the processorsmight be high, delaying writeprocessing to the drive.
● The capacity of the installed cachememory might be insufficient.
■ Possible solutions:● Consider allocating some volumes to
another cache partition.
● Consider increasing the cachememory.
● Limit I/O to the volumes using I/Ocontrols.
● Consider allocating the busyresources (internal volumes, externalvolumes, or journal groups) to anotherMP Blade (changing the MP Bladeownership).
The following table lists the commonly observed server-related problems and possiblesolutions.
Solving performance problems
Appendix B: TroubleshootingHitachi Ops Center Analyzer User Guide 174

Bottleneck metrics Root cause and possible solutions
CPU utilization ■ Root cause:
CPU bottlenecks occur when severalVMs run on the same physical machine,and end up sharing the same CPU. If theVMs (logical resources) share the sameCPU (physical resource) and if one of theVMs utilizes the CPU more than theothers in the shared infrastructure, thetotal efficiency of the CPU is degradedand the CPU utilization rate increases.The CPU could become saturated withrequests because of resource contentionissues.
■ Possible solutions:
Consider moving the VMs to anotherserver.
Memory utilization ■ Root cause:
Memory bottlenecks occur when severalVMs (logical resources) share theavailable memory (physical resources)which might result in the performancedegradation of the physical memory.
■ Possible solutions:
Consider allocating additional physicalmemory, or moving the VMs to anotherserver.
Solving performance problems
Appendix B: TroubleshootingHitachi Ops Center Analyzer User Guide 175

Troubleshooting granular data collection error codesIf an error occurs during granular data collection, determine the cause of the error using oneof the following methods.■ Check the message display on the Events tab in Ops Center Analyzer.
If data collection does not start because the script corresponding to an action does notexist, the message returns a code that indicates the cause of the error.
Example:
Message: Command finished. (action name, command return code: return code
Refer to the following table to identify the cause of the error and the solution.■ Check the result in the log file.
If the return code 0 is displayed on the Events tab, check the log file to see the results ofthe granular data collection.
Message: KNAQ03626-I command finished. (exit code: exit code)
Note: The message ID related to granular data collection is KNAQ03626-I.
If an action ends successfully, the message displays exit code 0. If an exit code other than0 is displayed, refer to the following table to identify the cause of the error and thesolution.
Troubleshooting granular data collection error codes
Appendix B: TroubleshootingHitachi Ops Center Analyzer User Guide 176

Returncode Root cause and solutions
10-21 An invalid value is specified for an option.
Refer to the log and specify an appropriate value for the option that caused theerror.
22-23 The value specified for the -startTime or -timezone option is invalid.
Specify appropriate values for these options.
24 The date and time specified for the -startTime option is earlier than thecurrent date and time.
Specify an appropriate value for this option.
28 The target Agent host could not be identified.■ Make sure that the file storage_agent_map.txt exists in the same
directory as this command.■ Confirm that the lines corresponding to the model and serial numbers
specified in the -model and -serialNumber options are coded in the filestorage_agent_map.txt.
29 The port number defined in the file storage_agent_map.txt is invalid.
Make sure that a numeric value is defined for the port number.
30 A connection to the Agent host could not be established.■ Make sure that the IP address of the Agent host specified in the file
storage_agent_map.txt is correct.
■ Make sure that Agent host is running.■ Confirm that communication can be established between the Ops Center
Analyzer server and the Agent host.■ Make sure that the initial settings for this command are completed.
40-44 An internal error occurred.■ Make sure that IP address of the Agent host specified in the file
storage_agent_map.txt is correct.
■ Make sure that the Agent host is running.■ Confirm that communication can be established between the Ops Center
Analyzer server and the Agent host.■ Make sure that the initial settings of this command are completed.
45 The storage information could not be obtained.■ Make sure that the Tuning Manager Web service is running on the Agent
host.
Troubleshooting granular data collection error codes
Appendix B: TroubleshootingHitachi Ops Center Analyzer User Guide 177

Returncode Root cause and solutions
■ Make sure that the port number of the Agent host specified in the filestorage_agent_map.txt matches the port number used by the TuningManager Web service.
46 The Agent instance that is to monitor the target storage system does not exist.■ Make sure that the storage system specified by the -model and -
serialNumber options is set to be monitored on the corresponding Agenthost.
■ Check that the PD records have been already collected on the instance thatis to monitor the specified storage system.
50 The directory that stores the collection results exists as a file.■ Refer to the log file and delete or rename the file whose path is shown for
the RESULT_DIR parameter.
■ Alternatively, change the path name specified for the -pathLabel option.
51 The directory that stores the execution results exists as a file.■ Refer to the log file and delete or rename the file model-name_serial-
number whose path is shown for the RESULT_DIR parameter.
■ Alternatively, change the path name specified for the -pathLabel option.
52 The directory that stores the execution results could not be created.
Refer to the log file and check the permissions for the directory shown for theRESULT_DIR parameter.
53-54 An internal error occurred. A temporary file could not be created or deleted.
Refer to the log file and check the permissions for the directory shown for theRESULT_DIR parameter.
60-62 An internal error occurred. An operation could not be performed for a file ordirectory on the Agent host.
Delete the file in the following directory on the Agent host:
/opt/jplpc/agtd/agent/instance-name/raidperf_ldevlist/hiaa.conf/opt/jplpc/agtd/agent/instance-name/secdata_rmFor instance-name, specify the name of the instance that monitors thespecified storage system.
70-72 An internal error occurred. The RAID Agent command could not be executednormally on the Agent host.■ Make sure that the Agent host is running and that communication is
available between the Ops Center Analyzer server and the Agent host.
Troubleshooting granular data collection error codes
Appendix B: TroubleshootingHitachi Ops Center Analyzer User Guide 178

Returncode Root cause and solutions
■ Make sure that the Agent version is 8.5.1 or later.■ Part of the pre-transfer execution result might remain in the following
directory on the Agent host. Because this directory is initialized the nexttime the command is run, obtain the file beforehand if necessary:
/opt/jplpc/agtd/agent/instance-name/secdata_rmFor instance-name, specify the name of the instance that monitors thespecified storage system.
73 The execution result file could not be transferred from the Agent host. Part ofthe pre-transfer execution result might remain in the following directory on theAgent host.
Because this directory is initialized the next time the command is run, obtainthe file beforehand, if necessary.
80 An internal error occurred.
Make sure that Agent host is running and that communication is availablebetween the Ops Center Analyzer server and the Agent host.
/opt/jplpc/agtd/agent/instance-name/secdata_rmFor instance-name, specify the name of the instance that monitors thespecified storage system.
81 The data collection processing is being executed for the same storage by thesame command.
After the data collection processing is finished, run the command again.
If this error occurs but no data collection processing is running, delete thefollowing file on the Agent host:
/opt/jplpc/agtd/agent/instance-name/raidperf_ldevlist_hiaa.confFor instance-name, specify the name of the instance that monitors thespecified storage system.
90 The installation path of Ops Center Analyzer was not found.
Check the status of the installation.
91 The schedule could not be set according to the time specified in the -startTime option.
■ Check the specification for this option.■ Make sure that the atd service is running on the Ops Center Analyzer
server.
Troubleshooting granular data collection error codes
Appendix B: TroubleshootingHitachi Ops Center Analyzer User Guide 179

Returncode Root cause and solutions
92 The command required for specifying the start of the collection time (the -startTime option) was not found.
Install the at command on the Ops Center Analyzer server.
Troubleshooting granular data collection error codes
Appendix B: TroubleshootingHitachi Ops Center Analyzer User Guide 180

IndexSpecial Charactersassignment rule
changing the order of priority (resource) 109changing the order of priority (user resource) 102creating (resource) 108creating (user resource) 102executing (resource) 109executing (user resource) 103
Aaction template 53, 55analytics 19, 68, 74analyze 68, 74Analyzer detail view 10.8.1 19, 68, 74analyzing
bottleneck 45, 51authentication
external, groups 115external, users 114
Bbatch file for event action execution 159bottleneck
analyzing 45determining cause 50
CCapacity of VMware Datastores report 137Capacity of VMware Datastores with Usage Exceeding80% report 137capacity reports
drive types 141HUS 100 storage systems 139
condition profilecreating 111
configuration report 30configuring
mail server 110consumer
consumer (continued)creating 108grade 120status 120summary 120
Consumer - Critical report 121consumer capacity 150consumers
settings 107creating
consumer 108critical reports
Consumer - Critical 121custom report 30custom reports
line graphs 30table report 30
Ddashboard
overview 21datastores
Capacity of VMware Datastores report 137Capacity of VMware Datastores with UsageExceeding 80% report 137
default reportsEvent Trends 25Resource Events 26System Resource Status 24, 119System Status Summary 23
definition 159definition file template 166device mapping 64
Eemail notification
condition profile (creating) 111settings 110
email notificationsemail address (settings to enable or disable) 111
IndexHitachi Ops Center Analyzer User Guide 181

email template definition file 161event action 159event action definition file 160Event Trends report 25events
overview 26Execute Action
Granular Data Collection 56
Fformat 160, 161, 166
Ggranular data collection 55Granular Data Collection
collecting granular data 56error codes and solutions 176guidelines 56options 56output 56prerequisites 56troubleshooting 176
HHitachi Ops Center Analyzer 10.8.1 19, 68, 74Hitachi Ops Center Automator 19Hitachi Performance Analytics 19, 68, 74hypervisor 131
II/O control
clear settings 88optimizing I/O performance 85set IO control 87SLO 85
Mmail server
configuring 110monitoring environment setup 19monitoring settings
dynamic threshold (overview) 93static threshold (overview) 98
OOps Center Analyzer
features 14
Ops Center Analyzer (continued)logging on 18overview 13
Ops Center Analyzer 10.8.1 19, 68, 74Ops Center Analyzer detail view 10.8.1 19, 68, 74Ops Center AutomatorAutomation Director 19Ops Center Automatorservices 55
PPerformance Analytics 19, 68, 74predict 68, 74predictive analytics
generating a risk report 72licenses 70report definitions 69risk profile 69
predictive risk profile 69predictive risk report definitions 69
Rreport definition 68, 74reports
Capacity of VMware Datastores 137Capacity of VMware Datastores with UsageExceeding 80% 137Consumer - Critical 121Event Trends 25Resource Events 26storage systems 133switches 132System Resource Status 24, 119system resources 134System Status Summary 23Total Hosts 130Total VMs 125VM CPU Ready 124VM Disk Latency 125VM NIC Dropped 124
resourceassignment rule (changing the order of priority) 109assignment rule (creating) 108assignment rule (executing) 109
Resource Events report 26resources
monitoring settings (overview) 90risk profile 68, 74risk profiles 71risk report definitions 71risk reporting 68, 74
IndexHitachi Ops Center Analyzer User Guide 182

Ssecond-level data 55security 116service template 55settings
consumers 107email notification 110monitoring resources (overview) 90
storage capacity 138system resource
setting thresholds 103System Resource Status report 24, 119System Status Summary
infrastructure resources 118Storage Resources 117System Resources 118user resources
host 24, 118VM 24, 118volume 24, 118
Volumes 117System Status Summary report 23
Tthreshold
settings (system resource) 103settings (user resource) 101
topology view 64Total Hosts report 130Total VMs report 125trend chart 68, 74
Uuser resource
assignment rule (changing the order of priority) 102assignment rule (creating) 102assignment rule (executing) 103setting thresholds 101
VVM CPU Ready report 124VM DIsk Latency report 125VM NIC Dropped report 124VM reports
VM CPU Ready 124VM Disk Latency 125VM NIC Dropped 124
VMs
VMs (continued)Total VMs report 125
IndexHitachi Ops Center Analyzer User Guide 183

Hitachi Vantara
Corporate Headquarters
2535 Augustine Drive
Santa Clara, CA 95054 USA
HitachiVantara.com | community.HitachiVantara.com
Contact Information
USA: 1-800-446-0744
Global: 1-858-547-4526
HitachiVantara.com/contact