Metabolic profiling of presymptomatic Huntington's disease ...
Upload
independentCategory
view
0download
0
Magnetic resonance perfusion imaging ofresting-state cerebral blood flow in preclinicalHuntington’s disease
Robert C Wolf1,2, Georg Gron2, Fabio Sambataro3, Nenad Vasic2, Nadine D Wolf4,Philipp A Thomann1, Carsten Saft5, G Bernhard Landwehrmeyer6 and Michael Orth6
1Center of Psychosocial Medicine, Department of General Psychiatry, University of Heidelberg, Heidelberg,Germany; 2Department of Psychiatry and Psychotherapy III, University of Ulm, Ulm, Germany; 3Brain Centerfor Motor and Social Cognition, Italian Institute of Technology, Parma, Italy; 4Central Institute of MentalHealth, Department of Addictive Behavior and Addiction Medicine, Mannheim, Germany; 5Department ofNeurology, St Josef-Hospital, University of Bochum, Bochum, Germany; 6Department of Neurology,University of Ulm, Ulm, Germany
Magnetic resonance imaging (MRI) of the brain could be a powerful tool for discovering earlybiomarkers in clinically presymptomatic carriers of the Huntington’s disease gene mutation (preHD).The aim of this study was to investigate the sensitivity of resting-state perfusion MRI in preHD and toidentify neural changes, which could serve as biomarkers for future clinical trials. Differences inregional cerebral blood flow (rCBF) in 18 preHD and 18 controls were assessed with a novel MRImethod based on perfusion images obtained with continuous arterial spin labeling. High-resolutionstructural data were collected to test for changes of brain volume. Compared with controls, preHDindividuals showed decreased rCBF in medial and lateral prefrontal regions and increased rCBF inthe precuneus. PreHD near to symptom onset additionally showed decreased rCBF in the putamenand increased rCBF in the hippocampus. Network analyses revealed an abnormal lateral prefrontalpattern in preHD far and near to motor onset. These data suggest early changes of frontostriatalbaseline perfusion in preHD independent of substantial reductions of gray matter volume. Thisstudy also shows the feasibility of detecting neural changes in preHD with a robust MRI techniquethat would be suitable for longitudinal multisite application.Journal of Cerebral Blood Flow & Metabolism advance online publication, 11 May 2011; doi:10.1038/jcbfm.2011.60
Keywords: arterial spin labeling; cerebral blood flow; Huntington’s disease; prefrontal cortex; magnetic resonanceimaging; striatum
Introduction
Huntington’s disease (HD) is an autosomal dominantinherited neurodegenerative disorder caused byCAG repeat expansion mutation in the HTT geneon chromosome 4 (Vonsattel et al, 1985). Clinically,the disorder is characterized by progressive motordysfunction, psychiatric disturbances, and cognitive
deficits. Much effort at present focuses on identify-ing therapeutic targets and developing treatmentsthat may delay onset of the disease, or slow downor stop the progression of HD once it manifests.Similarly important is the development of objectivemeasures that allow reliable assessment of the effectson disease progression, or the prevention of theemergence of signs of HD in the preclinical phase(preHD) of such novel treatments. Imaging the brainmay be a powerful tool in this regard. Neuroimagingstudies of brain structure, metabolism, and perfusionhave revealed differences between preclinicalmutant HTT gene carriers and controls (Aylward,2007; Feigin et al, 2007; Harris et al, 1999; Tabriziet al, 2009). In addition, measuring brain activitychanges with functional magnetic resonance imaging(fMRI) may also reveal early and sensitive markers ofHD pathology. So far, brain activation in preHD hasbeen assessed using different cognitive stimulationparadigms (Kloppel et al, 2009b). Importantly, brain
Received 20 October 2010; revised 28 February 2011; accepted 25March 2011
Correspondence: Dr RC Wolf, Department of Psychiatry, Universityof Heidelberg, Vo�trasse 4, Heidelberg 69115, Germany.E-mail: [email protected]
RCW was supported by a grant from the CHDI/High Q foundation, a
non-for-profit organization dedicated to increase the understanding of
Huntington’s disease and to facilitate the development of new treat-
ment strategies for this illness (http://www.highqfoundation.org/).
This study also received support from the European Huntington’s
Disease Network (EHDN, http://www.euro-hd.net/html/network).
Journal of Cerebral Blood Flow & Metabolism (2011), 1–11& 2011 ISCBFM All rights reserved 0271-678X/11 $32.00
www.jcbfm.com
activation differences in preHD have been demon-strated in the absence of structural changes (Zimbelmanet al, 2007), suggesting that MRI-derived markers ofbrain activation might be more sensitive indicators ofneural dysfunction in preHD than volumetric mea-sures alone. However, despite its power to detectearly neural changes in preHD, the implementationof task-based fMRI in a multicentric setting ismethodologically challenging (Stocker et al, 2005).Unlike resting-state measures of brain metabolism orbrain structure, task-based techniques need to beinterpreted within their experimental framework,since task complexity, cognitive capacity, and per-formance variability have as much to be consideredas experimental test–retest effects associated withlongitudinal study designs (Maitra, 2009).
Regional cerebral blood flow (rCBF) is tightlycoupled to neural function and is relatively stableover time (Floyd et al, 2003). Previous studies usingsingle photon emission computed tomography andpositron emission tomography have demonstratedstriatal and cortical changes of baseline rCBF (Harriset al, 1999) in manifest HD and preHD. In preHD,altered rCBF was associated with changes in memoryand executive function, suggesting a relationshipbetween perfusion abnormalities and cognition(Hasselbalch et al, 1992).
In this study, we investigated rCBF in preHDindividuals and healthy controls using a novel MRItechnique based on perfusion images obtained withcontinuous arterial spin labeling (CASL; Wang et al,2005). Continuous arterial spin labeling uses magne-tically labeled arterial blood water to endogenouslytrace and quantify regional changes in CBF as asurrogate marker reflecting underlying neural acti-vity and metabolism (Wang et al, 2005). Continuousarterial spin labeling allows for safe and economicalrepeated measurements with high stability acrosssessions (Floyd et al, 2003), and with sufficient test–
retest reliability for longitudinal investigations ofCBF (Petersen et al, 2010). The CASL data can beanalyzed using uni- and multivariate statisticaltechniques to explore disease-related network pat-terns (Eidelberg, 2009) in addition to regionallydefined differences of neural activity.
We investigated a group of preHD individuals andmatched controls to test the prediction that, inpreHD, rCBF differs in frontostriatal regions andwithin an a-priori frontostriatal CBF network ofinterest. We also expected to detect locally distrib-uted differences between preHD far and near tomotor onset if some of these differences reflect anongoing pathological process. In addition to CASL,high-resolution structural data were collected toaccount for potential effects of early brain atrophy,and we administered a neuropsychological testbattery to relate rCBF to cognitive performance.
Materials and methods
Subjects
We studied 18 right-handed participants with a moleculargenetic diagnosis of a CAG repeat expansion (X39) in theHuntingtin gene (Table 1) and a diagnostic confidencescore of p2 on the motor Unified Huntington’s DiseaseRating Scale (UHDRS, Huntington Study Group, 1996).All participants underwent a thorough neuropsychiatricexamination by clinicians experienced in HD (GBL andMO); this included the complete UHDRS, the BeckDepression Inventory and the 21-item Hamilton Depres-sion Rating Scale. PreHD participants with a history ofanother neurologic disorder, a history of head trauma, orlearning disabilities were excluded from the study. Inaddition, all participants underwent a semistructuredpsychiatric interview to exclude axis-I and axis-II disordersaccording to DSM-IV-TR (interview conducted by RCW).Only one preHD participant was on medication (venlafaxine,
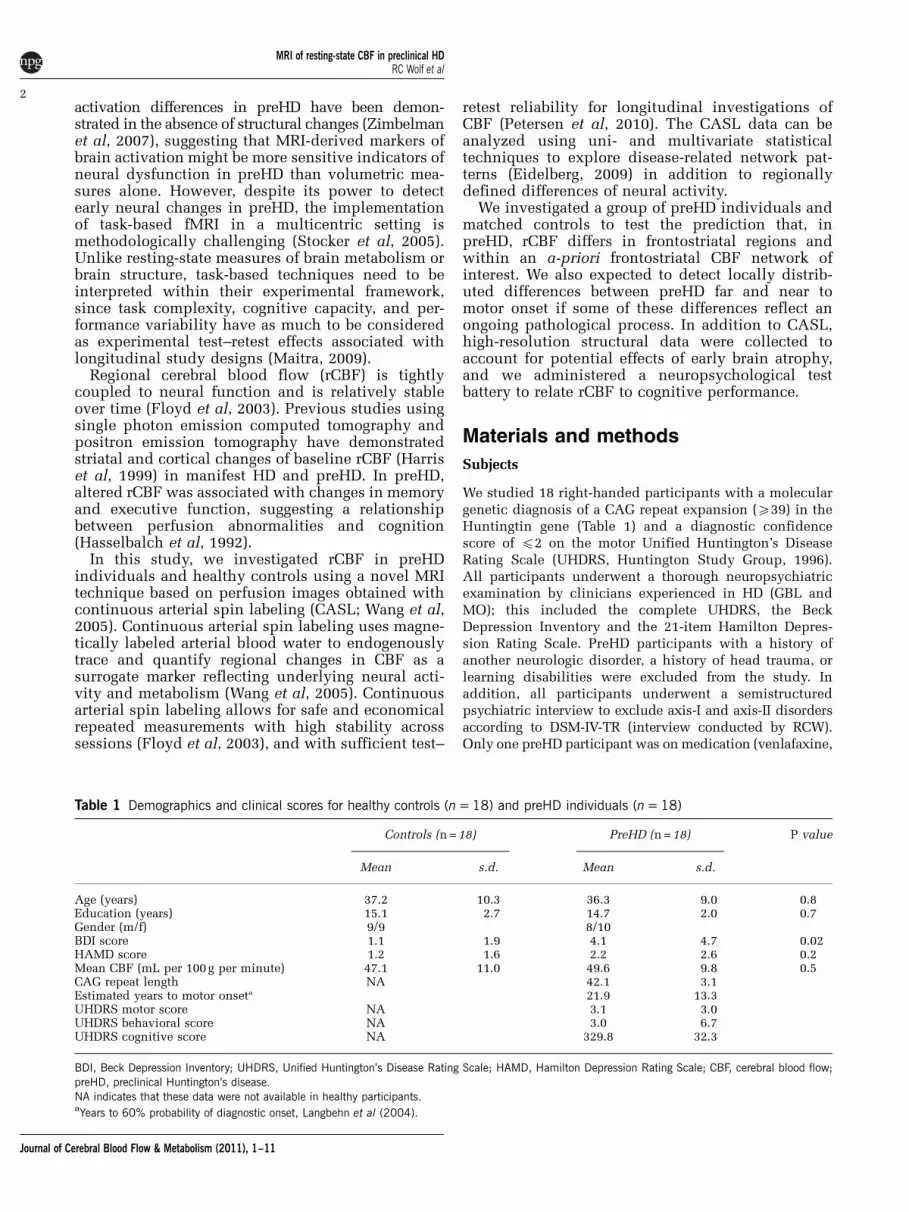
Table 1 Demographics and clinical scores for healthy controls (n = 18) and preHD individuals (n = 18)
Controls (n = 18) PreHD (n = 18) P value
Mean s.d. Mean s.d.
Age (years) 37.2 10.3 36.3 9.0 0.8Education (years) 15.1 2.7 14.7 2.0 0.7Gender (m/f) 9/9 8/10BDI score 1.1 1.9 4.1 4.7 0.02HAMD score 1.2 1.6 2.2 2.6 0.2Mean CBF (mL per 100 g per minute) 47.1 11.0 49.6 9.8 0.5CAG repeat length NA 42.1 3.1Estimated years to motor onseta 21.9 13.3UHDRS motor score NA 3.1 3.0UHDRS behavioral score NA 3.0 6.7UHDRS cognitive score NA 329.8 32.3
BDI, Beck Depression Inventory; UHDRS, Unified Huntington’s Disease Rating Scale; HAMD, Hamilton Depression Rating Scale; CBF, cerebral blood flow;preHD, preclinical Huntington’s disease.NA indicates that these data were not available in healthy participants.aYears to 60% probability of diagnostic onset, Langbehn et al (2004).
MRI of resting-state CBF in preclinical HDRC Wolf et al
2
Journal of Cerebral Blood Flow & Metabolism (2011), 1–11
mean daily dosage 150 mg). The ‘age-at-onset’ of motorsymptoms, i.e., the age at which the predicted probabilityof motor symptoms exceeds 0.6, was estimated using aformula based on age and CAG repeat length (Langbehnet al, 2004). PreHD participants were then assigned to twosubgroups: those farther (preHDfar) or closer (preHDnear),from onset than the median estimated time to motorsymptom onset ( = 18.7 years). The healthy control groupconsisted of 18 right-handed subjects matched for age,education, and handedness. Subjects with a neurologicor a psychiatric disorder according to DSM-IV-TR criteria,substance abuse or dependence were excluded. The projectwas approved by the local Institutional Review Board.Written informed consent was obtained from all partici-pants after a complete description of the study.
Neuropsychological Assessment
A neuropsychological test battery assessed variousdomains of frontostriatal function. This battery consistedof seven tests that assessed alertness, divided attention(DA), verbal and spatial working memory, executivefunction and inhibition processes. Divided attention wasmeasured using a computerized DA test from a standar-dised test battery (Zimmermann and Fimm, 1994). Verbaland spatial working memory tests included the digit andspatial span, where both domains were tested forward andbackward (12 verbal or 9 spatial items, presented at 1 Hz).Executive function was tested using a computerizedversion of the Wisconsin Card Sorting Test (WCST). ThisWCST variant consisted of 48 cards and a maximum of 5category switches. Inhibition was tested by a computerizedversion of the Stroop Word-Color Interference Test based onrandomized single trials (20 trials per color and condition).
Performance measures were recorded as follows: (1) DA:mean reaction times (in ms) of correctly identified targetsas well as the absolute and number of omitted targets(DA-om); (2) verbal span: number of correctly recalleditems in forward and backward direction; (3) spatial span:number of correctly recalled items in forward and back-ward direction; (4) WCST-P: number of perseverative errors(WCST-P), number of total errors (WCST-err) and adjustedswitch costs after the procedure by Spitzer et al (2001)(WCST-sc, given in seconds); (5) Stroop test: mean reactiontimes of correctly identified targets (Stroop reaction timesin ms) as well as the difference of errors in the incongruentand congruent Stroop conditions (Stroop-Err). Differencesbetween controls and preHD individuals were assessed bycalculating 11 separate t-tests (nominal level of a: P < 0.05).To avoid a-error accumulation, all t-tests were assessedwith Bonferroni-adjusted level of a: corrected (P < 0.005).
Continuous Arterial Spin labeling Magnetic ResonanceImaging
Data acquisition: Continuous arterial spin labeling brainvolumes were obtained with a 3-T Magnetom Allegra(Siemens, Erlangen, Germany) MRI system equipped witha head volume coil at the Department of Psychiatry andPsychotherapy III at the University of Ulm, Germany. The
MRI scanning was performed in darkness, and participantswere explicitly instructed to keep their eyes closed, relax,and not to think about anything special.
We opted to use MRI-based perfusion CASL because thismethod (1) appears better suited than blood oxygen level-dependent techniques for investigating slow changes inneural activity that could otherwise be biased by scannerdrifts, (2) has a high stability over long time scales, and (3)generates data that are statistically independent over timeunder the null hypothesis, i.e., the data do not possessautocorrelation (Detre and Wang, 2002). Technical detailson the CASL sequence used in this study were described inmore detail elsewhere (Wang et al, 2005). In brief, thelabeling plane was 8 cm beneath the center of the imagingsections. 20 radio frequency pulses of 100 ms duration anda gap of 7.5 ms were used for labeling. Mean duration ofeach control or labeling image acquisition was 2142.5 ms.To reduce transit-related effects a delay of 1 secondbetween the end of the labeling pulses and image acquisi-tion was introduced. Off-resonance artefacts were con-trolled by a sinusoidally amplitude-modulated versionof the labeling pulse. T2*-weighted interleaved label andcontrol images were acquired using a gradient echoecho-planar imaging sequence (matrix size: 64� 64 pixels,repetition time = 4 seconds, echo time = 16 ms, band-width = 3.005 Hz/Px). In all volumes, 18 transversalslices were positioned along the anterior commissure-posterior commissure (AC-PC) line (slice thickness =5 mm, 1.5 mm gap between slices). In-plane resolutionwas 3.44� 3.44 mm. The perfusion block for all partici-pants comprised 80 acquisitions of labeled and controlimages, with a duration of 320 seconds. Before the perfu-sion scan head positions were assessed with a localizerscan, followed by whole-brain shimming.
Data analysis: General Linear Model (GLM) analysis:Preprocessing and statistical analyses of perfusion datawere performed using Statistical Parametric Mapping(SPM5, Wellcome Department of Cognitive Neurology,London, UK; http://www.fil.ion.ucl.ac.uk) in combinationwith software implemented in MATLAB 7.3 (MathWorks,Natick, MA, USA) for use as a toolbox under SPM5. Thetoolbox code is based on an MATLAB script by HY Raoand JJ Wang from the Center for Functional Imaging atthe University of Pennsylvania (http://cfn.upenn.edu/perfusion/software.html) that implements a single com-partment CASL perfusion model (Wang et al, 2005) forreconstructing images of raw perfusion and quantifiedrCBF in units of mL per 100 g tissue per minute. The indi-vidual images underwent realignment to the first image tocorrect for head movements, reslicing, and generation ofperfusion-weighted images by pairwise subtraction of thelabel and control images, followed by conversion to quanti-fied rCBF. This procedure also incorporated the calculationof a mean echo-planar imaging by averaging across allacquired echo-planar imaging images and the coregistra-tion of the mean echo-planar imaging to individual T1image. The rCBF images were normalized to the canonicalMNI (Montreal Neurological Institute) space by applyingthe transformation matrices estimated from the normal-ization of the individual high-resolution T1-weighted MR
MRI of resting-state CBF in preclinical HDRC Wolf et al
3
Journal of Cerebral Blood Flow & Metabolism (2011), 1–11
images to a standard T1 template of 3� 3� 3 mm3 voxel.The normalized rCBF images were then smoothed with athree-dimensional 10 mm full-width at half-maximumGaussian kernel.
To prepare group comparisons of rCBF data individualmean rCBF images were computed for each subject withinthe framework of the GLM. To reduce spatially coherentnoise (Wang et al, 2003), volume-averaged, proportionallyscaled mean CBF values were used as a covariate in theindividual (first level) GLM analyses, where session meanswere computed per participant. During this analysis, aproportional scaling of the average CBF of each volumewas performed, such that the grand mean (average over allvolume averages over time) equaled 50 mL per 100 g perminute. Local or voxelwise variations in CBF were notaffected by this procedure. No temporal filtering wasinvolved. Group comparisons between healthy controls,far and near preHD individuals were conducted at thesecond level using the individual mean rCBF images. Ananalysis of variance (ANOVA) model was computed, whereage, gender, Beck Depression Inventory scores, and theindividual mean rCBF values were included as nuisancevariables. Inference of meaningful local group differenceswas based on a cluster extent (CE) of at least 70 contiguousvoxel, each significant at P < 0.005 (uncorrected). Allwhole-brain analyses were inclusively masked by astatistical parametric map comprising voxels with positiverCBF values that were significantly (P < 0.05) different fromzero when averaged across both groups of patients andcontrols.
CBF network analyses: CASL data were preprocessedusing SPM5 (Wellcome Department of Cognitive Neurol-ogy) and MATLAB 7.3 as described in the previous section.After normalization, a spatial independent componentanalysis was performed using a group independentcomponent analysis for fMRI toolbox (GIFT; http://icatb.sourceforge.net) (Correa et al, 2005). The dimensionality ofthe functional data for each subject was reduced usingthree consecutive steps of Principal Component Analysisalternated with data concatenation across subjects, result-ing in one aggregate mixing matrix for all the subjects. Anindependent component analysis decomposition using theInfomax algorithm was used to extract 11 independentcomponents (ICs), consisting of group spatial maps andrelated time courses. The minimum description lengthcriteria were used to estimate the order selection, i.e., thenumber of ICs (Li et al, 2007) from the unsmoothed datasets after taking into account the spatial and temporalcorrelation of the fMRI data. A set of effectively indepen-dent and identically distributed data samples was firstestimated for each subject through a subsampling algo-rithm, and the median of these values across the wholesample was used for order selection. The estimation of thenumber of the ICs performed directly on the data has beenproven to effectively reduce the occurrence of over/under-fitting the data (Li et al, 2007). The group estimated ICswere then back reconstructed into individual ICs using theaggregate mixing matrix created during the dimensionalitydata reduction steps. Given the neurobiological rele-vance of frontostriatal function in HD and prior reports ofthalamic abnormalities (Feigin et al, 2007) and altered
frontostriatal connectivity in preHD (Wolf et al, 2008a), wewere primarily interested in a circuit involving lateralprefrontal areas, the striatum, and the thalamus. In order toidentify this network of interest, the individual ICsconsisting of individual spatial independent maps andtime-courses were spatially sorted using the correlationwith an a-priori mask comprising left and right lateralprefrontal regions (Brodmann Area [BA] 9, 10, 44, 45, 46),the bilateral striatum (caudate nucleus and putamen) andthe bilateral thalamus. The spatial mask was computedusing the WFU (Wake Forest University) PickAtlas, Version2.3 (Maldjian et al, 2003).
One component of interest (COI) exhibiting a pattern oflateral prefrontal, striatal, and thalamic regions thatshowed the greatest spatial correlation (r = 0.17) with thefrontostriatal sorting mask was chosen for the second levelwithin- and between-group analyses. Before second levelanalyses, the individual COIs were smoothed with a 9-mmfull-width at half-maximum Gaussian kernel. The voxelweights for each subject’s spatial COI were used as randomeffects variables and analyzed on the second level usingSPM5. For within-group analyses, voxelwise one-samplet-tests against the null hypothesis of zero magnitude wereused to calculate within-group maps for each COI. Thestatistical threshold for these analyses was set at P < 0.001uncorrected for height and P < 0.05 corrected for spatialextent. For between-group comparisons, an ANOVA modelincluding age, gender, and Beck Depression Inventoryscores as nuisance variables was computed to comparespatial maps between healthy controls, preHDfar, andpreHDnear individuals. These analyses were masked by acombination of the main effects maps of both groups(P < 0.05). As for the GLM analyses, the statistical thresholdfor the between-group comparisons was set at P < 0.005(uncorrected at the voxel level, cluster-level correction of70 contiguous voxel).
Regions-of-interest analyses were conducted in additionto whole-brain data analysis. Here, we restricted ouranalyses to subcortical structures, where we included thebilateral caudate nucleus and the bilateral thalamus. Thefirst region was chosen since caudate pathology is a well-known finding in HD, the latter region was chosen givenreports of thalamic network abnormalities in preHD (Feiginet al, 2007). Regions-of-interest masks were computedusing the WFU PickAtlas. The mean rCBF cluster valueswere extracted using MarsBar (Brett et al, 2002) andsubsequently analyzed using the Statistica software pack-age (Version 6.0, StatSoft Inc., Tulsa, OK, USA).
Correlations with clinical scores and behavioral para-meters: Exploratory correlation analyses (P < 0.05) werecalculated between CAG repeat length, estimated years tosymptom onset, UHDRS scores, neuropsychological vari-ables and rCBF changes in preHD individuals. Correlationswere computed using the appropriate clinical and beha-vioral variables and the extracted rCBF values from theGLM analysis as well as the b parameters from theindependent component analysis (corresponding to thevoxel weights of the COI) from the maxima emerging fromthe between-group comparisons (see below). All correla-tions were conducted using the Statistica software package(Version 6.0, StatSoft Inc.).
MRI of resting-state CBF in preclinical HDRC Wolf et al
4
Journal of Cerebral Blood Flow & Metabolism (2011), 1–11
Structural Magnetic Resonance Imaging
Data acquisition: As for the CASL data, high-resolutionstructural data were acquired using a 3-T MagnetomAllegra (Siemens) head MRI system. The MRI parametersof the three-dimensional magnetization-prepared rapidgradient-echo (3D-MPRAGE) sequences were as follows:echo time = 3.93 ms; repetition time = 2080 ms; inversiontime = 1100 ms; field of view = 256 mm; slice plane = axial;slice thickness = 1 mm; resolution = 1.0� 1.0� 1.0 mm3;number of slices = 256.
Data analysis: Voxel-based morphometry (VBM; Ashbur-ner and Friston, 2000) analyses were performed with SPM5and MATLAB 7.3 (MathWorks). We used an extension ofSPM5, the VBM tools written by C Gaser (http://dbm.neuro.uni-jena.de/vbm). In brief, each participant’s originalimage was spatially normalized and segmented into grayand white matter. The images were resliced with1.0� 1.0� 1.0 mm3 voxel and then used for the groupcomparison of voxelwise gray matter volume (GMV)differences (Ashburner and Friston, 2000). The resultingGM images were smoothed with a Gaussian kernel of 8 mmfull-width at half-maximum, on which all between-groupanalyses were performed. To identify the brain regions ofGMV changes in preHD participants relative to the healthycontrols, a group ANOVA was performed where age,gender, and GMV were included as a nuisance covariatein all analyses. These analyses yielded statistical para-metric maps, based on threshold of P < 0.001 (uncorrectedat the voxel level, P < 0.05 cluster correction).
For all imaging data, all anatomical regions and denomi-nations are reported according to the atlas of Talairachand Tournoux (1988). Coordinates are maxima in a givencluster according to the MNI template.
Results
Participants
All groups, preHDnear, preHDfar and controls, weresimilar in age and years of education (Table 2). Therewere more women in the preHDnear group(w2, P < 0.01), CAG repeat length was higher and theestimated years to motor onset lower (P < 0.05, seealso Table 2). Beck Depression Inventory scores werehigher in preHD participants than in controls(P < 0.02), whereas Hamilton Depression Rating Scalescores did not significantly differ between the groups(see also Table 2).
Neuropsychological Assessment
Compared with healthy controls, preHD participantsshowed higher switch costs during WCST perfor-mance (P < 0.02; Table 3). However, this differencedid not survive the Bonferroni correction for multi-ple comparisons. No group differences were foundfor variables measuring DA, verbal and spatialworking memory, the total numbers of errors and
perseverative responses obtained from the WCST andbehavioral inhibition (see Table 3 for detailed resultsof the statistical analysis). When contrasted sepa-rately, switch costs during the WCST were higherfor preHDnear participants compared with controls(P < 0.04); however, this difference again did notsurvive correction for multiple comparisons. On allother assessments, controls, preHDnear, and pre-HDfar were similar.
Continuous Arterial Spin Labeling Between-GroupAnalyses
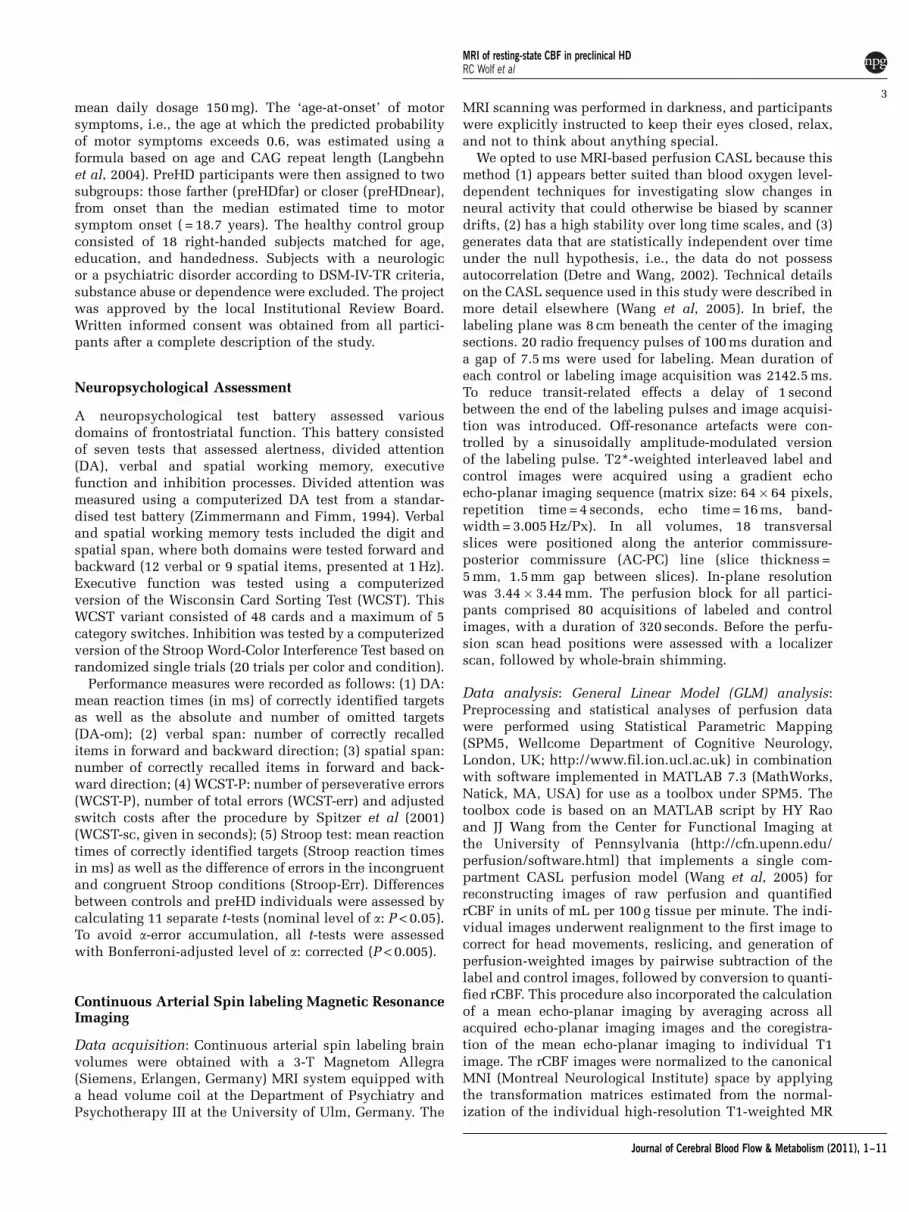
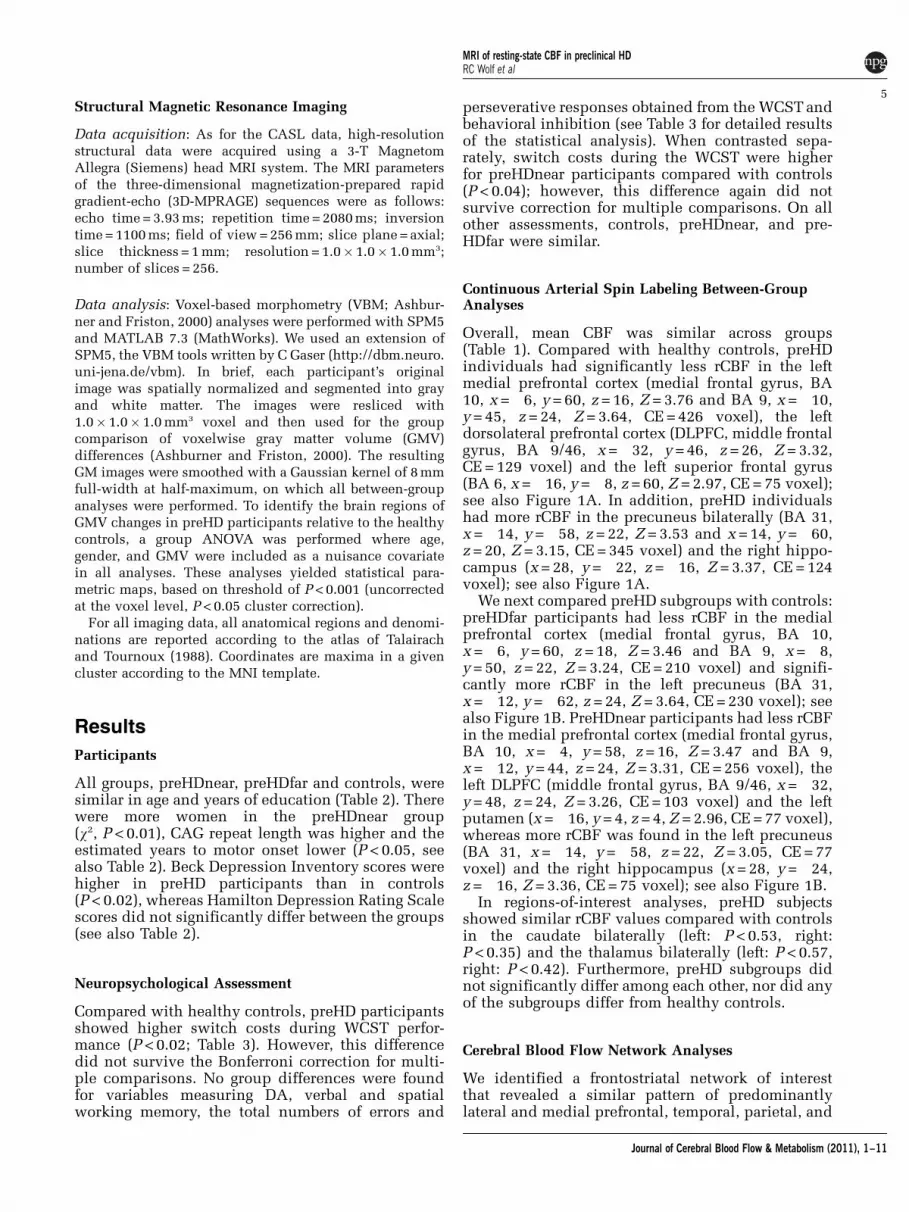
Overall, mean CBF was similar across groups(Table 1). Compared with healthy controls, preHDindividuals had significantly less rCBF in the leftmedial prefrontal cortex (medial frontal gyrus, BA10, x =�6, y = 60, z = 16, Z = 3.76 and BA 9, x =�10,y = 45, z = 24, Z = 3.64, CE = 426 voxel), the leftdorsolateral prefrontal cortex (DLPFC, middle frontalgyrus, BA 9/46, x =�32, y = 46, z = 26, Z = 3.32,CE = 129 voxel) and the left superior frontal gyrus(BA 6, x =�16, y =�8, z = 60, Z = 2.97, CE = 75 voxel);see also Figure 1A. In addition, preHD individualshad more rCBF in the precuneus bilaterally (BA 31,x =�14, y =�58, z = 22, Z = 3.53 and x = 14, y =�60,z = 20, Z = 3.15, CE = 345 voxel) and the right hippo-campus (x = 28, y =�22, z =�16, Z = 3.37, CE = 124voxel); see also Figure 1A.
We next compared preHD subgroups with controls:preHDfar participants had less rCBF in the medialprefrontal cortex (medial frontal gyrus, BA 10,x =�6, y = 60, z = 18, Z = 3.46 and BA 9, x =�8,y = 50, z = 22, Z = 3.24, CE = 210 voxel) and signifi-cantly more rCBF in the left precuneus (BA 31,x =�12, y =�62, z = 24, Z = 3.64, CE = 230 voxel); seealso Figure 1B. PreHDnear participants had less rCBFin the medial prefrontal cortex (medial frontal gyrus,BA 10, x =�4, y = 58, z = 16, Z = 3.47 and BA 9,x =�12, y = 44, z = 24, Z = 3.31, CE = 256 voxel), theleft DLPFC (middle frontal gyrus, BA 9/46, x =�32,y = 48, z = 24, Z = 3.26, CE = 103 voxel) and the leftputamen (x =�16, y = 4, z = 4, Z = 2.96, CE = 77 voxel),whereas more rCBF was found in the left precuneus(BA 31, x =�14, y =�58, z = 22, Z = 3.05, CE = 77voxel) and the right hippocampus (x = 28, y =�24,z =�16, Z = 3.36, CE = 75 voxel); see also Figure 1B.
In regions-of-interest analyses, preHD subjectsshowed similar rCBF values compared with controlsin the caudate bilaterally (left: P < 0.53, right:P < 0.35) and the thalamus bilaterally (left: P < 0.57,right: P < 0.42). Furthermore, preHD subgroups didnot significantly differ among each other, nor did anyof the subgroups differ from healthy controls.
Cerebral Blood Flow Network Analyses
We identified a frontostriatal network of interestthat revealed a similar pattern of predominantlylateral and medial prefrontal, temporal, parietal, and
MRI of resting-state CBF in preclinical HDRC Wolf et al
5
Journal of Cerebral Blood Flow & Metabolism (2011), 1–11
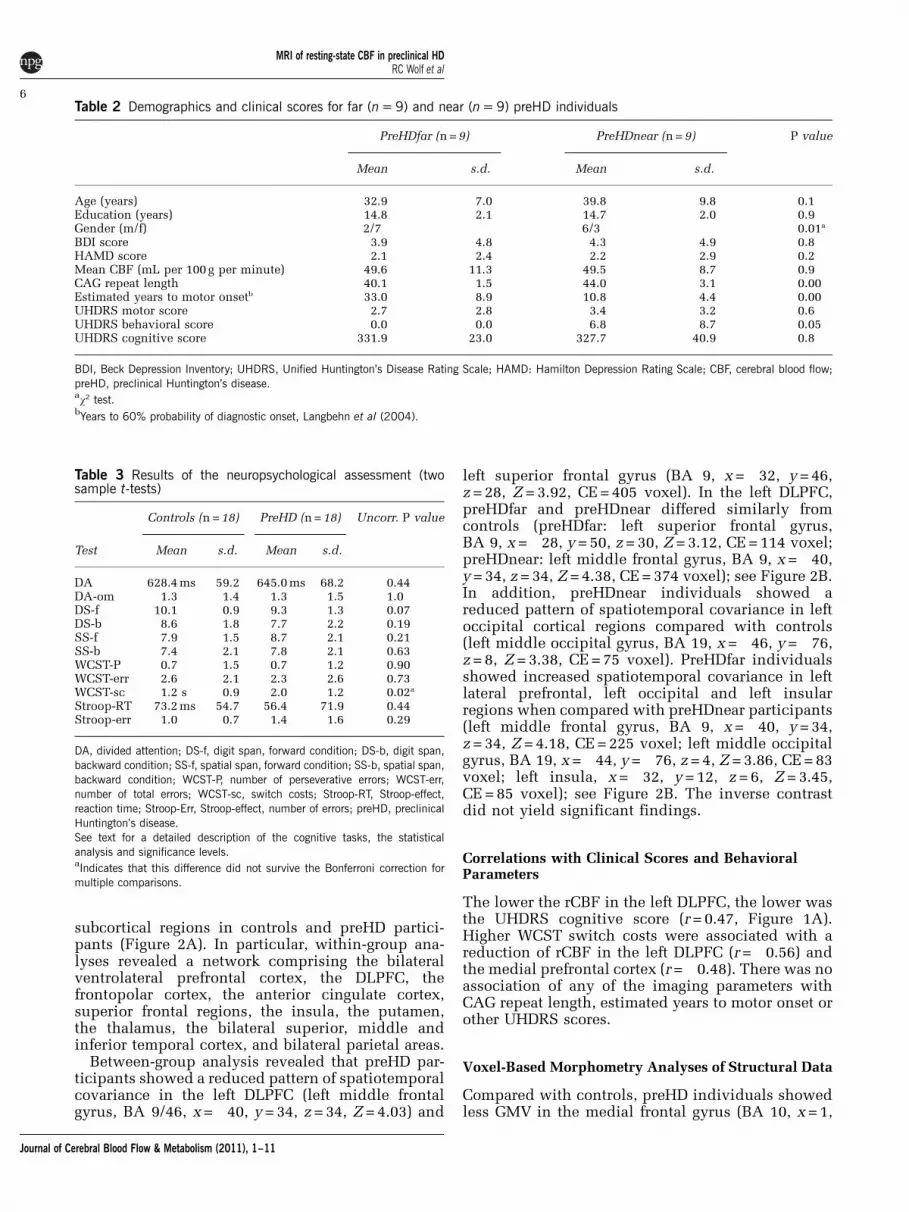
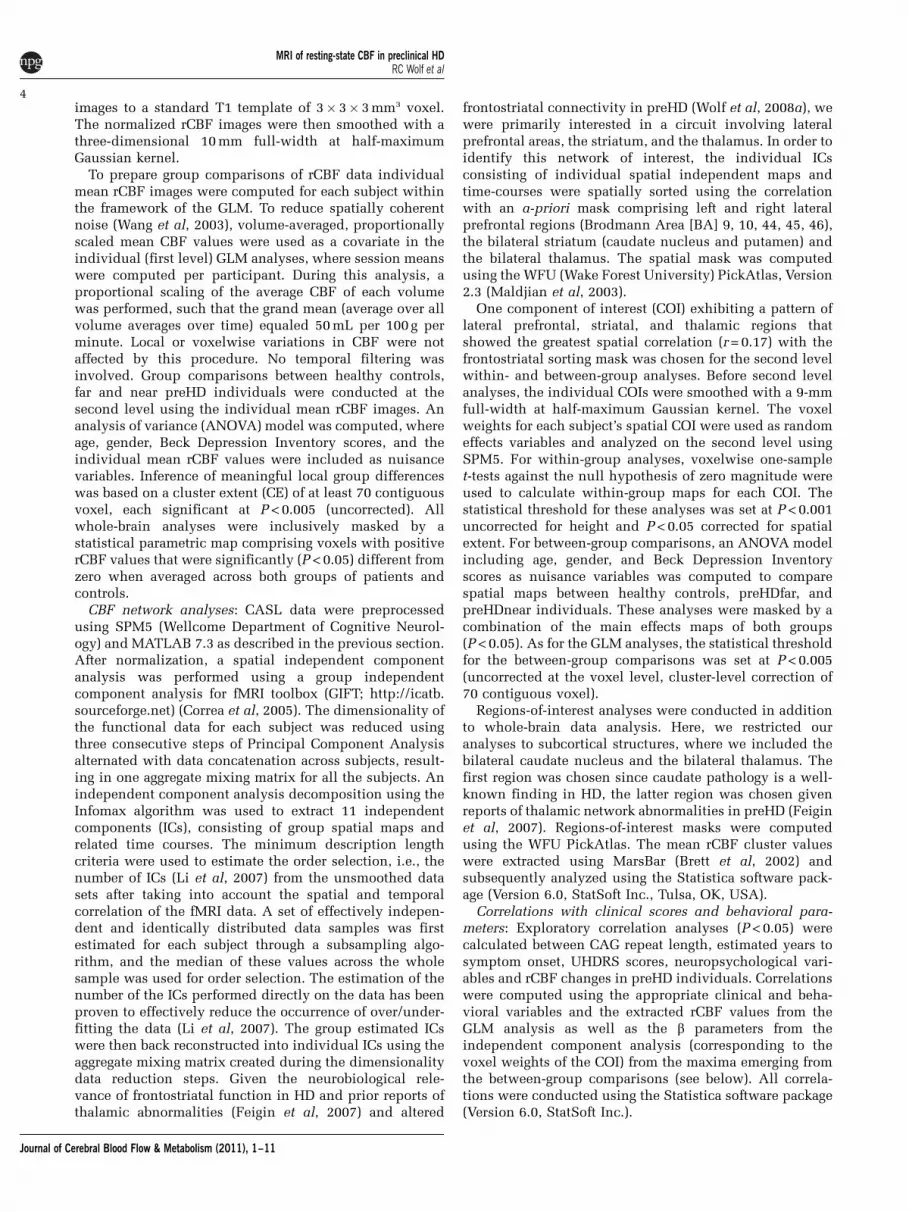
subcortical regions in controls and preHD partici-pants (Figure 2A). In particular, within-group ana-lyses revealed a network comprising the bilateralventrolateral prefrontal cortex, the DLPFC, thefrontopolar cortex, the anterior cingulate cortex,superior frontal regions, the insula, the putamen,the thalamus, the bilateral superior, middle andinferior temporal cortex, and bilateral parietal areas.
Between-group analysis revealed that preHD par-ticipants showed a reduced pattern of spatiotemporalcovariance in the left DLPFC (left middle frontalgyrus, BA 9/46, x =�40, y = 34, z = 34, Z = 4.03) and
left superior frontal gyrus (BA 9, x =�32, y = 46,z = 28, Z = 3.92, CE = 405 voxel). In the left DLPFC,preHDfar and preHDnear differed similarly fromcontrols (preHDfar: left superior frontal gyrus,BA 9, x =�28, y = 50, z = 30, Z = 3.12, CE = 114 voxel;preHDnear: left middle frontal gyrus, BA 9, x =�40,y = 34, z = 34, Z = 4.38, CE = 374 voxel); see Figure 2B.In addition, preHDnear individuals showed areduced pattern of spatiotemporal covariance in leftoccipital cortical regions compared with controls(left middle occipital gyrus, BA 19, x =�46, y =�76,z = 8, Z = 3.38, CE = 75 voxel). PreHDfar individualsshowed increased spatiotemporal covariance in leftlateral prefrontal, left occipital and left insularregions when compared with preHDnear participants(left middle frontal gyrus, BA 9, x =�40, y = 34,z = 34, Z = 4.18, CE = 225 voxel; left middle occipitalgyrus, BA 19, x =�44, y =�76, z = 4, Z = 3.86, CE = 83voxel; left insula, x =�32, y = 12, z = 6, Z = 3.45,CE = 85 voxel); see Figure 2B. The inverse contrastdid not yield significant findings.
Correlations with Clinical Scores and BehavioralParameters
The lower the rCBF in the left DLPFC, the lower wasthe UHDRS cognitive score (r = 0.47, Figure 1A).Higher WCST switch costs were associated with areduction of rCBF in the left DLPFC (r =�0.56) andthe medial prefrontal cortex (r =�0.48). There was noassociation of any of the imaging parameters withCAG repeat length, estimated years to motor onset orother UHDRS scores.
Voxel-Based Morphometry Analyses of Structural Data
Compared with controls, preHD individuals showedless GMV in the medial frontal gyrus (BA 10, x = 1,
Table 3 Results of the neuropsychological assessment (twosample t-tests)
Controls (n = 18) PreHD (n = 18) Uncorr. P value
Test Mean s.d. Mean s.d.
DA 628.4 ms 59.2 645.0 ms 68.2 0.44DA-om 1.3 1.4 1.3 1.5 1.0DS-f 10.1 0.9 9.3 1.3 0.07DS-b 8.6 1.8 7.7 2.2 0.19SS-f 7.9 1.5 8.7 2.1 0.21SS-b 7.4 2.1 7.8 2.1 0.63WCST-P 0.7 1.5 0.7 1.2 0.90WCST-err 2.6 2.1 2.3 2.6 0.73WCST-sc 1.2 s 0.9 2.0 1.2 0.02a
Stroop-RT 73.2 ms 54.7 56.4 71.9 0.44Stroop-err 1.0 0.7 1.4 1.6 0.29
DA, divided attention; DS-f, digit span, forward condition; DS-b, digit span,backward condition; SS-f, spatial span, forward condition; SS-b, spatial span,backward condition; WCST-P, number of perseverative errors; WCST-err,number of total errors; WCST-sc, switch costs; Stroop-RT, Stroop-effect,reaction time; Stroop-Err, Stroop-effect, number of errors; preHD, preclinicalHuntington’s disease.See text for a detailed description of the cognitive tasks, the statisticalanalysis and significance levels.aIndicates that this difference did not survive the Bonferroni correction formultiple comparisons.
Table 2 Demographics and clinical scores for far (n = 9) and near (n = 9) preHD individuals
PreHDfar (n = 9) PreHDnear (n = 9) P value
Mean s.d. Mean s.d.
Age (years) 32.9 7.0 39.8 9.8 0.1Education (years) 14.8 2.1 14.7 2.0 0.9Gender (m/f) 2/7 6/3 0.01a
BDI score 3.9 4.8 4.3 4.9 0.8HAMD score 2.1 2.4 2.2 2.9 0.2Mean CBF (mL per 100 g per minute) 49.6 11.3 49.5 8.7 0.9CAG repeat length 40.1 1.5 44.0 3.1 0.00Estimated years to motor onsetb 33.0 8.9 10.8 4.4 0.00UHDRS motor score 2.7 2.8 3.4 3.2 0.6UHDRS behavioral score 0.0 0.0 6.8 8.7 0.05UHDRS cognitive score 331.9 23.0 327.7 40.9 0.8
BDI, Beck Depression Inventory; UHDRS, Unified Huntington’s Disease Rating Scale; HAMD: Hamilton Depression Rating Scale; CBF, cerebral blood flow;preHD, preclinical Huntington’s disease.aw2 test.bYears to 60% probability of diagnostic onset, Langbehn et al (2004).
MRI of resting-state CBF in preclinical HDRC Wolf et al
6
Journal of Cerebral Blood Flow & Metabolism (2011), 1–11
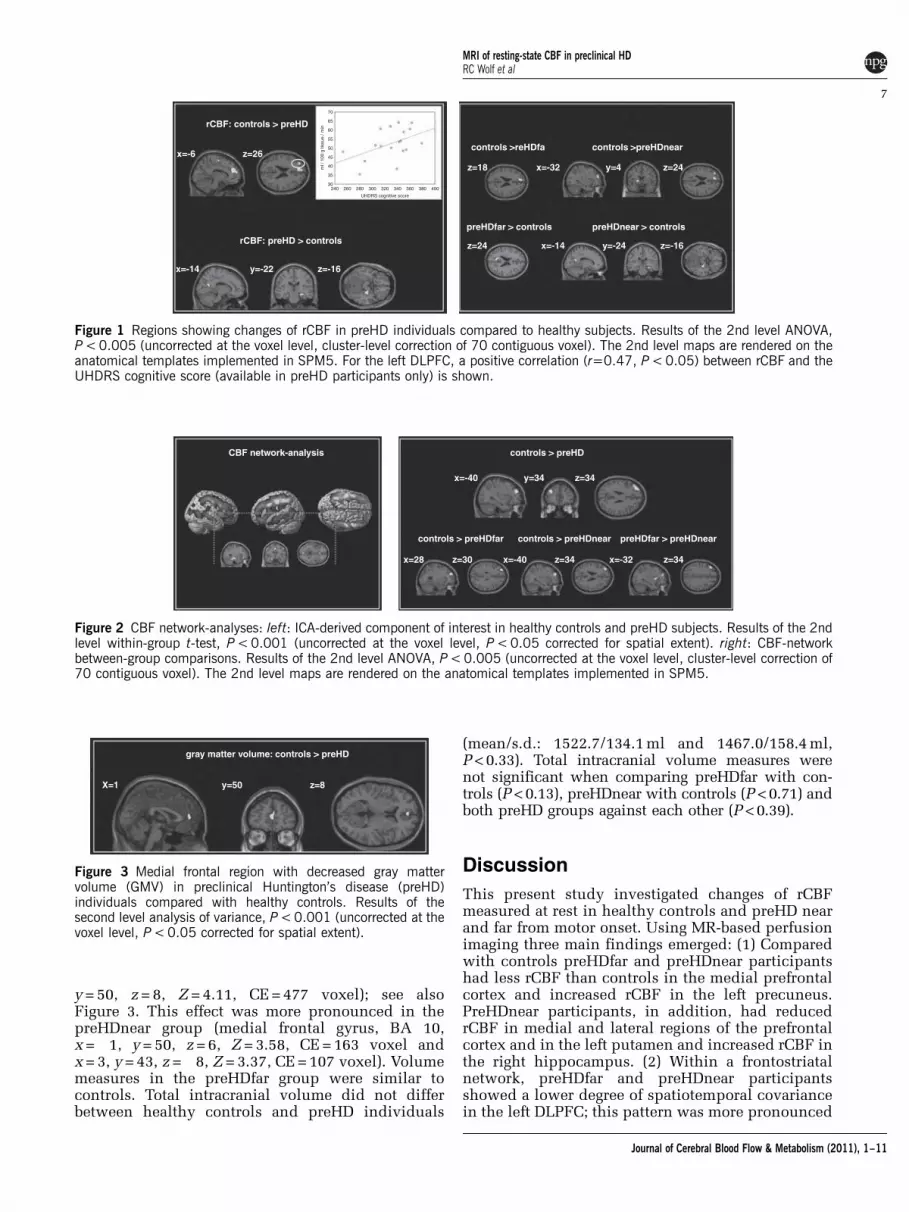
y = 50, z = 8, Z = 4.11, CE = 477 voxel); see alsoFigure 3. This effect was more pronounced in thepreHDnear group (medial frontal gyrus, BA 10,x =�1, y = 50, z = 6, Z = 3.58, CE = 163 voxel andx = 3, y = 43, z =�8, Z = 3.37, CE = 107 voxel). Volumemeasures in the preHDfar group were similar tocontrols. Total intracranial volume did not differbetween healthy controls and preHD individuals
(mean/s.d.: 1522.7/134.1 ml and 1467.0/158.4 ml,P < 0.33). Total intracranial volume measures werenot significant when comparing preHDfar with con-trols (P < 0.13), preHDnear with controls (P < 0.71) andboth preHD groups against each other (P < 0.39).
Discussion
This present study investigated changes of rCBFmeasured at rest in healthy controls and preHD nearand far from motor onset. Using MR-based perfusionimaging three main findings emerged: (1) Comparedwith controls preHDfar and preHDnear participantshad less rCBF than controls in the medial prefrontalcortex and increased rCBF in the left precuneus.PreHDnear participants, in addition, had reducedrCBF in medial and lateral regions of the prefrontalcortex and in the left putamen and increased rCBF inthe right hippocampus. (2) Within a frontostriatalnetwork, preHDfar and preHDnear participantsshowed a lower degree of spatiotemporal covariancein the left DLPFC; this pattern was more pronounced
rCBF: controls > preHD
controls >reHDfa controls >preHDnear x=-6 z=26
z=18 x=-32 y=4 z=24
rCBF: preHD > controls
preHDfar > controls preHDnear > controls
z=24 x=-14 y=-24 z=-16
x=-14 y=-22 z=-16
Figure 1 Regions showing changes of rCBF in preHD individuals compared to healthy subjects. Results of the 2nd level ANOVA,P < 0.005 (uncorrected at the voxel level, cluster-level correction of 70 contiguous voxel). The 2nd level maps are rendered on theanatomical templates implemented in SPM5. For the left DLPFC, a positive correlation (r=0.47, P < 0.05) between rCBF and theUHDRS cognitive score (available in preHD participants only) is shown.
controls > preHDCBF network-analysis
controls > preHDfar preHDfar > preHDnearcontrols > preHDnear
x=-40
x=28 x=-40 z=34 z=34x=-32z=30
y=34 z=34
Figure 2 CBF network-analyses: left: ICA-derived component of interest in healthy controls and preHD subjects. Results of the 2ndlevel within-group t-test, P < 0.001 (uncorrected at the voxel level, P < 0.05 corrected for spatial extent). right: CBF-networkbetween-group comparisons. Results of the 2nd level ANOVA, P < 0.005 (uncorrected at the voxel level, cluster-level correction of70 contiguous voxel). The 2nd level maps are rendered on the anatomical templates implemented in SPM5.
gray matter volume: controls > preHD
X=1 y=50 z=8
Figure 3 Medial frontal region with decreased gray mattervolume (GMV) in preclinical Huntington’s disease (preHD)individuals compared with healthy controls. Results of thesecond level analysis of variance, P < 0.001 (uncorrected at thevoxel level, P < 0.05 corrected for spatial extent).
MRI of resting-state CBF in preclinical HDRC Wolf et al
7
Journal of Cerebral Blood Flow & Metabolism (2011), 1–11
in preHDnear than preHDfar individuals. (3) Pre-HDnear, but not preHDfar participants had less GMVin the medial frontal cortex when compared withcontrols. However, structural changes revealed byVBM were not associated with lateral prefrontal,striatal, or hippocampal changes in brain perfusionat rest. Our data indicate that there are cleardifferences between preHD and controls in arterialblood flow without concomitant structural changes.Continuous arterial spin labeling may thus be auseful noninvasive tool for new neurobiologicalmarkers in HD.
Measuring CBF can help assess brain activity, achange of which is expected in the course of theneurodegenerative process of HD. In the presentstudy, brain perfusion at rest was measured usingMRI-based CASL. This technique requires consider-ably less time than task-based fMRI, does not use anyradioactive substances and can be easily implemen-ted at several sites (Petersen et al, 2010). Continuousarterial spin labeling quantifies regional changes inCBF as a surrogate marker for underlying neuralactivity and metabolism. Using this approach, wecould show rCBF measures differed between controlsand preHD subgroups in the striatum but also in themedial and lateral prefrontal cortex. The involve-ment of the frontal cortex is in good accordance withprevious neuropathological, metabolic, structuraland functional neuroimaging findings (Kloppelet al, 2009b; Paulsen, 2009). Interestingly, reducedrCBF in our preHDfar group involved regions of thefrontal cortex only, whereas blood flow in striatalareas was normal. In contrast, in preHDnear rCBFwas reduced in the putamen suggesting that striatalblood flow changes when mutant HTT gene carriersapproach motor onset. A previous study by Harriset al (1999) reported that putaminal blood flow wasreduced to a similar degree in preHD far and nearfrom motor onset. However, that study includedpreHD individuals 6.1±6.2 years from estimatedmotor onset, whereas our group was substantiallyfarther from the motor onset (21.9±13.3 years). Thenotion that striatal blood flow may only declinewhen approaching motor onset is further supportedby structural imaging (Aylward, 2007), and by fMRIstudies showing more pronounced loss of striatalconnectivity with closer proximity to motor onset(Wolf et al, 2008b). Another region with a progressiveloss of rCBF as HD gene mutation carriers approachmotor onset was the left DLPFC. We identifiedabnormal CBF patterns in regions of the prefrontalcortex that were associated with proximity to motoronset. In the preHDnear group, rCBF in the leftDLPFC was lower than in the preHDfar and controlgroups, both at the regional and at the network level.With the caveat of inferring from a cross-sectionalstudy this suggests the possibility of a progressiveloss of CBF in the prefrontal cortex as mutant HTTgene carriers approach motor onset. This finding isin line with left DLPFC hypoactivation in fMRI as aneural signature of regional dysfunction (Wolf et al,
2007) and decreased frontostriatal connectivity (Wolfet al, 2008b). Our present rCBF data extend on theseobservations suggesting DLPFC physiology is alreadyabnormal at rest. Taken together, these data indicatethat changes in the prefrontal cortex might representan early and robust marker of neural dysfunction inpreHD.
Importantly, regions with altered perfusion werenot substantially linked to volume loss. Lateralprefrontal and putaminal blood flow in preHDnearwas lower without evidence for DLPFC and striatalatrophy in our VBM data. In addition, preHDfarindividuals had normal brain volumes in thepresence of abnormal rCBF patterns in prefrontalregions. Previous rCBF studies in manifest HD andpreHD could not clearly dissociate effects of brainatrophy from brain perfusion abnormalities (Harriset al, 1999), possibly due to issues with spatialresolution of the used techniques, and in conjunc-tion with limited availability of structural data.While striatal volume loss has been frequentlyshown in preHD individuals near to motor onset(Aylward, 2007), recent studies have also reportednormal striatal volumes in preHDfar cohorts (Hobbset al, 2010). Our data suggest that rCBF measurescould improve the sensitivity for detecting neuro-biological changes during early presymptomaticstages.
Regional cerebral blood flow was not only reducedbut also increased in preHD individuals comparedwith healthy controls. These increases were confinedto the left precuneus in both preHD subgroups.PreHDnear participants, in addition, had increasedrCBF in the right hippocampus. Structure andfunction of precuneus and hippocampus can beabnormal in preclinical and very early HD (Feiginet al, 2006; Voermans et al, 2004), and patterns ofincreased metabolism and brain activation in preHDhave been demonstrated by previous neuro-imaging studies (Feigin et al, 2006; Wolf et al,2007; Zimbelman et al, 2007). Patterns of enhancedactivation may reflect ‘compensatory’ neural pro-cesses, possibly paralleling striatal degeneration anda subsequent impairment of corticostriatal circuits(Paulsen et al, 2004; Saft et al, 2009). ‘Functionalcompensation’ in the presence of increased cognitivedemand has also been discussed (Kloppel et al,2009a; Wolf et al, 2007). However, given the absenceof specific instructions in our study we cannot suffi-ciently relate the findings of elevated rCBF patternsto a specific cognitive or affective process. Alterna-tively, it is also possible that increased levels of meta-bolism and activation could mirror a generalizedspreading of activity due to reduced regional specia-lization or differentiation (Rajah and D’Esposito,2005).
Finally, we related rCBF to clinical measures,where prefrontal perfusion was associated with theUHDRS cognitive score. This suggests that theprefrontal cortex hypoperfusion we measured usingCASL reflects the level of clinical function even
MRI of resting-state CBF in preclinical HDRC Wolf et al
8
Journal of Cerebral Blood Flow & Metabolism (2011), 1–11
though, in line with previous studies (Brandt et al,2008), the overall cognitive performance was normal.Interestingly, in preHD participants we also observedan association between higher WCST switch costsand lower rCBF in the left DLPFC and the medialprefrontal cortex. Switch costs have been used astime-dependent markers of cognitive flexibility dur-ing card sorting tasks (Spitzer et al, 2001), whichhave been related to the functional integrity offrontostriatal circuits (Monchi et al, 2001). Our resultsare in accordance with reports highlighting therelationship of corticostriatal rCBF and executiveperformance in HD (Hasselbalch et al, 1992), and inline with computational models of frontostriatalfunction in neurodegenerative disorders (Amos, 2000).
The precise neurobiological mechanisms ofresting-state brain perfusion changes in preHDcannot be resolved by the present study. The neuralphysiology might change reflecting different stages ofneural dysfunction in different transitional periodsof preHD. Brain volume loss could mirror bothincipient and overt cell loss, whereas functionalmeasures including rCBF may detect cell dysfunc-tion even earlier (Paulsen, 2009). Indeed, multiplelines of evidence suggest that deficits in corticalneurophysiology and morphology can precedeneuronal degeneration (Gutekunst et al, 1999).Metabolic changes and abnormal cellular processwithin cortical regions have been documented inpreHD (Ciarmiello et al, 2006), and loss of synapticproteins in cortical regions may contribute to abnor-mal metabolism and neurotransmission (DiProsperoet al, 2004). Other explanations for abnormal CBF inpreHD, such as a disturbance of nitric oxide andnitric oxide synthase systems, have been suggested(Deckel et al, 2002). However, the precise physio-logical underpinnings of cerebral perfusion changesin preHD clearly need further research.
Our results are potentially limited by the fact thatphysiological parameters influencing CBF, such asheart rate or oxygen saturation, could not be reliablymeasured for every participant for technical reasons.Also, there was no specific monitoring of CO2 since allparticipants included in this study neither showedclinical signs of lung dysfunction, nor reported ahistory of asthma or chronic obstructive pulmonarydisease. Given this clinical data, however, we con-sider states of hypercapnia and associated increases inCBF as unlikely. If acute fear or distress had led torespiratory stress during the perfusion scan one wouldhave expected that increases in breath rates had beenmost probably associated with states of hypocapnia,which in turn would have led to a decrease in overallCBF. However, mean CBF was similar across groups.Nevertheless, to regress out any unspecific changes inoverall CBF, the individual grand mean CBF averageswere included in the second level ANOVA. Moreover,the very distinct local pattern of regional CBFbetween-group differences does not support thatgroup differences were merely a consequence of anyunbalanced respiratory distress.
Taken together, our data suggest early, quantifiableresting-state CBF changes in preHD individuals atthe regional and neural network level. These changeswere most prominent in medial and lateral areas ofthe prefrontal cortex and were more pronouncedwith closer proximity to motor symptom onset. Leftprefrontal perfusion was associated with UHDRScognitive scores and executive processing, suggest-ing a link between prefrontal blood flow andcognitive performance. As shown by VBM analysesof structural data, the perfusion changes in preHDwere not substantially affected by early changes ofGMV. Continuous arterial spin labeling is a non-invasive and robust measure of resting-state rCBFwith high signal-to-noise ratio and short acquisitiontimes. Regional cerebral blood flow measures withCASL are stable over time and thus the within-subject variability is low. Continuous arterial spinlabeling may thus lend itself as a read out inmultisite studies including clinical trials. However,we acknowledge as a limitation of our study that weinfer from cross-sectional data. Hence, we proposethat CASL should be investigated more closely inlongitudinal studies for its biomarker suitability inHD.
Acknowledgements
The authors thank all participants and their familiesfor their time and interest in this study. The authorsare grateful to Jurn Wolf and Johanna Fischer fortheir assistance with data collection.
Disclosure/conflict of interest
The authors declare no conflict of interest.
References
Amos A (2000) A computational model of informationprocessing in the frontal cortex and basal ganglia. J CognNeurosci 12:505–19
Ashburner J, Friston KJ (2000) Voxel-based morphometry—the methods. Neuroimage 11:805–21
Aylward EH (2007) Change in MRI striatal volumes as abiomarker in preclinical Huntington’s disease. Brain ResBull 72:152–8
Brandt J, Inscore AB, Ward J, Shpritz B, Rosenblatt A,Margolis RL, Ross CA (2008) Neuropsychological defi-cits in Huntington’s disease gene carriers and correlatesof early ‘conversion’. J Neuropsychiatry Clin Neurosci20:466–72
Brett M, Anton J-L, Valabregue R, Poline J-B (2002) Regionof interest analysis using an SPM toolbox. Neuroimage16(2): abstract 497 (available on CD-ROM)
Ciarmiello A, Cannella M, Lastoria S, Simonelli M, Frati L,Rubinsztein DC, Squitieri F (2006) Brain white-mattervolume loss and glucose hypometabolism precede theclinical symptoms of Huntington’s disease. J Nucl Med47:215–22
MRI of resting-state CBF in preclinical HDRC Wolf et al
9
Journal of Cerebral Blood Flow & Metabolism (2011), 1–11
Correa N, Adali T, Yi-Ou L, Calhoun VD (2005) Comparisonof blind source separation algorithms for FMRI using anew Matlab toolbox: GIFT. Proc IEEE Int Conf Acoustics,Speech, Signal Processing 5:401–4
Deckel AW, Tang V, Nuttal D, Gary K, Elder R (2002)Altered neuronal nitric oxide synthase expressioncontributes to disease progression in Huntington’sdisease transgenic mice. Brain Res 939:76–86
Detre JA, Wang J (2002) Technical aspects and utility offMRI using BOLD and ASL. Clin Neurophysiol 113:621–34
DiProspero NA, Chen EY, Charles V, Plomann M, KordowerJH, Tagle DA (2004) Early changes in Huntington’sdisease patient brains involve alterations in cyto-skeletal and synaptic elements. J Neurocytol 33:517–33
Eidelberg D (2009) Metabolic brain networks in neuro-degenerative disorders: a functional imaging approach.Trends Neurosci 32:548–57
Feigin A, Tang C, Ma Y, Mattis P, Zgaljardic D, Guttman M,Paulsen JS, Dhawan V, Eidelberg D (2007) Thalamicmetabolism and symptom onset in preclinical Hunting-ton’s disease. Brain 130:2858–67
Feigin AS, Ghilardi MF, Huang C, Yilong M, Carbon M,Guttman M, Paulsen JS, Ghez CP, Eidelberg D (2006)Preclinical Huntington’s disease: compensatory brainresponses during learning. Ann Neurol 59:53–9
Floyd TF, Ratcliffe SJ, Wang J, Resch B, Detre JA (2003)Precision of the CASL-perfusion MRI technique forthe measurement of cerebral blood flow in whole brain
and vascular territories. J Magn Reson Imaging 18:649–55
Gutekunst CA, Li SH, Yi H, Mulroy JS, Kuemmerle S,Jones R, Rye D, Ferrante RJ, Hersch SM, Li XJ (1999)Nuclear and neuropil aggregates in Huntington’s dis-ease: relationship to neuropathology. J Neurosci 19:2522–34
Harris GJ, Codori AM, Lewis RF, Schmidt E, Bedi A,Brandt J (1999) Reduced basal ganglia blood flow andvolume in pre-symptomatic, gene-tested persons at-riskfor Huntington’s disease. Brain 122(Part 9):1667–78
Hasselbalch SG, Oberg G, Sorensen SA, Andersen AR,Waldemar G, Schmidt JF, Fenger K, Paulson OB (1992)Reduced regional cerebral blood flow in Huntington’sdisease studied by SPECT. J Neurol Neurosurg Psychiatry55:1018–23
Hobbs NZ, Henley SM, Ridgway GR, Wild EJ, Barker RA,Scahill RI, Barnes J, Fox NC, Tabrizi SJ (2010) Theprogression of regional atrophy in premanifest andearly Huntington’s disease: a longitudinal voxel-basedmorphometry study. J Neurol Neurosurg Psychiatry81:756–63
Huntington-Study-Group (1996) Unified Huntington’s Dis-ease Rating Scale: reliability and consistency. MovementDisorders 11:136–42
Kloppel S, Draganski B, Siebner HR, Tabrizi SJ, Weiller C,Frackowiak RS (2009a) Functional compensation ofmotor function in pre-symptomatic Huntington’s dis-ease. Brain 132:1624–32
Kloppel S, Henley SM, Hobbs NZ, Wolf RC, Kassubek J,Tabrizi SJ, Frackowiak RS (2009b) Magnetic resonanceimaging of Huntington’s disease: preparing for clinicaltrials. Neuroscience 164:205–19
Langbehn DR, Brinkman RR, Falush D, Paulsen JS,Hayden MR (2004) A new model for prediction of theage of onset and penetrance for Huntington’s diseasebased on CAG length. Clin Genet 65:267–77
Li YO, Adali T, Calhoun VD (2007) Estimating thenumber of independent components for functionalmagnetic resonance imaging data. Hum Brain Mapp 28:1251–66
Maitra R (2009) Assessing certainty of activation orinactivation in test-retest fMRI studies. Neuroimage47:88–97
Maldjian JA, Laurienti PJ, Kraft RA, Burdette JH (2003) Anautomated method for neuroanatomic and cytoarchitec-tonic atlas-based interrogation of fMRI data sets. Neuro-image 19:1233–9
Monchi O, Petrides M, Petre V, Worsley K, Dagher A (2001)Wisconsin Card Sorting revisited: distinct neuralcircuits participating in different stages of the task iden-tified by event-related functional magnetic resonanceimaging. J Neurosci 21:7733–41
Paulsen JS (2009) Functional imaging in Huntington’sdisease. Exp Neurol 216:272–7
Paulsen JS, Zimbelman JL, Hinton SC, Langbehn DR,Leveroni CL, Benjamin ML, Reynolds NC, Rao SM(2004) fMRI biomarker of early neuronal dysfunctionin presymptomatic Huntington’s Disease. Am J Neuro-radiol 25:1715–21
Petersen ET, Mouridsen K, Golay X (2010) The QUASARreproducibility study, Part II: results from a multi-centerarterial spin labeling test-retest study. Neuroimage49:104–13
Rajah MN, D’Esposito M (2005) Region-specific changesin prefrontal function with age: a review of PET andfMRI studies on working and episodic memory. Brain128:1964–83
Saft C, Kosinski CM, Landwehrmeyer B (2009) [Progress inpremanifest and manifest diagnostics in Huntington’sdisease.]. Aktuelle Neurologie 36:506–23
Spitzer M, Franke B, Walter H, Buechler J, Wunderlich AP,Schwab M, Kovar K, Hermle L, Gron G (2001) Enantio-selective cognitive and brain activation effects ofN-ethyl-3,4-methylenedioxyamphetamine in humans.Neuropharmacology 41:263–71
Stocker T, Schneider F, Klein M, Habel U, Kellermann T,Zilles K, Shah NJ (2005) Automated quality assuranceroutines for fMRI data applied to a multicenter study.Hum Brain Mapp 25:237–46
Tabrizi SJ, Langbehn DR, Leavitt BR, Roos RA, Durr A,Craufurd D, Kennard C, Hicks SL, Fox NC, Scahill RI,Borowsky B, Tobin AJ, Rosas HD, Johnson H,Reilmann R, Landwehrmeyer B, Stout JC (2009)Biological and clinical manifestations of Huntington’sdisease in the longitudinal TRACK-HD study: cross-sectional analysis of baseline data. Lancet Neurol 8:791–801
Talairach J, Tournoux P (1988) Co-Planar Stereotaxic Atlasof the Human Brain. New York, NY: Thieme MedicalPublishers
Voermans NC, Petersson KM, Daudey L, Weber B,Van Spaendonck KP, Kremer HP, Fernandez G (2004)Interaction between the human hippocampus and thecaudate nucleus during route recognition. Neuron43:427–35
Vonsattel JP, Myers RH, Stevens TJ (1985) Neuropatho-logical classification of Huntington’s disease. J Neuro-pathol Exp Neurol 44:559–77
Wang J, Aguirre GK, Kimberg DY, Detre JA (2003) Empiricalanalyses of null-hypothesis perfusion FMRI data at 1.5and 4 T. Neuroimage 19:1449–62
Wang J, Zhang Y, Wolf RL, Roc AC, Alsop DC, Detre JA(2005) Amplitude-modulated continuous arterial spin-
MRI of resting-state CBF in preclinical HDRC Wolf et al
10
Journal of Cerebral Blood Flow & Metabolism (2011), 1–11

labeling 3.0-T perfusion MR imaging with a single coil:feasibility study. Radiology 235:218–28
Wolf RC, Sambataro F, Vasic N, Schonfeldt-Lecuona C,Ecker D, Landwehrmeyer B (2008a) Aberrant connec-tivity of lateral prefrontal networks in presymptomaticHuntington’s disease. Exp Neurol 213:137–44
Wolf RC, Sambataro F, Vasic N, Schonfeldt-Lecuona C,Ecker D, Landwehrmeyer B (2008b) Altered frontostriatalcoupling in pre-manifest Huntington’s disease: effects ofincreasing cognitive load. Eur J Neurol 15:1180–90
Wolf RC, Vasic N, Schonfeldt-Lecuona C, LandwehrmeyerGB, Ecker D (2007) Dorsolateral prefrontal cortexdysfunction in presymptomatic Huntington’s disease:evidence from event-related fMRI. Brain 130:2845–57
Zimbelman JL, Paulsen JS, Mikos AE, Reynolds NC,Hoffman RG, Rao SM (2007) fMRI detection of earlyneural dysfunction in preclinical Huntington’s disease.J Int NeuropsycholSoc 13:758–69
Zimmermann P, Fimm B (1994) Testbatterie zur Aufmerk-samkeitsprufung (TAP). Herzogenrath: Psytest
MRI of resting-state CBF in preclinical HDRC Wolf et al
11
Journal of Cerebral Blood Flow & Metabolism (2011), 1–11
Copyright © 2022 FDOKUMEN