Effect of arterial blood perfusion pressure on vascular ...
194
Effect of arterial blood perfusion pressure on vascular conductance and muscle blood flow at rest and exercise by Rodrigo Villar A thesis presented to the University of Waterloo in fulfillment of the thesis requirement for the degree of Doctor of Philosophy in Kinesiology Waterloo, Ontario, Canada, 2012 © Rodrigo Villar 2012
-
Upload
khangminh22 -
Category
Documents
-
view
0 -
download
0
Transcript of Effect of arterial blood perfusion pressure on vascular ...

Effect of arterial blood perfusionpressure on vascular conductance andmuscle blood flow at rest and exercise
by
Rodrigo Villar
A thesispresented to the University of Waterloo
in fulfillment of thethesis requirement for the degree of
Doctor of Philosophyin
Kinesiology
Waterloo, Ontario, Canada, 2012
© Rodrigo Villar 2012

I hereby declare that I am the sole author of this thesis. This is a true copy of the thesis,including any required final revisions, as accepted by my examiners.
I understand that my thesis may be made electronically available to the public.
ii

Abstract
The adaptations of vessel diameter represented by vascular conductance (VC), muscleblood flow (MBF) and oxygen delivery (DO2est) were investigated during rest and exerciseusing the effects of gravity to manipulate muscle perfusion pressure (MPP) by placingthe heart above (head-up tilt) and below (head-down tilt) the level of the muscle. Thisexperimental paradigm was used to explore VC and MBF regulation and related controlmechanisms during rest and exercise. Study 1 tested the repeatability of Doppler ultra-sound measurements of muscle blood flow velocity (MBV), arterial diameter, MBF andVC. The adaptations in VC and MBF (Study 2) and changes in anterograde and retro-grade MBV patterns (Study 3) were investigated during postural challenges at rest. Study4, determined the peak VC and its fractional recruitment during transitions from rest tolower (LPO) and higher power output (HPO) calf muscle exercise in HDT and HUT. Study5 investigated the combined effects of altered MPP and hypoxia during exercise. Duringrest-HDT, increases in VC compensated for the MPP reduction to maintain MBF, whilein rest-HUT, MBF was reduced. Following the start of LPO and HPO exercises, MBF andVC responses were delayed in HDT and accelerated in HUT. During LPO, MBF steady-state was reduced in HUT compared to horizontal (HOR), while the greater increase inVC during HDT maintained MBF at a similar level as HUT. Post-exercise MBF recoveredrapidly in all positions after LPO exercise but did not after HPOHDT. During HPOHDT,MBF was reduced despite the increase in VC, while in HPOHUT MBF was similar to thatin HPOHOR. The hypoxic challenge added in exercise was met during LPOHDT by in-creased VC to compensate reduced MPP and O2 availability such that MBF maintainedDO2est. However, during HPOHDT in hypoxia, VC reached maximal vasodilatory capacity,compromising MBF and DO2est. Together, these findings indicate that LPOHDT in nor-moxia or hypoxia VC increased to maintain MBF and DO2est, but during HPO functionallimitation for recruitment of VC constrained MBF and DO2 in normoxia and hypoxia.Elevated muscle electromyograpic signals in HPOHDT were consistent with challenged aer-obic metabolism. MPP reduction in HDT caused slower adaptation of MBF limiting O2
availability would result in a greater O2 deficit that could contribute to an increase in therelative stress of the exercise challenge and advance the onset of muscle fatigue.
iii

Acknowledgements
I would like to thank all the people who made this possible. I was blessed to have thisopportunity and be surrounded by many important people.
First, I would like to thank my supervisor Dr. Richard L. Hughson to accept me asstudent and for your support and patience during this journey.
I would like to thank my PhD Examining Committee, Drs. James Rush, Russ Tupling,Jack Goodman and Niels Bols for the insightful advice in this thesis document.
I acknowledge all of the awesome participants in the five studies of this thesis whogenerously donated their time.
I acknowledge the Brazilian Ministry of Education (CAPES) and the University ofWaterloo for the financial support.
My special thanks to Danielle Greaves not only for the excellent technical support, butfor the continuous encouragement and motivation. You are an angel. My infinite gratitudefor everything that you did for me.
To King Dave Northey, the time was not as long as I wanted but know that yourexample of how to deal with work and people in the lab has had a great impact on my lifeas person and researcher.
To Michael Williams Bell. You are a great friend. Thanks for all the fun and greatconversations and for always respecting me despite my limitations. My infinite gratitudeto you. You are a great man and I was honoured to have you as my Canadian friend.
Many thanks to my lab mates (all of you) for the support, encouragement, motivationand everything else.
Infinite thanks to Ruth Gooding for making all paper work easy through these years,and for always having a friendly smile even when I was bringing trouble.
I would like to thank Wendel Prime and Jeff Rice for built the equipment device usedin this thesis and also technical support and for making so many problems disappear.
I would like to thank Drs. Sebastiao Gobbi and Lilian Gobbi for always believing inme, for the support, encouragement and guidance. You both are source of inspiration andan example that I would like to follow as person and researcher.
I would like to thank Rupesh and Marcus. My gratitude for all the great moments,fun, support, motivation and conversations. You guys made this journey much more funand easier. Thank you boys.
iv

Dedication
This thesis is dedicated to:
(Essa tese e dedicada a):
In memory of my dad Valerio Villar (1941-2008). He was a great man, wonderfulhusband and father. I always would be proud to be your son.
Em memoria de meu pai Valerio Villar (1941-2008). Ele foi um grande homem, mar-avilhoso marido e pai. Eu sempre terei orgulho de ter sido seu filho.
My wonderful mother Ruth. Thank you for everything. Your constant support sincethe beginning made me the man that I am today. You always are a source of inspirationand deep admiration. Mommy you are the best.
Minha mame maravilhosa Ruth. Obrigado por tudo. Seu constante suporte desde dosprimeiros passos me fizeram o homem que sou hoje. Voce sempre e fonte de inspiracao eprofunda admiracao. Mamae voce e a melhor.
My awesome brother’s Rogerio and Romulo. Both of you always make me feel loved. Iam very lucky to have brothers like you. Thank you very much for the love, encouragement,support and friendship. You guys are the best.
Meus grandes irmaos Rogerio e Romulo. Voces dois sempre me fizeram sentir amado.Eu tenho muita sorte de ter irmaos como voces. Muito obrigado pelo amor, encouraja-mento, suporte e amizade. Voces sao os melhores.
My wonderful and great wife. Thank you for your love and to help me in this journey.As always, you guided me through the dark times with patience and love. You are thebest.
Minha maravilhosa e grande esposa. Obrigado por seu amor e ajuda nessa jornada.Como sempre, voce me guiou nos momentos mais dificeis com muita paciencia e amor.Voce e a melhor.
All my great friends. These people make my life better. You always help me to becomea better person. Thank you for being in my life.
Aos meus grandes amigos. Essas pessoas fazem minha vida melhor. Voces sempre meajudaram a me tornar uma pessoa melhor. Obrigado por fazerem parte da minha vida.
I love you all.
Eu amo todos voces
”Life is not about just what you want but how much you do to deserve it (Valrio Villar,2008)”
v

Table of Contents
Author’s Declaration ii
Abstract iii
Aknowledgements iv
Dedication v
Table of Contents vi
List of Tables xiii
List of Figures xv
List of Abreviations xxvi
1 General Introduction 1
1.1 Introduction . . . . . . . . . . . . . . . . . . . . . . . . . . . . . . . . . . . 1
1.2 Overview of Literature . . . . . . . . . . . . . . . . . . . . . . . . . . . . . 5
1.2.1 Effects of altered arterial perfusion pressure on vascular conductanceand muscle blood flow at rest . . . . . . . . . . . . . . . . . . . . . 5
1.2.2 Muscle blood flow response during exercise . . . . . . . . . . . . . . 6
1.2.3 Muscle blood flow response during phase I . . . . . . . . . . . . . . 8
vi

1.2.4 Muscle blood flow during phase II response . . . . . . . . . . . . . . 9
1.2.5 Effects of altered arterial perfusion pressures on vascular conductanceand muscle blood flow during exercise . . . . . . . . . . . . . . . . . 10
1.2.6 Effects of hypoxia on vascular conductance, muscle blood flow andoxygen delivery during exercise . . . . . . . . . . . . . . . . . . . . 11
1.3 Objectives of this thesis . . . . . . . . . . . . . . . . . . . . . . . . . . . . 12
2 Repeatability of the muscle blood flow response at rest and exerciseduring body tilt using Doppler ultrasound 16
2.1 Overview . . . . . . . . . . . . . . . . . . . . . . . . . . . . . . . . . . . . . 17
2.2 Introduction . . . . . . . . . . . . . . . . . . . . . . . . . . . . . . . . . . . 18
2.3 Methods . . . . . . . . . . . . . . . . . . . . . . . . . . . . . . . . . . . . . 19
2.3.1 Participants . . . . . . . . . . . . . . . . . . . . . . . . . . . . . . . 19
2.3.2 Experimental Design . . . . . . . . . . . . . . . . . . . . . . . . . . 19
2.3.2.1 Resting Protocol . . . . . . . . . . . . . . . . . . . . . . . 20
2.3.2.2 Exercise Protocol . . . . . . . . . . . . . . . . . . . . . . . 20
2.3.3 Data Acquisition . . . . . . . . . . . . . . . . . . . . . . . . . . . . 21
2.3.4 Data Analysis . . . . . . . . . . . . . . . . . . . . . . . . . . . . . . 22
2.3.5 Statistical Analysis . . . . . . . . . . . . . . . . . . . . . . . . . . . 23
2.4 Results . . . . . . . . . . . . . . . . . . . . . . . . . . . . . . . . . . . . . . 24
2.4.1 Resting Protocol . . . . . . . . . . . . . . . . . . . . . . . . . . . . 24
2.4.2 Exercise Protocol . . . . . . . . . . . . . . . . . . . . . . . . . . . . 26
2.5 Discussion . . . . . . . . . . . . . . . . . . . . . . . . . . . . . . . . . . . . 29
2.5.1 Popliteal arterial diameter repeatability . . . . . . . . . . . . . . . . 29
2.5.2 Muscle blood flow velocity repeatability . . . . . . . . . . . . . . . 30
2.6 Conclusion . . . . . . . . . . . . . . . . . . . . . . . . . . . . . . . . . . . . 32
vii

3 Adaptations of lower limb vascular conductance and resting blood flowduring head-up and head-down postural challenge 33
3.1 Overview . . . . . . . . . . . . . . . . . . . . . . . . . . . . . . . . . . . . . 34
3.2 Introduction . . . . . . . . . . . . . . . . . . . . . . . . . . . . . . . . . . . 35
3.3 Methods . . . . . . . . . . . . . . . . . . . . . . . . . . . . . . . . . . . . . 36
3.3.1 Participants . . . . . . . . . . . . . . . . . . . . . . . . . . . . . . . 36
3.3.2 Experimental Design . . . . . . . . . . . . . . . . . . . . . . . . . . 36
3.3.3 Data Acquisition . . . . . . . . . . . . . . . . . . . . . . . . . . . . 37
3.3.4 Data Analysis . . . . . . . . . . . . . . . . . . . . . . . . . . . . . . 38
3.3.5 Statistical Analysis . . . . . . . . . . . . . . . . . . . . . . . . . . . 39
3.4 Results . . . . . . . . . . . . . . . . . . . . . . . . . . . . . . . . . . . . . . 39
3.5 Discussion . . . . . . . . . . . . . . . . . . . . . . . . . . . . . . . . . . . . 44
3.5.1 Local vascular responses in the transition from horizontal to head-down tilt . . . . . . . . . . . . . . . . . . . . . . . . . . . . . . . . . 44
3.5.2 Local vascular responses in the transition from horizontal to head-uptilt . . . . . . . . . . . . . . . . . . . . . . . . . . . . . . . . . . . . 45
3.5.3 Central cardiovascular responses . . . . . . . . . . . . . . . . . . . . 46
3.5.4 Methodological considerations and study limitations . . . . . . . . . 47
3.6 Conclusion . . . . . . . . . . . . . . . . . . . . . . . . . . . . . . . . . . . . 48
4 The changes in anterograde and retrograde muscle blood flow velocitypatterns during postural challenge 49
4.1 Overview . . . . . . . . . . . . . . . . . . . . . . . . . . . . . . . . . . . . . 50
4.2 Introduction . . . . . . . . . . . . . . . . . . . . . . . . . . . . . . . . . . . 51
4.3 Methods . . . . . . . . . . . . . . . . . . . . . . . . . . . . . . . . . . . . . 52
4.3.1 Participants . . . . . . . . . . . . . . . . . . . . . . . . . . . . . . . 52
4.3.2 Resting Protocol . . . . . . . . . . . . . . . . . . . . . . . . . . . . 52
4.3.3 Data Acquisition . . . . . . . . . . . . . . . . . . . . . . . . . . . . 52
4.3.4 Data Analysis . . . . . . . . . . . . . . . . . . . . . . . . . . . . . . 53
viii

4.3.5 Statistical Analysis . . . . . . . . . . . . . . . . . . . . . . . . . . . 54
4.4 Results . . . . . . . . . . . . . . . . . . . . . . . . . . . . . . . . . . . . . . 55
4.4.1 Muscle blood flow velocity patterns in different body positions . . . 55
4.4.2 Muscle blood flow velocity patterns in different body positions . . . 58
4.5 Discussion . . . . . . . . . . . . . . . . . . . . . . . . . . . . . . . . . . . . 59
4.5.1 Muscle blood flow velocity waveforms in different body positions . . 59
4.5.2 Patterns of the muscle blood flow velocity and vascular conductancein different body positions . . . . . . . . . . . . . . . . . . . . . . . 60
4.5.2.1 Head-down tilt . . . . . . . . . . . . . . . . . . . . . . . . 60
4.5.2.2 Head-up tilt . . . . . . . . . . . . . . . . . . . . . . . . . . 61
4.5.3 Limitations . . . . . . . . . . . . . . . . . . . . . . . . . . . . . . . 62
4.6 Conclusion . . . . . . . . . . . . . . . . . . . . . . . . . . . . . . . . . . . . 64
5 Effect of altered arterial perfusion pressure on vascular conductance andmuscle blood flow responses during exercise in humans 65
5.1 Overview . . . . . . . . . . . . . . . . . . . . . . . . . . . . . . . . . . . . . 66
5.2 Introduction . . . . . . . . . . . . . . . . . . . . . . . . . . . . . . . . . . . 67
5.3 Methods . . . . . . . . . . . . . . . . . . . . . . . . . . . . . . . . . . . . . 68
5.3.1 Participants . . . . . . . . . . . . . . . . . . . . . . . . . . . . . . . 68
5.3.2 Experimental Design . . . . . . . . . . . . . . . . . . . . . . . . . . 68
5.3.2.1 Peak vascular conductance protocols . . . . . . . . . . . . 69
5.3.2.2 Transitions from rest to exercise protocols . . . . . . . . . 69
5.3.3 Data Acquisition . . . . . . . . . . . . . . . . . . . . . . . . . . . . 71
5.3.4 Data Analysis . . . . . . . . . . . . . . . . . . . . . . . . . . . . . . 72
5.3.4.1 Peak vascular conductance . . . . . . . . . . . . . . . . . . 72
5.3.4.2 Transitions from rest to exercise . . . . . . . . . . . . . . . 74
5.3.4.3 Electromyography . . . . . . . . . . . . . . . . . . . . . . 74
5.3.5 Statistical Analysis . . . . . . . . . . . . . . . . . . . . . . . . . . . 75
ix

5.4 Results . . . . . . . . . . . . . . . . . . . . . . . . . . . . . . . . . . . . . . 76
5.4.1 Muscle blood flow velocity patterns in different body positions . . . 76
5.4.2 Transitions from rest to exercise in lower output tests . . . . . . . . 76
5.4.3 Transitions from rest to exercise in higher output tests . . . . . . . 78
5.4.4 Vascular conductance expressed as percentage of VCpeak . . . . . . 82
5.4.5 Muscle activity responses during exercise . . . . . . . . . . . . . . . 84
5.4.6 Normalized muscle blood flow by muscle activity . . . . . . . . . . . 85
5.4.7 MAP and HR responses during lower and higher power output exercises 86
5.5 Discussion . . . . . . . . . . . . . . . . . . . . . . . . . . . . . . . . . . . . 88
5.5.1 Peak Vascular Conductance . . . . . . . . . . . . . . . . . . . . . . 88
5.5.2 Baseline VC and MBF . . . . . . . . . . . . . . . . . . . . . . . . . 89
5.5.3 Adaptive responses of vascular conductance and muscle blood flowto exercise . . . . . . . . . . . . . . . . . . . . . . . . . . . . . . . . 90
5.5.4 Consequences of muscle blood flow to Metabolic Demand . . . . . . 92
5.6 Conclusion . . . . . . . . . . . . . . . . . . . . . . . . . . . . . . . . . . . . 93
6 Effects of altered arterial oxygen inspired fraction and arterial perfusionpressure on vascular conductance and muscle blood flow during exercisein humans 94
6.1 Overview . . . . . . . . . . . . . . . . . . . . . . . . . . . . . . . . . . . . . 95
6.2 Introduction . . . . . . . . . . . . . . . . . . . . . . . . . . . . . . . . . . . 96
6.3 Methods . . . . . . . . . . . . . . . . . . . . . . . . . . . . . . . . . . . . . 97
6.3.1 Participants . . . . . . . . . . . . . . . . . . . . . . . . . . . . . . . 97
6.3.2 Experimental Design . . . . . . . . . . . . . . . . . . . . . . . . . . 97
6.3.2.1 Altered arterial perfusion pressure and inspired O2 fractionexercise protocols . . . . . . . . . . . . . . . . . . . . . . . 98
6.3.3 Data Acquisition . . . . . . . . . . . . . . . . . . . . . . . . . . . . 99
6.3.4 Data Analysis . . . . . . . . . . . . . . . . . . . . . . . . . . . . . . 101
6.3.5 Statistical Analysis . . . . . . . . . . . . . . . . . . . . . . . . . . . 101
x

6.4 Results . . . . . . . . . . . . . . . . . . . . . . . . . . . . . . . . . . . . . . 102
6.4.1 Lower output tests responses under altered FIO2 . . . . . . . . . . . 102
6.4.2 Higher output tests responses under altered FIO2 . . . . . . . . . . 105
6.4.3 Vascular conductance expressed as percentage of the peak vascularconductance under altered FIO2 . . . . . . . . . . . . . . . . . . . . 108
6.4.4 Muscle activity responses during exercise . . . . . . . . . . . . . . . 110
6.4.5 Normalized muscle blood flow by muscle activity under altered FIO2 112
6.4.6 Q, MAP and HR responses during lower and higher power outputexercises during normoxia and hypoxia . . . . . . . . . . . . . . . . 114
6.5 Discussion . . . . . . . . . . . . . . . . . . . . . . . . . . . . . . . . . . . . 116
6.5.1 VC, MBF and DO2est responses during exercise: comparisons be-tween normoxia and hypoxia in the same body position . . . . . . . 116
6.5.1.1 Lower power output exercise . . . . . . . . . . . . . . . . . 116
6.5.1.2 Higher power output exercise . . . . . . . . . . . . . . . . 117
6.5.2 VC, MBF and DO2 responses during exercise: comparisons betweenbody positions under normoxia and hypoxia . . . . . . . . . . . . . 119
6.5.2.1 Lower power output exercise . . . . . . . . . . . . . . . . . 119
6.5.2.2 Higher power output exercise . . . . . . . . . . . . . . . . 120
6.6 Conclusion . . . . . . . . . . . . . . . . . . . . . . . . . . . . . . . . . . . . 122
7 General Discussion, Conclusions and Future Considerations 123
7.1 Summary of studies . . . . . . . . . . . . . . . . . . . . . . . . . . . . . . . 123
7.2 Resting vascular conductance and resting muscle blood flow responses fol-lowing tilt . . . . . . . . . . . . . . . . . . . . . . . . . . . . . . . . . . . . 126
7.3 Vascular conductance and muscle blood flow adaptive responses in exercise 128
7.3.1 7.2.1 At the onset of exercise . . . . . . . . . . . . . . . . . . . . . . 128
7.3.2 Exercise . . . . . . . . . . . . . . . . . . . . . . . . . . . . . . . . . 130
7.3.3 Hypoxic Exercise . . . . . . . . . . . . . . . . . . . . . . . . . . . . 132
7.4 Conclusion . . . . . . . . . . . . . . . . . . . . . . . . . . . . . . . . . . . . 134
7.5 Future Directions . . . . . . . . . . . . . . . . . . . . . . . . . . . . . . . . 135
xi

APPENDICES 137
A Repeatability of the muscle blood flow response at rest and exerciseduring body tilt using Doppler ultrasound 138
A.1 Resting . . . . . . . . . . . . . . . . . . . . . . . . . . . . . . . . . . . . . 139
A.2 Transition from rest to exercise (EX) . . . . . . . . . . . . . . . . . . . . . 144
A.3 Exercise experiments under altered O2 inspired fraction (hypoxia) . . . . . 147
B Equipment Design 150
B.1 Introduction . . . . . . . . . . . . . . . . . . . . . . . . . . . . . . . . . . . 151
B.1.1 Tilt table and resting protocol . . . . . . . . . . . . . . . . . . . . . 151
B.1.2 Tilt table and exercise protocol . . . . . . . . . . . . . . . . . . . . 154
References 158
xii

List of Tables
2.1 Participants’ characteristics related to age (years), height (cm) and bodymass (Kg). . . . . . . . . . . . . . . . . . . . . . . . . . . . . . . . . . . . . 19
2.2 MBV, ADpop, MBF and VC during baseline, HDT, HOR, and HUT withrespect to coefficient of variation during the rest protocol. . . . . . . . . . . 24
2.3 MBV, ADpop, MBF, VC and CV between two days of testing during lowerand higher power output during plantar flexion averaged over the last twominutes of exercise. . . . . . . . . . . . . . . . . . . . . . . . . . . . . . . . 27
3.1 MPP, ADpop, MBV, MBF and VC values at baseline and averaged datafrom 3 to 5min following tilting during HOR, HDT, and HUT conditions. . 40
3.2 SBP, DBP, MAP, Q, HR, SV, SVC and TPR values at baseline and averageddata from 3 to 5min following tilting during HOR, HDT, and HUT conditions. 43
4.1 MBVant, MBVret, MBVnet, MPP, ADpop and VC averaged in the last minuteof tilting during HOR, HDT, and HUT conditions. . . . . . . . . . . . . . 58
5.1 MBVpeak, ADpop, MBFpeak, MPP and VC responses during VCpeak protocolduring HOR, HDT and HUT conditions. . . . . . . . . . . . . . . . . . . . 76
5.2 Dynamic responses of MBF and VC during exercise in LPOHOR, LPOHDT
and LPOHUT. . . . . . . . . . . . . . . . . . . . . . . . . . . . . . . . . . . 78
5.3 Dynamic responses of MBF and VC during exercise in HPOHOR, HPOHDT
and HPOHUT. . . . . . . . . . . . . . . . . . . . . . . . . . . . . . . . . . . 80
5.4 MAP and HR at baseline, exercise (last 2min of exercise) and recovery(last minute) during LPOHDT, LPOHOR, LPOHUT, HPOHDT, HPOHOR andHPOHUT. . . . . . . . . . . . . . . . . . . . . . . . . . . . . . . . . . . . . 87
xiii

6.1 MBF, DO2est and VC at baseline, exercise (normoxia and hypoxia) andrecovery during LPOHOR, LPOHDT and LPOHUT conditions. . . . . . . . . 103
6.2 MBF, DO2est and VC at baseline, exercise (normoxia and hypoxia) andrecovery during HPOHOR, HPOHDT and HPOHUT conditions. . . . . . . . . 106
6.3 Q, MAP and HR in normoxia and hypoxia averaged during the last minuteof exercise during LPOHDT, LPOHOR, LPOHUT, HPOHDT, HPOHOR andHPOHUT. . . . . . . . . . . . . . . . . . . . . . . . . . . . . . . . . . . . . 115
A.1 MBV, ADpop, MBF and VC during baseline, HDT, HOR, and HUT withrespect to coefficient of variation during the rest protocol. . . . . . . . . . . 139
A.2 CV for MBV during lower power output exercise in (LPOHDT), (LPOHOR)and (LPOHUT) and higher power output exercise in (HPOHDT), (HPOHOR)and (HPOHUT) conditions during transitions from rest to exercise. . . . . . 146
A.3 CV for MBV during lower power output exercise in (LPOHDT), (LPOHOR)and (LPOHUT) and higher power output exercise in (HPOHDT), (HPOHOR)and (HPOHUT) conditions during hypoxic exercise. . . . . . . . . . . . . . . 149
xiv

List of Figures
1.1 Illustration of the dynamic response of MBF during moderate intensityplantar flexion exercise (data from the current study displayed consistentwith Shoemaker and Hughson, 1999 and Tschakovsky, Saunders, Webb, andO’Donnell, 2006.) . . . . . . . . . . . . . . . . . . . . . . . . . . . . . . . . 7
1.2 Illustration of the three parameters that are involved in a dynamic responseof MBF: (1) time delay (TD), (2) time constant (τ) and (3) gain (TG) (datafrom the current study displayed consistent with Tschakovsky, Saunders,Webb, and O’Donnell, 2006.) . . . . . . . . . . . . . . . . . . . . . . . . . 8
1.3 Illustration of possible mechanisms for control of muscle blood flow (MBF)through the popliteal artery in phase I and phase II following the startof exercise. During phase I, the main control mechanisms involved are:(1) changes in pressure gradient (∆P) due to muscle pump action and (2)changes in vascular conductance (VC) due to vasodilation. In phase II, themain mechanism considered is vasodilation that is probably controlled by:metabolic, endothelial-mediated, myogenic and neural factors (adapted fromShoemaker and Hughson, 1999.) . . . . . . . . . . . . . . . . . . . . . . . . 10
1.4 Resting protocol used to investigate the adaptations of the lower limb VCand resting MBF during HOR, HDT and HUT positions. Arrows indicatewere ADpop (popliteal arterial diameter) were taken. . . . . . . . . . . . . . 13
1.5 Exercising protocol used to test the impact of altered MPP on VC and MBFduring transitions from rest to plantar flexion exercise in HOR, HDT andHUT positions. Arrows indicate were ADpop (popliteal arterial diameter)were taken. . . . . . . . . . . . . . . . . . . . . . . . . . . . . . . . . . . . 14
xv

1.6 Exercising protocol used to investigate MBF, DO2 and VC responses duringsubmaximal calf exercise in HOR, HDT and HUT positions under alteredO2 inspired fraction (normoxia, FIO2 = 0.21 and hypoxia, FIO2 = 0.14).Arrows indicate were ADpop (popliteal arterial diameter) were taken. . . . 15
2.1 Muscle blood flow velocity (MBV) responses to changes in body positionacross two days of testing for HDT (A), HOR (B) and HUT (C). Linesindicate group response, symbols indicated the points at which repeatabilitywere performed and dashed vertical lines indicate transition from baselineto HDT and baseline to HUT. Bland-Altman plots during HDT (D), HOR(E), and HUT (F) comparing two days of testing at rest (Difference MBV= MBVDay1 − MBVDay2, Average = (MBVDay1 − MBVDay2)/2). Solidhorizontal lines show mean values and dashed horizontal lines represent 95%confidence limits. The symbols are offset for clarity. . . . . . . . . . . . . . 25
2.2 Muscle blood flow velocity (MBV) responses to dynamic plantar flexion ex-ercise across two days of testing during lower power output: LPOHDT (A),LPOHOR (B) and LPOHUT (C). Lines indicate group response, symbols in-dicate the points at which repeatability were performed and dashed verticallines indicate the start and cessation of exercise. Data are the mean ± SDanalyzed over the last two minutes of exercise. Bland-Altman plots duringlower power output: LPOHDT (D), LPOHOR (E) and LPOHUT (F) over thelast two minutes of exercise (Difference MBV = MBVDay1 − MBVDay2,Average = (MBVDay1 − MBVDay2)/2). Solid horizontal lines show meanvalues and dashed horizontal lines represent 95% confidence limits. Thesymbols are offset for clarity. . . . . . . . . . . . . . . . . . . . . . . . . . . 28
3.1 Resting protocol used to investigate the adaptations of the lower limb VCand resting MBF during HOR, HDT and HUT positions. Arrows indicatewere ADpop (popliteal arterial diameter) were taken. . . . . . . . . . . . . . 37
3.2 Comparison of MBF (A) and VC (B) responses during HOR, HDT and HUTpositions in steady-state at rest. Lines indicate the group responses, symbolsindicate the points at which statistical comparisons were performed (mean,n = 15) and dashed vertical lines indicate transitions from baseline to HDTand baseline to HUT. SD values were omitted and are found in Table 3.1.Statistically significant differences compared to: aHOR and bHDT, p<0.05.The symbols were offset for clarity. . . . . . . . . . . . . . . . . . . . . . . 41
xvi

4.1 Illustration of MBV profile taken from a single participant during rest in dif-ferent body positions: (A) head-down tilt (HDT); (B) horizontal (HOR) and(C) head-up tilt (HUT) using a non-imaging Doppler ultrasound. Duringthe cardiac cycle, there are anterograde (positive) and retrograde (negative)flow patterns related to the vascular resistance and downstream compliance. 55
4.2 Illustration of the Doppler ultrasound imaging of the anterograde (red) andretrograde flow (blue) in the popliteal artery during HOR and HDT takenfrom a single participant. Longitudinal views during anterograde flow inHOR (A) and HDT (B); longitudinal views during retrograde flow in HOR(C) and HDT (D); flow velocity profiles using colour Doppler ultrasoundimaging in HOR (E) and HDT (F); flow velocity profiles using non-imagingDoppler ultrasound in HOR (G) and HDT (H). . . . . . . . . . . . . . . . 57
4.3 Illustration of the Colour Doppler ultrasound images of the flow velocityprofiles consisting of anterograde flow (positive) and retrograde flow (nega-tive) in the popliteal artery during HOR and HDT without vein (A and C,respectively) and with the presence of the vein (B and D, respectively). . . 63
5.1 Exercising protocol used to test the impact of altered MPP on VC and MBFduring transitions from rest to plantar flexion exercise in HOR, HDT andHUT positions. Arrows indicate were ADpop (popliteal arterial diameter)were taken. . . . . . . . . . . . . . . . . . . . . . . . . . . . . . . . . . . . 70
5.2 Representative patterns of beat-by-beat muscle blood flow velocity wave-forms after cuff release in the peak vascular conductance (VCpeak) tests in(A) horizontal (HOR), (B) head-down tilt (HDT), (C) head-up tilt (HUT).Dashed lines indicate cuff release (cuff down) and rectangular dashed boxdepicts the three beats averaged to represent peak muscle blood flow velocity(MBVpeak). . . . . . . . . . . . . . . . . . . . . . . . . . . . . . . . . . . . 73
5.3 Example of isolation of complete cardiac cycles (onset of systole to end ofdiastole) during the relaxation phase of exercise for calculation of effectivevascular conductance (VCrelax). In this example, the average MBV over twocomplete cardiac cycles was used to calculate MBF which was divided bycorresponding average MPP (not shown) to yield VCrelax. . . . . . . . . . . 74
xvii

5.4 Time course of changes in MBF and VC during dynamic plantar flexionexercise performed in lower (A and B) and higher (C and D) power outputs.Lines indicate group response, symbols indicate the points at which statis-tical analysis were performed and dashed vertical lines indicate the startand cessation of exercise. Data are the mean analysed over 6 seconds timebins including contraction and relaxation phases of the duty cycles. SD wasomitted to improve data visualization, but are presented in the Table 5.2.If necessary symbols were offset for clarity. . . . . . . . . . . . . . . . . . . 81
5.5 Time course of changes in VCrelax (mL.min-1.mmHg-1) and %VCrelax as per-centage of change in vascular conductance response (%VCrelax =VCrelax/VCpeak×100)during dynamic plantar flexion exercise performed in lower (A) and higherpower outputs (C). Lines indicate group response, symbols indicate thepoints at which statistical analysis were performed and dashed vertical linesindicate the start and cessation of exercise. The bar graphs represent exer-cising VCrelax and %VCrelax during lower (B) and higher power outputs (D).Data are the mean ± SD analysed over the relaxation phases between mus-cle contraction phases of the duty cycles. Statistically significant comparedto: aHOR and bHDT (p < 0.05). If necessary symbols were offset for clarity. 83
5.6 Muscle activity in soleus, gastrocnemius medial head (GMH) and gastrocne-mius lateral head (GLH) during plantar flexion exercise during lower (A) andhigher power outputs (B) in horizontal (LPOHOR), head-down tilt (LPOHDT)and head-up tilt (LPOHUT) positions. Total muscle activity (C) was calcu-lated as the sum of the mean for soleus and gastrocnemius muscle groupsactivity as a percentage of MVC and EMGindex (D) was calculated as thesum of the mean for soleus and gastrocnemius muscle groups activity di-vided by the sum of the MVCs during plantar flexion exercise during lower(LPO) and higher power outputs (HPO) in horizontal (HOR), head-downtilt (HDT) and head-up tilt (HUT) positions. Data are the mean ± SD av-eraged in the last two minutes of exercise. Statistically significant comparedto: aHOR and bHUT (p < 0.05). . . . . . . . . . . . . . . . . . . . . . . . 85
5.7 Time course of changes in MBF/EMGindex during dynamic plantar flexionexercise performed in lower (A) and higher (B) power outputs. Symbolsindicate group response which statistical analysis was performed. Data arethe mean analyzed over 6 seconds time bins including contraction and relax-ation phases of the duty cycles. Statistically significant compare to: aHORand bHUT (p < 0.05). Symbols were offset for clarity. . . . . . . . . . . . . 86
xviii

6.1 Exercising protocol used to investigate MBF, DO2est and VC responses dur-ing submaximal calf exercise in HOR, HDT and HUT positions under alteredFIO2 (normoxia, FIO2 = 0.21 and hypoxia, FIO2 = 0.14). Arrows indicatewere ADpop (popliteal arterial diameter) were taken. . . . . . . . . . . . . . 99
6.2 Time course of changes in MBF (A), DO2est (B) and VC (C) during dynamicplantar flexion exercise performed in lower power output under normoxia(FIO2 = 0.21) and hypoxia (FIO2 = 0.14). Lines indicate group response,symbols indicate the points at which statistical analysis were performedand dashed vertical lines indicate the start, gas concentration shift and ces-sation of exercise. Data are the mean analysed over 6 second time binsincluding contraction and relaxation phases of the duty cycles. MBF (D),DO2est (E) and VC (F) during dynamic plantar flexion exercise performedin lower power output under normoxia and hypoxia. Data are the mean ±
SD averaged during the last minute of exercise in normoxia and hypoxia.Statistically significant compared to: aLPOHOR,
bLPOHDT and cLPOHUT innormoxia and dLPOHOR and eLPOHDT in hypoxia (p < 0.05). If necessarythe symbols were offset for clarity. . . . . . . . . . . . . . . . . . . . . . . . 104
6.3 Time course of changes in MBF (A), DO2est (B) and VC (C) during dynamicplantar flexion exercise performed in highber power output under normoxia(FIO2 = 0.21) and hypoxia (FIO2 = 0.14). Lines indicate group response,symbols indicate the points at which statistical analysis were performedand dashed vertical lines indicate the start, gas concentration shift and ces-sation of exercise. Data are the mean analysed over 6 second time binsincluding contraction and relaxation phases of the duty cycles. MBF (D),DO2est (E) and VC (F) during dynamic plantar flexion exercise performedin higher power output under normoxia and hypoxia. Data are the mean± SD averaged during the last minute of exercise in normoxia and hypoxia.Statistically significant compared to: aHPOHOR,
bHPOHDT and cHPOHUT innormoxia and dHPOHOR and eHPOHDT in hypoxia (p < 0.05). If necessarythe symbols were offset for clarity. . . . . . . . . . . . . . . . . . . . . . . . 107
xix

6.4 Time course of changes in VCrelax (mL.min-1.mmHg-1) and %VCrelax as per-centage of change in vascular conductance response (%VCrelax =VCrelax/VCpeak×100)during dynamic plantar flexion exercise performed in lower (A) and higherpower outputs (B) under normoxia (FIO2 = 0.21) and hypoxia (FIO2 =0.14). Lines indicate group response, symbols indicate the points at whichstatistical analysis were performed and dashed vertical lines indicate thestart and cessation of exercise. The bar graphs represent exercising VCrelax
and %VCrelax during lower (C) and higher power outputs (D) under nor-moxia and hypoxia. Data are the mean ± SD analysed over the relaxationphases between muscle contraction phases of the duty cycles in normoxiaand hypoxia. Statistically significant compared to: aHOR and bHDT andcHUT in normoxia and dHOR and eHDT in hypoxia (p < 0.05). If necessarysymbols were offset for clarity. . . . . . . . . . . . . . . . . . . . . . . . . . 109
6.5 (A) Muscle activity in soleus, (B) gastrocnemius medial head (GMH), (C)gastrocnemius lateral head (GLH), (D) total muscle activity (TMA) and(E) EMGindex during plantar flexion exercise during lower and higher poweroutputs under horizontal (HOR), head-down tilt (HDT) and head-up tilt(HUT) positions under normoxia (FIO2 = 0.21) and hypoxia (FIO2 = 0.14).Total muscle activity was calculated as the sum of the mean for soleus andgastrocnemius muscle groups activity as a percentage of MVC and EMGindex
was calculated as the sum of the mean for soleus and gastrocnemius musclegroups activity divided by the sum of the MVC for both workloads and forall body positions. Data are the mean ± SD averaged during the last minuteof exercise in normoxia and hypoxia. Statistically significant compared to:aHOR, bHDT and cHUT in normoxia and dHOR and eHDT in hypoxia (p< 0.05). . . . . . . . . . . . . . . . . . . . . . . . . . . . . . . . . . . . . . 111
xx

6.6 Time course of changes in MBF/EMGindex during dynamic plantar flexionexercise performed in lower (A) and higher (B) power outputs under nor-moxia (FIO2 = 0.21) and hypoxia (FIO2 = 0.14). Lines indicate groupresponse, symbols indicate the points at which statistical analysis wereperformed and dashed vertical lines indicate the start, gas concentrationshift and cessation of exercise. Data are the mean analysed over 6 secondtime bins including contraction and relaxation phases of the duty cycles.MBF/EMGindex during dynamic plantar flexion exercise performed in lower(C) and higher power output (D) under normoxia and hypoxia. Data arethe mean ± SD averaged during the last minute of exercise in normoxia andhypoxia. Statistically significant compared to: aHOR, bHDT and cHUT innormoxia and dHOR and eHDT in hypoxia (p < 0.05). If needed symbolswere offset for clarity. . . . . . . . . . . . . . . . . . . . . . . . . . . . . . . 113
7.1 Schematic illustration of the local peripheral mechanisms probably involvedin VC and MBF responses in HDT at rest. During HDT, VC increasedto fully compensate for the reduction in MPP to maintain MBF at thesame level as horizontal (control condition). The local peripheral (myogenicand venoarteriolar reflexes) and central cardiovascular reflexes (arterial andcardiopulmonary baroreceptors activity) mechanisms are involved in the VCresponse to promote vasodilation. . . . . . . . . . . . . . . . . . . . . . . . 126
7.2 Schematic illustration of the local peripheral mechanisms probably involvedin VC and MBF responses in HUT at rest. During HUT, VC decreasedin face of elevated MPP resulting in a reduction in MBF. The local pe-ripheral (myogenic and venoarteriolar reflexes) and central cardiovascularreflexes (arterial and cardiopulmonary baroreceptors activity) mechanismsare involved in the VC response to promote vasoconstriction. . . . . . . . . 127
7.3 Schematic illustration of the VC and MBF responses in HDT during exer-cise. In HDT, VC and MBF responses at the onset of exercise were delayeddue to the lack of contribution of the muscle pump and the greater vasodila-tion required in this position due to the greater accumulation of vasodilatormetabolites. . . . . . . . . . . . . . . . . . . . . . . . . . . . . . . . . . . . 129
7.4 Schematic illustration of the VC and MBF responses in HUT during exercise.In HUT, VC and MBF responses at the onset of exercise were accelerated dueto the combined effects of more efficient muscle pump and less requirementof vasodilation due to lower accumulation of vasodilator metabolites. . . . 130
xxi

7.5 Schematic illustration of the mechanisms probably involved in VC and MBFresponses in HDT and HUT during exercise in normoxia and hypoxia. . . . 133
A.1 The mean muscle blood flow velocity (MBV) responses to changes in bodyposition across four different trials for HDT (A), HOR (B) and HUT (C), twodays of testing for HDT (D), HOR (E) and HUT (F), and Bland-AltmanPlots during HDT (G), HOR (H), and HUT (I) comparing two days oftesting at rest. Lines indicate group response (mean ± SE, n =15). Dashedvertical line indicates transition from baseline to HDT and baseline to HUT.Solid horizontal lines show mean values and dashed horizontal lines represent95% confidence limits. . . . . . . . . . . . . . . . . . . . . . . . . . . . . . 140
A.2 The mean muscle blood flow (MBF) responses to changes in body positionacross four different trials for HDT (A), HOR (B) and HUT (C), two daysof testing for HDT (D), HOR (E) and HUT (F), and Bland-Altman Plotsduring HDT (G), HOR (H), and HUT (I) comparing two days of testing atrest. Lines indicate group response (mean ± SE, n =15). Dashed verticalline indicates transition from baseline to HDT and baseline to HUT. Solidhorizontal lines show mean values and dashed horizontal lines represent 95%confidence limits. . . . . . . . . . . . . . . . . . . . . . . . . . . . . . . . . 141
A.3 The mean vascular conductance (VC) responses to changes in body positionacross four different trials for HDT (A), HOR (B) and HUT (C), two daysof testing for HDT (D), HOR (E) and HUT (F), and Bland-Altman Plotsduring HDT (G), HOR (H), and HUT (I) comparing two days of testing atrest. Lines indicate group response (mean ± SE, n =15). Dashed verticalline indicates transition from baseline to HDT and baseline to HUT. Solidhorizontal lines show mean values and dashed horizontal lines represent 95%confidence limits. . . . . . . . . . . . . . . . . . . . . . . . . . . . . . . . . 142
A.4 Bland-Altman Plots for popliteal artery diameter (ADpop) during HDT (A),HOR (B), and HUT (C) comparing two day of testing at rest. Solid hor-izontal lines show mean values and dashed horizontal lines represent 95%confidence limits. . . . . . . . . . . . . . . . . . . . . . . . . . . . . . . . . 143
xxii

A.5 The mean muscle blood flow velocity (MBV) responses to dynamic plantarflexion exercise across two days of testing during LPOHDT (A), LPOHOR (B)and LPOHUT (C). Lines indicate group response and symbols indicate thepoints at which repeatability were performed. Dashed vertical lines indicatethe start and cessation of exercise. Data are the mean ± SE analysed over6 seconds time bins including contraction and relaxation phases of the dutycycles. Bland-Altman plots during LPOHDT (D), LPOHOR (E), and LPOHUT
(F) over the last 2min of exercise. Solid horizontal lines show mean valuesand dashed horizontal lines represent 95% confidence limits. . . . . . . . . 144
A.6 The mean muscle blood flow velocity (MBV) responses to dynamic plantarflexion exercise across two days of testing during HPOHDT (A), HPOHOR
(B) and HPOHUT (C). Lines indicate group response and symbols indicatethe points at which repeatability were performed. Dashed vertical lines in-dicate the start and cessation of exercise. Data are the mean ± SE analysedover 6 seconds time bins including contraction and relaxation phases of theduty cycles. Bland-Altman plots during HPOHDT (D), HPOHOR (E), andHPOHUT (F) over the last 2min of exercise. Solid horizontal lines show meanvalues and dashed horizontal lines represent 95% confidence limits. . . . . . 145
A.7 The mean muscle blood velocity (MBV) responses to dynamic plantar flex-ion exercise across two days of testing during LPOHDT (A), LPOHOR (B)and LPOHUT (C) under altered FIO2 (hypoxia). Lines indicate group re-sponse and symbols indicate the points at which Bland-Altman plots wereperformed. Lines indicate group response and symbols indicate the pointsat which repeatability were performed. Dashed vertical lines indicate thestart and cessation of exercise. Data are the mean ± SE analysed over 6seconds time bins including contraction and relaxation phases of the dutycycles. Bland-Altman plots during LPOHDT (D), LPOHOR (E), and LPOHUT
(F) over the last 2min of exercise. Solid horizontal lines show mean valuesand dashed horizontal lines represent 95% confidence limits. . . . . . . . . 147
xxiii

A.8 The mean muscle blood velocity (MBV) responses to dynamic plantar flex-ion exercise across two days of testing during HPOHDT (A), HPOHOR (B)and HPOHUT (C) under altered FIO2 (hypoxia). Lines indicate group re-sponse and symbols indicate the points at which Bland-Altman plots wereperformed. Lines indicate group response and symbols indicate the points atwhich repeatability were performed. Dashed vertical lines indicate the startand cessation of exercise. Data are the mean ± SE analysed over 6 secondstime bins including contraction and relaxation phases of the duty cycles.Bland-Altman plots during HPOHDT (D), HPOHOR (E), and HPOHUT (F)over the last 2min of exercise. Solid horizontal lines show mean values anddashed horizontal lines represent 95% confidence limits. . . . . . . . . . . . 148
B.1 Schematic illustration of the tilt table: (1) metal support; (2) metal frame;(3) wood support; (4) cushion and memory foam; (5) pedal system; (6) pivotpoint; (7) massage table head piece; (8) adjustable shoulder blocks; (9) armresting apparatus; (10) belt system (chest and hips); and (11) strap system. 152
B.2 Illustration of the tilt table during HDT at -35° angle (left side) and HUTat 45° angle (right side). . . . . . . . . . . . . . . . . . . . . . . . . . . . . 153
B.3 Illustration of the custom tilt table device with the participant. Participantsface on a (1) massage table head piece; (2) arm resting apparatus placed onthe side of the table with the shoulders and elbows positioned at approx-imately 90°; (3) shoulder blocks adjusted according to participants height;(4) chest and hip belts worn by the participants, and (5) strap system at-tached in the tilt table to help to avoid, as much as possible, participantsliding and provide optimal comfort, security and stability. . . . . . . . . . 154
B.4 Illustration of the tilt table connected to a footplate that allows participantsto perform plantar flexion exercise and MVC tests. (1) footplate support; (2)footplate; (3) point of rotation (participants ankle); (4) hook used to attachthe stainless steel cable with the footplate; (5) pulley system (3 pulleys); (6)load cell (MVC tests) or weight system (dynamic exercise tests); (7) lightsystem (visual feedback about the correct range of motion); and (8) stopperplaced at the end of the table. . . . . . . . . . . . . . . . . . . . . . . . . . 155
xxiv

B.5 Tilt table with the participants face on a (1) massage table head piece; (2)arm resting apparatus (shoulders and elbows positioned in approximately90°); (3) shoulder blocks (adjusted according to participants height); (4)footplate connection on a tilt table (plantar flexion exercise); (5) footplatestrap system (stability during motion and better contact between plantarsurface of the foot and footplate). . . . . . . . . . . . . . . . . . . . . . . . 156
B.6 Comparison of the EMG activity between horizontal (HOR, middle) com-pared to HUT without correction factor (HUT-NCF, top) and HUT withcorrection factor (HUT-CF, bottom).It was noticed that the EMG activitywas similar between HOR and HUT when the correction factor was applied,but EMG activity was lower without the correction factor. . . . . . . . . . 157
xxv

List of Abreviations
∆P Perfusion pressure gradient
Q Cardiac output
%VC Vascular conductance expresses as percentage
%VCpeak percentage of peak vascular conductance
a-vO2diff arterial-venous oxygen content difference
ACh acethylcoline
AD Arterial diameter
ADpop Popliteal artery diameter
ADP Adenosine diphosphate
AMPK adenosine monophosphate-activated protein kinase
AO2EX Altered oxygen during exercise
ATP Adenosine triphosphate
BP Blood pressure
CaO2 Arterial oxygen content
CO2 carbon dioxide
CV coefficient of variation
CvO2 venous oxygen content
xxvi

CVP central venous pressure
DBP Diastolic blood pressure
DO2est Estimated oxygen delivery
DO2 Oxygen delivery
EDHF endothelial-derived-hyperpolarization-factor
EMG Electromyography
EMGindex Electromyographyc index
EX Transitons from rest to exercise
FIO2 Inspired oxygen fractions
FFT Fast Fourier transformation
G Gain of the response
GLH Gastrocnemius lateral head
GMH Gastrocnemius medial head
H2O water
H+ Hydrogen ion
Hb Hemoglobin
HDT Head-down tilt
HOR Horizontal
HPO Higher power output
HPOHDT Higher power output in head-down tilt
HPOHOR Higher power output in horizontal
HPOHUT Higher power output in head-up tilt
HR Heart rate
xxvii

HUT Head-up tilt
iEMG Integrated EMG
K+ potassium ion
LBNP lower body negative pressure
LPO Lower power output
LPOHDT Lower power output in head-down tilt
LPOHOR Lower power output in horizontal
LPOHUT Lower power output in head-up tilt
MAP Mean arterial pressure
MBF Muscle blood flow
MBFpeak Peak muscle blood flow
MBFrelax Muscle blood flow during relaxation between muscle contractions
MBV Muscle blood flow velocity
MBVant Anterograde muscle blood flow velocity
MBVnet Muscle blood flow velocity
MBVpeak Peak muscle blood flow velocity
MBVret Retrograde muscle blood flow velocity
MPF Mean power frequency
MPP Muscle perfusion pressure
MPPpeak Peak muscle perfusion pressure
MPPrelax Muscle perfusion pressure during relaxation between muscle contractions
MVC Maximal voluntary contraction
MVF Maximal voluntary force
xxviii

NIRS near infrared spectroscopy
NMRS nuclear magnetic resonance spectroscopy
NO nitric oxide
O2 Oxygen
O2deficit Deficit of oxygen
PaO2 Arterial oxygen partial pressure
PCr phosphocreatine
PG prostaglandins
Pi Inorganic phosphate
PO2 Oxygen
SaO2 Arterial oxygen saturation
SBP Systolic blood pressure
SD Standard Deviation
SS Steady-state response
SV Stroke volume
SVC Systemic vascular conductance
T63% Time to reach 63% of the steady state response
TMA total muscle activity
TPR Total peripheral resistance
VC Vascular conductance
VCpeak Peak vascular conductance
VCrelax Vascular conductance during the relaxation between muscle contractions
VO2mus Muscle oxygen consumption
VO2 oxygen consumption
xxix

Chapter 1
General Introduction
1.1 Introduction
The human body is constantly challenged by different types of activity increasing rapidlymetabolic and cardiovascular demands. These increased demands of working muscle aremet by the elevation in muscle blood flow (MBF) to match oxygen delivery (DO2) tothe metabolic demand. It is known that MBF is determined by the interaction betweenperfusion pressure gradient (∆P) and vascular conductance (VC) expressed as MBF = VC× ∆P (Rowell, 1993, Hughson, Shoemaker, Tschakovsky, and Kowalchuk, 1996, Laughlinand Korzick, 2001, Tschakovsky and Sheriff, 2004). Therefore, the dynamic response ofMBF can be challenged by manipulation of VC or ∆P. There are a number of approachesthat can be used to manipulate ∆P, VC or MBF including: lower body negative pressure(Hughson, Cochrane, and Butler, 1993), multiple bouts of exercise (MacDonald, Naylor,Tschakovsky, and Hughson, 2001), short training programs (Shoemaker, Phillips, Green,and Hughson, 1996), Mourtzakis, Gonzalez-Alonso, Graham, and Saltin, 2004), changes inthe physical adjustments of the body (Hughson et al., 1996) and modifications of inspiredO2 fractions (FIO2) (Calbet, 2000). For the purpose of this thesis, the last two approaches,changes in body position and hypoxia, were chosen to challenge MBF and VC responsesduring rest and exercise.
It is known that the human body is sensitive to postural challenges due to the effects ofgravity inducing hydrostatic pressure changes and shifts in blood volume affecting MBF andVC (Rowell, 1993, Shoemaker and Hughson, 1999, Egana and Green, 2005). In fact, muscleperfusion pressure (MPP) can be enhanced or reduced if arterial blood pressure is itselfincreased or decreased by placing the heart above or below the level of the muscle (Hughson
1

et al., 1996). Consequently, compensatory adjustments in VC are required to respond tothe alterations in MPP to modify MBF. Resting MBF is reduced despite the elevated MPPin the head-up tilt (HUT) or seated compared to supine position in healthy individuals(Delis, Nicolaides, and Stansby, 2000, Imadojemu et al., 2001, Groothuis, Boot, Houtman,van Langen, and Hopman, 2005) due to the decrease in VC via vasoconstriction througha complex interaction between local and central mechanisms (Laughlin and Korzick, 2001,Segal, 2005).
Since exercising muscles are sensitive to changes in limb or body position due to theeffects of gravity (Egana and Green, 2005), positioning of the limb above and below theheart level promotes changes in the gravity-dependent distribution of arterial and venouspressures affecting the dynamic response of MBF at the onset and steady-state of exercise(Hughson et al., 1996, Walker et al., 2007, Nadland, Walloe, and Toska, 2009). At theonset of exercise, MBF increases rapidly to meet the metabolic demand (Laughlin andKorzick, 2001, Hughson, 2003) being dependent on the intensity and the relative durationof contraction and relaxation phases (Walloe and Wesche, 1988). The rapid increase inMBF observed at the exercise onset is controlled by the complex interaction between localmechanical factors related to muscle pump action increasing pressure gradient across themuscle (Laughlin and Korzick, 2001, Tschakovsky and Sheriff, 2004) and local vasodilatorfactors increasing VC (Tschakovsky and Hughson, 1999, Shoemaker and Hughson, 1999,Tschakovsky and Sheriff, 2004, Tschakovsky, Saunders, Webb, and O’Donnell, 2006) be-ginning with the first contraction (Shoemaker and Hughson, 1999). Since a large portionof the increase in pressure gradient across working muscles occurs early in exercise, fur-ther increases in MBF must be accomplished by increases in VC to match oxygen delivery(DO2) to the metabolic demand (Laughlin and Korzick, 2001, Tschakovsky et al., 2006).
In submaximal steady-state exercise with small muscle mass, MBF determines DO2 be-cause there is no alteration in the arterial O2 content (Walker et al., 2007). However, lowerO2 concentrations as in hypoxia cause a decrease in arterial O2 content (CaO2) resultingin a decrease in the O2 availability unless compensated by an increase in MBF (Koskolou,Calbet, Radegran, and Roach, 1997, Gonzalez-Alonso, Richardson, and Saltin, 2001, Cal-bet et al., 2002). The combined effect of hypoxia and reduced MPP could challenge theability to sufficiently increase DO2 during submaximal exercise.
The overall purpose of this thesis was to investigate the effects of postural changes onMPP and the subsequent adaptations of lower limb VC and MBF at rest, during transi-tions from rest to exercise in different work rates and exercise in different work rates underaltered FIO2. To characterize and investigate MBF and VC responses during posturalchallenges as proposed on this thesis, it was necessary that the measurement techniqueshad beat-by-beat resolution and high reliability (Shoemaker, Pozeg, and Hughson, 1996).
2

Doppler ultrasound is a non-invasive method that has the capability to produce continuousmeasurements on a beat-by-beat basis due to its high temporal resolution (Shoemaker etal., 1996, Radegran, 1997, Osada, 2004, Walther, Nottin, Dauzat, and Obert, 2006). There-fore, the use of Doppler ultrasound is an attractive tool to measure arterial diameter (AD)and muscle blood flow velocity (MBV) allowing determination of MBF (Leyk, Essfeld,Baum, and Stegemann, 1992, Leyk, Essfeld, Baum, and Stegemann, 1994, Tschakovsky,Shoemaker, and Hughson, 1995, Shoemaker et al., 1996, Hughson et al., 1996, Radegran,1997,Osada, 2004, Walther et al., 2006). Although many studies have used Doppler ultra-sound to quantify AD, MBV and MBF during rest and exercise there are few data availableregarding its reproducibility for leg peripheral arteries (Walther et al., 2006). This issue ofrepeatability of the AD, MBV, MBF and VC responses at rest and exercise during bodytilt using Doppler ultrasound was addressed in Chapter 2.
Resting limb blood flow is determined by the interactions between perfusion pressuregradient and VC (Rowell, 1993). In healthy individuals from supine to HUT, leg arterialperfusion pressure is increased but MBF is decreased due to the reduction in VC (Deliset al., 2000, Imadojemu et al., 2001, Groothuis et al., 2005). However, little is known aboutthe adaptation of the lower limb VC and MBF responses when the lower limb is positionedabove the heart level (head-down tilt, HDT). The main issue of Chapter 3 was to discuss theadaptations of lower limb resting VC and MBF during HUT and HDT postural challenges.The analysis of the results in this study was based only on the averaged MBV, MBF and VCover a beat and averaged over the last two minutes of testing representing the net arterialresponses in each body position. However, when only mean values are presented, importantinformation concerning to flow patterns are unexplored (Thijssen, Green, Steendijk, andHopman, 2009). Therefore, this follow up study (Chapter 4) addressed as the main issuethe changes in MBV waveforms and MBV patterns within a cardiac cycle under alteredMPP caused by changes in body position.
The effects of gravity caused by changes in body position affect exercising muscle be-cause of its sensitivity to perfusion pressure (Egana and Green, 2005). MBF adaptationsat the onset and steady-state exercise have been challenged by positioning the limb aboveand/or below the heart level to alter arterial and venous pressures (Nadland et al., 2009,Walker et al., 2007, Lutjemeier et al., 2005, Shoemaker, Tschakovsky, and Hughson, 1998,Tschakovsky, Shoemaker, and Hughson, 1996, Hughson et al., 1996, Leyk et al., 1994).From supine to HUT (Nadland et al., 2009) or arm below versus above heart level (Hugh-son et al., 1996) the same level of MBF is achieved, but leg peak blood flow (Egana andGreen, 2005) as well as mean leg blood flow in moderate and heavy exercises (Van Leeuwen,Barendsen, Lubbers, and de Pater, 1992) demonstrated to be lower in supine compared toupright position. The lower MBF in some experimental conditions may suggest that MBF
3

was compromised in supine compared to upright exercise (Eiken, 1988). The main issueof Chapter 5 was to investigate the peak and submaximal MBF and VC responses duringexercise in three different body positions that affect the gravity-dependent distribution ofarterial and venous pressures.
Manipulation of FIO2 via hypoxia resulted in compensatory adjustments in MBF tomaintain DO2 during submaximal exercise (Koskolou et al., 1997, Gonzalez-Alonso et al.,2001). Manipulations of limb position relative to the heart to alter arterial and venouspressure affected MBF and VC responses during submaximal exercise. The effects ofaltered FIO2 (hypoxia) in conjunction with altered arterial perfusion pressure on MBF,DO2 and VC responses during exercise in humans are not known. This issue of the effectsof altered FIO2 and altered arterial perfusion pressure on MBF, DO2 and VC responsesduring exercise was addressed in Chapter 6.
4

1.2 Overview of Literature
1.2.1 Effects of altered arterial perfusion pressure on vascular
conductance and muscle blood flow at rest
The hydrostatic component of the blood pressure is altered during changes in body posi-tion affecting central hemodynamics (Shoemaker and Hughson, 1999). During HDT, thealterations in regional hydrostatic pressure might reduce blood pressure as well as lowerbody venous pressure being related to the magnitude of the stimulus (Sheriff, Nadland, andToska, 2007). This body position causes the translocation of venous blood volume fromthe lower extremities to the central region of the body (Bundgaard-Nielsen, Sorensen,Dalsgaard, Rasmussen, and Secher, 2009). The effective arterial pressure detected at thearterial baroreceptors in the carotid artery would increase as well as the stimulation ofthe cardiopulmonary baroreceptors. The combined effect of these mechanisms would re-sult in reduction in sympathetic vasoconstrictor tone in the leg arteries (Nagaya, Wada,Nakamitsu, Sagawa, and Shiraki, 1995, Rowell, 1993). In the lower legs in HDT, MPPis reduced decreasing transmural pressure as well as wall tension would induce relaxationof the arteriolar resistance vessels through the myogenic response (Sheriff et al., 2007,Tschakovsky and Hughson, 2000). The gravity-assisted shift in venous blood volume wouldinhibit the veno-arteriolar reflex (Sheriff et al., 2007, Toska and Walloe, 2002, Tschakovskyand Hughson, 2000). These mechanisms might act to promote arteriolar vasodilation re-sulting in the increase of VC to compensate for the reduction in MPP to maintain restingMBF.
In the HUT position, there is a relatively greater arterial-venous pressure gradient driv-ing flow to the lower limbs due to effects of gravity shifting blood from the central circula-tion into the abdominal region and the legs inducing venous pooling (Rowell, 1993, Toskaand Walloe, 2002, Cui et al., 2003, Harms, van Lieshout, Jenstrup, Pott, and Secher, 2003,Groothuis et al., 2005, van Lieshout, Harms, Pott, Jenstrup, and Secher, 2005, Bundgaard-Nielsen et al., 2009). This would in turn reduce venous return lowering central venouspressure and stimulating the cardiopulmonary baroreflex response to enhance muscle sym-pathetic nerve activity (Imadojemu et al., 2001, Toska and Walloe, 2002, Cui et al., 2003).The reduction in SV and SBP combined with the positioning of the carotid arterial barore-ceptors above the heart level would increase sympathetic vasoconstrictor activity as well asHR. The progressive pooling of blood early during HUT increases venous pressure (Matzen,Perko, Groth, Friedman, and Secher, 1991, Madsen et al., 1995, Cui et al., 2003) that wouldinduce arteriolar vasoconstriction of the corresponding arteriole due to the veno-arteriolarreflex (Henriksen and Sejrsen, 1977, Tschakovsky and Hughson, 2000). The higher MPP
5
in HUT raises distending pressure on the vessel and increase transmural pressure as wellas wall tension inducing vasoconstriction of the arteriolar resistance vessels via myogenicresponse (Imadojemu et al., 2001, Toska and Walloe, 2002). The combined effects of thesemechanisms might act to promote vasoconstriction resulting in the decrease of VC due tothe rise in vascular resistance in HUT (Harms et al., 2003) resulting in decreased restingMBF (Delis et al., 2000, Imadojemu et al., 2001, Groothuis et al., 2005).
1.2.2 Muscle blood flow response during exercise
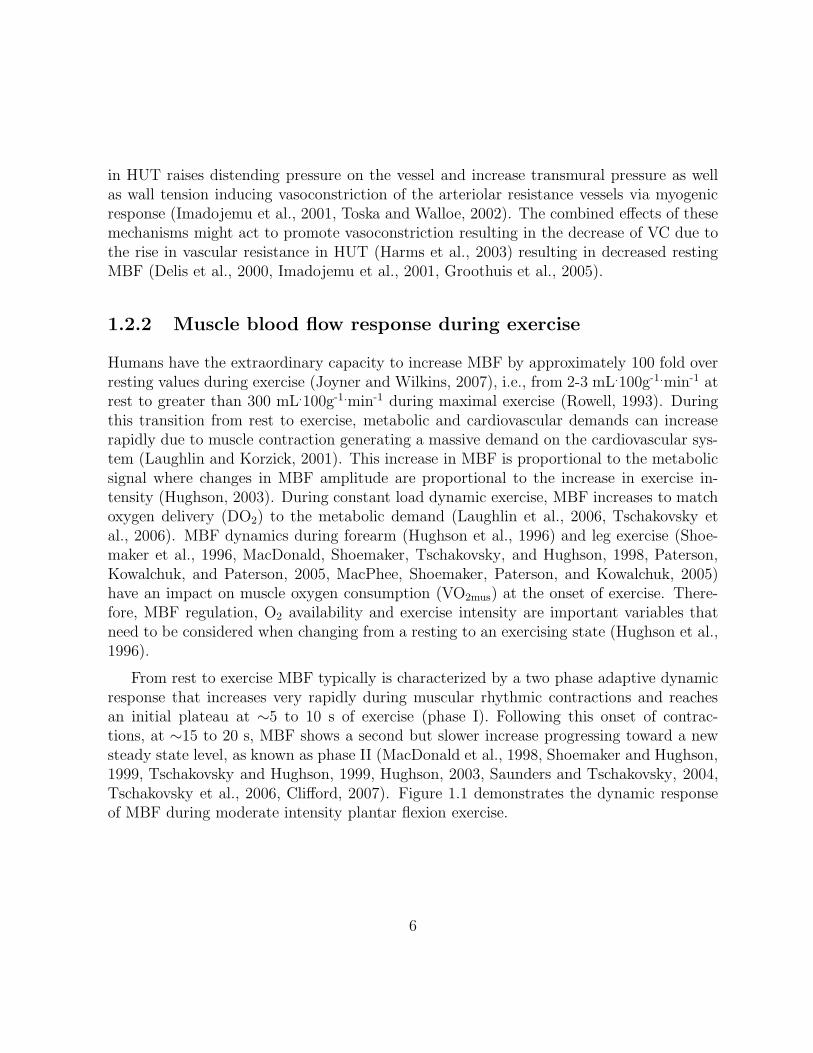
Humans have the extraordinary capacity to increase MBF by approximately 100 fold overresting values during exercise (Joyner and Wilkins, 2007), i.e., from 2-3 mL.100g-1.min-1 atrest to greater than 300 mL.100g-1.min-1 during maximal exercise (Rowell, 1993). Duringthis transition from rest to exercise, metabolic and cardiovascular demands can increaserapidly due to muscle contraction generating a massive demand on the cardiovascular sys-tem (Laughlin and Korzick, 2001). This increase in MBF is proportional to the metabolicsignal where changes in MBF amplitude are proportional to the increase in exercise in-tensity (Hughson, 2003). During constant load dynamic exercise, MBF increases to matchoxygen delivery (DO2) to the metabolic demand (Laughlin et al., 2006, Tschakovsky etal., 2006). MBF dynamics during forearm (Hughson et al., 1996) and leg exercise (Shoe-maker et al., 1996, MacDonald, Shoemaker, Tschakovsky, and Hughson, 1998, Paterson,Kowalchuk, and Paterson, 2005, MacPhee, Shoemaker, Paterson, and Kowalchuk, 2005)have an impact on muscle oxygen consumption (VO2mus) at the onset of exercise. There-fore, MBF regulation, O2 availability and exercise intensity are important variables thatneed to be considered when changing from a resting to an exercising state (Hughson et al.,1996).
From rest to exercise MBF typically is characterized by a two phase adaptive dynamicresponse that increases very rapidly during muscular rhythmic contractions and reachesan initial plateau at ∼5 to 10 s of exercise (phase I). Following this onset of contrac-tions, at ∼15 to 20 s, MBF shows a second but slower increase progressing toward a newsteady state level, as known as phase II (MacDonald et al., 1998, Shoemaker and Hughson,1999, Tschakovsky and Hughson, 1999, Hughson, 2003, Saunders and Tschakovsky, 2004,Tschakovsky et al., 2006, Clifford, 2007). Figure 1.1 demonstrates the dynamic responseof MBF during moderate intensity plantar flexion exercise.
6

Figure 1.1: Illustration of the dynamic response of MBF during moderate intensity plantarflexion exercise (data from the current study displayed consistent with Shoemaker andHughson, 1999 and Tschakovsky et al., 2006.)
The rate of increase in blood flow to the exercising muscle has an effect on steady-stateconditions consequently the time course of the adaptive processes and control mechanismsresponsible for the increase in MBF is critical during the transition from rest to exercise(Shoemaker and Hughson, 1999, Hughson et al., 1996). Therefore, the characterization ofthe time course and quantification of the dynamic response of MBF during the adaptivephase between rest and exercise offers a unique opportunity to obtain information aboutthe potential underlying mechanisms and MBF regulators that is not possible during thesteady-state phase of exercise (Tschakovsky et al., 2006, Hughson, 2003).
The adaptive dynamic response of MBF to an exercise challenge behaves in an approx-imately exponential manner; although, more complex models might be appropriate underconditions of very heavy or very light exercise. The exponential response can be describedby three parameters characteristic of the dynamic response: (1) time delay (TD), repre-senting the onset of stimulus to the onset of response; (2) time constant (τ), representingthe rate of adaptation of the response, it is considered as the time required to reach 63% ofthe difference between baseline and a new steady state value; and (3) gain (G) representingthe magnitude of the response, where total gain (TG) represents the total amplitude ofthe response (Hughson, 2003, Tschakovsky et al., 2006) (Figure 1.2).
7

Figure 1.2: Illustration of the three parameters that are involved in a dynamic response ofMBF: (1) time delay (TD), (2) time constant (τ) and (3) gain (TG) (data from the currentstudy displayed consistent with Tschakovsky et al., 2006.)
1.2.3 Muscle blood flow response during phase I
MBF increases very rapidly in response to muscle contractions during the first 5 to 10 sof exercise (phase I). Since blood flow is the product between perfusion pressure gradientand VC, MBF distribution is dependent on the interaction between MPP and VC (Hugh-son et al., 1996, Laughlin and Korzick, 2001, Tschakovsky and Sheriff, 2004). There aremany potential factors that might influence MBF at the onset of exercise acting to modifyvascular tone (VC) and the pressure gradient across capillary beds (Hughson et al., 1996,Laughlin and Korzick, 2001, Tschakovsky and Sheriff, 2004)
The rapid increase in MBF is controlled by local mechanical factors related to mus-cle pump action increasing pressure gradient across the muscle (Tschakovsky and Sheriff,2004, Laughlin and Korzick, 2001) and vasodilation increasing VC (Tschakovsky et al.,2006, Tschakovsky and Sheriff, 2004, Tschakovsky and Hughson, 1999, Shoemaker andHughson, 1999) beginning with the first contraction (Shoemaker and Hughson, 1999). Thisearly dilation is related to the production and release of the vasodilator substances duringcontraction to reduce vascular tone facilitating hyperemia during relaxation (Shoemakerand Hughson, 1999). Several candidates have been indicated as the main substance re-sponsible for the early dilation at the onset of exercise, such as: muscle metabolites (ADP,Pi, CO2, H
+, lactate) (Lash, 1996), potassium (K+) (MacDonald et al., 2001), adenosine,
8

nitric oxide (NO), neural regulation and acetylcholine (ACh) (Welsh and Segal, 1998) aswell as compression and deformation of the vessel wall considered as mechanical factors(Clifford, 2007). It appears that ACh might not play a role in the regulation of vascu-lar tone in humans (Brock et al., 1998) because ACh had no effect on the magnitude ofincrease in blood flow suggesting no functional involvement of this substance (Shoemakerand Hughson, 1999). This feed forward mechanism probably cannot account for bloodflow adaptation, at least in large muscle mass, owing to the physical distance betweenneuromuscular junction and the major portion of the muscle mass (Hughson, 2003). Theincrease in VC and MBF from rest to exercise during this adaptive phase I seems to beregulated by multiple and probably redundant mechanisms (Tschakovsky et al., 2006).
1.2.4 Muscle blood flow during phase II response
Following phase I, MBF continues to increase until 2-3 min of moderate intensity exercise.Despite the quick vasodilatory response at the onset of exercise in this phase, such responseis not enough to achieve steady-state MBF. Since a large portion of the increase in pressuregradient across working muscles occurred early in exercise (phase I), further increases inMBF must be accomplished by increases in VC to meet the metabolic demand as wellas steady state MBF requirements during a delayed phase II response (Shoemaker andHughson, 1999). This phase is characterized by an exponential increase in MBF starting∼15 to 20 s after the onset of exercise and it appears to be under much tighter feedbackregulation than the phase I response (Shoemaker and Hughson, 1999, Tschakovsky andHughson, 1999).
The metabolic and endothelial-derived regulatory factors probably are released propor-tionally to exercise intensity to provide feedback regulation of VC leading to an increasein MBF via vasodilation through a complex interaction between local and central mech-anisms (Laughlin and Korzick, 2001, Segal, 2005). There are several control mechanismsas well as vasodilatory candidates identified to be involved in this phase. The MBF regu-lation represents the integration of multiple stimuli to obtain the required response wherein the absence or reduction of the effect of one, others can completely compensate (Shoe-maker and Hughson, 1999, Laughlin and Korzick, 2001, Hughson, 2003). Consequently,the dynamic response of MBF represents the net interactive effect of multiple mechanisms(Tschakovsky et al., 2006). The main control mechanisms likely involved in phase I and IIresponse of MBF are presented in Figure 1.3.
9

Figure 1.3: Illustration of possible mechanisms for control of muscle blood flow (MBF)through the popliteal artery in phase I and phase II following the start of exercise. Dur-ing phase I, the main control mechanisms involved are: (1) changes in pressure gradient(∆P) due to muscle pump action and (2) changes in vascular conductance (VC) due tovasodilation. In phase II, the main mechanism considered is vasodilation that is probablycontrolled by: metabolic, endothelial-mediated, myogenic and neural factors (adapted fromShoemaker and Hughson, 1999.)
1.2.5 Effects of altered arterial perfusion pressures on vascularconductance and muscle blood flow during exercise
Exercise hyperemia is affected by changes in body position through the interaction be-tween changes in MPP and the mechanical effects of muscle contraction and muscle pumpactivation combined with local vasodilatory mechanisms that influence VC (Leyk et al.,1994, Tschakovsky et al., 1996, Shoemaker et al., 1998, Tschakovsky and Hughson, 1999,Shoemaker and Hughson, 1999, Tschakovsky and Sheriff, 2004, Tschakovsky et al., 2006,Walker et al., 2007). The increase in VC during exercise is probably a consequence of thecombined effects of vasodilation and muscle pump activity increasing the perfusion pres-sure gradient across the working muscle enhancing the virtual conductance (Tschakovskyet al., 1996, Shoemaker et al., 1998, Shoemaker and Hughson, 1999, Nadland et al., 2009).
Positioning of the arm (Hughson et al., 1996, Walker et al., 2007) or legs (Leyk etal., 1994, Grassi et al., 1996, Radegran and Saltin, 1998, Nadland et al., 2009) below
10

heart level increases the rate of adaptation of MBF and VC toward a new steady-statelevel. The blunted VC response with the arm below heart level probably indicate that lessaccumulation of vasodilator metabolites is required as the muscle pump is more effective toincrease MBF in conditions with elevated MPP (Folkow, Haglund, Jodal, and Lundgren,1971, Laughlin and Joyner, 2003, Nadland et al., 2009). However, when the arm is placedabove the heart level muscle pump no longer contribute to the increase in VC and MBFdue to the minimized emptying effect of the veins and the lack of a hydrostatic column(Tschakovsky et al., 1996, Saunders and Tschakovsky, 2004). In this condition, localvasodilation occurs to increase VC in an attempt to compensate for the reduced MPPto maintain MBF (Hughson et al., 1996), but there is a possibility that MBF would becompromised under reduced MPP (Eiken, 1988).
1.2.6 Effects of hypoxia on vascular conductance, muscle bloodflow and oxygen delivery during exercise
Hypoxia has been used to manipulate CaO2 and PaO2 to investigate MBF and DO2 adjust-ments during exercise. Reductions of CaO2 and PaO2 via hypoxia resulted in compensatoryadjustments in VC to increase MBF maintaining DO2 during one or two-legged knee exten-sion submaximal exercise in semi-supine position (Koskolou et al., 1997, Gonzalez-Alonsoet al., 2001) or maintenance of MBF with reduction in DO2 during alternated two-leggedkicking submaximal exercise in sitting position (MacDonald, Tarnopolsky, and Hughson,2000). The higher VC response in hypoxia compared to normoxia is probably due to localvasodilation in response to the reduced cellular PO2 caused by the reductions of CaO2,PaO2 and O2 availability (Calbet, 2000).
The red blood cells can sense the decrease in O2 leading to release of ATP from the ery-throcytes mediating vasodilatory responses relaxing the vascular smooth muscle via releaseof nitric oxide (NO), endothelium-derived-hyperpolarization-factor (EDHF) and/or releaseof NO from S-nitrosohemoglobin due to hemoglobin deoxygenation (Calbet, 2000, Stamleret al., 1997, Jia, Bonaventura, Bonaventura, and Stamler, 1996, Ellsworth, Forrester, Ellis,and Dietrich, 1995). In hypoxia, the accumulation of adenosine activating the adenosine-sensitive K+ channels (Allen, Lamb, and Westerblad, 2008) , adenosine monophosphate-activated protein kinase (AMPK) stimulating the release of NO and PG (Fisslthaler andFleming, 2009, Towler and Hardie, 2007) and release of metabolic vasodilators by musclecontractions (CO2, H
+, lactate, Pi) could contribute to the vasodilation increasing VC(Calbet, 2000). The maintenance of DO2 in hypoxia would be obtained by the compen-satory adjustments in MBF due to the increase in VC.
11

1.3 Objectives of this thesis
The overall purpose of this thesis was to investigate the adaptations of lower limb VC andMBF during alterations in arterial perfusion pressure at rest, during transitions from restto exercise and during exercise under altered FIO2. To do so, five studies were designed inan attempt to achieve such purpose.
The aim of the first study (Chapter 2) was to test data repeatability for popliteal MBV,popliteal arterial diameter (ADpop), MBF and VC at rest, during the steady-state of ex-ercise in different body positions using a custom-built tilt table associated with Dopplerand echo Doppler ultrasound techniques. Previous studies have been conducted with ma-nipulations of arm below and above heart level, or leg position below heart level and orchanges from supine to upright posture, but not in head-down tilt with a focus on the lowerlegs. This study provided a critical basis for the subsequent studies which manipulatedarterial perfusion pressure to affect limb VC and MBF at rest, during transitions from restto exercise, and during exercise under altered FIO2 (hypoxia).
The aim of the second study (Chapter 3) was to investigate the adaptations of the lowerlimb VC and MBF during HUT and HDT postural challenges at rest. Previous studiesreported the effect of HUT position in the cardiovascular system impacting VC and MBF.However, little is known about VC and MBF responses with the lower leg positioned abovethe heart level (HDT). This approach provided information on how VC and MBF adaptedin conditions with reduced (HDT) and elevated (HUT) MPP at rest providing a basis forsubsequent studies that investigated VC and MBF responses during exercise. The protocolapplied in this study is illustrated in Figure 3.1.
12

Figure 1.4: Resting protocol used to investigate the adaptations of the lower limb VCand resting MBF during HOR, HDT and HUT positions. Arrows indicate were ADpop
(popliteal arterial diameter) were taken.
The aim of the third study (Chapter 4) was to compare MBV and VC patterns duringthree different body positions that affected the gravity-dependent distribution of arterialand venous pressures. The effects of passive HDT and HUT on the anterograde muscleblood flow velocity (MBVant) and retrograde muscle blood flow velocity (MBVret) patternsare not well characterized. This analysis provided additional information on how VC andMBF adapts in conditions with reduced (HDT) and elevated (HUT) MPP at rest withincardiac cycles.
In the fourth study (Chapter 5), the aim of the first experiment was to determinepeak vascular conductance (VCpeak) in the lower limb by the sudden release of occlusionfollowing intense, ischemic muscle contractions. The aim of the second experiment wasto compare the impact of altered MPP on MBF and VC during transitions from rest tolower and higher power output plantar flexion exercise performed with manipulations oflimb position relative to the heart. This approach determined the VCpeak and its fractionalrecruitment allowing investigation of the MBF regulation in different exercise challengeswith altered perfusion pressure. The Figure 6.1 presents the illustration of the protocolused in the second experiment.
13

Figure 1.5: Exercising protocol used to test the impact of altered MPP on VC and MBFduring transitions from rest to plantar flexion exercise in HOR, HDT and HUT positions.Arrows indicate were ADpop (popliteal arterial diameter) were taken.
The main of the fifth study (Chapter 6) was to investigate MBF, DO2 and VC responsesduring submaximal calf exercise in three different body positions that affect the gravity-dependent distribution of arterial and venous pressures under altered O2 inspired fraction(normoxia,FIO2 = 0.21 and hypoxia, FIO2 = 0.14). The effects of hypoxia in conjunctionwith altered arterial perfusion pressure on MBF, DO2 and VC responses during exercisein humans are not known. This approach provided further information about how VCand MBF adapt to the exercise challenge in conditions with reduced FIO2 associated withconditions under reduced MPP (HDT) and elevated MPP (HUT) eliciting some moredetails about blood flow regulation and control mechanisms. The Figure 1.6 presents theillustration of the protocol used in this study.
14

Figure 1.6: Exercising protocol used to investigate MBF, DO2 and VC responses duringsubmaximal calf exercise in HOR, HDT and HUT positions under altered O2 inspiredfraction (normoxia, FIO2 = 0.21 and hypoxia, FIO2 = 0.14). Arrows indicate were ADpop
(popliteal arterial diameter) were taken.
The final chapter of this thesis (Chapter 7) presented a summary of the studies as wellas the implications of these findings and providing guidance for future investigations.
15

Chapter 2
Repeatability of the muscle bloodflow response at rest and exerciseduring body tilt using Dopplerultrasound
16

2.1 Overview
This study tested the data repeatability for popliteal muscle blood flow velocity (MBV),popliteal arterial diameter (ADpop), muscle blood flow (MBF) and vascular conductance(VC) at rest and exercise in different body positions and work rates (EX). Fifteen andeleven healthy volunteers participated in the two phases of the studies. Resting protocolswere performed in horizontal (HOR), 35° head-down tilt (HDT) and 45° head-up tilt (HUT)for 5min in each body position on two separate days. EX was performed at lower and higherpower outputs (repeated plantar flexion contractions at 20 and 30% maximal voluntarycontraction, respectively) in HOR, 35°HDT and 45°HUT on two separate days. MBV wasmeasured in the popliteal artery by Doppler ultrasound, ADpop was measured by ultrasoundimaging, MBF was calculated and VC was estimated by dividing MBF flow by muscleperfusion pressure (MPP) determined beat-by-beat from a finger cuff and corrected to thelevel of the mid-calf. All variables were not different and demonstrated good agreementbetween the two days of testing during both rest and exercise regardless of body position.In conclusion MBV, ADpop, MBF, and VC were repeatable in all body positions duringrest and exercise conditions. Therefore, these data support the utilization of Dopplerultrasound and echo Doppler as a reproducible method to measure MBV and ADpop andconsequently estimate MBF and VC in such conditions.
17

2.2 Introduction
Accurate, reliable and reproducible quantitative measurements of blood flow are essentialin studies interested to explore the dynamic response of muscle blood flow during bothrest and exercise. Especially during exercise, the major challenge is to obtain consistentmeasurements of arterial diameter and blood flow velocity due to muscle contraction andthe variable velocity profile (Shoemaker et al., 1996). This problem is increased whendifferent body positions are assumed because the velocity profile changes according to thealterations in posture and pressure gradients. Non-invasive ultrasound is a method thathas the capability to measure arterial diameter, blood flow velocity to determine bloodflow (Walther et al., 2006, Osada, 2004, Radegran, 1997, Shoemaker et al., 1996). Theuse of this method has been applied to measure femoral (Walther et al., 2006, Osada,2004, Radegran, 1997, Stacey-Clear and Fish, 1984) brachial (Shoemaker et al., 1996)and popliteal (Labropoulos et al., 1998) arterial diameters and blood flow velocities andconsequently estimation of the blood flow at rest.
Doppler ultrasound has the advantage to permit continuous measurements on a beat-by-beat basis due to its high temporal resolution allowing blood flow velocity measuresduring dynamic exercise (Walther et al., 2006, Osada, 2004, Radegran, 1997, Shoemakeret al., 1996). Therefore, this technique became an attractive tool to measure blood flowin different conduit arteries in different exercise models, such as, brachial artery duringdynamic handgrip exercise (Shoemaker et al., 1996, Hughson et al., 1996, Tschakovskyet al., 1995), femoral artery during leg-extension exercise (Walther et al., 2006,Osada,2004, Radegran, 1997) and plantar flexion exercise (Leyk et al., 1994, Leyk et al., 1992).Although many studies have used Doppler ultrasound to quantify arterial blood flow duringexercise there are few data available regarding its repeatability for peripheral arteries inthe lower limb (Walther et al., 2006). Therefore, the purpose of the current study wasto test the data repeatability for popliteal muscle blood flow velocity, popliteal arterialdiameter, muscle blood flow, and vascular conductance at rest and exercise at two workrates in different body positions.
18

2.3 Methods
2.3.1 Participants
Fifteen and eleven healthy, non-smoking, male volunteers participated in the two phasesof the studies with experiments performed at rest and exercise in different body positions(EX). Participants’ characteristics related to age, height, and body mass are described inthe Table 2.1.
Table 2.1: Participants’ characteristics related to age (years), height (cm) and body mass(Kg).
Conditions Rest EX(n = 15) (n = 11)
Age (years) 29.6± 2.7 28.0± 3.8Height (cm) 177.1± 5.5 176.5± 5.3
Body mass (Kg) 80.4± 13.5 79.0± 6.9
Values are mean ± SD. Number of participants (n).
Participants received complete written and verbal details of the experimental proce-dures and potential risks involved prior to signing an information consent form approvedby the Office of Research Ethics of the University of Waterloo. All participants were in-structed to refrain from consuming alcohol, caffeinated beverages, engaging in vigorousexercise for 24 hours prior to testing, and from consuming a large meal within two hoursof testing.
2.3.2 Experimental Design
Participants reported to the laboratory two times for the rest and four times for EXexperimental conditions. For all tests, participants assumed a prone position on a custombuilt tilt table with their head supported by a massage table head piece. Shoulder blockswere adjusted accordingly and their arms were placed on the resting apparatus with theshoulders and elbows positioned at approximately 90°. Two belts, one located on the chestand other on the hips, were used to secure the participants during testing. Straps fromthese belts were attached in the tilt table to help to avoid the participants from sliding. Inthe resting condition, there was no tension placed on the foot and it was held in a natural
19

angle. Under exercise, the foot was secured to a foot plate with the angle of rotation atthe ankle. Further details are provided in Chapter 3 and Chapter 4.
Following this procedure, ECG electrodes were applied on the skin surface in the back, 4MHz pulsed Doppler ultrasound and 6-13 MHz echo Doppler ultrasound probes were placedon the skin over the popliteal artery. In the first day of a new section, once the participantswere secured to the table, they were familiarized with a short trial which simulated theprotocols with enough recovery time to ensure the return of the variables to the baselinelevels. During familiarization, none of the participants reported any discomfort. Eachparticipant performed four repeated randomized trials, two trials of each condition per dayat rest, two repeated randomized trials, one trial of each condition per day for EX.
2.3.2.1 Resting Protocol
The resting protocol consisted of three different gravitational stress conditions. First,participants performed 3min of baseline in a HOR position at 0°. Then, the participant wastilted in approximately 3s to 35°HDT or 45°HUT and this body position was maintained for5min. After this period of time, the table was rotated back ( 3s) to HOR (control condition)for 5min. Subsequently, subjects were tilted to the other position, HUT or HDT, for 5min.The order of these conditions was randomized and counterbalanced among the participantsbetween HDT and HUT. In each body position, data were analysed between 3-5min afterallowing for stabilization.
2.3.2.2 Exercise Protocol
The EX protocols were comprised of repeated plantar flexion exercise consisting of 1s toextend the footplate, 1s to return it to resting position, and 1s of rest (3s duty cycle) whenthe load was 20% or 30% of the maximal voluntary contraction (MVC). The work ratesgenerated by these protocols were defined respectively as lower and higher power output.The angle of movement was ∼20° representing a displacement of 10cm. The foot platemovement was set in the rotational axis of the ankle to isolate contractions to the calfmuscles. The four days of testing were performed two times per week separated by atleast 48 hours. This break minimized any carry over and cumulative effect of the exerciseprotocols, as well as muscle adaptation to the stimulus.
The angles of tilting for HDT (35°) and HUT (45°) accomplished a reduction andincrease in muscle perfusion pressure (MPP) estimated to the middle of the calf muscle of∼ −44mmHg and ∼ +55mmHg, respectively. Changing the angle of the tilt table required
20

adjusting the load to achieve the same tension on the cable attached to the foot plate (formore details see Chapter 4.
For EX, each participant performed six different protocols; three tests per day on fourdifferent days randomized by blocks and counterbalanced among the participants. Thespecific sequence and recovery time provided between exercise bouts was designed to avoidmuscle fatigue in both protocols. Each EX protocol consisted of 3min baseline in a bodyposition followed by 5min of exercise. A more detailed description of the exercise protocolis provided in the Chapter 4.
All tests were conducted in a quiet room where room temperature was kept constantat 19.4 ± 0.9 °C to ensure minimal skin blood flow at rest and exercise protocols withhumidity at 39.9 ± 4.8%, and barometric pressure at 730.8 ± 2.4 mmHg.
2.3.3 Data Acquisition
Muscle blood flow velocity (MBV) in the popliteal artery, heart rate (HR) and bloodpressure (BP) were measured beat-by-beat recorded at 1000 Hz using a data acquisitionsystem (Powerlab, ADInstruments, Colorado Springs, USA) and processed after testingwith specific data analysis software (Chart, version 5.5, ADInstruments, Colorado Springs,USA). MBV was determined from the intensity weighted mean of a 4 MHz pulsed Dopplerultrasound probe (Neurovision Doppler Ultrasound, Model 500, Multigon Industries, Mt.Vernon, USA). The flat ultrasound probe was secured by surgical tape to the skin surfaceover the popliteal artery embedded at a 45° angle of insonation relative to the skin andadjusted according to the measured angle between the skin and the popliteal artery.
Prior to each trial the popliteal artery was investigated to establish proper alignment,and to determine the depth and gate to assure full insonation of the artery lumen withoutcontamination from the venous signal. The probe location was marked on the skin to assistrepositioning of the probe during the test and on subsequent tests. If it was necessary,the researcher manipulated the probe to preserve the best Doppler signal as determinedby constant use of auditory and visual feedback. If the ultrasound signal quality wascompromised during the last 2min of baseline or a tilt trial, it was excluded from theanalysis. Two participants in HUT and one in HDT were excluded for the repeatabilitytests during exercise due to difficulties with the Doppler ultrasound signal resulting in lossof some data in those trials. Therefore, the data analysis for HUT and HDT were basedon nine and ten rather than eleven participants, respectively.
Diameter of the popliteal artery (ADpop) was measured with an 8-12 MHz echo Dopplerultrasound probe (Diagnostic Ultrasound System, Model M5, Shenzen Mindray Bio-medical
21

Electronics Co., Ltd., Shenzen, China). These popliteal artery images were recorded andstored for analysis. ADpop measurements were performed in B-mode with the echo Dopplerultrasound probe positioned just proximal to the site of velocity measurements. ADpop im-ages at rest were taken as the average of three separate measurements during diastole atbaseline (1.5min), 5.5 (HDT or HUT), 10.5 (HOR), and 15.5min (HUT or HDT). Duringexercise, ADpop images were taken during diastole at baseline and at the end of recoverytime and in the relaxation phase between contractions in the fourth minute of exercise forEX.
Arterial blood pressure was estimated from a photoplethysmograph cuff placed aroundthe middle finger of the left hand (Finometer, Finapres Medical Systems, Arnhem, theNetherlands). Mean arterial pressure (MAP) was determined as the area under the curvebetween successive heart beats. Heart rate (HR) was continuously calculated from theRR-interval obtained from an electrocardiogram (Pilot 9200, Colin Medical InstrumentsCorp, San Antonio, Texas, USA).
2.3.4 Data Analysis
The MBV and the ADpop cross-sectional area were used to calculate MBF (mL.min-1)as MBF = MBV×πr2×60; where r is the vessel radius. Vascular conductance (VC) wasestimated from MBF and MPP as VC (mL.min-1) = MBF/MPP. The MPP (mmHg) wasestimated by MAP (mmHg) and the distance between subjects heart and the middle of thecalf muscle for all body positions. For the HOR position, the distance between participantsheart and the middle of the calf muscle is zero, thus, MPP was equal to MAP (i.e. 85mmHg+ 0mmHg = 85mmHg). For the HDT position, MPP was equal to MAP subtracted fromthe vertical distance between participants heart and the middle of the calf muscle, convertedin millimeters of mercury (1mmHg = 1.36cm of H2O, due to the effects of gravity loweringarterial perfusion pressure (i.e. 85mmHg − 44mmHg, 60cm/1.36cm of H2O = 41mmHg).For the HUT position, MPP was equal to MAP added from the vertical distance betweenparticipants heart and the middle of the calf muscle, converted in millimeters of mercury(1mmHg = 1.36cm of H2O), due to the effects of gravity increasing arterial perfusionpressure (i.e. 85mmHg + 55mmHg, 75cm/1.36cmH2O = 140mmHg).
Aberrant data from each trial were deleted and following this procedure data wereaveraged over 2min at rest and in the last 2min of exercise to generate a single value forHDT, HOR, and HUT positions. In HOR, the first minute of data were excluded to avoidcarrying over effect of the tilting procedures.
22

2.3.5 Statistical Analysis
Order effect was analyzed with repeated measures one-way analysis of variance to detectpossible statistical differences between trials in the same body position for MBV, ADpop,MBF, and VC at rest. Day-to-day variability for the same variables and the same bodypositions during rest and exercise trials were determined with: (1) student t-test analysisto identify statistically significant differences between day 1 and day 2, with the levelof significance set at p < 0.05; (2) calculation of coefficient of variation (CV), which isCV = (Standard deviation/mean)×100, for each participant in each condition to measurevariability between days and (3) Bland-Altman plots to access the level of agreementbetween the two days of testing. Data were presented as means ± standard deviation(SD).
23

2.4 Results
2.4.1 Resting Protocol
There were no statistical differences between the trials for all variables indicating no ordereffect was caused by the randomization procedures. All variables did not show statisticaldifferences between two days of testing for all body positions (Figure 2.1A, 2.1B, 2.1C).The mean CV values were close regardless of the body position indicating that MBV,ADpop, MBF and VC were consistent between two days of testing (Table 2.2).
Table 2.2: MBV, ADpop, MBF and VC during baseline, HDT, HOR, and HUT with respectto coefficient of variation during the rest protocol.
Variables days Baseline HDT HOR HUT
MBV (cm.s-1) 1 2.7± 0.8 2.4± 0.7 2.6± 0.8 1.6± 0.3MBV (cm.s-1) 2 2.8± 1.0 2.5± 0.6 2.7± 0.9 1.5± 0.5ADpop (cm) 1 0.64± 0.06 0.64± 0.06 0.64± 0.06 0.64± 0.06ADpop (cm) 2 0.64± 0.06 0.64± 0.06 0.64± 0.06 0.64± 0.06MBF (mL.min-1) 1 52.1± 15.4 45.8± 14.4 51.9± 17.5 29.9± 6.0MBF (mL.min-1) 2 52.5± 20.6 46.9± 12.4 51.2± 18.0 30.1± 6.0VC (mL.min-1.min-1) 1 0.60± 0.20 1.01± 0.38 0.54± 0.12 0.21± 0.05VC (mL.min-1.min-1) 2 0.59± 0.23 0.99± 0.28 0.56± 0.19 0.21± 0.08
Values are mean ± SD of 15 participants in two days of testing. Muscle blood flow velocity(MBV), popliteal arterial diameter (ADpop), muscle blood flow (MBF), vascular conduc-tance (VC), horizontal (HOR), head-down tilt (HDT), head-up tilt (HUT) and coefficientof variation (CV).
The Bland-Altman analyses indicated that the 95% limits of agreement between thetwo days of testing showed no deviation of the mean value from 0, and relatively smallvariability about the mean for all body positions for MBV, ADpop, MBF and VC (Figure2.1D, 2.1E, 2.1F).
24

Figure 2.1: Muscle blood flow velocity (MBV) responses to changes in body position acrosstwo days of testing for HDT (A), HOR (B) and HUT (C). Lines indicate group response,symbols indicated the points at which repeatability were performed and dashed verticallines indicate transition from baseline to HDT and baseline to HUT. Bland-Altman plotsduring HDT (D), HOR (E), and HUT (F) comparing two days of testing at rest (Differ-ence MBV = MBVDay1 − MBVDay2, Average = (MBVDay1 − MBVDay2)/2). Solidhorizontal lines show mean values and dashed horizontal lines represent 95% confidencelimits. The symbols are offset for clarity.
25

2.4.2 Exercise Protocol
MBV, ADpop, MBF and VC were not different between two days of testing during lowerand higher power output exercise (Table 2.3). The mean CV values showed that MBV,ADpop, MBF and VC were consistent between two days of testing regardless of the bodyposition (Table 2.3). The Bland-Altman analyses for lower power output are presented inthe Figure 2.2. The Bland-Altman analyses indicated that the 95% limits of agreementbetween the two days of testing ranged from -2.5 to 2.4 for HPOHDT, -3.0 to 4.4 for HPOHOR
and -2.3 to 3.5 for HPOHUT. These results indicate no deviation of the mean value from0, and relatively small variability about the mean.
26

Table 2.3: MBV, ADpop, MBF, VC and CV between two days of testing during lower andhigher power output during plantar flexion averaged over the last two minutes of exercise.
Conditions days MBV (cm.s-1) ADpop (cm) MBF (mL.min-1) VC (mL.min-1.min-1)
LPOHOR (n = 11) 1 8.7± 2.8 0.64± 0.04 175.1± 72.4 2.04± 0.83LPOHOR (n = 11) 2 9.6± 2.5 0.64± 0.04 187.8± 68.0 2.26± 0.84
CV (%) 7.6± 4.8 1.1± 0.9 7.5± 4.5 8.1± 4.7
LPOHDT (n = 10) 1 7.8± 2.5 0.63± 0.05 142.0± 55.0 3.36± 0.92LPOHDT (n = 10) 2 8.0± 2.6 0.63± 0.04 158.2± 53.3 3.76± 1.10
CV (%) 4.3± 4.0 1.2± 0.8 5.0± 5.1 6.1± 5.9
LPOHUT (n = 9) 1 6.4± 2.6 0.63± 0.04 126.4± 60.8 0.90± 1.10LPOHUT (n = 9) 2 5.6± 2.4 0.64± 0.04 110.0± 44.1 0.77± 1.30
CV (%) 7.8± 4.0 1.2± 0.7 8.0± 4.2 8.8± 5.3
HPOHOR (n = 11) 1 12.7± 3.3 0.64± 0.05 257.3± 89.7 2.83± 1.1HPOHOR (n = 11) 2 12.0± 4.2 0.64± 0.05 236.0± 101.7 2.77± 1.3
CV (%) 6.6± 4.2 0.6± 0.7 7.1± 4.6 6.4± 4.4
HPOHDT (n = 10) 1 8.7± 1.0 0.63± 0.05 161.0± 69.1 3.02± 1.10HPOHDT (n = 10) 2 8.8± 1.0 0.63± 0.04 164.7± 54.1 3.35± 1.27
CV (%) 6.1± 4.8 0.8± 0.9 5.6± 4.6 8.5± 5.9
HPOHUT (n = 9) 1 11.8± 1.0 0.64± 0.04 227.6± 69.5 1.62± 0.52HPOHUT (n = 9) 2 11.7± 1.0 0.64± 0.05 229.4± 80.3 1.63± 0.61
CV (%) 9.0± 6.2 1.1± 0.3 9.7± 7.5 9.1± 7.7
Values are mean ± SD for two days of testing. Number of participants (n), muscle bloodflow velocity (MBV), popliteal arterial diameter (ADpop), muscle blood flow (MBF) andvascular conductance (VC), lower power output in horizontal (LPOHOR), lower power out-put in head-down tilt (LPOHDT), lower power output in head-up tilt (LPOHUT), higherpower output in horizontal (HPOHOR), higher power output in head-down tilt (HPOHDT),higher power output in head-up tilt (HPOHUT) and coefficient of variation (CV).
27

Figure 2.2: Muscle blood flow velocity (MBV) responses to dynamic plantar flexion exer-cise across two days of testing during lower power output: LPOHDT (A), LPOHOR (B) andLPOHUT (C). Lines indicate group response, symbols indicate the points at which repeata-bility were performed and dashed vertical lines indicate the start and cessation of exercise.Data are the mean ± SD analyzed over the last two minutes of exercise. Bland-Altmanplots during lower power output: LPOHDT (D), LPOHOR (E) and LPOHUT (F) over thelast two minutes of exercise (Difference MBV = MBVDay1 − MBVDay2, Average = (MB-VDay1 − MBVDay2)/2). Solid horizontal lines show mean values and dashed horizontallines represent 95% confidence limits. The symbols are offset for clarity.
28

2.5 Discussion
This is the first time that MBV, ADpop, MBF and VC repeatability were tested at rest andduring different work rates in HOR, HDT and HUT positions. The present study providedevidence that MBV and ADpop measured by Doppler ultrasound techniques are repeatableduring such body positions, consequently estimates of MBF and VC can be obtained bythese methods. The ultrasound data proved to be reliable and suitable for studies testingthe dynamic response of MBF and VC at rest and exercise with postural challenges.
2.5.1 Popliteal arterial diameter repeatability
ADpop estimation by echo Doppler ultrasound technique showed to be highly repeatablebetween two days of testing during both rest and exercise for all body positions. In thecurrent study, the mean CV between days for ADpop during both rest and exercise was ∼2%(Table 2.2 and Table 2.3, respectively). The CV in the current study is in a similar range ofprevious studies between ∼2-4% for brachial (Shoemaker et al., 1996), ∼1-4% for axillary(Walther et al., 2006, Amundsen, Wisloff, Helgerud, Hoff, and Slordahl, 2002), ∼1.5-2%for femoral (Walther et al., 2006, Radegran, 1997) and ∼2-5% for popliteal (Labropouloset al., 1998) arteries.
Measurement error in the estimation of vessel diameter could lead to large error in cal-culation of blood flow since flow is a function of the squared vessel radius (Walther et al.,2006, Radegran, 1997, Shoemaker et al., 1996). An error in the placement of the measure-ment calipers by the operator contributes for the variability in the diameter (Amundsenet al., 2002, Shoemaker et al., 1996). In the current study, the echo Doppler ultrasoundused has a resolution of 0.1mm. Therefore, this error for diameter in the range of 0.64cm(6.4mm) would contribute to ∼1.6% of the variability. This variability is slightly lowerthan the range reported by Shoemaker et al., 1996 between ∼2.5-3% and similar to therange of Amundsen et al., 2002 between ∼1-2%.
A further contributor to the diameter measurement variability is the motion duringmuscle contraction (Shoemaker et al., 1996). Strapping the participants on the tilt tableand the use of a small muscle mass with a short range of motion to exercise (plantar flexion)reduced the motion caused by calf muscle contractions. Despite this, movements of thepopliteal artery could occur during contractions increasing variability. An experiencedand well trained operator held the probe freely to follow the movement pattern of theartery to maintain optimal image. The same operator participated in all of the studiesminimizing potential systematic errors due to technique. An average of the diameters
29

was taken to produce one data set. Taken together, all these procedures were used tominimize ADpop measurements variability. Low coefficients of variation (∼2%) and goodagreement between these two days of testing indicated that image ADpop measurementswere consistently optimal and were not affected by repositioning of the probe.
2.5.2 Muscle blood flow velocity repeatability
MBV did not show differences across two days of testing during both rest and exercisepresenting greater variability than arterial diameter. In the current study, the CV forMBV ranged from ∼7-10% at rest (Table 2.2 and Figure 2.1) and from ∼4-9% duringexercise (Table 2.3, Figure 2.2). This variability during both rest and exercise is within therange of the brachial blood velocity between ∼7-25% at rest and ∼5-31% during handgripexercise (Walther et al., 2006), axillary between ∼13% at rest and ∼5-10% during elbow-flexion exercise (Walther et al., 2006, Amundsen et al., 2002), femoral between ∼14% atrest and ∼1-8% during knee-extension exercise (Walther et al., 2006, Radegran, 1997) andpopliteal between ∼5-36% at rest (Labropoulos et al., 1998).
MBF was calculated from ADpop and MBV, thus, CV values for MBF are dependentof these two variables. Since ADpop presented very small variability (∼2%) the CV valuesfor MBF were close to the MBV values during rest (Table 2.2) and exercise (Table 2.3).VC was calculated from MBF and MPP, thus, CV values for VC depends on the combinedvariability between MBF and MPP. Since MPP had small variation in the same bodyposition, the CV values for VC were close to the MBF values during rest (Table 2.2) andexercise (Table 2.3).
The main sources of variability in velocity measurements are: (1) error in the angle ofinsonation (Walther et al., 2006, Amundsen et al., 2002, Walther et al., 2006, Gill, 1985);(2) improper alignment of the ultrasound beam with the artery (Radegran, 1997, Gill,1985); (3) Doppler signal processing and (4) frequency estimation. Exercise contractioninduced variability in the angle of insonation of ∼ 5% (Shoemaker et al., 1996) where anerror of 3° when the angle of insonation was 55° would overestimate femoral and axillaryblood velocities by 8% (Amundsen et al., 2002). In the current study, the flat Dopplerultrasound probe was fixed over the popliteal artery during each test in an attempt tomaintain the angle of insonation constant and proper alignment between ultrasound beamand popliteal artery during both rest and exercise experiments. The pulsed ultrasoundprobe location was marked on the skin and the distance between probe and popliteal fossawas recorded to assist in the return of the probe to the same location during subsequenttests. Radegran, 1997 reported that vessel visualization and audiovisual blood velocityfeedback with continuous velocity measurements provide for the most accurate results.
30

Further variability in velocity measurements are influenced by physiological sources,such as, variation due to muscle contraction-relaxation phases (Osada, 2004, Radegran,1997, Shoemaker et al., 1996, Walloe and Wesche, 1988) and control of arterial perfusionpressure and downstream arteriolar tone (Radegran, 1997). Beat-by-beat blood flow veloc-ity variability during dynamic exercise is affected by the transient variations in intramuscu-lar pressure, cardiac cycle, and perfusion pressure during muscle contraction (Osada, 2004,Radegran, 1997, Walloe and Wesche, 1988). Blood flow stops or reverses momentarily andhigh intramuscular pressure is observed during muscle contraction phase. Subsequently,during the muscle relaxation phase, low intramuscular pressure allows a rapid and largeincrease in blood flow through the artery (Radegran, 1997, Shoemaker et al., 1996,Wal-loe and Wesche, 1988). The force (compression) produced during contractions could havean impact on the magnitude of the intramuscular pressure variations affecting perfusionpressure and consequently blood flow (Osada, 2004).
The muscle contraction-relaxation phases and blood flow velocity variability are closelyrelated (Radegran, 1997). Therefore, if blood flow velocity variation is highly influencedby muscle contraction-relaxation phases, it is expected that averaging blood flow velocitydata over longer periods of time (Radegran, 1997, Shoemaker et al., 1996) or higher numberof contraction-relaxation cycles (Osada, 2004, Radegran, 1997) would reduce variability.Analysis of blood flow velocity over long durations (Radegran, 1997, Shoemaker et al., 1996)or over an increased number of contraction-relaxation cycles (Osada, 2004) diminishedblood flow velocity variability. An additional source of blood flow velocity variabilitywould be the cadence of the contraction-relaxation cycle. Shorter or longer durations couldinfluence the timing of arterial perfusion pressure between the contraction and relaxationphases (Osada, 2004).
In the current study, attempts to attenuate the effects of the factors exposed previ-ously were taken to reduce MBV variability. First of all, the security and stability of theparticipants were guaranteed by a strap system connecting them to the tilt table. Morestability represented less unnecessary movements during muscle contractions, which im-proved the Doppler signal. An experienced and well trained operator performed all thetests. Room temperature was maintained sufficiently cool to diminish skin blood flow. Theexercise-induced variability was improved by averaging MBV data in contraction relaxationcycles. Since duration of duty cycle influences MBV variability, the cadence used in thisstudy, 60 beats per minute, 3s duty cycles (1s to extend the footplate, 1s to return it toresting position, and 1s of rest contraction) represented 20 contractions-relaxation cyclesper minute, was chosen to permit sufficient time for full relaxation of the working musclebetween contractions.
31

2.6 Conclusion
In conclusion MBV, ADpop, MBF, and VC were repeatable regardless of the body posi-tion during rest and exercise in different body positions and workloads. These variablespresented lower coefficient of variation and agreement over days of testing within a givenbody position, which are the requirements to ensure data repeatability. The data supportthe utilization of Doppler ultrasound and echo Doppler methods as a repeatable tool tomeasure conduit artery blood flow velocities and arterial diameters as well as for estima-tion of MBF and VC. The repeatability of these methods allows the measurement of thedynamic response of MBF and VC at rest and exercise.
32

Chapter 3
Adaptations of lower limb vascularconductance and resting blood flowduring head-up and head-downpostural challenge
33

3.1 Overview
This study tested the hypothesis that central and local reflex mechanisms affecting vascularconductance through the popliteal artery completely compensated for the reduction inarterial perfusion pressure to maintain muscle blood flow during head-down tilt (HDT)but not in head-up tilt (HUT). Resting measurements were made on 15 healthy men,all non-smokers, on two separate days during horizontal (HOR) baseline, HDT or HUTapplied in random order. In each body position, the leg and foot were suspended sothat there was no muscle tension as with normal standing or HUT with weight bearing.Popliteal artery blood flow velocity and diameter were measured by ultrasound and muscleblood flow (MBF) was calculated. Muscle perfusion pressure (MPP) was corrected tomid-calf from measured finger cuff pressure, and vascular conductance (VC) was estimatedby dividing MBF by MPP. The MPP in HDT (48.4 ± 2.0 mmHg) was approximately100 mmHg less than in HUT (145.0 ± 2.1 mmHg). MBF was similar between HOR(51.6 ± 17.8 mL.min-1) and HDT (46.6 ± 13.5 mL.min-1), but was lower in HUT (30.0± 8.7 mL.min-1). VC was different between HDT (1.0 ± 0.34 mL.min-1.mmHg-1), HOR(0.55 ± 0.16 mL.min-1.mmHg-1) and HUT (0.21 ± 0.06 mL.min-1.mmHg-1) postures, butthe relatively greater reduction during HUT resulted in lower MBF which could not beattributed to an elevated muscle tension that occurs with normal standing. These resultssuggested that the baroreflex, venoarteriolar reflex and/or myogenic responses contributedto a disproportionate reduction in VC during HUT at rest decreasing MBF, but in HDTreduced activation of the arterial and cardiopulmonary baroreflexes, myogenic vasodilationand inhibition of the veno-arteriolar reflex probably contributed to maintain MBF as thesame level as the control condition (HOR).
34

3.2 Introduction
Resting limb blood flow is determined by the interactions between perfusion pressure gra-dient and vascular conductance (Rowell, 1993). Even though arterial perfusion pressure iselevated in the head-up (HUT) or seated position, leg blood flow is reduced 33% or morecompared to the supine position in healthy subjects (Groothuis et al., 2005, Imadojemuet al., 2001, Delis et al., 2000) and in patients with spinal cord injury (Groothuis et al.,2005). The mechanisms accounting for the reduction in blood flow in the upright postureprobably include elevated sympathetic vasoconstriction due to activation of the cardiopul-monary and arterial baroreflexes (Bundgaard-Nielsen et al., 2009, Imadojemu et al., 2001,Ng, Johnson, Callister, and Seals, 1995, van Lieshout et al., 2005, Cui et al., 2003, Harmset al., 2003, Toska and Walloe, 2002, Matzen et al., 1991) an increase in myogenic responsewith elevated arterial pressure (Groothuis et al., 2005, Imadojemu et al., 2001) and anactivation of the veno-arteriolar reflex as the venous pressure is also elevated by the gravi-tational gradient (Groothuis et al., 2005, Tschakovsky and Hughson, 2000, Henriksen andSejrsen, 1977).
Little is known about blood flow when the lower limb is positioned above the heartlevel. During a transient, 20s, period in head-down tilt (HDT), it appeared that femoralblood flow returned close to the supine baseline values (Sheriff et al., 2007), but theirdata did not provide evidence that blood flow and vascular conductance stabilized in thisbody position. Blood flow to the arm in the above heart position has been reported tobe either not different (Hughson et al., 1996, Hildebrandt, Herrmann, and Stegemann,1993) or elevated (Walker et al., 2007, Saunders and Tschakovsky, 2004, Tschakovsky andHughson, 2000) when compared to below the heart. A single study reported arm bloodflow to be lower in both above and below heart positions when compared to the arm atheart level (Hildebrandt et al., 1993). The results from the arm appear to contrast withobservations from the leg and do not provide a basis for prediction of leg vascular responsesin HDT.
The purpose of the current study was to compare the central cardiac and peripheralvascular responses in three different body positions that affected the gravity-dependentdistribution of arterial and venous pressures. To avoid changes in intramuscular pressuredue to loading, the body was supported and the ankle was maintained in a constant,relaxed state. We hypothesized that central cardiac and local reflex mechanisms affectingvascular conductance would completely compensate for the reduction in arterial perfusionpressure to maintain muscle blood flow during HDT but, consistent with previous reports(Groothuis et al., 2005, Imadojemu et al., 2001, Delis et al., 2000), that muscle blood flowwould be reduced in HUT.
35

3.3 Methods
3.3.1 Participants
Fifteen healthy men, all non-smokers (29.6 ± 2.7 years, height 177.1 ± 5.5 cm, and bodymass 80.4 ± 13.5 Kg) volunteered for this study. Participants received complete writtenand verbal details of the experimental procedures and potential risks involved prior tosigning an information and consent form approved by the Office of Research Ethics of theUniversity of Waterloo. All participants were instructed to refrain from consuming alcohol,caffeinated beverages and engaging in vigorous exercise for 24 hours prior to testing, andfrom consuming a large meal within two hours of testing.
3.3.2 Experimental Design
Participants reported to the laboratory on two separate occasions. They assumed a proneposition with their face supported by a massage table head piece. Shoulder blocks wereadjusted accordingly and the arms were placed on the resting apparatus with the shouldersand elbows positioned at approximately 90°. Two belts, one located on the chest and otheron the hips, were used to secure the participants during testing. Straps from these beltswere attached in the tilt table to help to keep the participants from sliding.
Following this procedure, ECG electrodes were applied on the skin surface in the back, 4MHz pulsed Doppler ultrasound and 6-13 MHz echo Doppler ultrasound probes were placedon the skin over the popliteal artery. Once the participants were secured to the table, theywere familiarized with the tilt protocols then rested for approximately 30min before startingthe testing. None of the participants reported any discomfort during familiarization. Eachparticipant performed four repeated randomized trials, two trials of each condition per day.
The protocol consisted of three different gravitational stress conditions. First, par-ticipants performed 3min of baseline in a horizontal (HOR) position at 0°. Then, theparticipant was tilted in approximately 3s to 35°HDT or 45°HUT and this body positionwas maintained for 5min. After this period of time, the table was rotated back ( 3s) toHOR (control condition) for 5min. Subsequently, subjects were tilted to the other position,HUT or HDT, for 5min. The order of these conditions was randomized and counterbal-anced among the participants between HDT and HUT (Figure 3.1).
36

Figure 3.1: Resting protocol used to investigate the adaptations of the lower limb VCand resting MBF during HOR, HDT and HUT positions. Arrows indicate were ADpop
(popliteal arterial diameter) were taken.
The measurements were obtained in a quiet room, temperature was kept constant at21.1 ± 0.4 C, humidity at 34.0 ± 9.3% with barometric pressure at 733.4 ± 3.0 mmHg.
3.3.3 Data Acquisition
Muscle blood flow velocity (MBV) in the popliteal artery, heart rate (HR), cardiac output(Q) and blood pressure (BP) were measured beat-by-beat. MBV was determined from theintensity weighted mean of a 4 MHz pulsed Doppler ultrasound probe (Neurovision DopplerUltrasound, Model 500, Multigon Industries, Mt. Vernon, USA). The flat ultrasound probewas secured by surgical tape to the skin surface over the popliteal artery embedded at a45° angle of insonation relative to the skin and adjusted according to the measured anglebetween the skin and the popliteal artery.
Prior to each trial the popliteal artery was investigated to establish proper alignment,and to determine the depth and gate to assure full insonation of the artery lumen withoutcontamination from the venous signal. The probe location was marked on the skin toassist repositioning of the probe during the test and on subsequent tests. During the test,a researcher stood up beside the participants to follow the tilt table movement up or down.If it was necessary, the researcher manipulated the probe to preserve the best Dopplersignal as determined by constant use of auditory and visual feedback.
Diameter of the popliteal artery (ADpop) was collected using a 6-13 MHz echo Doppler
37

ultrasound probe (Sonosite Titan, Sonosite, Bothell, WA, USA). These ADpop images wererecorded and stored into a mini DV digital video cassette tape (Hitachi Maxell Ltd., modelDVM60SE, Osaka, Japan) for analysis. ADpop measurements were performed in B-modewith the echo Doppler ultrasound probe positioned a few centimeters proximal to the placeof velocity measurements. ADpop images were taken during diastole and each diameter wasselected from the single frozen screen image performed by the same operator measured fourseparate times at baseline (1.5min), 5.5 (HDT or HUT), 10.5 (HOR), and 15.5 minutes(HDT or HUT).
Systolic (SBP) and diastolic blood pressure (DBP) were determined by the inflation ofa photoplethysmograph cuff around the middle finger of the left hand (Finometer, FinapresMedical Systems, Arnhem, the Netherlands). Mean arterial pressure (MAP) was providedby the integration of the area under the curve. HR was continuously calculated from theRR-interval obtained from an electrocardiogram (ECG, Pilot 9200, Colin Medical Instru-ments Corp, San Antonio, Texas, USA). Q as estimated from the finger arterial pulse wavewith the Modelflow algorithm that incorporates age, sex, height, and weight as factorsto estimate stroke volume (SV) (Langewouters, Wesseling, and Goedhard, 1984). MBV,SBP, DBP, MAP and HR were continuously collected at 1000 Hz using a data acquisitionsystem (Powerlab, Chart, version 5.5, ADInstruments, Colorado Springs, USA).
3.3.4 Data Analysis
MBV, SBP, DBP, MAP, HR, and Q were analysed as beat-by-beat data (Chart, version5.5, ADInstruments, Colorado Springs, USA). Aberrant data from each trial were deletedthen time aligned and linearly interpolated to produce second-by-second values (Matlab,version 7.0, The Mathworks, Natick, Massachusetts, USA). Data were averaged to obtainone single value for each second and then averaged over the last two minutes of testing(3-5min).
MBF was estimated based on the MBV and ADpop cross-sectional area as MBF =MBV×πr2×60; where r is the vessel radius. Stroke volume (SV in mL) was calculated fromQ (L.min-1) as SV = (Q/HR)×1000. Systemic vascular conductance (SVC in L.min-1.mmHg-1)was calculated as SVC = (Q/MAP)×1000, with total peripheral resistance (TPR, mmHg.L.min-1)= MAP/Q. MPP was estimated by MAP (mmHg) and the distance between subjects heartand middle of the calf muscle (cm) in HOR, HDT, and HUT converted in millimeters ofmercury (mmHg, 1 mmHg = 1.36 cm of H2O) as demonstrated elsewhere (see 2.3.4 DataAnalysis, page 22). Vascular conductance (VC, mL.min-1.mmHg-1) was determined byMBF (mL.min-1) divided by MPP (mmHg) as VC = MBF/MPP.
38

3.3.5 Statistical Analysis
Variables were averaged over the last two minutes of testing for each position. Data un-derwent to a one way analysis of variance for repeated measures. If statistical differenceswere not detected between the trials, data for each trial was averaged for each condition toobtain a single value. Subsequently, a two-way analysis of variance for repeated measureswas performed with main effects of selected times (baseline and average of the last twominutes) and body positions (HOR, HDT, and HUT) for the dependent variables. TheStudent-Newman Keuls post-hoc test was performed on significant main effects and inter-actions. The level of significance was set at p < 0.05. Data are presented as means ±
standard deviation (SD).
3.4 Results
There were no significant differences in any of the measured peripheral vascular variablesduring the baseline periods prior to the HOR, HDT and HUT positions. The two-wayrepeated measures ANOVA indicated a main effect of time and body position and aninteraction between time and body position for MPP, MBV and MBF (p < 0.05) and amain effect of body position and interaction between time and body position for VC (p< 0.05). The post-hoc analysis indicated that following tilt, MPP was ∼47% lower in theHDT compared to HOR position, and ∼60% higher in HUT than HOR position (p < 0.05,Table 3.1). ADpop was not different between HOR, HDT, and HUT positions (Table 3.1).The post-hoc analysis indicated that following tilting, MBV was not different betweenHOR and HDT positions, but was ∼38% lower in HUT compared to both HOR and HDTpositions (p < 0.05, Table 3.1). As a consequence of the reduction in MBV, the calculatedMBF was also reduced in HUT (p < 0.05, Table 3.1, Figure 3.2A). The post-hoc analysisindicated that VC increased ∼82% in HDT position compared to HOR and reduced ∼62%in HUT compared to HOR position (Table 3.1, Figure 3.2B).
39

Table 3.1: MPP, ADpop, MBV, MBF and VC values at baseline and averaged data from 3to 5min following tilting during HOR, HDT, and HUT conditions.
Variables time points HOR HDT HUT
MPP (mmHg) baseline 89.8± 6.9 90.2± 6.6 90.5± 6.1MPP (mmHg) avg3-5min 90.7± 5.7 48.4± 7.9ac 145.0± 8.1abc
ADpop (cm) baseline 0.64± 0.06 0.64± 0.06 0.64± 0.06ADpop (cm) avg3-5min 0.64± 0.06 0.64± 0.06 0.64± 0.06
MBV (cm.s-1) baseline 2.6± 0.7 2.7± 0.9 2.7± 0.8MBV (cm.s-1) avg3-5min 2.7± 0.8 2.4± 0.7 1.6± 0.4abc
MBF (mL.min-1) baseline 53.2± 17.7 52.3± 18.6 53.2± 18.1MBF (mL.min-1) avg3-5min 51.6± 17.8 46.6± 13.5 30.0± 8.7abc
VC (mL.min-1.min-1) baseline 0.60± 0.21 0.60± 0.22 0.54± 0.12VC (mL.min-1.min-1) avg3-5min 0.55± 0.16 1.00± 0.34ac 0.58± 0.19abc
Values are mean ± SD of 15 participants. Muscle perfusion pressure (MPP), poplitealarterial diameter (ADpop), muscle blood flow velocity (MBV), muscle blood flow (MBF),vascular conductance (VC), horizontal (HOR), head-down tilt (HDT) and head-up tilt(HUT). Statistically significant differences compared to: aHOR, bHDT and cbaseline inthe same condition, p<0.05.
40

Figure 3.2: Comparison of MBF (A) and VC (B) responses during HOR, HDT and HUTpositions in steady-state at rest. Lines indicate the group responses, symbols indicatethe points at which statistical comparisons were performed (mean, n = 15) and dashedvertical lines indicate transitions from baseline to HDT and baseline to HUT. SD valueswere omitted and are found in Table 3.1. Statistically significant differences compared to:aHOR and bHDT, p<0.05. The symbols were offset for clarity.
Central cardiovascular responses were not different during baseline measurements, butwere affected by tilting. The two-way repeated measures ANOVA indicated a main effectof body position and an interaction between time and body position for SBP and MAPand a main effect of time for DBP (p < 0.05). The post-hoc analysis indicated that therewas a small but significant increase in SBP (∼4%) during HDT and a decrease in HUT(∼6%) compared to HOR position (p < 0.05, Table 3.2). Following tilting, DBP valueswere not different between all body positions, but increased slightly during HDT (∼5%),while MAP increased slightly during HUT both with respect to their baselines (p < 0.05,Table 3.2).
The two-way repeated measures ANOVA indicated a main effect of time and bodyposition for Q (p < 0.05). The post-hoc analysis indicated that there were no significantchanges in Q with tilt but slightly decreased during HDT with respect to its baseline(∼5%). A main effect of time and body position and an interaction between time andbody position was identified by the two-way repeated measures ANOVA for HR, SV, SVCand TPR (p < 0.05). The post-hoc analysis indicated that following tilting, HR decreased∼5% during HDT and increased ∼11% in HUT position compared to HOR position (p <
41

0.05, Table 3.2). SV was not different between HOR and HDT positions but was ∼12%reduced during HUT compared to HOR (p < 0.05, Table 3.2). SVC and TPR values werenot different between HOR and HUT positions, but SVC decreased ∼7% and TPR rose∼9% during HDT with respect to their baseline values (p < 0.05, Table 3.2).
The transient responses of MBF with the onset of tilt were primarily a consequenceof changes in MPP. In HUT, MBF increased to 109.4 ± 35.3 mL.min-1 compared to 53.2mL.min-1 in HOR (p < 0.05), while in the transition to HDT, MBF decreased to 18.5 ± 5.7mL.min-1 compared to 52.3 mL.min-1 in HOR (p < 0.05). Changes in VC are not reportedin the transition because of simultaneous, unknown effects on arterial and venous pressuresaffecting calculations.
42

Table 3.2: SBP, DBP, MAP, Q, HR, SV, SVC and TPR values at baseline and averageddata from 3 to 5min following tilting during HOR, HDT, and HUT conditions.
Variables time points HOR HDT HUT
SBP (mmHg) baseline 122.5± 7.9 123.0± 7.3 122.5± 7.1SBP (mmHg) avg3-5min 123.1± 6.3 128.3± 8.2ac 116.1± 6.7abc
DBP (mmHg) baseline 71.1± 6.1 71.2± 6.0 71.9± 5.6DBP (mmHg) avg3-5min 72.1± 5.4 74.5± 5.3c 73.1± 5.9
MAP (mmHg) baseline 89.8± 6.9 90.2± 6.6 90.2± 6.1MAP (mmHg) avg3-5min 90.7± 5.7 92.6± 6.7ac 89.4± 6.2b
Q (L.min-1) baseline 6.2± 1.0 6.2± 1.0 6.1± 0.8
Q (L.min-1) avg3-5min 6.1± 0.9 5.9± 1.1 5.9± 0.4
HR (bpm) baseline 63.2± 6.7 63.1± 6.8 63.5± 7.1HR (bpm) avg3-5min 63.5± 7.2 60.4± 6.0ac 70.6± 9.3abc
SV (mL) baseline 99.1± 12.8 99.5± 13.5 96.0± 12.3SV (mL) avg3-5min 96.3± 13.1 98.2± 14.2ac 84.7± 11.4abc
SVC (mmHg-1.mL.min-1) baseline 69.7± 12.8 69.4± 10.4 67.4± 10.0SVC (mmHg-1.mL.min-1) avg3-5min 67.2± 10.1 64.2± 11.4ac 67.4± 10.0b
TPR (L.min-1.mmHg-1) baseline 14.6± 2.2 14.7± 2.3 15.1± 2.2TPR (L.min-1.mmHg-1) avg3-5min 15.2± 2.3 16.0± 2.7ac 15.3± 2.0b
Values are mean ± SD of 15 participants. Systolic blood pressure (SBP), diastolic bloodpressure (DBP), mean arterial pressure (MAP), cardiac output (Q), heart rate (HR), strokevolume (SV), systemic vascular conductance (SVC) and total peripheral resistance (TPR).Statistically significant differences compared to: aHOR, bHDT and cbaseline in the samecondition, p<0.05.
43

3.5 Discussion
The novel finding during the HDT in the present study was that the 82% increase in VCcompletely compensated the 42 mmHg reduction in MPP in the lower leg such that restingMBF through the popliteal artery was maintained in this body position. In contrast, higherarterial and venous pressure in the HUT position was associated with a ∼62% reduction inVC and as a consequence resting MBF through the popliteal artery was diminished ∼38%.These results were consistent with the hypotheses as predicted based on observations fromthe forearm (Hughson et al., 1996) and previous investigations from the leg (Groothuiset al., 2005, Delis et al., 2000).
3.5.1 Local vascular responses in the transition from horizontalto head-down tilt
As anticipated the gravitational stress promoted by the transition from HOR to HDTposition caused an immediate decrease in MPP from ∼90 mmHg to ∼48 mmHg. Despitethis considerable drop in MPP that induced a brief reduction in MBF, steady-state MBFremained unchanged in HDT compared to HOR (Figure 3.2). These results contrast withthose of Sheriff et al., 2007. However, these researchers reported data from only the first 20sin 15°HDT when femoral blood flow velocity and femoral blood flow dropped transiently.The results of the current study showed that if sufficient time is allowed for the response tostabilize in the new HDT position MBF recovered to the same level as in HOR and higherthan HUT position.
Sheriff et al., 2007 reported a transient fall in femoral vascular conductance during 20sin 15°HDT. The recovery of MBF during sustained HDT was a consequence of a ∼82%increase in VC compared to the HOR position. There was only a very small increase inMAP during HDT (∼3%) and therefore the decline in MPP was primarily the effect ofthe gravitational gradient with the altered body position. The augmented VC response,which was similar to that observed with the arm above heart level (Tschakovsky and Hugh-son, 2000), indicated that vasodilation occurred at the level of resistance vessels (arteri-oles) and microvasculature to compensate for the reduction in MPP during HDT. RestingADpop measurements were not different between body positions (Table 3.1) indicating nodetectable vasodilatory response of the feed artery.
The mechanisms accounting for the increase in VC by vasodilation in the leg duringHDT were related to effects on gravitational gradients and shifts in blood volume. Pos-tural change from HOR to HDT induced a hydrostatic pressure gradient that caused the
44

translocation of venous blood volume from the lower extremities to the central region ofthe body (Bundgaard-Nielsen et al., 2009) as well as an increase effective arterial pressuredetected at the arterial baroreceptors in the carotid artery. The combined effects of thesetwo changes in stimulation of the cardiopulmonary and arterial baroreflexes would be areduction in sympathetic vasoconstrictor tone in the leg arteries (Nagaya et al., 1995, Row-ell, 1993). In HDT, the activation of the aortic and carotid arterial baroreceptors afferentwould be altered by the changes in the dimensions of the vessel walls contributing to thedecrease in the responsiveness of the baroreflex resulting in decreased sympathetic activitymediated by decreased vasomotor efferent activity (Charkoudian et al., 2004). As a conse-quence, there was vascular smooth muscles relaxation increasing arterial diameters as wellas increased activity of the parasympathetic vagal efferent resulting in the reduction of theHR.
The reduced MPP in the lower legs during HDT (Sheriff et al., 2007, Tschakovskyand Hughson, 2000) decreased transmural pressure and wall tension probably inducingrelaxation of the arteriolar resistance vessels through the myogenic response (Sheriff et al.,2007, Tschakovsky and Hughson, 2000, Rowell, 1993). The gravity-assisted shift in venousblood volume probably inhibited the veno-arteriolar reflex (Sheriff et al., 2007, Tschakovskyand Hughson, 2000). The combined effects of reduced sympathetic vasoconstrictor tone(inhibition of arterial and cardiopulmonary baroreflex), myogenic relaxation and inhibitionof the veno-arteriolar reflex vasoconstrictor response is an increase in vasodilation andconsequently VC (Sheriff et al., 2007, Tschakovsky and Hughson, 2000, Madsen et al.,1995) that fully compensated for the reduced MPP in the legs to maintain resting MBF.
3.5.2 Local vascular responses in the transition from horizontalto head-up tilt
The initial transition from HOR to HUT caused a brief elevation in MBF, but in spite ofthe sustained increase in MPP from ∼90 mmHg to ∼145 mmHg in the HUT position, MBFwas reduced ∼ 38% during resting steady-state condition in HUT compared to the HORposition (Figure 3.2A). The MBF responses in the current study are in line with thosemeasured previously in transitions from horizontal to sitting (Delis et al., 2000) and fromhorizontal to 40°HUT (Imadojemu et al., 2001). In these previous studies (Imadojemuet al., 2001, Delis et al., 2000), it was not specified whether there was weight bearing onthe leg which could increase muscle tension compressing the capillaries increasing vascularresistance. In the present study, there was no change in muscle tension with changes inbody position, so the vascular responses could be attributed to local changes in arterialand venous pressure, and to central reflex mechanisms.
45

The elevated MPP was expected to induce myogenic vasoconstriction that would con-tribute to the reduced VC with HUT in the current study and in previous investigations(Sheriff et al., 2007, Groothuis et al., 2005, Harms et al., 2003, Toska and Walloe, 2002,Imadojemu et al., 2001). There was no detectable constriction of the feed artery as indi-cated by the measurement of ADpop (Table 3.1) a finding consistent with other investiga-tions (Groothuis et al., 2005, Delis et al., 2000, Tschakovsky and Hughson, 2000).
A sympathetic nervous system vasoconstrictor response contributed to the reductionin VC in the HUT position. HUT shifted blood from the central circulation into the ab-dominal region and the legs inducing venous pooling (Bundgaard-Nielsen et al., 2009, vanLieshout et al., 2005, Groothuis et al., 2005, Cui et al., 2003, Harms et al., 2003, Toskaand Walloe, 2002, Rowell, 1993). This would in turn reduce venous return lowering cen-tral venous pressure and stimulating the cardiopulmonary baroreflex response to enhancemuscle sympathetic nerve activity (Cui et al., 2003, Toska and Walloe, 2002, Imadojemuet al., 2001). Further, HUT was associated with a reduction in SV and a decrease in SBPwhich, combined with the positioning of the carotid arterial baroreceptors above the heartlevel, would have increased sympathetic vasoconstrictor activity and increased HR. In thisposition, aortic and carotid baroreceptors afferent activity was inhibited decreasing theimpulses to the brain resulting in increased sympathetic activity mediated by increasedvasomotor efferent activity. As a result there was vasoconstriction of the vascular smoothmuscle reducing arterial diameter as well as decreased activity of parasympathetic efferent(vagus) resulting in elevation of the HR.
Venous pressure increased with the progressive pooling of blood early during HUT (Cuiet al., 2003, Madsen et al., 1995, Matzen et al., 1991) increasing arteriolar vasoconstrictionof the corresponding arteriole due to the veno-arteriolar reflex (Tschakovsky and Hughson,2000, Henriksen and Sejrsen, 1977). The combined effects of the elevated sympatheticvasoconstrictor activity (arterial and cardiopulmonary baroreflex), the veno-arteriolar re-flex and the myogenic response caused vasoconstriction of the leg arteries contributing tothe reduction in VC decreasing MBF. Enhanced sympathetic vasoconstriction would haveprevented further reduction in central blood volume acted to preserve SV and Q (Rowell,1993).
3.5.3 Central cardiovascular responses
In contrast to the marked vascular responses of the lower legs in the current study, thecentral circulatory effects resulting from changes in body position were relatively minor.In HDT, there were small increases in SBP and MAP along with a small reduction in
46

HR as seen previously (Bundgaard-Nielsen et al., 2009, Harms et al., 2003). Q and SVwere not different in HDT probably because the angle of tilt was not sufficient to inducemarked changes in venous filling pressure from the HOR position (Bundgaard-Nielsen etal., 2009, van Lieshout et al., 2005, Harms et al., 2003). The small decrease in SVC wasconsistent with the estimated results based on the data provided by Bundgaard-Nielsen etal., 2009from supine to 45° and 70°HDT, but for previous investigations with only 20°HDTthere were no differences between SVC (van Lieshout et al., 2005, Harms et al., 2003).Thus, in HDT when there was a marked increase in VC of the lower leg, there was a slightoverall reduction in SVC which reflected regional differences in vascular responses inducedby the altered gravitational effects.
In the HUT position, the anticipated reduction in SV was observed (Bundgaard-Nielsenet al., 2009, van Lieshout et al., 2005, Groothuis et al., 2005, Cui et al., 2003, Harms et al.,2003, Toska and Walloe, 2002) along with small decreases in SBP and MAP which wereconsistent with some (van Lieshout et al., 2005, Harms et al., 2003, Imadojemu et al.,2001), but not all investigations of HUT (Bundgaard-Nielsen et al., 2009, Groothuis et al.,2005, Toska and Walloe, 2002). HR was elevated in HUT, probably as a consequence ofarterial baroreflex withdrawal of vagal activity, thus there was no overall change in duringHUT (Sheriff et al., 2007, Groothuis et al., 2005, Harms et al., 2003); although somestudies have reported reduced (Bundgaard-Nielsen et al., 2009, van Lieshout et al., 2005,Cui et al., 2003, Toska and Walloe, 2002). Overall, SVC was not different in HUT andHOR (Table 3.2) which reflects again regional differences in vascular responses with tilt asthe lower leg VC was reduced during HUT. Unchanged SVC was shown with HUT to 45°by Groothuis et al., 2005. However, previous investigations using higher angles of tiltingup to 70° demonstrated a reduced SVC suggesting an augmented vasoconstrictor responseduring HUT position (Bundgaard-Nielsen et al., 2009, van Lieshout et al., 2005, Cui et al.,2003, Harms et al., 2003, Toska and Walloe, 2002).
3.5.4 Methodological considerations and study limitations
In the current study, subjects were positioned prone (face-down) to enable easy accessto the popliteal artery. Participants were suspended on the tilt table by a chest beltand hip belt as well as held during HDT by shoulder blocks, the feet were in a relaxedstate. These procedures ensured that the leg did not support any weight in any positionand both leg and foot were in the same position eliminating any change in the loadingof the calf muscles. The positioning prevented any muscle activity that might changemetabolic demand or development of tension in the muscle that could have altered theexternal pressures on capillaries and venules as experienced during standing (van Dijk et
47

al., 2005, Modin, 2003). Therefore, intravascular pressures were modified only by gravityand vascular responses occurred in response to these changes and to reflex mechanisms toregulate MBF.
In the current study, venous pressure was not measured; however, our approach wassimilar to that of Sheriff et al., 2007 who referred to this as the virtual conductance. VCwas reported only during the steady-state in each posture so transient changes in venouspressure were not included in any calculations considered in this study. Likewise, CVPwas not estimated thus calculations of SVC or TPR were limited to estimates based solelyon MAP.
Central cardiovascular responses were estimated from the Modelflow algorithm analysisof the finger arterial pressure wave. Recent evidence suggested that this estimate of SVand Q might be high under conditions of HUT (Dyson, Shoemaker, Arbeille, and Hughson,2010). This could mean in the current study that the drop in Q from HOR to HUT wasunder-estimated by this method.
3.6 Conclusion
In conclusion, resting MBF through popliteal artery was maintained during HDT posi-tion probably due to combined effects of myogenic vasodilatory response, inhibition of theveno-arteriolar reflex constrictor response and decreased baroreflex activity causing va-sodilation and consequent increase in VC. Conversely in HUT, VC was decreased whenMPP was higher so that lower leg MBF was actually reduced compared to both HORand HDT, probably due to the combined effects of increased arterial and cardiopulmonarybaroreflex activation of the sympathetic nervous system, vasoconstriction induced by theveno-arteriolar reflex and/or myogenic responses. The results have implications for mus-cle oxygen delivery and the potential for meeting the demands of physical activity underconditions where MPP is varied as a function of body position. Under resting conditions,maintained MBF in the HDT position kept oxygen delivery constant, but during the chal-lenge of exercise it is possible that there will be limitations in the ability to recruit increasesin VC so that oxygen delivery could be compromised in the face of reduced perfusion pres-sure. In contrast during HUT, resting MBF was reduced even though perfusion pressurewas increased. This probably means there is a greater reserve in the upright position toincrease VC during exercise and allow for greater oxygen delivery as a consequence of theelevated arterial perfusion pressure.
48

Chapter 4
The changes in anterograde andretrograde muscle blood flow velocitypatterns during postural challenge
49

4.1 Overview
This study tested the hypothesis that anterograde and retrograde blood flow velocities(MBVant and MBVret) in the lower legs present different patterns during three differentbody positions that affected the gravity-dependent distribution of arterial and venous pres-sures impacting net muscle blood flow velocity (MBVnet) and vascular conductance (VC).Resting measurements were made on 15 healthy men on two separate days during horizontal(HOR), head down-tilt (HDT) or head-up tilt (HUT) applied in random order. Poplitealartery blood flow velocity (MBV) and diameter (ADpop) were measured by ultrasound andmuscle blood flow (MBF) was calculated. Muscle perfusion pressure (MPP) was correctedto mid-calf from measured finger cuff pressure, and vascular conductance (VC) was esti-mated by dividing MBF by MPP. In six participants, popliteal artery longitudinal viewand MBV profile images were measured by colour Doppler ultrasound imaging. MBVant
and MBVret were provided by the mean velocity within each cardiac cycle. MBVant andMBVret were greater in HDT (8.3 cm.s-1 and -5.9 cm.s-1) and lower in HUT (1.8 cm.s-1 and-0.6 cm.s-1) compared to HOR (3.6 cm.s-1 and -1.5 cm.s-1). MBVnet was maintained despitereduction in perfusion pressure during HDT (2.4 cm.s-1) compared to HOR (2.1 cm.s-1) butit was lower under elevated perfusion pressure (1.5 cm.s-1), while VC was greater in HDTbut lower in HUT. In conclusion, the same MBVnet was attained in HOR and HDT de-spite differences in MBVant and MBVret. However, in HUT, the decreased MBVnet wasaccompanied by reductions in MBVant and MBVret. The mechanisms accounting for theseresponses probably involved changes in vascular conductance and arterial compliance.
50

4.2 Introduction
In the previous study (Chapter 3), it was demonstrated that resting muscle blood flowvelocity (MBV) and muscle blood flow (MBF) were not different between head-down tilt(HDT) and horizontal (HOR) position, but MBV and MBF were reduced in head-uptilt (HUT). These responses indicated that MBV, MBF and vascular conductance (VC)responses were influenced by alterations in muscle perfusion pressure (MPP) with conse-quent changes in VC. These previous results were based only on the averaged MBV, MBFand VC over a beat and averaged over the last two minutes of testing representing thenet arterial responses in each body position. However, when only mean values are presentimportant information concerning to flow patterns are unexplored (Thijssen et al., 2009).
In Chapter 3, it was noticed that the MBV waveform was quite different between bodypositions, thus, it was decided to investigate the MBV waveforms and patterns within acardiac cycle under altered MPP. Anterograde and retrograde flow velocity waveforms andpatterns (MBVant and MBVret) in a peripheral artery affect the shear patterns (Padillaet al., 2010) being dependent on the interplay between perfusion pressure and local periph-eral vascular resistance or conductance (Baccelli et al., 1985) and downstream compliance(Zamir, Goswami, Salzer, and Shoemaker, 2007). Previous studies demonstrated thatchanges in perfusion pressure and local peripheral vascular resistance modified blood flowvelocity waveform and profile in brachial human artery (Baccelli et al., 1985) or in femoral,popliteal, posterior tibial and pedal arteries during supine position (Risoe and Wille, 1978)or in popliteal artery from supine to orthostatic position (Modin, 2003). Nevertheless, Za-mir et al., 2007 demonstrated that not only changes in vascular resistance, but also changesin compliance were involved in vascular tone control. However, the effects of passive HDTand HUT on the MBVant and MBVret patterns are not well characterized.
The purpose of the current study was to compare MBV patterns during three differentbody positions that affected the gravity-dependent distribution of arterial and venous pres-sures. We hypothesized that MBVant and MBVret in the lower leg during HOR, HDT andHUT positions would present different patterns and waveforms due to the effects of grav-ity on perfusion pressure, changes in VC and arterial compliance. We also hypothesizedthat in HDT position, less distension of the arterioles would increase arterial complianceand that associated with an increase in VC there would be an increase in MBVant withcorresponding changes in MBVret to maintain MBVnet. Likewise, in HUT, the higher dis-tending pressure in the arterioles would decrease arterial compliance that combined withthe reduction of VC would not only reduce, but also change the ratio of MBVant to MBVret
with consequent decrease in MBVnet.
51

4.3 Methods
4.3.1 Participants
Fifteen healthy men, all non-smokers (29.6 ± 2.7 years, height 177.1 ± 5.5 cm, and bodymass 80.4 ± 13.5 Kg) volunteered for this study. Participants received complete writtenand verbal details of the experimental procedures and potential risks involved prior tosigning an information and consent form approved by the Office of Research Ethics of theUniversity of Waterloo. All participants were instructed to refrain from consuming alcohol,caffeinated beverages and engaging in vigorous exercise for 24 hours prior to testing, andfrom consuming a large meal within two hours of testing.
4.3.2 Resting Protocol
The experimental design used in the current study was previously described elsewhere(2.3.2 Experimental design, page 19-20). The resting protocol consisted of three differentgravitational stress conditions. First, participants performed 3min of baseline in HORposition at 0°. Then, the participant was tilted in approximately 3s to 35°HDT or 45°HUTand this body position was maintained for 5min. After this period of time, the tablewas rotated back ( 3s) to HOR (control condition) for 5min. Subsequently, subjects weretilted to the other position, HUT or HDT, for 5min. The order of these conditions wasrandomized and counterbalanced among the participants between HDT and HUT (see,Figure 3.1, page 37). The measurements were obtained in a quiet room, temperature waskept constant at 21.1 ± 0.4 °C, humidity at 34.0 ± 9.3% with barometric pressure at 733.4± 3.0 mmHg.
4.3.3 Data Acquisition
Muscle blood flow velocity (MBV) in the popliteal artery, heart rate (HR), cardiac output(Q) and blood pressure (BP) were measured beat-by-beat. MBV was determined from theintensity weighted mean of a 4 MHz pulsed Doppler ultrasound probe (Neurovision DopplerUltrasound, Model 500, Multigon Industries, Mt. Vernon, USA). The flat ultrasound probewas secured by surgical tape to the skin surface over the popliteal artery embedded at a45° angle of insonation relative to the skin and adjusted according to the measured anglebetween the skin and the popliteal artery.
52

Prior to each trial the popliteal artery was investigated by the echo Doppler ultrasoundto establish proper alignment, and to determine the depth and gate to assure full insonationof the artery lumen without contamination from the venous signal. The probe location wasmarked on the skin to assist repositioning of the probe during the test and on subsequenttests. During the test, a researcher stood up beside the participants to follow the tilttable movement up or down. If it was necessary, the researcher manipulated the probeto preserve the best Doppler signal as determined by constant use of auditory and visualfeedback.
The colour Doppler ultrasound imaging measurements were collected using a 8-12 MHzecho Doppler ultrasound probe (Diagnostic Ultrasound system, Mindray, Model M5, Shen-zen Mindray Bio-medical Electronics Co., Ltd., Shenzen, China). These popliteal artery(ADpop) images were recorded and stored for analysis. The echo Doppler ultrasound probewas positioned just proximal to the site of velocity measurements. The ADpop imagesfrom the longitudinal view were taken in M-mode and MBV profile images were taken inB-imaging with Doppler and colour during systole and diastole.
Arterial pressure was determined by the inflation of a photoplethysmograph cuff aroundthe middle finger of the left hand (Finometer, Finapres Medical Systems, Arnhem, theNetherlands). Mean arterial pressure (MAP) was provided by the average within eachcardiac cycle. HR was continuously calculated from the RR-interval obtained from anelectrocardiogram (ECG, Pilot 9200, Colin Medical Instruments Corp, San Antonio, Texas,USA).MBV, SBP, DBP, MAP and HR was continuously collected at 1000 Hz using a dataacquisition system (Powerlab, ADInstruments, Colorado Springs, USA) connected to thecomputer to record data for analysis (Chart, version 5.5, ADInstruments, Colorado Springs,USA).
4.3.4 Data Analysis
MBV waveform was separated into MBVant and MBVret within the cardiac cycles for eachbody position (Matlab, version 7.0, The Mathworks, Natick, Massachusetts, USA). TheMBVant, MBVret and MBVnet were determined as the mean velocity within each cardiaccycle. Following this, these data were averaged over the last minute of testing for eachbody position. VC was taken as the reciprocal of vascular resistance calculated as MBFdivided by MPP as VC = MBF/MPP as previously demonstrated elsewhere (Chapter 2,page 22).
53
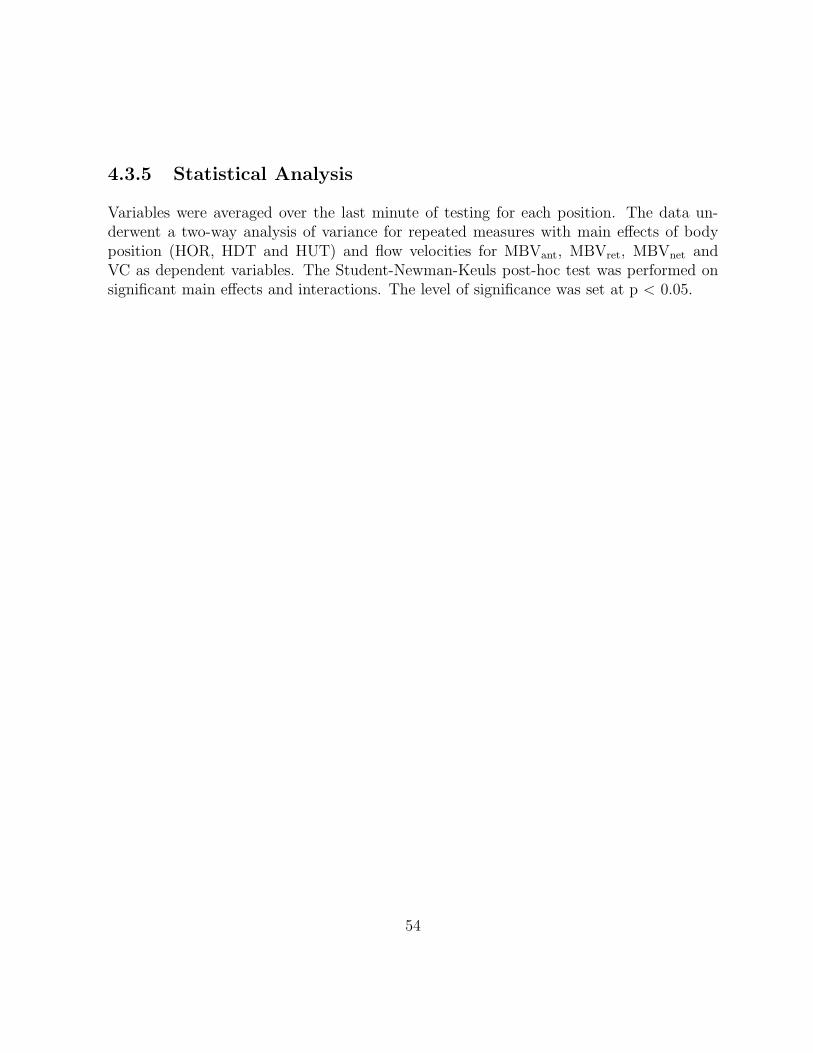
4.3.5 Statistical Analysis
Variables were averaged over the last minute of testing for each position. The data un-derwent a two-way analysis of variance for repeated measures with main effects of bodyposition (HOR, HDT and HUT) and flow velocities for MBVant, MBVret, MBVnet andVC as dependent variables. The Student-Newman-Keuls post-hoc test was performed onsignificant main effects and interactions. The level of significance was set at p < 0.05.
54

4.4 Results
4.4.1 Muscle blood flow velocity patterns in different body po-
sitions
The MBVant and MBVret within a cardiac cycle were greater in HDT and smaller in HUTposition than in the HOR position (Figure 4.1).
Figure 4.1: Illustration of MBV profile taken from a single participant during rest indifferent body positions: (A) head-down tilt (HDT); (B) horizontal (HOR) and (C) head-up tilt (HUT) using a non-imaging Doppler ultrasound. During the cardiac cycle, thereare anterograde (positive) and retrograde (negative) flow patterns related to the vascularresistance and downstream compliance.
55

Longitudinal images of the popliteal artery from the colour Doppler ultrasound imagingdemonstrated that during the systolic phase of the cardiac cycle there was an anterogradeflow velocity (positive, in red) followed by retrograde flow (negative, in blue) during thediastolic phase of the cardiac cycle (Figure 4.2A, 4.2B, 4.2C, 4.2D). The velocity waveformsobtained in the same conditions were similar between Doppler ultrasound imaging (Min-dray) which shows the placement of the ultrasound gate in the popliteal artery, and theMBV from the non-imaging Doppler ultrasound system (Multigon) with anterograde andretrograde velocities during systole and diastole during horizontal (HOR) (Figure 4.2E,4.2G) and HDT (Figure 4.2F, H).
56

Figure 4.2: Illustration of the Doppler ultrasound imaging of the anterograde (red) andretrograde flow (blue) in the popliteal artery during HOR and HDT taken from a singleparticipant. Longitudinal views during anterograde flow in HOR (A) and HDT (B); lon-gitudinal views during retrograde flow in HOR (C) and HDT (D); flow velocity profilesusing colour Doppler ultrasound imaging in HOR (E) and HDT (F); flow velocity profilesusing non-imaging Doppler ultrasound in HOR (G) and HDT (H).
57

4.4.2 Muscle blood flow velocity patterns in different body po-
sitions
The two-way repeated measures ANOVA indicated a main effect of flow velocities and aninteraction between flow velocities and body position (p < 0.05). The post-hoc analysisshowed that in the last minute of tilt in each body position, MBVant was greater thanMBVret (p < 0.05) which ensured net forward flow velocity for all body positions (Table4.1). The MBVant and MBVret were greater in HDT but were smaller in HUT positioncompared to HOR (p < 0.05, Table 4.1). Despite the differences in MBV patterns, theMBVnet was not different between HDT and HOR but it was lower in HUT compared toHOR and HDT positions (p < 0.05, Table 4.1).
Table 4.1: MBVant, MBVret, MBVnet, MPP, ADpop and VC averaged in the last minute oftilting during HOR, HDT, and HUT conditions.
Variables HOR HDT HUT
MBVant (cm.s-1) 3.6± 1.2c 8.3± 2.5ac 1.8± 0.7abc
MBVret (cm.s-1) −1.5 ± 0.5 −5.9± 2.1a −0.6 ± 0.2ab
MBVnet (cm.s-1) 2.1± 0.9 2.4± 1.2 1.2± 0.5ab
MPP (mmHg) 90.7± 5.7 48.4± 7.9a 145.0± 8.1ab
ADpop (cm) 0.64± 0.06 0.64± 0.06 0.64± 0.06VC (mL.min-1.min-1) 0.55± 0.16 1.00± 0.34a 0.21± 0.06ab
Values are mean ± SD of 15 participants. Anterograde muscle blood flow velocity(MBVant), retrograde muscle blood flow velocity (MBVret), net muscle blood flow velocity(MBVnet), muscle perfusion pressure (MPP), popliteal arterial diameter (ADpop), vascu-lar conductance (VC). Statistically significant differences compared to: aHOR, bHDT andcMBVret, p<0.05.
58

4.5 Discussion
The patterns of MBVant, MBVret, and MBV waveforms within a cardiac cycle were quitedifferent between body positions. The primary novel finding of the present study wasthat the same average MBVnet in the popliteal artery was attained in the HOR and HDTpositions with different absolute values of MBVant and MBVret in the two body positions.In HDT, the greater increase in both MBVant and MBVret was probably due to the increasein arterial compliance and VC that compensated for the lower MPP to maintain MBVnet
at the same level as HOR position. Conversely, lower MBVnet in the popliteal arterywas observed in the HUT due to the reductions of MBVant and MBVret probably as theresult of lower arterial compliance and VC changing the ratio between MBVant and MBVret
compared to the other two body positions.
4.5.1 Muscle blood flow velocity waveforms in different body po-
sitions
The popliteal artery MBV waveforms were different between all body positions consistingof a response with three components. The first component was the highest forward flowmagnitude (anterograde flow) during systole that was higher in HDT and lower in HUTposition. This phase was followed by a second reverse component (retrograde flow) duringdiastole that was higher in HDT and lower in HUT position. After that, a third componentcontaining a second forward flow (anterograde flow) during late diastole of less magnitudewas observed in HOR and HUT (HOR > HUT), but not in HDT before blood flow velocityfell close to zero (Figure 4.1). The highest MBVant and MBVret occur in the centre of theartery lumen (Baccelli et al., 1985, Blackshear, Phillips, and Strandness, 1979) which bothdiminished progressively from this point to the proximity of artery wall (Baccelli et al.,1985) within a cardiac cycle for all body positions (Figure 4.2A, 4.2B, 4.2C, 4.2D). Thecharacteristics of MBV waveforms for HOR and HUT positions are consistent with thedescriptions for brachial (Baccelli et al., 1985), femoral (Blackshear et al., 1979, Risoe andWille, 1978), popliteal (Risoe and Wille, 1978) and posterior tibial arteries (Risoe andWille, 1978).
59

4.5.2 Patterns of the muscle blood flow velocity and vascular
conductance in different body positions
4.5.2.1 Head-down tilt
The MBVant and MBVret presented an increase of ∼131% and ∼293%, respectively, andVC increased 82% when the legs were positioned above the heart level (HDT) in responseto the ∼47% reduction in MPP (Table 4.1). Regardless of the larger relative increase in theMBVret, the absolute MBVant surpassed the MBVret resulting in forward MBVnet withinthe cardiac cycles during HDT being sufficiently great to maintain the MBVnet valuessimilar to the HOR position (Table 4.1). Despite similar MBVnet both body positionspresented marked differences in MBVant and MBVret as previously reported by Thijssenet al., 2009, Baccelli et al., 1985 and Risoe and Wille, 1978 during supine position. Inthe current study, the results indicated that MBVant and MBVret were directly relatedto the VC and inversely related to the perfusion pressure and local peripheral vascularresistance demonstrating the importance of local vascular resistance for the shape of thevelocity pattern in the artery (Risoe and Wille, 1978). Baccelli et al., 1985 demonstratedthat reduction of perfusion pressure by progressive inflation of an arm cuff decreased bothanterograde and retrograde peak brachial artery flow velocities in supine position. Intheir study, MBVant was inversely related to local vascular resistance while MBVret wasdirectly related to local vascular resistance. Zamir et al., 2007 reported that after wrist cuffinflation, vascular resistance in the brachial artery increased with no changes in arterialcompliance but with elevation of the arm above heart level arterial compliance increasedwith no changes in resistance indicating that changes in vasomotor tone involved not onlychanges in arterial diameter, but also changes in arterial stiffness. Grassi et al., 1995 showedinverse relationship between radial compliance and muscle sympathetic nerve activity.
The mechanisms accounting for the greater MBVant and MBVret during HDT positionprobably involves the increase in arterial compliance (Zamir et al., 2007, Grassi et al.,1995) and increase in VC (Thijssen et al., 2009, Baccelli et al., 1985, Risoe and Wille,1978). In HDT, the lower MPP diminished distending and transmural pressures lead-ing to a reduction in the stretch of the arterioles probably increasing arterial complianceconsequently enhanced arterial inflow would be expected. The relaxation of the vascularsmooth muscle during HDT causing vasodilation increasing arterial compliance is in agree-ment with the higher arterial compliance with the arm above heart level (Zamir et al.,2007) and with greater compliance under lower muscle sympathetic nerve activity (Grassiet al., 1995). The distending pressure on the vessel wall reduces transmural pressure acrossthe arterioles inducing vascular smooth muscle relaxation via myogenic reflex (Toska and
60

Walloe, 2002, Imadojemu et al., 2001). The venous emptying induces the unloading ofthe veno-arteriolar reflex response (Sheriff et al., 2007, Tschakovsky and Hughson, 2000).The arterial baroreflex activity is probably reduced which would decrease the sympatheticvasoconstrictor tone in the lower leg arteries (Nagaya et al., 1995). Together, these effectsinduced vasodilation with consequent increase in VC and arterial compliance.
In HDT, the higher MBVant associated with greater arterial compliance and VC wouldincrease the net storage of blood in the elastic arteries during systole. As a consequence,during diastole, greater volume of blood would be available in these elastic arteries duringrelaxation increasing MBV. However, during diastole in HDT, the reduction in pressuregradient combined with increases in resistance to flow caused by the effects of gravity wouldnot sustain forward flow resulting in greater reverse flow (MBVret). Despite the greaterincrease in MBVret, the combined effects of increased arterial compliance and VC enhancedMBVant sufficiently to maintain MBVnet in this position at the same level as HOR despitethe reduction in MPP.
4.5.2.2 Head-up tilt
The MBVant and MBVret decreased ∼50% and ∼60%, respectively, when the legs were po-sitioned below the heart level (HUT) in response to the ∼60% increase in MPP (Table 4.1).Modin, 2003 demonstrated from supine to standing with weight bearing that MBVant wasreduced and MBVret decreased until it disappeared in the popliteal artery. In the presentstudy, both MBVant and MBVret were reduced but MBVret was not abolished as describedby Modin, 2003. Although standing-up and passive HUT are comparable, they are notphysiological identical forms of postural challenge (Spodick and Lance, 1977). During thepassive HUT in this study, the legs did not support any weight eliminating any change inthe loading of the calf muscles, preventing muscle activity to increase metabolic demandand development of muscle tension that could have altered the external pressures on thecapillaries and venules. The muscle reflexes activation associated with the development ofmuscle tension probably augment external pressures on the capillaries and venules duringweight bearing could reduce VC, but also could increase VC due to the metabolites pro-duced by muscle contraction. This could be the reason for the differences between MBVret
and VC responses in both studies.
The MBVant and MBVret demonstrated marked changes between body positions affect-ing MBVnet. The MBVant decreased ∼7% less than MBVret resulting in forward MBVnet
within the cardiac cycles during HUT, despite this, MBVnet decreased ∼38% compared toHOR and HDT positions (Table 4.1). The increase in MPP and local vascular resistance
61

were associated with decreases in MBVant and MBVret indicating an inversely relationship(Risoe and Wille, 1978).
The mechanisms accounting for the lower MBVant and MBVret during HUT positionprobably involves the decrease in arterial compliance and VC (Grassi et al., 1995). In HUT,the increase in distending and transmural pressures associated with greater volume of bloodin the lower legs would increase the distending force in the arteries. As a consequence ofthe increased distending pressure within the arterioles, the stretch of the arterioles wouldincrease resulting in decrease of arterial compliance (Zamir et al., 2007). During HUT, thecombined effects of myogenic vasoconstriction (Groothuis et al., 2005, Toska and Walloe,2002, Imadojemu et al., 2001), activation of the veno-arteriolar reflex (Groothuis et al.,2005, Tschakovsky and Hughson, 2000, Henriksen and Sejrsen, 1977) and the activation ofthe arterial and cardiopulmonary baroreflexes to elevate sympathetic vasoconstriction inthe arteries of the legs (Cui et al., 2003, Toska and Walloe, 2002, Imadojemu et al., 2001)reduced VC. The combination of these effects probably increased the contractile state ofthe vascular smooth muscle in the lower legs decreasing arterial diameter and arterialcompliance (Grassi et al., 1995).
During HUT, elevated MPP probably caused the decrease in arterial compliance andarterioles diameter (as indicated by the decrease in VC) resulting in a reduction of forwardflow (MBVant) due to higher resistance in these arterioles. During diastole, the lowerforward flow (MBVant) could not be sustained due to the reduction in the pressure gradientas a consequence of the drop in diastolic pressure resulting in reverse flow (MBVret). Thecombined effects of reduced arterial compliance and increased vasoconstriction diminishingvascular conductance would result in a decrease in MBVant and MBVret resulting in lowerMBVnet in conditions with elevated MPP.
4.5.3 Limitations
The anatomical location of the popliteal vein related to the popliteal artery could affect thesignal of the Doppler ultrasound due to the proximity between them. As a result MBVret
could be overestimated if negative flow velocity from the popliteal vein is present. In thisscenario, the gate to assure full insonation of the artery lumen could be insonating part ofthe vein flow (Figure 4.3B, 4.3D). It was taken a great care to avoid vein in the Dopplersignal (Figure 4.3A, 4.3C). Prior to each trial the popliteal artery was investigated toestablish proper alignment, and to determine the depth and gate to assure full insonation ofthe artery lumen without the vein. The intensity of the Doppler spectrum was constantlyverified by audio and visual feedback. Therefore, it is believed that these procedures
62

ensured a reliable set of data and did not affect the interpretation of the results in thecurrent study.
Figure 4.3: Illustration of the Colour Doppler ultrasound images of the flow velocity profilesconsisting of anterograde flow (positive) and retrograde flow (negative) in the poplitealartery during HOR and HDT without vein (A and C, respectively) and with the presenceof the vein (B and D, respectively).
The colour Doppler ultrasound imaging alias occurs if velocity exceeds the limit of thecolour scale as a result equipment interprets high velocity in one direction as lower velocityin the other direction (Lunt, 1999). The highest flow velocities patterns were locatedin the centre of the popliteal artery due to the laminar flow characteristics regardlessof body position. Consequently, MBV need to be analysed carefully to account for thisalias effect on the colour Doppler ultrasound imaging signal especially in the centre of theartery. Despite this limitation, colour Doppler ultrasound imaging was able to demonstratethat MBV patterns and waveforms were different between body positions being confirmedby the comparison between the waveforms with non-imaging Doppler ultrasound system(Multigon) (Figure 4.2E, 4.2F, 4.2G, 4.2H).
63

In the current study, VC was calculated dividing MBF and MPP (VC = MBF/MPP),but the arterial compliance component was not determined. Therefore, it is uncertainthe contribution of arterial compliance for the differences between MBVant and MBVret
between body positions. Despite this the results of the current study are in line of thosereported by Grassi et al., 1995 and Zamir et al., 2007. Zamir et al., 2007 determined arte-rial compliance in the brachial artery with the arm above the heart level. In their modelnot only resistance and compliance were include, but also viscoelasticity of the vessel andinductance representing the effects of fluid and vessel wall inertia (RCKL model). Bothstudies suggested that not only changes in vessel diameter (vasodilation or vasoconstric-tion), but also changes in vessel stiffness (compliance) should be considered to analysechanges in vasomotor tone. Even though, important information about the role of vascularcompliance in vasomotor control in skeletal muscle was obtained with RCKL model, itrepresents a simplification of the physiological system Zamir et al., 2007, thus data needto be analysed with caution.
4.6 Conclusion
In conclusion, patterns of MBVant and MBVret and MBV waveforms within a cardiac cyclewere different between body positions due to the effects of gravity on MPP and its con-sequences to VC and arterial compliance. Similar average MBVnet in the popliteal arterywas attained in the HOR and HDT positions with different absolute values of MBVant
and MBVret. A greater forward (MBVant) and reverse (MBVret) flow was observed in thelower legs during HDT position probably due to the increase in arterial compliance and VCthat compensated for the lower MPP. In contrast, during HUT, the average MBVnet in thepopliteal artery was lower presenting smaller forward (MBVant) and reverse (MBVret) flowscompared to HOR and HDT positions probably due to the decrease in arterial complianceand VC.
64

Chapter 5
Effect of altered arterial perfusionpressure on vascular conductance andmuscle blood flow responses duringexercise in humans
65
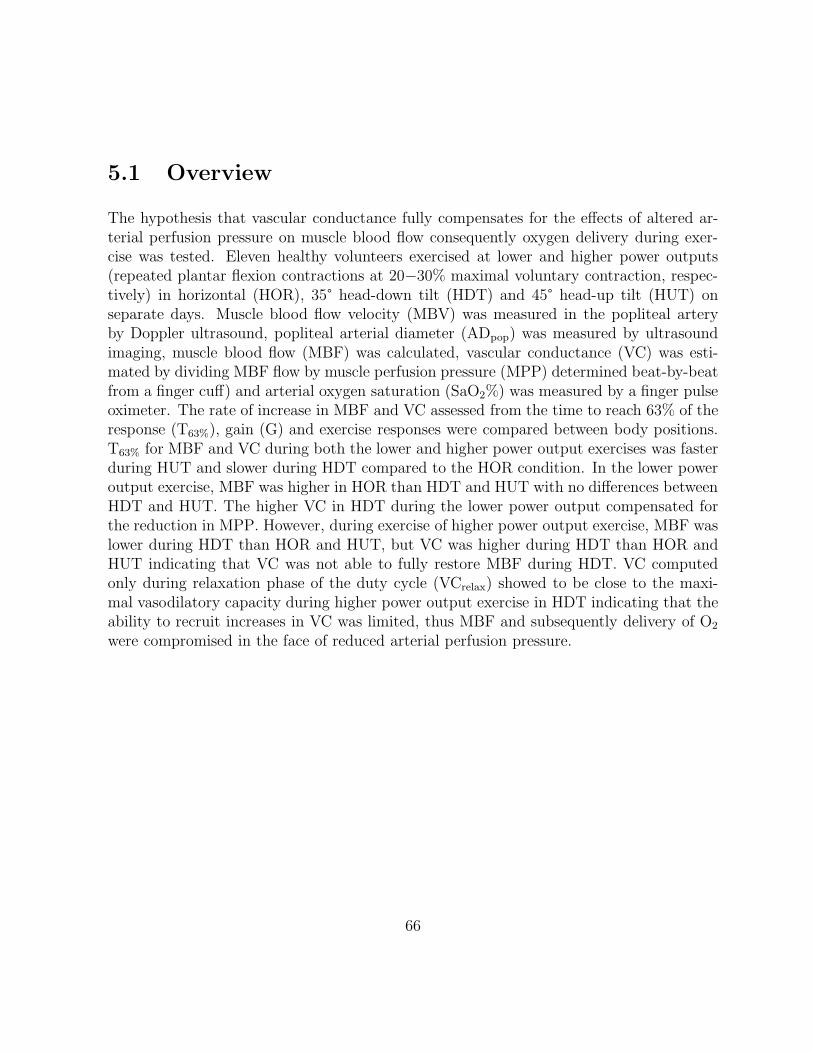
5.1 Overview
The hypothesis that vascular conductance fully compensates for the effects of altered ar-terial perfusion pressure on muscle blood flow consequently oxygen delivery during exer-cise was tested. Eleven healthy volunteers exercised at lower and higher power outputs(repeated plantar flexion contractions at 20−30% maximal voluntary contraction, respec-tively) in horizontal (HOR), 35° head-down tilt (HDT) and 45° head-up tilt (HUT) onseparate days. Muscle blood flow velocity (MBV) was measured in the popliteal arteryby Doppler ultrasound, popliteal arterial diameter (ADpop) was measured by ultrasoundimaging, muscle blood flow (MBF) was calculated, vascular conductance (VC) was esti-mated by dividing MBF flow by muscle perfusion pressure (MPP) determined beat-by-beatfrom a finger cuff) and arterial oxygen saturation (SaO2%) was measured by a finger pulseoximeter. The rate of increase in MBF and VC assessed from the time to reach 63% of theresponse (T63%), gain (G) and exercise responses were compared between body positions.T63% for MBF and VC during both the lower and higher power output exercises was fasterduring HUT and slower during HDT compared to the HOR condition. In the lower poweroutput exercise, MBF was higher in HOR than HDT and HUT with no differences betweenHDT and HUT. The higher VC in HDT during the lower power output compensated forthe reduction in MPP. However, during exercise of higher power output exercise, MBF waslower during HDT than HOR and HUT, but VC was higher during HDT than HOR andHUT indicating that VC was not able to fully restore MBF during HDT. VC computedonly during relaxation phase of the duty cycle (VCrelax) showed to be close to the maxi-mal vasodilatory capacity during higher power output exercise in HDT indicating that theability to recruit increases in VC was limited, thus MBF and subsequently delivery of O2
were compromised in the face of reduced arterial perfusion pressure.
66
5.2 Introduction
Exercising muscles are sensitive to changes in limb or body position due to the effectsof gravity (Egana and Green, 2005). Exercise performed with the limb positioned aboveand/or below the heart level to alter arterial and venous pressure has been used to chal-lenge muscle blood flow (MBF) adaptations at the onset of exercise (Shoemaker et al.,1998, Tschakovsky et al., 1996, Leyk et al., 1994), steady-state (Lutjemeier et al., 2005)or both (Nadland et al., 2009, Walker et al., 2007, Hughson et al., 1996). Different bodypositions affect exercise hyperemia by the interaction between changes in muscle perfu-sion pressure (MPP) and the mechanical effects of muscle contraction and muscle pumpactivation combined with local vasodilatory mechanisms that influence vascular conduc-tance (VC) (Walker et al., 2007, Tschakovsky et al., 2006, Tschakovsky and Sheriff, 2004,Tschakovsky and Hughson, 1999, Shoemaker and Hughson, 1999, Shoemaker et al., 1998,Tschakovsky et al., 1996, Leyk et al., 1994).
Limb position is an important determinant of the dynamic response of blood flowfollowing the onset of exercise. Positioning of the arm (Walker et al., 2007, Hughson et al.,1996) or legs (Nadland et al., 2009, Radegran and Saltin, 1998, Grassi et al., 1996, Leyket al., 1994) below, relative to at, heart level can increase the rate of adaptation of bloodflow toward the steady-state because of the contribution of the muscle pump (Nadlandet al., 2009, Laughlin and Joyner, 2003, Folkow et al., 1971). When the arm is placedabove the heart, the role of the muscle pump is eliminated (Saunders and Tschakovsky,2004, Tschakovsky et al., 1996). Vasodilation due to accumulation of metabolites nearthe resistance vessels of contracting muscles contributes as well to the increase in bloodflow (Shoemaker and Hughson, 1999). During low and moderate exercise intensities, MBFreached the same level whether comparing supine with HUT (Nagaya et al., 1995) orarm below versus above heart level (Hughson et al., 1996). However, MBFpeak to the legdiffers between upright and supine postures (Van Leeuwen et al., 1992) as well as meanMBF (estimated during relaxation) in moderate and heavy exercise intensities (Egana andGreen, 2005). The supine cycling work performance was increased by lower body negativepressure (LBNP) and was further enhanced in upright cycling suggesting that MBF wascompromised in supine position (Eiken, 1988).
The purpose of the current study was to investigate the peak and submaximal MBFand VC responses during exercise in three different body positions that affect the gravity-dependent distribution of arterial and venous pressures. The aim of the first experimentwas to determine peak vascular conductance (VCpeak) in the lower limb by the suddenrelease of occlusion following intense, ischemic muscle contractions. It was hypothesizedthat VCpeak response in the lower limb represents the maximal vasodilator capacity and
67

it would not differ between HOR, 35°HDT and 45°HUT positions despite the differencesin MPP. The aim of the second experiment was to compare the impact of altered MPPon MBF and VC during transitions from rest to lower and higher power output plantarflexion exercise performed with manipulations of limb position relative to the heart. Itwas hypothesized that following the onset of exercise the rate of increase in MBF and VCwould be faster during HUT than HOR and both would be faster than the correspondingresponse during HDT in both lower and higher power outputs. It is also hypothesized thatthe adaptations in VC would counteract the changes in perfusion pressure so that MBFand consequently the delivery of oxygen (DO2) to the working muscle would be maintainedregardless of body position during lower power output exercise. However, during the higherpower output exercise the ability to recruit VC would be limited in HDT thus compromisingMBF and DO2.
5.3 Methods
5.3.1 Participants
Eleven healthy, non-smoking male, volunteers participated in the two phases of the studies.The average physical characteristics were: age 28.0 ± 3.8 years, height 176.5 ± 5.3 cm andbody mass 79.0 ± 6.9 Kg. Their maximal isometric voluntary contraction force was 60.0± 3.5 Kg during plantar flexion exercise in the prone horizontal position. Participantsreceived complete written and verbal details of the experimental procedures and potentialrisks involved prior to signing an information consent form approved by the Office ofResearch Ethics of the University of Waterloo. All participants were instructed to refrainfrom consuming alcohol, caffeinated beverages, engaging in vigorous exercise for 24 hoursprior to testing, and from consuming a large meal within two hours of testing.
5.3.2 Experimental Design
Participants reported to the laboratory five times, four times for the transitions from restto exercise (EX) and once for measurement of peak vascular conductance (VCpeak). Afterarrival in the laboratory, they assumed a prone position with their head supported bya massage table head piece. Shoulder blocks were adjusted accordingly and their armswere placed with the shoulders and elbows positioned at approximately 90°. Two belts,one located on the chest and other on the hips, were used to secure the participants
68

during testing. Straps from these belts were attached to the tilt table to help to avoidthe participants from sliding. A footplate was connected to the tilt table allowing plantarflexion exercise to be performed. Participants foot was strapped on the footplate to ensuremore stability during the motion and better contact between plantar surface of the footand footplate. Instrumentation took place as described below then the participants restedbefore starting the testing for approximately 30 minutes.
5.3.2.1 Peak vascular conductance protocols
The VCpeak was obtained during the reactive hyperemia that followed release of an arterialocclusion cuff placed around the lower leg just distal to the popliteal fossa. After briefcollection of baseline data, the cuff was inflated to 300 mmHg for 2 minutes. Duringthe inflation period, isometric plantar flexion exercise was performed at 50% of maximalvoluntary contraction force (MVC) for 1 minute. The occlusion cuff was rapidly deflatedafter optimal acquisition of the Doppler ultrasound signal to monitor for peak muscle bloodflow velocity (MBVpeak). The VCpeak was obtained in the three different body positionsadministered in random order. Recovery for at least 30 min was allowed between VCpeak
measurements, and in each case MBV had returned to baseline.
5.3.2.2 Transitions from rest to exercise protocols
Preliminary testing revealed that participants could sustain a repeated plantar flexionexercise consisting of 1s to extend the footplate, 1s to return it to resting position, and 1sof rest (3s duty cycle) when the load was 20% or 30% of the maximal voluntary contraction(MVC). The work rates generated by these protocols, defined respectively as lower andhigher power output, could be sustained for 5min with some challenge but without fatigue.The initial body position in the start of testing was maintained for the entire duration(Figure 6.1) representing a different procedure than our previous study (Chapter 3, page37).
The angle of movement was ∼20° representing a displacement of 10 cm. The footplate movement was set in the rotational axis of the ankle to isolate contractions to thecalf muscles. Each participant performed six different protocols; three tests per day onfour different days randomized by blocks and counterbalanced among the participants.Between each individual test on each day, participants were allowed to come off the tilttable and rest prior to the next test bout. The order for test block A was: higher poweroutput exercise in head-up tilt (HPOHUT), lower power output exercise in head-down tilt
69

Figure 5.1: Exercising protocol used to test the impact of altered MPP on VC and MBFduring transitions from rest to plantar flexion exercise in HOR, HDT and HUT positions.Arrows indicate were ADpop (popliteal arterial diameter) were taken.
(LPOHDT) and higher power output exercise in horizontal (HPOHOR). The order for testblock B was: lower power output exercise in horizontal (LPOHOR), higher power outputexercise in head-down tilt (HPOHDT) and lower power output exercise in head-up tilt(LPOHUT). These blocks were distributed based on the best physiological approach tominimize any carry over, cumulative effect of one condition to another, especially on theearly stages of the subsequent protocols and to avoid muscle fatigue. The four days oftesting were performed two times per week separated by at least 48 hours. This breakminimized any carry over and cumulative effect of the exercise protocols, as well as muscleadaptation to the stimulus.
The angles of tilting for HDT (35°) and HUT (45°) accomplished a reduction andincrease in muscle perfusion pressure (MPP) estimated to the middle of the calf muscleof approximately −44mmHg and +55mmHg, respectively. Changing the angle of the tilttable required adjusting the load to achieve the same tension on the cable attached to thefoot plate. This was accomplished by raising and lowering 2.4 ± 0.4Kg (power output,= 1.6 ± 0.2 W) for LPOHDT, 3.0 ± 0.4Kg (2.0 ± 0.2 W) for LPOHOR, 3.8 ± 0.4Kg (2.6± 0.2 W) for LPOHUT, 5.4 ± 0.7Kg (3.6 ± 0.5 W) for HPOHDT, 6.0 ± 0.7Kg (4.0 ± 0.5W) for HPOHOR and 6.8 ± 0.7Kg (4.6 ± 0.5 W) for HPOHUT. In the horizontal position,the lower power output exercises elicited an EMG response of ∼20% MVC, while at thehigher power output the EMG response was ∼30% MVC measured during brief isometriccontraction.
70

All tests were conducted in a quiet room where room temperature was kept constantat 19.4 ± 0.9 °C to ensure minimal skin blood flow at rest, with humidity at 39.9 ± 4.8%,and barometric pressure at 730.8 ± 2.4 mmHg.
5.3.3 Data Acquisition
Muscle blood flow velocity (MBV) in the popliteal artery, heart rate (HR) and blood pres-sure (BP) were measured on a beat-by-beat basis. For all trials in the experiments, MBVresponses were determined from the intensity weighted mean of a 4 MHz pulsed Dopplerultrasound probe (Neurovision Doppler Ultrasound, Model 500, Multigon Industries, Mt.Vernon, USA). This flat ultrasound probe was secured by surgical tape to the skin surfaceover the popliteal artery embedded at a 45° angle of insonation relative to the skin andadjusted according to the measured angle between the skin and the popliteal artery.
Prior to each trial in the experiments, the popliteal artery was investigated to establishproper alignment, and to determine the depth and gate to assure full insonation of theartery lumen. The intensity of the Doppler spectrum was verified by audio and visualfeedback. The probe location was marked on the skin to assist repositioning of the probeduring the test and on subsequent tests. During the test, a researcher stood up beside theparticipants to follow the tilt table movement up or down. If it was necessary, the researchermanipulated the probe to preserve the best Doppler signal as determined by constant useof auditory and visual feedback. If the ultrasound signal quality was compromised the testtrial was excluded from the analysis.
Diameter of the popliteal artery (ADpop) was measured with an 8-12 MHz echo Dopplerultrasound probe (Diagnostic Ultrasound system, Model M5, Shenzen Mindray Bio-medicalelectronics CO., LTD., Shenzen, China). These popliteal artery images were recordedand stored for analysis. ADpop measurements were performed in B-mode with the echoDoppler ultrasound probe positioned just proximal to the site of velocity measurements.ADpop images were taken as the average of three separate measurements during diastole atbaseline and at the end of recovery and during the relaxation phase between contractionsin the fourth minute of exercise.
Arterial blood pressure was estimated from a photoplethysmograph cuff placed aroundthe middle finger of the left hand (Finometer, Finapres Medical Systems, Arnhem, theNetherlands). Mean arterial pressure (MAP) was determined as the area under the curvebetween successive heart beats. Heart rate (HR) was continuously calculated from the RR-interval obtained from an electrocardiogram (Pilot 9200, Colin Medical Instruments Corp,San Antonio, Texas, USA). Oxygen saturation (SaO2) was obtained by a pulse oximeter
71

with the probe placed in the index finger of the left hand (Ohmeda 3740 Pulse oximeter,Lousville, CO., USA).
The muscle activity was measured by electromyography (EMG) through six skin surfacedisposable electrodes pre-gelled (Blue Sensor, Medicost, Inc., Olstykke, Denmark) placedlongitudinally on the distal half of the medial and lateral gastrocnemius (GMH and GLH,respectively) and soleus muscles in the right leg in a bipolar configuration with the inter-electrodes distance of 2 cm. Prior to the data collection, participants were shaved, abradedand cleaned with isopropyl alcohol to reduce skin impedance. Following this procedures,the electrodes were fixed on the skin where the reference electrode was placed over thehead of the fibula. EMG electrodes placement was marked on the skin by a pen markerand recorded to ensure a more precise return during subsequent tests. A custom builtamplifier (Waterloo, Ontario, Canada, bandwidth 20-500Hz, common mode rejection rate> 90db, input impedance 2MΩ) was used to amplify the raw EMG.
MBV, MAP, HR, EMG and SaO2 were continuously collected at 1000 Hz using a dataacquisition system (Powerlab, ADInstruments, Colorado Springs, USA). This system wasconnected to the computer and all the variables were continuously recorded using dataanalysis software (Chart, version 5.5, ADInstruments, Colorado Springs, USA). EMG datawere collected at 1000 Hz and processed with custom software (Matlab, version 7.0, TheMathworks, Natick, Massachusetts, USA).
5.3.4 Data Analysis
5.3.4.1 Peak vascular conductance
The MBVpeak was detected as the average of the three highest consecutive beats after cuffrelease. ADpop value used was the closest to the time of the MBVpeak. Then, peak muscleblood flow (MBFpeak in mL.min-1) was determined as the product of MBVpeak and ADpop
cross-sectional area as MBFpeak = MBVpeak×πr2×60; where r is the vessel radius. Tocalculate peak vascular conductance (VCpeak in mL.min-1.mmHg-1) MBFpeak was dividedby MPP measured at the same time (Figure 5.2).
72

Figure 5.2: Representative patterns of beat-by-beat muscle blood flow velocity waveformsafter cuff release in the peak vascular conductance (VCpeak) tests in (A) horizontal (HOR),(B) head-down tilt (HDT), (C) head-up tilt (HUT). Dashed lines indicate cuff release (cuffdown) and rectangular dashed box depicts the three beats averaged to represent peakmuscle blood flow velocity (MBVpeak).
73
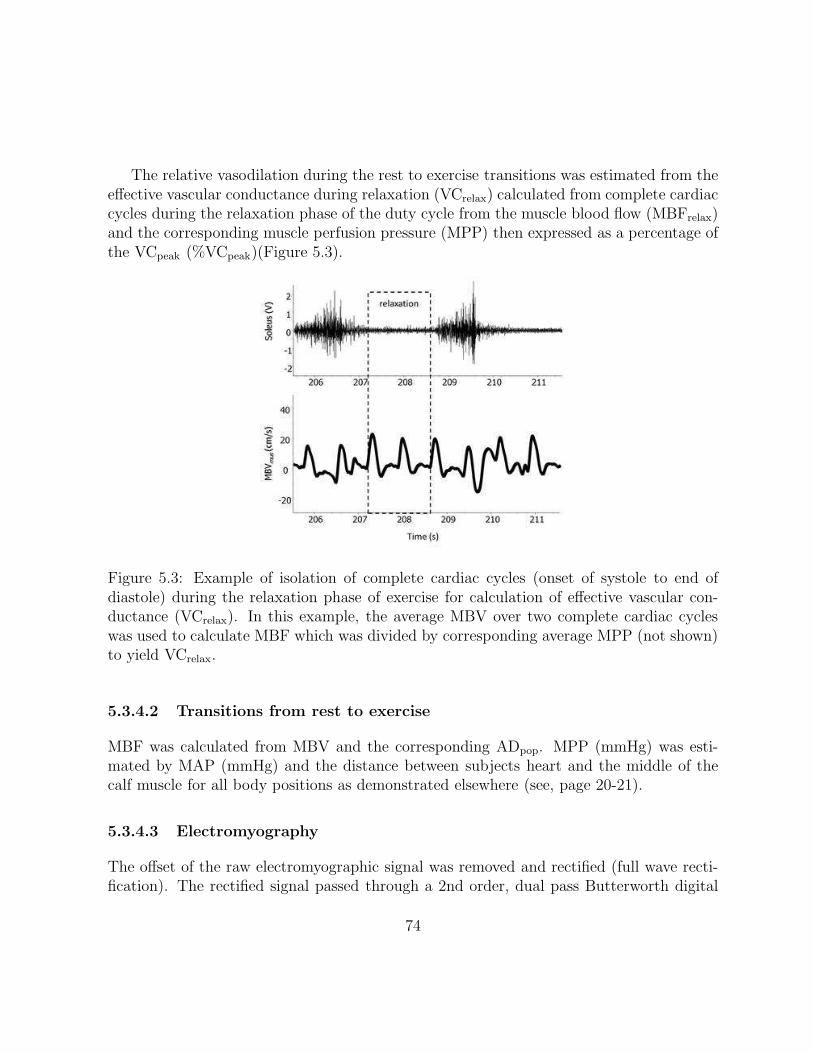
The relative vasodilation during the rest to exercise transitions was estimated from theeffective vascular conductance during relaxation (VCrelax) calculated from complete cardiaccycles during the relaxation phase of the duty cycle from the muscle blood flow (MBFrelax)and the corresponding muscle perfusion pressure (MPP) then expressed as a percentage ofthe VCpeak (%VCpeak)(Figure 5.3).
Figure 5.3: Example of isolation of complete cardiac cycles (onset of systole to end ofdiastole) during the relaxation phase of exercise for calculation of effective vascular con-ductance (VCrelax). In this example, the average MBV over two complete cardiac cycleswas used to calculate MBF which was divided by corresponding average MPP (not shown)to yield VCrelax.
5.3.4.2 Transitions from rest to exercise
MBF was calculated from MBV and the corresponding ADpop. MPP (mmHg) was esti-mated by MAP (mmHg) and the distance between subjects heart and the middle of thecalf muscle for all body positions as demonstrated elsewhere (see, page 20-21).
5.3.4.3 Electromyography
The offset of the raw electromyographic signal was removed and rectified (full wave recti-fication). The rectified signal passed through a 2nd order, dual pass Butterworth digital
74

filter with a cut-off frequency of 5Hz. The area under of the rectified signal for each con-traction was used to calculate the integrated EMG (iEMG) blocked into 3 seconds windowfor each exercise protocol. The fast Fourier transformation (FFT) analysis was used toestimate mean power frequency (MPF) on the raw signal. The EMG signal was normal-ized by the maximal voluntary contraction (MVC) performed prior to each day of testingto account for the inter participant and day to day variability. Then, the EMG data wasaveraged in the last minute of exercise expressed as the percentage of MVC.
5.3.5 Statistical Analysis
MBVpeak, ADpop, MBFpeak, MPP, and VCpeak were analysed by one-way analysis of vari-ance for repeated measures with respect to body position (HOR, HDT, and HUT). ForEX experiments, exercise, T63%, G and EMG data underwent a one-way analysis of vari-ance (ANOVA) for repeated measures of body position (HOR, HDT, and HUT) for thedependent variables in lower and higher power outputs. Time (baseline and recovery),VCrelax and %VCpeak data were analysed by a two-way ANOVA for repeated measureswith main effects of body position and time. If required, prior to the analysis data wererank-transformed to address concerns of non-normal distribution. The Student-Newman-Keuls post-hoc test was performed to identify the statistically significant main effects andinteractions. The level of significance for main effects and interactions was set at p < 0.05.Data were presented as means ± standard deviation (SD).
75

5.4 Results
5.4.1 Muscle blood flow velocity patterns in different body po-
sitions
The post-hoc analysis of the one-way repeated measures ANOVA indicated that ADpop
and VCpeak were not different for any body position, while MBVpeak, MBFpeak and MPPwere different between all body positions (p < 0.05). MBVpeak, MBFpeak and MPP werehigher during 45°HUT but lower during 35°HDT (Table 5.1).
Table 5.1: MBVpeak, ADpop, MBFpeak, MPP and VC responses during VCpeak protocolduring HOR, HDT and HUT conditions.
Variables HOR HDT HUT
MBVpeak (cm.s-1) 34.5± 7.9 19.8± 7.0a 52.0± 10.3ab
ADpop (cm) 0.64± 0.06 0.63± 0.06 0.63± 0.06MBFpeak (mL.min-1) 673.6± 226.1 378.2± 134.9a 997.4± 284.2ab
MPP (mmHg) 93.2± 8.0 54.9± 11.4a 142.6± 6.6ab
VC (mL.min-1.min-1) 7.2± 2.1 7.1± 1.8 7.0± 1.9
Values are mean ± of 11 participants. Peak muscle blood flow velocity (MBVpeak),popliteal arterial diameter at MBVpeak (ADpop), peak muscle blood flow (MBFpeak), mus-cle perfusion pressure at MBVpeak (MPP), effective vascular conductance (VC), horizontal(HOR), head-down tilt (HDT) and head-up tilt (HUT). Statistically significant differencescompared to: aHOR and bHDT, p<0.05.
5.4.2 Transitions from rest to exercise in lower output tests
The two-way repeated measures ANOVA indicated a main effect of body position for MBFand VC (p < 0.05). The post-hoc analysis demonstrated that baseline values for MBFwere not statistically significant differences between LPOHOR and LPOHDT but were lowerduring LPOHUT (p < 0.05, Table 5.2, Figure 5.4A). The baseline values for VC weresignificantly different between all body positions being higher during LPOHDT but lowerduring LPOHUT (p < 0.05, Table 5.2, Figure 5.4B).
MBF and VC demonstrated a rapid increase immediately after the onset of exercisefor all body positions (Figure 5.4A, 5.4B). The post-hoc analysis of the one-way repeated
76

measure ANOVA indicated that the rate of increase was faster in the LPOHUT and slowerin LPOHDT as observed in the patterns of the responses and significant effect of bodyposition (p < 0.05, Figure 5.4A, 5.4B) and the more rapid T63% (p < 0.05, Table 5.2). Thegain values for MBF were not statistically different between all body positions but tendedto be higher in LPOHOR than the other two positions (p = 0.06, Table 5.2). VC gainwas not significantly different during LPOHDT and LPOHOR (p = 0.13) but it was lowerduring LPOHUT (p < 0.05, Table 5.2). The post-hoc analysis of the one-way repeatedmeasure ANOVA indicated that MBF values during exercise were higher during LPOHOR
than LPOHDT and LPOHUT (p < 0.05, Table 5.2) with no differences between and LPOHDT
and LPOHUT (Figure 5.4A). VC values during exercise were higher in LPOHDT (p < 0.05)but were lower during LPOHUT (p < 0.05, Table 5.2, Figure 5.4B). The post-exercise MBFand VC responses were greater in LPOHDT and lower in LPOHUT (p < 0.05, Table 5.2).The post-hoc analysis showed that in the last minute of recovery, MBF and VC returnedto the baseline levels for all body positions (Figure 5.4A, 5.3B).
77

Table 5.2: Dynamic responses of MBF and VC during exercise in LPOHOR, LPOHDT andLPOHUT.
Variables time points LPOHOR LPOHDT LPOHUT
baseline 51.5± 25.5 41.8± 15.3 28.6± 14.0ab
T63% 16.5± 10.9 37.6± 15.5a 9.5± 6.3b
MBF (mL.min-1) G 133.4± 65.0 105.1± 57.0 92.3± 48.1exercise 185.9± 70.2 146.9± 62.1a 120.9± 54.8a
recovery 53.6± 32.8 49.0± 28.4 26.6± 9.9ab
baseline 0.7± 0.4 1.0± 0.4 0.2± 0.1ab
T63% 16.9± 9.8 35.6± 14.1a 9.9± 7.6b
VC (mL.min-1.min-1) G 1.5± 0.7 2.0± 1.1 0.6± 0.4ab
exercise 2.2± 0.9 2.9± 1.3a 0.9± 0.4ab
recovery 0.7± 0.4 1.1± 0.6 0.2± 0.1ab
test block order B1 A2 B3
Values are mean ± SD of 11 participants. Muscle blood flow (MBF), vascular conductance(VC), lower power output in horizontal (LPOHOR), lower power output in head-down tilt(LPOHDT), lower power output in head-up tilt (LPOHUT), time to reach 63% of the re-sponse (T63%), gain of the response (G). Statistically significant compared to: aLPOHOR;bLPOHDT;
cLPOHUT;dbaseline in the same conditions (p < 0.05). Test Block Order indi-
cates for each of the Blocks (see 5.3.4.2 Transitions from rest to exercise (EX), page 76)the order of that specific condition for comparison of baseline data (see Table 2.2, page24).
5.4.3 Transitions from rest to exercise in higher output tests
The two-way repeated measures ANOVA indicated a main effect of body position andtime (baseline and recovery) and interactions between body position and time for MBFand VC (p < 0.05). The post-hoc analysis indicated that baseline values for MBF werenot different between HPOHOR and HPOHDT but were lower during HPOHUT (p < 0.05,Table 5.2, Figure 5.4C). The baseline values for VC were significantly different betweenall body positions with higher VC during HPOHDT and lower VC during HPOHUT (p <
0.05, Table 5.2, Figure 5.4D). MBF and VC demonstrated a rapid increase immediatelyafter the onset of exercise for all body positions (Figure 5.4C, 5.4D). The one-way repeatedmeasure ANOVA post-hoc analysis demonstrated that the rate of increase was faster in the
78

HPOHUT and slower in HPOHDT as observed in the patterns of the responses and significanteffect of body position (p < 0.05, Figure 5.4C, 5.4D) and the more rapid T63% (p < 0.05,Table 5.2). The gain values of MBF were not different between HPOHOR and HPOHUT
but were lower in HPOHDT (p < 0.05, Table 5.2). VC gain was not different betweenHPOHDT than HPOHOR but it was lower during HPOHUT (p < 0.05, Table 5.2). Thepost-hoc analysis of the one-way repeated measure ANOVA indicated that MBF valuesduring exercise were not different between HPOHOR and HPOHUT but lower in HPOHDT (p< 0.05, Table 5.2, Figure 5.4C, 5.4D). VC values during exercise were higher in HPOHDT
compared to HPOHOR and HPOHUT (p < 0.05, Table 5.2), but were lower during HPOHUT
(p < 0.05, Table 5.2, Figure 5.4D). The post-exercise MBF and VC response was greaterin HDT and lower in HUT (p < 0.05, Table 5.2). The post-hoc analysis showed that inthe last minute of recovery, MBF and VC returned to the baseline levels during HPOHOR
and HPOHUT but did not in HPOHDT (Figure 5.4C, 5.4D).
79

Table 5.3: Dynamic responses of MBF and VC during exercise in HPOHOR, HPOHDT andHPOHUT.
Variables time points HPOHOR HPOHDT HPOHUT
baseline 44.2± 14.0 46.7± 17.7 32.8± 10.7ab
T63% 25.3± 8.9 44.5± 9.7a 13.4± 6.7ab
MBF (mL.min-1) G 197.2± 83.9 135.9± 55.6a 187.0± 60.6b
exercise 241.4± 93.2 182.6± 54.6a 219.8± 64.2recovery 47.7± 19.0 118.1± 59.4ab 38.0± 16.2b
baseline 0.6± 19.0 1.2± 0.8a 0.2± 0.1ab
T63% 23.9± 10.1 39.0± 15.1a 13.3± 6.7ab
VC (mL.min-1.min-1) G 2.2± 1.1 2.5± 1.1a 1.3± 0.5ab
exercise 2.8± 1.2 3.7± 1.2a 1.5± 0.5ab
recovery 0.7± 0.3 2.9± 1.8ad 0.3± 0.1ab
test block order A3 B2 A1
Values are mean ± SD of 11 participants. Muscle blood flow (MBF), vascular conductance(VC), higher power output in horizontal (HPOHOR), higher power output in head-downtilt (HPOHDT), higher power output in head-up tilt (HPOHUT), time to reach 63% of theresponse (T63%), gain of the response (G). Statistically significant compared to: aHPOHOR;bHPOHDT;
cHPOHUT;dbaseline in the same conditions (p < 0.05). Test Block Order
indicates for each of the Blocks (see 5.3.4.2 Transitions from rest to exercise (EX), page76) the order of that specific condition for comparison of baseline data (see Table 2.2, page24).
80

Figure 5.4: Time course of changes in MBF and VC during dynamic plantar flexion exer-cise performed in lower (A and B) and higher (C and D) power outputs. Lines indicategroup response, symbols indicate the points at which statistical analysis were performedand dashed vertical lines indicate the start and cessation of exercise. Data are the meananalysed over 6 seconds time bins including contraction and relaxation phases of the dutycycles. SD was omitted to improve data visualization, but are presented in the Table 5.2.If necessary symbols were offset for clarity.
81

5.4.4 Vascular conductance expressed as percentage of VCpeak
The two-way repeated measures ANOVA indicated a main effect of body position andtime and an interaction between body position and time for vascular conductance duringrelaxation (VCrelax) and VCrelax expressed as percentage of VCpeak (%VCpeak) (p < 0.05).The post-hoc analysis indicated that VCrelax and %VCpeak were significantly higher duringHDT and lower during HUT from baseline to recovery for both lower and higher poweroutputs (p < 0.05, Figure 5.5A, 5.5B, 5.5C, 5.5D).
82

Figure 5.5: Time course of changes in VCrelax (mL.min-1.mmHg-1) and %VCrelax as percent-age of change in vascular conductance response (%VCrelax = VCrelax/VCpeak×100) duringdynamic plantar flexion exercise performed in lower (A) and higher power outputs (C).Lines indicate group response, symbols indicate the points at which statistical analysiswere performed and dashed vertical lines indicate the start and cessation of exercise. Thebar graphs represent exercising VCrelax and %VCrelax during lower (B) and higher poweroutputs (D). Data are the mean ± SD analysed over the relaxation phases between musclecontraction phases of the duty cycles. Statistically significant compared to: aHOR andbHDT (p < 0.05). If necessary symbols were offset for clarity.
83

5.4.5 Muscle activity responses during exercise
The one-way repeated measures ANOVA post-hoc analysis showed that muscle activity(EMG) was not different during lower power output exercise for all body positions (Figure5.6A) and for HPOHOR and HPOHUT during higher power output exercise, excepted forgastrocnemius medial head (GMH). However, muscle activity was higher during HPOHDT
for all muscle groups (p < 0.05, Figure 5.6B). Total muscle activity and EMGindex were notdifferent during lower power output for all body positions and for HPOHOR and HPOHUT,but they were higher during HPOHDT (p < 0.05, Figure 5.6C, 5.6D).
84

Figure 5.6: Muscle activity in soleus, gastrocnemius medial head (GMH) and gastroc-nemius lateral head (GLH) during plantar flexion exercise during lower (A) and higherpower outputs (B) in horizontal (LPOHOR), head-down tilt (LPOHDT) and head-up tilt(LPOHUT) positions. Total muscle activity (C) was calculated as the sum of the mean forsoleus and gastrocnemius muscle groups activity as a percentage of MVC and EMGindex (D)was calculated as the sum of the mean for soleus and gastrocnemius muscle groups activitydivided by the sum of the MVCs during plantar flexion exercise during lower (LPO) andhigher power outputs (HPO) in horizontal (HOR), head-down tilt (HDT) and head-up tilt(HUT) positions. Data are the mean ± SD averaged in the last two minutes of exercise.Statistically significant compared to: aHOR and bHUT (p < 0.05).
5.4.6 Normalized muscle blood flow by muscle activity
The relationship between MBF and an index of the sum of electromyographic signals fromthe muscles (EMGindex) for the corresponding time was used to account for the differencesin muscle activity related to body position (MBF/EMGindex) and used to determine com-
85

pensations in MBF. The one-way repeated measures ANOVA post-hoc analysis showedthat this ratio was not different between LPOHDT and LPOHUT, but both conditions werelower than LPOHOR (p < 0.05, Figure 5.7A). The MBF/EMGindex was not different be-tween HPOHOR and HPOHUT but both conditions were higher than HPOHDT (p < 0.05,Figure 5.7B).
Figure 5.7: Time course of changes in MBF/EMGindex during dynamic plantar flexionexercise performed in lower (A) and higher (B) power outputs. Symbols indicate groupresponse which statistical analysis was performed. Data are the mean analyzed over 6 sec-onds time bins including contraction and relaxation phases of the duty cycles. Statisticallysignificant compare to: aHOR and bHUT (p < 0.05). Symbols were offset for clarity.
5.4.7 MAP and HR responses during lower and higher poweroutput exercises
The two-way repeated measures ANOVA indicated a main effect of body position and timefor MAP during lower power output (p < 0.05) and a main effect of time and interactionbetween body position and time for higher power output (p < 0.05). The post-hoc anal-ysis demonstrated that baseline, exercise and recovery values for MAP were not differentbetween LPOHOR and LPOHUT, but were higher during LPOHDT (p < 0.05, Table 5.3).The baseline and recovery values for MAP were not different for all body positions duringhigher power output exercise. During exercise, MAP values were not different betweenHPOHOR and HPOHUT but were higher during HPOHDT (p < 0.05, Table 5.3).
The two-way repeated measures ANOVA indicated a main effect of body position andtime and an interaction between body position and time for HR during lower and higherpower outputs (p < 0.05). The post-hoc analysis showed that baseline HR was not different
86

between LPOHOR and LPOHUT, but was slightly lower during LPOHDT (p < 0.05, Table5.3). During exercise, HR values were not different between all body positions in LPO (p <
0.05, Table 5.3). At the recovery, HR was not different between LPOHOR and LPOHDT, butslightly higher during LPOHUT (p < 0.05, Table 5.3). The baseline, exercise and recoveryHR were not different between HPOHDT and HPOHOR, but was higher in HPOHUT (p <
0.05, Table 5.3).
Table 5.4: MAP and HR at baseline, exercise (last 2min of exercise) and recovery (lastminute) during LPOHDT, LPOHOR, LPOHUT, HPOHDT, HPOHOR and HPOHUT.
Variables time points LPOHOR LPOHDT LPOHUT
baseline 80.9± 5.8 91.5± 6.7a 84.1± 5.9b
MAP (mmHg) exercise 85.3± 5.8 95.8± 8.1a 87.6± 6.6b
recovery 83.0± 5.6f 93.5± 8.7af 84.1± 6.4b
baseline 62.4± 8.0 55.7± 9.0a 64.4± 8.8b
HR (bpm) exercise 65.3± 9.4 62.5± 9.3 64.7± 8.5recovery 61.8± 7.6 59.8± 10.2f 66.0± 9.8ab
Variables time points HPOHOR HPOHDT HPOHUT
baseline 85.2± 6.9 86.2± 7.5 83.9± 7.1MAP (mmHg) exercise 89.3± 6.1 95.3± 9.3d 88.5± 5.7e
recovery 86.6± 7.9 88.1± 7.4 84.7± 6.7
baseline 58.5± 6.7 55.5± 8.9 70.0± 11.8de
HR (bpm) exercise 63.7± 7.3 65.8± 9.8 70.6± 12.3de
recovery 59.6± 6.0 55.6± 8.7 70.4± 13.0de
Values are mean ± SD of 11 participants. Mean arterial pressure (MAP), heart rate(HR), lower power output in horizontal (LPOHOR), lower power output in head-down tilt(LPOHDT), lower power output in head-up tilt (LPOHUT), higher power output in hori-zontal (HPOHOR), higher power output in head-down tilt (HPOHDT), higher power outputin head-up tilt (HPOHUT). Statistically significant compared to: aLPOHOR;
bLPOHDT;cLPOHUT;
dHPOHOR,eHPOHDT, and
fbaseline in the same body position (p < 0.05).
87

5.5 Discussion
In the presented study, it was shown the functional limitations of the vascular system tocompensate for altered MPP during exercise. This is the first time that HOR, HDT andHUT positions were tested to determine the maximal dilatory capacity of the vascularsystem of the calf muscles. The findings confirmed the hypothesis that following intense,ischemic muscle contractions, VCpeak response would not differ between body positionsindicating that VCpeak would be independent of changes in MPP. The second hypothesiswas also supported by the results demonstrating that the rate of increase for MBF and VCat the onset of exercise would be more rapid in HUT and slower during HDT for both thelower and higher output exercise levels. Finally, the results confirmed that recruitment ofgreater VC was able to fully compensate for the reduced MPP in LPOHDT to maintain MBFand therefore DO2 at the same levels as LPOHUT. However, as predicted, the recruitmentof VC during HPOHDT restricted the increase in MBF limiting the DO2 with consequentmetabolic stress as suggested by the increased EMG only in this condition.
5.5.1 Peak Vascular Conductance
Complete occlusion of the circulation during 2 minutes associated with one minute ofintense, ischemic isometric muscle contraction at 50% MVC were able to elicit VCpeak dueto the high accumulation of vasodilators metabolites around the resistance vessels of the calfmuscle. Such method was similar to the previous method applied by Snell, Martin, Buckey,and Blomqvist, 1987 and Martin et al., 1991 which reported ∼10−30 fold increases in VC.To the best of our knowledge, this is the first time VCpeak has been assessed in conditionswhich MPP was reduced by −44mmHg (HDT) and increased by +55mmHg (HUT). Thecurrent study results demonstrated ∼12 fold increases in VC in HOR, ∼8 fold increases inHDT and ∼29 fold increases in HUT. The differences between studies can be attributed tothe methods employed, occlusion plethysmography (Martin et al., 1991, Snell et al., 1987)versus Doppler ultrasound, body position and physical fitness. Based on the evidencesprovided by this study, baseline VC is considered an important component in assessingpercentage changes. However, the main finding from the present study was that VCpeak
was similar regardless of body position indicating that VCpeak was independent of limbposition and MPP. This result was anticipated as the accumulation of metabolites duringone minute of ischemic, isometric exercise (50% MVC) was expected to be sufficient toachieve maximal vasodilation and to be independent of body position. Consistent VCpeak
in each body position allows investigation of the regulation of MBF under different exercise
88

challenges with altered MPP and estimation of the fractional contribution of VC duringexercise.
Nevertheless, the blood flow velocity pattern in different body positions was highlydependent on MPP despite similar VCpeak (Figure 5.2A, 5.2B, 5.2C). The MBV patternshowed elevation of blood flow throughout the cardiac cycle (i.e. in systole and diastole) inHOR and HUT. Conversely, the MBV pattern under condition with reduced MPP (HDT)demonstrated periods of no forward flow. The velocity waveform prior to cuff releasepresented brief periods of reverse flow (negative) during diastole indicating a high resistancevascular bed (Arbeille, Berson, Achaibou, Bodard, and Locatelli, 1995). Therefore, it wasanticipated after cuff deflation that the reverse flow would be eliminated of the velocitywave for all body positions (Figure 5.2A, 5.2B, 5.2C).
5.5.2 Baseline VC and MBF
MBF and VC baseline values were different between body positions. MBF and VC werelower in HUT and higher in HDT. The mechanisms underlying these differences relateto the interactions of metabolic demand that would affect vasodilation, shear rate withrelease of vasoactive compounds from the endothelium, myogenic responses of the vascularsmooth muscle, and local and systemic sympathetic vasoconstriction (for more detailssee Chapter 3). At rest, MBF is sufficient to maintain the metabolites released fromthe muscles in low concentrations. Despite nitric oxide (NO) in skeletal muscle is released(Shoemaker, Halliwill, Hughson, and Joyner, 1997), flow rates and shear stress are relativelylow in the basal condition. However, the potential effects of vasodilatory factors releasedfrom the endothelium contributing to the differences in VC and MBF is not known.
In the HUT position, the MPP was ∼55 mmHg greater than HOR and ∼100 mmHggreater than in HDT. This higher MPP raises distending pressure on the vessel increasingtransmural pressure across the arterioles stimulating smooth muscle contraction mediatedby myogenic reflex response (Toska and Walloe, 2002, Imadojemu et al., 2001). The legveins are distended due to the hydrostatic effect on the venous blood column activatingthe veno-arteriolar reflex inducing local arteriolar vasoconstriction of the correspondingarteriole (Tschakovsky and Hughson, 2000, Henriksen and Sejrsen, 1977). In this position,the arterial baroreflex response is activated increasing sympathetic vasoconstriction (Cuiet al., 2003, Toska and Walloe, 2002). Combined, these factors result in reduced VC due tothe rise in vascular resistance in HUT (Harms et al., 2003). In the HDT, the hydrostaticeffect is reduced emptying the veins as result vascular smooth muscle relax due to themyogenic response, removal of venoarteriolar reflex (Sheriff et al., 2007, Rowell, 1993) and
89

possibly reduced baroreflex activity (Toska, Eriksen, and Walloe, 1994) (for more detailssee Chapter 3).
In the present study, it is necessary to consider whether the experimental design couldhave contributed to the differences in baseline. The block design consisted of three separatetests on each day and the order of testing was kept constant with at least 30 minutesbetween any two tests. Before the next test, the participants were allowed to move fromthe tilt table to rest. Small differences were noted during the baseline periods for VC andMBF between lower and higher power outputs. However, it is though highly unlikely thatthese differences were caused by prior tests on that day. For example, the VC and MBFwere slightly higher in the LPOHOR and the HPOHUT than the HPOHOR and LPOHUT
respectively, but in both cases the slightly higher values were observed in the first test ofthe day eliminating any possibility of carryover effect (Table 5.2).
5.5.3 Adaptive responses of vascular conductance and muscleblood flow to exercise
The current study is the first to compare the effect of HOR, HDT and HUT positions onthe vascular adaptations to calf muscle exercise. VC response was consistently higher inHDT compared to HOR and HUT and lower in HUT than the other two body positions(Figure 5.4B, 5.4D). As a consequence of altered MPP, MBF responses were differentbetween body positions and work rates (Figure 5.4A, 5.4C). There were rapid increases inVC that permitted increases in MBF following the onset of muscle contractions. Such VCincreases were a consequence of both changes in vasodilation and muscle pump effect thateffectively enhanced the perfusion pressure gradient across the working muscle resulting inan increase in virtual conductance (Nadland et al., 2009, Shoemaker and Hughson, 1999,Shoemaker et al., 1998, Tschakovsky et al., 1996).
The adaptive VC responses were quite different between HOR, HDT and HUT. Therate of increase in VC and the amplitude of increase in VC were different between bodypositions for both lower and higher power output exercises. These results are supported byprevious studies comparing arm below and above heart level (Walker et al., 2007, Saundersand Tschakovsky, 2004) and with the legs below compared to heart level (Nadland et al.,2009). The rate of increase in VC was fastest for the HUT position, but slowest for theHDT position (Table 5.2, Figure 5.4B, 5.4D). The greater amplitude of change for VCin face of reduced arterial perfusion pressure (HDT) in comparison with elevated arterialperfusion pressure (HUT) reflects the demand for vasodilation when MPP is diminished inthe HDT position.
90
The mechanism accounting for the VC response was probably the greater local accu-mulation of vasodilator metabolites, as the muscle pump was unable to contribute to theincrease in VC and MBF due to the minimized emptying effect of the veins and the lack ofa hydrostatic column in the HDT position (Saunders and Tschakovsky, 2004, Tschakovskyet al., 1996). A longer time was required to achieve this greater vasodilation as indicatedby the longer time to reach steady-state (T63%) in the HDT position. The blunted VCresponse with elevated arterial perfusion pressure (HUT) reflects the lower demand forvasodilation (Saunders and Tschakovsky, 2004). The mechanism accounting for the VCresponse was probably the less accumulation of vasodilator metabolites as the muscle pumpis more effective contributing to the increase in MBF (Nadland et al., 2009, Laughlin andJoyner, 2003, Folkow et al., 1971). A shorter time was necessary to achieve the requiredvasodilation was shown by the shorter T63% in the HUT position.
The MBF responses also had different response times (T63%) following the onset ofexercise between conditions. MBF for the HUT position reached T63% faster, while HDTwas the slowest compared to the other two positions (Table 5.2, Figure 5.4A, 5.4C). Theseresults are supported by previous studies comparing arm below and above heart level(Hughson et al., 1996) and with the legs below compared to heart level (Egana and Green,2005, MacDonald et al., 1998, Leyk et al., 1994). However, the difference in MPP betweenconditions resulted in different MBF responses during exercise. MBF was higher in theLPOHOR position compared to LPOHDT and LPOHUT (Figure 5.4A). However, MBF forHPOHOR and HPOHUT were similar but were both higher than HPOHDT (Figure 5.4C). Theconfirmation of inadequate MBF was observed from the relationship between MBF and anindex of the sum of electromyographic signals from the muscles (EMGindex) demonstratingthat MBF in HPOHDT was lower than HPOHOR and HPOHUT with no differences betweenHPOHOR and HPOHUT (Figure 5.7B).
MBF was probably sufficient in each condition to maintain a relatively low local concen-tration of vasodilatory metabolites during lower power output exercise, but probably moreaccentuated during LPOHDT. For the LPOHDT, the VC response was ∼80% VCpeak com-pared to ∼45% VCpeak in the LPOHOR position and only ∼20% in LPOHUT (Figure 5.5A).However, the VC in the HPOHDT position reached ∼92% VCpeak than ∼57% in HPOHOR
and ∼33% in HPOHUT (Figure 5.5B) as consequence MBF in HPOHDT was considerablyreduced compared to HPOHOR and HPOHUT positions (Figure 5.4C and Figure 5.7B). De-spite the greater recruitment of VC in HPOHDT, VC was not able to fully compensate forthe reduction in MPP due to the functional limitation of VC as consequence MBF wascompromised in face of reduced MPP. This suggested that the dilatory contribution to theincrease in MBF was close to its maximum in the HDT position where the muscle pumpcontributes little to the change in MBF (Saunders and Tschakovsky, 2004, Tschakovsky
91

et al., 1996). Conversely, during HUT, the contribution from the muscle pump is moreeffective allowing further increases in MBF (Nadland et al., 2009, Laughlin and Joyner,2003, Folkow et al., 1971 with less extent of the vasodilation (Nadland et al., 2009).
5.5.4 Consequences of muscle blood flow to Metabolic Demand
The finding that MBF was lower in the HPOHDT compared to the other body positionssuggested that DO2 was insufficient to meet the demands for aerobic metabolism. TheEMG and MBF/EMGindex data provide further support for this evidence. Muscle fatigueis associated with an increase in amplitude of EMG as there is an increased requirementfor muscle fiber recruitment to maintain muscle power output (Cheng and Rice, 2005,Klass, Guissard, and Duchateau, 2004). In the current study, it was found an increase inEMG only during HPOHDT (Figure 5.6B) suggesting that to accomplish the work rate itwas necessary to recruit more muscle fibers as fibers that had been recruited but engagedanaerobic metabolism had ceased to generate the appropriate muscle force. Conversely,MBF must have increased to meet the metabolic requirements as there was no change inEMG relative to LPOHOR, LPOHDT and LPOHUT (Figure 5.6A).
The implications of these data are that reduced MPP caused slower adaptation of MBFwhich limited O2 availability following the onset of exercise resulting in slower adaptationof oxidative metabolism and a greater O2 deficit. This in turn would require greater break-down of phosphocreatine (PCr) lowering intracellular PCr concentrations with concomitantincreases in Pi, ADP, H+ and lactate. Overall, this would increase the relative stress ofthe exercise challenge and advance the onset of muscle fatigue. In contrast, elevated MPPcaused faster adaptation of MBF which increase O2 availability following the onset of ex-ercise resulting in faster adaptation of oxidative metabolism and a lower O2 deficit. Thisin turn would require lower breakdown of phosphocreatine (PCr) resulting in higher intra-cellular PCr concentrations and lower accumulation of metabolic by products (Pi, ADP,H+ and lactate).
92

5.6 Conclusion
In summary, intense ischemic isometric muscle contraction was able to elicit similar VCpeak
regardless of body position indicating that VCpeak was independent of limb position andMPP. The rate of increase for VC and MBF following the onset of exercise were acceleratedin HUT and delayed during HDT due to changes in vasodilation and muscle pump activityaltering perfusion pressure gradient across the working muscle resulting in changes in vir-tual conductance. Recruitment of greater VC was able to fully compensate for the reducedMPP in LPOHDT to maintain MBF and thus DO2 at the same levels as LPOHUT. However,as predicted, a functional limitation to the recruitment of VC during HPOHDT restrictedthe increase in MBF, as confirmed by the relationship between MBF and EMGindex anal-ysis, limiting the DO2 with consequent metabolic stress as suggested by the higher EMGactivity in this body position. The lower MBF in the HPOHDT suggested that DO2 wasinsufficient to meet the demands for aerobic metabolism. This slower adaptation of MBFwhich limited O2 availability following the onset of exercise would result in slower adapta-tion of oxidative metabolism and a greater O2 deficit increasing the relative stress of theexercise challenge which could advance the onset of muscle fatigue.
93

Chapter 6
Effects of altered arterial oxygeninspired fraction and arterialperfusion pressure on vascularconductance and muscle blood flowduring exercise in humans
94

6.1 Overview
This study tested the hypothesis during the combined challenges of altered inspired O2
concentration (FIO2) and posture that vascular conductance (VC) to the exercising musclewould change to compensate for changes in muscle perfusion pressure (MPP) and arterialO2 such that muscle blood flow (MBF) can completely compensate to maintain estimatedO2 delivery (DO2est). Ten healthy volunteers exercised at lower (LPO) and higher poweroutputs (HPO) (repeated plantar flexion contractions at∼20% and 30%maximal voluntarycontraction, respectively) in horizontal (HOR), 35° head-down tilt (HDT) and 45° head-uptilt (HUT) under normoxia and hypoxia on separate days randomized by blocks. Muscleblood flow velocity was measured by Doppler ultrasound, popliteal arterial diameter wasmeasured by ultrasound imaging, MBF was calculated, arterial O2 saturation (SaO2%)was measured by a finger pulse oximeter, DO2est was estimated by MBF times SaO2 andVC was calculated by dividing MBF by MPP determined beat-by-beat from a finger cuff.Exercise VC, MBF and DO2est were higher in hypoxia than normoxia during LPO andHPO. Exercise MBF and DO2est in hypoxia were higher in LPOHOR than LPOHDT andLPOHUT,v but was lower in LPOHUT. Exercise VC in hypoxia was higher in LPOHDT
and lower in LPOHUT. The higher VC in LPOHDT during hypoxia compensated for thereduced MPP and SaO2 increasing MBF to maintain DO2est. During HPO in hypoxia,MBF and DO2est tended to be higher in HPOHOR with no differences between HPOHDT
and HPOHUT. VC was higher during HPOHDT and lower in HPOHUT. The greater VC inHPOHDT in hypoxia compensated the reduced MPP and O2 availability such that MBFand DO2est were not different between HPOHDT and HPOHUT. However, the relationshipbetween MBF and EMG activity demonstrated that MBF was reduced during HPOHDT
indicating that MBF and DO2est were not sufficient, a conclusion also supported by themarkedly elevated VC, MBF and DO2est post-exercise recovery responses. VC during therelaxation phase of the duty cycle (VCrelax) demonstrated to be at the maximal vasodilatorycapacity during HPOHDT indicating that the ability to recruit further increases in VC waslimited. Thus, MBF and subsequently DO2 were compromised during reduced MPP andSaO2.
95

6.2 Introduction
Muscle blood flow (MBF) increases to match oxygen delivery (DO2) to the metabolic de-mand during exercise with constant intensity (Walker et al., 2007, Laughlin and Joyner,2003). This matching between MBF to DO2 to metabolic demand is accomplished througha combined effect of progressive vasodilatory mechanisms and potential contribution ofthe muscle pump (Walker et al., 2007, Tschakovsky et al., 2006, Lutjemeier et al., 2005,Tschakovsky and Sheriff, 2004, Shoemaker and Hughson, 1999). This metabolic regula-tion of MBF is mainly responsible to promote the maintenance of steady state conditions(Shoemaker and Hughson, 1999). In submaximal steady-state exercise performed withsmall muscle mass, MBF determines DO2 because there is no alteration in the arterial O2
content (Walker et al., 2007). However, in conditions with altered inspired O2 fraction(FIO2), arterial O2 content (CaO2) and arterial O2 partial pressure (PaO2) changes andcompensatory adjustments in MBF are required to maintain the delivery of O2 (Gonzalez-Alonso et al., 2001). The capacity of MBF to increase DO2 is directly dependent on O2
content on the blood (Calbet, 2000).
Alterations in FIO2 to manipulate CaO2 and PaO2, such as hypoxia, have been used toinvestigate MBF and DO2 adjustments during exercise. Previous investigations reportedthat manipulation of CaO2 and PaO2 via hypoxia resulted in compensatory adjustmentsin MBF to maintain DO2 during submaximal one or two-legged knee extension exercise insemi-supine position (Gonzalez-Alonso et al., 2001, Koskolou et al., 1997) or maintenanceof MBF with reduction in DO2 during submaximal alternated two-legged kicking exercisein sitting position (MacDonald et al., 2001). Manipulations of limb position relative to theheart to alter arterial and venous pressure also have been used to investigate MBF andDO2 adaptations during exercise. In the previous investigation (Chapter 5) and Walker etal., 2007 provided evidences that MBF during exercise was reduced in the face of reducedmuscle perfusion pressure (MPP) despite the greater vascular conductance (VC) duringhead-down tilt (HDT), indicating that VC response was not able to fully compensate forthe diminished MPP. This functional limitation to the recruitment of VC during HDT re-stricted the increase in MBF limiting the DO2 with consequent metabolic stress suggestingthat DO2 was insufficient to meet the demands for aerobic metabolism (Chapter 5). How-ever, the effects of altered FIO2 (hypoxia) in conjunction with altered arterial perfusionpressure on MBF, DO2 and VC responses during exercise in humans are not known.
The purpose of the current study was to investigate MBF, DO2est and VC responsesduring submaximal calf exercise in three different body positions that affect the gravity-dependent distribution of arterial and venous pressures under altered FIO2 (normoxia,FIO2 = 0.21 and hypoxia, FIO2 = 0.14). It was hypothesized that under hypoxia within
96

the same body position VC to the exercising muscle would change to compensate forchanges in perfusion pressure and O2 availability such that MBF through the poplitealartery can completely compensate to maintain DO2est. It was also hypothesized that inhypoxic gas breathing during lower power output exercise, VC response would be able tofully compensate for the changes in FIO2 and MPP so that MBF to the working musclewould be maintained as well as DO2est regardless of body position. However, during higherpower output exercise, VC response would not be able to completely compensate for thereduction in FIO2 and MPP due to a functional limitation to the recruitment of VC thatwould restrict the increase in MBF leading to a limitation in DO2est.
6.3 Methods
6.3.1 Participants
Ten healthy, non-smoking male volunteers, not specifically exercise trained, with averagephysical characteristics of: age 27.2 ± 3.6 years, height 176.7 ± 5.5 cm, body mass 78.6 ±
6.9 Kg and body mass index 25.2 ± 2.5 Kg/m2 participated in this study. The participantsaverage maximal isometric voluntary contraction force (MVC) produced during plantarflexion exercise in prone horizontal position was 61.0 ± 3.2 Kg. Participants receivedcomplete written and verbal details of the experimental procedures and potential risksinvolved prior to signing an information consent form approved by the Office of ResearchEthics of the University of Waterloo. All participants were instructed to refrain fromconsuming alcohol, caffeinated beverages, engaging in vigorous exercise for 24 hours priorto testing, and from consuming a large meal within two hours of testing.
6.3.2 Experimental Design
Participants, who had previously completed tests of peak vascular conductance (VCpeak)(see Chapter 5, page 69) reported to the laboratory four times for the manipulations of thegas breathing conditions to alter FIO2 (normoxia, 21% O2 or FIO2 = 0.21 and hypoxia,14% O2 or FIO2 = 0.14) associated with changes in body position during submaximalplantar flexion exercise. Briefly, after arrival in the laboratory, they assumed a proneposition with their heads supported by a massage table head piece, shoulder blocks wereadjusted accordingly, their arms were placed with the shoulders and elbows positionedat approximately 90°. Two belts, one located on the chest and other on the hips were
97

used to secure the participants during testing. Straps from these belts were attachedto the tilt table to maintain body position. A footplate was connected to the tilt tableallowing plantar flexion exercise to be performed. The participants foot was strapped on thefootplate to ensure more stability during the motion and better contact between plantarsurface of the foot and footplate. Instrumentation took place as described below thenthe participants rested before starting the testing for approximately 30 minutes. For theexperiments involving manipulations of gas concentrations, participants breathed hypoxicair through a face mask connected via a sterile air filter to a large non-pressurized bag(Non-diffusing gas collection bag 60L, Hans Rudolph Inc., Kansas City, Missouri, USA)containing medical grade gas mixtures with 14% O2 and balance nitrogen from a cylindertank (Praxair Canada Inc., Mississauga, Ontario, Canada).
6.3.2.1 Altered arterial perfusion pressure and inspired O2 fraction exerciseprotocols
The participants were able to sustain a repeated plantar flexion exercise comprised of 1s toextend the footplate, 1s to return it to resting position, and 1s of rest representing 3s dutycycle in time with a metronome with the load set to 20% or 30% MVC. These protocolsgenerated work rates defined as lower and higher power output that could be sustained for7min with some challenge but without fatigue. The foot plate movement was set in therotational axis of the ankle to isolate calf muscle contractions which the angle of movementset at ∼20° representing a displacement of 10 cm.
Each participant performed six different protocols, three tests per day on four differentdays randomized by blocks and counterbalanced. Participants were permitted to comeoff the tilt table and rest for at least 30min between each individual test on each day toensure that variables were back to the baseline levels. The altered FIO2 tests consistedof 3min baseline followed by 3min exercise in normoxia (FIO2 = 0.21), 4min exercisein hypoxia and 3min of recovery in hypoxia (FIO2 = 0.14) (Figure 6.1). The order fortest block A was: higher power output exercise in head-up tilt (HPOHUT), lower poweroutput exercise in head-down tilt (LPOHDT) and higher power output exercise in horizontal(HPOHOR). The order for test block B was: lower power output exercise in horizontal(LPOHOR), higher power output exercise in head-down tilt (HPOHDT) and lower poweroutput exercise in head-up tilt (LPOHUT). These blocks were distributed based on thebest physiological approach to minimize any carry over, cumulative effect of one conditionto another, especially on the early stages of the subsequent protocols and to avoid musclefatigue. The four days of testing were performed two times per week separated by atleast 48 hours. This break minimized any carry over and cumulative effect of the exercise
98

protocols as well as muscle adaptation to the stimulus.
Figure 6.1: Exercising protocol used to investigate MBF, DO2est and VC responses duringsubmaximal calf exercise in HOR, HDT and HUT positions under altered FIO2 (normoxia,FIO2 = 0.21 and hypoxia, FIO2 = 0.14). Arrows indicate were ADpop (popliteal arterialdiameter) were taken.
The angle of tilting accomplished an average reduction in MPP estimated to the middleof the calf muscle of ∼−44 mmHg for HDT (35°) and ∼+55 mmHg for HUT position (45°).The gas breathing changes accomplished a reduction of ∼8% in SaO2 from normoxia (FIO2
= 0.21) to hypoxia (FIO2 = 0.14). Changing the angle of the tilt table required adjustingthe load to achieve the same tension on the cable attached to the foot plate as previouslydescribed elsewhere (see methods section in Chapter 5 for more details, page 70).
All tests were conducted in a quiet room where room temperature was kept constantat 19.4 ± 0.9 °C to ensure minimal skin blood flow at rest, with humidity at 39.9 ± 4.8%,and barometric pressure at 730.8 ± 2.4 mmHg.
6.3.3 Data Acquisition
Muscle blood flow velocity (MBV) in the popliteal artery, heart rate (HR) and bloodpressure (BP) were measured on a beat-by-beat basis. MBV responses were determinedfrom the intensity weighted mean of a 4 MHz pulsed Doppler ultrasound probe (NeurovisionDoppler Ultrasound, Model 500, Multigon Industries, Mt. Vernon, USA) for all trials in theexperiments. This flat ultrasound probe was secured by surgical tape to the skin surface
99

over the popliteal artery embedded at a 45° angle of insonation relative to the skin andadjusted according to the measured angle between the skin and the popliteal artery.
The popliteal artery was investigated to establish proper alignment, and to determinethe depth and gate to assure full insonation of the artery lumen prior to each trial. Theintensity of the Doppler spectrum was verified by audio and visual feedback. The probelocation was marked on the skin to assist repositioning of the probe during the test andon subsequent tests. If it was necessary, the researcher manipulated the probe to preservethe best Doppler signal as determined by constant use of auditory and visual feedback.If the ultrasound signal quality was compromised during the last minute of exercise innormoxia and/or hypoxia the test trial was excluded from the analysis. This occurred withone participant in HDT conditions due to difficulties with the Doppler ultrasound signalresulting in loss of some data in those trials. Therefore, the data analysis for LPOHDT andHPOHDT were based on nine rather than ten participants.
Diameter of the popliteal artery (ADpop) was measured with an 8-12 MHz echo Dopplerultrasound probe (Diagnostic Ultrasound system, Model M5, Shenzen Mindray Bio-medicalelectronics Co., Ltd., Shenzen, China). These popliteal artery images were recorded andstored for analysis. ADpop measurements were performed in B-mode with the echo Dopplerultrasound probe positioned just proximal to the site of velocity measurements. ADpop
images were taken as the average of three separate measurements during diastole at baselineand at the end of recovery and during the relaxation phase between contractions in thethird and sixth minutes of exercise.
Arterial blood pressure was estimated from a photoplethysmograph cuff placed aroundthe middle finger of the left hand (Finometer, Finapres Medical Systems, Arnhem, theNetherlands). Mean arterial pressure (MAP) was determined as the area under the curvebetween successive heart beats. HR was continuously calculated from the RR-intervalobtained from an electrocardiogram (Pilot 9200, Colin Medical Instruments Corp, San An-tonio, Texas, USA). Oxygen saturation (SaO2) was obtained by a pulse oximeter with theprobe placed in the index finger of the left hand (Ohmeda 3740 Pulse oximeter, Louisville,CO., USA).
The muscle activity was measured by electromyography (EMG) as described elsewhere(for more details see methods section Chapter 5, page 72). Briefly, the EMG surface elec-trodes were placed longitudinally on the distal half of the medial and lateral gastrocnemiusand soleus of the right leg. Participants were shaved, abraded and cleaned with alcoholand electrodes were fixed on the skin with the reference electrode on the head of the fibula.A custom built amplifier was used to amplify the raw EMG signal.
MBV, MAP, HR, EMG and SaO2 were continuously collected at 1000 Hz using a data
100

acquisition system (Powerlab, ADInstruments, Colorado Springs, USA). This system wasconnected to the computer and all the variables were continuously recorded using dataanalysis software (Chart, version 5.5, ADInstruments, Colorado Springs, USA). EMG datawere collected at 1000 Hz and processed with custom software (Matlab, version 7.0, TheMathworks, Natick, Massachusetts, USA).
6.3.4 Data Analysis
Beat-by-beat data were time aligned, linearly interpolated and averaged over two completecontraction/relaxation cycles (6 seconds) and over two trials to produce a single data setper person for each of the six conditions. In the current study, MBF, DO2est, VC and EMGin different body positions (HOR, HDT and HUT) were all determine in the last minuteof exercise in normoxia (2-3min) and compared with the last minute of exercise in hypoxia(6-7min).
MBF was calculated as the product between MBV and the corresponding ADpop cross-sectional area as MBF = MBV×πr2×60; where r is the vessel radius. The DO2est wascalculated as MBF (mL.min-1) times SaO2. MPP (mmHg) was estimated by MAP (mmHg)and the distance between subjects heart and the middle of the calf muscle for all bodypositions as demonstrated elsewhere (Chapter 2, page 22). VC (mL.min-1.mmHg-1) wasdetermined by MBF (mL.min-1) divided by MPP (mmHg) as VC = MBF/MPP.
The EMG data analyses were described elsewhere (see methods section Chapter 5 formore details, page 74-75). Briefly, the EMG data was rectified and filtered (2nd order,dual pass Butterworth, cut off frequency of 5Hz). The area under the rectified signal de-termined integrated EMG (iEMG) and the fast Fourier transformation (FFT) determinedmean power frequency (MPF). The EMG signal was normalized by the maximal voluntarycontraction (MVC) and then averaged in the last minute of exercise expressed as percentageof MVC (%MVC).
6.3.5 Statistical Analysis
Data underwent a two way analysis of variance (ANOVA) for repeated measures withmain effects of body position (HOR, HDT, and HUT) and time (baseline and recovery)for the dependent variables during lower and higher power outputs at baseline and thelast minute of recovery. Exercise data were analysed by a two way analysis of variance(ANOVA) for repeated measures with main effects of body position (HOR, HDT, and HUT)and altered FIO2 (normoxia and hypoxia) for the dependent variables during lower and
101

higher power outputs in the last minute of normoxia and hypoxia. If required, prior to theanalysis data were rank-transformed to address concerns of non-normal distribution. TheStudent-Newman-Keuls post-hoc test was performed to identify the statistically significantdifferences. The level of significance for main effects and interactions was set at p < 0.05.Data were presented as means ± standard deviation (SD).
6.4 Results
6.4.1 Lower output tests responses under altered FIO2
The two-way repeated measures ANOVA indicated a main effect of body position andtime (baseline and recovery) and interactions between body position and time for MBFand DO2est (p < 0.05) and a main effect of body position and time for VC (p < 0.05).The post-hoc analysis demonstrated that the baseline values for MBF and DO2est were notdifferent between LPOHDT and LPOHOR but lower in LPOHUT (p < 0.05, Table 6.1, Figure6.2A, 6.2B). The baseline values for VC were higher in LPOHDT and lower during LPOHUT
(p < 0.05, Table 6.1, Figure 6.2C).
During exercise, the two-way repeated measures ANOVA indicated a main effect ofbody position and interactions between body position and FIO2 for MBF and DO2est (p <
0.05) and main effect of body position and FIO2 and interactions between body positionand FIO2 for VC (p < 0.05). Mean values of MBF during exercise were not differentbetween normoxia and hypoxia in the same condition for LPOHOR and LPOHUT, but duringLPOHUT, DO2est was lower in hypoxia than normoxia (p < 0.05). During LPOHDT, MBFand DO2est were higher in hypoxia than normoxia (p < 0.05, Table 6.1, Figure 6.2D, 6.2E).Mean VC values during exercise were not different between normoxia and hypoxia in thesame condition for LPOHOR and LPOHUT, but were higher in hypoxia than normoxia forLPOHDT (p < 0.05, Table 6.1, Figure 6.2F).
Differences existed between body positions for both the normoxic and hypoxic phasesof the tests. During exercise in normoxia, MBF and DO2est were higher in LPOHOR thanLPOHDT and LPOHUT (p < 0.05) with no differences between LPOHUT and LPOHDT (Ta-ble 6.1, Figure 6.2D, 6.2E). During exercise in hypoxia, MBF and DO2est were higher inLPOHOR than (p < 0.05), but lower in LPOHUT compared to LPOHDT (Table 6.1, Fig-ure 6.2D, 6.2E). VC values during exercise in both normoxia and hypoxia were higher inLPOHDT but were lower during LPOHUT (p < 0.05, Table 6.1, Figure 6.2F).
The post-hoc analysis indicated that MBF values in the same conditions were higherduring recovery than baseline for all body positions (p < 0.05, Table 2.1, Figure 6.2A).
102

However, DO2est values were higher during recovery compared to baseline only for LPOHDT
(p < 0.05) with no differences for LPOHOR and LPOHUT (Table 6.1, Figure 6.2B). Thepost-exercise recovery for MBF and DO2est between body positions were lower in LPOHUT
compared to LPOHDT and LPOHOR (p < 0.05) with no differences between LPOHOR andLPOHDT (Table 6.1, Figure 6.2A, 6.2B). Within the same condition, VC was higher duringrecovery than baseline for LPOHDT (p < 0.05) with no differences between LPOHOR andLPOHUT (Table 6.1, Figure 6.2C). VC values between body positions were higher duringLPOHDT but lower in LPOHUT (p < 0.05, Table 6.1, Figure 6.2C).
Table 6.1: MBF, DO2est and VC at baseline, exercise (normoxia and hypoxia) and recoveryduring LPOHOR, LPOHDT and LPOHUT conditions.
Variables time points LPOHOR (n=10) LPOHDT (n=9) LPOHUT (n=10)
baseline 48.4± 17.2 44.3± 13.5 27.3± 10.0ab
normoxia 188.7± 67.1 146.3± 34.2a 127.2± 58.8a
MBF (mL.min-1) hypoxia 195.8± 72.4 167.3± 38.1bd 119.5± 53.2de
recovery 61.7± 26.7f 82.8± 34.4f 31.1± 11.2fgh
baseline 46.9± 16.7 43.2± 13.2 26.6± 9.7ab
normoxia 183.4± 65.6 142.2± 33.2a 123.9± 57.2a
DO2est (mLO2.min-1) hypoxia 176.9± 65.4 152.6± 34.3d 109.6± 48.5cde
recovery 54.6± 23.4 74.2± 34.7f 29.6± 9.7gh
baseline 0.6± 0.2 0.9± 0.4a 0.2± 0.1ab
normoxia 2.2± 0.7 2.9± 0.8a 0.9± 0.4ab
VC (mL.min-1.min-1) hypoxia 2.1± 0.8 3.3± 0.8bd 0.8± 0.4de
recovery 0.7± 0.3 1.8± 1.0fg 0.2± 0.1gh
test block order B1 A2 B3
Values are mean ± SD. Number of participants (n), muscle blood flow (MBF), estimated O2
delivery (DO2est), vascular conductance (VC), lower power output in horizontal (LPOHOR),lower power output in head-down tilt (LPOHDT) and lower power output in head-up tilt(LPOHUT). Statistically significant compared to: aLPOHOR,
bLPOHDT and cLPOHUT innormoxia, dLPOHOR and eLPOHDT in hypoxia, fbaseline in the same condition, grecoveryin LPOHOR and hrecovery in LPOHDT (p < 0.05). Test Block Order indicates for each ofthe Blocks (see page 98).
103

Figure 6.2: Time course of changes in MBF (A), DO2est (B) and VC (C) during dynamicplantar flexion exercise performed in lower power output under normoxia (FIO2 = 0.21)and hypoxia (FIO2 = 0.14). Lines indicate group response, symbols indicate the points atwhich statistical analysis were performed and dashed vertical lines indicate the start, gasconcentration shift and cessation of exercise. Data are the mean analysed over 6 secondtime bins including contraction and relaxation phases of the duty cycles. MBF (D), DO2est
(E) and VC (F) during dynamic plantar flexion exercise performed in lower power outputunder normoxia and hypoxia. Data are the mean ± SD averaged during the last minuteof exercise in normoxia and hypoxia. Statistically significant compared to: aLPOHOR,bLPOHDT and cLPOHUT in normoxia and dLPOHOR and eLPOHDT in hypoxia (p < 0.05).If necessary the symbols were offset for clarity.
104

6.4.2 Higher output tests responses under altered FIO2
The two-way repeated measures ANOVA indicated a main effect of body position andtime (baseline and recovery) for MBF, DO2est and VC (p < 0.05). The post-hoc analysisdemonstrated that the baseline values for MBF, DO2est and VC were higher in HPOHDT,but lower in HPOHUT (p < 0.05, Figure 6.3A, 6.3B, 6.3C).
During exercise, the two-way repeated measures ANOVA indicated a main effect ofbody position and FIO2 for MBF, DO2est and VC (p < 0.05). The post-hoc analysisindicated that mean values of MBF and DO2est during exercise were not different betweennormoxia and hypoxia in the same condition for HPOHUT, but were higher during hypoxiathan normoxia in HPOHOR and HPOHDT (Table 6.2, Figure 6.3D, 6.3E). Mean VC valuesduring exercise were not different between normoxia and hypoxia in the same condition forHPOHOR and HPOHUT but were higher in hypoxia than normoxia for HPOHDT (p < 0.05,Table 6.2, Figure 6.3).
Normoxic and hypoxic phases of the tests presented differences between body positions.MBF and DO2est during normoxia were higher in HPOHOR compared to HPOHDT (p < 0.05)and tended to be higher compared to HPOHUT (p = 0.064) with no differences betweenHPOHDT and HPOHUT (p = 0.236). During hypoxia, MBF and DO2est tended to be higherin HPOHOR compared to HPOHDT (p = 0.052) and HPOHUT (p = 0.077) with no differencesbetween HPOHDT and HPOHUT (p = 0.808, Figure 6.3D, 6.3E). VC values during exercisebetween body positions during both normoxia and hypoxia were higher in HPOHDT (p <
0.05), but were lower during HPOHUT (p < 0.05, Table 6.2, Figure 6.3F).
The post-hoc analysis indicated that MBF and DO2est values were higher during recov-ery compared to baseline for all body positions in the same conditions (p < 0.05, Table 6.2,Figure 6.3A, 6.3B). MBF and DO2est values between body positions were higher duringHPOHDT than HPOHOR and HPOHUT (p < 0.05), but lower in HPOHUT (p < 0.05, Table6.2, Figure 6.3C). Within the same conditions, VC values were higher during recoverycompared to baseline for HPOHDT and HPOHUT (p < 0.05) and tended to be for HPOHOR
(p = 0.063, Figure 6.3C). VC responses between body positions were greater in HPOHDT
than HPOHOR and HPOHUT (p < 0.05), but lower in HPOHUT (p < 0.05, Table 6.2, Figure6.3C).
105

Table 6.2: MBF, DO2est and VC at baseline, exercise (normoxia and hypoxia) and recoveryduring HPOHOR, HPOHDT and HPOHUT conditions.
Variables time points LPOHOR (n=10) LPOHDT (n=9) LPOHUT (n=10)
baseline 36.8± 11.4 47.8± 15.3 30.8± 11.1b
normoxia 227.5± 79.7 186.8± 55.4a 203.3± 74.3MBF (mL.min-1) hypoxia 249.5± 95.7a 221.6± 68.7bd 210.3± 84.2
recovery 55.1± 23.8f 155.2± 72.3fg 43.5± 18.9fh
baseline 35.9± 11.1 46.4± 14.8 29.9± 10.7b
normoxia 221.0± 77.3 180.9± 53.3a 197.0± 72.4DO2est (mLO2
.min-1) hypoxia 228.4± 86.7 201.0± 60.8bd 190.8± 75.0recovery 49.6± 21.3f 138.2± 63.6fg 38.7± 16.0fgh
baseline 0.4± 0.1 1.0± 0.4a 0.2± 0.1ab
normoxia 2.4± 0.8 3.6± 1.0a 1.4± 0.5ab
VC (mL.min-1.min-1) hypoxia 2.5± 0.9 4.1± 1.2bd 1.4± 0.6de
recovery 0.5± 0.2 3.3± 1.7fg 0.3± 0.1fgh
test block order A3 B2 A1
Values are mean ± SD. Number of participants (n), muscle blood flow (MBF), esti-mated O2 delivery (DO2est), vascular conductance (VC), higher power output in horizontal(HPOHOR), higher power output in head-down tilt (HPOHDT) and higher power outputin head-up tilt (HPOHUT). Statistically significant compared to: aHPOHOR,
bHPOHDT
and cHPOHUT in normoxia, dHPOHOR and eHPOHDT in hypoxia, fbaseline in the samecondition, grecovery in HPOHOR and hrecovery in HPOHDT (p < 0.05). Test Block Orderindicates for each of the Blocks (see page 98).
106

Figure 6.3: Time course of changes in MBF (A), DO2est (B) and VC (C) during dynamicplantar flexion exercise performed in highber power output under normoxia (FIO2 = 0.21)and hypoxia (FIO2 = 0.14). Lines indicate group response, symbols indicate the points atwhich statistical analysis were performed and dashed vertical lines indicate the start, gasconcentration shift and cessation of exercise. Data are the mean analysed over 6 secondtime bins including contraction and relaxation phases of the duty cycles. MBF (D), DO2est
(E) and VC (F) during dynamic plantar flexion exercise performed in higher power outputunder normoxia and hypoxia. Data are the mean ± SD averaged during the last minuteof exercise in normoxia and hypoxia. Statistically significant compared to: aHPOHOR,bHPOHDT and cHPOHUT in normoxia and dHPOHOR and eHPOHDT in hypoxia (p < 0.05).If necessary the symbols were offset for clarity.
107

6.4.3 Vascular conductance expressed as percentage of the peak
vascular conductance under altered FIO2
The two-way repeated measures ANOVA indicated a main effect of body position andinteraction between body position and FIO2 for vascular conductance during relaxation(VCrelax) and VCrelax expressed as percentage (% VCrelax) for lower power output (p <
0.05). The post-hoc analysis demonstrated that the baseline VCrelax and %VCrelax weresignificantly higher during LPOHDT and lower during LPOHUT (p < 0.05, Figure 6.4A).VCrelax and %VCrelax responses during exercise were different between normoxia and hy-poxia for LPOHDT (p < 0.05) with no differences within LPOHOR and LPOHUT (Figure6.4C). In both normoxia and hypoxia during lower power output, VCrelax and %VCrelax
during exercise were higher in LPOHDT and lower in LPOHUT position (p < 0.05, Figure6.4C).
In higher power output there were main effects of body position and FIO2 and interac-tion between body position and FIO2 for VCrelax and %VCrelax (p < 0.05). The post-hocanalysis indicated that the baseline VCrelax and %VCrelax were significantly higher dur-ing HPOHDT and lower during HPOHUT (p < 0.05, Figure 6.4B). In exercise, VCrelax and%VCrelax responses were different between normoxia and hypoxia for HPOHDT and HPOHOR
(p < 0.05), but not in HPOHUT (Figure 6.4D). During higher power output, VCrelax and%VCrelax exercise were higher in HPOHDT and lower in HPOHUT in both normoxic andhypoxic conditions (p < 0.05, Figure 6.4D).
108

Figure 6.4: Time course of changes in VCrelax (mL.min-1.mmHg-1) and %VCrelax as percent-age of change in vascular conductance response (%VCrelax = VCrelax/VCpeak×100) duringdynamic plantar flexion exercise performed in lower (A) and higher power outputs (B)under normoxia (FIO2 = 0.21) and hypoxia (FIO2 = 0.14). Lines indicate group response,symbols indicate the points at which statistical analysis were performed and dashed verti-cal lines indicate the start and cessation of exercise. The bar graphs represent exercisingVCrelax and %VCrelax during lower (C) and higher power outputs (D) under normoxia andhypoxia. Data are the mean ± SD analysed over the relaxation phases between musclecontraction phases of the duty cycles in normoxia and hypoxia. Statistically significantcompared to: aHOR and bHDT and cHUT in normoxia and dHOR and eHDT in hypoxia(p < 0.05). If necessary symbols were offset for clarity.
109

6.4.4 Muscle activity responses during exercise
In lower power output, the two-way repeated measures ANOVA indicated a main effectof body position and interaction between body position and FIO2 for soleus, total muscleactivity (TMA) and EMGindex and interaction between body position and FIO2 for gas-trocnemius medial head (GMH) and gastrocnemius lateral head (GLH) (p < 0.05). Thepost-hoc analysis showed that during lower power output, EMG activity was not differentbetween normoxia and hypoxia in the same condition for all muscles and body positions(Figure 6.5A, 6.5B, 6.5C). However, TMA and EMGindex were different between normoxiaand hypoxia in the same conditions for all body positions (Figure 6.5D, 6.5E). In lowerpower output in normoxia, EMG activity was not different between body positions for allmuscles, TMA and EMGindex (Figure 6.5A-E). However, in hypoxia, soleus, GLH, TMAand EMGindex responses during exercise were higher in LPOHDT than LPOHOR and LPOHUT
(p < 0.05) with no differences between LPOHOR and LPOHUT positions (Figure 6.5A, 6.5C,6.5D, 6.5D, respectively).
In higher power output, the two-way repeated measures ANOVA indicated a main effectof body position and interaction between body position and FIO2 for all muscle groups,TMA and EMGindex (p <0.05). The post-hoc analysis demonstrated that in higher poweroutput, EMG activity was different between normoxia and hypoxia during HPOHDT withno differences during HPOHOR and HPOHUT for all muscle groups, TMA and EMGindex
(p < 0.05, Figure 6.5A-E). In normoxia, GMH, TMA and EMGindex demonstrated lowervalues during HPOHUT compared to HPOHDT and HPOHOR (p < 0.05) with no differencesbetween HPOHOR and HPOHDT (Figure 6.5B, 6.5D, 6.5E). Soleus showed lower valuesduring HPOHUT compared to HPOHDT (p < 0.05), but not different than HPOHOR (Figure6.5A). GLH was not different between body positions in normoxia (Figure 6.5C). In hypoxiaduring higher power output, EMG activity for all muscle groups, TMA and EMGindex werehigher in HPOHDT, but lower in HPOHUT (p < 0.05, Figure 6.5A-E).
110

Figure 6.5: (A) Muscle activity in soleus, (B) gastrocnemius medial head (GMH), (C)gastrocnemius lateral head (GLH), (D) total muscle activity (TMA) and (E) EMGindex
during plantar flexion exercise during lower and higher power outputs under horizontal(HOR), head-down tilt (HDT) and head-up tilt (HUT) positions under normoxia (FIO2 =0.21) and hypoxia (FIO2 = 0.14). Total muscle activity was calculated as the sum of themean for soleus and gastrocnemius muscle groups activity as a percentage of MVC andEMGindex was calculated as the sum of the mean for soleus and gastrocnemius muscle groupsactivity divided by the sum of the MVC for both workloads and for all body positions.Data are the mean ± SD averaged during the last minute of exercise in normoxia andhypoxia. Statistically significant compared to: aHOR, bHDT and cHUT in normoxia anddHOR and eHDT in hypoxia (p < 0.05).
111

6.4.5 Normalized muscle blood flow by muscle activity under
altered FIO2
The two-way repeated measures ANOVA indicated a main effect of body position andFIO2 for MBF/EMGindex during lower power output (p < 0.05). The post-hoc analysis in-dicated that MBF/EMGindex was different between normoxia and hypoxia during LPOHOR
(p < 0.05) with no differences between LPOHDT and LPOHUT (Figure 6.6C). During lowerpower output in normoxia and hypoxia, MBF/EMGindex was higher in LPOHOR comparedto LPOHDT and LPOHUT (p < 0.05) with no differences between LPOHDT and LPOHUT
(Figure 6.6C).
The two-way repeated measures ANOVA indicated a main effect of body position forMBF/EMGindex during higher power output (p < 0.05). The post-hoc analysis indicatedthat MBF/EMGindex was not different between normoxia and hypoxia for all body positions(Figure 6.6D). In higher power output during normoxia and hypoxia MBF/EMGindex waslower in HPOHDT than HPOHOR and HPOHUT (p < 0.05) with no differences betweenHPOHOR and HPOHUT (Figure 6.6D).
112

Figure 6.6: Time course of changes in MBF/EMGindex during dynamic plantar flexionexercise performed in lower (A) and higher (B) power outputs under normoxia (FIO2
= 0.21) and hypoxia (FIO2 = 0.14). Lines indicate group response, symbols indicatethe points at which statistical analysis were performed and dashed vertical lines indicatethe start, gas concentration shift and cessation of exercise. Data are the mean analysedover 6 second time bins including contraction and relaxation phases of the duty cycles.MBF/EMGindex during dynamic plantar flexion exercise performed in lower (C) and higherpower output (D) under normoxia and hypoxia. Data are the mean ± SD averaged duringthe last minute of exercise in normoxia and hypoxia. Statistically significant comparedto: aHOR, bHDT and cHUT in normoxia and dHOR and eHDT in hypoxia (p < 0.05). Ifneeded symbols were offset for clarity.
113

6.4.6 Q, MAP and HR responses during lower and higher power
output exercises during normoxia and hypoxia
The two-way repeated measures ANOVA indicated a main effect of body position andFIO2 for MAP during lower and higher power outputs (p < 0.05). The post-hoc analysisindicated that in the lower power output exercise, MAP was not different between normoxiaand hypoxia in the same conditions for all body positions (Table 6.3). In both normoxiaand hypoxia during lower power output, MAP was higher in LPOHDT and LPOHUT thanLPOHOR (p < 0.05) with no differences between LPOHDT and LPOHUT (Table 6.3). Inhigher power output exercise, MAP was lower in normoxia than hypoxia for HPOHOR andHPOHDT (p < 0.05), but not different in HPOHUT (Table 6.3). In both normoxia andhypoxia, MAP was lower in HPOHUT than HPOHOR and HPOHDT (p < 0.05) with nodifferences between HPOHOR and HPOHDT (Table 6.3).
The two-way repeated measures ANOVA indicated a main effect of body position andFIO2 for Q and HR during lower power output (p < 0.05). The post-hoc analysis demon-strated that Q was lower in normoxia compared to hypoxia for all body positions duringlower power output (Table 6.3). In normoxia and hypoxia, Q was higher in LPOHOR
compared to LPOHDT and LPOHUT (p < 0.05) with no differences between LPOHDT andLPOHUT (Table 6.3). During higher power output, Q was lower in normoxia than hypoxiafor HPOHOR and HPOHDT (p < 0.05), but not during HPOHUT as indicated by the maineffect of FIO2 (Table 6.3). Q during normoxia and hypoxia was not different for all bodypositions (Table 6.3).
The post-hoc analysis indicated that HR during lower power output was lower in nor-moxia compared to hypoxia in the same conditions for all body positions (p < 0.05). Dur-ing lower power output, HR values during exercise in normoxia and hypoxia were lower inLPOHDT than LPOHOR and LPOHUT (p < 0.05) with no differences between LPOHOR andLPOHUT (Table 6.3). In higher power output, HR was lower in normoxia than hypoxia forall body positions (p < 0.05). Normoxic and hypoxic conditions showed higher HR val-ues during HPOHUT than HPOHOR and HPOHDT (p < 0.05) with no differences betweenHPOHOR and HPOHDT (Table 6.3).
114

Table 6.3: Q, MAP and HR in normoxia and hypoxia averaged during the last minute ofexercise during LPOHDT, LPOHOR, LPOHUT, HPOHDT, HPOHOR and HPOHUT.
Variables time points LPOHOR LPOHDT LPOHUT
normoxia 89.9± 5.2 95.3± 7.9a 95.1± 7.2a
MAP (mmHg) hypoxia 90.4± 5.7 95.6± 7.9d 96.0± 8.3d
normoxia 6.4± 1.0 5.6± 1.0a 5.4± 0.7a
Q (L.min-1) hypoxia 7.1± 1.3a 5.9± 1.1bd 5.9± 0.9acd
normoxia 63.6± 9.4 60.7± 8.7a 65.3± 9.3b
HR (bpm) hypoxia 70.1± 11.2a 65.8± 10.1bd 72.1± 10.7de
Variables time points HPOHOR HPOHDT HPOHUT
normoxia 96.0± 7.0 95.1± 7.6 91.8± 8.2ab
MAP (mmHg) hypoxia 98.2± 7.6a 97.7± 7.4b 92.7± 7.6de
normoxia 5.9± 0.7 6.0± 1.0 6.2± 0.9
Q (L.min-1) hypoxia 6.3± 0.7a 6.6± 1.4d 6.4± 0.8
normoxia 61.3± 8.8 64.6± 9.6 70.7± 10.5ab
HR (bpm) hypoxia 66.3± 9.6a 72.2± 11.6b 75.4± 12.4cde
Values are mean± SD of 10 participants. Mean arterial pressure (MAP), cardiac output(Q)heart rate (HR), lower power output in horizontal (LPOHOR), lower power output in head-down tilt (LPOHDT), lower power output in head-up tilt (LPOHUT), higher power outputin horizontal (HPOHOR), higher power output in head-down tilt (HPOHDT) and higherpower output in head-up tilt (HPOHUT). Statistically significant compared to: aLPOHOR;bLPOHDT;
cLPOHUT;dHPOHOR and eHPOHDT (p < 0.05).
115

6.5 Discussion
In the present study, it was demonstrated the capability of the vascular system to regulateMBF to maintain DO2 in conditions with altered FIO2 (hypoxia) and MPP during sub-maximal exercise. This is the first time that HDT, HOR and HUT positions were testedin conjunction with hypoxia to determine exercise MBF, DO2est and VC responses dur-ing lower and higher power output exercises. The findings confirmed the hypothesis thatwithin the same body position VC to the exercising muscle would increase to compensatefor the alterations in perfusion pressure and O2 availability such that MBF through thepopliteal artery would increase sufficiently to maintain DO2est. The greater recruitment ofVC in HDT compensated for the reduction in MPP and SaO2 increasing MBF sufficientlyto maintain DO2est at the same level as HUT. However, the analysis of the relationshipbetween MBF and EMG activity (EMGindex) demonstrated that this ratio was reducedduring HPOHDT in both normoxia and hypoxia. The lower MBF/EMGindex ratio indi-cated inadequate MBF limiting DO2est despite the greater VC response. During HPOHDT
in hypoxia, the maximal vasodilatory capacity was reached indicating that the ability tocompensate was exceeded. This functional limitation in the recruitment of VC might in-crease the metabolic stress in exercise as suggested by the higher EMG activity in thiscondition. The higher VC, MBF and DO2est responses during post-exercise recovery inHDT is also evidence that the MBF and DO2est were inadequate during the exercise phasein this position.
6.5.1 VC, MBF and DO2est responses during exercise: compar-
isons between normoxia and hypoxia in the same body po-sition
6.5.1.1 Lower power output exercise
During LPOHDT, the ∼14% increase in VC on average in hypoxia resulted in similar ∼14%in MBF that maintained DO2est at the same level as normoxia compensating for the re-duced MPP and SaO2 probably due to the greater accumulation of metabolites promotingvasodilation of the resistance arterioles. Despite this, there was ∼9% increase in EMGactivity in this position during hypoxia compared to normoxia suggesting that oxidativeenergy supply might have been impaired (Figure 6.2A-F, Figure 6.5A-E). The higher VCvalues during post-exercise recovery in LPOHDT suggested greater vasodilation probablydue to the higher concentration of muscle metabolites produced during this exercise condi-tion resulting in higher post-exercise MBF. The higher post-exercise VC, MBF and DO2est
116
are evidences that both flow and DO2 were probably not sufficient to meet the demand foraerobic metabolism in this position during exercise.
During LPOHOR, the non-significant changes in VC (∼4%) were sufficient to alter MBF(∼4%) to maintain DO2est at the same level as normoxia (Figure 6.5A-F) which was con-sistent with no significant changes in EMG values in this position in hypoxia comparedto normoxia (Figure 6.5A-E). In the current study, the compensatory adjustments in VCand MBF to maintain DO2est between normoxia and hypoxia are in line with studies thatdemonstrated increase in VC and MBF to maintain DO2 during hypoxia during one ortwo-legged knee extension submaximal exercise in semi-supine position (Gonzalez-Alonsoet al., 2001, Roach, Koskolou, Calbet, and Saltin, 1999, Koskolou et al., 1997, Rowell,Saltin, Kiens, and Christensen, 1986) or submaximal handgrip exercise (Wilkins, Schrage,Liu, Hancock, and Joyner, 2006). Such compensatory adjustments in VC and MBF duringhypoxia probably minimized the risk of mismatch between DO2 and metabolic demand dur-ing exercise (Calbet, Radegran, Boushel, and Saltin, 2009, Calbet, 2000). During LPOHOR,the VC, MBF and DO2est post-exercise responses suggested that both MBF and DO2 wereadequate to match the aerobic metabolism requirements in this condition during exercise.
During LPOHUT, VC and MBF responses did not change significantly as a consequenceDO2est decreased ∼12% in hypoxia in comparison with normoxia (Table 6.1, Figure 6.2A-F)with no significant changes in EMG activity between normoxia and hypoxia (Figure 6.5A-E). The result in the current study is in agreement with the no significant compensationin leg blood flow during hypoxia resulting in reduced DO2 during submaximal alternatedtwo-legged kicking exercise (MacDonald et al., 2000). The lower VC response duringexercise and recovery in LPOHUT suggested less vasodilation probably due to the lowerconcentrations of muscle metabolites produced during exercise condition. The VC, MBFand DO2est post-exercise responses are evidences that both flow and DO2 were probablysufficient to meet the demand for aerobic metabolism during exercise in this position.
6.5.1.2 Higher power output exercise
During higher power output despite the ∼8% reduction in SaO2 during hypoxia, VC was14% higher on average during HPOHDT which was accompanied by ∼19% increase in MBFthat maintained DO2est at the same level as normoxia, but in spite of this the averageEMG increased ∼20% compared to normoxia (Figure 6.3A-F, Figure 6.5A-E). The higherEMG activity in hypoxia indicated a relative increased metabolic stress that would advancethe onset of muscle fatigue. The increased VC during exercise and recovery in HPOHDT
suggested greater vasodilation probably due to the higher production and greater accumu-lation of muscle metabolites resulting in greater post-exercise hyperemia and DO2est. The
117

increased VC, MBF and DO2est post-exercise responses in HPOHDT are evidences that bothflow and DO2 were probably not sufficient to meet the demand for aerobic metabolism.Together, these responses suggested impairment of oxidative energy supply to meet thedemands for aerobic metabolism increasing metabolic stress during exercise as indicatedby the increased EMG activity in this position that would in turn advance the onset ofmuscle fatigue.
In HPOHOR in hypoxia, the∼7% non-significant increase in VC was sufficient to increaseMBF by ∼10% maintaining DO2est at the same level as normoxia (Figure 6.3A-F) and therewere no changes in EMG activity between normoxia and hypoxia in this position (Figure6.5A-E). The results of the present study are supported by the increase in VC and MBF tomaintain DO2 during hypoxia during one or two-legged knee extension submaximal exercisein semi-supine position (Gonzalez-Alonso et al., 2001, Roach et al., 1999, Koskolou et al.,1997, Rowell et al., 1986) or submaximal handgrip exercise (Wilkins et al., 2006). TheVC, MBF and DO2est post-exercise responses suggested that both MBF and DO2est wereadequate to match the aerobic metabolism requirements during exercise in this condition.
During HPOHUT in hypoxia, the slightly increase in VC and MBF responses were suffi-cient to maintain DO2est at the same level as normoxia (Figure 6.3A-F) and there were nosignificant changes in EMG activity between normoxic and hypoxic gas breathing condi-tions (Figure 6.5A-E). The lower VC response during exercise suggested that less vasodi-lation was needed to achieve the required MBF response as a consequence of the elevatedMPP (Nadland et al., 2009) probably due to the lower accumulation of muscle metabolitesproduced during this exercise condition. The VC, MBF and DO2est post-exercise responsesalso provided additional evidences that both MBF and DO2 were probably sufficient tomeet the demand for aerobic metabolism during HPOHUT.
The mechanisms accounting for the match between MBF to DO2 to the metabolic de-mand during exercise with constant work rate was accomplished through the increase in VCdue to vasodilatory mechanisms in response to the reduction in SaO2 caused by the hypoxia.The hypoxic conditions reduced SaO2, but also may result in decrease in CaO2 and PaO2 af-fecting O2 availability with consequent decrease in the cellular PO2 stimulating vasodilatoryresponse (Calbet, 2000). The reduced O2 is probably sensed by the red blood cells stimulat-ing the release of ATP from the erythrocytes mediating vasodilatory responses (Ellsworthet al., 1995) via nitric oxide (NO) and/or endothelium-derived-hyperpolarization-factor(EDHF) and/or release of NO from S-nitrosohemoglobin due to hemoglobin deoxygena-tion relaxing the vascular smooth muscle (Calbet, 2000, Stamler et al., 1997, Jia et al.,1996). The accumulation of adenosine in hypoxia could activate the adenosine-sensitiveK+ channels enhancing the release of K+ from the active muscle fiber and elevating the in-terstitial K+ concentrations (Allen et al., 2008). The adenosine monophosphate-activated
118

protein kinase (AMPK) is probably activated in hypoxic conditions stimulating the releaseof NO and PG relaxing the vascular smooth muscle (Fisslthaler and Fleming, 2009, Towlerand Hardie, 2007). Other vasoactive factors released during hypoxic exercise, such as CO2,H+, lactate probably also contribute to mediate the vasodilatory response to increase VC(Calbet, 2000).
6.5.2 VC, MBF and DO2 responses during exercise: comparisonsbetween body positions under normoxia and hypoxia
6.5.2.1 Lower power output exercise
During LPOHDT in normoxia, the higher VC response compensated for the reduction inMPP increasing MBF sufficiently to maintain DO2est at the same level as LPOHUT, butboth were lower than LPOHOR with non-significant differences in EMG activity betweenbody positions. These results were confirmed by the relationship between MBF and anindex of the sum of electromyographic signals from the muscles (EMGindex) used to accountfor the differences in EMG activity as well as to confirm the adequacy of MBF and DO2est.MBF/EMGindex ratio was not different between LPOHUT and LPOHDT but both were lowerthan LPOHOR (Figure 6.6A, 6.6C). The greater recruitment of VC during LPOHDT reached∼75% VCpeak in normoxia reflecting the greater demand for vasodilation in this position.The current results are supported by the previous study during lower power output plantarflexion exercise in normoxia (Chapter 5).
During LPOHDT in hypoxia, the increase in VC caused further increase in MBF tomaintain DO2est in face of reduced MPP and SaO2. The MBF response in LPOHDT duringhypoxia was higher than LPOHUT due to the ∼26% increase in EMG activity. How-ever, MBF in hypoxia was lower during LPOHDT compared to LPOHOR despite the ∼24%increase in EMG activity. When the relationship between MBF and EMGindex were con-sidered in hypoxia, this ratio did not differ between LPOHUT and LPOHDT but both werelower than LPOHOR (Figure 6.6A, 6.6C). The greater recruitment of VC during LPOHDT
compensated for the reduction in MPP and SaO2 inducing compensatory changes in MBFthat maintained DO2est at the same level as LPOHUT, but not high enough to match MBF inLPOHOR. The greater recruitment of VC during hypoxia in LPOHDT reached ∼85%VCpeak
reflecting the greater demand for vasodilation caused probably by the greater accumulationof muscle metabolites produced during this exercise condition inducing vasodilation of theresistance arterioles (Chapter 5) as the muscle pump does not contribute to the change inMBF in this position (Saunders and Tschakovsky, 2004, Tschakovsky et al., 1996). Thepost-exercise recovery in hypoxia demonstrated higher VC values in LPOHDT after cessation
119

of exercise indicating enhanced vasodilation which is consistent with greater accumulationof muscle metabolites during exercise in this position. As a consequence of the augmentedVC both MBF and DO2est responses were higher during recovery suggesting inadequateMBF and DO2est during exercise to meet the demands for the aerobic metabolism.
During LPOHUT in normoxia and hypoxia, VC was blunted reaching only ∼15-20%VCpeak reflecting the lower demand for vasodilation with elevated MPP due to probablylower accumulation of muscle metabolites during exercise in this position and more effectivecontribution of the muscle pump to the increase in MBF (Nadland et al., 2009, Laughlinand Joyner, 2003, Folkow et al., 1971). The constrained VC response in normoxia resultedin reduced MBF compared to LPOHOR. However, during hypoxia, the constrained VCresulted in decreased MBF and DO2est compared to both LPOHOR and LPOHDT. Despitethis, the post-exercise recovery suggested adequate flow and DO2est in this position. Theseresults are supported by the previous study during normoxic conditions (Chapter 5).
6.5.2.2 Higher power output exercise
During HPOHDT in normoxia and hypoxia, the increase in VC values compensated forthe reduction in MPP increasing MBF sufficiently to maintain DO2est at the same levelas HPOHUT, but lower than HPOHOR. In normoxia, despite ∼28% higher EMG activ-ity and ∼62% greater VC response during HPOHDT compared to HPOHUT, MBF andDO2est responses were not different between these body positions. Although in hypoxia,EMG activity was ∼60% higher and VC was ∼65% higher in HPOHDT in comparison withHPOHUT, there were no differences in MBF and DO2est between these body positions.However, the ∼12% higher EMG activity and ∼53% greater VC response in HPOHDT
compared to HPOHOR in normoxia and the ∼36% higher EMG activity and ∼53% greaterVC response in HPOHDT compared to HPOHOR in hypoxia were not sufficient to maintainMBF and DO2est at the same level as in horizontal. However, the relationship betweenMBF and EMG activity (MBF/EMGindex) in both normoxia and hypoxia demonstratedthat this ratio was lower in HPOHDT with no differences between HPOHOR and HPOHUT.
The lower MBF/EMGindex indicated that the increase in MBF in HPOHDT was re-stricted despite the greater VC response indicating that VC could not fully compensatefor the reduction in MPP alone or the combined effects of reduced MPP and SaO2. Thegreater recruitment of VC reached ∼90%VCpeak with only 2-3min of normoxic exercise and∼100%VCpeak in hypoxia indicating that the maximal vasodilatory capacity was achieved,thus, the ability to compensate was exceeded. This functional limitation on the VC re-sponse did not allow further increases in MBF limiting DO2est in this position. The resultsof the present study are in line with the previous study that demonstrated limitation in
120

the recruitment of VC restricting MBF during plantar flexion exercise in normoxia in faceof reduced MPP (Chapter 5), reduced brachial blood flow with the arm above heart leveldespite the increase in VC in normoxia (Walker et al., 2007) and VC limiting the increasein leg blood flow in hypoxia during one-legged exercise (Gleser, 1973).
The VC, MBF and DO2est post-exercise responses also supported the inadequacy ofMBF and DO2est during exercise in HPOHDT. The higher post-exercise VC indicated thatgreater amount of vasodilator muscle metabolites still present after cessation of exerciseprobably as a consequence of the greater accumulation of those metabolites during exercisein HPOHDT inducing vasodilation of the resistance arterioles. This higher VC resultedin higher MBF and DO2est during recovery suggesting that both MBF and DO2est werenot adequate during the exercise phase in both normoxia and hypoxia. The greater MBFobserved during recovery probably represented the repayment of the O2 deficit accumulatedat the onset of exercise as consequence of the slow rate of adaptation and the highermetabolic demand during HPOHDT as suggested by the higher EMG activity which wasconsistent with challenged aerobic metabolism (Chapter 5).
In HPOHUT in normoxia and hypoxia, the lower VC (∼41% in normoxia and ∼43%in hypoxia) and EMG activity (∼12% in normoxia and ∼14% in hypoxia) compared toHPOHOR resulted in non-significant changes in MBF and DO2est responses, but there weretrends for higher responses to both normoxia and hypoxia during HPOHOR. However,the relationship between MBF and EMG activity (MBF/EMGindex) in both normoxia andhypoxia demonstrated that this ratio was not different between HPOHOR and HPOHUT.During HPOHUT, the VC response was blunted reaching only∼30% VCpeak in normoxia andhypoxia reflecting the lower demand for vasodilation with elevated MPP even with reducedSaO2. The blunted VC response in normoxia and hypoxia was probably caused by lessaccumulation of vasodilator metabolites in the resistance arterioles due to more effectivecontribution of the muscle pump to the increase in MBF (Nadland et al., 2009, Laughlinand Joyner, 2003, Folkow et al., 1971) (Figure 7.4). The increase in MBF was achieved bythe combined effects of vasodilation and the enhanced perfusion pressure gradient acrossthe working muscle resulting in an increase in virtual conductance (Nadland et al., 2009,Shoemaker and Hughson, 1999, Shoemaker et al., 1998, Tschakovsky et al., 1996) with lessextent of vasodilation (Nadland et al., 2009) as indicated by the use of only ∼30% VCpeak
in HPOHUT. The post-exercise recovery indicated that despite the constrained VC duringHPOHUT, MBF and DO2est were adequate and probably sufficient to maintain relativelylow accumulation of vasodilatory metabolites during the exercise phase. The lower MBFduring recovery probably represented a lower O2 deficit accumulated at the onset of exerciseas consequence of the faster rate of adaptation and the lower metabolic demand duringHPOHUT as suggested by the lower EMG activity (Chapter 5).
121

6.6 Conclusion
In conclusion, the hypoxic challenge added in exercise was met during LPOHDT by in-creased VC to compensate reduced MPP and O2 availability such that MBF maintainedDO2est. However, during HPOHDT in hypoxia, VC reached maximal vasodilatory capacity,compromising MBF and DO2est. Together, these findings indicate that LPOHDT in nor-moxia or hypoxia VC increased to maintain MBF and DO2est, but during HPO functionallimitation for recruitment of VC constrained MBF and DO2est in normoxia and hypoxia.Elevated muscle electromyograpic signals in HPOHDT were consistent with challenged aer-obic metabolism associated with reduced MPP and O2 availability that could contributeto a greater increase in the relative stress of the exercise challenge and advance the onsetof muscle fatigue.
122

Chapter 7
General Discussion, Conclusions andFuture Considerations
7.1 Summary of studies
Muscle blood flow (MBF) is determined by the interaction between perfusion pressuregradient and vascular conductance (VC) (Tschakovsky and Sheriff, 2004, Laughlin andKorzick, 2001, Hughson et al., 1996, Rowell, 1993). Based on this concept, the presentwork investigated the adaptations of VC, MBF and DO2 during rest and exercise. Thestudies in this thesis used the changes in body position as an experimental model to inducehydrostatic pressure changes and shifts in blood volume to alter perfusion pressure by theeffects of gravity. Overall, the findings from these studies provided insights about thecontrol mechanisms regulating VC and MBF and their consequences on DO2.
Reliable and reproducible quantitative measurements of muscle blood flow and arterialdiameter at rest and exercise were essential for the experiments involved in this thesis.Previous investigations have determined that non-invasive Doppler ultrasound method canbe used to obtain continuous and reliable measurements at rest, during the onset andsteady-state phase of exercise with small muscle mass (Shoemaker et al., 1996, Hughsonet al., 1996). In the Chapter 2, data repeatability for popliteal muscle blood flow velocity(MBV), popliteal arterial diameter (ADpop), MBF and VC at rest and exercise in differentbody positions and work rates were tested. All variables were repeatable regardless of bodyposition for all conditions proving that ultrasound methods are suitable to measure suchdynamic responses as supported by previous investigations (Walker et al., 2007, Amundsenet al., 2002, Radegran, 1997, Shoemaker et al., 1996).
123

The interactions between perfusion pressure gradient and VC determine resting MBF(Rowell, 1993). In the Chapter 3, the adaptations of the lower limb resting VC andMBF during HUT and HDT postural challenges were investigated. The novel findingof this study showed that, in HDT, the increase in VC completely compensated for thereduction in MPP in the lower leg such that resting MBF was maintained. This resultwas in contrast with Sheriff et al., 2007 who demonstrated a transient fall in femoralvascular conductance during 20s of 15°HDT, but was similar to that observed with thearm above heart level (Tschakovsky and Hughson, 2000). As anticipated during HUT, VCwas reduced in conditions under higher MPP consequently resting MBF was decreased.The results of the current study are in line with the decreased leg blood flow with elevatedarterial perfusion pressure during HUT or seated position (Groothuis et al., 2005, Deliset al., 2000) as well as with the forearm below heart level (Hughson et al., 1996).
The results of the previous study (Chapter 3) were analysed as average over a beat andthen averaged over the last two minutes of testing representing the net arterial responsein each body position. However, this procedure did not consider important informationrelated to MBV pattern and waveform characteristics (Thijssen et al., 2009). It was in-teresting to note that while the absolute MBF was not different between HDT and HOR,the patterns of MBV differed between these positions as well as in HUT. The Chapter 4examined the changes in MBVant and MBVret patterns in the three different body positions(HOR, HDT and HUT). The primary novel finding was that the same average MBVnet inthe popliteal artery was attained in the HOR and HDT positions even though absoluteMBVant and MBVret values were greater in HDT than HOR probably due to the increasein arterial compliance and VC that compensated for the lower MPP in HDT. In contrast,lower MBVnet in the popliteal artery was detected in the HUT than HOR with reductionsin both MBVant and MBVret in this position probably due to the lower arterial complianceand VC changing the ratio between MBVant and MBVret. The MBV patterns and wave-forms characteristics during HOR and HUT in this study were consistent with previousdescriptions of brachial (Baccelli et al., 1985), femoral (Blackshear et al., 1979, Risoe andWille, 1978), popliteal (Risoe and Wille, 1978) and posterior tibial arteries (Risoe andWille, 1978).
Exercising muscles are sensitive to changes in limb or body position due to the effects ofgravity (Egana and Green, 2005) determining the dynamic responses of blood flow followingthe onset and steady-state exercise (Nadland et al., 2009, Hughson et al., 1996). The matchbetween MBF to DO2 to metabolic demand are dependent on work rates, magnitude ofthe hydrostatic column changes and muscle mass engaged in the exercise (Nadland et al.,2009). Therefore, the exercise model with manipulation of the body position involving alarge hydrostatic column associated with different work rates involving a small muscle mass
124

was selected to challenge the adaptive response of VC and MBF during transitions fromrest to exercise. The main findings were that the maximal dilatory capacity of the vascularsystem of the calf muscles was achieved following intense, ischemic muscle contractionswith no differences between body positions indicating that VCpeak was independent ofMPP. Following the onset of exercise, MBF and VC responses were delayed in HDT andaccelerated in HUT in both lower and higher power outputs. These results are in agreementwith faster increases in brachial blood flow observed in the arm below compared to aboveheart level (Hughson et al., 1996) and femoral blood flow below compared to heart level(Egana and Green, 2005, MacDonald et al., 1998, Leyk et al., 1994). In LPOHDT, theincrease in VC was able to counteract the reduced MPP to maintain MBF. In contrastduring HPOHDT, the increase in VC response could not compensate for the reduction inMPP resulting in lower MBF due to a limitation of VC to promote further increases inMBF with consequences for the delivery of O2.
In the previous study (Chapter 5, MBF determined DO2 responses because arterial O2
content (CaO2) was not altered during exercise. To further challenge the adaptive responsesof VC, MBF and DO2 during exercise in different body positions, the manipulation of theFIO2 was added to investigate whether VC responses would lead to compensatory changesin MBF to maintain DO2est. The main findings were that within the same body position VCto the exercising muscle increased to compensate for the alterations in perfusion pressureand O2 availability such that MBF increased sufficiently to maintain DO2est. The greaterrecruitment of VC in HDT compensated for the reduction in MPP and SaO2 increasingMBF sufficiently to maintain DO2est at the same level as HUT. However, the analysis ofthe relationship between MBF and EMG activity (EMGindex) demonstrated that this ratiowas reduced during HPOHDT in both normoxia and hypoxia. The lower MBF/EMGindex
ratio indicated inadequate MBF limiting DO2est despite the greater VC response. DuringHPOHDT in hypoxia, the maximal vasodilatory capacity was reached indicating that theability to compensate was exceeded. This functional limitation in the recruitment of VCmight increase the metabolic stress in exercise as suggested by the higher EMG activity inthis condition. The higher VC, MBF and DO2est responses during post-exercise recoveryin HDT is also evidence that the MBF and DO2est were inadequate during exercise in thisposition.
125

7.2 Resting vascular conductance and resting muscle
blood flow responses following tilt
The central circulatory effects of changes in body position were relatively minor comparedto the local peripheral responses of the lower legs. In HDT, the sympathetic vasoconstrictortone in the leg arteries was probably reduced by arterial and cardiopulmonary baroreceptoractivity (Nagaya et al., 1995, Rowell, 1993). The transmural pressure and wall tensionwere decreased inducing relaxation of the resistance arteries in the legs through myogenicresponse (Sheriff et al., 2007, Tschakovsky and Hughson, 2000, Rowell, 1993). The gravity-assisted shift in venous blood volume probably inhibited the veno-arteriolar reflex (Sheriffet al., 2007, Tschakovsky and Hughson, 2000). The combination of these effects alteredvascular tone promoting vasodilation with consequent increase in VC that fully compensatefor the reduced MPP to maintain MBF and consequently constant DO2 (Figure 7.1).
Figure 7.1: Schematic illustration of the local peripheral mechanisms probably involvedin VC and MBF responses in HDT at rest. During HDT, VC increased to fully compen-sate for the reduction in MPP to maintain MBF at the same level as horizontal (controlcondition). The local peripheral (myogenic and venoarteriolar reflexes) and central car-diovascular reflexes (arterial and cardiopulmonary baroreceptors activity) mechanisms areinvolved in the VC response to promote vasodilation.
126

In HUT, the sympathetic vasoconstrictor response was augmented by the increase in thearterial and cardiopulmonary baroreceptors activity (Cui et al., 2003, Toska and Walloe,2002, Imadojemu et al., 2001). The elevated MPP with consequent increased transmuralpressure and wall tension probably induce myogenic vasoconstriction (Sheriff et al., 2007,Groothuis et al., 2005, Harms et al., 2003, Toska and Walloe, 2002, Imadojemu et al.,2001). The increase in venous pressure probably induced arteriolar vasoconstriction of thecorresponding arteriole through the veno-arteriolar reflex (Tschakovsky and Hughson, 2000,Henriksen and Sejrsen, 1977). The combination of these effects resulted in vasoconstrictionreducing VC and consequently resting MBF and DO2 (Figure 7.2).
Figure 7.2: Schematic illustration of the local peripheral mechanisms probably involved inVC and MBF responses in HUT at rest. During HUT, VC decreased in face of elevatedMPP resulting in a reduction in MBF. The local peripheral (myogenic and venoarteriolarreflexes) and central cardiovascular reflexes (arterial and cardiopulmonary baroreceptorsactivity) mechanisms are involved in the VC response to promote vasoconstriction.
The MBV patterns in the popliteal artery demonstrated marked differences betweenbody positions within a cardiac cycle. MBVant and MBVret waveforms and patterns are notonly dependent on the interactions between perfusion pressure and local vascular resistanceor conductance (Baccelli et al., 1985), but also on downstream compliance (Zamir et al.,2007). In HDT, the greater increase in both MBVant and MBVret was probably due to theincrease in arterial compliance and VC that compensated for the lower MPP to maintain
127

MBVnet at the same level as HOR position. In HUT, the lower MBVnet in the poplitealartery and the reductions of MBVant and MBVret was probably due to the lower arterialcompliance and VC changing the ratio between MBVant and MBVret.
In HDT, the lower MPP decreased distending and transmural pressures would reducestretching of the arterioles probably leading to an increase in arterial compliance (Zamiret al., 2007, Grassi et al., 1995) due to the relaxation of the vascular smooth muscle in-ducing vasodilation (Zamir et al., 2007). During HDT, the effects of induced vasodilationvia local peripheral reflexes and central cardiovascular mechanisms increase both arterialcompliance and VC resulting in higher MBVant and MBVret that maintained MBVnet atthe same level as horizontal. Likewise, in HUT, the elevated MPP increasing distendingand transmural pressures would enhance the stretching of the arterioles resulting in lowerarterial compliance (Zamir et al., 2007). The combined effects of induced vasoconstric-tion through local peripheral reflexes and central cardiovascular mechanisms decrease botharterial compliance and VC resulting in lower MBVant and MBVret consequently lowerMBVnet than HOR and HDT positions.
7.3 Vascular conductance and muscle blood flow adap-
tive responses in exercise
7.3.1 7.2.1 At the onset of exercise
VC and MBF demonstrated a biphasic response as previously reported by others (Nadlandet al., 2009, Walker et al., 2007, Saunders and Tschakovsky, 2004, Hughson et al., 1996).The rapid increase in VC allowed the increases in MBF at the onset of exercise as a con-sequence of vasodilation and muscle pump effect. The increased VC suggested a reductionin downstream resistance to permit the increase in MBF through smaller resistance vessels(Shoemaker et al., 1996). This vasodilatory response associated with muscle pump actioneffectively enhanced the perfusion pressure gradient across the working muscle resultingin an increase in virtual conductance (Nadland et al., 2009, Shoemaker and Hughson,1999, Shoemaker et al., 1998, Tschakovsky et al., 1996). At the onset of exercise in HDT,both VC and MBF adaptive responses were delayed but in HUT such adaptive responseswere accelerated in both lower and higher power output exercises. It is important to notethat the amplitude of the increase in VC was inversely dependent upon baseline perfusionpressure and vessel tone supported by Shoemaker et al., 1996.
The VC response at the onset of exercise in HDT was dependent almost or exclusively
128

on vasodilation because muscle pump could not contribute to the increase in VC due tothe minimized emptying effect of the veins during muscle contractions and the lack of ahydrostatic column in this position (Saunders and Tschakovsky, 2004, Tschakovsky et al.,1996). A greater local accumulation of vasodilator metabolites probably occurred takinglonger time to achieve the required vasodilation as indicated by the slower rate of increaseof VC to reach steady-state (Figure 7.3).
Figure 7.3: Schematic illustration of the VC and MBF responses in HDT during exercise.In HDT, VC and MBF responses at the onset of exercise were delayed due to the lack ofcontribution of the muscle pump and the greater vasodilation required in this position dueto the greater accumulation of vasodilator metabolites.
In HUT, the faster VC response at the onset of exercise reflected the combined effectsof vasodilation and muscle pump action. In this position, the more effective muscle pumpcontributed to the increase in MBF (Nadland et al., 2009, Laughlin and Joyner, 2003,Folkow et al., 1971) by the enhanced perfusion pressure gradient across the working mus-cle with less extent of vasodilation (Nadland et al., 2009) increasing virtual conductance(Nadland et al., 2009, Shoemaker and Hughson, 1999, Shoemaker et al., 1998, Tschakovskyet al., 1996). Lower VC values in HUT suggested that less accumulation of vasodilatormetabolites were required to achieve the desired increase in VC resulting in shorter timeto reach steady-state (Figure 7.4).
129

Figure 7.4: Schematic illustration of the VC and MBF responses in HUT during exercise.In HUT, VC and MBF responses at the onset of exercise were accelerated due to thecombined effects of more efficient muscle pump and less requirement of vasodilation dueto lower accumulation of vasodilator metabolites.
7.3.2 Exercise
The majority of the effects of increased MPP probably occurred in the first phase of bloodflow adaptation described previously, thus, during the second phase of exercise the addi-tional increase in MBF was the result of further increases in VC. VC and MBF responseswere different between body positions and work rates as a consequence of altered MPPalone or with the combination between altered MPP and FIO2. During LPOHDT, the higherVC response reached ∼80% VCpeak in normoxia and 85%VCpeak in hypoxia reflecting agreater demand for vasodilation. The recruitment of greater VC in normoxia and hypoxiafully compensated for the reduced MPP during LPOHDT to maintain MBF and thereforeDO2. During HPOHDT in normoxia, VC increased even further than during LPOHDT, butMBF was reduced compared with HPOHOR and HPOHUT indicating that the increase inVC could not counteract the reduction in MPP. The recruitment of VC during HPOHDT
reached ∼92% VCpeak in normoxia indicating that the maximal vasodilatory capacity wasalmost reached. During HPOHDT in hypoxia, the combined effects of reduced MPP andFIO2 were counteracted by the greater recruitment of VC to maintain MBF and DO2est.However, the analysis of the relationship between MBF and EMG activity (EMGindex)demonstrated that MBF was reduced during HPOHDT in hypoxia restricting the increasein MBF limiting DO2est despite the greater VC response indicating that the ability to
130

compensate was exceeded as indicated by the achievement of the maximal vasodilatorycapacity (∼100%VCpeak).
The increase in VC during LPOHDT and HPOHDT in normoxia and hypoxia was proba-bly due to the greater accumulation of metabolites promoting vasodilation of the resistancearterioles as the muscle pump does not contribute to the change in MBF in this position(Saunders and Tschakovsky, 2004, Tschakovsky et al., 1996) (Figure 7.3). The lower MBFin both gas breathing conditions indicated that DO2 was insufficient to meet the demandsfor aerobic metabolism increasing the metabolic stress of exercise as suggested by the higherEMG activity during HPOHDT in both normoxia and hypoxia.
The higher post-exercise VC in HDT indicated that higher concentration of vasodilatormetabolites still present after cessation of exercise resulting in higher MBF suggestinginadequacy of flow and DO2 in the exercise phase during normoxia and hypoxia. Thegreater MBF observed during recovery probably represented the repayment of the O2
deficit accumulated at the onset of exercise as consequence of the slow rate of adaptationand the higher metabolic demand during HPOHDT as suggested by the higher EMG activitywhich was consistent with challenged aerobic metabolism. The higher post-exercise VC inHDT also indicated that local peripheral reflexes are operating to maintain the vasodilationrequirements after the cessation of exercise.
The slower adaptation of MBF during conditions with reduced MPP indicated inade-quacy of flow limiting O2 availability following the onset of exercise. As a consequence theadaptation of oxidative metabolism would be slow resulting in greater O2 deficit requiringa greater breakdown of phosphocreatine (PCr) increasing intracellular inorganic phosphateconcentrations (Pi) and also accumulation of metabolic by products such as ADP, H+ andlactate. This would in turn indicate a relative increased metabolic stress of the exerciseand advance the onset of muscle fatigue.
During LPOHUT, the VC response was blunted reaching only ∼20% VCpeak in nor-moxia and hypoxia, while in HPOHUT VC response reached ∼30%VCpeak in normoxia andhypoxia, reflecting the lower demand for vasodilation with elevated MPP even with re-duced SaO2. The blunted VC response in normoxia and hypoxia was probably causedby less accumulation of vasodilator metabolites in the resistance arterioles due to moreeffective contribution of the muscle pump to the increase in MBF (Nadland et al., 2009,Laughlin and Joyner, 2003, Folkow et al., 1971) (Figure 7.4). The increase in MBF wasachieved by vasodilation and the enhanced perfusion pressure gradient across the workingmuscle resulting in an increase in virtual conductance (Nadland et al., 2009, Shoemakerand Hughson, 1999, Shoemaker et al., 1998, Tschakovsky et al., 1996).
During LPOHUT in normoxia and hypoxia, VC was constrained reducing MBF, but the
131

post-exercise recovery suggested that both MBF and DO2 were adequate. During HPOHUT
in normoxia and hypoxia, the post-exercise recovery suggested that both MBF and DO2
were adequate and probably sufficient to maintain relatively low local concentrations ofvasodilatory metabolites. The lower VC values in HUT during the post-exercise recoveryalso indicated that local peripheral reflexes are operating again after the cessation of ex-ercise. In HUT, with elevated MPP, the accelerated adaptation of VC and MBF wouldincrease O2 availability following the onset of exercise resulting in faster adaptation ofMBF and oxidative metabolism with consequent lower O2 deficit and less accumulation ofthe metabolic by products during exercise in this body position.
7.3.3 Hypoxic Exercise
During hypoxic exercise in all body positions, the changes in VC caused proportionalchanges in MBF sufficient to maintain DO2 at the same level as normoxia for both lowerand higher power outputs. The mechanisms accounting for the match between MBF toDO2 to the metabolic demand during exercise with constant work rate was accomplishedthrough the increase in VC due to vasodilatory mechanisms in response to the reductionin SaO2 caused by hypoxia.
The reduction of FIO2 involved decrease in SaO2 and probably CaO2 and PaO2 affectingO2 availability decreasing cellular PO2 stimulating vasodilatory responses (Calbet, 2000).The reduced O2 is probably sensed by the red blood cells stimulating the release of ATPfrom the erythrocytes mediating vasodilatory responses (Ellsworth et al., 1995) via nitricoxide (NO) and/or endothelium-derived-hyperpolarization-factor (EDHF) and/or releaseof NO from S-nitrosohemoglobin due to hemoglobin deoxygenation relaxing the vascularsmooth muscle (Calbet, 2000, Stamler et al., 1997, Jia et al., 1996).
The accumulation of adenosine in hypoxia could activate the adenosine-sensitive K+
channels enhancing the release of K+ from the active muscle fiber and elevating the in-terstitial K+ concentrations (Allen et al., 2008). The adenosine monophosphate-activatedprotein kinase (AMPK) is probably activated in hypoxic conditions stimulating the releaseof NO and PG relaxing the vascular smooth muscle (Fisslthaler and Fleming, 2009, Towlerand Hardie, 2007). Other vasoactive factors released during hypoxic exercise, such asCO2, H
+, lactate probably also contribute to mediate the vasodilatory response to increaseVC (Calbet, 2000) (Figure 7.5). The compensatory adjustments in VC and MBF duringhypoxia probably minimized the risk of mismatch between DO2 and metabolic demandduring exercise (Calbet et al., 2009, Calbet, 2000).
132

Figure 7.5: Schematic illustration of the mechanisms probably involved in VC and MBFresponses in HDT and HUT during exercise in normoxia and hypoxia.
133

7.4 Conclusion
In conclusion, this thesis provided evidence that at rest in HDT, the increase in VC fullycompensated for the reduction of MPP to maintain MBF. However, during HUT, thedecrease in VC reduced resting MBF. The mechanisms accounting for these responsesinvolved local peripheral and central cardiovascular reflexes. Following the onset of lowerand higher power output exercises, MBF and VC responses were delayed during HDTbut accelerated during HUT. In the steady-state during LPOHDT, the adaptations in VCcompletely compensated for the reduction in MPP maintaining MBF to the exercisingmuscles. However, during HPOHDT, the ability to recruit increases in VC was limited,compromising MBF. In HUT, during lower and higher power output exercises, VC wasblunted but sufficiently high to maintain MBF. In LPOHDT, the combined effects of reducedMPP and hypoxia were counteracted by the increase in VC to sufficiently increase MBF tomaintain DO2est. However, in HPOHDT in hypoxia, VC was not able to fully compensatefor the reduction of MPP and SaO2 due to a functional limitation in the recruitmentof VC (reached maximal vasodilatory capacity) resulting in restricted MBF and DO2est.During lower and higher power output exercise in HUT under hypoxia, VC was bluntedbut sufficient great to increase MBF to maintain the DO2est. Together, these findingsindicated that during LPOHDT in normoxia or hypoxia VC increased to maintain MBFand DO2est, but during HPOHDT, a functional limitation for recruitment of VC constrainedMBF and DO2est in normoxia and hypoxia as demonstrated by the relationship betweenMBF/EMGindex. The elevated VC, MBF and DO2est post-exercise responses in HDT alsosupport the inadequacy of MBF and DO2 during the exercise phase. Elevated muscleelectromyograpic signals in normoxia and hypoxia during HPOHDT were consistent withchallenged aerobic metabolism indicating relative increased metabolic stress of the exercisethat would advance the onset of muscle fatigue.
134

7.5 Future Directions
The studies in this thesis were designed to investigate the adaptations of VC and MBF andtheir consequences for DO2 under conditions with altered MPP alone at rest and exerciseor associated with FIO2 during exercise through non-invasive measurements. Following aresome considerations for future studies.
The results of Chapter 3 demonstrated that VC increased to fully compensate thereduction in MPP (HDT) to maintain MBF, but with elevated MPP, VC response wasreduced as well as MBF. The HOR and HDT positions used as an experimental model inthis thesis could be combined with lower body negative pressure (LBNP). LBNP wouldincrease arterial-venous pressure gradient affecting resting VC and MBF responses. Thecomparison between HOR and HDT positions with and without LBNP will provide addi-tional details about the regulation of resting VC and MBF under altered perfusion pressuregradient. Furthermore, LBNP could be applied with the same exercise experimental de-sign of this thesis to investigate the adaptations of VC, MBF and DO2 at the onset andsteady-state exercise. LBNP would increase perfusion pressure gradient during exercise indifferent body positions affecting the changes in VC, MBF and DO2 responses. This ap-proach would provide additional information about the adaptive responses and regulationof VC, MBF and DO2 at the onset and steady-state exercise.
Beat-by-beat analysis on HR, BP, MBF, local and total vascular resistances typicallypresent oscillatory patterns in distinct frequencies (Ichinose et al., 2004, O’Leary, Shoe-maker, Edwards, and Hughson, 2004). The cardiovascular fluctuations may result fromneural autonomic modulatory activity over the heart and blood vessels or from autoregula-tory responses arising from different regions in the arterial and arteriolar trees (Ichinose etal., 2004, O’Leary et al., 2004, Akselrod et al., 1985). The transfer function analysis couldbe used in the present data to explore the dynamic interactions between blood pressure andvascular resistance and static and dynamic cardiac baroreflex responses to changes in bodyposition. This would provide more information about systemic and regional circulatoryadjustments to postural challenges.
This thesis was not designed to deal with the relationship between MBF and at theonset and steady-state exercise. Previous investigation reported that VO2mus at the onsetof forearm exercise was dependent on the MBF dynamic response (Hughson et al., 1996).Positioning of the arm above heart level (Hughson et al., 1996), alterations in O2 concentra-tion in the gas breathing by hypoxia (MacDonald et al., 1998) slowed the rate of MBF andadaptation. In contrast, with the arm below heart level (Hughson et al., 1996), MBF andkinetics were accelerated at the onset of exercise. Further investigations applying the same
135

experimental models performed in this thesis during exercise combined with simultaneousmeasurements of VO2mus are necessary to determine the relationship between changes inVC, MBF and dynamic responses at the onset and steady-state exercise providing moreinformation about DO2 and O2 utilization. Such challenge could be accomplished by di-rect measurements of blood samples and pressure via transducers. These techniques allowmeasurements of PO2, , hematocrit, plasma concentration of lactate, SaO2, CaO2, venousO2 content (CvO2), arterio-venous O2 content difference (a-vO2diff) as well as estimationof O2 extraction, DO2 and calculation of VO2mus.
Also, near infrared spectroscopy (NIRS), a non-invasive technique, can be used tomeasure muscle oxygenation during exercise. However, MacDonald, Tarnopolsky, Green,and Hughson, 1999 reported that NIRS did not provide the same information as femoralvenous blood samples at the onset of exercise. Therefore, the validity and reproducibilityof NIRS measurements of muscle oxygenation at the onset of small muscle mass need to bedetermined prior its application. Alternatively, nuclear magnetic resonance spectroscopy(NMRS) is also non-invasive technique that has been used to measure PCr, Pi, ADP, ATP,pH responses during exercise. Previous investigations using NMRS had shown similar timecourse of change in intramuscular metabolism during dynamic calf exercise and duringcycling exercise (Barstow, Buchthal, Zanconato, and Cooper, 1994). Together, the exercisemodels present in this thesis associated with the techniques previously mentioned wouldpermit determination of the relationship between the adaptive responses of VC, MBF andVO2mus to different work rates, the control mechanisms regulating such responses and theirimpact on muscle metabolism.
136

APPENDICES
137

Appendix A
Repeatability of the muscle bloodflow response at rest and exerciseduring body tilt using Dopplerultrasound
138

A.1 Resting
Table A.1: MBV, ADpop, MBF and VC during baseline, HDT, HOR, and HUT with respectto coefficient of variation during the rest protocol.
Variables days Baseline HDT HOR HUT
1 2.71± 0.20 2.36± 0.18 2.64± 0.21 1.56± 0.09MBV (cm.s-1) 2 2.79± 0.25 2.45± 0.17 2.66± 0.22 1.54± 0.13
CV (%) 9.46± 1.53 6.62± 1.06 7.48± 1.39 9.65± 1.41
1 0.64± 0.06 0.64± 0.06 0.64± 0.06 0.64± 0.06ADpop (cm) 2 0.64± 0.06 0.64± 0.06 0.64± 0.06 0.64± 0.06CV (%) 1.07± 0.24 1.07± 0.24 1.09± 0.24 1.13± 0.23
1 52.11± 3.98 45.78± 3.71 51.92± 4.52 29.93± 1.55MBF (mL.min-1) 2 52.52± 5.33 46.90± 3.20 51.18± 4.65 30.06± 2.95
CV (%) 8.01± 1.40 6.02± 0.92 7.32± 1.31 10.11± 1.53
1 0.60± 0.05 1.01± 0.10 0.54± 0.03 0.21± 0.01VC (mL.min-1.min-1) 2 0.59± 0.06 0.99± 0.07 0.56± 0.05 0.21± 0.02
CV (%) 7.60± 1.39 6.12± 1.15 6.59± 1.19 10.41± 1.74
Values are mean ± SD of 15 participants in two days of testing. Muscle blood flow velocity(MBV), popliteal arterial diameter (ADpop), muscle blood flow (MBF), vascular conduc-tance (VC), horizontal (HOR), head-down tilt (HDT), head-up tilt (HUT) and coefficientof variation (CV).
139

Figure A.1: The mean muscle blood flow velocity (MBV) responses to changes in bodyposition across four different trials for HDT (A), HOR (B) and HUT (C), two days oftesting for HDT (D), HOR (E) and HUT (F), and Bland-Altman Plots during HDT (G),HOR (H), and HUT (I) comparing two days of testing at rest. Lines indicate groupresponse (mean ± SE, n =15). Dashed vertical line indicates transition from baseline toHDT and baseline to HUT. Solid horizontal lines show mean values and dashed horizontallines represent 95% confidence limits.
140

Figure A.2: The mean muscle blood flow (MBF) responses to changes in body positionacross four different trials for HDT (A), HOR (B) and HUT (C), two days of testing forHDT (D), HOR (E) and HUT (F), and Bland-Altman Plots during HDT (G), HOR (H),and HUT (I) comparing two days of testing at rest. Lines indicate group response (mean± SE, n =15). Dashed vertical line indicates transition from baseline to HDT and baselineto HUT. Solid horizontal lines show mean values and dashed horizontal lines represent 95%confidence limits.
141

Figure A.3: The mean vascular conductance (VC) responses to changes in body positionacross four different trials for HDT (A), HOR (B) and HUT (C), two days of testing forHDT (D), HOR (E) and HUT (F), and Bland-Altman Plots during HDT (G), HOR (H),and HUT (I) comparing two days of testing at rest. Lines indicate group response (mean± SE, n =15). Dashed vertical line indicates transition from baseline to HDT and baselineto HUT. Solid horizontal lines show mean values and dashed horizontal lines represent 95%confidence limits.
142

The Bland-Altman analyses showed that the 95% limits of agreement between the twodays of testing ranged from -0.060 to 0.062 for HDT, -0.045to 0.047 for HOR and -0.047to 0.043 for HUT. These results indicated no deviation of the mean value from 0, andrelatively small variability about the mean.
Figure A.4: Bland-Altman Plots for popliteal artery diameter (ADpop) during HDT (A),HOR (B), and HUT (C) comparing two day of testing at rest. Solid horizontal lines showmean values and dashed horizontal lines represent 95% confidence limits.
143

A.2 Transition from rest to exercise (EX)
Figure A.5: The mean muscle blood flow velocity (MBV) responses to dynamic plantarflexion exercise across two days of testing during LPOHDT (A), LPOHOR (B) and LPOHUT
(C). Lines indicate group response and symbols indicate the points at which repeatabilitywere performed. Dashed vertical lines indicate the start and cessation of exercise. Dataare the mean ± SE analysed over 6 seconds time bins including contraction and relaxationphases of the duty cycles. Bland-Altman plots during LPOHDT (D), LPOHOR (E), andLPOHUT (F) over the last 2min of exercise. Solid horizontal lines show mean values anddashed horizontal lines represent 95% confidence limits.
144

Figure A.6: The mean muscle blood flow velocity (MBV) responses to dynamic plantarflexion exercise across two days of testing during HPOHDT (A), HPOHOR (B) and HPOHUT
(C). Lines indicate group response and symbols indicate the points at which repeatabilitywere performed. Dashed vertical lines indicate the start and cessation of exercise. Dataare the mean ± SE analysed over 6 seconds time bins including contraction and relaxationphases of the duty cycles. Bland-Altman plots during HPOHDT (D), HPOHOR (E), andHPOHUT (F) over the last 2min of exercise. Solid horizontal lines show mean values anddashed horizontal lines represent 95% confidence limits.
145

Table A.2: CV for MBV during lower power output exercise in (LPOHDT), (LPOHOR)and (LPOHUT) and higher power output exercise in (HPOHDT), (HPOHOR) and (HPOHUT)conditions during transitions from rest to exercise.
days 1min 2min 3min 4min 5min
Day1 5.3± 0.6 7.0± 0.9 7.1± 0.9 8.0± 1.1 8.2± 0.9LPOHDT (n=8) Day2 5.3± 0.7 7.4± 0.9 8.4± 1.1 8.0± 1.0 8.2± 1.0
CV (%) 6.0± 1.3 7.2± 1.8 7.1± 2.7 8.5± 0.9 3.1± 0.8
Day1 7.6± 0.6 9.1± 0.8 8.8± 0.9 8.6± 0.9 8.8± 0.8LPOHOR (n=11) Day2 8.4± 0.6 10.1± 0.8 10.0± 0.9 9.4± 0.7 9.5± 0.7
CV (%) 7.2± 1.7 7.7± 1.5 9.4± 1.8 8.5± 1.5 6.9± 1.5
Day1 6.8± 0.7 7.0± 0.9 6.6± 0.9 6.7± 1.0 5.8± 0.7LPOHUT (n=9) Day2 5.3± 0.6 5.6± 0.8 5.7± 0.9 5.4± 0.7 5.6± 0.8
CV (%) 11.3± 2.0 11.9± 1.4 9.3± 1.7 8.3± 1.4 5.9± 1.1
Day1 5.7± 0.6 7.6± 0.9 8.1± 0.9 8.5± 0.9 9.5± 1.0HPOHDT (n=11) Day2 5.9± 0.7 7.9± 0.9 8.4± 0.8 8.8± 0.9 9.3± 0.8
CV (%) 7.8± 1.6 7.1± 1.3 5.2± 1.4 6.4± 1.8 6.8± 1.2
Day1 9.9± 0.8 12.6± 1.2 13.0± 1.1 12.8± 1.1 13.2± 1.0HPOHOR (n=10) Day2 9.5± 0.9 11.2± 1.1 11.6± 1.2 12.2± 1.4 12.2± 1.4
CV (%) 4.6± 0.9 5.4± 0.8 7.4± 0.8 6.8± 1.2 8.5± 1.5
Day1 11.3± 0.8 12.5± 1.0 12.2± 1.0 12.2± 1.1 11.0± 0.8HPOHUT (n=10) Day2 11.2± 1.0 12.0± 1.1 11.9± 1.1 11.7± 1.0 11.5± 1.0
CV (%) 8.8± 2.1 9.3± 2.4 8.8± 2.3 8.7± 2.1 7.7± 1.7
Values are mean ± SE of two days of testing and mean coefficient of variation (CV). Muscleblood flow velocity (MBV), lower power output exercise in head-down tilt (LPOHDT), lowerpower output exercise in horizontal (LPOHOR), lower power output exercise in head-uptilt (LPOHUT), higher power output exercise in head-down tilt (HPOHDT), higher poweroutput exercise in horizontal (HPOHOR) and higher power output exercise in head-up tilt(HPOHUT).
146

A.3 Exercise experiments under altered O2 inspired
fraction (hypoxia)
Figure A.7: The mean muscle blood velocity (MBV) responses to dynamic plantar flexionexercise across two days of testing during LPOHDT (A), LPOHOR (B) and LPOHUT (C)under altered FIO2 (hypoxia). Lines indicate group response and symbols indicate thepoints at which Bland-Altman plots were performed. Lines indicate group response andsymbols indicate the points at which repeatability were performed. Dashed vertical linesindicate the start and cessation of exercise. Data are the mean ± SE analysed over 6seconds time bins including contraction and relaxation phases of the duty cycles. Bland-Altman plots during LPOHDT (D), LPOHOR (E), and LPOHUT (F) over the last 2min ofexercise. Solid horizontal lines show mean values and dashed horizontal lines represent95% confidence limits.
147

Figure A.8: The mean muscle blood velocity (MBV) responses to dynamic plantar flexionexercise across two days of testing during HPOHDT (A), HPOHOR (B) and HPOHUT (C)under altered FIO2 (hypoxia). Lines indicate group response and symbols indicate thepoints at which Bland-Altman plots were performed. Lines indicate group response andsymbols indicate the points at which repeatability were performed. Dashed vertical linesindicate the start and cessation of exercise. Data are the mean ± SE analysed over 6seconds time bins including contraction and relaxation phases of the duty cycles. Bland-Altman plots during HPOHDT (D), HPOHOR (E), and HPOHUT (F) over the last 2min ofexercise. Solid horizontal lines show mean values and dashed horizontal lines represent95% confidence limits.
148

Table A.3: CV for MBV during lower power output exercise in (LPOHDT), (LPOHOR)and (LPOHUT) and higher power output exercise in (HPOHDT), (HPOHOR) and (HPOHUT)conditions during hypoxic exercise.
days 4min 5min 6min 7min
Day1 6.8± 0.7 7.1± 0.8 7.0± 0.7 7.5± 0.0LPOHDT (n=8) Day2 6.6± 0.7 6.7± 0.8 6.9± 0.8 7.3± 0.9
CV (%) 6.5± 2.0 7.8± 2.2 5.5± 1.9 7.3± 2.8
Day1 9.7± 1.0 10.0± 1.0 10.1± 0.9 9.7± 0.9LPOHOR (n=11) Day2 8.9± 0.8 9.3± 0.8 9.5± 1.1 9.0± 1.0
CV (%) 12.4± 2.1 11.1± 2.1 8.6± 2.1 7.3± 2.8
Day1 6.6± 1.1 6.8± 1.0 6.7± 1.1 6.1± 0.9LPOHUT (n=9) Day2 4.8± 0.7 4.8± 0.7 5.1± 0.7 5.1± 0.7
CV (%) 17.6± 2.0 16.4± 1.4 15.3± 2.3 12.3± 1.7
Day1 9.2± 0.9 9.8± 1.0 10.2± 1.1 10.3± 1.1HPOHDT (n=11) Day2 9.1± 1.0 10.2± 1.1 10.4± 1.2 10.0± 1.0
CV (%) 5.8± 1.5 3.4± 0.7 4.1± 0.9 5.5± 1.5
Day1 12.4± 1.3 12.7± 1.4 12.6± 1.4 13.2± 1.6HPOHOR (n=10) Day2 11.3± 0.8 11.6± 0.9 12.2± 1.0 11.9± 0.9
CV (%) 6.8± 1.0 7.4± 1.2 6.5± 1.2 8.4± 1.1
Day1 10.5± 1.1 10.9± 1.2 10.7± 1.2 10.6± 1.2HPOHUT (n=10) Day2 9.9± 1.1 10.1± 1.1 10.4± 1.3 11.0± 1.3
CV (%) 8.6± 1.4 7.3± 1.3 8.0± 1.8 7.6± 1.9
Values are mean ± SE of two days of testing and mean coefficient of variation (CV). Muscleblood flow velocity (MBV), lower power output exercise in head-down tilt (LPOHDT), lowerpower output exercise in horizontal (LPOHOR), lower power output exercise in head-uptilt (LPOHUT), higher power output exercise in head-down tilt (HPOHDT), higher poweroutput exercise in horizontal (HPOHOR) and higher power output exercise in head-up tilt(HPOHUT).
149

Appendix B
Equipment Design
150

B.1 Introduction
The equipment used in the current thesis was specifically designed and built to study theeffect of altered arterial blood perfusion pressure on vascular conductance (VC) and muscleblood flow (MBF) at rest and exercise by placing the heart above or below the level of themuscle.
B.1.1 Tilt table and resting protocol
This custom built tilt table device placed participants horizontally in a prone (face down)position and permitted changes in body position to different angles during resting condi-tions while studying the VC and MBF responses of the popliteal artery. The participantsrested on the table supported by a cushion and memory foam. A massage table head piecewas connected to the table for the participants to place their faces permitting unobstructedvision and breathing. Adjustable shoulder blocks were placed at the top of the table. Anarm resting apparatus was placed on each side of the table with shoulders and elbows inapproximately 90°. An adjustable strap system was connected to the table and to twobelts by metal clips. These adjustable belts were placed on the participants chest andhips to restrict sliding, minimize muscle activity, and provide comfort and security to theparticipants. A total of ten straps were used, with six straps connected to the metal clipsin the chest belt and the other four straps connected to the metal clips in the hip belt.The table could be tilted up or down. The Figure B.1 represents the schematic illustrationwith numbers indicating the parts of the equipment.
151

Figure B.1: Schematic illustration of the tilt table: (1) metal support; (2) metal frame;(3) wood support; (4) cushion and memory foam; (5) pedal system; (6) pivot point; (7)massage table head piece; (8) adjustable shoulder blocks; (9) arm resting apparatus; (10)belt system (chest and hips); and (11) strap system.
The angle of tilting was selected to promote changes in muscle perfusion pressure (MPP)by placing the heart below or above the level of the muscle. At 35° head-down tilt (HDT)MPP was reduced while in 45° head-up tilt (HUT) MPP was enhanced due to the effectsof gravity. The Figure B.2 represents the angle of tilting used to change MPP.
152

Figure B.2: Illustration of the tilt table during HDT at -35° angle (left side) and HUT at45° angle (right side).
Participants assumed a prone position with their face in the massage table head piece.Additionally, shoulder blocks were adjusted according to participants height and their armswere placed on the resting apparatus located on the side of the table with the shoulders andelbows positioned at approximately 90°. Two belts, one located on the chest and the otheron the hips, were used to secure the participants during testing. Straps were connected tothe metal clips in the chest belt and hip belt and attached in the tilt table (Figure B.3).
153
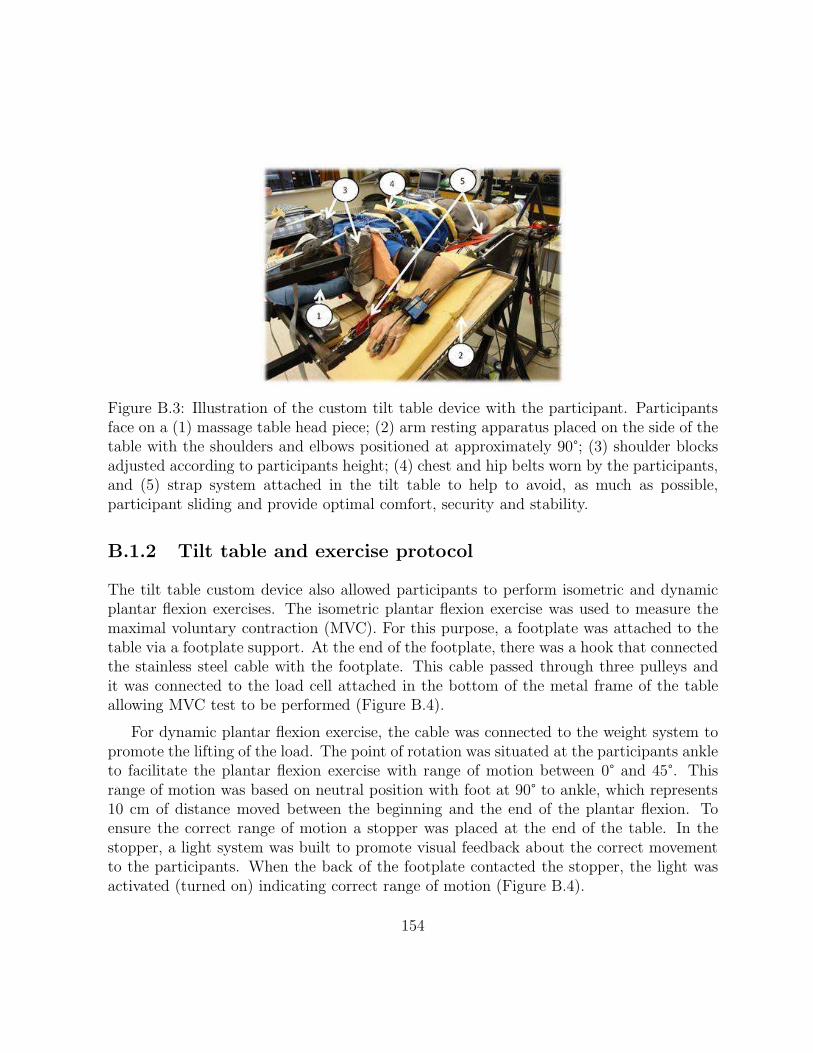
Figure B.3: Illustration of the custom tilt table device with the participant. Participantsface on a (1) massage table head piece; (2) arm resting apparatus placed on the side of thetable with the shoulders and elbows positioned at approximately 90°; (3) shoulder blocksadjusted according to participants height; (4) chest and hip belts worn by the participants,and (5) strap system attached in the tilt table to help to avoid, as much as possible,participant sliding and provide optimal comfort, security and stability.
B.1.2 Tilt table and exercise protocol
The tilt table custom device also allowed participants to perform isometric and dynamicplantar flexion exercises. The isometric plantar flexion exercise was used to measure themaximal voluntary contraction (MVC). For this purpose, a footplate was attached to thetable via a footplate support. At the end of the footplate, there was a hook that connectedthe stainless steel cable with the footplate. This cable passed through three pulleys andit was connected to the load cell attached in the bottom of the metal frame of the tableallowing MVC test to be performed (Figure B.4).
For dynamic plantar flexion exercise, the cable was connected to the weight system topromote the lifting of the load. The point of rotation was situated at the participants ankleto facilitate the plantar flexion exercise with range of motion between 0° and 45°. Thisrange of motion was based on neutral position with foot at 90° to ankle, which represents10 cm of distance moved between the beginning and the end of the plantar flexion. Toensure the correct range of motion a stopper was placed at the end of the table. In thestopper, a light system was built to promote visual feedback about the correct movementto the participants. When the back of the footplate contacted the stopper, the light wasactivated (turned on) indicating correct range of motion (Figure B.4).
154

Figure B.4: Illustration of the tilt table connected to a footplate that allows participantsto perform plantar flexion exercise and MVC tests. (1) footplate support; (2) footplate;(3) point of rotation (participants ankle); (4) hook used to attach the stainless steel cablewith the footplate; (5) pulley system (3 pulleys); (6) load cell (MVC tests) or weightsystem (dynamic exercise tests); (7) light system (visual feedback about the correct rangeof motion); and (8) stopper placed at the end of the table.
Participants lay down on a tilt table in a prone position (face down). The footplate wasconnected to the tilt table allowing plantar flexion exercise to be performed. Participantsfoot was strapped on the footplate to ensure more stability during the motion and bettercontact between plantar surface of the foot and footplate (Figure B.5).
155

Figure B.5: Tilt table with the participants face on a (1) massage table head piece; (2)arm resting apparatus (shoulders and elbows positioned in approximately 90°); (3) shoulderblocks (adjusted according to participants height); (4) footplate connection on a tilt table(plantar flexion exercise); (5) footplate strap system (stability during motion and bettercontact between plantar surface of the foot and footplate).
However, it was noticed during a previous pilot study that the work output performedduring HDT and HUT was similar at the neutral position (starting position at 90°), butwas different during plantar flexion especially at the end of the range of motion due to theeffects of gravity on work output. Therefore, more pilot tests were performed to detect howmuch gravity was affecting work output. Based on these previous pilot data, a correctionfactor for the workloads was used to account for the effects of gravity in HDT and HUTpositions. As a result, the workload obtained in HOR was subtracted by 600g in HDT,then, if the load obtained in HOR was 3.0Kg, then, the load in HDT was 3.0Kg − 0.6Kg(600g) = 2.4Kg.Likewise, in HUT, 800g was added to the HOR value, then, the load inHUT was 3.0Kg + 0.8Kg (800g) = 3.8Kg. The Figure B.6 provided an example of theEMG activity comparison between HOR with HUTwithout correction factor (HUT-NCF)and HUT with correction factor.
156

Figure B.6: Comparison of the EMG activity between horizontal (HOR, middle) comparedto HUT without correction factor (HUT-NCF, top) and HUT with correction factor (HUT-CF, bottom).It was noticed that the EMG activity was similar between HOR and HUTwhen the correction factor was applied, but EMG activity was lower without the correctionfactor.
157

References
Akselrod, S., Gordon, D., Madwed, J., Snidman, N., Shannon, D., & Cohen, R. (1985).Hemodynamic regulation: investigation by spectral analysis. Am.J.Physiol, 249 (4 Pt2), H867–H875.
Allen, D., Lamb, G., & Westerblad, H. (2008). Skeletal muscle fatigue: cellular mechanisms.Physiol Rev. 88 (1), 287–332.
Amundsen, B., Wisloff, U., Helgerud, J., Hoff, J., & Slordahl, S. (2002). Ultrasound recordedaxillary artery blood flow during elbow-flexion exercise. Med.Sci.Sports Exerc. 34 (8),1288–1293.
Arbeille, P., Berson, M., Achaibou, F., Bodard, S., & Locatelli, A. (1995). Vascular resis-tance quantification in high flow resistance areas using the doppler method. Ultra-sound Med.Biol. 21 (3), 321–328.
Baccelli, G., Pignoli, P., Corbellini, E., Pizzolati, P., Bassini, M., Longo, T., & Zanchetti,A. (1985). Hemodynamic factors changing blood flow velocity waveform and profilein normal human brachial artery. Angiology, 36 (1), 1–8.
Barstow, T., Buchthal, S., Zanconato, S., & Cooper, D. (1994). Muscle energetics andpulmonary oxygen uptake kinetics during moderate exercise/. J.Appl.Physiol, 77 (4),1742–1749.
Blackshear, W., Phillips, D., & Strandness, D. (1979). Pulsed doppler assessment of normalhuman femoral artery velocity patterns. J.Surg.Res. 27 (2), 73–83.
Brock, R., Tschakovsky, M., Shoemaker, J., Halliwill, J., Joyner, M., & Hughson, R. (1998).Effects of acetylcholine and nitric oxide on forearm blood flow at rest and after a singlemuscle contraction. J Appl.Physiol. 85 (6), 2249–2254.
Bundgaard-Nielsen, M., Sorensen, H., Dalsgaard, M., Rasmussen, P., & Secher, N. (2009).Relationship between stroke volume, cardiac output and filling of the heart duringtilt. Acta Anaesthesiol.Scand. 53 (10), 1324–1328.
Calbet, J. (2000). Oxygen tension and content in the regulation of limb blood flow. ActaPhysiol Scand. 168 (4), 465–472.
158

Calbet, J., Radegran, G., Boushel, R., & Saltin, B. (2009). On the mechanisms that limitoxygen uptake during exercise in acute and chronic hypoxia: role of muscle mass.J.Physiol, 587 (Pt 2), 477–490.
Calbet, J., Radegran, G., Boushel, R., Sondergaard, H., Saltin, B., & Wagner, P. (2002, De-cember). Effect of blood haemoglobin concentration on VO2max and cardiovascularfunction in lowlanders acclimatised to 5260 m. J.Physiol. 545 (2), 715–728.
Charkoudian, N., Martin, E., Dinenno, F., Eisenach, J., Dietz, N., & Joyner, M. (2004).Influence of increased central venous pressure on baroreflex control of sympatheticactivity in humans. Am.J.Physiol Heart Circ.Physiol, 287 (4), H1658–H1662.
Cheng, A., & Rice, C. (2005). Fatigue and recovery of power and isometric torque followingisotonic knee extensions. J.Appl.Physiol, 99 (4), 1446–1452.
Clifford, P. (2007). Skeletal muscle vasodilatation at the onset of exercise. J.Physiol. 583 (Pt3), 825–833.
Cui, J., Zhang, R., Wilson, T., Witkowski, S., Crandall, C., & Levine, B. (2003). Nitric oxidesynthase inhibition does not affect regulation of muscle sympathetic nerve activityduring head-up tilt. Am.J.Physiol Heart Circ.Physiol, 285 (5), H2105–H2110.
Delis, K., Nicolaides, A., & Stansby, G. (2000). Effect of posture on popliteal artery hemo-dynamics. Arch.Surg. 135 (3), 265–269.
Dyson, K., Shoemaker, J., Arbeille, P., & Hughson, R. (2010). Modelflow estimates ofcardiac output compared with doppler ultrasound during acute changes in vascularresistance in women. Exp.Physiol, 95 (4), 561–568.
Egana, M., & Green, S. (2005). Effect of body tilt on calf muscle performance and bloodflow in humans. J.Appl.Physiol, 98 (6), 2249–2258.
Eiken, O. (1988). Effects of increased muscle perfusion pressure on responses to dynamicleg exercise in man. Eur.J.Appl.Physiol Occup.Physiol, 57 (6), 772–776.
Ellsworth, M., Forrester, T., Ellis, C., & Dietrich, H. (1995). The erythrocyte as a regulatorof vascular tone. Am.J.Physiol, 269 (6 Pt 2), H2155–H2161.
Fisslthaler, B., & Fleming, I. (2009). Activation and signaling by the AMP-activated pro-tein kinase in endothelial cells. Circ.Res. 105 (2), 114–127.
Folkow, B., Haglund, U., Jodal, M., & Lundgren, O. (1971). Blood flow in the calf muscleof man during heavy rhythmic exercise. Acta Physiol Scand. 81 (2), 157–163.
Gill, R. (1985). Measurement of blood flow by ultrasound: accuracy and sources of error.Ultrasound Med.Biol. 11 (4), 625–641.
Gleser, M. (1973). Effects of hypoxia and physical training on hemodynamic adjustmentsto one-legged exercise. J.Appl.Physiol, 34 (5), 655–659.
Gonzalez-Alonso, J., Richardson, R., & Saltin, B. (2001). Exercising skeletal muscle bloodflow in humans responds to reduction in arterial oxyhaemoglobin, but not to alteredfree oxygen. J.Physiol, 530 (Pt 2), 331–341.
159

Grassi, B., Poole, D., Richardson, R., Knight, D., Erickson, B., &Wagner, P. (1996). Muscleo2 uptake kinetics in humans: implications for metabolic control. J.Appl.Physiol,80 (3), 988–998.
Grassi, G., Giannattasio, C., Failla, M., Pesenti, A., Peretti, G., Marinoni, E., Fraschini, N.,Vailati, S., & Mancia, G. (1995). Sympathetic modulation of radial artery compliancein congestive heart failure. Hypertension, 26 (2), 348–354.
Groothuis, Boot, Houtman, van Langen, & Hopman. (2005). Leg vascular resistance in-creases during head-up tilt in paraplegics. Eur.J.Appl.Physiol. 94, 408–414.
Harms, M., van Lieshout, J., Jenstrup, M., Pott, F., & Secher, N. (2003). Postural effects oncardiac output and mixed venous oxygen saturation in humans. Exp.Physiol, 88 (5),611–616.
Henriksen, O., & Sejrsen, P. (1977). Local reflex in microcirculation in human skeletalmuscle. Acta Physiol Scand. 99 (1), 19–26.
Hildebrandt, W., Herrmann, J., & Stegemann, J. (1993). Vascular adjustment and fluid re-absorption in the human forearm during elevation. Eur.J.Appl.Physiol Occup.Physiol,66 (5), 397–404.
Hughson, R. (2003). Regulation of blood flow at the onset of exercise by feed forward andfeedback mechanisms. Can.J.Appl.Physiol. 28 (5), 774–787.
Hughson, R., Cochrane, J., & Butler, G. (1993). Faster o2 uptake kinetics at onset ofsupine exercise with than without Lower-Body Negative-Pressure. J.Appl.Physiol.75 (5), 1962–1967.
Hughson, R., Shoemaker, J., Tschakovsky, M., & Kowalchuk, J. (1996). Dependence ofmuscle VO2 on blood flow dynamics at onset of forearm exercise. J Appl.Physiol,81 (4), 1619–1626.
Ichinose, M., Saito, M., Wada, H., Kitano, A., Kondo, N., & Nishiyasu, T. (2004). Mod-ulation of arterial baroreflex control of muscle sympathetic nerve activity by musclemetaboreflex in humans. Am.J.Physiol Heart Circ.Physiol, 286 (2), H701–H707.
Imadojemu, V., Lott, M., Gleeson, K., Hogeman, C., Ray, C., & Sinoway, L. (2001). Con-tribution of perfusion pressure to vascular resistance response during head-up tilt.Am.J.Physiol Heart Circ.Physiol, 281 (1), H371–H375.
Jia, L., Bonaventura, C., Bonaventura, J., & Stamler, J. (1996). S-nitrosohaemoglobin: adynamic activity of blood involved in vascular control. Nature, 380 (6571), 221–226.
Joyner, M., & Wilkins, B. (2007). Exercise hyperaemia: is anything obligatory but thehyperaemia? J.Physiol. 583 (Pt 3), 855–860.
Klass, M., Guissard, N., & Duchateau, J. (2004). Limiting mechanisms of force productionafter repetitive dynamic contractions in human triceps surae. J.Appl.Physiol, 96 (4),1516–1521.
160

Koskolou, M., Calbet, J., Radegran, G., & Roach, R. (1997). Hypoxia and the cardiovascu-lar response to dynamic knee-extensor exercise. Am.J.Physiol, 272 (6 Pt 2), H2655–H2663.
Labropoulos, N., Watson, W., Mansour, M., Kang, S., Littooy, F., & Baker, W. (1998).Acute effects of intermittent pneumatic compression on popliteal artery blood flow.Arch.Surg. 133 (10), 1072–1075.
Langewouters, G., Wesseling, K., & Goedhard, W. (1984). The static elastic properties of45 human thoracic and 20 abdominal aortas in vitro and the parameters of a newmodel 243. J.Biomech. 17 (6), 425–435.
Lash, J. (1996). Regulation of skeletal muscle blood flow during contractions. Proc.Soc.Exp.Biol.Med.211 (3), 218–235.
Laughlin, M., & Joyner, M. (2003). Closer to the edge? contractions, pressures, waterfallsand blood flow to contracting skeletal muscle. J.Appl.Physiol, 94 (1), 3–5.
Laughlin, M., & Korzick, D. (2001). Vascular smooth muscle: integrator of vasoactivesignals during exercise hyperemia. Med.Sci.Sports Exerc. 33 (1), 81–91.
Laughlin, M., Cook, J., Tremble, R., Ingram, D., Colleran, P., & Turk, J. (2006). Exer-cise training produces nonuniform increases in arteriolar density of rat soleus andgastrocnemius muscle. Microcirculation, 13 (3), 175–186.
Leyk, D., Essfeld, D., Baum, K., & Stegemann, J. (1992). Influence of calf muscle contrac-tions on blood flow parameters measured in the arteria femoralis. Int.J.Sports Med.13 (8), 588–593.
Leyk, D., Essfeld, D., Baum, K., & Stegemann, J. (1994). Early leg blood flow adjustmentduring dynamic foot plantarflexions in upright and supine body position. Int.J.SportsMed. 15 (8), 447–452.
Lunt, M. (1999). Review of duplex and colour doppler imaging of lower-limb arteries andveins. J.Tissue Viability. 9 (2), 45–55.
Lutjemeier, B., Miura, A., Scheuermann, B., Koga, S., Townsend, D., & Barstow, T. (2005).Muscle contraction-blood flow interactions during upright knee extension exercise inhumans. J.Appl.Physiol, 98 (4), 1575–1583.
MacDonald, M., Tarnopolsky, M., & Hughson, R. (2000). Effect of hyperoxia and hypoxiaon leg blood flow and pulmonary and leg oxygen uptake at the onset of kickingexercise. Can.J.Physiol.Pharmacol. 78 (1), 67–74.
MacDonald, M., Shoemaker, J., Tschakovsky, M., & Hughson, R. (1998). Alveolar oxygenuptake and femoral artery blood flow dynamics in upright and supine leg exercise inhumans. J Appl.Physiol, 85 (5), 1622–1628.
MacDonald, M., Tarnopolsky, M., Green, H., & Hughson, R. (1999). Comparison of femoralblood gases and muscle near-infrared spectroscopy at exercise onset in humans. JAppl.Physiol. 86 (2), 687–693.
161

MacDonald, M., Naylor, H., Tschakovsky, M., & Hughson, R. (2001). Peripheral circulatoryfactors limit rate of increase in muscle o(2) uptake at onset of heavy exercise. JAppl.Physiol. 90 (1), 83–89.
MacPhee, S., Shoemaker, J., Paterson, D., & Kowalchuk, J. (2005). Kinetics of o2 uptake,leg blood flow, and muscle deoxygenation are slowed in the upper compared withlower region of the moderate-intensity exercise domain. J.Appl.Physiol. 99 (5), 1822–1834.
Madsen, P., Lyck, F., Pedersen, M., Olesen, H., Nielsen, H., & Secher, N. (1995). Brainand muscle oxygen saturation during head-up-tilt-induced central hypovolaemia inhumans. Clin.Physiol, 15 (5), 523–533.
Martin, W., Ogawa, T., Kohrt, W., Malley, M., Korte, E., Kieffer, P., & Schechtman, K.(1991). Effects of aging, gender, and physical training on peripheral vascular function.Circulation, 84 (2), 654–664.
Matzen, S., Perko, G., Groth, S., Friedman, D., & Secher, N. (1991). Blood volume distri-bution during head-up tilt induced central hypovolaemia in man. Clin.Physiol, 11 (5),411–422.
Modin, A. (2003). [Effect of gravity on blood flow and distribution in large vessels of healthyhuman subjects]. Fiziol.Cheloveka, 29 (5), 47–52.
Mourtzakis, M., Gonzalez-Alonso, J., Graham, T., & Saltin, B. (2004). Hemodynamics ando-2 uptake during maximal knee extensor exercise in untrained and trained humanquadriceps muscle: effects of hyperoxia. J.Appl.Physiol. 97 (5), 1796–1802.
Nadland, I., Walloe, L., & Toska, K. (2009). Effect of the leg muscle pump on the rise inmuscle perfusion during muscle work in humans. Eur.J.Appl.Physiol, 105 (6), 829–841.
Nagaya, K., Wada, F., Nakamitsu, S., Sagawa, S., & Shiraki, K. (1995). Responses ofthe circulatory system and muscle sympathetic nerve activity to head-down tilt inhumans. Am.J.Physiol, 268 (5 Pt 2), R1289–R1294.
Ng, A., Johnson, D., Callister, R., & Seals, D. (1995). Muscle sympathetic nerve activityduring postural change in healthy young and older adults. Clin.Auton.Res. 5 (1), 57–60.
O’Leary, D., Shoemaker, J., Edwards, M., & Hughson, R. (2004). Spontaneous beat-by-beat fluctuations of total peripheral and cerebrovascular resistance in response to tilt.Am.J.Physiol.Regul.Integr.Comp Physiol. 287 (3), R670–R679.
Osada, T. (2004). Muscle contraction-induced limb blood flow variability during dynamicknee extensor. Med.Sci.Sports Exerc. 36 (7), 1149–1158.
Padilla, J., Young, C., Simmons, G., Deo, S., Newcomer, S., Sullivan, J., Laughlin, M., &Fadel, P. (2010). Increased muscle sympathetic nerve activity acutely alters conduitartery shear rate patterns. Am.J.Physiol Heart Circ.Physiol, 298 (4), H1128–H1135.
162

Paterson, N., Kowalchuk, J., & Paterson, D. (2005). Kinetics of VO2 and femoral arteryblood flow during heavy-intensity, knee-extension exercise. J.Appl.Physiol. 99 (2),683–690.
Radegran, G. (1997). Ultrasound doppler estimates of femoral artery blood flow duringdynamic knee extensor exercise in humans. J.Appl.Physiol, 83 (4), 1383–1388.
Radegran, G., & Saltin, B. (1998). Muscle blood flow at onset of dynamic exercise inhumans. Am.J.Physiol.Heart Circ.Physiol. 43 (1), H314–H322.
Risoe, C., & Wille, S. (1978). Blood velocity in human arteries measured by a bidirectionalultrasonic doppler flowmeter. Acta Physiol Scand. 103 (4), 370–378.
Roach, R., Koskolou, M., Calbet, J., & Saltin, B. (1999). Arterial o2 content and ten-sion in regulation of cardiac output and leg blood flow during exercise in humans.Am.J.Physiol, 276 (2 Pt 2), H438–H445.
Rowell, L. (1993). Human cardiovascular control. New York: Oxford University Press, Inc.Rowell, L., Saltin, B., Kiens, B., & Christensen, N. (1986). Is peak quadriceps blood flow
in humans even higher during exercise with hypoxemia? Am.J.Physiol, 251 (5 Pt 2),H1038–H1044.
Saunders, N., & Tschakovsky, M. (2004). Evidence for a rapid vasodilatory contributionto immediate hyperemia in rest-to-mild and mild-to-moderate forearm exercise tran-sitions in humans. J.Appl.Physiol. 97 (3), 1143–1151.
Segal, S. (2005). Regulation of blood flow in the microcirculation. Microcirculation, 12 (1),33–45.
Sheriff, D., Nadland, I., & Toska, K. (2007). Hemodynamic consequences of rapid changesin posture in humans. J.Appl.Physiol. 103 (2), 452–458.
Shoemaker, J., & Hughson, R. (1999). Adaptation of blood flow during the rest to worktransitions in humans. Med.Sci.Sports Exerc. 31, 1019–1026.
Shoemaker, J., Pozeg, Z., & Hughson, R. (1996). Forearm blood flow by doppler ultrasoundduring rest and exercise: tests of day-to-day repeatability. Medicine and Science inSports and Exercise, 28 (9), 1144–1149.
Shoemaker, J., Tschakovsky, M., & Hughson, R. (1998, April). Vasodilation contributes tothe rapid hyperemia with rhythmic contractions in humans. Can.J.Physiol.Pharmacol.76 (4), 418–427.
Shoemaker, J., Phillips, S., Green, H., & Hughson, R. (1996). Faster femoral artery bloodvelocity kinetics at the onset of exercise following short-term training. Cardiovasc.Res.31 (2), 278–286.
Shoemaker, J., Halliwill, J., Hughson, R., & Joyner, M. (1997). Contributions of acetyl-choline and nitric oxide to forearm blood flow at exercise onset and recovery. Am.J.Physiol.273 (5 Pt 2), H2388–H2395.
163

Snell, P., Martin, W., Buckey, J., & Blomqvist, C. (1987). Maximal vascular leg conduc-tance in trained and untrained men. J.Appl.Physiol, 62 (2), 606–610.
Spodick, D., & Lance, V. (1977). Comparative orthostatic responses: standing vs. head-uptilt. Aviat.Space Environ.Med. 48 (5), 432–433.
Stacey-Clear, A., & Fish, P. (1984). Repeatability of blood flow measurement using multi-channel pulsed doppler ultrasound. Br.J.Radiol. 57 (677), 419–420.
Stamler, J., Jia, L., Eu, J., McMahon, T., Demchenko, I., Bonaventura, J., Gernert, K.,& Piantadosi, C. (1997). Blood flow regulation by s-nitrosohemoglobin in the physi-ological oxygen gradient. Science, 276 (5321), 2034–2037.
Thijssen, D., Green, D., Steendijk, S., & Hopman, M. (2009). Sympathetic vasomotorcontrol does not explain the change in femoral artery shear rate pattern during arm-crank exercise. Am.J.Physiol Heart Circ.Physiol, 296 (1), H180–H185.
Toska, K., Eriksen, M., & Walloe, L. (1994). Short-term cardiovascular responses to a stepdecrease in peripheral conductance in humans. Am.J.Physiol, 266 (1 Pt 2), H199–H211.
Toska, K., & Walloe, L. (2002). Dynamic time course of hemodynamic responses afterpassive head-up tilt and tilt back to supine position. J.Appl.Physiol. 92 (4), 1671–1676.
Towler, M., & Hardie, D. (2007). AMP-activated protein kinase in metabolic control andinsulin signaling. Circ.Res. 100 (3), 328–341.
Tschakovsky, M., & Hughson, R. (1999). Interaction of factors determining oxygen uptakeat the onset of exercise. J Appl.Physiol. 86 (4), 1101–1113.
Tschakovsky, M., & Hughson, R. (2000). Venous emptying mediates a transient vasodila-tion in the human forearm. Am.J.Physiol Heart Circ.Physiol. 279 (3), H1007–H1014.
Tschakovsky, M., & Sheriff, D. (2004). Immediate exercise hyperemia: contributions of themuscle pump vs. rapid vasodilation. J Appl.Physiol. 97 (2), 739–747.
Tschakovsky, M., Shoemaker, J., & Hughson, R. (1995). Beat-by-beat forearm blood flowwith doppler ultrasound and strain-gauge plethysmography. J.Appl.Physiol. 79 (3),713–719.
Tschakovsky, M., Shoemaker, J., & Hughson, R. (1996). Vasodilation and muscle pumpcontribution to immediate exercise hyperemia. Am.J.Physiol. 271 (4 Pt 2), H1697–H1701.
Tschakovsky, M., Saunders, N., Webb, K., & O’Donnell, D. (2006). Muscle blood-flowdynamics at exercise onset: do the limbs differ? Med.Sci.Sports Exerc. 38 (10), 1811–1818.
van Dijk, de Bruin, Gisolf, de Bruin-Bon, Linzer, M, van Lieshout, & Wieling, W. (2005).Hemodynamic effects of leg crossing and skeletal muscle tensing during free standingin patients with vasovagal syncope. J.Appl.Physiol, 98 (2), 584–590.
164

van Lieshout, J., Harms, M., Pott, F., Jenstrup, M., & Secher, N. (2005). Stroke volume ofthe heart and thoracic fluid content during head-up and head-down tilt in humans.Acta Anaesthesiol.Scand. 49 (9), 1287–1292.
Van Leeuwen, B., Barendsen, G., Lubbers, J., & de Pater, L. (1992). Calf blood flow andposture: doppler ultrasound measurements during and after exercise. J.Appl.Physiol,72 (5), 1675–1680.
Walker, K., Saunders, N., Jensen, D., Kuk, J., Wong, S., Pyke, K., Dwyer, E., & Tschakovsky,M. (2007). Do vasoregulatory mechanisms in exercising human muscle compensatefor changes in arterial perfusion pressure? Am.J.Physiol.Heart Circ.Physiol. 293 (5),H2928–H2936.
Walloe, L., & Wesche, J. (1988). Time course and magnitude of blood flow changes inthe human quadriceps muscles during and following rhythmic exercise. J.Physiol,405 (0022-3751 (Linking)), 257–273.
Walther, G., Nottin, S., Dauzat, M., & Obert, P. (2006, July). Femoral and axillary ul-trasound blood flow during exercise: a methodological study. Med.Sci.Sports Exerc.38 (7), 1353–1361.
Welsh, & Segal. (1998). Coactivation of resistance vessels and muscle fibers with acetyl-choline release from motor nerves. Am.J.Physiol. 273(1 Pt 2), 156–163.
Wilkins, B., Schrage, W., Liu, Z., Hancock, K., & Joyner, M. (2006). Systemic hypoxia andvasoconstrictor responsiveness in exercising human muscle. J.Appl.Physiol, 101 (5),1343–1350.
Zamir, M., Goswami, R., Salzer, D., & Shoemaker, J. (2007). Role of vascular bed compli-ance in vasomotor control in human skeletal muscle. Exp.Physiol, 92 (5), 841–848.
165