Validation of diffuse correlation spectroscopy for muscle blood flow with concurrent arterial spin...
9
Validation of diffuse correlation spectroscopic measurement of cerebral blood flow using phase-encoded velocity mapping magnetic resonance imaging Erin M. Buckley Dalton Hance Thomas Pawlowski Jennifer Lynch Felice B. Wilson Rickson C. Mesquita Turgut Durduran Laura K. Diaz Mary E. Putt Daniel J. Licht Mark A. Fogel Arjun G. Yodh
-
Upload
independent -
Category
Documents
-
view
1 -
download
0
Transcript of Validation of diffuse correlation spectroscopy for muscle blood flow with concurrent arterial spin...
Validation of diffuse correlationspectroscopic measurement of cerebralblood flow using phase-encoded velocitymapping magnetic resonance imaging
Erin M. BuckleyDalton HanceThomas PawlowskiJennifer LynchFelice B. WilsonRickson C. MesquitaTurgut DurduranLaura K. DiazMary E. PuttDaniel J. LichtMark A. FogelArjun G. Yodh
Validation of diffuse correlation spectroscopicmeasurement of cerebral blood flow usingphase-encoded velocity mapping magneticresonance imaging
Erin M. Buckley,a,g Dalton Hance,a Thomas Pawlowski,b Jennifer Lynch,a Felice B. Wilson,b Rickson C. Mesquita,a,cTurgut Durduran,d Laura K. Diaz,e Mary E. Putt,f Daniel J. Licht,g Mark A. Fogel,b and Arjun G. Yodha
aUniversity of Pennsylvania, Department of Physics and Astronomy, 3231 Walnut Street, Philadelphia, Pennsylvania 19104bChildren’s Hospital of Philadelphia, Division of Cardiology, 34th Street and Civic Center Boulevard, Philadelphia, Pennsylvania 19104cUniversity of Campinas – UNICAMP, Institute of Physics 'GlebWataghin', 777 Sergio Buarque de Holanda Street, Campinas, SP, Brazil 13083-859dICFO-Institut de Ciències Fotòniques, Mediterranean Technology Park, 08860 Castelldefels, Barcelona, SpaineChildren’s Hospital of Philadelphia, Department of Anesthesiology and Critical Care, 34th Street and Civic Center Boulevard, Philadelphia,Pennsylvania 19104fUniversity of Pennsylvania, Center for Clinical Epidemiology and Biostatistics, 423 Guardian Drive, Philadelphia, Pennsylvania 19104gChildren’s Hospital of Philadelphia, Division of Neurology, 34th Street and Civic Center Boulevard, Philadelphia, Pennsylvania 19104
Abstract. Diffuse correlation spectroscopy (DCS) is a novel optical technique that appears to be an excellent tool forassessing cerebral blood flow in a continuous and non-invasive manner at the bedside. We present new clinicalvalidation of the DCS methodology by demonstrating strong agreement between DCS indices of relative cerebralblood flow and indices based on phase-encoded velocity mapping magnetic resonance imaging (VENC MRI) ofrelative blood flow in the jugular veins and superior vena cava. Data were acquired from 46 children with singleventricle cardiac lesions during a hypercapnia intervention. Significant increases in cerebral blood flow, measuredboth by DCS and by VENC MRI, as well as significant increases in oxyhemoglobin concentration, and totalhemoglobin concentration, were observed during hypercapnia. Comparison of blood flow changes measuredby VENC MRI in the jugular veins and by DCS revealed a strong linear relationship, R ¼ 0.88, p < 0.001,slope ¼ 0.91� 0.07. Similar correlations were observed between DCS and VENC MRI in the superior venacava, R ¼ 0.77, slope ¼ 0.99� 0.12, p < 0.001. The relationship between VENC MRI in the aorta and DCS, anegative control, was weakly correlated, R ¼ 0.46, slope ¼ 1.77� 0.45, p < 0.001. © 2012 Society of Photo-Optical Instru-
mentation Engineers (SPIE). [DOI: 10.1117/1.JBO.17.3.037007]
Keywords: cerebral blood flow; diffuse optical spectroscopy; diffuse correlation spectroscopy; phase encoded velocity mapping magneticresonance imaging; congenital heart defects; pediatrics; hypercapnia.
Paper 11547 received Sep. 27, 2011; revised manuscript received Jan. 16, 2012; accepted for publication Jan. 17, 2012; published onlineMar. 27, 2012; corrected Apr. 17, 2012.
1 IntroductionAssuring adequate tissue perfusion is central for support ofpatients in the critical care arena. In particular, informationabout cerebral blood flow is valuable for assessment of brainperfusion and prevention of secondary injury. Very few technol-ogies, however, provide clinicians with bedside access to thisinformation. Current cerebral perfusion diagnostics, such astranscranial Doppler ultrasound, arterial spin-labeled magneticresonance imaging (MRI), Xenon-133 clearance, and positronemission tomography, are either low-throughput, indirect,expensive, invasive, or require patient transport.1,2 Diffuse cor-relation spectroscopy (DCS), is a novel optical technique thatappears to be an excellent tool for assessing cerebral blood flowin a continuous and non-invasive manner at the bedside. Thetechnique, however, must be validated in a variety of clinicalsettings and against numerous well-established blood flow mod-alities in order for this new optical tool to gain wide acceptance.
Patients with congenital heart defects represent one popula-tion that could benefit from a non-invasive bedside monitor ofcerebral blood flow. Recent work has shown that whencomparedto healthy full-term children, patients with complex congenitalheart defects have a high incidence of peri-operative brain injuryand a significantly higher incidence of neurocognitive impair-ments.3–5 During periods of hemodynamic instability, such asperi-operative care, a monitor of cerebral blood flow couldprovide insight into the timing, development, and evolutionof these brain injuries.
DCS6–9 has shown promise as a monitor of relative changesin cerebral blood flow.10–16 The DCS technique uses near-infrared, NIR, light in the tissue absorption windowto probe thedynamics of deep tissues. Within this window scattering, ratherthan absorption, dominates photon transport, so that near-infrared light experiences thousands of scattering events andpropagates centimeters into the tissue before it is either detectedat the tissue surface or lost due to absorption. DCS monitorschanges in blood flow by capturing temporal fluctuations ofscattered light detected at the tissue surface.10 These temporalAddress all correspondence to: Erin M. Buckley, University of Pennsylvania,
Department of Physics and Astronomy, 3231 Walnut Street, Philadelphia, Penn-sylvania 19104. Tel: (215) 573-6406; Fax: (215) 573-6391; E-mail: [email protected]. 0091-3286/2012/$25.00 © 2012 SPIE
Journal of Biomedical Optics 17(3), 037007 (March 2012)
Journal of Biomedical Optics 037007-1 March 2012 • Vol. 17(3)
light intensity fluctuations are sensitive to blood flow in thetissue microvasculature and such measurements can be madein a continuous fashion with data acquisition rates of 0.3 Hzand even faster.15
The present contribution validates DCS measurement ofrelative changes in cerebral blood flow (CBF) against a well-established magnetic resonance technique known as phaseencoded velocity mapping (VENC MRI). VENC MRI does notmeasure cerebral blood flow in the brain; rather, it measuresblood flow in the main vessel supplying blood to the brain, theaortic arch, and blood flow in the main vessels draining bloodfrom the brain, the right and left common jugular veins, and thesuperior vena cava. These measures of flow in the jugular veinshave been shown to agree with other measures of cerebral bloodflow. These measures of flow in the jugular veins have beenshown to agree strongly with other measures of cerebralblood flow.17,18 However, while VENC MRI provides high-quality, reliable blood flow data, these measurements must becarried out in an MRI scanner making them unsuitable for con-tinuous monitoring. We find that relative changes of blood flowin the jugular veins and superior vena cava correlate stronglywith relative changes in CBF measured with DCS. Additionally,we find that blood flow changes in the aorta, a negative control,were only weakly correlated with relative changes in CBF mea-sured with DCS. These results indicate DCS may be employedas a continuous bedside monitor of CBF in patients with con-genital heart defects as well as in a wide variety of other patients.
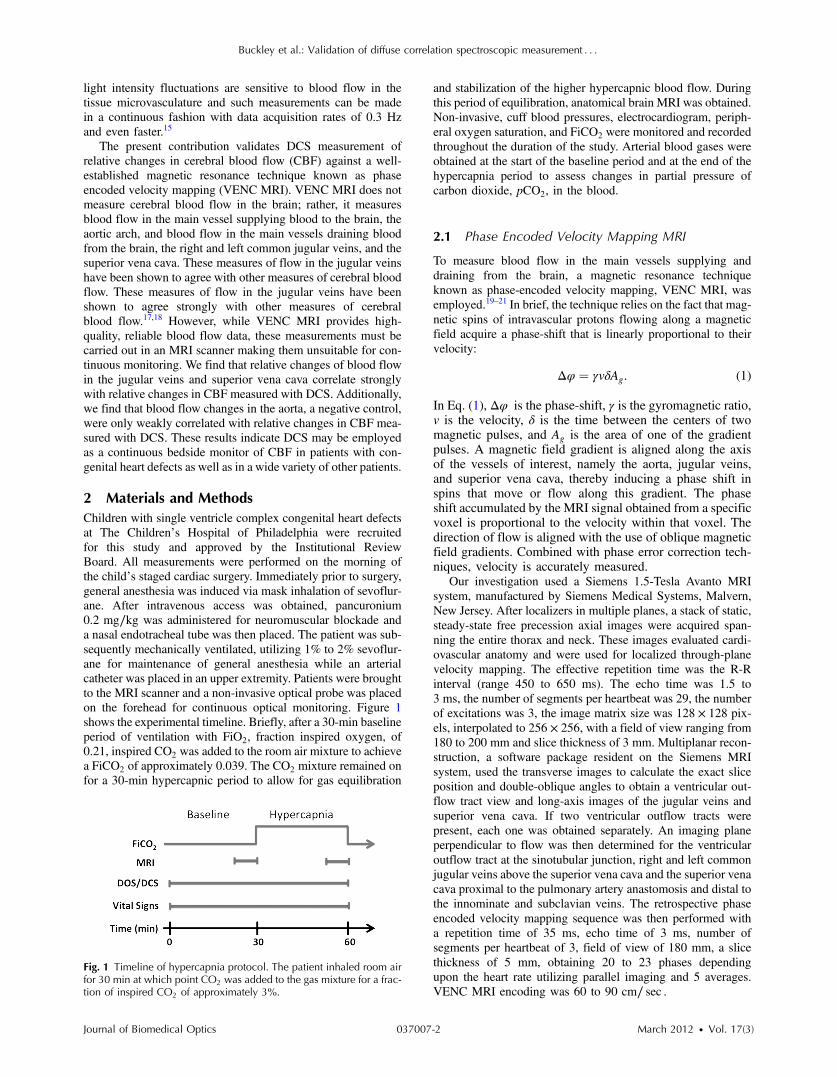
2 Materials and MethodsChildren with single ventricle complex congenital heart defectsat The Children’s Hospital of Philadelphia were recruitedfor this study and approved by the Institutional ReviewBoard. All measurements were performed on the morning ofthe child’s staged cardiac surgery. Immediately prior to surgery,general anesthesia was induced via mask inhalation of sevoflur-ane. After intravenous access was obtained, pancuronium0.2 mg∕kg was administered for neuromuscular blockade anda nasal endotracheal tube was then placed. The patient was sub-sequently mechanically ventilated, utilizing 1% to 2% sevoflur-ane for maintenance of general anesthesia while an arterialcatheter was placed in an upper extremity. Patients were broughtto the MRI scanner and a non-invasive optical probe was placedon the forehead for continuous optical monitoring. Figure 1shows the experimental timeline. Briefly, after a 30-min baselineperiod of ventilation with FiO2, fraction inspired oxygen, of0.21, inspired CO2 was added to the room air mixture to achievea FiCO2 of approximately 0.039. The CO2 mixture remained onfor a 30-min hypercapnic period to allow for gas equilibration
and stabilization of the higher hypercapnic blood flow. Duringthis period of equilibration, anatomical brain MRI was obtained.Non-invasive, cuff blood pressures, electrocardiogram, periph-eral oxygen saturation, and FiCO2 were monitored and recordedthroughout the duration of the study. Arterial blood gases wereobtained at the start of the baseline period and at the end of thehypercapnia period to assess changes in partial pressure ofcarbon dioxide, pCO2, in the blood.
2.1 Phase Encoded Velocity Mapping MRI
To measure blood flow in the main vessels supplying anddraining from the brain, a magnetic resonance techniqueknown as phase-encoded velocity mapping, VENC MRI, wasemployed.19–21 In brief, the technique relies on the fact that mag-netic spins of intravascular protons flowing along a magneticfield acquire a phase-shift that is linearly proportional to theirvelocity:
Δφ ¼ γvδAg: (1)
In Eq. (1), Δφ is the phase-shift, γ is the gyromagnetic ratio,v is the velocity, δ is the time between the centers of twomagnetic pulses, and Ag is the area of one of the gradientpulses. A magnetic field gradient is aligned along the axisof the vessels of interest, namely the aorta, jugular veins,and superior vena cava, thereby inducing a phase shift inspins that move or flow along this gradient. The phaseshift accumulated by the MRI signal obtained from a specificvoxel is proportional to the velocity within that voxel. Thedirection of flow is aligned with the use of oblique magneticfield gradients. Combined with phase error correction tech-niques, velocity is accurately measured.
Our investigation used a Siemens 1.5-Tesla Avanto MRIsystem, manufactured by Siemens Medical Systems, Malvern,New Jersey. After localizers in multiple planes, a stack of static,steady-state free precession axial images were acquired span-ning the entire thorax and neck. These images evaluated cardi-ovascular anatomy and were used for localized through-planevelocity mapping. The effective repetition time was the R-Rinterval (range 450 to 650 ms). The echo time was 1.5 to3 ms, the number of segments per heartbeat was 29, the numberof excitations was 3, the image matrix size was 128 × 128 pix-els, interpolated to 256 × 256, with a field of view ranging from180 to 200 mm and slice thickness of 3 mm. Multiplanar recon-struction, a software package resident on the Siemens MRIsystem, used the transverse images to calculate the exact sliceposition and double-oblique angles to obtain a ventricular out-flow tract view and long-axis images of the jugular veins andsuperior vena cava. If two ventricular outflow tracts werepresent, each one was obtained separately. An imaging planeperpendicular to flow was then determined for the ventricularoutflow tract at the sinotubular junction, right and left commonjugular veins above the superior vena cava and the superior venacava proximal to the pulmonary artery anastomosis and distal tothe innominate and subclavian veins. The retrospective phaseencoded velocity mapping sequence was then performed witha repetition time of 35 ms, echo time of 3 ms, number ofsegments per heartbeat of 3, field of view of 180 mm, a slicethickness of 5 mm, obtaining 20 to 23 phases dependingupon the heart rate utilizing parallel imaging and 5 averages.VENC MRI encoding was 60 to 90 cm∕ sec .
Fig. 1 Timeline of hypercapnia protocol. The patient inhaled room airfor 30 min at which point CO2 was added to the gas mixture for a frac-tion of inspired CO2 of approximately 3%.
Buckley et al.: Validation of diffuse correlation spectroscopic measurement : : :
Journal of Biomedical Optics 037007-2 March 2012 • Vol. 17(3)
Quantitative velocities were obtained in a region of interest(ROI) that was semi-automatically traced along the margins ofthe blood vessels of interest. Blood flow was computed by thesum of the product of the velocities measured in each pixel andthe area of each pixel in the ROI. By integrating this flow overthe cardiac cycle and multiplying by the heart rate, we obtainedan average blood flow in units of liters per minute. The protocolnot only included VENC MRI, but also a contiguous stack ofstatic, steady state free precession images in the axial plane. Thisstack was used to locate the exact slice positions for VENCMRIso that this plane was perpendicular to flow.
For each patient, velocity maps were obtained at the sinotub-ular junction in the aortic root, in the left and right commonjugular veins, and in the superior vena cava during room airinhalation and during hypercapnia as seen in Figs. 1 and 2.From these maps, we calculated a net flow, as describedabove, per cardiac cycle. The signal was averaged over multiplecardiac cycles to minimize effects of respiratory motion.Averaging also had the advantage of improving the signal-to-noise ratio, yielding an average blood flow value for each vesselacquired over approximately 1 min. Thus, we obtained a meanblood flow with units of liters/minute in the aorta (BFAorta),superior vena cava (BFSVC), and by summing the blood flowin the right and left common jugulars, the jugular veins(BFJug). Relative changes in blood flow (rBF) through thesevessels due to hypercapnia were computed using the followingformula: rBF ¼ ðBFCO2
∕BFRoom AirÞ × 100%. Cerebrovascularreactivity (CVR), defined as the change in blood flow dividedby the change in partial pressure of CO2 (ΔpCO2), was com-puted as CVR ¼ ðrBF − 100%Þ∕ΔpCO2.
2.2 Diffuse Optical and Correlation Spectroscopies
Optical measurements of changes in oxy- and deoxy-hemoglobinconcentration (ΔHb and ΔHbO2, respectively) and relativechanges in cerebral blood flow (rCBF) were obtained continu-ously with a custom-made optical probe, manufactured by Fiber-optic Systems, Inc., Simi Valley, California. The probe containedtwo separate source-detector pairs, one for diffuse optical spectro-scopy (DOS) andone forDCS, both separated by2.5 cm; thus, themean penetration depth of diffusing photons reached into the cor-tical tissues. TheDCS detector was a bundle of eight single-modefibers used to improve the signal-to-noise ratio. The probe wassecuredgently to the foreheadwith a soft headwrap.Additionally,a fiducialmarkerwasplacedover theprobetolocate fiberpositionson anatomical MRI images.
Optical data were acquired using a hybrid diffuse opticalspectrometer consisting of a commercially available DOS sys-tem (Imagent, ISS, Champaign, Illinois) and a diffuse correla-tion spectrometer custom-made in our laboratory. The DOSinstrument operates in the frequency domain at 110 MHzwith three wavelengths, 686, 786, and 826 nm. It uses a hetero-dyne detection at 5 kHz to quantify diffusive wave ACamplitude attenuation, phase shift, and average DC value ofthe detected light. For DOS data analysis, the modifiedBeer-Lambert law,22,23 was employed to compute changes inthe absorption coefficient, ΔμaðλÞ:
log½IðλÞ∕I0ðλÞ� ¼ r × DPFðλÞ × ΔμaðλÞ; (2)
μaðλÞ is linearly dependent on the changes in concentrationsof oxy- and deoxy-hemoglobin (ΔHbO2 and ΔHb, respec-tively).24 In Eq. (2), IðλÞ is the AC light intensity measuredat wavelength λ and time t, I0ðλÞ is the mean AC light inten-sity measured at wavelength λ during the 5 min of room airinhalation when VENCMRI scans were obtained, DPFðλÞ isthe wavelength dependent diffuse pathlength factor account-ing for the increase in photon pathlength due to multiplescattering, equal to 5.4, 5.0, and 4.7 for 686, 786, and826 nm, respectively,25 and r is the DOS source detectorseparation distance (2.5 cm for this experiment). If thedetected AC light intensity was outside the linear range ofour instrument, the DOS data were excluded from our ana-lysis. Note, the measured DC amplitude attenuation andphase-shift were not employed in this analysis.
The DCS instrument uses a long-coherence-length laser,CrystaLaser, RCL-080-785S, operating at 785 nm to delivercoherent light to the tissue. Light is detected at the tissue surfacewith a bundle of eight single-mode detection fibers and is trans-mitted to a fast photon counting avalanche photodiode thatoutputs a TTL signal for every photon detected. A custombuilt 8-channel correlator board (FLEX03OEM-8CH, correla-tor.com, Bridgewater, New Jersey) uses this TTL signal toderive the intensity autocorrelation function based on the photonarrival times.26
For DCS analysis, we employed the semi-infinite homoge-neous medium solution to the correlation diffusion equation tofit our measured intensity autocorrelation curves, g2ðτÞ, for ablood flow index (BFI). BFI is related to the motion of redblood cells and their concentration.10 DCS data were discardedif the intensity (i.e., photon count rate) of all detectors was lessthan 5 kHz (i.e., if the intensity signal-to-noise ratio was lessthan 10). Intensity autocorrelation curves were fit for BFIusing fminsearchbnd.m, (Matlab 2010a, MathWorks) to find
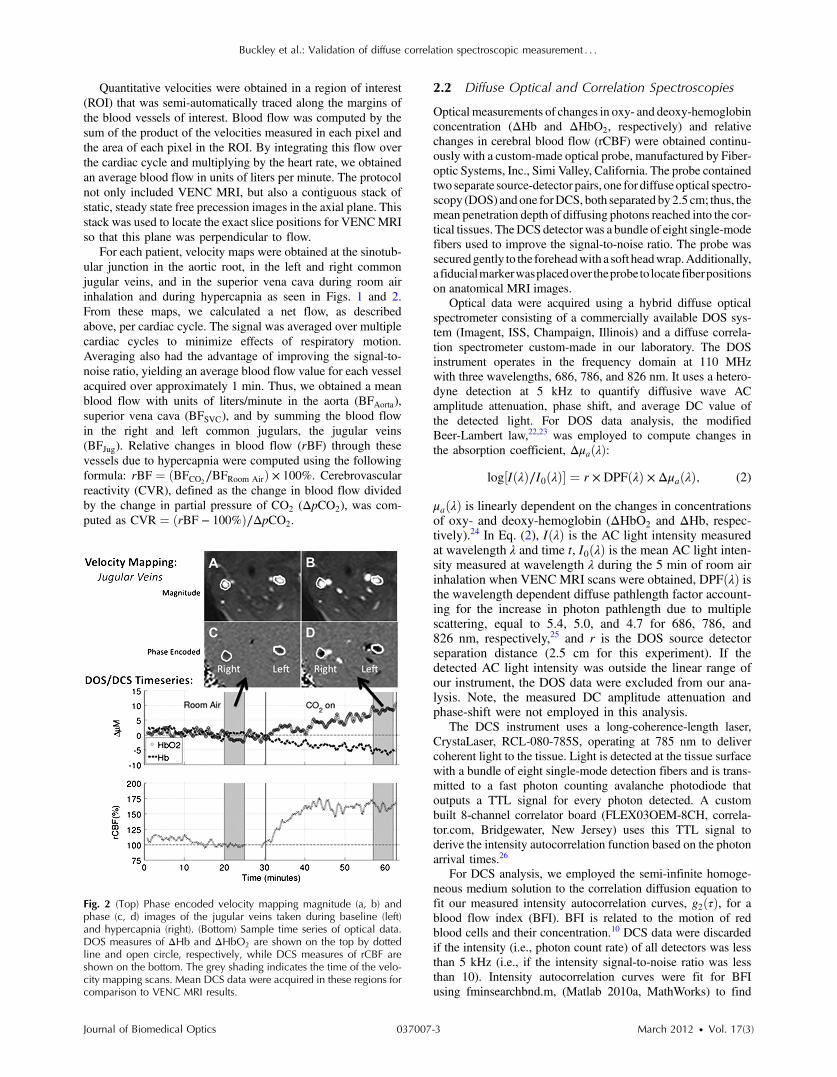
Fig. 2 (Top) Phase encoded velocity mapping magnitude (a, b) andphase (c, d) images of the jugular veins taken during baseline (left)and hypercapnia (right). (Bottom) Sample time series of optical data.DOS measures of ΔHb and ΔHbO2 are shown on the top by dottedline and open circle, respectively, while DCS measures of rCBF areshown on the bottom. The grey shading indicates the time of the velo-city mapping scans. Mean DCS data were acquired in these regions forcomparison to VENC MRI results.
Buckley et al.: Validation of diffuse correlation spectroscopic measurement : : :
Journal of Biomedical Optics 037007-3 March 2012 • Vol. 17(3)
the optimal solution to the objective function, f , where f isdefined as
f ¼ffiffiffiffiffiffiffiffiffiffiffiffiffiffiffiffiffiffiffiffiffiffiffiffiffiffiffiffiffiffiffiffiffiffiffiffiffiffiffiffiffiffiffiffiffiffiffiffiffiffiffiffiffiffiffiffiΣi
hg2ðτiÞFit − g2ðτiÞMeasured
i2
r: (3)
The fitting procedure assumes an initial value of μa and μ 0s ,
(0.1 cm−1 and 9 cm−1, respectively, at 785 nm) for allpatients.27 The reduced scattering coefficient, μ 0
s , wasassumed to remain constant, but the measured changes inμa at 786 nm computed with the DOS setup were incorpo-rated into each fit of g2ðτÞ. Additionally, we fit the dataassuming the mean squared displacement of the moving scat-terers obeys a Brownian motion model. In this case, the lead-ing exponential decay rate of g2ðτÞ should be proportional tothe sq uare root of the correlation time, τ.7,10,24
For comparison with velocity mapping MRI data, a meanrelative change in CBF obtained by DCS was calculated foreach patient. A mean and standard deviation of the bloodflow index, hBFIi and σBFI respectively, were computed duringthe approximately 5-min long room air and hypercapnia velocitymapping scans. We defined the relative change in CBF due tohypercapnia as rCBFDCS ¼ ðhBFIiCO2
∕hBFIiRoom AirÞ × 100%,where the subscript indicates data acquired during thehypercapnic or room air velocity mapping MRI scan.Additionally, erebrovascular reactivity, CVR, was defined asCVR ¼ ðrCBFDCS − 100%Þ∕ΔpCO2.
2.3 Statistical Analysis
To test the hypothesis that each of the relative variables differedfrom room air during hypercapnia, we carried out a Wilcoxonsigned rank test.28 Analyses used R 2.11,29 hypotheses tests andassociated p-values (p) were two-sided. Statistical significancewas declared for p-values <0.05.
To quantify the relationship between relative changes inblood flow in the jugular veins, superior vena cava, andaorta measured by velocity mapping MRI against relativechanges in cerebral blood flow measured by DCS, we fit asimple linear regression model and estimated Pearson’scorrelation coefficient. Pearson’s correlation, R, varies from0 to 1.0 and measures the extent to which a linear modelexplains variability in the data. Note that R can approach1.0, even for a case where the slope of the line betweenthe two measures varied substantially from unity. We usedLin’s concordance correlation coefficient, CCC, to measureagreement between the two measures. The CCC is the productof Pearson’s R, a measure of precision, and a bias correctionfactor which reflects the degree that the linear associationbetween two variables differs from 45 deg through the origin.For example, R ¼ CCC∕Bias Correction. Bland-Altman plotsof the difference versus the mean of the two measures of rela-tive flow changes were constructed as a graphical approachto assessing agreement.30
3 ResultsFifty-three children with single ventricle congenital heartdefects were recruited. All patients were scheduled for cardiacsurgical repair on the day of the study. Fifty-two patients com-pleted the entire study, one was eliminated due to timeconstraints. Forty-six out of 52 remaining patients satisfied
the inclusion criteria of having high-quality DOS, DCS, andVENC MRI data. Table 1 lists the median and interquartilerange values of patient age, weight, height, skull/scalp/CSFthickness, sex, and surgical procedure for the study cohort.Patients had a median age of 2.8 years and were largelymale, 70%.
Figure 2 shows velocity mapping MRI and DOS/DCS datafrom a typical subject. The top images show the phase mapsof the region in and around the right and left common jugularveins during the room air, left, and hypercapnia, right. Theveins are circled in white for ease of viewing. It is evidentthat during hypercapnia, the phase contrast in both vesselsincreases, indicating an increase in velocity in these vessels.The middle and bottom portions of Fig. 2 show the contin-uous time trace of DOS measures of ΔHb and ΔHbO2, mid-dle, and DCS measures of rCBF, bottom. The shaded greyregions indicate the time periods in which VENC MRIscans were taken. For comparison between DCS and VENCMRI, the DCS data were averaged over the grey shadedregions to extract an average rCBF due to hypercapnia foreach patient.
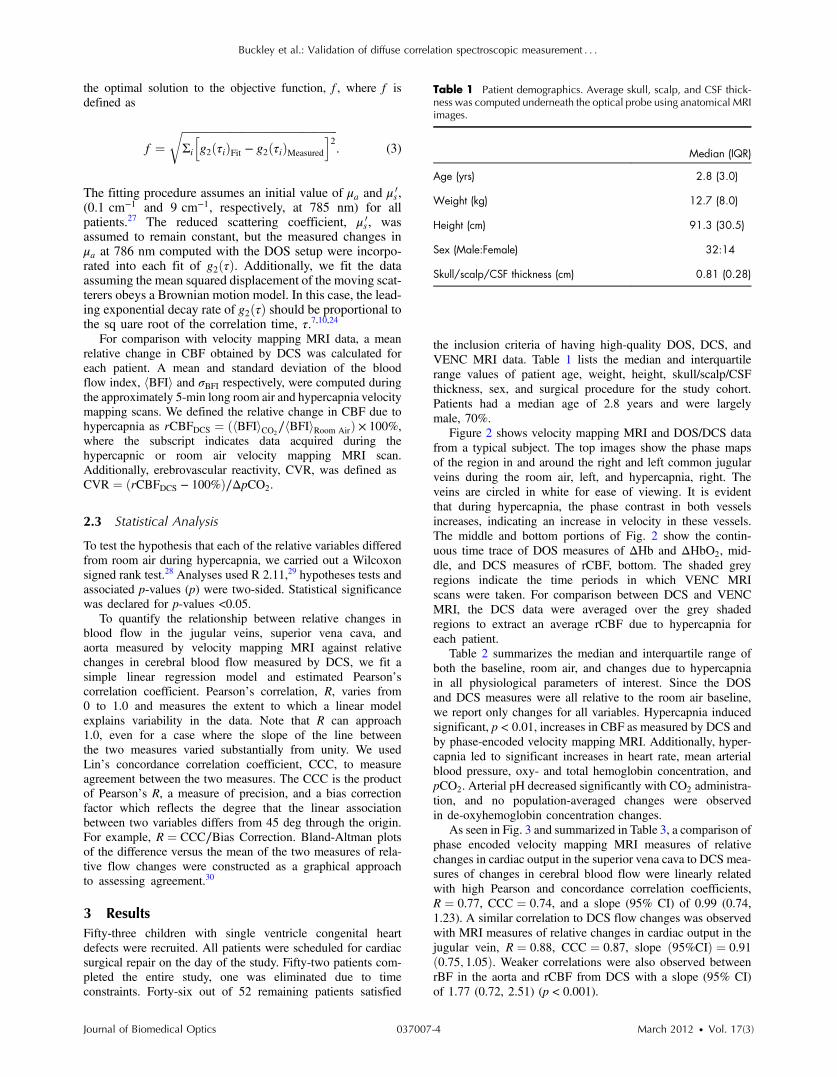
Table 2 summarizes the median and interquartile range ofboth the baseline, room air, and changes due to hypercapniain all physiological parameters of interest. Since the DOSand DCS measures were all relative to the room air baseline,we report only changes for all variables. Hypercapnia inducedsignificant, p < 0.01, increases in CBF as measured by DCS andby phase-encoded velocity mapping MRI. Additionally, hyper-capnia led to significant increases in heart rate, mean arterialblood pressure, oxy- and total hemoglobin concentration, andpCO2. Arterial pH decreased significantly with CO2 administra-tion, and no population-averaged changes were observedin de-oxyhemoglobin concentration changes.
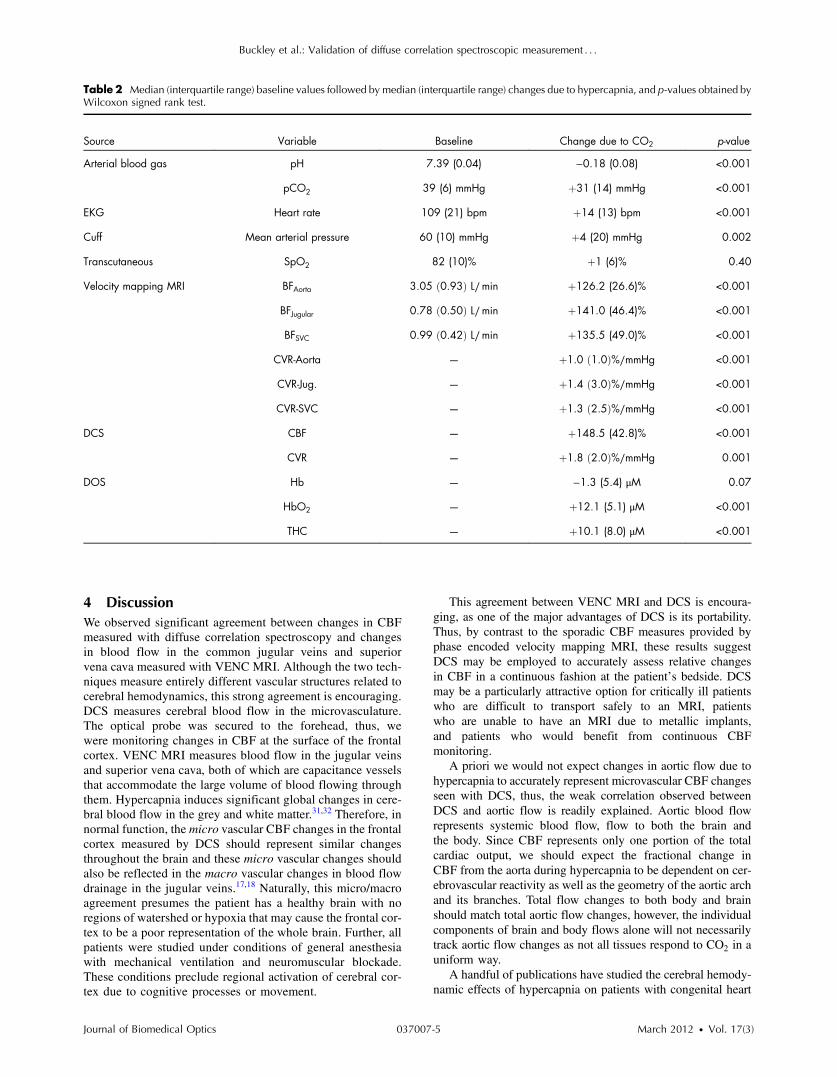
As seen in Fig. 3 and summarized in Table 3, a comparison ofphase encoded velocity mapping MRI measures of relativechanges in cardiac output in the superior vena cava to DCS mea-sures of changes in cerebral blood flow were linearly relatedwith high Pearson and concordance correlation coefficients,R ¼ 0.77, CCC ¼ 0.74, and a slope (95% CI) of 0.99 (0.74,1.23). A similar correlation to DCS flow changes was observedwith MRI measures of relative changes in cardiac output in thejugular vein, R ¼ 0.88, CCC ¼ 0.87, slope ð95%CIÞ ¼ 0.91ð0.75; 1.05Þ. Weaker correlations were also observed betweenrBF in the aorta and rCBF from DCS with a slope (95% CI)of 1.77 (0.72, 2.51) (p < 0.001).
Table 1 Patient demographics. Average skull, scalp, and CSF thick-ness was computed underneath the optical probe using anatomical MRIimages.
Median (IQR)
Age (yrs) 2.8 (3.0)
Weight (kg) 12.7 (8.0)
Height (cm) 91.3 (30.5)
Sex (Male:Female) 32:14
Skull/scalp/CSF thickness (cm) 0.81 (0.28)
Buckley et al.: Validation of diffuse correlation spectroscopic measurement : : :
Journal of Biomedical Optics 037007-4 March 2012 • Vol. 17(3)
4 DiscussionWe observed significant agreement between changes in CBFmeasured with diffuse correlation spectroscopy and changesin blood flow in the common jugular veins and superiorvena cava measured with VENC MRI. Although the two tech-niques measure entirely different vascular structures related tocerebral hemodynamics, this strong agreement is encouraging.DCS measures cerebral blood flow in the microvasculature.The optical probe was secured to the forehead, thus, wewere monitoring changes in CBF at the surface of the frontalcortex. VENC MRI measures blood flow in the jugular veinsand superior vena cava, both of which are capacitance vesselsthat accommodate the large volume of blood flowing throughthem. Hypercapnia induces significant global changes in cere-bral blood flow in the grey and white matter.31,32 Therefore, innormal function, the micro vascular CBF changes in the frontalcortex measured by DCS should represent similar changesthroughout the brain and these micro vascular changes shouldalso be reflected in the macro vascular changes in blood flowdrainage in the jugular veins.17,18 Naturally, this micro/macroagreement presumes the patient has a healthy brain with noregions of watershed or hypoxia that may cause the frontal cor-tex to be a poor representation of the whole brain. Further, allpatients were studied under conditions of general anesthesiawith mechanical ventilation and neuromuscular blockade.These conditions preclude regional activation of cerebral cor-tex due to cognitive processes or movement.
This agreement between VENC MRI and DCS is encoura-ging, as one of the major advantages of DCS is its portability.Thus, by contrast to the sporadic CBF measures provided byphase encoded velocity mapping MRI, these results suggestDCS may be employed to accurately assess relative changesin CBF in a continuous fashion at the patient’s bedside. DCSmay be a particularly attractive option for critically ill patientswho are difficult to transport safely to an MRI, patientswho are unable to have an MRI due to metallic implants,and patients who would benefit from continuous CBFmonitoring.
A priori we would not expect changes in aortic flow due tohypercapnia to accurately represent microvascular CBF changesseen with DCS, thus, the weak correlation observed betweenDCS and aortic flow is readily explained. Aortic blood flowrepresents systemic blood flow, flow to both the brain andthe body. Since CBF represents only one portion of the totalcardiac output, we should expect the fractional change inCBF from the aorta during hypercapnia to be dependent on cer-ebrovascular reactivity as well as the geometry of the aortic archand its branches. Total flow changes to both body and brainshould match total aortic flow changes, however, the individualcomponents of brain and body flows alone will not necessarilytrack aortic flow changes as not all tissues respond to CO2 in auniform way.
A handful of publications have studied the cerebral hemody-namic effects of hypercapnia on patients with congenital heart
Table 2 Median (interquartile range) baseline values followed by median (interquartile range) changes due to hypercapnia, and p-values obtained byWilcoxon signed rank test.
Source Variable Baseline Change due to CO2 p-value
Arterial blood gas pH 7.39 (0.04) −0.18 (0.08) <0.001
pCO2 39 (6) mmHg þ31 (14) mmHg <0.001
EKG Heart rate 109 (21) bpm þ14 (13) bpm <0.001
Cuff Mean arterial pressure 60 (10) mmHg þ4 (20) mmHg 0.002
Transcutaneous SpO2 82 (10)% þ1 (6)% 0.40
Velocity mapping MRI BFAorta 3.05 ð0.93Þ L∕min þ126.2 (26.6)% <0.001
BFJugular 0.78 ð0.50Þ L∕min þ141.0 (46.4)% <0.001
BFSVC 0.99 ð0.42Þ L∕min þ135.5 (49.0)% <0.001
CVR-Aorta — þ1.0 ð1.0Þ%∕mmHg <0.001
CVR-Jug. — þ1.4 ð3.0Þ%∕mmHg <0.001
CVR-SVC — þ1.3 ð2.5Þ%∕mmHg <0.001
DCS CBF — þ148.5 (42.8)% <0.001
CVR — þ1.8 ð2.0Þ%∕mmHg 0.001
DOS Hb — −1.3 (5.4) μM 0.07
HbO2 — þ12.1 (5.1) μM <0.001
THC — þ10.1 (8.0) μM <0.001
Buckley et al.: Validation of diffuse correlation spectroscopic measurement : : :
Journal of Biomedical Optics 037007-5 March 2012 • Vol. 17(3)
defects.11,33–36 Durduran et al.11 measured a mean, cerebrovas-cular reactivity due to increased CO2 of 3.1%∕mmHg inneonates with congenital heart defects using DCS. The popula-tion studied in this work was considerably older than theneonates previously studied, ranging in age from 3 months to5 years old. In our population, we found a slightly lowermean CO2 reactivity of 1.8%∕mmHg. Fogel et al.36 studiedolder CHD patients with VENC-MRI during hypercapnia,mean age of 2.2 years. They found a mean increase in jugularflows of 230% with a mean change in pCO2 of 23 mmHg indi-cating a cerebrovascular reactivity of approximately5%∕mmHg. Our results fall within the published values forthis patient population of infants with congenital heart defects.
4.1 Optical Approximations
Due to limitations in probe size, we were restricted to a singlesource-detector separation for DOS measurements. Thus, themodified Beer-Lambert law was used to quantify changes in
the absorption coefficient and changes in oxy- and deoxy-hemoglobin. However, assumptions are required to employthe modified Beer-Lambert Law. In particular, it is assumedthat Δμa is small relative to its baseline value and we assumethat μ 0
s remains constant. These assumptions appear to bevalid in the present experiment. On average, Δμa at 786 nmwas 0.015 cm−1, a change of approximately 15% ofthe presumed baseline value of Δμa ¼ 0.1 cm−1 at 786 nm.Similar results were found for 688 and 826 nm. Additionally,although μ 0
s was not explicitly measured in this experiment,we feel justified in assuming μ 0
s does not change due to hyper-capnia.37 Red blood cells contribute very little to the total cellvolume of brain tissue, thus the majority of light scatteringevents are most likely due to mitochondria and other organellesas well as cell nuclei.38,39 Thus, even if the blood volumeincreases substantially due to hypercapnia, this increasewould have a small effect on the net scattering coefficient.
To fit the DCS data for a blood flow index, we assumedinitial values for the absorption and reduced scattering coeffi-cients, μa and μ 0
s . Because we are only interested in relativechanges in the BFI, our choice of initial μa and μ 0
s has littleto no effect on the resulting value of rCBF. However, changesfrom these initial values of μa and μ 0
s that occur during the dura-tion of the study may influence the magnitude of rCBF. Thus,we incorporated changes in μa obtained with DOS into our fit-ting procedure for BFI. However, as mentioned previously, ourDOS analysis assumed that the scattering coefficient remainedconstant during the duration of the study. This assumption ismost likely valid for hypercapnia. If false, a 10% increase inthe scattering coefficient could alter the magnitude of rCBFby approximately 20%. Thus, future work would benefit greatlyfrom the use of multiple source detector DOS amplitude andphase measurements used to continuously quantify μa and μ 0
s .We have anatomical brain images of each patient, and we
computed the mean skull/scalp/CSF thickness underneath ouroptical probe to be 0.81 cm. Because of the 2.5 cm source-detec-tor separations used for both DOS and DCS, photons travel onaverage a depth of 1 cm into the tissue. Thus, we are confidentthe optical measurements are probing the surface of the cortex.However, in the future, DCS quantification of rCBF can befurther improved. A semi-infinite model was used to fit DCSdata and the fits were restricted to the early delay times, whereing2ðτÞ > 1.2, to isolate contributions from photons penetratingdeeply into tissue. As known from the anatomical scans, thismodel greatly simplifies the head geometry of these patients.In reality, the scalp, skull, cerebral spinal fluid, grey matter,and white matter possess different optical properties that canbe accounted for in Monte Carlo simulations of light propaga-tion.40–42 Although the semi-infinite model can be improvedupon, it provides a sufficient approximation for this pilot study.
Fig. 3 (Top) Changes in blood flow (rBF) measured with velocity map-ping MRI in the jugular veins (left), superior vena cava (middle), andaorta (right) compared to rCBFDCS. The solid line represents the best-fitline to the data, while the dashed line indicates the line of perfect con-cordance. The grey ribbon denotes the 95% confidence interval forthe mean rCBFDCS. (Bottom) Bland-Altman plots of the difference inrBF, measured with VENC-MRI, and rCBF, measured with DCS, versusthe mean of these parameters. Solid horizontal lines indicate the meandifference between each VENC parameter and rCBF measured withDCS, while the dotted lines indicate the 95% limits of agreement.
Table 3 Summary of concordance correlation coefficients (CCC) and bias correction factor, along with the estimated slope and intercept for a linearregression between DCS measures of rCBF and phase encoded velocity mapping rBF and the adjusted R2 and p-values.
Site CCC Bias correction Slope estimate (95% CI) Intercept estimate (95% CI) [%] R, p-value
Jugular veins 0.87 1.00 0.91 (0.75, 1.05) 15.3 (−9.1, 39.7) 0.88, p < 0.001
Superior vena cava 0.74 0.95 0.99 (0.74, 1.23) 11.4 (−25.9, 48.6) 0.77, p < 0.001
Aorta 0.20 0.42 1.77 (0.72, 2.51) −62.2 (−159.1, 66.8) 0.46, p < 0.001
Buckley et al.: Validation of diffuse correlation spectroscopic measurement : : :
Journal of Biomedical Optics 037007-6 March 2012 • Vol. 17(3)
4.2 MRI Assumptions
VENCMRI is a very accurate technique that does not depend onassumptions of flow profiles. Nevertheless, eddy currents andhigher order Maxwell terms can introduce errors into the mea-surements. In addition, if a blood vessel is tortuous, flow maynot be perpendicular to the imaging plane and this may intro-duce errors as well. Finally, partial volume effects will averageout velocities in a given voxel, decreasing the accuracy of themeasurement. In our study, eddy currents and Maxwell termswere minimized and the authors took great pains to ensurethe imaging plane was perpendicular to flow. The dimensionsof our VENC MRI images were 1 × 1 × 5 mm, which waswell within accepted norms. Prior to each MRI scan, phantomswere used to calibrate the system.
5 ConclusionIn this paper, we demonstrate a highly significant correlationbetween measures of relative changes in cerebral blood flowderived with diffuse correlation spectroscopy and relativechanges in blood flow in the common jugular veins and superiorvena cava in pediatric patients with congenital heart defects.This agreement further strengthens the promise of DCS as anaccurate and non-invasive modality for continuous CBF moni-toring at the bedside.
AcknowledgmentsThis work would not have been possible without the help ofthe following people: Peter Schwab, Ellen Foster, WesleyBaker, Steven Schenkel, Varsha Jain, Justine Wilson, MatthewHarris, Cardiac Anesthesia staff, and, most importantly, thepatients and their families. This work was supported by theNIH (NS-052380, NS-060653, RR-002305, HL090615,T32NS007413), by the Dana Foundation, and by the Steveand Judy Wolfson Family Trust.
References1. M. Wintermark et al., “Comparative overview of brain perfusion
imaging techniques,” Stroke 36(9), E83–E99 (2005).2. K. D. Liem and G. Greisen, “Monitoring of cerebral haemodynamics in
newborn infants,” Early Hum. Develop. 86(3), 155–158 (2010).3. K. K. Galli et al., “Periventricular leukomalacia is common after neo-
natal cardiac surgery,” J. Thorac. Cardiovasc. Surg. 127(3), 692–704(2004).
4. D. J. Licht et al., “Brain maturation is delayed in infants with complexcongenital heart defects,” J. Thorac. Cardiovasc. Surg. 137(3), 529–537(2009).
5. D. B. Andropoulos et al., “Brain immaturity is associated with braininjury before and after neonatal cardiac surgery with high-flow bypassand cerebral oxygenation monitoring,” J. Thorac. Cardiovasc. Surg.139(3), 543–556 (2010).
6. G. Maret and P. Wolf, “Multiple light scattering from disordered media.The effect of Brownian motion of scatterers,” Zeitschrift für Physik BCondensed Matter 65(4), 409–413 (1987).
7. D. A. Boas et al., “Detection and characterization of optical inhomo-geneities with diffuse photon density waves: a signal-to-noise analysis,”Appl. Opt. 36(1), 75–92 (1997).
8. D. J. Pine et al., “Diffusing wave spectroscopy,” Phys. Rev. Lett. 60(12),1134–1137 (1988).
9. D. A. Boas, L. E. Campbell, and A. G. Yodh, “Scattering and imagingwith diffusing temporal field correlations,” Phys. Rev. Lett. 75(9), 1855–1858 (1995).
10. C. Cheung et al., “In vivo cerebrovascular measurement combiningdiffuse near-infrared absorption and correlation spectroscopies,”Phys. Med. Biol. 46(8), 2053–2065 (2001).
11. T. Durduran et al., “Optical measurement of cerebral hemodynamicsand oxygen metabolism in neonates with congenital heart defects,”J. Biomed. Opt. 15(3), 037004 (2010).
12. M. N. Kim et al., “Noninvasive measurement of cerebral blood blowand blood oxygenation using near-infrared and diffuse correlationspectroscopies in critically brain-injured adults,” Neurocrit. Care12(2), 173–180 (2010).
13. C. Zhou et al., “Diffuse optical monitoring of hemodynamics in pigletbrain with head trauma injury,” J. Biomed. Opt. 14(3), 034015(2009).
14. T. Durduran et al., “Diffuse optical measurement of blood flow, bloodoxygenation, and metabolism in a human brain during sensorimotor cor-tex activation,” Opt. Lett. 29(15), 1766–1768 (2004).
15. G. Dietsche et al., “Fiber-based multispeckle detection for time-resolveddiffusing-wave spectroscopy: characterization and application to bloodflow detection in deep tissue,” Appl. Opt. 46(35), 8506–8514(2007).
16. M. Diop et al., “Calibration of diffuse correlation spectroscopy witha time-resolved near-infrared technique to yield absolute cerebralblood flow measurements,” Biomed. Opt. Express 2(7), 2068–2081(2011).
17. E. M. Wilson, J. H. Halsey, Jr., and J. J. Vitek, “Validation of jugularvenous flow as an index of total cerebral blood flow,” Stroke 3(3),300–321 (1972).
18. J. S. Meyer et al., “Quantitative measurement of cerebral bloodflow with electromagnetic flowmeters: recording internal jugularvenous flow of monkey and man,” Trans. Am. Neurol. Assoc. 88,78–83 (1963).
19. D. J. Bryant et al., “Measurement of flow with NMR imaging using agradient pulse and phase difference technique,” J. Comput. Assist.Tomogr. 8(4), 588–593 (1984).
20. C. L. Dumoulin and H. R. Hart, “Magnetic resonance angiography,”Radiology 161(3), 717–720 (1986).
21. N. J. Pelc et al., “Quantitative magnetic-resonance flow imaging,”Magn. Reson. Quart. 10(3), 125–147 (1994).
22. D. T. Delpy et al., “Estimation of optical pathlength through tissuefrom direct time of flight measurement,” Phys. Med. Biol. 33(12),1433–1442 (1988).
23. S. Fantini et al., “Non-invasive optical monitoring of the newborn pigletbrain using continuous-wave and frequency-domain spectroscopy,”Phys. Med. Biol. 44(6), 1543–1563 (1999).
24. T. Durduran et al., “Diffuse optics for tissue monitoring and tomogra-phy,” Rep. Progr. Phys. 73(7), 43 (2010).
25. A. Duncan et al., “Measurement of cranial optical path length as a func-tion of age using phase resolved near infrared spectroscopy,” Pediatr.Res. 39(5), 889–894 (1996).
26. J. Bruce and R. P. Berne, Dynamic Light Scattering: With Applicationsto Chemistry, Biology, and Physics, Courier Dover Publications, Mine-ola, NY (2000).
27. J. Zhao et al., “In vivo determination of the optical properties of infantbrain using frequency-domain near-infrared spectroscopy,” J. Biomed.Opt. 10(2), 024028 (2005).
28. F. Wilcoxon, “Individual comparisons by ranking methods,” BiometricsBulletin 1(6), 80–83 (1945).
29. R Development Core Team, R: A Language and Environment for Sta-tistical Computing, (2011), R Foundation for Statistical Computing.
30. L. I. Lin, “A concordance correlation-coefficient to evaluate reproduci-bility,” Biometrics 45(1), 255–268 (1989).
31. H. Ito et al., “Changes in human cerebral blood flow and cerebral bloodvolume during hypercapnia and hypocapnia measured by positron emis-sion tomography,” J. Cerebr. Blood FlowMetab. 23(6), 665–670 (2003).
32. E. Rostrup et al., “Regional differences in the CBF and BOLDresponses to hypercapnia: a combined PET and fMRI study,” Neuro-image 11(2), 87–97 (2000).
33. S. Tabbutt et al., “Impact of inspired gas mixtures on preoperativeinfants with hypoplastic left heart syndrome during controlled ventila-tion,” Circulation 104(12), I159–I164 (2001).
34. C. Ramamoorthy et al., “Effects of inspired hypoxic and hypercapnicgas mixtures on cerebral oxygen saturation in neonates withuniventricular heart defects,” Anesthesiology 96(2), 283–288 (2002).
35. K. Toiyama et al., “Changes in cerebral oxygen saturation and bloodflow during hypoxic gas ventilation therapy in HLHS and CoA/IAA
Buckley et al.: Validation of diffuse correlation spectroscopic measurement : : :
Journal of Biomedical Optics 037007-7 March 2012 • Vol. 17(3)

complex with markedly increased pulmonary blood flow,” Circul. J. 74(10), 2125–2131 (2010).
36. M. A. Fogel et al., “Brain versus lung: hierarchy of feedback loops insingle-ventricle patients with superior cavopulmonary connection,”Circulation 110(11), II147–II152 (2004).
37. M. Diop, “Calibration of diffuse correlation spectroscopy witha time-resolved near-infrared technique to yield absolute cerebralblood flow measurements,” Biomed. Opt. Express 2, 2068–2081(2011).
38. J. R. Mourant et al., “Predictions and measurements of scattering andabsorption over broad wavelength ranges in tissue phantoms,” Appl.Opt. 36(4), 949–957 (1997).
39. J. R. Mourant et al., “Mechanisms of light scattering from biologicalcells relevant to noninvasive optical-tissue diagnostics,” Appl. Opt.37(16), 3586–3593 (1998).
40. L. H. Wang, S. L. Jacques, and L. Q. Zheng, “MCML—Monte Carlomodeling of light transport in multilayered tissues,” Comput. Meth. Pro-gram Biomed. 47(2), 131–146 (1995).
41. L. Gagnon et al., “Investigation of diffuse correlation spectroscopy inmulti-layered media including the human head,” Opt. Express 16(20),15514–15530 (2008).
42. D. Boas et al., “Three dimensional Monte Carlo code for photon migra-tion through complex heterogeneous media including the adult humanhead,” Opt. Express 10(3), 159–170 (2002).
Buckley et al.: Validation of diffuse correlation spectroscopic measurement : : :
Journal of Biomedical Optics 037007-8 March 2012 • Vol. 17(3)