Validation study of a pulsed arterial spin labeling technique by comparison to perfusion computed...
11
Validation study of a pulsed arterial spin labeling technique by comparison to perfusion computed tomography ☆ Adrian M. Koziak a,b , Jeff Winter a,b , Ting-Yim Lee a,b,c , R. Terry Thompson a,b,c , Keith S. St. Lawrence a,b,c, ⁎ a Lawson Health Research Institute, University of Western Ontario, London, Ontario, Canada N6A 4V2 b Department of Medical Biophysics, University of Western Ontario, London, Ontario, Canada N6A 4V2 c Department of Nuclear Medicine and Diagnostic Radiology, University of Western Ontario, London, Ontario, Canada N6A 4V2 Received 23 March 2007; revised 15 August 2007; accepted 8 October 2007 Abstract Abnormalities in cerebral blood flow (CBF) are believed to play a significant role in the development of major neonatal neuropathologies. One approach that would appear ideal for measuring CBF in this fragile age group is arterial spin labeling (ASL) since ASL techniques are noninvasive and quantitative. The purpose of this study was to assess the accuracy of a pulsed ASL method implemented on a 3-T scanner dedicated to neonatal imaging. Cerebral blood flow was measured in nine neonatal piglets, the ASL– CBF measurements were acquired at two inversion times (TI) (1200 and 1700 ms), and CBF was measured by perfusion computed tomography (pCT) for validation. Perfusion CT also provided images of cerebral blood volume, which were used to identify large blood vessels, and contrast arrival time, which were used to assess differences in arterial transit times between gray and white matter. Good agreement was found between gray matter CBF values from pCT (76±1 ml/min per 100 g) and ASL at TI=1700 ms (73±1 ml/ min per 100 g). At TI=1200 ms, ASL overestimated CBF (91±2 ml/min per 100 g), which was attributed to substantial intravascular signal. No significant differences in white matter CBF from pCT and ASL were observed (average CBF=60±1 ml/min per 100 g), nor was there any difference in contrast arrival times for gray and white matter (0.95±0.04 and 0.99±0.03 s, respectively), which suggests that the arterial transit times for ASL were the same in this animal model. This study verified the accuracy of the implemented ASL technique and showed the value of using pCT to study other factors that can affect ASL–CBF measurements. © 2008 Elsevier Inc. All rights reserved. Keywords: Cerebral blood flow; Cerebral perfusion; Arterial spin labeling; Perfusion computed tomography; Piglets validation study 1. Introduction Magnetic resonance imaging (MRI) is becoming the imaging modality of choice for assessing neonatal brain injury and understanding how these injuries affect subse- quent brain development [1,2]. It is ideally suited for neonates because MRI is safe and provides excellent tissue contrast, and the continuing development of novel imaging techniques, such as diffusion tractography, is increasing the wealth of information that can be obtained. A limitation with current MRI techniques that have been applied to neonates is the lack of a suitable method for measuring cerebral blood flow (CBF), even though CBF disturbances play significant roles in major neonatal neuropathologies, including hypoxia- ischemia, intraventricular hemorrhage and periventricular leukomalacia [3]. Furthermore, it has been shown using nuclear medicine techniques that regional CBF changes dynamically throughout brain development due to the coupling of CBF to cerebral energy demands [4,5]. An MRI-based technique for measuring CBF would provide complementary functional information to the measures of maturation, such as relaxation times, that are currently used in MRI studies [6]. Available online at www.sciencedirect.com Magnetic Resonance Imaging 26 (2008) 543 – 553 ☆ This research was supported by grants from the Lawson Health Research Institute, the Ontario Research and Development Fund and the Ontario Ministry of Training, Colleges and Universities. ⁎ Corresponding author. Lawson Health Research Institute, St. Joseph's Health Care London, London, Ontario, Canada N6A 4V2. Tel.: +1 519 646 6000x65737; fax: +1 519 646 6110. E-mail address: [email protected] (K.S. St. Lawrence). 0730-725X/$ – see front matter © 2008 Elsevier Inc. All rights reserved. doi:10.1016/j.mri.2007.10.005
Transcript of Validation study of a pulsed arterial spin labeling technique by comparison to perfusion computed...
Available online at www.sciencedirect.com
ng 26 (2008) 543–553
Magnetic Resonance ImagiValidation study of a pulsed arterial spin labeling technique by comparisonto perfusion computed tomography☆
Adrian M. Koziaka,b, Jeff Wintera,b, Ting-Yim Leea,b,c,R. Terry Thompsona,b,c, Keith S. St. Lawrencea,b,c,⁎
aLawson Health Research Institute, University of Western Ontario, London, Ontario, Canada N6A 4V2bDepartment of Medical Biophysics, University of Western Ontario, London, Ontario, Canada N6A 4V2
cDepartment of Nuclear Medicine and Diagnostic Radiology, University of Western Ontario, London, Ontario, Canada N6A 4V2
Received 23 March 2007; revised 15 August 2007; accepted 8 October 2007
Abstract
Abnormalities in cerebral blood flow (CBF) are believed to play a significant role in the development of major neonatalneuropathologies. One approach that would appear ideal for measuring CBF in this fragile age group is arterial spin labeling (ASL)since ASL techniques are noninvasive and quantitative. The purpose of this study was to assess the accuracy of a pulsed ASL methodimplemented on a 3-T scanner dedicated to neonatal imaging. Cerebral blood flow was measured in nine neonatal piglets, the ASL–CBF measurements were acquired at two inversion times (TI) (1200 and 1700 ms), and CBF was measured by perfusion computedtomography (pCT) for validation. Perfusion CT also provided images of cerebral blood volume, which were used to identify largeblood vessels, and contrast arrival time, which were used to assess differences in arterial transit times between gray and white matter.Good agreement was found between gray matter CBF values from pCT (76±1 ml/min per 100 g) and ASL at TI=1700 ms (73±1 ml/min per 100 g). At TI=1200 ms, ASL overestimated CBF (91±2 ml/min per 100 g), which was attributed to substantial intravascularsignal. No significant differences in white matter CBF from pCT and ASL were observed (average CBF=60±1 ml/min per 100 g), norwas there any difference in contrast arrival times for gray and white matter (0.95±0.04 and 0.99±0.03 s, respectively), which suggeststhat the arterial transit times for ASL were the same in this animal model. This study verified the accuracy of the implemented ASLtechnique and showed the value of using pCT to study other factors that can affect ASL–CBF measurements.© 2008 Elsevier Inc. All rights reserved.
Keywords: Cerebral blood flow; Cerebral perfusion; Arterial spin labeling; Perfusion computed tomography; Piglets validation study
1. Introduction
Magnetic resonance imaging (MRI) is becoming theimaging modality of choice for assessing neonatal braininjury and understanding how these injuries affect subse-quent brain development [1,2]. It is ideally suited forneonates because MRI is safe and provides excellent tissuecontrast, and the continuing development of novel imaging
☆ This research was supported by grants from the Lawson HealthResearch Institute, the Ontario Research and Development Fund and theOntario Ministry of Training, Colleges and Universities.
⁎ Corresponding author. Lawson Health Research Institute, St. Joseph'sHealth Care London, London, Ontario, Canada N6A 4V2. Tel.: +1 519 6466000x65737; fax: +1 519 646 6110.
E-mail address: [email protected] (K.S. St. Lawrence).
0730-725X/$ – see front matter © 2008 Elsevier Inc. All rights reserved.doi:10.1016/j.mri.2007.10.005
techniques, such as diffusion tractography, is increasing thewealth of information that can be obtained. A limitation withcurrent MRI techniques that have been applied to neonates isthe lack of a suitable method for measuring cerebral bloodflow (CBF), even though CBF disturbances play significantroles in major neonatal neuropathologies, including hypoxia-ischemia, intraventricular hemorrhage and periventricularleukomalacia [3]. Furthermore, it has been shown usingnuclear medicine techniques that regional CBF changesdynamically throughout brain development due to thecoupling of CBF to cerebral energy demands [4,5]. AnMRI-based technique for measuring CBF would providecomplementary functional information to the measures ofmaturation, such as relaxation times, that are currently usedin MRI studies [6].
544 A.M. Koziak et al. / Magnetic Resonance Imaging 26 (2008) 543–553
One approach for assessing CBF with MRI is dynamicsusceptibility contrast-enhanced MRI, which generatesperfusion-weighted images by tracking the passage of anintravascular contrast agent [7]. This method has beenapplied to neonatal studies, for example, to detect perfusionabnormalities in infants suspected of ischemic brain injury[8]. A limitation to contrast-enhanced MRI is that onlyrelative CBF images are obtained due to issues regarding thelinearity of the signal change and the need for anindependently measured proportionality constant to convertthe signal into units of contrast agent concentration [9,10]. Asa result, this approach would not be suitable for serial studiesof cerebral vascular abnormalities and their effects on braindevelopment. An alternative MRI approach for measuringCBF is arterial spin labeling (ASL), which generates imagesof CBF by magnetically labeling endogenous water in thearterial blood flowing into the brain [11,12]. Since it iscompletely noninvasive and, in principle, can measureabsolute CBF, it would appear to be well suited for neonatalimaging. Initial studies have used ASL to detect CBF defectsin infants suspected of brain injury and those with congenitalheart defects [13,14]. However, there are a number ofpotential problems with ASL that can affect the accuracy ofthe CBF measurements. These include transit time effects,i.e., uncertainties regarding when labeled water arrives in thetissue; vascular artifacts, i.e., labeled water that remains in thevasculature and limitedwater extraction into brain tissue [12].
A number of validation studies, which consisted ofcomparing ASL measurements of CBF to measurementsobtained with established methods, have been conducted.The accuracy of the CBF measurements has varieddepending on the specifics of the labeling methodsimplemented and/or the species studied [15–19]. Forexample, in humans, ASL measurements of basal CBF ingray matter were in good agreement with measurementsobtained by positron emission tomography [17]. However,ASL underestimated white matter CBF, which was attributedto the substantially longer transit times compared to graymatter. In contrast, ASL was found to consistently over-estimate CBF in rats when compared to measurementsobtained by 14C-iodoantipyrine autoradiography [16]. Inpart, the variation between these studies can be explained bythe different labeling strategies implemented; however, thevariation also highlights the importance of performingvalidation studies when implementing an ASL technique.
The purpose of this work was to validate CBF measure-ments obtained with an ASL technique implemented on ashort-bore, 3-T MRI scanner dedicated to neonatal imaging[20,21]. To reduce motion artifacts, which are a significantchallenge to neonatal imaging, a pulsed ASL technique thatuses multiple inversion pulses to suppress static backgroundsignal was implemented [22,23]. Experiments were con-ducted using a neonatal animal model (piglets) andvalidation was performed by independently measuringCBF with perfusion computed tomography (pCT) [24].Perfusion CT was chosen because it provides quantitative
high-resolution images of CBF, the cerebral blood volume(CBV), and the contrast arrival time (T0). The T0 maps wereused as an independent method for assessing differences inthe arterial transit times for gray and white matter.
2. Methods
2.1. Animal preparation
The study was approved by the Council on Animal Care–Animal Use Subcommittee at the University of WesternOntario. Experiments were performed on Duroc piglets (2–4 days old) obtained from a local supplier on the morning ofthe experiment. Piglets were anesthetized with isoflurane(3–4% during preparatory surgery and 1.5–1.75% duringthe experiment), tracheotomized and mechanically venti-lated on an oxygen/medical air mixture. Catheters wereinserted into a belly vein for computed tomographic (CT)contrast injection and into a femoral artery to continuouslymonitor blood pressure and to collect samples for blood gasand glucose measurements.
After the surgical procedure, piglets were placed prone ona custom-built sled with their heads secured in place. Afudicial marker (a 1.5-cm diameter vial containing water)was securely placed on the piglet's head to match the slicelocations in the MRI and CT scans. Physiological para-meters, including arterial oxygen tension (PaO2), arterialcarbon dioxide tension (PaCO2), pH, heart rate, bloodglucose, temperature and mean arterial blood pressure weremonitored throughout the experiment. The temperature wasmaintained between 37.5°C and 38.5°C by a heatedrecirculating water pad. Arterial CO2 tension was maintainedat a constant level by adjusting the ventilation rate.
2.2. Validation protocol
Cerebral blood flow was measured using the MRI andCT techniques in nine piglets (age 3.1±0.7 days, weight1.6±0.2 kg). Each experiment began with the acquisition ofhigh-resolution anatomical magnetic resonance (MR)images. Functional images were obtained with an echoplanar imaging (EPI) sequence from 4 coronal slices throughthe piglet's head. First, a series of T1-weighted images wereacquired with the inversion time (TI) ranging from 25 to3500 ms. Second, proton density (M0) images were collectedusing a repetition time (TR) of 7 s. Third, two seriesof perfusion-weighted (ΔM) images were acquired atTI=1200 ms, denoted ASL1200, and at TI=1700 ms, denotedASL1700. These images were acquired using a backgroundsuppression pulsed ASL technique, which is described inmore detail in the section MRI techniques. Two TI valueswere chosen to assess the effects of different arterial/tissueweightings on the accuracy of the CBF measurements [25].One hundred ΔM images were collected for ASL1200 and150 ΔM images for ASL1700 with TR=3 s for both series.The number of acquisitions was less for ASL1200 in order tokeep the total scanning time to less than 2.5 h. The piglet,
545A.M. Koziak et al. / Magnetic Resonance Imaging 26 (2008) 543–553
while remaining on the sled, was carefully transported to theCT facility, which was located on the same floor at the MRscanner. The pCT data were acquired at the same PaCO2
value as during the ASL imaging. If necessary, the ventilationrate was adjusted until the target PaCO2 was achieved. Thetypical length of time between the end of the MR session andthe acquisition of the pCT images was 30 min.
2.3. Arterial transit time protocol
The mean arterial transit time, τa, was measured in sixadditional piglets (age 1.4±1 day, weight 1.63±0.22 kg). Thesurgical and MRI imaging protocols were similar to thevalidation protocol, with the following minor alterations.First, PaCO2 was maintained between 39 and 41 mmHg in allpiglets to ensure similar CBF values across experiments.Second, a series of 50 ΔM images were collected at nine TIvalues (400, 600, 800, 1000, 1200, 1600, 2000, 2500 and3000 ms). The TR was adjusted such that the relaxation timebetween inversions was constant. Third, background sup-pression was not used in these experiments due to thevariable TI, and finally, no CT data were acquired.
2.4. MRI techniques
All MR experiments were performed on a 3.0 T dual-channel, custom-built imaging spectroscopy systemdesigned for imaging studies of infants. The short-boremagnet (length, 135 cm) was equipped with asymmetricgradients with a gradient clear bore of 379 mm and amaximum gradient strength of 40 mT/m. Piglets wereimaged in a 274-mm diameter quadrature birdcage coil,which is the same coil used for neonatal studies [21].
Anatomical MR images were collected using a standardtwo-dimensional (2D), spin-echo sequence with the followingparameters: matrix size=256×256, slice thickness=4.25 mm,slice separation=0.75 mm, echo time (TE)=20 ms, TR=1000 ms, and FOV=96 mm. A four-segment, 2D gradient-echo EPI technique was used to collect the T1-weighted, M0
and ΔM images. Images were obtained with a matrixsize=48×48, FOV=96 mm, acquisition bandwidth=100 kHz,slice thickness=4.25 mm, slice separation=0.75 mm andTE=13 ms.
The multislice, background-suppressed, pulsed ASLsequence was based on flow-sensitive alternating inversionrecovery (FAIR) [26]. It consisted of a labeling pulse thatalternated between slab-selective (45 mm width) and globalinversion. The TI values used in the validation and arterialtransit time protocols referred to the time between theinversion pulse and the beginning of the multislice EPIacquisition sequence. To suppress the static water signal inthe imaging slab (i.e., background suppression), the ASLsequence included a series of five saturation pulses (36-mmwidth), which were applied immediately after the arteriallabeling pulse, and two global inversion pulses, which areapplied during the labeling period [22,23]. The backgroundsuppression pulses were applied during the TI period for
both the control and labeled images. For the two labelingdurations used in the validation studies, the timings of thebackground suppression inversion pulses were TIBS1=662and TIBS2=1439 ms for ASL1700 and TIBS1=350 andTIBS2=950 ms for ASL1200. For each TI value, it wasnecessary to change the timings of TIBS1 and TIBS2 to ensurethat the image acquisition occurred around the null point ofthe static water signal. To define the duration of the labelingperiod, a saturation pulse (35 mm in width) was appliedproximal to the imaging slices 800 ms after the arteriallabeling pulse [27].
2.5. MRI analysis
All inhouse image analysis software was written inMatlab (The MathWorks, Natick, MA, USA) unlessotherwise specified. To improve the signal-to-noise ratio,all images were convolved with a 2D Gaussian filter with a5-mm full width at half maximum. Images of T1 wereobtained by a numerical fit of the Bloch equation to theinversion recovery data. To calculate CBF, pairwisesubtraction was used to generate a series of ΔM images.These images were scaled by the M0 images obtained fromthe EPI sequence with a TR of 7 s (see Validation protocol).The CBF images were generated from the mean ΔM/M0
images using the following equations [22,28].
DMðtÞM0
¼ � 2akd CBFde�R1adTI
� 1� e�DR1dðTI�sÞ� �DR
þ s� sað Þ" #
; ð1AÞ
for τa≤TI≤τa+d.
DMðtÞM0
¼ � 2akd CBFde�R1adTI
� 1� e�DR1dðTI�sÞ� �DR
þ sþ d � TIð Þ" #
; ð1BÞ
for τa+d≤TIbτ+d.In these equations, R1b is the water relaxation rate in
brain tissue (1/T1), R1a the water relaxation rate in blood(1/T1a=0.677 s−1) [29], ΔR1=R1a−R1b, λ is the partitioncoefficient of water (0.9 ml/g) [30], τa is the measuredarterial transit time, τ is the tissue transit time and is set toτa+500 ms [31] and d is the width of the label period and isdefined as the time between the inversion pulse and thearterial saturation pulse (800 ms). The parameter α is set to.85 and accounts for the loss of labeling signal due toimperfections in the inversion pulses used for backgroundsuppression [22,23].
In Eqs. (1A) and (1B), the first term in the square bracketsis the contribution from labeled water in the braincompartment, and the second term is the contribution fromlabeled water in the arterial compartment. Equation (1A) wasused with the ΔM images acquired at TI=1200 ms, since the
546 A.M. Koziak et al. / Magnetic Resonance Imaging 26 (2008) 543–553
delay after the application of the arterial saturation pulse (i.e.,TI−d) was not sufficient for the trailing edge of the bolus oflabeled blood water to reach the arterial compartment.Equation (1B) was used with the ΔM images acquired atTI=1700 ms. In this case, the delay was sufficient for theentire bolus to reach the arterial compartment, but not longenough for the trailing edge to reach the tissue compartment.
2.6. pCT imaging and registration
All CT experiments were performed on a Discovery LSPET/CT scanner (General Electric Medical Systems, Mil-waukee, WI, USA). Precontrast coronal scans, which wereused for image registration, were prescribed from a lateralscout image and were acquired at the same slice locations atthe MR images. The imaging parameters were as follows:120 kVP, 340 mA, 1 s/rotation, matrix size=512×512, slicethickness=5 mm and FOV=96 mm. Perfusion CT consistedof injecting 2 ml/kg of iodinated contrast agent (Omnipaque300 mg/ml) at a rate of 1 ml/s at the beginning of a 30-s cinescan (80 kVP, 190 mA).
From the serial images, it was possible to determine thearterial and tissue concentrations of contrast agent with atemporal resolution of 1 s. The relationship between the braintissue concentration of contrast agent, Q(t), and the arterialblood concentration of contrast agent,Ca(t), is as follows [32]:
QðtÞ ¼ CBFdRðtÞ � CaðtÞ; ð2Þwhere, � is the convolution operator and R(t) is the impulseresidue function, which is the solution of Q(t) when Ca(t) is adelta function. The General Electric software package CTperfusion 3 was used to generate quantitative maps of CBF,CBVand the contrast arrival time (T0). This package is basedon a deconvolution routine that was developed and validated inour laboratory [24]. DeconvolvingQ(t) and Ca(t) produces theexpression CBF·R(t), from which the height is equal to CBFand the area is equal to CBV.
The CT images were registered to the MR images usingthe software package Regman [33]. Each of the fouranatomical CT images from an individual piglet wasmatched to the corresponding MR anatomical image usinga six landmark, rigid-body registration algorithm. Theregistration matrix was applied to the correspondingfunctional images (CBF, CBV and T0 maps).
2.7. Region of interest analysis
Region of interest (ROI) analysis was used to comparemean CBF in gray and white matter regions from thecorresponding ASL and pCT images. For this analysis, theASL–CBF images were converted from a matrix size of48×48 to the CT matrix size of 512×512 by defining a pixelvalue in the output image by the value of the nearest pixelin the original image. In each slice, three ROIs weremanually placed in cortical gray matter, and two bilateralROIs were placed in white matter, for a total of 20 ROIs perpiglet. A typical example of the locations and sizes of the
ROIs is displayed in Fig. 3 (see Results, Validation study).Gray and white matter regions were delineated using theT1-weighted MR images acquired at TI=800 ms. At thisinversion time, gray matter appeared bright, while whitematter appeared dark. The placement of the ROIs wasconducted using Analyze software (Mayo Medical Ven-tures, Rochester, MN, USA).
A known artifact with any intravascular tracer is thepresence of pixels with extremely high values. Such pixelscontain a substantial blood volume and are typicallyobserved at the sites of penetrating arteries and in vesselson the surface of the brain. To avoid an overestimation ofCBF by pCT, a second set of ROIs were generated byremoving the high-signal vascular pixels from the originalROIs (see Fig. 3B in Results, Validation study). Vascularregions were removed using a CBV threshold of 5 ml/100 gand a cluster size greater than 20 pixels [34]. To distinguishbetween the two sets of ROIs, the original ROI set isdenoted ROIVASC and the ROI set with the vascular regionsremoved is denoted ROIMASK. Both the ASL and pCT CBFimages were analyzed with the two ROI sets.
2.8. Statistical analysis
All data are presented as mean± S.E.M. Statistical analysiswas performed using SPSS 10.1.0 (SPSS Inc, Chicago, IL).Statistical significance was defined as Pb.05. The physiolo-gical variables from theMRI and CTsessions were comparedusing a paired t test including Bonferroni correction formultiple comparisons (n=5). A repeated-measures of analysisof variance (ANOVA) was used to compare CBF measure-ments between techniques. In this analysis, the within-subjectvariable was tissue type, and the between-subject variablewas technique: pCT, ASL1200 and ASL1700. The analysisincluded the two sets of gray andwhite matter regions definedby ROIVASC and ROIMASK. For any significant relationshipsrevealed by the omnibus test, a Student t test (two-tailed) wasperformed including Bonferroni correction (n=6).
A regression analysis was not used to determine thecorrelation between the ASL and pCT measurements ofCBF because multiple measurements were acquired fromeach animal. Instead, a variation of the generalizedestimation equation method was used to account for themultiple data acquired per animal [35]. For each piglet, alinear regression was applied to correlate the CBF datafrom ASL to the corresponding CBF data from pCT. Theaverage of the distribution of regression slopes from theindividual analyses was compared to the null hypothesis(i.e., slope=0) to test if there was any correlation betweenthe pCT and ASL CBF data. The average slope was alsocompared to the line of identity (i.e., slope=1) to assess theagreement between the CBF measurements from the twotechniques. This analysis was conducted at both TI valuesand for both sets of ROIs. Bland–Altman analysis was usedto assess agreement between regional CBF measurementsfrom ASL and pCT. The analysis was performed forASL1200 and ASL1700 using ROIMASK [36].
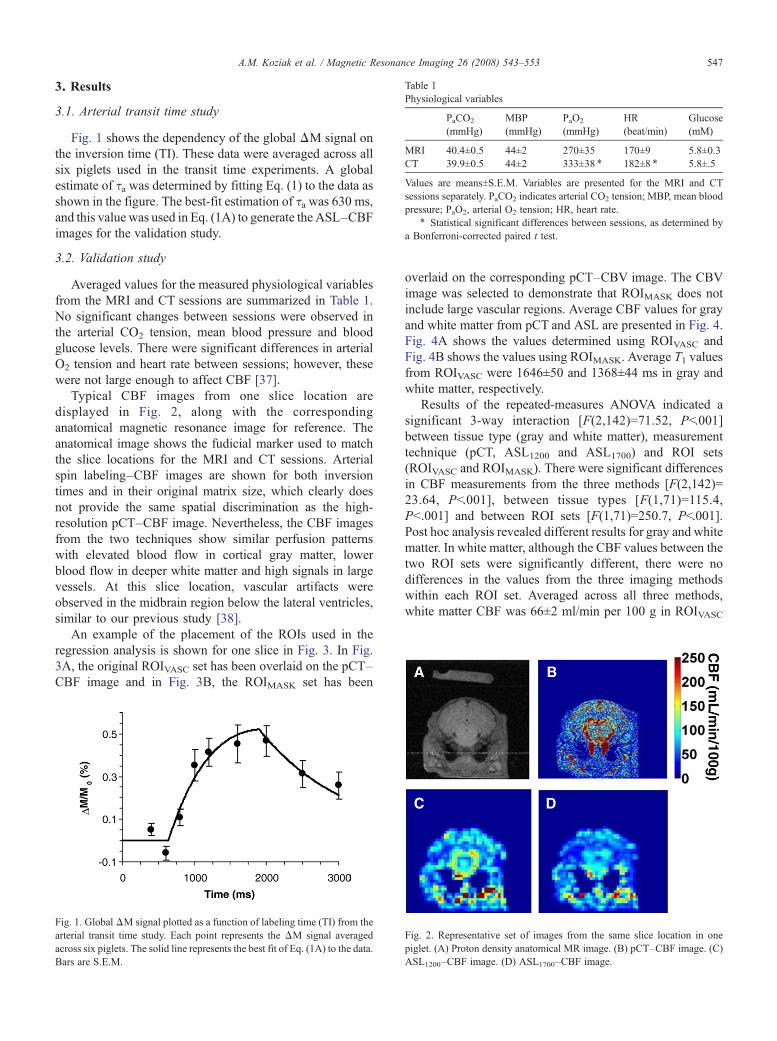
Table 1Physiological variables
PaCO2
(mmHg)MBP(mmHg)
PaO2
(mmHg)HR(beat/min)
Glucose(mM)
MRI 40.4±0.5 44±2 270±35 170±9 5.8±0.3CT 39.9±0.5 44±2 333±38 ⁎ 182±8 ⁎ 5.8±.5
Values are means±S.E.M. Variables are presented for the MRI and CTsessions separately. PaCO2 indicates arterial CO2 tension; MBP, mean bloodpressure; PaO2, arterial O2 tension; HR, heart rate.
⁎ Statistical significant differences between sessions, as determined bya Bonferroni-corrected paired t test.
547A.M. Koziak et al. / Magnetic Resonance Imaging 26 (2008) 543–553
3. Results
3.1. Arterial transit time study
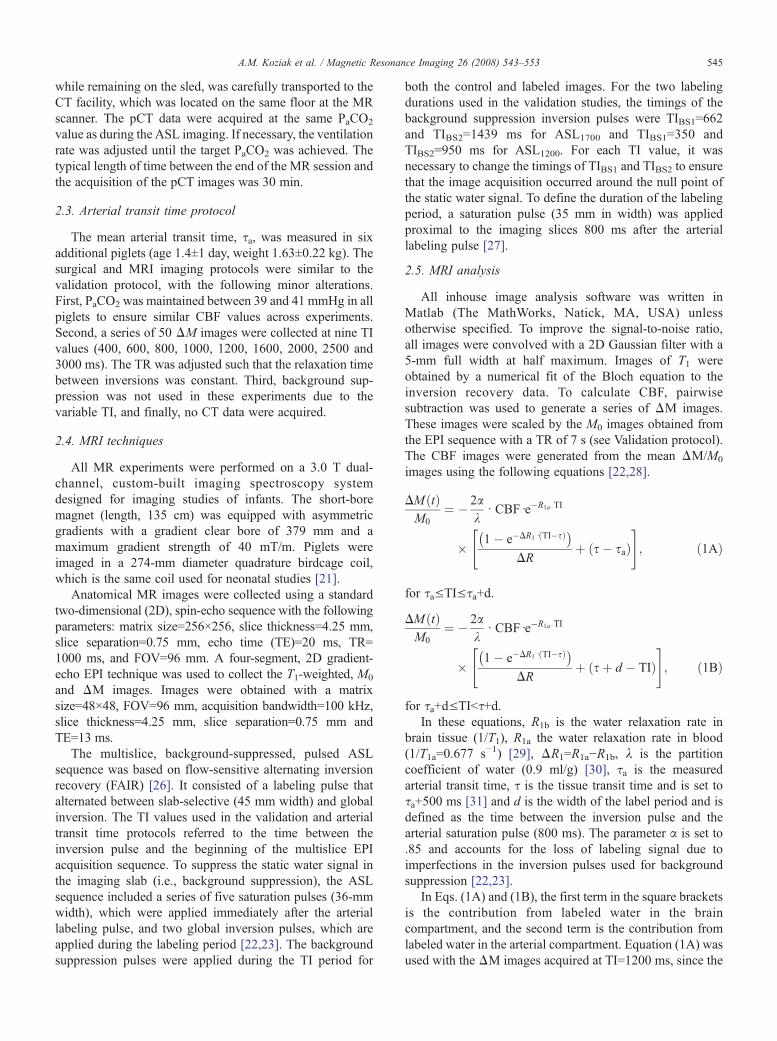
Fig. 1 shows the dependency of the global ΔM signal onthe inversion time (TI). These data were averaged across allsix piglets used in the transit time experiments. A globalestimate of τa was determined by fitting Eq. (1) to the data asshown in the figure. The best-fit estimation of τa was 630 ms,and this value was used in Eq. (1A) to generate the ASL–CBFimages for the validation study.
3.2. Validation study
Averaged values for the measured physiological variablesfrom the MRI and CT sessions are summarized in Table 1.No significant changes between sessions were observed inthe arterial CO2 tension, mean blood pressure and bloodglucose levels. There were significant differences in arterialO2 tension and heart rate between sessions; however, thesewere not large enough to affect CBF [37].
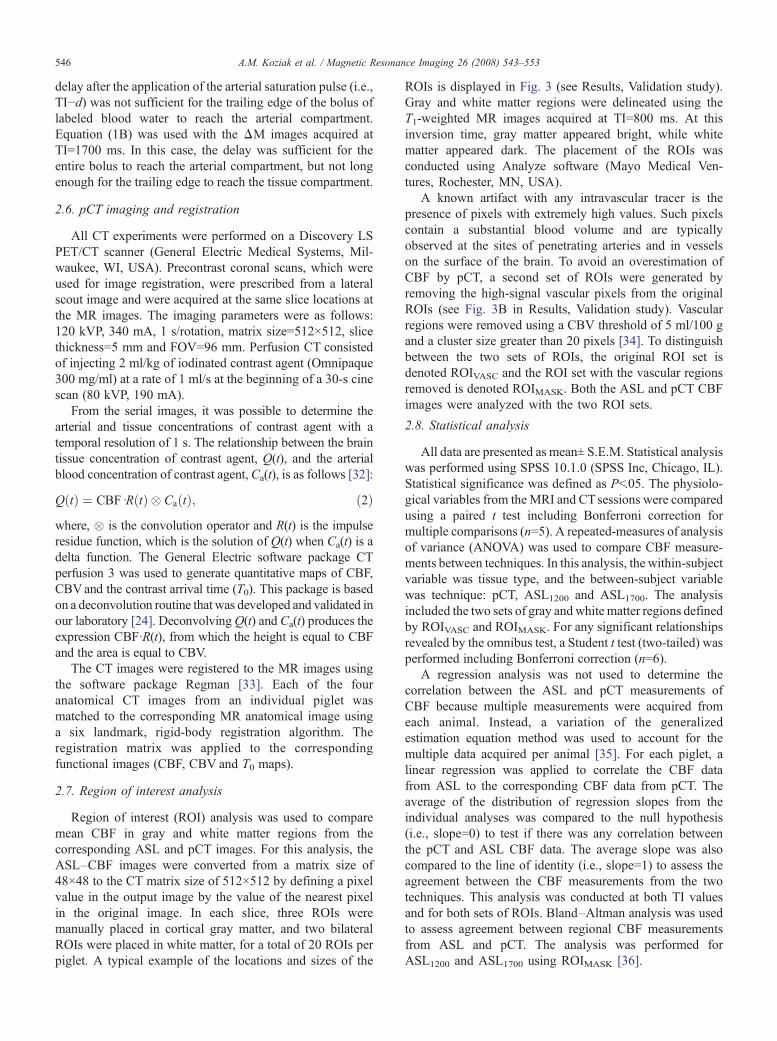
Typical CBF images from one slice location aredisplayed in Fig. 2, along with the correspondinganatomical magnetic resonance image for reference. Theanatomical image shows the fudicial marker used to matchthe slice locations for the MRI and CT sessions. Arterialspin labeling–CBF images are shown for both inversiontimes and in their original matrix size, which clearly doesnot provide the same spatial discrimination as the high-resolution pCT–CBF image. Nevertheless, the CBF imagesfrom the two techniques show similar perfusion patternswith elevated blood flow in cortical gray matter, lowerblood flow in deeper white matter and high signals in largevessels. At this slice location, vascular artifacts wereobserved in the midbrain region below the lateral ventricles,similar to our previous study [38].
An example of the placement of the ROIs used in theregression analysis is shown for one slice in Fig. 3. In Fig.3A, the original ROIVASC set has been overlaid on the pCT–CBF image and in Fig. 3B, the ROIMASK set has been
Fig. 1. GlobalΔM signal plotted as a function of labeling time (TI) from thearterial transit time study. Each point represents the ΔM signal averagedacross six piglets. The solid line represents the best fit of Eq. (1A) to the dataBars are S.E.M.
Fig. 2. Representative set of images from the same slice location in onepiglet. (A) Proton density anatomical MR image. (B) pCT–CBF image. (C
. ASL1200–CBF image. (D) ASL1700–CBF image.overlaid on the corresponding pCT–CBV image. The CBVimage was selected to demonstrate that ROIMASK does notinclude large vascular regions. Average CBF values for grayand white matter from pCT and ASL are presented in Fig. 4.Fig. 4A shows the values determined using ROIVASC andFig. 4B shows the values using ROIMASK. Average T1 valuesfrom ROIVASC were 1646±50 and 1368±44 ms in gray andwhite matter, respectively.
Results of the repeated-measures ANOVA indicated asignificant 3-way interaction [F(2,142)=71.52, Pb.001]between tissue type (gray and white matter), measurementtechnique (pCT, ASL1200 and ASL1700) and ROI sets(ROIVASC and ROIMASK). There were significant differencesin CBF measurements from the three methods [F(2,142)=23.64, Pb.001], between tissue types [F(1,71)=115.4,Pb.001] and between ROI sets [F(1,71)=250.7, Pb.001].Post hoc analysis revealed different results for gray and whitematter. In white matter, although the CBF values between thetwo ROI sets were significantly different, there were nodifferences in the values from the three imaging methodswithin each ROI set. Averaged across all three methods,white matter CBF was 66±2 ml/min per 100 g in ROIVASC
)
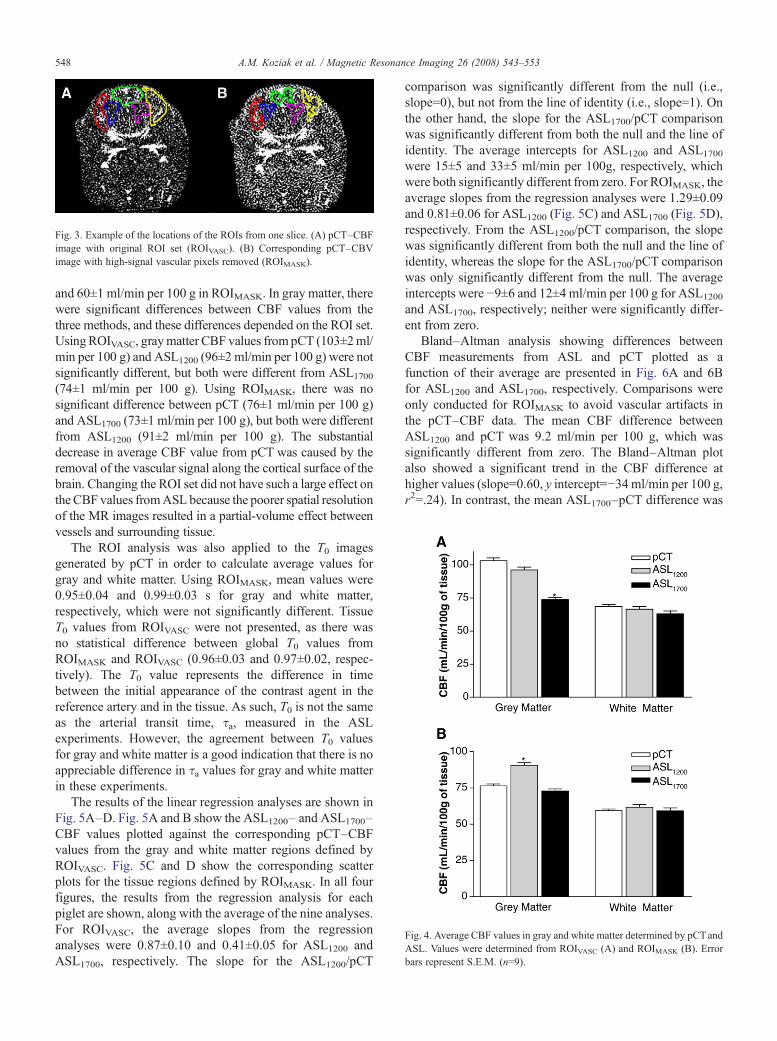
Fig. 3. Example of the locations of the ROIs from one slice. (A) pCT–CBFimage with original ROI set (ROIVASC). (B) Corresponding pCT–CBVimage with high-signal vascular pixels removed (ROIMASK).
548 A.M. Koziak et al. / Magnetic Resonance Imaging 26 (2008) 543–553
Fig. 4. Average CBF values in gray and white matter determined by pCTandASL. Values were determined from ROIVASC (A) and ROIMASK (B). Errobars represent S.E.M. (n=9).
and 60±1 ml/min per 100 g in ROIMASK. In gray matter, therewere significant differences between CBF values from thethree methods, and these differences depended on the ROI set.UsingROIVASC, graymatter CBF values frompCT (103±2ml/min per 100 g) and ASL1200 (96±2 ml/min per 100 g) were notsignificantly different, but both were different from ASL1700
(74±1 ml/min per 100 g). Using ROIMASK, there was nosignificant difference between pCT (76±1 ml/min per 100 g)and ASL1700 (73±1 ml/min per 100 g), but both were differentfrom ASL1200 (91±2 ml/min per 100 g). The substantialdecrease in average CBF value from pCT was caused by theremoval of the vascular signal along the cortical surface of thebrain. Changing the ROI set did not have such a large effect onthe CBF values fromASL because the poorer spatial resolutionof the MR images resulted in a partial-volume effect betweenvessels and surrounding tissue.
The ROI analysis was also applied to the T0 imagesgenerated by pCT in order to calculate average values forgray and white matter. Using ROIMASK, mean values were0.95±0.04 and 0.99±0.03 s for gray and white matter,respectively, which were not significantly different. TissueT0 values from ROIVASC were not presented, as there wasno statistical difference between global T0 values fromROIMASK and ROIVASC (0.96±0.03 and 0.97±0.02, respec-tively). The T0 value represents the difference in timebetween the initial appearance of the contrast agent in thereference artery and in the tissue. As such, T0 is not the sameas the arterial transit time, τa, measured in the ASLexperiments. However, the agreement between T0 valuesfor gray and white matter is a good indication that there is noappreciable difference in τa values for gray and white matterin these experiments.
The results of the linear regression analyses are shown inFig. 5A–D. Fig. 5A and B show the ASL1200– and ASL1700–CBF values plotted against the corresponding pCT–CBFvalues from the gray and white matter regions defined byROIVASC. Fig. 5C and D show the corresponding scatterplots for the tissue regions defined by ROIMASK. In all fourfigures, the results from the regression analysis for eachpiglet are shown, along with the average of the nine analyses.For ROIVASC, the average slopes from the regressionanalyses were 0.87±0.10 and 0.41±0.05 for ASL1200 andASL1700, respectively. The slope for the ASL1200/pCT
comparison was significantly different from the null (i.e.,slope=0), but not from the line of identity (i.e., slope=1). Onthe other hand, the slope for the ASL1700/pCT comparisonwas significantly different from both the null and the line ofidentity. The average intercepts for ASL1200 and ASL1700
were 15±5 and 33±5 ml/min per 100g, respectively, whichwere both significantly different from zero. For ROIMASK, theaverage slopes from the regression analyses were 1.29±0.09and 0.81±0.06 for ASL1200 (Fig. 5C) and ASL1700 (Fig. 5D),respectively. From the ASL1200/pCT comparison, the slopewas significantly different from both the null and the line ofidentity, whereas the slope for the ASL1700/pCT comparisonwas only significantly different from the null. The averageintercepts were −9±6 and 12±4 ml/min per 100 g for ASL1200
and ASL1700, respectively; neither were significantly differ-ent from zero.
Bland–Altman analysis showing differences betweenCBF measurements from ASL and pCT plotted as afunction of their average are presented in Fig. 6A and 6Bfor ASL1200 and ASL1700, respectively. Comparisons wereonly conducted for ROIMASK to avoid vascular artifacts inthe pCT–CBF data. The mean CBF difference betweenASL1200 and pCT was 9.2 ml/min per 100 g, which wassignificantly different from zero. The Bland–Altman plotalso showed a significant trend in the CBF difference athigher values (slope=0.60, y intercept=−34ml/min per 100 g,r2=.24). In contrast, the mean ASL1700–pCT difference was
r
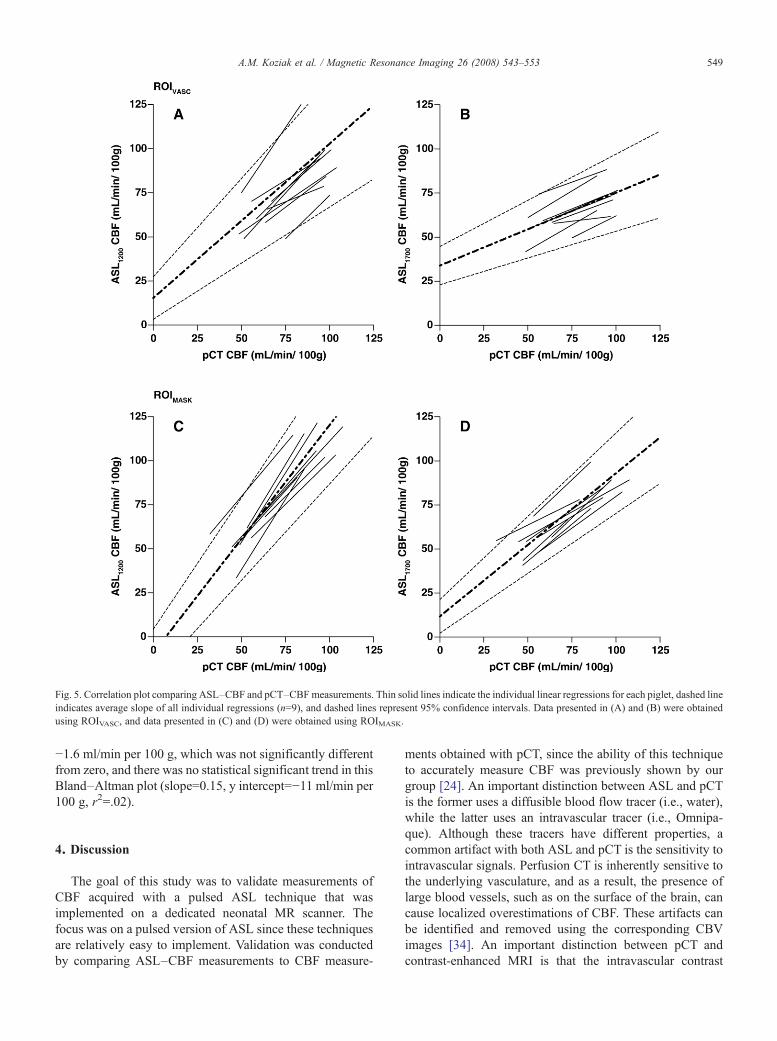
Fig. 5. Correlation plot comparing ASL–CBF and pCT–CBFmeasurements. Thin solid lines indicate the individual linear regressions for each piglet, dashed lineindicates average slope of all individual regressions (n=9), and dashed lines represent 95% confidence intervals. Data presented in (A) and (B) were obtainedusing ROIVASC, and data presented in (C) and (D) were obtained using ROIMASK.
549A.M. Koziak et al. / Magnetic Resonance Imaging 26 (2008) 543–553
−1.6 ml/min per 100 g, which was not significantly differentfrom zero, and there was no statistical significant trend in thisBland–Altman plot (slope=0.15, y intercept=−11 ml/min per100 g, r2=.02).
4. Discussion
The goal of this study was to validate measurements ofCBF acquired with a pulsed ASL technique that wasimplemented on a dedicated neonatal MR scanner. Thefocus was on a pulsed version of ASL since these techniquesare relatively easy to implement. Validation was conductedby comparing ASL–CBF measurements to CBF measure-
ments obtained with pCT, since the ability of this techniqueto accurately measure CBF was previously shown by ourgroup [24]. An important distinction between ASL and pCTis the former uses a diffusible blood flow tracer (i.e., water),while the latter uses an intravascular tracer (i.e., Omnipa-que). Although these tracers have different properties, acommon artifact with both ASL and pCT is the sensitivity tointravascular signals. Perfusion CT is inherently sensitive tothe underlying vasculature, and as a result, the presence oflarge blood vessels, such as on the surface of the brain, cancause localized overestimations of CBF. These artifacts canbe identified and removed using the corresponding CBVimages [34]. An important distinction between pCT andcontrast-enhanced MRI is that the intravascular contrast
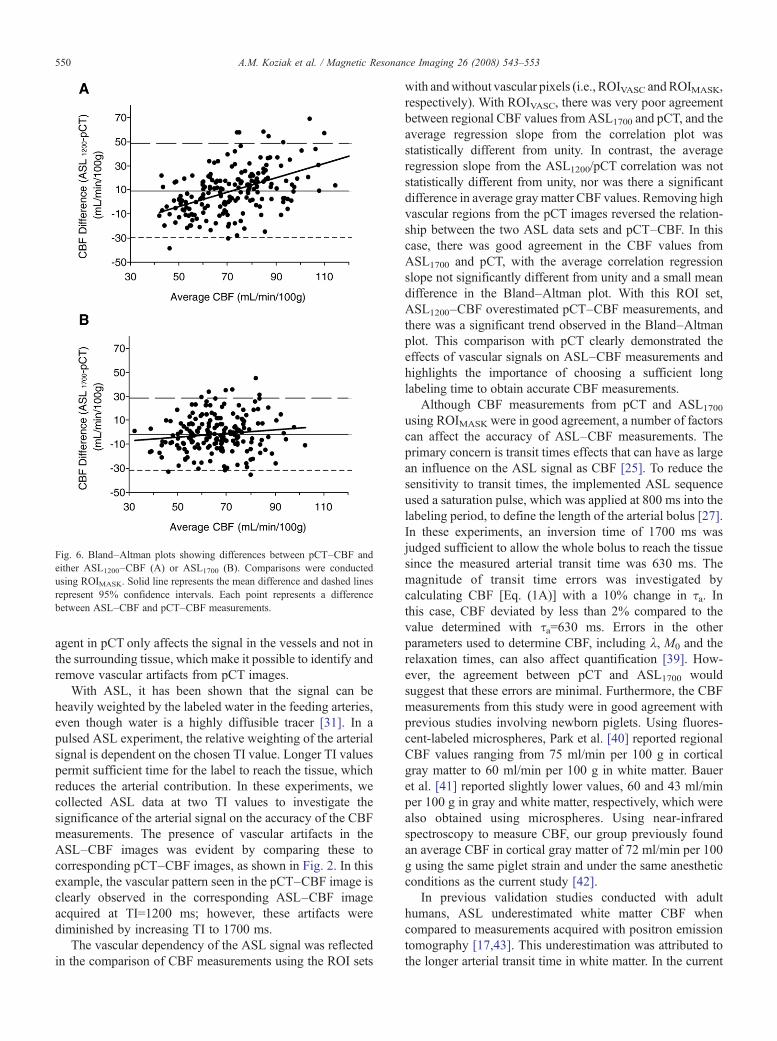
Fig. 6. Bland–Altman plots showing differences between pCT–CBF andeither ASL1200–CBF (A) or ASL1700 (B). Comparisons were conductedusing ROIMASK. Solid line represents the mean difference and dashed linesrepresent 95% confidence intervals. Each point represents a differencebetween ASL–CBF and pCT–CBF measurements.
550 A.M. Koziak et al. / Magnetic Resonance Imaging 26 (2008) 543–553
agent in pCT only affects the signal in the vessels and not inthe surrounding tissue, which make it possible to identify andremove vascular artifacts from pCT images.
With ASL, it has been shown that the signal can beheavily weighted by the labeled water in the feeding arteries,even though water is a highly diffusible tracer [31]. In apulsed ASL experiment, the relative weighting of the arterialsignal is dependent on the chosen TI value. Longer TI valuespermit sufficient time for the label to reach the tissue, whichreduces the arterial contribution. In these experiments, wecollected ASL data at two TI values to investigate thesignificance of the arterial signal on the accuracy of the CBFmeasurements. The presence of vascular artifacts in theASL–CBF images was evident by comparing these tocorresponding pCT–CBF images, as shown in Fig. 2. In thisexample, the vascular pattern seen in the pCT–CBF image isclearly observed in the corresponding ASL–CBF imageacquired at TI=1200 ms; however, these artifacts werediminished by increasing TI to 1700 ms.
The vascular dependency of the ASL signal was reflectedin the comparison of CBF measurements using the ROI sets
with andwithout vascular pixels (i.e., ROIVASC andROIMASK,respectively). With ROIVASC, there was very poor agreementbetween regional CBF values from ASL1700 and pCT, and theaverage regression slope from the correlation plot wasstatistically different from unity. In contrast, the averageregression slope from the ASL1200/pCT correlation was notstatistically different from unity, nor was there a significantdifference in average gray matter CBF values. Removing highvascular regions from the pCT images reversed the relation-ship between the two ASL data sets and pCT–CBF. In thiscase, there was good agreement in the CBF values fromASL1700 and pCT, with the average correlation regressionslope not significantly different from unity and a small meandifference in the Bland–Altman plot. With this ROI set,ASL1200–CBF overestimated pCT–CBF measurements, andthere was a significant trend observed in the Bland–Altmanplot. This comparison with pCT clearly demonstrated theeffects of vascular signals on ASL–CBF measurements andhighlights the importance of choosing a sufficient longlabeling time to obtain accurate CBF measurements.
Although CBF measurements from pCT and ASL1700
using ROIMASK were in good agreement, a number of factorscan affect the accuracy of ASL–CBF measurements. Theprimary concern is transit times effects that can have as largean influence on the ASL signal as CBF [25]. To reduce thesensitivity to transit times, the implemented ASL sequenceused a saturation pulse, which was applied at 800 ms into thelabeling period, to define the length of the arterial bolus [27].In these experiments, an inversion time of 1700 ms wasjudged sufficient to allow the whole bolus to reach the tissuesince the measured arterial transit time was 630 ms. Themagnitude of transit time errors was investigated bycalculating CBF [Eq. (1A)] with a 10% change in τa. Inthis case, CBF deviated by less than 2% compared to thevalue determined with τa=630 ms. Errors in the otherparameters used to determine CBF, including λ, M0 and therelaxation times, can also affect quantification [39]. How-ever, the agreement between pCT and ASL1700 wouldsuggest that these errors are minimal. Furthermore, the CBFmeasurements from this study were in good agreement withprevious studies involving newborn piglets. Using fluores-cent-labeled microspheres, Park et al. [40] reported regionalCBF values ranging from 75 ml/min per 100 g in corticalgray matter to 60 ml/min per 100 g in white matter. Baueret al. [41] reported slightly lower values, 60 and 43 ml/minper 100 g in gray and white matter, respectively, which werealso obtained using microspheres. Using near-infraredspectroscopy to measure CBF, our group previously foundan average CBF in cortical gray matter of 72 ml/min per 100g using the same piglet strain and under the same anestheticconditions as the current study [42].
In previous validation studies conducted with adulthumans, ASL underestimated white matter CBF whencompared to measurements acquired with positron emissiontomography [17,43]. This underestimation was attributed tothe longer arterial transit time in white matter. In the current
551A.M. Koziak et al. / Magnetic Resonance Imaging 26 (2008) 543–553
study, the difference in transit times for gray and white mattercould be assessed by the contrast arrival time maps generatedby pCT. No significant difference in arrival times of thecontrast agent to gray and white matter ROIs was observed.Although the contrast arrival time is not the same as thearterial transit time for ASL, the agreement between contrastarrival times for the two tissues suggests that the arterialtransit time would not be significant different in this animalmodel. This is reflected in the good agreement betweenwhite matter CBF measurements from pCT and ASL.
There are several factors to consider when interpreting theresults of this study. To start, the CBF measurements wereonly acquired at normocapnia. A number of previousvalidation studies, particularly in animals, have altered thePaCO2 levels to measure CBF over a broader range [16,18].Measurements at multiple PaCO2 levels were not feasible inthe current study due to the time required to collect both ASLdata sets (2.5 h) plus the additional 30 min necessary for theCT session. Although CBF was only obtained undernormocapnic conditions, the natural variation in CBF acrossthe brain and between animals permitted CBF to be assessedover a range from 40 to 100 ml/min per 100 g.
Another consideration is the long duration used to collectthe ASL images. At TI=1700 ms, 150 ΔM images werecollected in three 20-min intervals for a total duration of 1 h,which is clearly too long for clinical studies. This longacquisition was required to achieve reasonable precision inthe CBF images. Averaged across nine piglets, the temporalstability, which is defined as the pixel temporal standarddeviation divided by the resting-state perfusion signal, was2.0±0.2%, which is approximately 4 times larger than ourprevious measurements at 3 T [23]. This can be primarilyattributed to the difference in image resolution between thetwo studies. Due to the smaller size of the piglet's brain, theimages were acquired with a voxel size of 2×2×4.25 mm3,whereas in our previous study the voxel size was3.75×3.75×5 mm3. Using the latter image resolution,which is similar to previous pediatric reports [14], wouldreduce the scan time to approximately 15 min.
Acquisition times could be reduced further by implement-ing a phased array receiver coil instead of a single volumecoil. Initial ASL studies using eight-element phased arrayreceiver coils have reported a twofold improvement intemporal stability [44]. The use of continuous labelingapproaches, such as with a designated labeling coil or by apseudocontinuous labeling scheme, would improve thelabeling efficiency by approximately 50% compared to thepulsed labeling approach used in this study [45,46]. Withthese improvements, ASL scan times could be significantlyreduced, which is critical since motion artifacts remain amajor challenge to magnetic resonance imaging of new-borns. The ASL sequence implemented in this studyincluded background suppression, and although it does noteliminate motion, background suppression reduces artifactscaused by fluctuations in the static water signal [23].Sedation is commonly used in neonatal studies to minimize
motion; however, the potential effects of sedation on CBFmust be considered.
Piglets were chosen for this study as the head size issimilar to newborn human infants, allowing the experimentsto be conducted with the same MR equipment used inneonatal studies. The piglet is a common model for studyingperinatal brain injury as the rate of brain growth and the gray/white matter distribution are similar to human infants [47].However, the piglet brain appears to be physiologically moremature than the human brain at birth. The brain T1 valuesmeasured in this study were shorter than the values reportedfor newborns [21]. This suggests a difference in maturationsince T1 is dependent on brain water content, whichdecreases during postnatal development. Cerebral bloodflow in infants is generally lower than in piglets. Previousmeasurements ranged from 20 to 50 ml/100 g per minutedepending on the age and health statue of the infant and onthe brain region studied [48,49]. Lower CBF represents anadditional challenge to adapting ASL to neonatal studies,although this effect is partially offset by the prolonged T1values in the human newborn brain [14].
In conclusion, this study demonstrated that the implemen-ted ASL technique can provide accurate measurements ofCBF. By choosing an inversion time that was sufficientto allow all of the labeled water to reach the tissue (i.e.,TI=1700 ms), the ASL–CBF measurements were in goodagreement with pCT–CBFmeasurements after removing highvascular artifacts. By collecting ASL with two inversiontimes, we were able to show the spatial pattern of potentialvascular artifacts, which was confirmed by comparison to thecorresponding high-resolution CBF/CBV images generatedby pCT. Although there have been a number of validationstudies comparing ASL approaches to dynamic contrast-enhanced MRI [50,51], the advantages of using pCT are theability to obtain quantitative, high-resolution images ofcerebral hemodynamics, the simultaneous generation ofcontrast arrival maps, and the lack of signal contaminationfrom nearby vessels. The focus of future work will be toimprove the sensitivity of ASL in order to make this aclinically viable technique. The current pulsed ASL techniquethat was validated in this study can be used as a benchmark toensure the accuracy of future modifications. Considering theimpact of hemodynamic abnormalities on brain injuries innewborns, an MRI technique that can accurately measureCBF could have a significant impact on neonatal health care.
Acknowledgements
We would like to thank Dr. Yves Bureau for his adviceregarding the statistical analysis.
References
[1] Rutherford MA, Ward P, Malamatentiou C. Advanced MR techniquesin the term-born neonate with perinatal brain injury. Semin FetalNeonatal Med 2005;10(5):445–60.
552 A.M. Koziak et al. / Magnetic Resonance Imaging 26 (2008) 543–553
[2] Counsell SJ, Rutherford MA, Cowan FM, Edwards AD. Magneticresonance imaging of preterm brain injury. Arch Dis Child FetalNeonatal Ed 2003;88(4):F269–74.
[3] Volpe JJ. Neurobiology of periventricular leukomalacia in thepremature infant. Pediatr Res 2001;50(5):553.
[4] Tokumaru AM, Barkovich AJ, O'Uchi T, Matsuo T, Kusano S. Theevolution of cerebral blood flow in the developing brain: evaluationwith iodine-123 iodoamphetamine SPECT and correlation with MRimaging. AJNR Am J Neuroradiol 1999;20(5):845.
[5] Chugani HT. A critical period of brain development: studies of cerebralglucose utilization with PET. PrevMed 1998;27(2):184.
[6] Rivkin MJ. Developmental neuroimaging of children using magneticresonance techniques. Ment Retard Dev Disabil Res Rev 2000;6(1):68.
[7] Wintermark M, Sesay M, Barbier E, Borbely K, Dillon WP, EastwoodJD, et al. Comparative overview of brain perfusion imagingtechniques. Stroke 2005;36(9)e83–e99.
[8] Tanner SF, Cornette L, Ramenghi LA, Miall LS, Ridgway JP, SmithMA, et al. Cerebral perfusion in infants and neonates: preliminaryresults obtained using dynamic susceptibility contrast enhancedmagnetic resonance imaging. Arch Dis Child Fetal Neonatal Ed2003;88(6):F525.
[9] Ostergaard L, Johannsen P, Host-Poulsen P, Vestergaard-Poulsen P,Asboe H, Gee AD, et al. Cerebral blood flow measurements bymagnetic resonance imaging bolus tracking: comparison with [(15)O]H2O positron emission tomography in humans. J Cereb Blood FlowMetab 1998;18(9):935–40.
[10] Kiselev VG, Posse S. Analytical model of susceptibility-induced MRsignal dephasing: effect of diffusion in a microvascular network. MagnReson Med 1999;41(3):499–509.
[11] Detre JA, Leigh JS, Williams DS, Koretsky AP. Perfusion imaging.Magn Reson Med 1992;23(1):37.
[12] Barbier EL, Lamalle L, Decorps M. Methodology of brain perfusionimaging. J Magn Reson Imaging 2001;13(4):496.
[13] Licht DJ, Wang J, Silvestre DW, Nicolson SC, Montenegro LM,Wernovsky G, et al. Preoperative cerebral blood flow is diminished inneonates with severe congenital heart defects. J Thorac CardiovascSurg 2004;128(6):841–9.
[14] Wang J, Licht DJ. Pediatric perfusion MR imaging using arterial spinlabeling. Neuroimaging Clin N Am 2006;16(1):149–67, ix.
[15] Walsh EG, Minematsu K, Leppo J, Moore SC. Radioactive micro-sphere validation of a volume localized continuous saturationperfusion measurement. Magn Reson Med 1994;31(2):147.
[16] Ewing JR, Wei L, Knight RA, Pawa S, Nagaraja TN, Brusca T, et al.Direct comparison of local cerebral blood flow rates measured by MRIarterial spin-tagging and quantitative autoradiography in a rat model ofexperimental cerebral ischemia. J Cereb Blood Flow Metab 2003;23(2):198.
[17] Ye FQ, Berman KF, Ellmore T, Esposito G, van Horn JD, Yang Y, et al.H(2)(15)O PET validation of steady-state arterial spin tagging cerebralblood flow measurements in humans. Magn Reson Med 2000;44(3):450.
[18] Zhou J, Wilson DA, Ulatowski JA, Traystman RJ, van Zijl PC. Two-compartment exchange model for perfusion quantification usingarterial spin tagging. J Cereb Blood Flow Metab 2001;21(4):440.
[19] Pell GS, King MD, Proctor E, Thomas DL, Lythgoe MF, Gadian DG,et al. Comparative study of the FAIR technique of perfusionquantification with the hydrogen clearance method. J Cereb BloodFlow Metab 2003;23(6):689–99.
[20] Vasileiadis GT, Gelman N, HanVK,Williams LA,Mann R, Bureau Y, etal. Uncomplicated intraventricular hemorrhage is followed by reducedcortical volume at near-term age. Pediatrics 2004;114(3):e367–72.
[21] Williams LA, Gelman N, Picot PA, Lee DS, Ewing JR, Han VK, et al.Neonatal brain: regional variability of in vivo MR imaging relaxationrates at 3.0 T-initial experience. Radiology 2005;235(2):595–603.
[22] Ye FQ, Frank JA, Weinberger DR, McLaughlin AC. Noise reduction in3D perfusion imaging by attenuating the static signal in arterial spintagging (ASSIST). Magn Reson Med 2000;44(1):92.
[23] St Lawrence KS, Frank JA, Bandettini PA, Ye FQ. Noise reduction inmulti-slice arterial spin tagging imaging. Magn Reson Med 2005;53(3):735–8.
[24] Cenic A, Nabavi DG, Craen RA, Gelb AW, Lee TY. Dynamic CTmeasurement of cerebral blood flow: a validation study. AJNR Am JNeuroradiol 1999;20(1):63.
[25] Alsop DC, Detre JA. Reduced transit-time sensitivity in noninvasivemagnetic resonance imaging of human cerebral blood flow. J CerebBlood Flow Metab 1996;16(6):1236.
[26] Kim SG, Tsekos NV. Perfusion imaging by a flow-sensitive alternatinginversion recovery (FAIR) technique: application to functional brainimaging. Magn Reson Med 1997;37(3):425.
[27] Wong EC, Buxton RB, Frank LR. Quantitative imaging of perfusionusing a single subtraction (QUIPSS and QUIPSS II). Magn Reson Med1998;39(5):702.
[28] Lawrence StKS, Ye FQ, Lewis BK, Frank JA, McLaughlin AC.Measuring the effects of indomethacin on changes in cerebral oxidativemetabolism and cerebral blood flow during sensorimotor activation.Magn Reson Med 2003;50(1):99.
[29] Wang J, Zhang Y, Wolf RL, Roc AC, Alsop DC, Detre JA. Amplitude-modulated continuous arterial spin-labeling 3.0-T perfusion MRimaging with a single coil: feasibility study. Radiology 2005;235(1):218–28.
[30] Herscovitch P, Raichle ME. What is the correct value for the brain-blood partition coefficient for water? J Cereb Blood Flow Metab1985;5(1):65–9.
[31] Ye FQ, Mattay VS, Jezzard P, Frank JA, Weinberger DR, McLaughlinAC. Correction for vascular artifacts in cerebral blood flow valuesmeasured by using arterial spin tagging techniques. Magn Reson Med1997;37(2):226.
[32] Zierler KL. Equations for measuring blood flow by externalmonitoring of radioisotopes. Circ Res 1965;16:309.
[33] Li G, Nikolova S, Bartha R. Registration of in vivo magneticresonance T(1)- weighted brain images to triphenyltetrazoliumchloride stained sections in small animals. J Neurosci Methods2006;156(1-2):368–75.
[34] Kudo K, Terae S, Katoh C, Oka M, Shiga T, Tamaki N, et al.Quantitative cerebral blood flow measurement with dynamic perfusionCT using the vascular-pixel elimination method: comparison with H2
(15)O positron emission tomography. AJNR Am J Neuroradiol2003;24(3):419–26.
[35] Zeger SL, Liang KY, Albert PS. Models for longitudinal data: ageneralized estimating equation approach. Biometrics 1988;44(4):1049–60.
[36] Bland JM, Altman DG. Statistical methods for assessing agreementbetween two methods of clinical measurement. Lancet 1986;1(8476):307–10.
[37] Siesjo BK. Brain energy metabolism. Chichester: John Wiley & Sons;1978.
[38] Brown DW, Picot PA, Naeini JG, Springett R, Delpy DT, Lee TY.Quantitative near infrared spectroscopy measurement of cerebralhemodynamics in newborn piglets. Pediatr Res 2002;51(5):564.
[39] Calamante F, Thomas DL, Pell GS, Wiersma J, Turner R. Measuringcerebral blood flow using magnetic resonance imaging techniques.J Cereb Blood Flow Metab 1999;19(7):701.
[40] Park WS, Chang YS, Shim JW, Kim MJ, Ko SY, Kim SS, et al. Effectsof dopamine infusion on cerebral blood flow, brain cell membranefunction and energy metabolism in experimental Escherichia colimeningitis in the newborn piglet. J Korean Med Sci 2003;18(6):869–75.
[41] Bauer R, Walter B, Torossian A, Fritz H, Schlonski O, Jochum T, et al.A piglet model for evaluation of cerebral blood flow and brainoxidative metabolism during gradual cerebral perfusion pressuredecrease. Pediatr Neurosurg 1999;30(2):62–9.
[42] Tichauer KM, Hadway JA, Lee TY, Lawrence KS. Measurement ofcerebral oxidative metabolism with near-infrared spectroscopy: avalidation study. J Cereb Blood Flow Metab 2006;26(5):722–30.

553A.M. Koziak et al. / Magnetic Resonance Imaging 26 (2008) 543–553
[43] Kimura H, Kado H, Koshimoto Y, Tsuchida T, Yonekura Y, Itoh H.Multislice continuous arterial spin-labeled perfusion MRI in patientswith chronic occlusive cerebrovascular disease: a correlative studywith CO2 PET validation. J Magn Reson Imaging 2005;22(2):189–98.
[44] Wang Z, Wang J, Connick TJ, Wetmore GS, Detre JA. ContinuousASL (CASL) perfusion MRI with an array coil and parallel imaging at3T. Magn Reson Med 2005;54(3):732–7.
[45] Talagala SL, Ye FQ, Ledden PJ, Chesnick S. Whole-brain 3Dperfusion MRI at 3.0 T using CASL with a separate labeling coil.Magn Reson Med 2004;52(1):131–40.
[46] Garcia DM, de Bazelaire C, Alsop DC. Pseudo-continuous flow drivenadiabatic inversion for arterial spin labeling. Int Soc Magn Reson Med2005;13:37.
[47] Dobbing J. The later growth of the brain and its vulnerability.Pediatrics 1974;53(1):2–6.
[48] Lou HC, Skov H, Pedersen H. Low cerebral blood flow: a risk factor inthe neonate. J Pediatr 1979;95(4):606.
[49] Chiron C, Raynaud C, Maziere B, Zilbovicius M, Laflamme L, MasureMC, et al. Changes in regional cerebral blood flow during brainmaturation in children and adolescents. J Nucl Med 1992;33(5):696.
[50] Li TQ, Guang CZ, Ostergaard L, Hindmarsh T, Moseley ME.Quantification of cerebral blood flow by bolus tracking and arteryspin tagging methods. Magn Reson Imaging 2000;18(5):503.
[51] Hunsche S, Sauner D, Schreiber WG, Oelkers P, Stoeter P. FAIR anddynamic susceptibility contrast-enhanced perfusion imaging in healthysubjects and stroke patients. J Magn Reson Imaging 2002;16(2):137–46.