Improved Method for Differential Expression Proteomics Using Trypsin-catalyzed 18O Labeling with a...
13
Improved Method for Differential Expression Proteomics Using Trypsin-catalyzed 18 O Labeling with a Correction for Labeling Efficiency* □ S Antonio Ramos-Ferna ´ ndez‡, Daniel Lo ´ pez-Ferrer§, and Jesu ´ s Va ´ zquez¶ Quantitative strategies relying on stable isotope labeling and isotope dilution mass spectrometry have proven to be a very robust alternative to the well established gel-based techniques for the study of the dynamic proteome. Post- digestion 18 O labeling is becoming very popular mainly due to the simplicity of the enzyme-catalyzed exchange reaction, the peptide handling and storage procedures, and the flexibility and versatility introduced by decoupling protein digestion from peptide labeling. Despite recent progresses, peptide quantification by postdigestion 18 O labeling still involves several computational problems. In this work we analyzed the behavior of large collections of peptides when they were subjected to postdigestion la- beling and concluded that this process can be explained by a universal kinetic model. On the basis of this obser- vation, we developed an advanced quantification algo- rithm for this kind of labeling. Our method fits the entire isotopic envelope to parameters related with the kinetic exchange model, allowing at the same time an accurate calculation of the relative proportion of peptides in the original samples and of the specific labeling efficiency of each one of the peptides. We demonstrated that the new method eliminates artifacts produced by incomplete oxy- gen exchange in subsets of peptides that have a relatively low labeling efficiency and that may be considered indic- ative of false protein ratio deviations. Finally using a rig- orous statistical analysis based on the calculation of error rates associated with false expression changes, we showed the validity of the method in the practice by de- tecting significant expression changes, produced by the activation of a model preparation of T cells, with only 5 g of protein in three proteins among a pool of more than 100. By allowing a full control over potential artifacts, our method may improve automation of the procedures for relative protein quantification using this labeling strategy. Molecular & Cellular Proteomics 6:1274 –1286, 2007. Beyond the control of synthesis and degradation of mRNA, living organisms possess a wide variety of regulatory mech- anisms not affecting mRNA levels, such as protein synthesis, degradation, posttranslational modification or control of sub cellular location. Large-scale quantitative measurements at the protein level, also called quantitative proteomics, are thus complementary to the well established mRNA-based gene expression profiling techniques and will probably be- come one of the cornerstones of systems biology in the near future. In recent years, alternative strategies to the classical two- dimensional gel electrophoresis approaches based on the chromatographic separation of complex mixtures of prote- ase-generated peptides, also referred to as “shotgun pro- teomics,” have been developed. Peptides eluting from an RP 1 -HPLC column are sprayed into a mass spectrometer that detects, isolates, and fragments specific peptide ions to ob- tain structural information, which is correlated against protein databases to identify the peptide sequence. Recently these approaches have incorporated stable isotopic labeling tech- niques to produce relative quantitative information besides protein identification (1). When a peptide sample labeled with a heavy isotope is equimolarly mixed with an unlabeled sam- ple, peptide ions appear as doublets showing the same in- tensity separated by a mass-to-charge offset determined by the mass of the label and the charge state of the peptide. Peptides differentially represented in each sample show de- partures from the expected 1:1 ratio, allowing the quantifica- tion of changes in the corresponding protein levels. Stable isotopic labeling can be achieved chemically by modifying reactive peptide groups (for example, cysteine side chains) with site-specific reactants (2, 3), metabolically by growing cells in culture media enriched in heavy isotopes such as 15 N- or 13 C-labeled amino acids (4 – 6), or enzymatically by adding [ 18 O]water molecules into peptide C termini during or after proteolytic cleavage (7–10). Among these techniques, 18 O labeling is emerging as a powerful labeling strategy for quan- titative proteomics applications. Unlike other strategies that are restricted to peptides containing specific amino acids, any From the Protein Chemistry and Proteomics Laboratory, Centro de Biologı´a Molecular “Severo Ochoa”-Consejo Superior de Investiga- ciones Científicas, 28049 Cantoblanco, Madrid, Spain Received, June 8, 2006, and in revised form, February 16, 2007 Published, MCP Papers in Press, February 23, 2007, DOI 10.1074/ mcp.T600029-MCP200 1 The abbreviations used are: RP, reverse phase; FDR, false dis- covery rate. Technology © 2007 by The American Society for Biochemistry and Molecular Biology, Inc. 1274 Molecular & Cellular Proteomics 6.7 This paper is available on line at http://www.mcponline.org
-
Upload
independent -
Category
Documents
-
view
1 -
download
0
Transcript of Improved Method for Differential Expression Proteomics Using Trypsin-catalyzed 18O Labeling with a...

Improved Method for Differential ExpressionProteomics Using Trypsin-catalyzed18O Labeling with a Correction forLabeling Efficiency*□S
Antonio Ramos-Fernandez‡, Daniel Lopez-Ferrer§, and Jesus Vazquez¶
Quantitative strategies relying on stable isotope labelingand isotope dilution mass spectrometry have proven to bea very robust alternative to the well established gel-basedtechniques for the study of the dynamic proteome. Post-digestion 18O labeling is becoming very popular mainlydue to the simplicity of the enzyme-catalyzed exchangereaction, the peptide handling and storage procedures,and the flexibility and versatility introduced by decouplingprotein digestion from peptide labeling. Despite recentprogresses, peptide quantification by postdigestion 18Olabeling still involves several computational problems. Inthis work we analyzed the behavior of large collections ofpeptides when they were subjected to postdigestion la-beling and concluded that this process can be explainedby a universal kinetic model. On the basis of this obser-vation, we developed an advanced quantification algo-rithm for this kind of labeling. Our method fits the entireisotopic envelope to parameters related with the kineticexchange model, allowing at the same time an accuratecalculation of the relative proportion of peptides in theoriginal samples and of the specific labeling efficiency ofeach one of the peptides. We demonstrated that the newmethod eliminates artifacts produced by incomplete oxy-gen exchange in subsets of peptides that have a relativelylow labeling efficiency and that may be considered indic-ative of false protein ratio deviations. Finally using a rig-orous statistical analysis based on the calculation of errorrates associated with false expression changes, weshowed the validity of the method in the practice by de-tecting significant expression changes, produced by theactivation of a model preparation of T cells, with only 5 �gof protein in three proteins among a pool of more than100. By allowing a full control over potential artifacts, ourmethod may improve automation of the procedures forrelative protein quantification using this labeling strategy.Molecular & Cellular Proteomics 6:1274–1286, 2007.
Beyond the control of synthesis and degradation of mRNA,living organisms possess a wide variety of regulatory mech-anisms not affecting mRNA levels, such as protein synthesis,degradation, posttranslational modification or control of subcellular location. Large-scale quantitative measurements atthe protein level, also called quantitative proteomics, arethus complementary to the well established mRNA-basedgene expression profiling techniques and will probably be-come one of the cornerstones of systems biology in the nearfuture.
In recent years, alternative strategies to the classical two-dimensional gel electrophoresis approaches based on thechromatographic separation of complex mixtures of prote-ase-generated peptides, also referred to as “shotgun pro-teomics,” have been developed. Peptides eluting from anRP1-HPLC column are sprayed into a mass spectrometer thatdetects, isolates, and fragments specific peptide ions to ob-tain structural information, which is correlated against proteindatabases to identify the peptide sequence. Recently theseapproaches have incorporated stable isotopic labeling tech-niques to produce relative quantitative information besidesprotein identification (1). When a peptide sample labeled witha heavy isotope is equimolarly mixed with an unlabeled sam-ple, peptide ions appear as doublets showing the same in-tensity separated by a mass-to-charge offset determined bythe mass of the label and the charge state of the peptide.Peptides differentially represented in each sample show de-partures from the expected 1:1 ratio, allowing the quantifica-tion of changes in the corresponding protein levels. Stableisotopic labeling can be achieved chemically by modifyingreactive peptide groups (for example, cysteine side chains)with site-specific reactants (2, 3), metabolically by growingcells in culture media enriched in heavy isotopes such as 15N-or 13C-labeled amino acids (4–6), or enzymatically by adding[18O]water molecules into peptide C termini during or afterproteolytic cleavage (7–10). Among these techniques, 18Olabeling is emerging as a powerful labeling strategy for quan-titative proteomics applications. Unlike other strategies thatare restricted to peptides containing specific amino acids, any
From the Protein Chemistry and Proteomics Laboratory, Centro deBiologıa Molecular “Severo Ochoa”-Consejo Superior de Investiga-ciones Científicas, 28049 Cantoblanco, Madrid, Spain
Received, June 8, 2006, and in revised form, February 16, 2007Published, MCP Papers in Press, February 23, 2007, DOI 10.1074/
mcp.T600029-MCP200
1 The abbreviations used are: RP, reverse phase; FDR, false dis-covery rate.
Technology
© 2007 by The American Society for Biochemistry and Molecular Biology, Inc.1274 Molecular & Cellular Proteomics 6.7This paper is available on line at http://www.mcponline.org

peptide generated by proteolytic digestion can be labeledwith H2
18O (9–12).Peptide labeling with 18O tags is performed by digesting the
proteins with a proper endoprotease, originally trypsin, in thepresence of [18O]water; this produces incorporation of two18O atoms at the C-terminal end of peptides. It has beenshown that proteolytic 18O labeling can be decoupled fromprotein digestion so that the endoprotease can be used in aseparate step to label peptides after proteolysis has takenplace. This procedure has the advantage that proteins can bekept in solution prior to digestion using adequate chaotropicbuffers or surfactants, that labeling can be performed with alimited volume of H2
18O, and that digestion and labeling con-ditions can be optimized separately (10). This postlabelingstrategy is becoming very popular mainly due to the simplicityof the exchange reaction and the availability of fast and effi-cient peptide desalting procedures and has been adopted bymost researchers using this technique to make relative quan-tification of complex protein mixtures in solution.
The 18O labeling process introduces either 2- or 4-Da masstags depending on the number of C-terminal oxygen atomsexchanged. Because the efficiency of the exchange reactionis not always complete with all peptides, a rather complexisotopic envelope pattern is usually obtained due to the over-lap of the natural envelopes of unlabeled, singly labeled, anddoubly labeled peptides. This has limited the use of three-dimensional ion trap mass spectrometers, which produce lowresolution survey scans, for peptide quantification by thislabeling method. However, ion traps can perform high reso-lution mass spectra (or “ZoomScans”) of selected ions over alimited m/z range, and we have demonstrated previously thatby using these scanning modes in a linear ion trap and takingadvantage of its high scanning speed it is possible to makeaccurate quantitative measurements without compromisingthe ability of this machine to perform high throughput peptideidentification (13).
Described software applications for quantification from 18Olabeling data either use simple schemes assuming completeexchange to the doubly labeled species so that the 16O/18Oratio is directly computed as the intensity ratio of the mo-noisotopic peak and the peak located at �4 Da (14, 15) orimplement quantification algorithms that basically follow theformulation of Yao et al. (8) and Zang et al. (16). These algo-rithms compute the 16O/18O ratio either by sequentially sub-tracting the contributions of the peak heights of the threeoverlapping isotopic clusters (17, 18) or by directly measuringthe heights of the first, third, and fifth isotopic peaks and thenapplying an analytical formula that corrects the intensities forthe cluster overlap (17, 19). Here we present an advancedquantification algorithm specifically designed to deal withpeptides labeled by postdigestion 18O exchange. Our methodfits the entire isotopic envelope to parameters related with akinetic exchange model, allowing at the same time an accu-rate calculation of the relative proportion of peptides in the
original samples and of the specific labeling efficiency of eachone of the peptides. By improving the quantification proce-dure and allowing a full control over potential artifacts, wethink that our method is a significant step toward the com-plete automation of the method for relative protein quantifi-cation using this popular labeling strategy.
EXPERIMENTAL PROCEDURES
Preparation of a Model Mixture of Proteins—A mixture of stand-ard proteins purchased from Sigma-Aldrich was prepared by mix-ing the following proteins: bovine serum albumin (4 pmol/�l),chicken egg lysozyme (59 pmol/�l), horse cytochrome c (20.2 pmol/�l), horse heart apomyoglobin (5.9 pmol/�l), and bovine �-lactal-bumin (0.5 pmol/�l). 5 �l of this mixture were used for enzymaticdigestion.
Preparation of Endothelial Cell Extracts—Cells were grown at 37 °Cat 5% CO2. The EA.hy926 cell line (kindly provided by Dr. AntonioMartinez-Ruiz) was cultured in Dulbecco’s modified Eagle’s mediumwith hypoxanthine, aminopterin, and thymidine supplement, 20%fetal bovine serum, 100 units/ml penicillin, 100 �g/ml streptomycin,and 5 �g/ml gentamicin. For preparing cell protein extracts, confluentcells were scraped and resuspended in nondenaturing lysis solution(50 mM Tris-HCl, pH 7.4, 300 mM NaCl, 5 mM EDTA, 0.1 mM neocu-proine, and 1% Triton X-100 plus protease inhibitor mixture), incu-bated in ice for 15 min, and centrifuged at 10,000 � g for 15 min at4 °C. Supernatants were collected, and the protein content was quan-tified using the Bradford reagent (Bio-Rad).
Preparation of T Cell Extracts—These extracts were kindly pro-vided by Drs. Montse Carrascal and Joaquın Abian and were pre-pared as follows. Mononuclear cells were purified from PBS-dilutedblood using the Ficoll gradient centrifugation method as described byBoyum (20). To this end, Ficoll-Paque (Amersham Biosciences) wasused according to the instructions of the manufacturer. The purity ofthe mononuclear fraction was then verified by checking under themicroscope the fraction of mononuclear cells among all cells ob-served; it was around the expected value of 95%. Activation wascarried according to the following procedure: either 5 ml of PBS(negative control) or 5 ml of 10 �g/�l PBS-diluted �-CD3 antibody (BDBiosciences) were added to T75 vials to coat the surface with anti-body. After a 5-h incubation, flasks were washed twice with PBS, and55 � 106 cells, diluted in 10% FCS-supplemented RPMI 1640 me-dium, were added to each vial. After 15 min of incubation, cells werewashed twice with PBS and centrifuged at 500 � g for 10 min. Cellpellets were stored at �80 °C until use. To extract proteins, lysisbuffer (6 M urea, 50 mM Tris, 10 mM DTT) was then added. Afteralkylation with iodoacetamide (55 mM), protein extracts were acetone-precipitated prior to digestion.
Protein Digestion and Postdigestion Labeling—Total cell extractsfrom endothelial cells were subjected to cold acetone precipitation,lyophilized to dryness, and suspended in 8 M urea, 25 mM ammoniumbicarbonate. 200 �g of starting protein material were used for cellularextracts, and 5 �l were used for the model mixture of proteins.Proteins were reduced for 1 h in 10 mM DTT, 25 mM ammoniumbicarbonate, pH 8.25, at 37 °C and then alkylated for 45 min in 50 mM
iodoacetamide. Digestion was carried out overnight at 37 °C withtrypsin (1:50 protease/protein). In the case of the T cell extract, it wasdigested upon reconstitution in 25 mM ammonium bicarbonate, 2 M
urea without further treatment. After acidification with 1% TFA, thedigest was lyophilized. The dried pellet was then resuspended in 50 �lof 0.1% TFA and desalted in a Vydac C8 RP column (2.1 � 25 mm),using a Beckman Gold HPLC system, by one-step elution with 80%acetonitrile containing 0.1% TFA. The clean peptide pool was thendried down and dissolved in 40 �l of 20% acetonitrile (v/v); 40 �l of
Improved Method for Quantitative Proteomics by 18O Labeling
Molecular & Cellular Proteomics 6.7 1275
100 mM ammonium acetate, pH 6.75, was added together with 40 �lof 50 mM calcium chloride and 10 �g of sequence grade trypsin; andthe resulting mixture was dried in a vacuum centrifuge. The samplewas then resuspended in 40 �l of either H2
16O or H218O (95%,
Sigma-Aldrich) containing 20% acetonitrile and incubated at 37 °C for48 h. Labeling was stopped with 1% formic acid.
Mass Spectrometry—Protein digests were analyzed by LC-ESI-linear ion trap-MS/MS using a Surveyor LC system coupled to a linearion trap mass spectrometer model LTQ (Thermo-Finnigan, San Jose,CA). The separation column was a 0.18 � 150-mm Biobasic RPcolumn (ThermoHypersil-Keystone) operating at 1.5 �l/min. Peptideswere eluted using 300-min gradients from 5 to 40% solvent B (solventA: 0.1% formic acid; solvent B: 0.1% formic acid, 80% acetonitrile).The linear ion trap was operated in data-dependent ZoomScan andMS/MS switching mode using the three most intense precursorsdetected in a survey scan from 400 to 1600 amu (three microscans).ZoomScan mass windows were set to 12 Da to allow monitoring ofthe entire 16O/18O isotopic envelope of doubly and triply chargedpeptides irrespective of which isotopic peak was chosen as theprecursor. Singly charged ions were excluded for MS/MS analysis.ZoomScan settings (maximum injection time, 50 ms; zoom targetparameter, 3000 ions; and the number of microscans, 10) were ex-actly as optimized in a previous work (13). Normalized collision energywas set to 35%, and dynamic exclusion was applied during 3-minperiods to avoid fragmenting each ion more than twice.
Database Search—Protein identification in human InternationalProtein Index (IPI) version 3.12 database, downloaded from theEuropean Bioinformatics Institute website, was carried out as de-scribed using SEQUEST. Database search parameters included asvariable modifications Met oxidation and Lys and Arg � 4-Dalabeling and a fixed carbamidomethylation of Cys. Calculation oferror rates of peptide identification was carried out as we haveproposed earlier (21). Only ZoomScan spectra corresponding topeptide matches with a false discovery rate lower than 5% wereused for quantification.
Kinetic Model for Trypsin-catalyzed 18O Labeling—Let’s consider ageneral case where peptides are subjected to a certain labelingreaction where two labeled species are produced using a reagentwhose concentration is in large excess. Let’s also assume that thelabeled species may return to the unlabeled state and that thelabeling reaction takes place according to the following kineticmechanism,
B0-|0k
p�kB1-|0
�k
pkB2
REACTION 1
where B0 stands for the concentration of non-labeled peptide; B1 andB2 stand for the concentration of mono- and dilabeled peptide, re-spectively; k is the kinetic constant; and � and p are constants. Akinetic analysis of this equation (see the supplemental information)reveals that the concentrations of the three species along the labelingreaction are mathematically related in a manner that does not dependon the time or the kinetic constant.
In the case of trypsin-catalyzed H218O incorporation into peptides,
the parameter p is equal to the fraction of water molecules containing18O, i.e. to the purity of H2
18O. Besides oxygen exchange takes placein one of the two atoms at the C termini; hence only half the fractionof monolabeled species will give rise to a dilabeled species or returnto the non-labeled state. Therefore, � � 0.5, and the relation betweenthe three species also becomes independent on the constant p (seethe supplemental information). This relation may be expressed as afunction of the total peptide concentration (B � B0 � B1 � B2)) and
the labeling efficiency f.
B2 � Bf 2 (Eq. 1)
B0 � B�1 � f �2 (Eq. 2)
B1 � B2f�1 � f � (Eq. 3)
Note that it would also be possible to derive Equations 1–3 byassuming that the exchange of the two oxygen atoms is independentof each other. In other words, when � � 0.5, the labeled oxygenatoms become homogeneously distributed among the mono- anddilabeled peptide species even though a true equilibrium betweenthese species has not actually been reached.
ZoomScan Spectra Preprocessing and Initial Quantification Step—ZoomScan spectra are base line-corrected by subtracting from allpoints the median intensity of all local minima. A smoothened spec-trum is then obtained by applying a moving average window, which isweighted using a tricubic function to better preserve peak heights. Aninitial estimate of relative isotope amounts is carried out on the basisof the formulation described by Zang et al. (16). The amounts ofnon-labeled peptide (A) and of mono- (B1) and dilabeled peptide (B2),expressed in the same units as the ion intensities determined by theMS detector, are determined from
A � I0 (Eq. 4)
B1 � I2�1 �M2
M0� � �1 �
M2
M0�M2
M0I0 (Eq. 5)
B2 � I4 �M4
M0I0 (Eq. 6)
where I0, I2, and I4 are the raw intensities of the first, third, and fifthpeak maxima of the isotopic cluster and M0, M2, and M4 are therelative proportions of the first (monoisotopic), third, and fifth peaks inthe natural isotopic envelope. They are calculated from the elementalcomposition using a combinatorial subroutine determined from thepeptide sequence. Isotopic abundance values are those reported byChapman (22). The monoisotopic mass is also determined from thepeptide sequence. Peptide sequence and charge state are taken fromSEQUEST outputs once they are statistically analyzed to determinetrue peptide assignations.
Refinement of Quantification Using an Envelope Shape Model andCalculation of Standard Errors—The initial estimates of the relativecontent of the three isotopic species mentioned above (A, B1, and B2)are used as starting parameters for a procedure where the isotopicenvelope profile of the ZoomScan spectrum is fitted to a theoreticalcurve. Fitting is performed by a nonlinear, Newton-Gauss unweightedleast squares iterative method (23). The fitted function is the areacovered by the first eight peaks of the signal doublet, which ismodeled as a sum of three peptide isotopic envelopes, each onecomposed of a set of peaks evenly spaced 1/z units. To modelpeptide peaks, we observed that Gaussian distributions did notexplain adequately the behavior of ions upon resonance ejection,which showed a variable degree of leptokurtosis. For this reason,peaks were modeled using mixed Gaussian/double exponentialdistributions
I�x� � �1 � ��1
�2��exp��
�x � ��2
�2 �� �
12�
exp���x � �
��� (Eq. 7)
Improved Method for Quantitative Proteomics by 18O Labeling
1276 Molecular & Cellular Proteomics 6.7
where I(x) is the intensity at m/z x for a peak whose area is the unity,� is the location parameter (the mean in the Gaussian distribution), �
is the scale parameter (the standard deviation in the Gaussian distri-bution), and � evaluates the proportion of double exponential com-ponent within the mixed distribution; the two last parameters areindividually fitted for each spectrum. Five variable parameters areused to fit the function to the isotope envelope: A, B, f, �, and �.Standard errors for these parameters were calculated from the matrixof partial derivatives as described elsewhere (23).
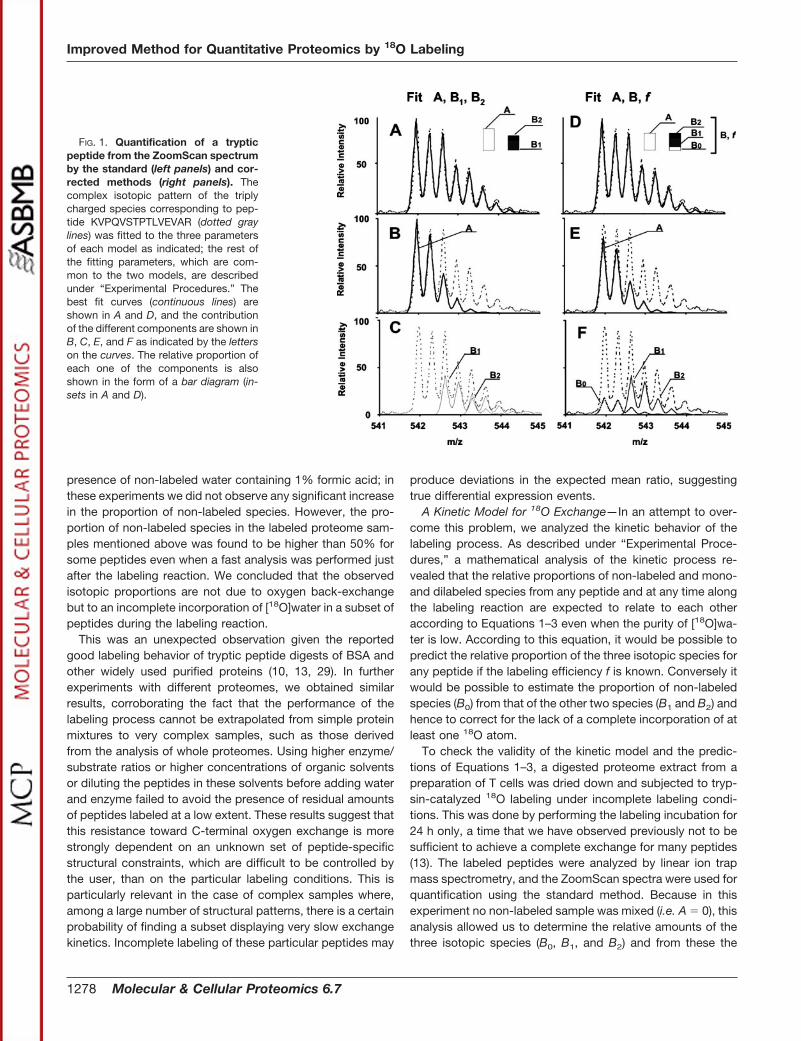
A Modified Algorithm Including a Correction for Incomplete Label-ing Efficiency—The corrected method was identical to the original oneexcept that instead of fitting the parameters A, B1, and B2 the pro-cedure fits the parameters A, B, and f. ZoomScan spectra weremodeled, as in the original protocol, as a sum of three isotopicenvelopes; the first one was computed as the sum of A and B0
species (see Fig. 1), and B0, B1, and B2 were calculated from B and fusing Equations 1–3. The modified algorithm used f � 1 as startingvalue for the curve fitting. This procedure allows a direct determina-tion of corrected A and B proportions and of the labeling efficiency ofeach one of the peptides.
The theoretical relationship between the ratios determined by thestandard (RS) and corrected (RC) algorithms and the labeling effi-ciency may be calculated considering the following.
RC �AB
�A
B0 � B1 � B2(Eq. 8)
and
RS �A � B0
B1 � B2(Eq. 9)
Applying Equations 1–3 gives Equation 10.
RS �RC � �1 � f �2
2f�1 � f � � f 2 (Eq. 10)
Using this equation it is possible to estimate the effect of labelingefficiency on the ratio determined using the standard method.
Statistical Analysis of Differential Expression Events—Expressionratios were statistically analyzed by a method similar to that describedby Li et al. (24). Briefly a ratio histogram in a log2 scale was con-structed, and the distribution was fitted by least squares to a Gaus-sian curve, determining the mean and the S.D. A standard two-tailedz test was then used to determine probability associated to peptidesshowing an expression ratio significantly higher or lower than themean, which is usually, but not always, centered on zero. By intro-ducing a sample-dependent normalization, this method corrects forany systematic errors introduced during sample handling (24). Tocalculate the final p values, the standard error of the fitted parameters(i.e. the experimental error performed in the calculation of the ratio)was also taken into account by using error propagation theory (25,26); this compensated for the fact that a noticeable departure fromthe center of distribution may not be statistically significant if the errormade during the determination of the ratio (the fitting procedure) issufficiently high.
The final statistical significance of potential differential expressionevents was assessed by determining the false discovery rates (FDRs)(27, 28), defined as the proportion of peptides expected to pass the pthreshold, calculated from the fitted Gaussian distribution and thetotal number of determinations, among the observed number of pep-tides actually passing this threshold.
RESULTS
A Standard Method for Quantification from ZoomScanSpectra Obtained by Linear Ion Trap Mass Spectrometry—In aprevious report we described a stable isotopic labeling quan-titative proteomics method based on 16O/18O labeling andlinear ion trap mass spectrometry that takes advantage of thehigh scanning speed of this machine. Peptides identified insurvey scans are subjected to a high resolution scanningmode (ZoomScan), which is used to quantify the isotopicpartners, and then subjected to MS/MS analysis. This allowedboth identification and relative quantification of peptides (13).Quantification was performed by decomposing the peakheights of the isotopic envelope into the relative contributionsof unlabeled (A), singly labeled (B1), and doubly labeled (B2)peptide species using a formula described earlier (16). In thismethod all non-labeled species are assumed to come fromthe non-labeled sample (A), and the proportion of peptidecoming from the labeled one is determined by adding up theproportion of singly labeled and doubly labeled species (i.e.B � B1 � B2). The ratio is then computed as A/(B1 � B2).
In this work we developed an improved algorithm that de-termines the same parameters by curve fitting of the isotopicenvelope obtained in ZoomScan spectra. This method isbased on the same assumption, uses the results obtained byour previous method as initial estimates, and makes a curvefitting to the peak envelope by using a peak shape model asexplained under “Experimental Procedures” and exemplifiedin Fig. 1, A–C. Among other advantages, this algorithm, towhich we will refer to as the standard method, allowed a moreaccurate quantification of proportions and also calculation oferrors of estimates from curve-fitting residuals.
Quantification Bias Associated to Incomplete 18O Ex-change—To test the performance of the standard method inthe practice, a negative control was prepared by making acomparative expression analysis of two identical aliquots of apeptide digest from a crude proteome extract from endothe-lial cells. The two samples were labeled with H2
16O and H218O
water, respectively, and mixed in equal proportion, and theirrelative proportions were analyzed. The distribution of ratiovalues was analyzed using a base 2 logarithmic scale, whichis a common practice for gene expression data and is ex-pected to produce a symmetric distribution tightly centeredon zero. We observed that the distribution of log2 ratios wasnot correctly centered on the expected value but was signif-icantly biased toward the non-labeled sample. Besides it wassignificantly asymmetric and showed an extended right tail(Fig. 2A).
After a close inspection of isotopic envelopes of peptides inthe labeled sample, we noticed that this distortion was due tothe presence of a small proportion of peptides having a lowbut significant proportion of non-labeled species. To analyzea possible oxygen back-exchange, labeled BSA tryptic di-gests were left at room temperature for several days in the
Improved Method for Quantitative Proteomics by 18O Labeling
Molecular & Cellular Proteomics 6.7 1277
presence of non-labeled water containing 1% formic acid; inthese experiments we did not observe any significant increasein the proportion of non-labeled species. However, the pro-portion of non-labeled species in the labeled proteome sam-ples mentioned above was found to be higher than 50% forsome peptides even when a fast analysis was performed justafter the labeling reaction. We concluded that the observedisotopic proportions are not due to oxygen back-exchangebut to an incomplete incorporation of [18O]water in a subset ofpeptides during the labeling reaction.
This was an unexpected observation given the reportedgood labeling behavior of tryptic peptide digests of BSA andother widely used purified proteins (10, 13, 29). In furtherexperiments with different proteomes, we obtained similarresults, corroborating the fact that the performance of thelabeling process cannot be extrapolated from simple proteinmixtures to very complex samples, such as those derivedfrom the analysis of whole proteomes. Using higher enzyme/substrate ratios or higher concentrations of organic solventsor diluting the peptides in these solvents before adding waterand enzyme failed to avoid the presence of residual amountsof peptides labeled at a low extent. These results suggest thatthis resistance toward C-terminal oxygen exchange is morestrongly dependent on an unknown set of peptide-specificstructural constraints, which are difficult to be controlled bythe user, than on the particular labeling conditions. This isparticularly relevant in the case of complex samples where,among a large number of structural patterns, there is a certainprobability of finding a subset displaying very slow exchangekinetics. Incomplete labeling of these particular peptides may
produce deviations in the expected mean ratio, suggestingtrue differential expression events.
A Kinetic Model for 18O Exchange—In an attempt to over-come this problem, we analyzed the kinetic behavior of thelabeling process. As described under “Experimental Proce-dures,” a mathematical analysis of the kinetic process re-vealed that the relative proportions of non-labeled and mono-and dilabeled species from any peptide and at any time alongthe labeling reaction are expected to relate to each otheraccording to Equations 1–3 even when the purity of [18O]wa-ter is low. According to this equation, it would be possible topredict the relative proportion of the three isotopic species forany peptide if the labeling efficiency f is known. Conversely itwould be possible to estimate the proportion of non-labeledspecies (B0) from that of the other two species (B1 and B2) andhence to correct for the lack of a complete incorporation of atleast one 18O atom.
To check the validity of the kinetic model and the predic-tions of Equations 1–3, a digested proteome extract from apreparation of T cells was dried down and subjected to tryp-sin-catalyzed 18O labeling under incomplete labeling condi-tions. This was done by performing the labeling incubation for24 h only, a time that we have observed previously not to besufficient to achieve a complete exchange for many peptides(13). The labeled peptides were analyzed by linear ion trapmass spectrometry, and the ZoomScan spectra were used forquantification using the standard method. Because in thisexperiment no non-labeled sample was mixed (i.e. A � 0), thisanalysis allowed us to determine the relative amounts of thethree isotopic species (B0, B1, and B2) and from these the
FIG. 1. Quantification of a trypticpeptide from the ZoomScan spectrumby the standard (left panels) and cor-rected methods (right panels). Thecomplex isotopic pattern of the triplycharged species corresponding to pep-tide KVPQVSTPTLVEVAR (dotted graylines) was fitted to the three parametersof each model as indicated; the rest ofthe fitting parameters, which are com-mon to the two models, are describedunder “Experimental Procedures.” Thebest fit curves (continuous lines) areshown in A and D, and the contributionof the different components are shown inB, C, E, and F as indicated by the letterson the curves. The relative proportion ofeach one of the components is alsoshown in the form of a bar diagram (in-sets in A and D).
Improved Method for Quantitative Proteomics by 18O Labeling
1278 Molecular & Cellular Proteomics 6.7
labeling efficiency f for each one of the peptides. In Fig. 3, theobserved proportions of the different species (circles) werecompared with the theoretical predictions given by Equations1–3 (solid lines). As shown, the majority of the peptides had alow proportion of non-labeled species, around or less than10% (open circles); the mean labeling efficiency was around0.7. As expected from our previous observations, a noticeable
number of peptides showed a significant proportion of non-labeled species, which in some cases reached 70% (Fig. 3).The relative proportion of the three species was in perfectagreement with the predictions of Equations 1–3 in all thepeptides without any exception. The same results have beenobtained in our laboratory after the analysis of other samples(not shown), strongly suggesting that the kinetic model isuniversally valid for this kind of labeling process, and hencepredictions given by Equations 1–3 may be potentially used tocorrect for an incomplete labeling efficiency.
A Corrected Method to Calculate Labeling Efficiency andCompensate for Incomplete 18O Labeling—As indicated ear-lier, all established quantification methods assume that theproportion of peptides in the non-labeled sample (A) corre-sponds to those of non-labeled species, whereas those in thelabeled sample (B) come from the mono- (B1) and dilabeledpeptide species (B2) (Fig. 1, A–C); this implicitly assumes thatthe proportion of non-labeled B species (B0) is negligible.However, from a kinetics viewpoint, peptide labeling pro-ceeds dynamically so that the proportion of B0 decreasesalong the oxygen exchange process but actually never takesa completely zero value. It is then difficult to ascertain at whatpoint of the kinetics can B0 be neglected in the quantification.Obviously it would be desirable to take always into accountthe proportion of non-labeled B species in the calculation ofpeptide ratios. With this idea in mind, we considered that theproportions of the three B species follow Equations 1–3 andhence may be calculated from a single parameter f and de-vised a modified algorithm where instead of fitting the Zoom-Scan isotope envelopes to a function constructed with theparameters A, B1, and B2 as in the standard method (Fig. 1,A–C) they are fitted to a function containing the parameters A,B, and f. The proportion of the three B components is calcu-lated using Equations 1–3, and the intensity of the first iso-
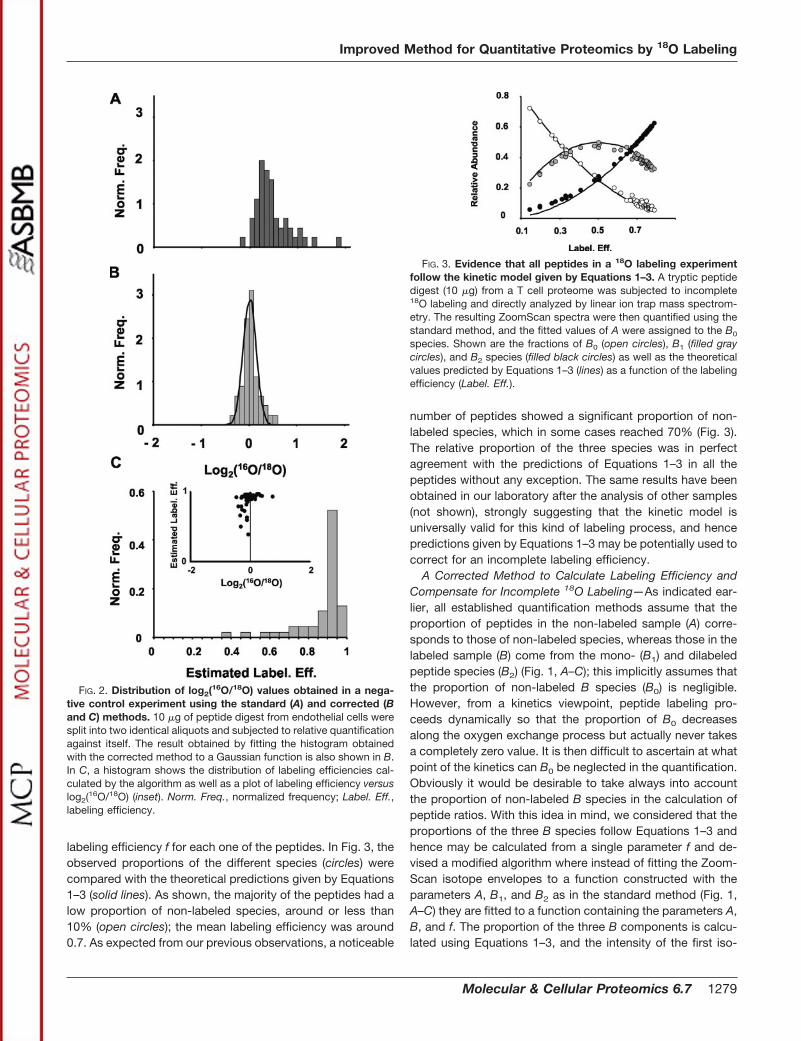
FIG. 2. Distribution of log2(16O/18O) values obtained in a nega-tive control experiment using the standard (A) and corrected (Band C) methods. 10 �g of peptide digest from endothelial cells weresplit into two identical aliquots and subjected to relative quantificationagainst itself. The result obtained by fitting the histogram obtainedwith the corrected method to a Gaussian function is also shown in B.In C, a histogram shows the distribution of labeling efficiencies cal-culated by the algorithm as well as a plot of labeling efficiency versuslog2(16O/18O) (inset). Norm. Freq., normalized frequency; Label. Eff.,labeling efficiency.
FIG. 3. Evidence that all peptides in a 18O labeling experimentfollow the kinetic model given by Equations 1–3. A tryptic peptidedigest (10 �g) from a T cell proteome was subjected to incomplete18O labeling and directly analyzed by linear ion trap mass spectrom-etry. The resulting ZoomScan spectra were then quantified using thestandard method, and the fitted values of A were assigned to the B0
species. Shown are the fractions of B0 (open circles), B1 (filled graycircles), and B2 species (filled black circles) as well as the theoreticalvalues predicted by Equations 1–3 (lines) as a function of the labelingefficiency (Label. Eff.).
Improved Method for Quantitative Proteomics by 18O Labeling
Molecular & Cellular Proteomics 6.7 1279
topic cluster is fitted to the sum of A and B0 (Fig. 1, D and E).This method, referred to here as the corrected method, makesit unnecessary to introduce additional fitting parameters, thusmaintaining the degrees of freedom and hence the goodnessof fit of the previous method. And despite its simplicity, itallows correcting for the presence of non-labeled B speciesand permits a direct and simultaneous calculation of theproportions of A and B and also of the specific efficiency withwhich each one of the peptides is labeled.
Performance of the Corrected Method for Equimolar ProteinMixtures—The performance of the corrected method wastested in the practice by applying it to the analysis of simple,equimolar protein mixtures subjected to incomplete labelingconditions. A tryptic digest of a mixture containing five differ-ent proteins was divided into two identical aliquots, and theywere subjected to trypsin-catalyzed enzymatic labeling in ei-ther H2
16O or H218O for 24 h. The two samples were then
mixed and analyzed by linear ion trap mass spectrometry. Theresulting spectra were then used for relative quantificationusing the standard and corrected methods. In Fig. 4A, theratios determined from peptides originating from the sameprotein were averaged and compared. As shown, by using thestandard method only two proteins could be accurately quan-
tified, and the ratios of the other three were clearly overesti-mated; besides these ratios, when considered at the peptidelevel, showed a large dispersion. In clear contrast, the cor-rected method took into account the bias produced by lowlabeling efficiencies, yielding ratios that in all the cases werevery close to the unity; this was reflected in the experimentalerror of the average ratios, which were much lower than thoseobtained with the standard method.
To analyze to what extent the corrected method was able tocompensate for low labeling efficiencies in the practice, atryptic digest from a complex protein mixture was again di-vided into two identical aliquots and subjected to labeling inthe same conditions of incomplete 18O incorporation. Therelative quantification results obtained by using the standard(empty circles) and the corrected methods (filled circles) werethen compared by plotting the labeling efficiencies of eachone of the quantified peptides versus the calculated ratios ina base 2 log scale (Fig. 4B). As shown, the ratios calculatedusing the standard method were gradually shifted towardincreasing values as the labeling efficiency of the peptidesdecreased; this shift was in good agreement with that theo-retically expected from the kinetic model according to Equa-tion 10 (Fig. 4B, black line), suggesting that the labeling effi-ciency was accurately estimated by using the correctedmethod. Consistently the log2 ratios determined using thecorrected method were centered on zero and showed no biaseven at labeling efficiencies as low as 0.2. These resultssuggested that the corrected method was able to compen-sate for the labeling efficiency effect in a wide range of valueswhen the ratios were around the unity.
The corrected algorithm was then applied to the analysis ofresults obtained with the endothelial cell peptide extract,which was labeled using the optimized conditions and wasanalyzed previously using the standard method (Fig. 2A). Asshown in Fig. 2B, the corrected algorithm eliminated the biasproduced by incomplete incorporation, generating a symmet-ric distribution of ratios centered on the 1:1 value, which wassatisfactorily fitted by a Gaussian envelope. Statistical analy-sis of these results failed to provide any peptide ratio showinga significant deviation from the average, thus confirming theinternal consistency of the method. The distribution of labelingefficiencies calculated by the corrected method together with aplot of efficiencies versus log2 ratios is shown in Fig. 2C.
Performance of the Corrected Method When Peptide RatiosTake Extreme Values—In a further set of experiments wetested the performance of the method in the extreme situa-tions of peptide ratios. For this purpose we used the samedataset used to test the kinetic model (Fig. 3), containinglabeled peptides only (i.e. A � 0 and B � 1), and analyzed theresults obtained by subjecting this sample to quantificationusing the corrected method. This served to determine to whatextent the modified algorithm was able to correctly assign thesignal coming from the first isotopic cluster to the B0 species.As shown in Fig. 5A, where the estimated labeling efficiencies
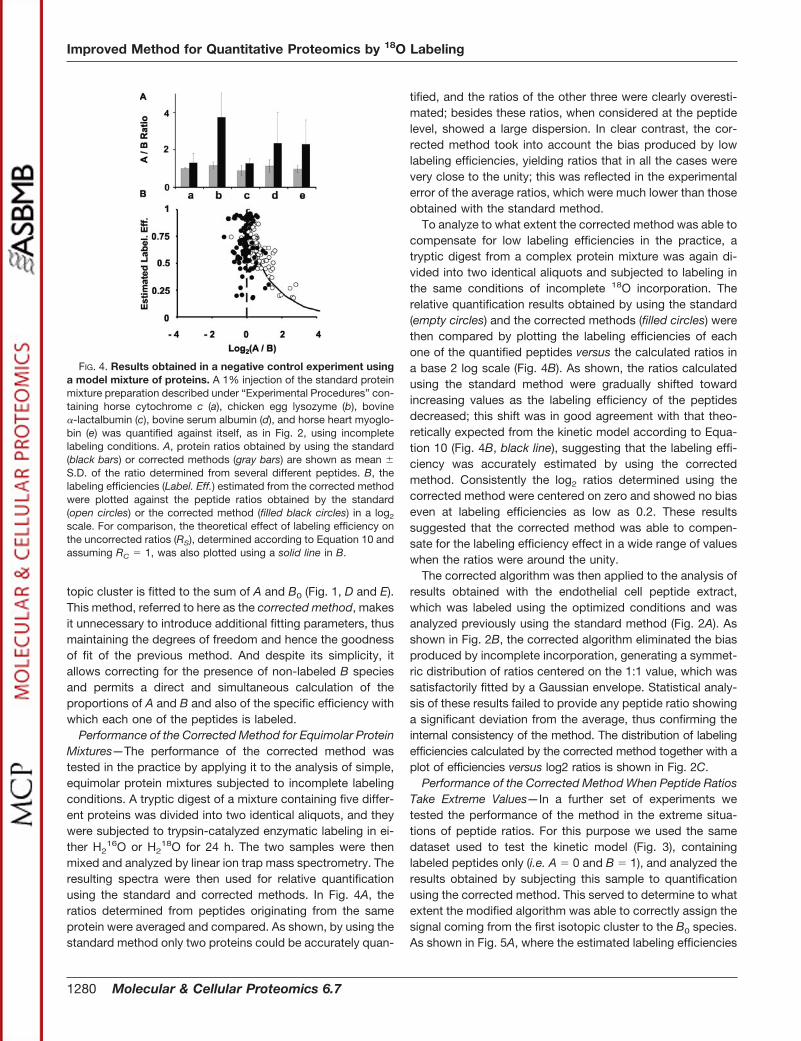
FIG. 4. Results obtained in a negative control experiment usinga model mixture of proteins. A 1% injection of the standard proteinmixture preparation described under “Experimental Procedures” con-taining horse cytochrome c (a), chicken egg lysozyme (b), bovine�-lactalbumin (c), bovine serum albumin (d), and horse heart myoglo-bin (e) was quantified against itself, as in Fig. 2, using incompletelabeling conditions. A, protein ratios obtained by using the standard(black bars) or corrected methods (gray bars) are shown as mean �S.D. of the ratio determined from several different peptides. B, thelabeling efficiencies (Label. Eff.) estimated from the corrected methodwere plotted against the peptide ratios obtained by the standard(open circles) or the corrected method (filled black circles) in a log2
scale. For comparison, the theoretical effect of labeling efficiency onthe uncorrected ratios (RS), determined according to Equation 10 andassuming RC � 1, was also plotted using a solid line in B.
Improved Method for Quantitative Proteomics by 18O Labeling
1280 Molecular & Cellular Proteomics 6.7
(i.e. the efficiencies computed by the method) are plotted as afunction of the real ones (i.e. the efficiencies calculated in Fig.3), the parameter f was calculated with good accuracy butonly when it was higher than 0.4; below this value, it wasoverestimated so that part of the intensity of the first isotopiccluster is erroneously assigned to the A component. Consis-tently when the estimated labeling efficiencies were plotted asa function of the ratios calculated using the standard method,the shift toward higher values was more marked than thatpredicted according to Equation 10 when labeling efficiencieswere lower than 0.4 (Fig. 5B, compare empty circles with thecurve). Similarly the corrected method was only able to makean efficient correction of the effect of labeling efficiency when
it was higher that 0.4 (Fig. 5B, filled circles). These resultsindicated that in these conditions a minimum labeling effi-ciency was actually needed in the practice to make an effi-cient correction; when a corrected peptide ratio is low, itshould only be trusted provided that the labeling efficiencyestimated by the algorithm is at least higher than 0.5.
The algorithm was then applied to the analysis of a non-labeled peptide digest (i.e. A � 1 and B � 0). In theseconditions, errors in estimation of labeling efficiency did nothave any appreciable effect on the calculation of B using thecorrected method because the estimated value of B took in allcases a very low value close to zero. These results are illus-trated in the histogram of Fig. 5C; as shown, 96% of thepeptides were assigned an A value equal to or higher than 0.9,and the lowest value of A determined from this experimentwas 0.8. Similar results were also obtained when analyzingpeptides at a ratio of 76:1 (not shown). These results showedthat the corrected method was also able to produce accuratevalues for peptides displaying a high ratio.
Although the labeling efficiency has no significant effect onthe calculation of corrected ratios when A �� B, it should benoted that in the extreme case of a completely non-labeledpeptide it is mathematically impossible to distinguish betweena very high ratio (A 1) and a very low labeling efficiency (f
0). In this situation, these two solutions produce the samecurve fitting to the isotope envelope. The reason that thecorrected algorithm produces consistent and reproducibleresults with A 1 is that the starting parameters for the curvefitting are estimated from a model that implicitly assumes thatthere are no non-labeled B species (B0 0), i.e. that labelingefficiency is high; hence the corrected method converges tothe first solution. Although this may in theory confound thecorrected algorithm, in the practice it only happens when thelabeling efficiency is very close to zero, and this is a situationthat we have never observed experimentally even when usingincomplete labeling conditions. Besides this situation is easilyavoided in the practice by checking that labeling efficienciesdo not take values that are too low. In a situation like that ofFig. 4B, for instance, it would be enough to keep the efficien-cies above 0.2, whereas in conditions with more extremeratios, like those of Fig. 5, B and C, labeling efficiencies mustbe cautiously kept above 0.5. We conclude that our analysisgives solid evidence that the corrected method makes veryefficient corrections for labeling efficiency in any range ofratios provided that a reasonable level of labeling is experi-mentally achieved.
Application of the Corrected Method to the Analysis ofDifferential Expression Events Induced by Stimulation of TCells—After the encouraging results obtained with controlledexperiments where the peptide ratios were a priori known, weapplied this method to analyze changes in the protein patternof small amounts of a crude proteome from a preparation of Tcells when they were stimulated with anti-CD3 antibody. Forthis end, samples from control and stimulated preparations
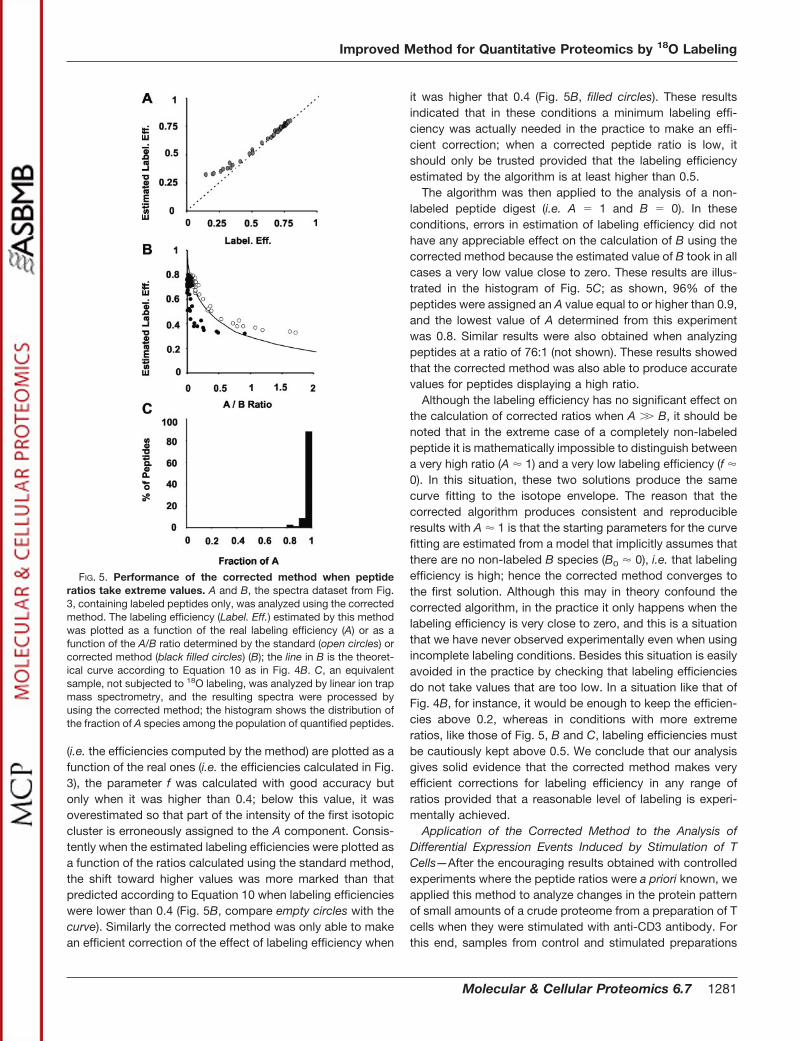
FIG. 5. Performance of the corrected method when peptideratios take extreme values. A and B, the spectra dataset from Fig.3, containing labeled peptides only, was analyzed using the correctedmethod. The labeling efficiency (Label. Eff.) estimated by this methodwas plotted as a function of the real labeling efficiency (A) or as afunction of the A/B ratio determined by the standard (open circles) orcorrected method (black filled circles) (B); the line in B is the theoret-ical curve according to Equation 10 as in Fig. 4B. C, an equivalentsample, not subjected to 18O labeling, was analyzed by linear ion trapmass spectrometry, and the resulting spectra were processed byusing the corrected method; the histogram shows the distribution ofthe fraction of A species among the population of quantified peptides.
Improved Method for Quantitative Proteomics by 18O Labeling
Molecular & Cellular Proteomics 6.7 1281

were adjusted for the total protein content (5 �g each), tryp-sin-digested, desalted, and subjected to enzymatic labelingfor 48 h. The stimulated sample was labeled with H2
18O,whereas the control was incubated with non-labeled water.The mixtures were then mixed and analyzed by linear ion trapmass spectrometry in only one HPLC run using a long gradi-ent. MS/MS spectra were then subjected to a databasesearch using SEQUEST, and the FDR of peptide identificationwas calculated using a previously published empirical method(21). 849 MS/MS spectra were encountered having a FDR of5%; they allowed the identification of 570 unique peptidesbelonging to 235 unique proteins. Among the ZoomScanspectra corresponding to these peptides, 495 were of suffi-cient quality to allow quantification; these spectra corre-sponded to 317 unique peptides belonging to 119 differentproteins.
When quantification data obtained using the standardmethod was analyzed, despite the long labeling times used,the distribution of log2 ratio values was again found to besignificantly biased toward the control sample and showed anextended right tail (Fig. 6A). Analyzing the data using thecorrected method, it was possible to estimate the labelingefficiency f of each one of the quantified peptides. A semilogplot of f versus the ratios obtained by the standard method(Fig. 6C) revealed that the vast majority of peptides werelabeled with an efficiency around 0.75; this is a typical result
using the labeling conditions optimized in a previous study(13), and at this efficiency the proportion of non-labeled sam-ple (B0) only accounts for 6% of the total amount of B.However, Fig. 6C also revealed the presence of a subpopu-lation of peptides labeled with a lower efficiency whose ratiosare shifted toward higher values. These peptides were re-sponsible for the bias of the distribution toward higher ratiosand the presence of a right tail. In contrast, when the cor-rected method was used, the bias in the distribution wasefficiently corrected and appeared centered at the 1:1 ratio,indicating that the two samples were in fact correctly adjustedfor their protein content, and the log2 ratio histogram could befitted to a symmetric Gaussian distribution (Fig. 6, B and D)with no evidence of a right tail, indicating that it was producedby peptides with a low labeling efficiency and not by truedifferential expression events.
A representative example of how the correction for labelingefficiency is made in poorly labeled peptides by using themodified method is shown in Fig. 7, A–D. This figure showsthe ZoomScan spectra of four different peptides correspond-ing to the same protein. The ratios obtained using the stand-ard method were 3.19, 1.54, 1.24, and 1.16, respectively. Asit can be seen, the first peptide, which shows an unusually lowincorporation of 18O with a labeling efficiency of 0.37 (Fig. 7A),yields a shifted ratio measurement that would have indicateda significant expression change. However, the ratio calculatedusing the corrected method is in much better accordance withthat of the other ones (Fig. 7, B–D) despite that its isotopicenvelope might resemble that of an unlabeled peptide. Thecorrected ratios were 1.48, 1.29, 1.07, and 1.05, respectively,and none of them reflects a significant change in expression.Another example is found in Fig. 1 where a triply chargedpeptide with a rather low labeling efficiency was quantifiedusing the standard and the corrected methods.
Statistical significance analysis of expression changes wasthen applied taking into account both the Gaussian ratiodistribution obtained using the modified method and the er-rors associated to ratio calculation by curve fitting by usingerror propagation theory. We used a criterion based on theFDR defined in this context as the proportion of peptides thatby chance alone are expected to display a similar increase ordecrease in their ratios among the population of peptides witha given p value. We believe that this criterion, similar to thatused for peptide identification (21), is much more adequatethan conventional ones based on plain p values because ittakes effectively into account the total number of quantifiedpeptide pairs and estimates the number of expected peptidepairs that by chance alone deviate from the distribution. Asshown in Table I, accepting a FDR not higher than 5%, onlysix spectra corresponding to tryptic peptides were detectedas displaying significant expression changes; they belongedto three proteins, actin, histone H4, and thrombospondin-1.Two further peptides with an FDR below 12% and belongingto the same set of proteins were also considered significant.
FIG. 6. Quantification of peptide ratios obtained from the anal-ysis of total protein extracts from control or anti-CD3-stimulatedT cells using the standard (left panels) and corrected method(right panels). Data were obtained after the analysis by linear ion trapmass spectrometry of 5 �g from each protein extract as explainedunder “Experimental Procedures.” Shown are the distribution of pep-tide ratios in log2 scale histograms (A and B) and the semilog plots oflabeling efficiency (Label. Eff.), estimated using the corrected method,as a function of peptide ratios determined using the standard (C) andcorrected methods (D). A and B also show the best fits of the histo-grams to Gaussian curves (lines) as well as details of the histogramsdrawn at a higher scale (insets). Lines in C and D are drawn accordingto Equations 8–10 as in Fig. 4B. Norm. Freq., normalized frequency.
Improved Method for Quantitative Proteomics by 18O Labeling
1282 Molecular & Cellular Proteomics 6.7
These proteins were identified by three additional peptides;although they did not pass the rigorous statistical criterion, allof them still displayed expression changes that were in goodagreement with that of the other peptides belonging to thesame protein (Table I). One of the histone H4 peptides wasquantified in its oxidized form. During the analysis of Zoom-Scan spectra, we also observed one that suggested a veryclear expression change but whose MS/MS spectra did notgive a significant match in databases. This spectrum wassubjected to de novo sequencing using the program DeNo-
voX 1.0, and the resulting sequence tags were subjected to astring database search yielding an actin-like sequence; man-ual inspection of the MS/MS spectra and SEQUEST databasesearch using non-enzyme constraints finally confirmed thatthis spectrum belonged to a non-tryptic peptide from actin(Table I). Representative ZoomScan spectra of some of thesepeptides are shown in Fig. 7, E–H; the spectra of the remain-ing peptides can be found in the supplemental information,which also contains the complete list of peptides quantified inthis experiment.
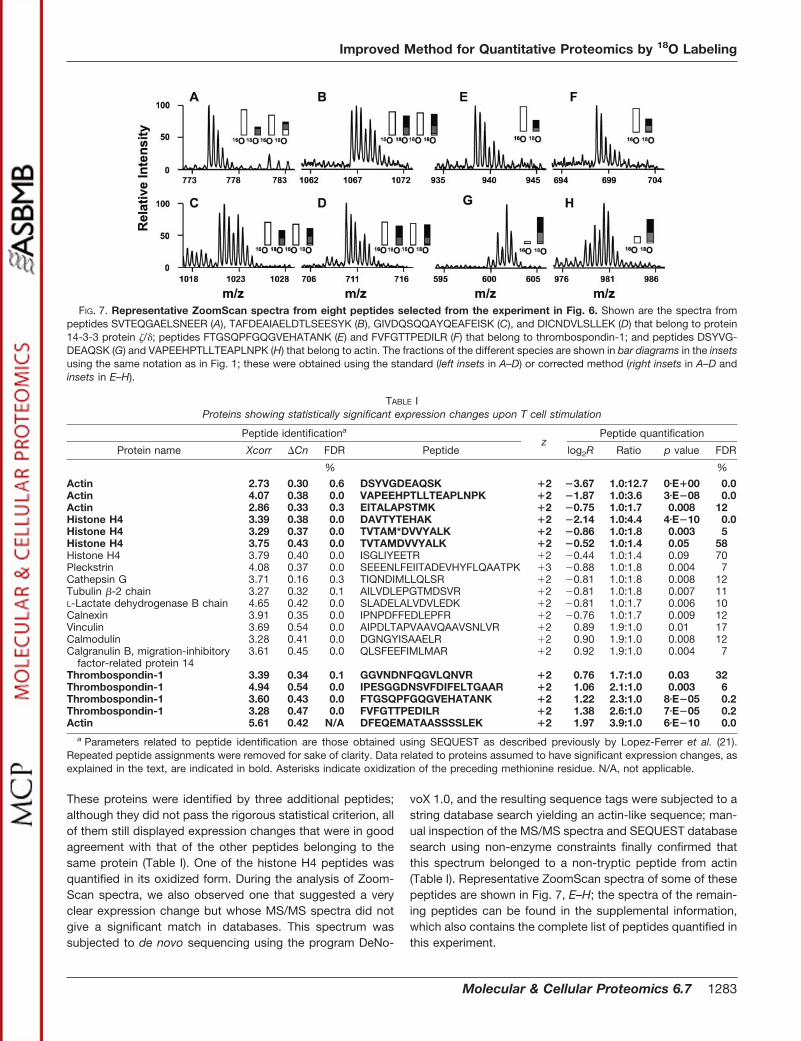
FIG. 7. Representative ZoomScan spectra from eight peptides selected from the experiment in Fig. 6. Shown are the spectra frompeptides SVTEQGAELSNEER (A), TAFDEAIAELDTLSEESYK (B), GIVDQSQQAYQEAFEISK (C), and DICNDVLSLLEK (D) that belong to protein14-3-3 protein /; peptides FTGSQPFGQGVEHATANK (E) and FVFGTTPEDILR (F) that belong to thrombospondin-1; and peptides DSYVG-DEAQSK (G) and VAPEEHPTLLTEAPLNPK (H) that belong to actin. The fractions of the different species are shown in bar diagrams in the insetsusing the same notation as in Fig. 1; these were obtained using the standard (left insets in A–D) or corrected method (right insets in A–D andinsets in E–H).
TABLE IProteins showing statistically significant expression changes upon T cell stimulation
Peptide identificationa
zPeptide quantification
Protein name Xcorr Cn FDR Peptide log2R Ratio p value FDR
% %
Actin 2.73 0.30 0.6 DSYVGDEAQSK �2 �3.67 1.0:12.7 0�E�00 0.0Actin 4.07 0.38 0.0 VAPEEHPTLLTEAPLNPK �2 �1.87 1.0:3.6 3�E�08 0.0Actin 2.86 0.33 0.3 EITALAPSTMK �2 �0.75 1.0:1.7 0.008 12Histone H4 3.39 0.38 0.0 DAVTYTEHAK �2 �2.14 1.0:4.4 4�E�10 0.0Histone H4 3.29 0.37 0.0 TVTAM*DVVYALK �2 �0.86 1.0:1.8 0.003 5Histone H4 3.75 0.43 0.0 TVTAMDVVYALK �2 �0.52 1.0:1.4 0.05 58Histone H4 3.79 0.40 0.0 ISGLIYEETR �2 �0.44 1.0:1.4 0.09 70Pleckstrin 4.08 0.37 0.0 SEEENLFEIITADEVHYFLQAATPK �3 �0.88 1.0:1.8 0.004 7Cathepsin G 3.71 0.16 0.3 TIQNDIMLLQLSR �2 �0.81 1.0:1.8 0.008 12Tubulin �-2 chain 3.27 0.32 0.1 AILVDLEPGTMDSVR �2 �0.81 1.0:1.8 0.007 11L-Lactate dehydrogenase B chain 4.65 0.42 0.0 SLADELALVDVLEDK �2 �0.81 1.0:1.7 0.006 10Calnexin 3.91 0.35 0.0 IPNPDFFEDLEPFR �2 �0.76 1.0:1.7 0.009 12Vinculin 3.69 0.54 0.0 AIPDLTAPVAAVQAAVSNLVR �2 0.89 1.9:1.0 0.01 17Calmodulin 3.28 0.41 0.0 DGNGYISAAELR �2 0.90 1.9:1.0 0.008 12Calgranulin B, migration-inhibitory
factor-related protein 143.61 0.45 0.0 QLSFEEFIMLMAR �2 0.92 1.9:1.0 0.004 7
Thrombospondin-1 3.39 0.34 0.1 GGVNDNFQGVLQNVR �2 0.76 1.7:1.0 0.03 32Thrombospondin-1 4.94 0.54 0.0 IPESGGDNSVFDIFELTGAAR �2 1.06 2.1:1.0 0.003 6Thrombospondin-1 3.60 0.43 0.0 FTGSQPFGQGVEHATANK �2 1.22 2.3:1.0 8�E�05 0.2Thrombospondin-1 3.28 0.47 0.0 FVFGTTPEDILR �2 1.38 2.6:1.0 7�E�05 0.2Actin 5.61 0.42 N/A DFEQEMATAASSSSLEK �2 1.97 3.9:1.0 6�E�10 0.0
a Parameters related to peptide identification are those obtained using SEQUEST as described previously by Lopez-Ferrer et al. (21).Repeated peptide assignments were removed for sake of clarity. Data related to proteins assumed to have significant expression changes, asexplained in the text, are indicated in bold. Asterisks indicate oxidization of the preceding methionine residue. N/A, not applicable.
Improved Method for Quantitative Proteomics by 18O Labeling
Molecular & Cellular Proteomics 6.7 1283
Just for illustrative purposes, Table I also shows the resultsthat would have been obtained using a common but lessrigorous criterion; using as a threshold a p value lower than0.01 (i.e. 99% confidence), eight additional peptides wouldhave been detected as reflecting a significant change. Inter-estingly all of them belonged to different proteins, and four ofthese belonged to proteins that were also quantified by otherpeptides not showing significant expression changes. Thisobservation supports the validity of using the FDR criterion todetect significant expression changes.
The expression changes detected by this method appear toreflect true differential expression events because the threeproteins identified have been implicated previously in T cellactivation and other functions. Thus, thrombospondin-1, anadhesive secreted glycoprotein that mediates cell-to-cell andcell-to-matrix interactions, has been shown to play a role in Tcell activation by anti-CD3 (30); interaction of this protein withCD47 has also been shown to mediate expansion of inflam-matory T cells (31). Histone H4 gene activation has beenrelated to cell cycle activation (32), and it has also beenimplied in chromatin remodeling in response to T cell activa-tion (33). Similarly actin cytoskeletal rearrangement is knownto occur upon T cell stimulation (34). In this regard, the non-tryptic actin peptide is probably the result of a proteolyticevent. Besides actin presents a rather large number of iso-forms in databases, and the four identified peptides are nothomogeneously distributed among them, making it impossi-ble to assign unequivocally the observed changes at theprotein level; in addition, each one of the peptides is presentin at least one isoform that does not contain the other ones.Cytoskeletal rearrangements probably affect the several actintypes in a different manner, thus explaining the differences inexpression ratios observed at the peptide level that were notobserved in any other protein in this experiment (see supple-mental information). In conclusion, the method was able todetect specific expression changes in three proteins, whichare consistent with the process of T cell activation, among apool of more than 100 proteins that did not exhibit significantvariation in their cellular content.
DISCUSSION
In the original methods for 18O labeling, it was assumed thattrypsin-catalyzed exchange reactions proceed completely tothe doubly labeled (�4 Da) species (14, 15). Later it wasacknowledged that although complete exchange is not al-ways achieved, complete incorporation of at least one 18Oatom was considered feasible in the practice. This allowedusing quantification algorithms where the isotopic envelope ofthe peptide pairs was assumed to be composed by oneisotopic cluster deriving from the non-labeled species, orsample A, and another two clusters deriving from the mono-(B1) and dilabeled (B2) species, which together compose thesample B (B � B1 � B2) (16–19). To achieve a completeincorporation of at least one oxygen, several labeling proto-
cols have been described. A number of groups have reportedefficient stable incorporation through a variety of ways, eachone pointing out a set of recommendations to ensure theefficiency of the labeling process. The variability in the proto-cols spans the postdigestion buffer pH, the initial solubiliza-tion with strong organic solvents (acetonitrile or DMSO), theaddition of calcium chloride, or the inactivation of trypsin afterlabeling to avoid back-exchange among others (10, 29, 35).To date, none of these methods is still considered a standard.Postdigestion labeling strategies relying on other proteases(9, 11, 12) add further complexity to the situation. Besides anddue to the small difference in the masses of the two labeledand the non-labeled species, to obtain accurate results, aminimum mass resolution is needed, limiting the use of pop-ular mass spectrometers like ion traps. These technical prob-lems have limited the universal application of this quantifica-tion method.
In a previous work we reported an optimized labeling pro-tocol and demonstrated that this method may be used forpeptide quantification by using linear ion trap mass spectrom-etry and performing high resolution scans in narrow massranges (ZoomScan) (13). In the present work, we tried tofurther automate this method by developing a peak-fittingalgorithm that takes into account all the information containedin the whole isotopic envelope and not just the heights of thefirst, third, and fifth peaks (Fig. 1, left panels). This algorithmwas more robust than previous ones, and by assessing thegoodness of fit, it allowed the evaluation of the accuracy of fitand hence the introduction of statistically relevant informationabout the estimation of ratios. However, when this improvedalgorithm was applied in the practice to the analysis of acomplex mixture of peptides derived from real proteomes, wenoticed that a small but significant proportion of the peptideshad no complete incorporation of at least one 18O atom evenwhen optimized protocols were used, producing a significantbias in the ratio distribution and false positive changes inexpression ratios. Apparently when labeling very complexpeptide pools, the probability of finding specific peptidesshowing a particularly low rate of 16O/18O exchange in-creased with the number of different peptides present in thesample so that some of them may be spuriously found not tobe completely labeled with at least one 18O atom.
To deal with this situation, we considered that the labelingprocess should actually be treated as a kinetic reaction whereeach one of the peptides had its own specific rate andreached a certain labeling efficiency after the exchange reac-tion step. Consistently the peptide population is expected todisplay a certain distribution of labeling efficiencies so that theproportion of completely non-labeled species should never beneglected; it may be more or less close to zero depending onthe labeling efficiency of each peptide. When peptide labelingbehavior was analyzed in the practice, we found that labelingof all peptides analyzed followed precisely a kinetic exchangemodel where the fraction of non-labeled and mono- and di-
Improved Method for Quantitative Proteomics by 18O Labeling
1284 Molecular & Cellular Proteomics 6.7
labeled species could be accurately predicted as a function ofthe labeling efficiency. This relation, given by Equations 1–3,was independent of kinetic exchange rates and hence ofpeptide sequence or catalytic rate of the enzyme. The exist-ence of a fixed relation between the three B species (B0, B1,and B2) allowed the development of a modified algorithm thatby direct curve fitting simultaneously determined the correctproportion of the A and B species and also of the labelingefficiency f that better explained the isotope distribution (Fig.1). This procedure maintains the degrees of freedom andovercomes the limitation of current methods; it is in theory ofpotential application in any point of the exchange reactionprocess even when low purity [18O]water is used.
Our results also indicate that the modified method is accu-rate in the practice even when peptide ratios take extremevalues provided that a minimum labeling efficiency, as calcu-lated by the algorithm itself, is reached. Although peptideslabeled with lower efficiencies could be accurately quantified,a conservative criterion is to use a minimum f value of about0.4 for a trustable quantification. This means that the modifiedalgorithm is able to efficiently compensate for a proportion ofnon-labeled peptide species as high as 36%. Expressionratios for peptides with lower f values should be consideredwith caution or even rejected. Direct calculation of labelingefficiency is also extremely useful in the practice to determinethe goodness of the experiment and the general confidence tointerpret quantification of peptide pairs. For this purpose theefficiencies estimated by the algorithm itself may be used toascertain the degree of labeling achieved in the experiment;the efficiency versus log2 ratios plots are particularly inform-ative to inspect the validity of the corrected ratios. Someexamples of these plots, obtained under different conditionsof labeling, are presented in this work where it is shown howexperimental bias related to labeling efficiency is effectivelyremoved, and there is a complete absence of false positiveswhen performing the quantification of complex peptide sam-ples against themselves.
The validity of the modified method was tested in the prac-tice by determining significant expression changes producedby the activation of T cells with only 5 �g of protein extracts.More than 300 peptide pairs, corresponding to 100 proteins,could be quantified, yielding a symmetric Gaussian distribu-tion of ratios closely centered around 1:1. Although the widthof the ratio distribution suggested that statistically significantchanges in expression ratios even lower than 2-fold could beaccurately detected at the 95% confidence level, we used amore rigorous statistical criterion. First, we took advantage ofthe curve-fitting algorithm, which allowed estimation of theerror associated to calculation of the ratio in each determina-tion; this error was taken into account in the calculation of thep value with respect to the null hypothesis. Second, we con-sidered all the expression data obtained in the experiment asa whole and calculated the FDR, or proportion of peptidesthat were expected to display just by chance a similar or
higher change in expression ratio, at the same p threshold.The importance of taking into account all these factors be-comes evident by the following considerations. Using theconventional statistical significance level of 95%, i.e. a pthreshold of 0.05, 43 peptide pairs would have been detectedas having a significant deviation in the ratio, corresponding tothe 19 unique peptides shown in Table I. However, the 5% ofthe total population of quantified peptide pairs used to con-struct the Gaussian distribution amounts to 25 peptides; thismeans that 58% of the observed changes are expected tooccur by chance alone (Table I). In addition, if the propagationof fit errors and the labeling efficiency correction are alsoomitted, the number of spectra in the set of differential ex-pression candidates rises to 87 among which 66.3% areexpected to occur by chance alone. Obviously and despitethat it is widely used in this kind of quantitative experiments,using a prefixed p value is not an acceptable criterion by itselfand leads to a false impression of high sensitivity at theexpense of error rates that may become very large. In thisparticular experiment, we found it necessary to lower the pthreshold down to 0.003, i.e. to use a 99.7% confidence level,until we achieved a satisfactory maximum error rate of 5%.The validity of this procedure is validated by the fact that allthe expression changes detected at the peptide level arecoherent among peptides belonging to the same proteins andare assigned to proteins that are known to be associated withT cell activation.
In conclusion, our results show that by introducing a cor-rection for labeling efficiency in the quantification algorithm,18O labeling is a good quantitative method for shotgun pro-teomics analysis of highly complex peptide mixtures. Themethod described here is not only more robust and accuratethat others described previously, but it also provides a meansto determine the labeling performance obtained in the exper-iment. We think that this is an important advantage in thepractice because stable isotope dilution techniques for quan-titative proteomics are still not widely implemented, andskilled users with experience in controlling all the experimen-tal factors related to labeling incorporation and quantificationsoftware are required. We also think that our approach makesthe 18O labeling method particularly attractive due to its sim-plicity, its almost universal applicability, the reasonabletradeoff between performance and costs, and the fact thatthis may be performed in the practice without high resolutionmachines using linear ion traps.
Acknowledgments—We are grateful to M. Carrascal, J. Abian, andA. Martınez-Ruiz for kindly providing the cell protein extracts and to F.Martın-Maroto and X. Du for helpful comments on differentialequations.
* This work was supported by Comision Interministerial de Cienciay Tecnologıa Grants BIO2003-01805 and BIO2006-10085, Comu-nidad Autonoma de Madrid Grants GR/SAL/0141/2004 and S2006/BIO-0194, by the Spanish Cardiovascular Research Network (RE-CAVA), and by an institutional grant by Fundacion Ramon Areces to
Improved Method for Quantitative Proteomics by 18O Labeling
Molecular & Cellular Proteomics 6.7 1285
Centro de Biologıa Molecular Severo Ochoa. The costs of publicationof this article were defrayed in part by the payment of page charges.This article must therefore be hereby marked “advertisement” inaccordance with 18 U.S.C. Section 1734 solely to indicate this fact.
□S The on-line version of this article (available at http://www.mcponline.org) contains supplemental material.
‡ Present address: Centro Nacional de Biotecnologıa, UniversidadAutonoma de Madrid, 28049 Cantoblanco, Madrid, Spain.
§ Present address: Biological Sciences Division and EnvironmentalMolecular Sciences Laboratory, Pacific Northwest National Labora-tory, Richland, WA 99352.
¶ To whom correspondence should be addressed: Centro de Bio-logıa Molecular Severo Ochoa, Universidad Autonoma de Madrid,28049 Cantoblanco, Madrid, Spain. Tel.: 34-91-497-8276; Fax: 34-91-497-8087; E-mail: [email protected].
REFERENCES
1. Canas, B., Lopez-Ferrer, D., Ramos-Fernandez, A., Camafeita, E., andCalvo, E. (2006) Mass spectrometry technologies for proteomics. Brief.Funct. Genomics Proteomics 4, 295–320
2. Gygi, S. P., Rist, B., Gerber, S. A., Turecek, F., Gelb, M. H., and Aebersold,R. (1999) Quantitative analysis of complex protein mixtures using iso-tope-coded affinity tags. Nat. Biotechnol. 17, 994–999
3. Ross, P. L., Huang, Y. N., Marchese, J. N., Williamson, B., Parker, K.,Hattan, S., Khainovski, N., Pillai, S., Dey, S., Daniels, S., Purkayastha, S.,Juhasz, P., Martin, S., Bartlet-Jones, M., He, F., Jacobson, A., andPappin, D. J. (2004) Multiplexed protein quantitation in Saccharomycescerevisiae using amine-reactive isobaric tagging reagents. Mol. Cell.Proteomics 3, 1154–1169
4. Oda, Y., Huang, K., Cross, F. R., Cowburn, D., and Chait, B. T. (1999)Accurate quantitation of protein expression and site-specific phospho-rylation. Proc. Natl. Acad. Sci. U. S. A. 96, 6591–6596
5. Berger, S. J., Lee, S. W., Anderson, G. A., Pasa-Tolic, L., Tolic, N., Shen, Y.,Zhao, R., and Smith, R. D. (2002) High-throughput global peptide pro-teomic analysis by combining stable isotope amino acid labeling anddata-dependent multiplexed-MS/MS. Anal. Chem. 74, 4994–5000
6. Ong, S. E., Blagoev, B., Kratchmarova, I., Kristensen, D. B., Steen, H.,Pandey, A., and Mann, M. (2002) Stable isotope labeling by amino acidsin cell culture, SILAC, as a simple and accurate approach to expressionproteomics. Mol. Cell. Proteomics 5, 376–386
7. Mirgorodskaya, O. A., Kozmin, Y. P., Titov, M. I., Korner, R., Sonksen, C. P.,and Roepstorff, P. (2000) Quantitation of peptides and proteins by ma-trix-assisted laser desorption/ionization mass spectrometry using 18O-labeled internal standards. Rapid Commun. Mass Spectrom. 14,1226–1232
8. Yao, X., Freas, A., Ramirez, J., Demirev, P. A., and Fenselau, C. (2001)Proteolytic 18O labeling for comparative proteomics: model studies withtwo serotypes of adenovirus. Anal. Chem. 13, 2836–2842
9. Reynolds, K. J., Yao, X., and Fenselau, C. (2002) Proteolytic 18O labeling forcomparative proteomics: evaluation of endoprotease Glu-C as the cat-alytic agent. J. Proteome Res. 1, 27–33
10. Yao, X., Afonso, C., and Fenselau, C. (2003) Dissection of proteolytic 18Olabeling: endoprotease-catalyzed exchange of truncated peptide sub-strates. J. Proteome Res. 2, 147–152
11. Rao, K. C. S., Carruth, R. T., and Miyagi, M. (2005) Proteolytic 18O labelingby peptidyl-Lys metalloendopeptidase for comparative proteomics. J.Proteome Res. 4, 507–514
12. Rao, K. C. S., Palamalai, V., Dunlevy, J. R., and Miyagi, M. (2005) Peptidyl-Lys metalloendopeptidase-catalyzed 18O labeling for comparative pro-teomics: application to cytokine/lipopolysaccharide-treated human reti-nal pigment epithelium cell line. Mol. Cell. Proteomics 10, 1550–1557
13. Lopez-Ferrer, D., Ramos-Fernandez, A., Martinez-Bartolome, S., Garcia-Ruiz, P., and Vazquez, J. (2006) Quantitative proteomics using 16O/18Olabeling and linear ion trap mass spectrometry. Proteomics 6, Suppl. 1,S4–S11
14. Heller, M., Mattou, H., Menzel, C., and Yao, X. (2003) Trypsin catalyzed
16O-to-18O exchange for comparative proteomics: tandem mass spec-trometry comparison using MALDI-TOF, ESI-QTOF, and ESI-ion trapmass spectrometers. J. Am. Soc. Mass Spectrom. 7, 704–718
15. Shinkawa, T., Taoka, M., Yamauchi, Y., Ichimura, T., Kaji, H., Takahashi, N.,and Isobe, T. (2005) STEM: a software tool for large-scale proteomic dataanalyses. J. Proteome Res. 5, 1826–1831
16. Zang, L., Palmer Toy, D., Hancock, W. S., Sgroi, D. C., and Karger, B. L.(2004) Proteomic analysis of ductal carcinoma of the breast using lasercapture microdissection, LC-MS, and 16O/18O isotopic labeling. J. Pro-teome Res. 3, 604–612
17. Halligan, B. D., Slyper, R. Y., Twigger, S. N., Hicks, W., Olivier, M., andGreene, A. S. (2005) ZoomQuant: an application for the quantitation ofstable isotope labeled peptides. J. Am. Soc. Mass Spectrom. 3, 302–306
18. Zhang, X., Hines, W., Adamec, J., Asara, J. M., Naylor, S., and Regnier,F. E. (2005) An automated method for the analysis of stable isotopelabeling data in proteomics. J. Am. Soc. Mass Spectrom. 7, 1181–1191
19. Johnson, K. L., and Muddiman, D. C. (2004) A method for calculating16O/18O peptide ion ratios for the relative quantification of proteomes.J. Am. Soc. Mass Spectrom. 4, 437–445
20. Boyum, A. (1968) Isolation of mononuclear cells and granulocytes fromhuman blood. Scand. J. Clin. Lab. Investig. Suppl. 97, 77–89
21. Lopez-Ferrer, D., Martinez-Bartolome, S., Villar, M., Campillos, M., Martin-Maroto, F., and Vazquez, J. (2004) Statistical model for large-scalepeptide identification in databases from tandem mass spectra usingSEQUEST. Anal. Chem. 23, 6853–6860
22. Chapman, J. R. (ed) (1996) Protein and Peptide Analysis by Mass Spec-trometry (Methods in Molecular Biology), 1st Ed., Humana Press, To-towa, NJ
23. Magar, E. M. (1972) Data Analysis in Biochemistry and Biophysics, Aca-demic Press, New York
24. Li, X. J., Zhang, H., Ranish, J. A., and Aebersold, R. (2003) Automatedstatistical analysis of protein abundance ratios from data generated bystable-isotope dilution and tandem mass spectrometry. Anal. Chem. 23,6648–6657
25. Taylor, J. R. (1997) An Introduction to Error Analysis: the Study of Uncer-tainties in Physical Measurements, 2nd Ed., University Science Press,Sausalito, CA
26. Quackenbush, J. (2002) Microarray data normalization and transformation.Nat. Genet. 32, 496–501
27. Benjamini, Y., and Hochberg, Y. (1995) Controlling the false discovery rate:a practical and powerful approach to multiple testing. J. R. Stat. Soc. B57, 289–300
28. Storey, J. D., and Tibshirani, R. (2003) Statistical significance for genome-wide studies. Proc. Natl. Acad. Sci. U. S. A. 16, 9440–9945
29. Bantscheff, M., Dumpelfeld, B., and Kuster, B. (2004) Femtomole sensitivitypost-digest 18O labeling for relative quantification of differential proteincomplex composition. Rapid Commun. Mass Spectrom. 8, 869–876
30. Zamiri, P., Masli, S., Kitaichi, N., Taylor, A. W., and Streilein, J. W. (2005)Thrombospondin plays a vital role in the immune privilege of the eye.Investig. Ophthalmol. Vis. Sci. 46, 908–919
31. Vallejo, A. N., Yang, H., Klimiuk, P. A., Weyand, C. M., and Goronzy, J. J.(2003) Synoviocyte-mediated expansion of inflammatory T cells in rheu-matoid synovitis is dependent on CD47-thrombospondin 1 interaction.J. Immunol. 171, 1732–1740
32. Aziz, F., van Wijnen, A. J., Stein, J. L., and Stein, G. S. (1998) HiNF-D(CDP-cut/CDC2/cyclin A/pRB-complex) influences the timing of IRF-2-dependent cell cycle activation of human histone H4 gene transcriptionat the G1/S phase transition. J. Cell. Physiol. 177, 453–464
33. Chen, X., Wang, J., Woltring, D., Gerondakis, S., and Shannon, M. F. (2005)Histone dynamics on the interleukin-2 gene in response to T-cell activa-tion. Mol. Cell. Biol. 25, 3209–3219
34. Finkelstein, L. D., and Schwartzberg, P. L. (2004) Tec kinases: shapingT-cell activation through actin. Trends Cell Biol. 14, 443–451
35. Staes, A., Demol, H., Van Damme, J., Martens, L., Vandekerckhove, J., andGevaert, K. (2004) Global differential non-gel proteomics by quantitativeand stable labeling of tryptic peptides with oxygen-18. J. Proteome Res.4, 786–791
Improved Method for Quantitative Proteomics by 18O Labeling
1286 Molecular & Cellular Proteomics 6.7