Executive and mnemonic functions in early Huntington's disease
Magnetic resonance imaging of Huntington's disease: preparingfor clinical trials
S. Klöppela,⁎, S.M. Henleyb, N.Z. Hobbsb, R.C. Wolfc, J. Kassubekd, S.J. Tabrizie, and R.S.J.Frackowiakf,g,haDepartment of Psychiatry and Psychotherapy, Freiburg Brain Imaging, University Clinic Freiburg,Hauptstrasse, 79108 Freiburg, Germany.bDementia Research Centre, Institute of Neurology, University College London, Queen Square,London WC1N 3BG, UK.cDepartment of Psychiatry and Psychotherapy III, University of Ulm, Leimgrubenweg, 89075 Ulm,Germany.dDepartment of Neurology, University of Ulm, Oberer Eselsberg, 89081 Ulm, Germany.eDepartment of Neurodegenerative Disease, Institute of Neurology, University College London,Queen Square, London WC1N 3BG, UK.fWellcome Trust Centre for Neuroimaging, Institute of Neurology, University College London, QueenSquare, London WC1N 3BG, UK.gDépartement d'études cognitives, Ecole Normale Supérieure, 29 rue d'Ulm, Paris 75005, France.hLaboratory of Neuroimaging, IRCCS Santa Lucia, Via Ardeatina, Roma 00179, Italy.
AbstractThe known genetic mutation causing Huntington's disease (HD) makes this disease an importantmodel to study links between gene and brain function. An autosomal dominant family history andthe availability of a sensitive and specific genetic test allow pre-clinical diagnosis many years beforethe onset of any typical clinical signs. This review summarizes recent magnetic resonance imaging(MRI)–based findings in HD with a focus on the requirements if imaging is to be used in treatmenttrials. Despite its monogenetic cause, HD presents with a range of clinical manifestations, notexplained by variation in the number of CAG repeats in the affected population. Neuroimagingstudies have revealed a complex pattern of structural and functional changes affecting widespreadcortical and subcortical regions far beyond the confines of the striatal degeneration that characterizesthis disorder. Besides striatal dysfunction, functional imaging studies have reported a variable patternof increased and decreased activation in cortical regions in both pre-clinical and clinically manifestHD-gene mutation carriers. Beyond regional brain activation changes, evidence from functional anddiffusion-weighted MRI further suggests disrupted connectivity between corticocortical andcorticostriatal areas. However, substantial inconsistencies with respect to structural and functionalchanges have been reported in a number of studies. Possible explanations include methodological
© 2009 Elsevier Ltd.This document may be redistributed and reused, subject to certain conditions.
⁎Corresponding author. Tel: +49-761-270-5234; fax: +49-761-270-5416 [email protected] document was posted here by permission of the publisher. At the time of deposit, it included all changes made during peer review,copyediting, and publishing. The U.S. National Library of Medicine is responsible for all links within the document and for incorporatingany publisher-supplied amendments or retractions issued subsequently. The published journal article, guaranteed to be such by Elsevier,is available for free, on ScienceDirect.
Sponsored document fromNeuroscience
Published as: Neuroscience. 2009 November 24; 164(1): 205–219.
Sponsored Docum
ent Sponsored D
ocument
Sponsored Docum
ent
factors and differences in study samples. There may also be biological explanations but these arepoorly characterized and understood at present. Additional insights into this phenotypic variabilityderived from study of mouse models are presented to explore this phenomenon.
Key wordsHuntington's disease; imaging; basal ganglia; subject stratification
AbbreviationsAD, Alzheimer's disease; BOLD, blood-oxygenation level dependent; BSI, brain boundary shiftintegral; CSF, cerebrospinal fluid; DWI, diffusion-weighted imaging; FA, fractional anisotropy;fMRI, functional magnetic resonance imaging; FWHM, full-width at half-maximum; GM, greymatter; HD, Huntington's disease; ICA, independent component analysis; MRI, magnetic resonanceimaging; PD, Parkinson's disease; PSC, presymptomatic gene carriers; ROI, region of interest; TCN,temporally coherent networks; TIV, total intracranial volume; VBM, voxel-based morphometry;WM, white matter
Huntington's disease (HD) is an autosomal dominant neurodegenerative disorder with anaverage age of onset around 40 years and an incidence of ∼4–10 per 100,000 in the UnitedStates and Western European countries. It is caused by a CAG repeat expansion in the geneencoding the protein huntingtin. The availability of a sensitive and specific genetic test allowspre-clinical diagnosis, many years before the onset of unequivocal motor signs (Walker,2007).
Within the present overview, we plan to update and extend recent review articles on imagingin HD (Henley et al., 2005; Montoya et al., 2006; Aylward, 2007; Bohanna et al., 2008). Wewill focus on the use of imaging for clinical therapeutic trials and will consider factors thatneed to be taken into account when designing them. In a disease like HD, there is a need tofollow the effects of neuro-degeneration in individuals over time to evaluate degeneration-modifying treatments. Optimally, monitoring should occur in both the pre-clinical andclinically manifest stages of the disease. Currently, it is difficult to monitor the progression ofneuro-degeneration in asymptomatic individuals using clinical or neuropsychological testing.Ideally, imaging would be used to stratify subjects by degree of caudate atrophy, well beforethe onset of unequivocal clinical signs. Such stratification would potentially make it possibleto stage subjects into more homogeneous populations and to assess the effects of treatmentson different stages in the evolution of this neuro-degenerative disorder.
We will focus mainly on T1-weighted structural imaging methods since treatment trials arelikely to include multiple clinical centers where technical requirements for diffusion weightedimaging (DWI) or functional magnetic resonance imaging (fMRI) studies are often not readilyavailable and potentially more difficult to standardize. There are however first encouragingdata from DWI (Landman et al., 2007; Wakana et al., 2007) and fMRI studies (Bosnell et al.,2008) preparing for multi-center and multimodality strategies and applications in the future.
We start by briefly outlining structural imaging methods, including some caveats in theirapplication. In the second section, we highlight current evidence for structural imagingabnormalities in HD, associations between atrophy visualized in vivo and clinical performance,and discuss imaging evidence for the stratification of HD subjects based on, e.g. the numberof CAG repeats, clinical phenotype, or pattern of cognitive impairment. We consider thiscritical for the optimal design of clinical trials, as clinically defined characteristics may beassociated with differential rates and distribution of degeneration. The third and fourth section
Klöppel et al. Page 2
Published as: Neuroscience. 2009 November 24; 164(1): 205–219.
Sponsored Docum
ent Sponsored D
ocument
Sponsored Docum
ent

reviews fMRI and DWI data with a focus on their usefulness for the characterization ofindividual subjects before entering treatment trials. The fifth section summarizes data fromimaging studies in HD mouse models and illustrates how such data aid in the stratification ofsubjects and in the interpretation of imaging findings.
Beyond issues related to imaging-based criteria for subject inclusion in trials, the next step willbe to find sensitive methods to detect possible effects of proposed treatments. The concludingsection therefore provides an update on the ongoing discussion about imaging-derivedmeasures as biomarkers of disease progression.
This selective review will restrict itself to magnetic resonance imaging (MRI). Imaging ofcerebral blood flow and glucose metabolism has been the focus of another recent review (Maand Eidelberg, 2007).
Structural imaging methodsStructural MRI analyses in HD have yielded inconsistent findings (see 2nd section).Discrepancies are likely to be due to methodological differences in the analysis techniquesapplied, as well as true heterogeneity in the cohorts studied. In this section we summarize someof the image analysis techniques currently used to investigate neurodegeneration in HD.
Structural MRI investigations typically fall into two categories: (1) hypothesis-driven regionof interest (ROI) studies on pathologically-affected structures, and (2) more exploratoryunbiased whole-brain analyses, requiring no a priori assumptions.
ROI analysesThe current gold-standard measurement technique for ROI volumetry is manual segmentation.This involves an expert rater tracing around the outline of the structure on every “slice” of theMR image. Manual segmentation has been used extensively to investigate atrophy in thecaudate, putamen, frontal lobe, and globus pallidus (Harris et al., 1992; Aylward et al., 1997,1998; Aylward et al., 2000; Rosas et al., 2001, 2003; Fennema-Notestine et al., 2004; Paulsenet al., 2006b). However, this approach is extremely time consuming, and results are subject tointer- and intra-rater variability.
As an alternative to manual-outlining algorithms, several fully automated segmentation andanatomical labeling techniques have been developed (Khan et al., 2008). These techniques arelikely to be used more frequently in future studies if they are shown to be reliable. Both manual-and automated-ROI-based analyses are limited by difficulties in accurately and reliablyoutlining small structures, especially if the structure is complex and contains poorly definedboundaries.
Whole-brain analysesThe most elementary whole-brain analysis is visual assessment of the MR images by aradiologist. However, quantification via visual rating scales is crude and subject to inter- andintra-rater variation.
The brain boundary shift (BSI) integral is a semi-automated technique for measuring whole-brain volume change from serial MRI (Freeborough and Fox, 1997), and can be used to capturethe full extent of diffuse cerebral volume loss in HD (Henley et al., 2006). The volume ofatrophy is measured directly from the difference in brain boundaries of registered scan pairs,thereby, reducing the impact of segmenter variability on results since the quantification doesnot rely on manual segmentation per se. One limitation of the BSI is its inability to localizechange to specific tissues. In addition, there is a possibility that degeneration in one structure
Klöppel et al. Page 3
Published as: Neuroscience. 2009 November 24; 164(1): 205–219.
Sponsored Docum
ent Sponsored D
ocument
Sponsored Docum
ent
might be accompanied by an enlargement in another which may not result in changes at thebrain boundary.
Voxel-based morphometry (VBM) (Ashburner and Friston, 2000) and cortical thicknessanalyses (Fischl and Dale, 2000; Lerch et al., 2008a) are unbiased whole-brain-based methodsused to study the pattern of neurodegeneration and neuro-anatomical correlates of HD.Although these methods are automated, there are numerous differences between researchgroups in the software used, the processing steps and statistical models applied, and thecorrection of the resulting statistical parametric maps, all of which may affect overall results.A principled approach is therefore mandatory.
In brief, VBM requires a series of automated image pre-processing steps, including segmentingimages into grey matter (GM), white matter (WM) and cerebrospinal fluid (CSF)compartments, spatially aligning (normalizing) these compartments into standard stereotacticspace and applying appropriate smoothing for subsequent analysis at group level. A numberof different analytical path specifications have been used and reported: some studies optimizethe normalization but not segmentation, some use a study-specific template for normalizationand these may be whole brain templates or templates designed for the tissue classes understudy. Some researchers introduce other new steps into the analytic path with varying degreesof a priori justification (compare, e.g. Thieben et al., 2002; Peinemann et al., 2005; Douaud etal., 2006).
Within the few published cortical thickness analyses in HD, there is variation in both thesoftware and methodology applied. Rosas et al. (e.g. Rosas et al., 2008) use the surface-basedsoftware package FreeSurfer (Fischl and Dale, 2000), which automatically extracts the innerand outer cortical surfaces using deformable models, and calculates cortical thickness as theshortest distance between the pial and WM surfaces (Fischl and Dale, 2000). By contrast,cortical thickness measurements in the YAC128 mouse-model study (see further below) useLaplace's equation to create streamlines between the inside and outside cortical surfaces, withthe length of streamline giving the measurement of thickness (Lerch et al., 2008a). Nopouloset al. (2007) used the BRAINS2 family of software programs (Magnotta et al., 2002) to extracta model representing the parametric center of the GM tissue class, which approximates thespatial center of the cortex. Here, cortical depth is measured as the minimum distance betweenthe 100% GM surface and the center of the cortex (i.e. 50%/50% GM/WM surface). Thesemethodological differences are likely to have some effect on results and should be consideredwhen comparing studies of cortical thickness.
There is a large amount of inconsistency in the specification of the covariates included instatistical models for analysis (O'Brien et al., 2006). VBM studies often, but not always, includeage, gender, and total intracranial volume (TIV) as nuisance factors, since they can affect brainvolume independently of disease. VBM studies also tend to adjust for total GM volume. Thisapproach allows for investigation of region-specific patterns of atrophy and relative atrophyor preservation of tissue (Muhlau et al., 2007); however it is important that GM volume is notused as a substitute for head size, particularly in studies of neurodegeneration, as total as wellas regional GM volume may vary with disease severity and duration. Cortical thickness.Cortical thickness analyses tend to correct for age and gender but not TIV. There appears tobe no relationship between brain size and cortical thickness in mice (Lerch et al., 2008a) butrecent work indicates that the relative dimensions of sulcal depth with respect to corticalthickness change with head size in humans (Im et al., 2008).
Some smoothing is generally required to compensate for small variation in individual anatomyduring inter-subject registration, and to ensure that the data are normally distributed(statistically stationary). The amount of smoothing sensitizes analyses to a particular spatial
Klöppel et al. Page 4
Published as: Neuroscience. 2009 November 24; 164(1): 205–219.
Sponsored Docum
ent Sponsored D
ocument
Sponsored Docum
ent
scale of effect (Ridgway et al., 2008) which will affect interpretation of results; the detectionof change in a structure is more sensitive if the smoothing kernel approximates the size of thestructure. For VBM analyses, segments are smoothed through convolution with a volumetricgaussian kernel. Kernel sizes in the HD literature range from full-width at half-maximum(FWHM) 4 mm (Barrios et al., 2007) to 12 mm (Kipps et al., 2005). However, the majority ofstudies do not justify their choice of smoothing kernel, for example, by attempting to matchthe spatial extent to that of the degenerative change expected (see Kassubek et al., 2004b foran example of selecting the smoothing kernel based on visual inspection of structural changes).In cortical thickness analyses, smoothing is typically carried out across the cortical surface tofollow the topology of the cortex (Rosas et al., 2002, 2005, 2008; Lerch et al., 2008a). Theamount of smoothing varies greatly in the few cortical papers published, for example Rosas etal. (2005) used a 2D gaussian kernel of FWHM 29 mm but a 3D kernel of FWHM 16 mm inearlier work. Fig. 1 shows the effects of varying a surface-based gaussian smoothing kernelfrom FWHM 10–30 mm on the same dataset. As the kernel size increases, the area of significantdifferences tends to increase. Therefore, differences between studies using different smoothingkernel types may not reflect true disease-related differences in the cohorts studied. For example,Lerch et al. (2008a) found an increase in cortical thickness of the sensorimotor cortex in theYAC128 mouse HD model relative to wild-type mice at a stage representing very early stageHD/presymptomatic gene carriers (PSC). This finding agrees with some results from humanPSC (Paulsen et al., 2006b), but contradicts others; Rosas et al. (2005) found regionally-selective thinning and no areas of thickening in their PSC cohort.
In summary, this section has illustrated a number of methodological issues which are likely toinfluence imaging findings. However, it is difficult to predict how each issue will affect theoverall result. The effects of smoothing-kernel size have been explored systematically (Joneset al., 2005) but are likely to be dependent on the specific study. In contrast, the effect ofchanging regressors in the statistical design or using different means for spatial normalizationis very difficult to predict. Such methodological issues need to be considered when trying tointerpret the HD literature and to generalize results. Ideally, as has been suggested recently(Nopoulos et al., 2007), researchers need to consolidate methods in order to produce findingsthat are replicable, robust, and truly representative of HD. Recently published sets of guidelines(Ridgway et al., 2008) could prove helpful in that respect. Such general guidelines arepreferable to very specific ones (e.g. a specific smoothing kernel or a specific set of covariates)as their choice will depend on the exact research question and dataset being investigated.
Structural correlates of clinical features and subject stratificationIn this section, we summarize recent structural MRI work in HD, as well as how these invivo findings relate to the clinical features observed in disease. We also highlight evidence thatstratification based on e.g. number of CAG repeats or clinical phenotype, yields distinctpatterns of atrophy. Tables providing an excellent overview of previously published studiesare provided in another review (Bohanna et al., 2008).
Structural MRI in HDThe most striking pathological changes in HD occur in the striatum (Halliday et al., 1998;Gutekunst et al., 2002) and there is a wealth of evidence that striatal atrophy can be detectedusing MRI up to 23 years prior to predicted motor onset and that striatal volume is negativelycorrelated with motor and cognitive function and CAG repeat length (Harris et al., 1992, 1996,1999; Aylward et al., 1994, 1996, 2004; Rosas et al., 2001; Kassubek et al., 2004b; Paulsen etal., 2006b; Fig. 2).
The contribution of cortical regions to the pathophysiology of HD has been of increasinginterest, since huntingtin-protein aggregates have been found to concentrate in cortical neurons
Klöppel et al. Page 5
Published as: Neuroscience. 2009 November 24; 164(1): 205–219.
Sponsored Docum
ent Sponsored D
ocument
Sponsored Docum
ent

to an even greater extent than in the striatum (Ferrante et al., 1997; Sapp et al., 1997; Gutekunstet al., 1999). Extra-striatal atrophy has been reported in early HD including WM loss in theabsence of total brain volume or GM loss (Aylward et al., 1998; Beglinger et al., 2005). Othershave reported reduced total brain volume or GM loss (Rosas et al., 2003; Fennema-Notestineet al., 2004; Kassubek et al., 2004a,b).
Reduced cortical thickness has been found in early to moderate HD, with a suggestion that thesensorimotor areas are most severely affected and that atrophy progresses from posterior toanterior regions with longer disease duration (Rosas et al., 2002, 2008). Of studies taking awhole-brain rather than an ROI approach, most find evidence of bilateral caudate and putaminalatrophy in both early disease and in PSC (Thieben et al., 2002; Peinemann et al., 2005). Incontrast there is less consensus about extra-striatal atrophy; for example insular atrophy hasbeen shown in PSC (Thieben et al., 2002), but not in a study in early HD (Kassubek et al.,2004b). There are similarly variable results on the involvement of the thalamus, amygdala,hypothalamus, and frontal areas (Kassubek et al., 2004b, 2005; Peinemann et al., 2005; Douaudet al., 2006; Muhlau et al., 2007). This could be an effect of relatively small group sizes,different clinical stages or the choice of statistical thresholds. It should also be kept in mindthat increasing levels of degeneration can result in problems with image registration in areasnot themselves affected by disease (e.g. an inward shift of the insular cortex with shrinkingstriatal volume).
Abnormal brain volume has also been found in PSC. A recent study found evidence of reducedWM but normal GM volume in PSC approximately 11 years from predicted clinical onset(Paulsen et al., 2006b). In contrast, PSC estimated at 23 years from onset had more grey andless WM than normal, in the absence of any increase in ventricular size or CSF volume, whichled the authors to postulate that their result may represent a developmental abnormality ratherthan a very early neurodegenerative process (Paulsen et al., 2006b). Total brain volume wasnot significantly reduced although further work on the same cohort demonstratedmorphological GM abnormalities, including increased gyral surface area, thicker gyri, andthinner sulci (Nopoulos et al., 2007). Decreased WM has been reported to correlate with yearsto onset in PSC, while the same study showed a non-significant reduction of GM (Ciarmielloet al., 2006). However, GM thinning in regions across the cortex has also been reported in thispopulation (Rosas et al., 2005).
In summary, structural MRI studies in early HD tend to support the postmortem findings(Vonsattel and DiFiglia, 1998; Gutekunst et al., 2002) of widespread generalized atrophythroughout the cortex, with disproportionate volume loss in the striatum. Where both GM andWM are measured, there is a suggestion that WM loss is relatively greater or seen earlier inthe course of the degeneration (see section on DWI). PSC have clear striatal atrophy and thereis evidence of WM loss but the involvement of cortical GM is less clear. There is considerablevariation between studies both with regard to the extent of extra-striatal atrophy and the pointin the disease process at which loss in different regions starts to become significant. In manycases these differences may be due to methodological differences or lack of statistical powercaused by the small or heterogeneous groups selected for study. Alternatively, they may reflecttrue heterogeneity in the populations sampled. Although it is clear that widespread structuralloss occurs early in the disease, more work is needed to define the pattern, time course, severity,significance, and evolution of these changes more clearly, particularly in the early PSC phase.
The majority of longitudinal structural MRI studies in HD have focused on the striatum and itis now well established that striatal atrophy rates are increased prior to onset of motor symptomsand that they may not be linearly progressive, at least in the pre-clinical stage. Atrophy rate isalso correlated with CAG repeat length (Aylward et al., 1997, 2000, 2004; Aylward, 2007).Other studies focusing on the whole brain have reported a decrease in WM volume in PSC
Klöppel et al. Page 6
Published as: Neuroscience. 2009 November 24; 164(1): 205–219.
Sponsored Docum
ent Sponsored D
ocument
Sponsored Docum
ent

over periods as short as 16 months (Ciarmiello et al., 2006), but others have reported atrophyof subcortical GM but no WM changes in PSC subjects over a period of 2 years (Kipps et al.,2005). In clinically manifest HD, there have been reports of no change over 18 months(Ciarmiello et al., 2006), increased whole-brain atrophy rates measured over 6 months (Henleyet al., 2006), and a decrease in insula, cerebellum and some regional cortical volumes over a1-year period (Ruocco et al., 2008). The specificity of the latter results may need clarificationas subjects were aged from 4 to 73 years, but results were not adjusted for either age or head-size (Ruocco et al., 2008).
Neural correlates of clinical performance in HDA number of imaging studies have confirmed the existence of a relationship between striatalvolumes and cognitive deficits (Bamford et al., 1989; Starkstein et al., 1992; Brandt et al.,1995; Harris et al., 1996). Measures of frontal lobe size correlate with memory and planningperformance (Bamford et al., 1989, 1995; Backman et al., 1997) and regions including thethalamus (Kassubek et al., 2005), insula (Peinemann et al., 2005), WM (Beglinger et al., 2005;Rosas et al., 2006), and widespread cortical regions (Rosas et al., 2005, 2008) are associatedwith cognitive performance in both PSC and early clinically manifest HD. Most of these studieshave focused on a few tests in a specific domain (executive function) although recently it hasalso been shown that striatal and frontal regions are associated with performance on emotionrecognition (Hennenlotter et al., 2004; Kipps et al., 2007; Henley et al., 2008).
Stratification of subjects for clinical trialsA problem in HD research is the heterogeneity of subject groups, making it hard to detect smalldifferences in variables of interest or to track change over time. One solution is to stratifysubjects based on clinical characteristics, and it has been demonstrated that such stratifiedgroups do show different patterns of atrophy. When stratified by CAG repeat length, motor orcognitive score, subjects with longer repeat lengths (or worse scores) show more extensiveatrophy, that also affects extra-striatal regions, than those with shorter repeat lengths (or bettermotor scores) (Kassubek et al., 2004b), when compared with controls. PSC subjects, whenstratified by estimated time to clinical onset, also demonstrate differences in the amount ofstriatal, grey and WM atrophy that are time dependent (Paulsen et al., 2006a). More recently,there has been a suggestion that patients showing more bradykinetic features of HD show adifferent pattern of cortical thinning to those without these features (Rosas et al., 2008).However, in most analyses of this type small subgroups were compared with controls, ratherthan directly with each other. Therefore, more work is needed to validate MRI differences andto determine whether they can be used to stratify pre-clinical and symptomatic subjects so thatmore homogeneous cohorts can be entered into clinical trials.
Functional MRI in HDWithin the past 5 years, fMRI has been increasingly used to study basic sensory, emotionaland cognitive processes in HD. In this section we seek to update the reader on newdevelopments in fMRI research since the review recently provided by Bohanna et al.(2008)and address three main questions that arise from published fMRI findings in clinical HD andPSC.
Does evidence from fMRI suggest a distinct pattern of neural dysfunction during cognitiveprocessing in HD?
Published fMRI studies (see Bohanna et al., 2008 for tables providing an overview of the mainfindings) have shown that abnormal activation patterns including hyper- and hypo-activationin HD patients and PSC are not restricted to the striatum. The stage of the disease as well asthe clinical phenotype might contribute to data heterogeneity, and differential patterns of neural
Klöppel et al. Page 7
Published as: Neuroscience. 2009 November 24; 164(1): 205–219.
Sponsored Docum
ent Sponsored D
ocument
Sponsored Docum
ent

dysfunction during different stages of the illness still have to be determined in larger patientcohorts. Taking these clinical limitations into account, the extant fMRI data in clinical HDsuggest a complex pattern of neural dysfunction during cognitive processing, including awidespread set of subcortical and cortical regions which have been found to show abnormalbrain activation responses compared to healthy subjects. These findings, however, do notconverge to define a single functional biomarker of HD, but rather suggest a dynamic patternof neural dysfunction in clinical HD and PSC which possibly depend on task type, cognitivedemand, task performance, or a combination of all three variables.
For instance, abnormal activation of the anterior cingulate cortex in clinical HD has been shownduring the Simon response conflict task (Georgiou-Karistianis et al., 2007), but not duringprocessing by working memory (Wolf et al., 2008c) or during implicit motor learning (Kim etal., 2004). These results suggest that the detection threshold for aberrant neural responses inthe cingulate cortex could be task-dependent. Furthermore, although the majority of fMRIstudies have so far demonstrated reduced task performance during cognitive processing inclinical HD (Kim et al., 2004; Georgiou-Karistianis et al., 2007; Wolf et al., 2008c), therelationship between task performance and brain dysfunction has to be determined, since bothdecreased brain activation (Wolf et al., 2008c) and increased functional connectivity(Thiruvady et al., 2007) in clinical HD have been discussed against the background of impairedtask accuracy. Several authors have discussed cortical hyperactivation shown by fMRI in termsof neural “compensation” (Paulsen et al., 2004; Georgiou-Karistianis et al., 2007; Wolf et al.,2007; Zimbelman et al., 2007), although the compensatory processes related to functionalabnormalities remains to be characterized in terms of a task-related mechanism. Indeed,increased brain activation in the presence of task-stimulation does not necessarily have tomirror task-specific processes, and thus other explanations appear plausible, e.g. the possibilityof abnormally increased activation that interferes with brain activation typically elicited by agiven task. For instance, a positive correlation between the UHDRS motor score and activationof right dorsal and left ventral premotor regions has been reported in clinically affected patientswith HD while performing a response conflict task (Georgiou-Karistianis et al., 2007). Theauthors interpreted this relationship as related to characteristics of the disease, and suggestedthat patients with more severe motor symptoms could exhibit greater baseline motor regionactivity in order to inhibit involuntary movements, while the alternative interpretation of arelationship between premotor activation and increasing task difficulty needs furthervalidation.
Moreover, the question is open whether brain activation abnormalities during cognitiveperformance as shown in HD are qualitatively different from the pattern of neural dysfunctionobserved in other basal ganglia disorders, e.g. Parkinson's disease (PD) (Monchi et al., 2000;Lewis et al., 2003). For instance, reduced activation of the prefrontal cortex and the putamenduring working memory performance has been reported in both patients with PD (Lewis et al.,2003) and HD (Wolf et al., 2008c). Furthermore, somewhat similar to fMRI findings in HD,patterns of both increased and decreased brain activation have been previously reported in PDpatients during executive processing (Monchi et al., 2007). While the notion of a differentialengagement of the caudate nucleus during distinct processing phases of a cognitive task(Monchi et al., 2006, 2007) could partially explain divergent findings of increased and reducedbrain activation in HD and PSC, this hypothesis clearly needs to be explicitly tested in HDpatients and PSC.
Eventually, it is also unclear if increased brain activation in HD patients and PSC could alsoreflect increased cortical “noise” and thus a loss of regional specialization (Rajah andD'Esposito, 2005), e.g. due to a generalized dopaminergic deficit, rather than reflectingcircumscribed deficits due to the disease or due to task-specific factors. Furthermore, the impactof GM volume changes and abnormal neurovascular coupling on neural activation and blood-
Klöppel et al. Page 8
Published as: Neuroscience. 2009 November 24; 164(1): 205–219.
Sponsored Docum
ent Sponsored D
ocument
Sponsored Docum
ent

oxygenation level dependent (BOLD) responses is not well-known yet, and could additionallylead to aberrant BOLD fluctuations associated with neurodegeneration and cerebrovasculardysregulation (Deckel et al., 1998; Deckel, 2001).
Can functional connectivity analyses provide further insights into early pathophysiologicalprocesses in PSC and into disease-related brain dysfunction during the symptomaticperiod?
Given the association between striatal abnormalities and cognitive performance in PSC(Backman et al., 1997; Solomon et al., 2007), as well as anatomical evidence fortopographically organized reciprocal connections between the striatum and neocortex(Middleton and Strick, 2000), it has been suggested that dysfunction of corticostriatal circuitsmay characterize pre-clinical stages of HD (Reading et al., 2004; Feigin et al., 2006) beforethe onset of overt brain atrophy and motor, psychiatric or cognitive disturbances.
It is unclear at present if regionally abnormal brain activation during the presymptomatic periodreflects aberrant corticostriatal pathways related to progressive subcortical atrophy, or if aprimarily cortical deficit independent of the neurodegenerative process in the striatum couldadditionally account for findings of primarily cortical dysfunction in PSC (Reading et al., 2005;Wolf et al., 2007). Although it is neuroanatomically plausible that cortical regions showingabnormal activation in PSC could reflect an early disruption of corticostriatal networks, e.g.as a consequence of impaired corticostriatal connectivity, recent evidence suggests thataberrant connectivity of functionally related networks extends beyond corticostriataldecoupling. For instance, a lower expression of functional networks involving dissociabledorsolateral prefrontal circuits was found in PSC during working memory processing despiteabsent differences in task performance compared to healthy controls (Wolf et al., 2008a). Bymeans of a model-free multivariate analysis technique (independent component analyses;ICA), two distinct temporally coherent networks (TCNs) (Calhoun et al., 2008a) wereidentified that were positively correlated with the delay period of a verbal working memoryparadigm. These TCNs comprised cortical and subcortical regions specified by a distinctspatiotemporal pattern comprising frontostriatal and fronto-parietal areas (Fig. 3). In PSC,decreased functional connectivity was found in left lateral prefrontal and bilateral striatal areas,as well as in left fronto-parietal regions compared to healthy controls. Interestingly,contributions of the lateral prefrontal cortex were not confined to frontostriatal pathways, butwere also detected in left lateralized fronto-parietal networks with sparing of the striatum,suggesting additional cortical decoupling without involvement of subcortical structures (Wolfet al., 2008a). It is yet an open question however, whether impaired striatal transmission canalso explain the latter findings since multimodal imaging data (e.g. PET and fMRI measuresobtained in an identical PSC sample) are lacking at present.
Regionally increased activation of the anterior cingulate cortex (Georgiou-Karistianis et al.,2007), as well as disrupted functional connectivity between the anterior cingulate and lateralprefrontal cortex has been shown in clinically affected subjects. The latter finding wasassociated with slower reaction times and more frequent errors during a Simon task (Thiruvadyet al., 2007). These findings are suggestive of a functional decoupling between the anteriorcingulate and the lateral prefrontal cortex in HD patients, which might partly account for thedeterioration in performance. Increased cortical activation could mirror regional compensatoryprocesses as a result of this impaired connectivity (Thiruvady et al., 2007). In contrast to thesefindings, impaired brain activation in the absence of coincidental hyper-activation has beenfound during working memory processing at intermediate and high levels of cognitiveprocessing (Wolf et al., 2007). One possible explanation for these findings is related to load-dependent mechanisms of frontostriatal function, which have been repeatedly shown withfMRI in healthy subjects (Rypma and D'Esposito, 1999; Rypma et al., 1999; Wolf and Walter,
Klöppel et al. Page 9
Published as: Neuroscience. 2009 November 24; 164(1): 205–219.
Sponsored Docum
ent Sponsored D
ocument
Sponsored Docum
ent

2005). With low task demands, brain activation during cognitive processing may be similar inHD patients and controls, or may augment as a consequence of increased cognitive effort tooptimize task performance. Given the possible load-dependency of neural dysfunction inclinical HD, parametric activation paradigms may be more suitable for assessment of gradualbrain activation and related functional connectivity changes between cortical regions and thestriatum (Wolf et al., 2008b).
Are functional brain activation changes in clinical HD and PSC subjects sensitive and reliablebiomarkers of neurodegeneration and disease progression?
The role of fMRI in tracking disease progression needs further evaluation at present. Forinstance, volumetric data suggest a relative decrease of striatal GM in PSC (Kipps et al.,2005) and cortical volume changes in HD patients over time (Ruocco et al., 2008) howeverlongitudinal fMRI data in both PSC and HD patients are lacking so far. Thus, it is unclear atpresent if functional or volumetric data are equally sensitive in the detection of earlyabnormalities in PSC and for tracking disease progression. Moreover, although inferences canbe made using cross-sectional years to clinical onset data (Paulsen et al., 2004; Wolf et al.,2007; Zimbelman et al., 2007; Saft et al., 2008), it is still not possible to determine the temporaldynamics of brain activation changes starting from the very early symptomatic period to overtlymanifest HD. In designing longitudinal fMRI studies of HD, certain clinical andmethodological issues should be taken into account. First, phenotypic variability in HD couldrepresent a potential confound, which may reduce the power of fMRI designs using cognitiveparadigms. Moreover, although a number of studies have shown cognitive deficits in PSCsubjects (Lawrence et al., 1996; Snowden et al., 2002; Lemiere et al., 2004), the variability incognitive performance has also been emphasized (Lundervold and Reinvang, 1995). Cognitiveimpairment does not evolve uniformly in PSC, either over time or with respect to specificcognitive domains (Lemiere et al., 2004), again suggesting a neurobiological and phenotypicvariability which has to be taken into account in future longitudinal studies. Studies of multiplecognitive domains (e.g. psychomotor speed, attention, memory and executive function) inpopulations using short, robust cognitive activation paradigms may offer a unique opportunityto validate a range of stimulation tasks. Those could be used in clinical HD exhibiting manifestcognitive impairment and PSC individuals with subtle cognitive deficits below the clinicalthreshold and associated neural abnormalities in one or more cognitive domains. Second,practice and learning effects or other strategic factors inherent in given cognitive tasks mustbe considered as they may be responsible for substantial inter- and intra-individual differencesin cognitive capacity (Rypma and D'Esposito, 1999; Rypma et al., 2002). Of note, inferringneural dysfunction in pre-HD so far has been derived from group activation maps, and thereis no clear consensus at present how data from complex cognitive activation tasks should betreated at the individual level. Furthermore, methodological heterogeneity in analyzing fMRIdata might limit the comparability between studies to a certain extent. While both ROI-drivenapproaches and whole-brain analyses have been employed, most studies relied on a priorimodels for the estimation of the hemodynamic response in the context of task-inducedstimulation blocks or events. In this context, multivariate statistical analyses might yield morerobust results than those obtained by a general linear model approach (Calhoun et al., 2008b).However, these increasingly used analysis and modeling techniques for fMRI data clearly needfurther evaluation before being implemented in a clinical trial design.
Diffusion weighted imagingThis method measures the diffusion of water molecules, which is influenced by the fiberarchitecture of the WM. It allows a voxel-by-voxel comparison of diffusion properties, mostlyfractional anisotropy (FA) and mean diffusivity (Beaulieu, 2002). It also permits the trackingof WM fiber connections between different regions of the brain (Mori et al., 1999). A recent
Klöppel et al. Page 10
Published as: Neuroscience. 2009 November 24; 164(1): 205–219.
Sponsored Docum
ent Sponsored D
ocument
Sponsored Docum
ent
review (Bohanna et al., 2008) provides an up-to-date overview of findings in HD. Mostconsistently reported findings include increases in FA in the putamen and globus pallidum.
It is not straightforward to conclude a specific histological correlate of such FA changes. FAis a measure of the anisotropy of the diffusion and ranges from zero to 1. FA is highest(anisotropic diffusion) in the large fiber tracts such as the cortico-spinal tract but lower wherefibers from different directions are crossing or within the GM. It effectively reflects thecoherence of the WM. Studies on the histological basis of FA changes usually focused onwallerian degeneration following traumatic brain injury or normal brain development whilevery little is available on neurodegenerative diseases (see Beaulieu, 2002; Mori and Zhang,2006 for an overview). It is likely that a degeneration of fibers is associated with a decrease inFA. However, in regions where two fiber tracts are crossing a degeneration of one fiber tractcould lead to an increase in FA because the unaffected tract will now dominate and increaseWM coherence.
It should also be kept in mind that some of the observed FA changes (Rosas et al., 2006; Klöppelet al., 2008) could be the effect of misregistration of the images in the presence ofneurodegeneration. The WM/GM boundary of the putamen could shift inwards. Areas whereHD gene carriers already show WM where the FA is relatively high would be compared tooverlapping GM in controls. This could lead to the observed FA increases in the putamen. Asimilar effect could explain reported decreases in FA in the external capsule. An inward shiftof the insular cortex could lead to areas where insular cortex in HD gene carries could overlapwith WM in controls. Given that the shift of the boundary correlated with disease progressionso would FA values and progression. While this mechanism could explain part of the data itcertainly does not explain the complete picture. For example, no FA changes have been foundin the caudate which should be equally affected by such misregistration. Interestingly, studieslooking at mean diffusivity found changes also in the caudate nucleus (Mascalchi et al., 2004;Seppi et al., 2006) which again argues for region specific degenerative changes.
As with fMRI, DWI can potentially be useful when preparing or conducting clinical trials. Partof the substantial clinical variability seen in HD may be a reflection of differential involvementof fiber connections between cortical and subcortical regions. For the case of eye-movements,previous work has already shown a correlation between the individual pattern of fiberconnections and the level of impairment in voluntary-guided saccades (Klöppel et al., 2008).New implementations of fiber tracking have been used to study whole circuits with encouragingreproducibility (Draganski et al., 2008).
While few longitudinal data on DWI are available, encouraging results on the exchangeabilityof DWI data between imaging centers has been presented (Landman et al., 2007) (but seeOzturk et al., 2008).
It is still too early to decide on the usefulness of DWI to either understand the pathophysiologyof HD or in the preparation of treatment trials. Currently available data suggest that it can helpunderstanding WM changes already seen in T1-weighted images. When trying to separate PSCfrom controls using either DWI or T1-weighted imaging, a better separation was achievedusing DWI (Klöppel et al., 2008, 2009). A direct comparison is however made difficult asacquisition time was shorter for T1-weighted imaging and because only DWI-weighted datawere acquired at a single imaging center. The comparison does however indicate substantialand disease specific changes already in the pre-symptomatic stage of HD to be detectable byDWI.
Klöppel et al. Page 11
Published as: Neuroscience. 2009 November 24; 164(1): 205–219.
Sponsored Docum
ent Sponsored D
ocument
Sponsored Docum
ent
Imaging: from mice to manThe identification of the genetic mutation causing HD has led to the development of severalanimal models of the disease, which have provided fundamental insights into key aspects ofdisease pathogenesis (Sipione and Cattaneo, 2001; Ramaswamy et al., 2007). Imaging inprimates has so far been limited to chemically generated HD models (Roitberg et al., 2002)which are unlikely to represent all aspects of the disease. While a transgenic HD model inprimates has been reported very recently (Yang et al., 2008), most imaging research has focusedon mouse models (Ramaswamy et al., 2007) and this includes treatment trials (Ferrante et al.,2002). Among other things, these models differ in the number of CAG repeats and whetherthe genetic mutation replaces a wild-type copy of the huntingtin gene (knock-in mice) or hasbeen inserted into the mouse genome, in addition to two normal copies of the mouse HD gene(transgenic mice) (Ramaswamy et al., 2007). Although the knock-in mouse should representa better model of HD in terms of genetics, even in the most rapidly progressing knock-in modelsend-stage disease does not occur until close to the mouse lifespan (∼2 years) which makesstudies using these mice challenging (Wheeler et al., 2000; Lin et al., 2001). However, thereis a clear effect of repeat length as more CAG repeats cause substantially more degenerationand clinical signs in both transgenic and knock-in mice (Van Raamsdonk et al., 2007).
Imaging studies have focused on the YAC and the R6/2 mouse models of HD (Ramaswamyet al., 2007). Motor symptoms and neuropathological changes in the YAC128 mouse with 128CAG repeats resemble those of humans. The phenotype of the YAC128 mouse includes ahyperactive phase at the age of 3 months but converts to a hypokinetic phenotype at 6 monthscompared to wild-type littermates (Slow et al., 2003). Interestingly, testing batteries have foundthat cognitive decline precedes detectable neuropathology as well as motor signs by the age of2 months (Van Raamsdonk et al., 2005). So far, the earliest imaging studies in YAC128 micehave been carried out at the later time point of 8 months (Lerch et al., 2008b). Imaging in miceis usually done with a far higher field strength than used in clinical work (7 T and higher inmice vs. 1.5 or 3 T in humans) and scanning times of several hours (compared to around 10min in humans). At this stage of disease development, comparable to early stage HD in humans,studies report evidence for an enlargement of cortical structures including the rightsensorimotor cortex (Lerch et al., 2008b). The finding has been repeated with analysis ofcortical thickness (Lerch et al., 2008a). An increase of volume or cortical thickness was alsofound bilaterally in the cerebellum, while entorhinal cortex and frontal cortex were enlargedon the left. The study also found decreased volumes of the left inferior colliculus and cerebralpeduncle as well as right thalamus and striatum, frontal cortex, paraflocculus and anteriorcommissure (Lerch et al., 2008b).
Comparison of the findings of imaging studies of the YAC128 mouse model with those inhumans reveals a number of similarities: most obviously, striatal degeneration is consistentlyreported in humans (Thieben et al., 2002; Aylward et al., 2004; Kassubek et al., 2004b; Douaudet al., 2006; Paulsen et al., 2006b). More interestingly, mouse models provide new evidencefor cortical enlargement which, as reviewed, has also been suggested in humans (Paulsen etal., 2006b). However, while increased cortical volume has been suggested as the result ofabnormal development, data from the YAC mouse show a negative correlation betweendecreasing striatal volume and increasing sensorimotor cortical thickness. Although this couldboth be a primary effect of the disease, a compensatory mechanism seems more likely.
Rosas and colleagues (2002, 2005, 2008) have conducted a number of studies on corticalthickness in human HD subjects. While increases in cortical thickness and volume were foundin the 8-month-old YAC128 mouse (Lerch et al., 2008a), reflecting an early stage of HD,increased thickness in humans was restricted to cingulate areas, with thinning in sensorimotorcortex (Rosas et al., 2008).
Klöppel et al. Page 12
Published as: Neuroscience. 2009 November 24; 164(1): 205–219.
Sponsored Docum
ent Sponsored D
ocument
Sponsored Docum
ent

Manual outlining and VBM have recently been used to further characterize 18-week-old R6/2mice with 277 CAG repeats (Sawiak et al., 2009a,b) and produced partially different results.The authors used VBM and located differences in a number of structures including cortex,cerebellum and striatum with gene status without characterizing the directionality. Manualoutlining performed by the group found a significantly smaller cortex and striatum in the R6/2mice while these mice showed a larger globus pallidus. Studies in humans had indicatedreduced volume of this structure.
Those discrepancies could well be attributed to differences between mice and men in brainstructure as well as to differences in the underlying genetic model. They underline currentdifficulties transferring results from mouse models to humans. Improved animal models,possibly including primates, are required, particularly as many drugs are tested in the pre-clinical phase in such models before proceeding to human phase 1 and 2 trials.
The usefulness of imaging as a biomarkerBiomarkers in HD
A biomarker is “a characteristic that is objectively measured and evaluated as an indicator ofnormal biological processes, pathogenic processes, or pharmacological responses to atherapeutic intervention” (Biomarkers Definitions Working Group, 2001). It can be used fordiagnosis or staging of disease, as an index of disease progression, or to monitor clinicalresponses to an intervention. In the case of HD, the genetic mutation is known and this thereforeserves as a diagnostic marker for the disease. A useful marker for progression in HD needs tobe sensitive to the early stages of the disease, be able to distinguish symptomatic benefit fromslowing progression, be associated with a pathogenic process and clinical manifestation of thedisease, and be measurable objectively and reliably. In other words it must give a clear pictureof part of the disease process. It is then assumed that disease-modifying treatments affectingthe clinical characteristics and pathogenesis of a disease, leading to clinical benefit, willsimilarly effect changes in the biomarker thus leading to a reliable marker of treatment efficacy.In addition, to be useful in a typical clinical trial context, a biomarker needs to be tolerated,non-invasive, reliable and reproducible in multi-center settings.
Markers that can predict clinical benefits may potentially also serve as surrogate endpoints.Currently typical clinical endpoints in HD are motor onset and death, but trials in which theseoutcomes were used to assess drug efficacy would take decades. A surrogate endpoint thatpredicts motor onset (or death) could be used instead, perhaps allowing therapeutic testing inthe asymptomatic years prior to motor onset, and also reducing the length of clinical trials.
However, biomarkers may not always respond to treatment in a predictable manner, as wasseen in a recent study for a potential treatment for Alzheimer's disease (AD) in which whole-brain atrophy rates actually increased in patients who responded to an antibody, although atthe same time cognitive performance improved slightly (Fox et al., 2005). This finding suggeststhat therapeutic effects may need to be evaluated using a number of different biomarkerssimultaneously, in order to provide a more comprehensive picture of the relationships betweenchanges in different modalities.
Imaging as a biomarkerMRI measures appear to have many advantages over other measures such as clinical orcognitive scores as a potential biomarker. Brain volume is unaffected by subject mood ortiredness. MRI can be analyzed blind to subject identity and gene status, and if necessary datacollected over a number of sites can be analyzed by a single investigator or fully automatedand so measures can be objective and highly reproducible (Aylward, 2007; Stonnington et al.,2008). However, brain volume can be affected by medication or co-morbidity, as well as
Klöppel et al. Page 13
Published as: Neuroscience. 2009 November 24; 164(1): 205–219.
Sponsored Docum
ent Sponsored D
ocument
Sponsored Docum
ent

nutritional factors such as hydration (Duning et al., 2005) and so some inter- and intra-individual variability is likely to remain as a result of factors such as these.
Technical issues such as scanner type and consistency can also affect scan measurements. Ifscans are acquired over a period of time it is important to ensure that changes in scannercalibration have not biased measurements, although some changes (e.g. in voxel size) can becorrected during post-processing (Whitwell et al., 2004). In addition, subjects need to remainstill in the scanner for adequate scan quality, which means that in a disease such as HD somesubjects will be unsuitable for scanning, and studies will tend to focus on PSC or early affectedsubjects. Longitudinal studies may risk dropout from the more affected subjects or only berepresentative of those with less severe motor problems.
Imaging biomarkers in HDIn HD, caudate volume has been suggested as a potential biomarker, because it can be measuredobjectively, is associated with the major site of pathology in the disease, and predicts motoronset (Aylward, 2007). Whole-brain atrophy rate has also been suggested, as it is increased inearly HD and measured using a robust, semi-automated technique (Henley et al., 2006). Othershave pointed out the potential utility of techniques such as VBM (Douaud et al., 2006) andcortical thickness measurements in providing indexes of change over time (Rosas et al.,2008). Only one study has used imaging in a treatment trial (Puri et al., 2002). While the studyshowed a treatment effect in both imaging and clinical ratings, it should be noted that thenumber of subjects in each treatment arm was very low (n=4 and n=3, respectively) and thatimaging in late stage HD is very challenging.
Recently, multivariate methods combining information from a number of characteristicdegenerative changes have caused increasing interest. While these methods are used primarilyto detect subtle degeneration in PSC (Klöppel et al., 2009), they could prove useful to rateindividual levels of degenerative change before inclusion in a treatment trial (Vemuri et al.,2008). Their usefulness as a sensitive tool to detect disease progression remains to be shown.
Bohanna et al. (2008) suggested multimodal imaging with the idea that structural MRI wouldbe most sensitive to slow degenerative processes while fMRI could aid in monitoringpharmacodynamics. They also suggested a combination with DWI to test for microstructuralchanges (Bohanna et al., 2008). While this approach constitutes a methodological challenge,it could facilitate the interpretation of results. As described for the case of AD (Fox et al.,2005), increasing atrophy rates do not necessarily represent increasing neurodegeneration.Similarly, a “normalization” of compensatory hyperactivation in HD found by fMRI couldmean a true normalization, but could also mean continuing degeneration.
Another issue, which is relevant to all potential markers of HD, is that motor onset is itselfsubjective and does not fully reflect the insidious onset of symptoms across multiple domains,which is now known to occur in HD. An ideal surrogate endpoint should fully predict existingclinical outcomes, but this will depend on how well the existing clinical outcome measuresreflect the disease in the first place, as well as the variability of the surrogate measure itself.
It is clear that more work is needed to measure change in the natural course of HD, and todetermine better indicators of onset and progression of the disease. This is particularly true forPSC and early affected subjects, those who are most likely to enter clinical trials and benefitfrom disease-modifying treatments at an earlier stage in the disease process. A number ofrelatively small treatment trials using imaging as an outcome measure are currently beingcarried out. In addition, large multi-center studies such as TRACK-HD(http://www.track-hd.net) and PREDICT-HD (Paulsen et al., 2008) are ongoing and are likelyto provide new insights into both the pathophysiology of HD and its measurement.
Klöppel et al. Page 14
Published as: Neuroscience. 2009 November 24; 164(1): 205–219.
Sponsored Docum
ent Sponsored D
ocument
Sponsored Docum
ent

AcknowledgmentsThe authors would like to thank Gillian Bates for editing the section on mice models. This work was supported by theWellcome Trust (grant 075,696 2/04/2 to R.F. and S.J.T.). N.H. and S.H. were supported by CHDI, Inc. Part of thiswork was undertaken at UCLH/UCH which received a proportion of funding from the Department of Health's NIHRBiomedical Research Centres funding scheme.
ReferencesAshburner J. Friston K.J. Voxel-based morphometry—the methods. Neuroimage 2000;11:805–821.
[PubMed: 10860804]Aylward E.H. Change in MRI striatal volumes as a biomarker in preclinical Huntington's disease. Brain
Res Bull 2007;72:152–158. [PubMed: 17352939]Aylward E.H. Anderson N.B. Bylsma F.W. Wagster M.V. Barta P.E. Sherr M. Feeney J. Davis A.
Rosenblatt A. Pearlson G.D. Ross C.A. Frontal lobe volume in patients with Huntington's disease.Neurology 1998;50:252–258. [PubMed: 9443488]
Aylward E.H. Brandt J. Codori A.M. Mangus R.S. Barta P.E. Harris G.J. Reduced basal ganglia volumeassociated with the gene for Huntington's disease in asymptomatic at-risk persons. Neurology1994;44:823–828. [PubMed: 8190282]
Aylward E.H. Codori A.M. Barta P.E. Pearlson G.D. Harris G.J. Brandt J. Basal ganglia volume andproximity to onset in presymptomatic Huntington disease. Arch Neurol 1996;53:1293–1296.[PubMed: 8970459]
Aylward E.H. Codori A.M. Rosenblatt A. Sherr M. Brandt J. Stine O.C. Barta P.E. Pearlson G.D. RossC.A. Rate of caudate atrophy in presymptomatic and symptomatic stages of Huntington's disease. MovDisord 2000;15:552–560. [PubMed: 10830423]
Aylward E.H. Li Q. Stine O.C. Ranen N. Sherr M. Barta P.E. Bylsma F.W. Pearlson G.D. Ross C.A.Longitudinal change in basal ganglia volume in patients with Huntington's disease. Neurology1997;48:394–399. [PubMed: 9040728]
Aylward E.H. Sparks B.F. Field K.M. Yallapragada V. Shpritz B.D. Rosenblatt A. Brandt J. GourleyL.M. Liang K. Zhou H. Margolis R.L. Ross C.A. Onset and rate of striatal atrophy in preclinicalHuntington disease. Neurology 2004;63:66–72. [PubMed: 15249612]
Backman L. Robins-Wahlin T.B. Lundin A. Ginovart N. Farde L. Cognitive deficits in Huntington'sdisease are predicted by dopaminergic PET markers and brain volumes. Brain 1997;120(Pt 12):2207–2217. [PubMed: 9448576]
Bamford K.A. Caine E.D. Kido D.K. Cox C. Shoulson I. A prospective evaluation of cognitive declinein early Huntington's disease: functional and radiographic correlates. Neurology 1995;45:1867–1873. [PubMed: 7477984]
Bamford K.A. Caine E.D. Kido D.K. Plassche W.M. Shoulson I. Clinical-pathologic correlation inHuntington's disease: a neuropsychological and computed tomography study. Neurology1989;39:796–801. [PubMed: 2524678]
Barrios F.A. Gonzalez L. Favila R. Alonso M.E. Salgado P.M. Diaz R. Fernandez-Ruiz J. Olfaction andneurodegeneration in HD. Neuroreport 2007;18:73–76. [PubMed: 17259864]
Beaulieu C. The basis of anisotropic water diffusion in the nervous system—a technical review. NMRBiomed 2002;15:435–455. [PubMed: 12489094]
Beglinger L.J. Nopoulos P.C. Jorge R.E. Langbehn D.R. Mikos A.E. Moser D.J. Duff K. Robinson R.G.Paulsen J.S. White matter volume and cognitive dysfunction in early Huntington's disease. CognBehav Neurol 2005;18:102–107. [PubMed: 15970729]
Biomarkers Definitions Working Group. Biomarkers and surrogate endpoints: preferred definitions andconceptual framework. Clin Pharmacol Ther 2001;69:89–95. [PubMed: 11240971]
Bohanna I. Georgiou-Karistianis N. Hannan A.J. Egan G.F. Magnetic resonance imaging as an approachtowards identifying neuropathological biomarkers for Huntington's disease. Brain Res Rev2008;58:209–225. [PubMed: 18486229]
Bosnell R. Wegner C. Kincses Z.T. Korteweg T. Agosta F. Ciccarelli O. De Stefano N. Gass A. HirschJ. Johansen-Berg H. Kappos L. Barkhof F. Mancini L. Manfredonia F. Marino S. Miller D.H.Montalban X. Palace J. Rocca M. Enzinger C. Ropele S. Rovira A. Smith S. Thompson A. Thornton
Klöppel et al. Page 15
Published as: Neuroscience. 2009 November 24; 164(1): 205–219.
Sponsored Docum
ent Sponsored D
ocument
Sponsored Docum
ent

J. Yousry T. Whitcher B. Filippi M. Matthews P.M. Reproducibility of fMRI in the clinical setting:implications for trial designs. Neuroimage 2008;42:603–610. [PubMed: 18579411]
Brandt J. Bylsma F.W. Aylward E.H. Rothlind J. Gow C.A. Impaired source memory in Huntington'sdisease and its relation to basal ganglia atrophy. J Clin Exp Neuropsychol 1995;17:868–877.[PubMed: 8847393]
Calhoun V.D. Kiehl K.A. Pearlson G.D. Modulation of temporally coherent brain networks estimatedusing ICA at rest and during cognitive tasks. Hum Brain Mapp 2008;29:828–838. [PubMed:18438867]
Calhoun V.D. Maciejewski P.K. Pearlson G.D. Kiehl K.A. Temporal lobe and “default” hemodynamicbrain modes discriminate between schizophrenia and bipolar disorder. Hum Brain Mapp2008;29:1265–1275. [PubMed: 17894392]
Ciarmiello A. Cannella M. Lastoria S. Simonelli M. Frati L. Rubinsztein D.C. Squitieri F. Brain white-matter volume loss and glucose hypometabolism precede the clinical symptoms of Huntington'sdisease. J Nucl Med 2006;47:215–222. [PubMed: 16455626]
Deckel A.W. Nitric oxide and nitric oxide synthase in Huntington's disease. J Neurosci Res 2001;64:99–107. [PubMed: 11288139]
Deckel A.W. Cohen D. Duckrow R. Cerebral blood flow velocity decreases during cognitive stimulationin Huntington's disease. Neurology 1998;51:1576–1583. [PubMed: 9855504]
Douaud G. Gaura V. Ribeiro M.J. Lethimonnier F. Maroy R. Verny C. Krystkowiak P. Damier P.Bachoud-Levi A.C. Hantraye P. Remy P. Distribution of grey matter atrophy in Huntington's diseasepatients: a combined ROI-based and voxel-based morphometric study. Neuroimage 2006;32:1562–1575. [PubMed: 16875847]
Draganski B. Kherif F. Klöppel S. Cook P.A. Alexander D.C. Parker G.J. Deichmann R. Ashburner J.Frackowiak R.S. Evidence for segregated and integrative connectivity patterns in the human basalganglia. J Neurosci 2008;28:7143–7152. [PubMed: 18614684]
Duning T. Kloska S. Steinstrater O. Kugel H. Heindel W. Knecht S. Dehydration confounds theassessment of brain atrophy. Neurology 2005;64:548–550. [PubMed: 15699394]
Feigin A. Ghilardi M.F. Huang C. Ma Y. Carbon M. Guttman M. Paulsen J.S. Ghez C.P. Eidelberg D.Preclinical Huntington's disease: compensatory brain responses during learning. Ann Neurol2006;59:53–59. [PubMed: 16261565]
Fennema-Notestine C. Archibald S.L. Jacobson M.W. Corey-Bloom J. Paulsen J.S. Peavy G.M. GamstA.C. Hamilton J.M. Salmon D.P. Jernigan T.L. In vivo evidence of cerebellar atrophy and cerebralwhite matter loss in Huntington disease. Neurology 2004;63:989–995. [PubMed: 15452288]
Ferrante R.J. Andreassen O.A. Dedeoglu A. Ferrante K.L. Jenkins B.G. Hersch S.M. Beal M.F.Therapeutic effects of coenzyme Q10 and remacemide in transgenic mouse models of Huntington'sdisease. J Neurosci 2002;22:1592–1599. [PubMed: 11880489]
Ferrante R.J. Gutekunst C.A. Persichetti F. McNeil S.M. Kowall N.W. Gusella J.F. MacDonald M.E.Beal M.F. Hersch S.M. Heterogeneous topographic and cellular distribution of huntingtin expressionin the normal human neostriatum. J Neurosci 1997;17:3052–3063. [PubMed: 9096140]
Fischl B. Dale A.M. Measuring the thickness of the human cerebral cortex from magnetic resonanceimages. Proc Natl Acad Sci U S A 2000;97:11050–11055. [PubMed: 10984517]
Fox N.C. Black R.S. Gilman S. Rossor M.N. Griffith S.G. Jenkins L. Koller M. Effects of Abetaimmunization (AN1792) on MRI measures of cerebral volume in Alzheimer disease. Neurology2005;64:1563–1572. [PubMed: 15883317]
Freeborough P.A. Fox N.C. The boundary shift integral: an accurate and robust measure of cerebralvolume changes from registered repeat MRI. IEEE Trans Med Imaging 1997;16:623–629. [PubMed:9368118]
Georgiou-Karistianis N. Sritharan A. Farrow M. Cunnington R. Stout J. Bradshaw J. Churchyard A.Brawn T.L. Chua P. Chiu E. Thiruvady D. Egan G. Increased cortical recruitment in Huntington'sdisease using a Simon task. Neuropsychologia 2007;45:1791–1800. [PubMed: 17321554]
Gutekunst C.A. Li S.H. Yi H. Mulroy J.S. Kuemmerle S. Jones R. Rye D. Ferrante R.J. Hersch S.M. LiX.J. Nuclear and neuropil aggregates in Huntington's disease: relationship to neuropathology. JNeurosci 1999;19:2522–2534. [PubMed: 10087066]
Klöppel et al. Page 16
Published as: Neuroscience. 2009 November 24; 164(1): 205–219.
Sponsored Docum
ent Sponsored D
ocument
Sponsored Docum
ent

Gutekunst, C.A.; Norflus, F.; Hersch, S.M. The neuropathology of Huntington's disease. In: Bates, G.,editor. Huntington's disease. Oxford Monographs on Medical Genetics; Oxford: 2002. p. 251-270.
Halliday G.M. McRitchie D.A. Macdonald V. Double K.L. Trent R.J. McCusker E. Regional specificityof brain atrophy in Huntington's disease. Exp Neurol 1998;154:663–672. [PubMed: 9878201]
Harris G.J. Aylward E.H. Peyser C.E. Pearlson G.D. Brandt J. Roberts-Twillie J.V. Barta P.E. FolsteinS.E. Single photon emission computed tomographic blood flow and magnetic resonance volumeimaging of basal ganglia in Huntington's disease. Arch Neurol 1996;53:316–324. [PubMed:8929153]
Harris G.J. Codori A.M. Lewis R.F. Schmidt E. Bedi A. Brandt J. Reduced basal ganglia blood flow andvolume in pre-symptomatic, gene-tested persons at-risk for Huntington's disease. Brain 1999;122(Pt9):1667–1678. [PubMed: 10468506]
Harris G.J. Pearlson G.D. Peyser C.E. Aylward E.H. Roberts J. Barta P.E. Chase G.A. Folstein S.E.Putamen volume reduction on magnetic resonance imaging exceeds caudate changes in mildHuntington's disease. Ann Neurol 1992;31:69–75. [PubMed: 1531910]
Henley S.M. Bates G.P. Tabrizi S.J. Biomarkers for neurodegenerative diseases. Curr Opin Neurol2005;18:698–705. [PubMed: 16280682]
Henley S.M. Frost C. MacManus D.G. Warner T.T. Fox N.C. Tabrizi S.J. Increased rate of whole-brainatrophy over 6 months in early Huntington disease. Neurology 2006;67:694–696. [PubMed:16924028]
Henley S.M. Wild E.J. Hobbs N.Z. Warren J.D. Frost C. Scahill R.I. Ridgway G.R. MacManus D.G.Barker R.A. Fox N.C. Tabrizi S.J. Defective emotion recognition in early HD is neuropsychologicallyand anatomically generic. Neuropsychologia 2008;46:2152–2160. [PubMed: 18407301]
Hennenlotter A. Schroeder U. Erhard P. Haslinger B. Stahl R. Weindl A. von Einsiedel H.G. Lange K.W.Ceballos-Baumann A.O. Neural correlates associated with impaired disgust processing in pre-symptomatic Huntington's disease. Brain 2004;127:1446–1453. [PubMed: 15090475]
Im K. Lee J.M. Lyttelton O. Kim S.H. Evans A.C. Kim S.I. Brain size and cortical structure in the adulthuman brain. Cereb Cortex 2008;18:2181–2191. [PubMed: 18234686]
Jones D.K. Symms M.R. Cercignani M. Howard R.J. The effect of filter size on VBM analyses of DT-MRI data. Neuroimage 2005;26:546–554. [PubMed: 15907311]
Kassubek J. Bernhard Landwehrmeyer G. Ecker D. Juengling F.D. Muche R. Schuller S. Weindl A.Peinemann A. Global cerebral atrophy in early stages of Huntington's disease: quantitative MRIstudy. Neuroreport 2004;15:363–365. [PubMed: 15076769]
Kassubek J. Juengling F.D. Kioschies T. Henkel K. Karitzky J. Kramer B. Ecker D. Andrich J. Saft C.Kraus P. Aschoff A.J. Ludolph A.C. Landwehrmeyer G.B. Topography of cerebral atrophy in earlyHuntington's disease: a voxel based morphometric MRI study. J Neurol Neurosurg Psychiatry2004;75:213–220. [PubMed: 14742591]
Kassubek J. Juengling F.D. Ecker D. Landwehrmeyer G.B. Thalamic atrophy in Huntington's disease co-varies with cognitive performance: a morphometric MRI analysis. Cereb Cortex 2005;15:846–853.[PubMed: 15459079]
Khan A.R. Wang L. Beg M.F. FreeSurfer-initiated fully-automated subcortical brain segmentation inMRI using large deformation diffeomorphic metric mapping. Neuroimage 2008;41:735–746.[PubMed: 18455931]
Kim J.S. Reading S.A. Brashers-Krug T. Calhoun V.D. Ross C.A. Pearlson G.D. Functional MRI studyof a serial reaction time task in Huntington's disease. Psychiatry Res 2004;131:23–30. [PubMed:15246452]
Kipps C.M. Duggins A.J. Mahant N. Gomes L. Ashburner J. McCusker E.A. Progression of structuralneuropathology in preclinical Huntington's disease: a tensor based morphometry study. J NeurolNeurosurg Psychiatry 2005;76:650–655. [PubMed: 15834021]
Kipps C.M. Duggins A.J. McCusker E.A. Calder A.J. Disgust and happiness recognition correlate withanteroventral insula and amygdala volume respectively in preclinical Huntington's disease. J CognNeurosci 2007;19:1206–1217. [PubMed: 17583995]
Klöppel S. Chu C. Tan G.C. Draganski B. Johnson H. Paulsen J.S. Kienzle W. Tabrizi S.J. Ashburner J.Frackowiak R.S. Automatic detection of preclinical neurodegeneration: presymptomatic Huntingtondisease. Neurology 2009;72:426–431. [PubMed: 19188573]
Klöppel et al. Page 17
Published as: Neuroscience. 2009 November 24; 164(1): 205–219.
Sponsored Docum
ent Sponsored D
ocument
Sponsored Docum
ent

Klöppel S. Draganski B. Golding C.V. Chu C. Nagy Z. Cook P.A. Hicks S.L. Kennard C. AlexanderD.C. Parker G.J. Tabrizi S.J. Frackowiak R.S. White matter connections reflect changes in voluntary-guided saccades in pre-symptomatic Huntington's disease. Brain 2008;131:196–204. [PubMed:18056161]
Landman B.A. Farrell J.A. Jones C.K. Smith S.A. Prince J.L. Mori S. Effects of diffusion weightingschemes on the reproducibility of DTI-derived fractional anisotropy, mean diffusivity, and principaleigenvector measurements at 1.5T. Neuroimage 2007;36:1123–1138. [PubMed: 17532649]
Lawrence A.D. Sahakian B.J. Hodges J.R. Rosser A.E. Lange K.W. Robbins T.W. Executive andmnemonic functions in early Huntington's disease. Brain 1996;119(Pt 5):1633–1645. [PubMed:8931586]
Lemiere J. Decruyenaere M. Evers-Kiebooms G. Vandenbussche E. Dom R. Cognitive changes inpatients with Huntington's disease (HD) and asymptomatic carriers of the HD mutation—alongitudinal follow-up study. J Neurol 2004;251:935–942. [PubMed: 15316797]
Lerch J.P. Carroll J.B. Dorr A. Spring S. Evans A.C. Hayden M.R. Sled J.G. Henkelman R.M. Corticalthickness measured from MRI in the YAC128 mouse model of Huntington's disease. Neuroimage2008;41:243–251. [PubMed: 18387826]
Lerch J.P. Carroll J.B. Spring S. Bertram L.N. Schwab C. Hayden M.R. Henkelman R.M. Automateddeformation analysis in the YAC128 Huntington disease mouse model. Neuroimage 2008;39:32–39.[PubMed: 17942324]
Lewis S.J. Cools R. Robbins T.W. Dove A. Barker R.A. Owen A.M. Using executive heterogeneity toexplore the nature of working memory deficits in Parkinson's disease. Neuropsychologia2003;41:645–654. [PubMed: 12591022]
Lin C.H. Tallaksen-Greene S. Chien W.M. Cearley J.A. Jackson W.S. Crouse A.B. Ren S. Li X.J. AlbinR.L. Detloff P.J. Neurological abnormalities in a knock-in mouse model of Huntington's disease.Hum Mol Genet 2001;10:137–144. [PubMed: 11152661]
Lundervold A.J. Reinvang I. Variability in cognitive function among persons at high genetic risk ofHuntington's disease. Acta Neurol Scand 1995;91:462–469. [PubMed: 7572041]
Ma Y. Eidelberg D. Functional imaging of cerebral blood flow and glucose metabolism in Parkinson'sdisease and Huntington's disease. Mol Imaging Biol 2007;9:223–233. [PubMed: 17334854]
Magnotta V.A. Harris G. Andreasen N.C. O'Leary D.S. Yuh W.T. Heckel D. Structural MR imageprocessing using the BRAINS2 toolbox. Comput Med Imaging Graph 2002;26:251–264. [PubMed:12074920]
Mascalchi M. Lolli F. Della Nave R. Tessa C. Petralli R. Gavazzi C. Politi L.S. Macucci M. Filippi M.Piacentini S. Huntington disease: volumetric, diffusion-weighted, and magnetization transfer MRimaging of brain. Radiology 2004;232:867–873. [PubMed: 15215553]
Middleton F.A. Strick P.L. Basal ganglia and cerebellar loops: motor and cognitive circuits. Brain ResBrain Res Rev 2000;31:236–250. [PubMed: 10719151]
Monchi O. Petrides M. Mejia-Constain B. Strafella A.P. Cortical activity in Parkinson's disease duringexecutive processing depends on striatal involvement. Brain 2007;130:233–244. [PubMed:17121746]
Monchi O. Petrides M. Strafella A.P. Worsley K.J. Doyon J. Functional role of the basal ganglia in theplanning and execution of actions. Ann Neurol 2006;59:257–264. [PubMed: 16437582]
Monchi O. Taylor J.G. Dagher A. A neural model of working memory processes in normal subjects,Parkinson's disease and schizophrenia for fMRI design and predictions. Neural Netw 2000;13:953–973. [PubMed: 11156204]
Montoya A. Price B.H. Menear M. Lepage M. Brain imaging and cognitive dysfunctions in Huntington'sdisease. J Psychiatry Neurosci 2006;31:21–29. [PubMed: 16496032]
Mori S. Crain B.J. Chacko V.P. van Zijl P.C. Three-dimensional tracking of axonal projections in thebrain by magnetic resonance imaging. Ann Neurol 1999;45:265–269. [PubMed: 9989633]
Mori S. Zhang J. Principles of diffusion tensor imaging and its applications to basic neuroscience research.Neuron 2006;51:527–539. [PubMed: 16950152]
Muhlau M. Weindl A. Wohlschlager A.M. Gaser C. Stadtler M. Valet M. Zimmer C. Kassubek J.Peinemann A. Voxel-based morphometry indicates relative preservation of the limbic prefrontalcortex in early Huntington disease. J Neural Transm 2007;114:367–372. [PubMed: 17024326]
Klöppel et al. Page 18
Published as: Neuroscience. 2009 November 24; 164(1): 205–219.
Sponsored Docum
ent Sponsored D
ocument
Sponsored Docum
ent

Nopoulos P. Magnotta V.A. Mikos A. Paulson H. Andreasen N.C. Paulsen J.S. Morphology of thecerebral cortex in preclinical Huntington's disease. Am J Psychiatry 2007;164:1428–1434. [PubMed:17728429]
O'Brien L.M. Ziegler D.A. Deutsch C.K. Kennedy D.N. Goldstein J.M. Seidman L.J. Hodge S. MakrisN. Caviness V. Frazier J.A. Herbert M.R. Adjustment for whole brain and cranial size in volumetricbrain studies: a review of common adjustment factors and statistical methods. Harv Rev Psychiatry2006;14:141–151. [PubMed: 16787886]
Ozturk A. Sasson A.D. Farrell J.A. Landman B.A. da Motta A.C. Aralasmak A. Yousem D.M. Regionaldifferences in diffusion tensor imaging measurements: assessment of intrarater and interratervariability. AJNR Am J Neuroradiol 2008;29:1124–1127. [PubMed: 18356471]
Paulsen J.S. Hayden M. Stout J.C. Langbehn D.R. Aylward E. Ross C.A. Guttman M. Nance M. KieburtzK. Oakes D. Shoulson I. Kayson E. Johnson S. Penziner E. Preparing for preventive clinical trials:the PREDICT-HD study. Arch Neurol 2006;63:883–890. [PubMed: 16769871]
Paulsen J.S. Magnotta V.A. Mikos A.E. Paulson H.L. Penziner E. Andreasen N.C. Nopoulos P.C. Brainstructure in preclinical Huntington's disease. Biol Psychiatry 2006;59:57–63. [PubMed: 16112655]
Paulsen J.S. Langbehn D.R. Stout J.C. Aylward E. Ross C.A. Nance M. Guttman M. Johnson S.MacDonald M. Beglinger L.J. Duff K. Kayson E. Biglan K. Shoulson I. Oakes D. Hayden M.Detection of Huntington's disease decades before diagnosis: the PREDICT-HD study. J NeurolNeurosurg Psychiatry 2008;79:874–880. [PubMed: 18096682]
Paulsen J.S. Zimbelman J.L. Hinton S.C. Langbehn D.R. Leveroni C.L. Benjamin M.L. Reynolds N.C.Rao S.M. fMRI biomarker of early neuronal dysfunction in presymptomatic Huntington's disease.AJNR Am J Neuroradiol 2004;25:1715–1721. [PubMed: 15569736]
Peinemann A. Schuller S. Pohl C. Jahn T. Weindl A. Kassubek J. Executive dysfunction in early stagesof Huntington's disease is associated with striatal and insular atrophy: a neuropsychological andvoxel-based morphometric study. J Neurol Sci 2005;239:11–19. [PubMed: 16185716]
Puri B.K. Bydder G.M. Counsell S.J. Corridan B.J. Richardson A.J. Hajnal J.V. Appel C. McKee H.M.Vaddadi K.S. Horrobin D.F. MRI and neuropsychological improvement in Huntington diseasefollowing ethyl-EPA treatment. Neuroreport 2002;13:123–126. [PubMed: 11924873]
Rajah M.N. D'Esposito M. Region-specific changes in prefrontal function with age: a review of PET andfMRI studies on working and episodic memory. Brain 2005;128:1964–1983. [PubMed: 16049041]
Ramaswamy S. McBride J.L. Kordower J.H. Animal models of Huntington's disease. ILAR J2007;48:356–373. [PubMed: 17712222]
Reading S.A. Dziorny A.C. Peroutka L.A. Schreiber M. Gourley L.M. Yallapragada V. Rosenblatt A.Margolis R.L. Pekar J.J. Pearlson G.D. Aylward E. Brandt J. Bassett S.S. Ross C.A. Functional brainchanges in presymptomatic Huntington's disease. Ann Neurol 2004;55:879–883. [PubMed:15174024]
Reading S.A. Yassa M.A. Bakker A. Dziorny A.C. Gourley L.M. Yallapragada V. Rosenblatt A. MargolisR.L. Aylward E.H. Brandt J. Mori S. van Zijl P. Bassett S.S. Ross C.A. Regional white matter changein pre-symptomatic Huntington's disease: a diffusion tensor imaging study. Psychiatry Res2005;140:55–62. [PubMed: 16199141]
Ridgway G.R. Henley S.M. Rohrer J.D. Scahill R.I. Warren J.D. Fox N.C. Ten simple rules for reportingvoxel-based morphometry studies. Neuroimage 2008;40:1429–1435. [PubMed: 18314353]
Roitberg B.Z. Emborg M.E. Sramek J.G. Palfi S. Kordower J.H. Behavioral and morphologicalcomparison of two nonhuman primate models of Huntington's disease. Neurosurgery 2002;50:137–145. [PubMed: 11844244]discussion: 145–136
Rosas H.D. Goodman J. Chen Y.I. Jenkins B.G. Kennedy D.N. Makris N. Patti M. Seidman L.J. BealM.F. Koroshetz W.J. Striatal volume loss in HD as measured by MRI and the influence of CAGrepeat. Neurology 2001;57:1025–1028. [PubMed: 11571328]
Rosas H.D. Hevelone N.D. Zaleta A.K. Greve D.N. Salat D.H. Fischl B. Regional cortical thinning inpreclinical Huntington disease and its relationship to cognition. Neurology 2005;65:745–747.[PubMed: 16157910]
Rosas H.D. Koroshetz W.J. Chen Y.I. Skeuse C. Vangel M. Cudkowicz M.E. Caplan K. Marek K.Seidman L.J. Makris N. Jenkins B.G. Goldstein J.M. Evidence for more widespread cerebral
Klöppel et al. Page 19
Published as: Neuroscience. 2009 November 24; 164(1): 205–219.
Sponsored Docum
ent Sponsored D
ocument
Sponsored Docum
ent

pathology in early HD: an MRI-based morphometric analysis. Neurology 2003;60:1615–1620.[PubMed: 12771251]
Rosas H.D. Liu A.K. Hersch S. Glessner M. Ferrante R.J. Salat D.H. van der Kouwe A. Jenkins B.G.Dale A.M. Fischl B. Regional and progressive thinning of the cortical ribbon in Huntington's disease.Neurology 2002;58:695–701. [PubMed: 11889230]
Rosas H.D. Salat D.H. Lee S.Y. Zaleta A.K. Pappu V. Fischl B. Greve D. Hevelone N. Hersch S.M.Cerebral cortex and the clinical expression of Huntington's disease: complexity and heterogeneity.Brain 2008;131:1057–1068. [PubMed: 18337273]
Rosas H.D. Tuch D.S. Hevelone N.D. Zaleta A.K. Vangel M. Hersch S.M. Salat D.H. Diffusion tensorimaging in presymptomatic and early Huntington's disease: selective white matter pathology and itsrelationship to clinical measures. Mov Disord 2006;21:1317–1325. [PubMed: 16755582]
Ruocco H.H. Bonilha L. Li L.M. Lopes-Cendes I. Cendes F. Longitudinal analysis of regional grey matterloss in Huntington disease: effects of the length of the expanded CAG repeat. J Neurol NeurosurgPsychiatry 2008;79:130–135. [PubMed: 17615168]
Rypma B. Berger J.S. D'Esposito M. The influence of working-memory demand and subject performanceon prefrontal cortical activity. J Cogn Neurosci 2002;14:721–731. [PubMed: 12167257]
Rypma B. D'Esposito M. The roles of prefrontal brain regions in components of working memory: effectsof memory load and individual differences. Proc Natl Acad Sci U S A 1999;96:6558–6563. [PubMed:10339627]
Rypma B. Prabhakaran V. Desmond J.E. Glover G.H. Gabrieli J.D. Load-dependent roles of frontal brainregions in the maintenance of working memory. Neuroimage 1999;9:216–226. [PubMed: 9927550]
Saft C. Schuttke A. Beste C. Andrich J. Heindel W. Pfleiderer B. fMRI reveals altered auditory processingin manifest and premanifest Huntington's disease. Neuropsychologia 2008;46:1279–1289.[PubMed: 18221758]
Sapp E. Schwarz C. Chase K. Bhide P.G. Young A.B. Penney J. Vonsattel J.P. Aronin N. DiFiglia M.Huntingtin localization in brains of normal and Huntington's disease patients. Ann Neurol1997;42:604–612. [PubMed: 9382472]
Sawiak S.J. Wood N.I. Williams G.B. Morton A.J. Carpenter T.A. Use of magnetic resonance imagingfor anatomical phenotyping of the R6/2 mouse model of Huntington's disease. Neurobiol Dis2009;33:12–19. [PubMed: 18930823]
Sawiak S.J. Wood N.I. Williams G.B. Morton A.J. Carpenter T.A. Voxel-based morphometry in the R6/2transgenic mouse reveals differences between genotypes not seen with manual 2D morphometry.Neurobiol Dis 2009;33:20–27. [PubMed: 18930824]
Seppi K. Schocke M.F. Mair K.J. Esterhammer R. Weirich-Schwaiger H. Utermann B. Egger K. BrenneisC. Granata R. Boesch S. Poewe W. Wenning G.K. Diffusion-weighted imaging in Huntington'sdisease. Mov Disord 2006;21:1043–1047. [PubMed: 16570300]
Sipione S. Cattaneo E. Modeling Huntington's disease in cells, flies, and mice. Mol Neurobiol2001;23:21–51. [PubMed: 11642542]
Slow E.J. van Raamsdonk J. Rogers D. Coleman S.H. Graham R.K. Deng Y. Oh R. Bissada N. HossainS.M. Yang Y.Z. Li X.J. Simpson E.M. Gutekunst C.A. Leavitt B.R. Hayden M.R. Selective striatalneuronal loss in a YAC128 mouse model of Huntington disease. Hum Mol Genet 2003;12:1555–1567. [PubMed: 12812983]
Snowden J.S. Craufurd D. Thompson J. Neary D. Psychomotor, executive, and memory function inpreclinical Huntington's disease. J Clin Exp Neuropsychol 2002;24:133–145. [PubMed: 11992196]
Solomon A.C. Stout J.C. Johnson S.A. Langbehn D.R. Aylward E.H. Brandt J. Ross C.A. Beglinger L.Hayden M.R. Kieburtz K. Kayson E. Julian-Baros E. Duff K. Guttman M. Nance M. Oakes D.Shoulson I. Penziner E. Paulsen J.S. Verbal episodic memory declines prior to diagnosis inHuntington's disease. Neuropsychologia 2007;45:1767–1776. [PubMed: 17303196]
Starkstein S.E. Brandt J. Bylsma F. Peyser C. Folstein M. Folstein S.E. Neuropsychological correlatesof brain atrophy in Huntington's disease: a magnetic resonance imaging study. Neuroradiology1992;34:487–489. [PubMed: 1436456]
Stonnington C.M. Tan G. Klöppel S. Chu C. Draganski B. Jack C.R. Chen K. Ashburner J. FrackowiakR.S. Interpreting scan data acquired from multiple scanners: a study with Alzheimer's disease.Neuroimage 2008;39:1180–1185. [PubMed: 18032068]
Klöppel et al. Page 20
Published as: Neuroscience. 2009 November 24; 164(1): 205–219.
Sponsored Docum
ent Sponsored D
ocument
Sponsored Docum
ent
Thieben M.J. Duggins A.J. Good C.D. Gomes L. Mahant N. Richards F. McCusker E. Frackowiak R.S.The distribution of structural neuropathology in pre-clinical Huntington's disease. Brain2002;125:1815–1828. [PubMed: 12135972]
Thiruvady D.R. Georgiou-Karistianis N. Egan G.F. Ray S. Sritharan A. Farrow M. Churchyard A. ChuaP. Bradshaw J.L. Brawn T.L. Cunnington R. Functional connectivity of the prefrontal cortex inHuntington's disease. J Neurol Neurosurg Psychiatry 2007;78:127–133. [PubMed: 17028117]
Van Raamsdonk J.M. Pearson J. Slow E.J. Hossain S.M. Leavitt B.R. Hayden M.R. Cognitive dysfunctionprecedes neuropathology and motor abnormalities in the YAC128 mouse model of Huntington'sdisease. J Neurosci 2005;25:4169–4180. [PubMed: 15843620]
Van Raamsdonk J.M. Warby S.C. Hayden M.R. Selective degeneration in YAC mouse models ofHuntington disease. Brain Res Bull 2007;72:124–131. [PubMed: 17352936]
Vemuri P. Whitwell J.L. Kantarci K. Josephs K.A. Parisi J.E. Shiung M.S. Knopman D.S. Boeve B.F.Petersen R.C. Dickson D.W. Jack C.R. Antemortem MRI based structural abnormality index(STAND)-scores correlate with postmortem Braak neurofibrillary tangle stage. Neuroimage2008;42:559–567. [PubMed: 18572417]
Vonsattel J.P. DiFiglia M. Huntington disease. J Neuropathol Exp Neurol 1998;57:369–384. [PubMed:9596408]
Wakana S. Caprihan A. Panzenboeck M.M. Fallon J.H. Perry M. Gollub R.L. Hua K. Zhang J. Jiang H.Dubey P. Blitz A. van Zijl P. Mori S. Reproducibility of quantitative tractography methods appliedto cerebral white matter. Neuroimage 2007;36:630–644. [PubMed: 17481925]
Walker F.O. Huntington's disease. Lancet 2007;369:218–228. [PubMed: 17240289]Wheeler V.C. White J.K. Gutekunst C.A. Vrbanac V. Weaver M. Li X.J. Li S.H. Yi H. Vonsattel J.P.
Gusella J.F. Hersch S. Auerbach W. Joyner A.L. MacDonald M.E. Long glutamine tracts causenuclear localization of a novel form of huntingtin in medium spiny striatal neurons in HdhQ92 andHdhQ111 knock-in mice. Hum Mol Genet 2000;9:503–513. [PubMed: 10699173]
Whitwell J.L. Schott J.M. Lewis E.B. MacManus D.G. Fox N.C. Using nine degrees-of-freedomregistration to correct for changes in voxel size in serial MRI studies. Magn Reson Imaging2004;22:993–999. [PubMed: 15288140]
Wolf R.C. Sambataro F. Vasic N. Schonfeldt-Lecuona C. Ecker D. Landwehrmeyer B. Aberrantconnectivity of lateral prefrontal networks in presymptomatic Huntington's disease. Exp Neurol2008;213:137–144. [PubMed: 18588876]
Wolf R.C. Sambataro F. Vasic N. Schonfeldt-Lecuona C. Ecker D. Landwehrmeyer B. Alteredfrontostriatal coupling in pre-manifest Huntington's disease: effects of increasing cognitive load.Eur J Neurol 2008;15:1180–1190. [PubMed: 18754766]
Wolf R.C. Vasic N. Schonfeldt-Lecuona C. Ecker D. Landwehrmeyer G.B. Cortical dysfunction inpatients with Huntington's disease during working memory performance. Hum Brain Mapp2008;30:327–339. [PubMed: 18172852]
Wolf R.C. Vasic N. Schonfeldt-Lecuona C. Landwehrmeyer G.B. Ecker D. Dorsolateral prefrontal cortexdysfunction in presymptomatic Huntington's disease: evidence from event-related fMRI. Brain2007;130:2845–2857. [PubMed: 17855375]
Wolf R.C. Walter H. Evaluation of a novel event-related parametric fMRI paradigm investigatingprefrontal function. Psychiatry Res 2005;140:73–83. [PubMed: 16139997]
Yang S.H. Cheng P.H. Banta H. Piotrowska-Nitsche K. Yang J.J. Cheng E.C. Snyder B. Larkin K. LiuJ. Orkin J. Fang Z.H. Smith Y. Bachevalier J. Zola S.M. Li S.H. Li X.J. Chan A.W. Towards atransgenic model of Huntington's disease in a non-human primate. Nature 2008;453:921–924.[PubMed: 18488016]
Zimbelman J.L. Paulsen J.S. Mikos A. Reynolds N.C. Hoffmann R.G. Rao S.M. fMRI detection of earlyneural dysfunction in preclinical Huntington's disease. J Int Neuropsychol Soc 2007;13:758–769.[PubMed: 17697407]
Klöppel et al. Page 21
Published as: Neuroscience. 2009 November 24; 164(1): 205–219.
Sponsored Docum
ent Sponsored D
ocument
Sponsored Docum
ent

Fig. 1.The figure illustrates the impact of different smoothing kernels (ranging from 10 to 30 mm)on the apparent distribution and severity of cortical thinning.
Klöppel et al. Page 22
Published as: Neuroscience. 2009 November 24; 164(1): 205–219.
Sponsored Docum
ent Sponsored D
ocument
Sponsored Docum
ent

Fig. 2.Example displays areas with decreased GM (P<0.001) as detected by VBM comparing earlyHD subjects to controls (see Kassubek et al., 2005; for details on group characteristics andmethodology).
Klöppel et al. Page 23
Published as: Neuroscience. 2009 November 24; 164(1): 205–219.
Sponsored Docum
ent Sponsored D
ocument
Sponsored Docum
ent
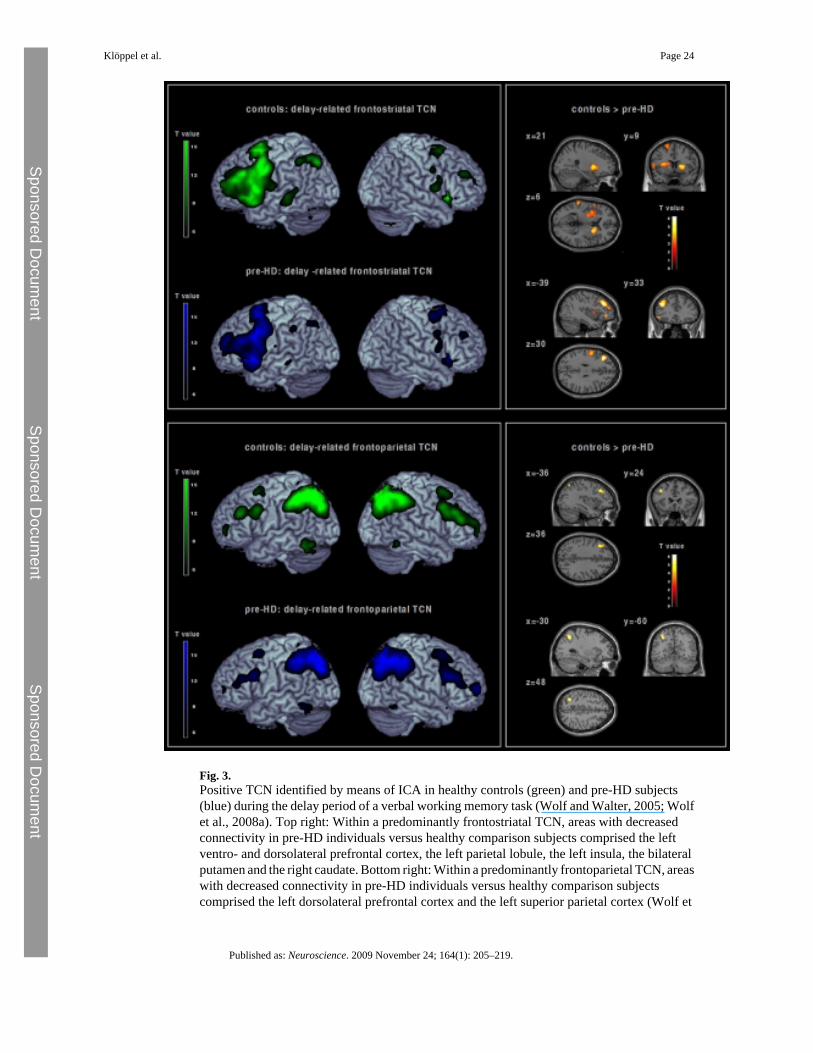
Fig. 3.Positive TCN identified by means of ICA in healthy controls (green) and pre-HD subjects(blue) during the delay period of a verbal working memory task (Wolf and Walter, 2005; Wolfet al., 2008a). Top right: Within a predominantly frontostriatal TCN, areas with decreasedconnectivity in pre-HD individuals versus healthy comparison subjects comprised the leftventro- and dorsolateral prefrontal cortex, the left parietal lobule, the left insula, the bilateralputamen and the right caudate. Bottom right: Within a predominantly frontoparietal TCN, areaswith decreased connectivity in pre-HD individuals versus healthy comparison subjectscomprised the left dorsolateral prefrontal cortex and the left superior parietal cortex (Wolf et
Klöppel et al. Page 24
Published as: Neuroscience. 2009 November 24; 164(1): 205–219.
Sponsored Docum
ent Sponsored D
ocument
Sponsored Docum
ent

al., 2008b). The 2nd level spatial maps are rendered on the anatomical templates implementedin MRIcron [http://www.sph.sc.edu/comd/rorden/mricron/] (left) and SPM5 (right).
Klöppel et al. Page 25
Published as: Neuroscience. 2009 November 24; 164(1): 205–219.
Sponsored Docum
ent Sponsored D
ocument
Sponsored Docum
ent
Copyright © 2022 FDOKUMEN