Logo detection based on spatial-spectral saliency and partial spatial context
8
LOGO DETECTION BASED ON SPATIAL-SPECTRAL SALIENCY AND PARTIAL SPATIAL CONTEXT Ke Gao 1, 2 , Shouxun Lin 1 , Yongdong Zhang 1 , Sheng Tang 1 , Dongming Zhang 1 1 Laboratory of Advanced Computing Research, Institute of Computing Technology, Chinese Academy of Sciences, Beijing, China, 100080 2 Graduate University of the Chinese Academy of Sciences, Beijing, China, 100080 {kegao, sxlin, zhyd, ts,dmzhang}@ict.ac.cn ABSTRACT Logo detection is important for brand advertising and surveillance applications. The central issues of this technology are fast localization and accurate matching. Based on key traits analysis of common logos, this paper presents a two-stage detection scheme based on spatial- spectral saliency (SSS) and partial spatial context (PSC). SSS speeds up logo location and avoid the impact of cluttered background. PSC filters false matching using spatial consistency of local invariant points. The integration of SSS and PSC result in faster localization and increased accuracy. Experiments on a dataset of nearly 10,000 web images containing several popular logo types are presented. The results indicate that our method is applicable and precise for different logo detection scenarios. Index Terms—Logo detection, spatial-spectral saliency, partial spatial context 1. INTRODUCTION Logo detection in images and videos is an important subset of content-based image retrieval technology. Applied logo detection systems may enable a variety of new web-based applications, such as automatic advertisement insertion and products identification. It has been regarded as an vital tool for industry, commerce, trademark registration and also for sports entertainment [1, 2, 3]. Logos are a tempting target for detection as they often appear in high contrast regions with distinctive visual information [1, 2] , as shown in Figure 1 with logo region boxed off. Here we summarized some key traits of common logos: 1) Logos are usually designed to contain both text and high-contrast visual features, such as abundant texture or distinctive colors, making it easy to be observed even in cluttered background. 2) The size of a logo is usually very small compared to the whole image, so as not to obstruct the screen. Fig.1 Logos in any orientation or at any position. 3) Logos could appear in any orientation or at any position of an image. Recent years have seen great progress in logo detection, but it is still an open-ended problem to solve. Different from common object detection, logos in natural photographs is usually too small to be accurately localized out of complex background. Existing methods often suffer from poor recall and high computational complexity. Previous works have primarily focused on sliding window approaches which have established themselves as state-of-the-art. But it usually suffers from heavy computational cost, because even an image of low resolution as 320×240 pixels contains more than ten billion rectangular subimages, which makes it too expensive to search exhaustively [4, 5]. Besides, these methods often extract color or texture features from sliding windows for logo pattern recognition, which can’t deal with occlusion and affine transformation properly. Recently, as local interest point detectors like SIFT [6] have become popular, there have been approaches that use point correspondences for matching object templates [2, 7, 8]. These methods regard an object as a bag of local patches and fit an affine transformation to simulate their geometric consistency. A major limitation of these methods is that there are thousands of redundant points (here redundant means not lie in logo regions), which not only increases the storage burden, but also results in lots of false-matches. 322 978-1-4244-4291-1/09/$25.00 ©2009 IEEE ICME 2009
-
Upload
independent -
Category
Documents
-
view
6 -
download
0
Transcript of Logo detection based on spatial-spectral saliency and partial spatial context

LOGO DETECTION BASED ON SPATIAL-SPECTRAL SALIENCY ANDPARTIAL SPATIAL CONTEXT
Ke Gao 1, 2, Shouxun Lin 1, Yongdong Zhang 1, Sheng Tang 1, Dongming Zhang 1
1Laboratory of Advanced Computing Research, Institute of Computing Technology, Chinese Academy of Sciences, Beijing, China, 100080
2Graduate University of the Chinese Academy of Sciences, Beijing, China, 100080 {kegao, sxlin, zhyd, ts,dmzhang}@ict.ac.cn
ABSTRACT
Logo detection is important for brand advertising and surveillance applications. The central issues of this technology are fast localization and accurate matching. Based on key traits analysis of common logos, this paper presents a two-stage detection scheme based on spatial-spectral saliency (SSS) and partial spatial context (PSC). SSS speeds up logo location and avoid the impact of cluttered background. PSC filters false matching using spatial consistency of local invariant points. The integration of SSS and PSC result in faster localization and increased accuracy. Experiments on a dataset of nearly 10,000 web images containing several popular logo types are presented. The results indicate that our method is applicable and precise for different logo detection scenarios.
Index Terms—Logo detection, spatial-spectral saliency, partial spatial context
1. INTRODUCTION
Logo detection in images and videos is an important subset of content-based image retrieval technology. Applied logo detection systems may enable a variety of new web-based applications, such as automatic advertisement insertion and products identification. It has been regarded as an vital tool for industry, commerce, trademark registration and also for sports entertainment [1, 2, 3].
Logos are a tempting target for detection as they often appear in high contrast regions with distinctive visual information [1, 2] , as shown in Figure 1 with logo region boxed off. Here we summarized some key traits of common logos:
1) Logos are usually designed to contain both text and high-contrast visual features, such as abundant texture or distinctive colors, making it easy to be observed even in cluttered background.
2) The size of a logo is usually very small compared to the whole image, so as not to obstruct the screen.
Fig.1 Logos in any orientation or at any position.
3) Logos could appear in any orientation or at any position of an image.
Recent years have seen great progress in logo detection, but it is still an open-ended problem to solve. Different from common object detection, logos in natural photographs is usually too small to be accurately localized out of complex background. Existing methods often suffer from poor recall and high computational complexity.
Previous works have primarily focused on sliding window approaches which have established themselves as state-of-the-art. But it usually suffers from heavy computational cost, because even an image of low resolution as 320×240 pixels contains more than ten billion rectangular subimages, which makes it too expensive to search exhaustively [4, 5]. Besides, these methods often extract color or texture features from sliding windows for logo pattern recognition, which can’t deal with occlusion and affine transformation properly.
Recently, as local interest point detectors like SIFT [6] have become popular, there have been approaches that use point correspondences for matching object templates [2, 7, 8]. These methods regard an object as a bag of local patches and fit an affine transformation to simulate their geometric consistency. A major limitation of these methods is that there are thousands of redundant points (here redundant means not lie in logo regions), which not only increases the storage burden, but also results in lots of false-matches.
322978-1-4244-4291-1/09/$25.00 ©2009 IEEE ICME 2009
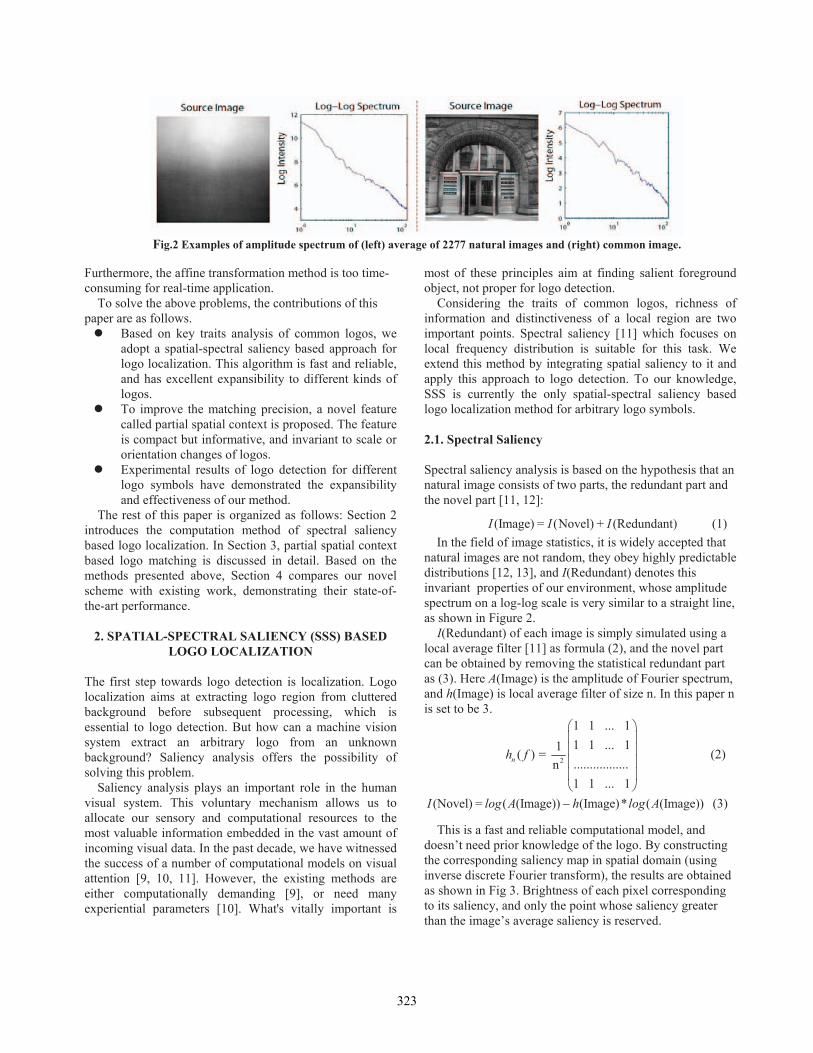
Fig.2 Examples of amplitude spectrum of (left) average of 2277 natural images and (right) common image.
Furthermore, the affine transformation method is too time-consuming for real-time application.
To solve the above problems, the contributions of this paper are as follows.
Based on key traits analysis of common logos, we adopt a spatial-spectral saliency based approach for logo localization. This algorithm is fast and reliable, and has excellent expansibility to different kinds of logos. To improve the matching precision, a novel feature called partial spatial context is proposed. The feature is compact but informative, and invariant to scale or orientation changes of logos. Experimental results of logo detection for different logo symbols have demonstrated the expansibility and effectiveness of our method.
The rest of this paper is organized as follows: Section 2 introduces the computation method of spectral saliency based logo localization. In Section 3, partial spatial context based logo matching is discussed in detail. Based on the methods presented above, Section 4 compares our novel scheme with existing work, demonstrating their state-of-the-art performance.
2. SPATIAL-SPECTRAL SALIENCY (SSS) BASED LOGO LOCALIZATION
The first step towards logo detection is localization. Logo localization aims at extracting logo region from cluttered background before subsequent processing, which is essential to logo detection. But how can a machine vision system extract an arbitrary logo from an unknown background? Saliency analysis offers the possibility of solving this problem.
Saliency analysis plays an important role in the human visual system. This voluntary mechanism allows us to allocate our sensory and computational resources to the most valuable information embedded in the vast amount of incoming visual data. In the past decade, we have witnessed the success of a number of computational models on visual attention [9, 10, 11]. However, the existing methods are either computationally demanding [9], or need many experiential parameters [10]. What's vitally important is
most of these principles aim at finding salient foreground object, not proper for logo detection.
Considering the traits of common logos, richness of information and distinctiveness of a local region are two important points. Spectral saliency [11] which focuses on local frequency distribution is suitable for this task. We extend this method by integrating spatial saliency to it and apply this approach to logo detection. To our knowledge, SSS is currently the only spatial-spectral saliency based logo localization method for arbitrary logo symbols.
2.1. Spectral Saliency
Spectral saliency analysis is based on the hypothesis that an natural image consists of two parts, the redundant part and the novel part [11, 12]:
(Image) = (Novel) + (Redundant)I I I (1) In the field of image statistics, it is widely accepted that
natural images are not random, they obey highly predictable distributions [12, 13], and I(Redundant) denotes this invariant properties of our environment, whose amplitude spectrum on a log-log scale is very similar to a straight line, as shown in Figure 2.
I(Redundant) of each image is simply simulated using a local average filter [11] as formula (2), and the novel part can be obtained by removing the statistical redundant part as (3). Here A(Image) is the amplitude of Fourier spectrum, and h(Image) is local average filter of size n. In this paper n is set to be 3.
2
1 1 ... 11 1 ... 11( ) = .................n1 1 ... 1
nh f (2)
(Novel) = ( (Image)) (Image)* ( (Image))I log A h log A (3)
This is a fast and reliable computational model, and doesn’t need prior knowledge of the logo. By constructing the corresponding saliency map in spatial domain (using inverse discrete Fourier transform), the results are obtained as shown in Fig 3. Brightness of each pixel corresponding to its saliency, and only the point whose saliency greater than the image’s average saliency is reserved.
323

Input Image Spectral Saliency Map Input Image Spectral Saliency Map
Fig.3 Results of spectral saliency analysis.
As shown above, spectral saliency analysis could detect the local high–frequency regions efficiently of each image (upper row). However, it also contains some unwanted parts such as successive texts or dense forests with similar local frequency characters (lower row). Therefore, we use spatial saliency analysis to refine the result of logo localization.
2.2. Spatial Saliency
The above stage focus on the “richness of information”, now we further filter these candidate regions based on “distinctiveness”. Different from logo regions, successive text or dense forests often have high self-similarity over large ranges of scale, which can be removed utilizing this attribute.
For efficiency, the image is down-sampled to size 320*240 pixels before processing, and divided them into 10*10 pixels non-overlapping patches. For a candidate salient patch X detected in the above stage (containing more than 20% spectral salient point), we calculate the sum of absolute difference of color and texture histograms within different scales, which is defined as self-similarity degree. Experientially, these 3 scales are set to be 5, 10, and 15 pixels separately.
X Color TextureSelfSim SelfSim SelfSim (4)
Color/Texture1
(| 10 5 | | 15 10 |)d
i i i ii
SelfSim Hist Hist Hist Hist(5)
( ) /100,
0,
i xi X
SpecSal
x
SelfSim Threshold
ElseSSS
(6) For color self-similarity, we use HSV color space, and
calculate 32-dimension color histograms of each patch, with each channel are quantized to 8, 2, and 2 separately. For texture self-similarity, 8-dimension gradient orientation similar to SIFT [7] is calculated for each patch. Finally, we use simple threshold segmentation to remove the unwanted candidate regions with experiential threshold, and the
spatial-spectral saliency of each patch is set to be its average spectral saliency.
2.3. Logo Localization
After the above process, the spatial-spectral saliency map of each image is obtained. The saliency map is an explicit representation of logo location, and the brightness of each patch corresponding to its average saliency. For simplicity, we select a square area of logo localization in this study. In order to make a trade-off between the richness of region information and the precision of logo localization, we use maximum saliency density algorithm to select the logo area.
Maximum Saliency Density Algorithm
Rank the N non-negative candidate patches according their SSS.
Pushback patch 1(maximum) to vector LogoAreas(LA)
For patch i, i=2 to NIf (patch i is far from any geometric center of
the existing LA ) Pushback patch i as a new LA;
ElseAdd patch i to the nearest LA k;Obtain the Minimum Boundary Rectangle (MBR) of LA k;Calculate the Saliency Density (SD) of MBR k;
If ( SD k increases) Continue; Else Delete patch i from LA k;
Delete LA whose MBR is smaller than 4 patches;
Number of logos in the image is LA.size();Square Area of logo k is MBR k.
324

Input Image SSS Map Logo Localization Input Image SSS Map Logo Localization
Fig.4 Results of SSS-based logo localization.
Input Image Itti’s Color Map Itti’s Intensities Map Itti’s Orientation Map Itti’s Saliency Map
Fig.5 Results of Itti’s method for comparison.
MBR is the minimum rectangle containing all of the patches in LA k, which can be obtained quickly as follows, and saliency density of MBR k is calculated as formula (9):
min {coordinate of patch i }low bound i LA kMBR (7)
max{coordinate of patch i }high bound i LA kMBR (8)
( ) /k i ki MBR k
SD Saliency Area (9)
While the logo areas are generated, logos can be easily extracted from their corresponding positions in the input image. Our algorithm is fast and also proper for multi-logo localization, providing a promising solution to real time systems. Some result instances are shown as Figure 4.
To make a comparison, we compare our SSS method with Itti’s well known theory [9], which integrates 48 low-level feature maps into a whole Saliency Map ( Including color, intensity and orientation, and at different scales). The implementation can be found in http://www.saliencytool-box.net. From the result shown in Figure 5, we observe that our method is much more appropriate for logo localization, which is fast and reliable for different kinds of logos. More details can be found in section 4.
3. PARTIAL SPATIAL CONTEXT (PSC) BASED LOGO MATCHING
325

(a) (b) (c)
(d) (e) (f) (g) Fig.6 (a) Illustration of Partial Spatial Context. (b) PSC of Original Logo. (c) PSC of Different Logo.
(d) Original Logo Pattern. (e) Rotated Logo Pattern. (f) Scaled Logo Pattern. (g) Different Logo Pattern.
The second step of logo detection is similarity matching, for which feature extraction is vital important.
Recently, the use of local descriptors has become particularly widespread because of its robustness to image clutter and occlusions [6, 7, 8]. Bag-of-local-features (BOF) based image representation is also proposed for object detection [15]. However, the existing methods either ignoring their spatial relation, or use affine transformation which is too time-consuming for real-time application [6, 7]. An efficient method for large scale image search has been proposed in [14], which filters matching descriptors based on different of angle and scale. But this method doesn’t consider the spatial relationship of points, which is very important for matching precision.
In this section, we present a new descriptor Partial Spatial Context (PSC) to formulate the spatial distribution for the set of matching local points. This descriptor describes both the transformation consistency and contextual information of the point set, which will improve the detection precision further.
PSC is built upon BOF formalism. The matching process starts with representing the Candidate logo region as a bag of quantified visual words based on SURF [16] feature points. Each point is described as: Pi = {(Xi, Yi), Si, Oi, Fi},where are respectively the x- and y- coordinate, the scale, the dominant orientation, and the corresponding visual word of the ith detected local point. Based on this information, the principle of PSC is illustrated as Figure 6.
For a given point set, the PSC of it can be obtained as follows:
Firstly, calculate its Geometrical Center and Average Scale as formula (10).
Second, find Minimum Boundary Round (MBRround,something like MBR--Minimum Boundary Rectangle) of this points set, and get its radius and domain orientation as (11). Finally, partition the MBRround into 9 segments as Fig 6(a). Describe these points’ distribution with a 9-dimension histogram, which is called PSC in this study.
Note that the PSC is rotate and scale invariant by aligning the MBRround with its radius and domain orientation. Formula (12) is used to measure the similarity of two PSCs, which is a float number between 0 and 1. And bigger score means higher similarity.
( ) / , ( ) /i iPi Set Pi Set
GC Coordinate n AScale Scale n (10)
max{ ( , )},
( ) /
round radius iPi Set
round domain orientation iPi Set
MBR Distance P GC
MBR Angle n (11)
9
1 2 1 2 =1
( , ) ( min{ , }) /i i matching pointsi
Sim PSC PSC PSC PSC N(12)
The motivations behind PSC are three aspects: (1) Reduce the false matching point set which are not
transformed by consistent angles and scales with the target point set.
(2) Further verify the spatial consistency of two point sets using their relative distance and position.
(3) The partition method is robust to occlusion and small deviation of keypoint’s position, but sensitive to changing of spatial distribution at the same time. Only two sets of matching points detected from the same logo symbol (or copies with some
326

transformation such as rotating or scale changing) will result in similar PSC, for the points in one set share the same transformation in scale and orientation, and the PSC will be invariant.
Our novel feature PSC is compact but informative, which would enable a variety of real-time applications. Details of the comparison between existing method and our scheme will be discussed in next section.
4. RESULT AND CONCLUSION
To evaluate our method, we collected a dataset of 10,016 images from the web and TV shows. Ten popular logos are selected for test, such as Starbucks, Coca-Cola, Nike, CNN etc. These logos are either on products or in cluttered background, and very different in position, orientation, and sizes. Related images (containing the same logo) for each logo category vary from 30 to 200, and the rest non-related images are also contained as interference.
The proposed scheme is designed to speed up logo localization and improve the detection precision at the same time. So we begin by demonstrating SSS for logo localization in section 4.1. The performance of PSC will be discussed in section 4.2.
4.1 Logo Localization
Firstly, we compare our SSS with the well known method Sliding Window (SW) mentioned above.
The majority of images in our dataset are between 1024 and 240(minimum of width and height), while the sizes of logos vary from 10 to 80 pixels. The number of subimages grows as O(n4) for image of size n n, which makes it too expensive to exhaustively detection. Even with a fixed size of sliding window, the computational complexity of SW method is about O(n2 w2/step), where w denotes sliding window size and step is sliding step. In contrast to this, the computational complexity of our SSS is only linear to image resolution.
Fig.7 Comparison of logo localization speed.
As shown in Figure 7, SW method using a window of 10×10 (sliding step is 1 pixel, detecting logo based on color and texture) is still much lower than our SSS method, and fixed size of sliding window often results in low recall and bad expansibility. The average speech of SSS is 0.1s per image because it needs to scan the image for only once.
Secondly, to compare our method with other saliency-based approach, table 1 shows both the logo localization speed and accuracy of our SSS and Itti’s Saliency Map (ISM). Localization accuracy is defined as the ratio of detected logos to the amount of logos contained in the test image dataset. The benchmark of logos’ real position and size are manually labeled, and a candidate detected logo region is discarded if the area overlap is lower than 80%.
We can see clearly that our SSS is more suitable for logo detection compared to Itti’s ISM method. Because ISM often focus on the salient object in foreground which has big contrast to its surrounding, such as people and building, and logos are usually ignored. Moreover, ISM needs to calculate 48 low-level feature maps corresponding to different feature and different scale, while SSS only have to calculate the Fourier spectrum of original image.
4.2 Logo Detection
In addition, by integrating SSS and PSC, our novel scheme can be applied not only for logo localization, but also in many other areas, such as logo recognition or logo retrieval.
In the following, we give a description on how to use our method for logo retrieval i.e. to retrieve logo-contained images from a database based on queries of target logo specified by users. The architecture of this system is shown in Fig.8.
Fig.8 Architecture of logo retrieval system.We adopt a query-by-example framework similar to [8],
where the query is a part of an image, and we are interested in all images in our dataset that contain the same object. Different with [8], we only focus on logos as query objects.
327

Table.1 Comparison of logo localization accuracy and speed.
As mentioned above, SSS is used to localize logo regions for images in dataset. We only analyze these regions in sequent process and extract 64-dimension SURF features from them. SURF features describe the visual character of each keypoint, and the spatial information of each point is also recorded, such as position, scale and orientation.
For a given query logo, the same processing will be used to obtain its SURF and spatial information, and all of these features are stored in an effective index something like k-d tree.Based on similarity search using SURF feature and simple voting algorithm, we can get a candidate image set, among which existing several false matching. That’s mainly because we have only relied on the visual feature of each point, but ignored their spatial relation which is important for keypoint set.
Therefore, we use PSC based geometric consistency verification to reduce false matching. For simplicity, we only use it to the candidate images and re-rank them based on the similarity of their PSCs. Some instances with representative results are shown in Fig 9. Where the left column images are query examples with logos specified.
We can see that we could detect logos efficiently even in an image with cluttered background, and properly deal with various kinds of logo symbols. Due to the terseness of PSC feature, it can be calculated very fast in order to realize online geometric consistency based re-ranking. On our 3.2GHz PC, this results in an average search time below 0.8s per query image, and scaling linearly with the number of returned images.
Fig.10 Average precision of 3 logo detection methods.
For comparison, we tested three kinds of methods and give the results in Fig 10. To demonstrate the effectiveness of our novel scheme (called SSS+PSC for short), BOF method without any spatial verification (BOF) and the famous method (WGC) recently presented in [14] are chosen for comparison. We have selected 10 categories of representative logos as queries, and calculate Average Precision (AP) of top 15 returned images for each kind of query logos.
Although detection precision varies because of different visual characters of different kinds of logos, our scheme performs better than other two methods in most situations. We believe that it is because we introduced a novel scheme which is suitable for logo detection and result in faster logo localization and better matching precision.
The contributions of this paper can be concluded as follows.
1) We proposed a two stage scheme suitable for logo detection based on key traits analysis of common logos. This method integrates two novel methods SSS and PSC.
2) Spatial-Spectral Saliency (called SSS for short) based approach is used for logo localization. The algorithm is fast and reliable, and has excellent expansibility to different kinds of logos even with strong background variations.
3) To improve the matching precision, a novel feature called Partial Spatial Context (PSC) is proposed. The feature is compact but informative, and invariant to scale or orientation changes of logos.
Experimental results of logo detection for different logo symbols have demonstrated the expansibility and effectiveness of our method.
5. ACKNOWLEDGEMENT
This work was supported by National Basic Research Program of China (973 Program, 2007CB311100), National High Technology and Research Development Program of China (863 Program, 2007AA01Z416), National Nature Science Foundation of China (6087316560802028), Beijing New Star Project on Science & Technology (2007B071), Co-building Program of Beijing Municipal Education Commission.
328

Fig.9 Some instances of logo retrieval based on SSS and PSC.
6. REFERENCES
[1] Kleban. Jim, Xing Xie, Wei-Ying Ma, “Spatial Pyramid Mining for Logo Detection In Natural Scenes,” IEEE International Conference on Multimedia and Expo (ICME08), pp. 1077-1080, 2008.
[2] S. Sanyal and S. H. Srinivasan, “Logoseeker: A System for Detecting and Matching Logos In Natural Images,” in Proc. of. ACM Multimedia (MM07), Augsburg, 2007.
[3] A. Bagdanov, L. Ballan, M. Bertini, A. Del Bimbo, "Trademark Matching and Retrieval in Sports Video Databases", In. Proc. of ACM Multimedia Information Retrieval (MIR07),Augsburg, Germany, 2007.
[4] Lampert, C. H., M. B. Blaschko and T. Hofmann, “Beyond Sliding Windows: Object Localization by Efficient Subwindow Search.” Proceedings of the IEEE Conference on Computer Vision and Pattern Recognition (CVPR08), 2008.
[5] V. Ferrari, L. Fevrier, F. Jurie, and C. Schmid, “Groups of Adjacent Contour Segments for Object Detection.” PAMI08,30:36–51, 2008.
[6] D. G. Lowe, “Distinctive Image Features from Scale-Invariant Keypoints.” IJCV, 60(2):91–110, 2004.
[7]R. Fergus, P. Perona, and A. Zisserman, “Object Class Recognition By Unsupervised Scale-Invariant Learning.” Proc. CVPR, 2003.
[8] Jams Phibin, Ondrej Chum, Michael Isard, et al. “Object Retrieval With Large Vocabularies And Fast Spatial Matching,”
IEEE Conference on Computer Vision and Pattern Recognition(CVPR), 2007.
[9] Itti. L, Koch. C, and Niebur. E, “A Model Of Saliency-Based Visual Attention For Rapid Scene Analysis.” IEEE-TPAMI, 20 (11) pp.1254–1259,1998.
[10] Ma Y F, Zhang H J, “Contrast-based Image Attention Analysis By Using Fuzzy Growing.” Proceedings of the 11th ACM International Conference on Multimedia (MM2003).Berkeley, CA, USA: ACM, pp.374 – 381, 2003.
[11] Xiaodi Hou, Liqing Zhang, "Saliency Detection: A Spectral Residual Approach," Computer Vision and Pattern Recognition (CVPR), 2007.
[12] C. Koch and T. Poggio, “Predicting The VisualWorld: Silence is Golden”. Nature Neuroscience, 2(1):9–10, 1999.
[13] D. Ruderman, “The Statistics of Natural Images.” Network: Computation in Neural Systems, 5(4):517–548, 1994.
[14] Herve Jegou, Matthijs Douze, and Cordelia Schmid, “Hamming Embedding And Weak Geometric Consistency For Large Scale Image Search,” ECCV, 2008.
[15] Sivic. J, Zisserman. A, “Video Google: A text retrieval approach to object matching in videos.” In: ICCV. pp. 1470–1477. 2003.
[16] Herbert Bay, Tinne Tuytelaars, and Luc Van Gool, “SURF: Speeded Up Robust Features,” ECCV , 2006.
329