localized and general corrosion of copper in azoles and silica ...
12
LOCALIZED AND GENERAL CORROSION OF COPPER IN AZOLES AND SILICA INHIBITED ZERO BLOWDOWN COOLING WATER IN AN AUTOMOTIVE PLANT Dan Duke Water Conservation Technology International, Inc. Temecula, CA Lietai Yang Corr Instruments, LLC San Antonio, TX ABSTRACT In the spring of 2007, the cooling water chemistry at a large automotive plant in Los Angeles, California, was changed from traditional chemical treatment of potable water to recycled water treated with a new zero blowdown chemistry. To establish the localized copper corrosion baseline during this transition, coupled multielectrode array sensors (CMAS) were installed in the sampling station of the cooling water system and corrosion monitoring was performed on real time basis in the plant. The CMAS corrosion monitoring was implemented as a means to rapidly confirm the effectiveness of the new corrosion control technology in protecting copper exchanger tubes in a potential highly corrosive environment. The need for rapid real time confirmation of effective copper corrosion inhibition with CMAS was based on presence of critical copper exchange surfaces in the customer system that would be exposed to the presence of 30 to 40 mg/L of ammonia in the recycled municipal waste water used as tower makeup. Prior experience using linear polarization resistance (LPR) and weight loss methods to determine corrosion rates indicated they were not effective in reliably detecting changes in corrosion in high dissolved solids water with this treatment method, primarily due to the extraordinarily low corrosion rates with this chemistry for steel, copper and other metals. Further, there was no prior monitoring experience with copper exposed to ammonia in high TDS chemistry to indicate that previous low corrosion rates could be maintained with this new chemistry. Keywords: zero blowdown, corrosion inhibition, cooling tower corrosion, cooling water corrosion, multielectrode, corrosion monitoring, corrosion sensor, localized corrosion sensor, multielectrode array, and coupled multielectrode. ` 1
-
Upload
khangminh22 -
Category
Documents
-
view
4 -
download
0
Transcript of localized and general corrosion of copper in azoles and silica ...

LOCALIZED AND GENERAL CORROSION OF COPPER IN AZOLES AND SILICA INHIBITED ZERO BLOWDOWN COOLING WATER IN AN AUTOMOTIVE PLANT
Dan Duke
Water Conservation Technology International, Inc. Temecula, CA
Lietai Yang
Corr Instruments, LLC San Antonio, TX
ABSTRACT
In the spring of 2007, the cooling water chemistry at a large automotive plant in Los Angeles, California, was changed from traditional chemical treatment of potable water to recycled water treated with a new zero blowdown chemistry. To establish the localized copper corrosion baseline during this transition, coupled multielectrode array sensors (CMAS) were installed in the sampling station of the cooling water system and corrosion monitoring was performed on real time basis in the plant.
The CMAS corrosion monitoring was implemented as a means to rapidly confirm the effectiveness of the new corrosion control technology in protecting copper exchanger tubes in a potential highly corrosive environment. The need for rapid real time confirmation of effective copper corrosion inhibition with CMAS was based on presence of critical copper exchange surfaces in the customer system that would be exposed to the presence of 30 to 40 mg/L of ammonia in the recycled municipal waste water used as tower makeup.
Prior experience using linear polarization resistance (LPR) and weight loss methods to determine corrosion rates indicated they were not effective in reliably detecting changes in corrosion in high dissolved solids water with this treatment method, primarily due to the extraordinarily low corrosion rates with this chemistry for steel, copper and other metals. Further, there was no prior monitoring experience with copper exposed to ammonia in high TDS chemistry to indicate that previous low corrosion rates could be maintained with this new chemistry.
Keywords: zero blowdown, corrosion inhibition, cooling tower corrosion, cooling water corrosion, multielectrode, corrosion monitoring, corrosion sensor, localized corrosion sensor, multielectrode array, and coupled multielectrode.
` 1
INTRODUCTION
Environmental and water sustainability concerns are increasing the movement of commercial and industrial plants toward use of zero blowdown (ZBD) and non-chemical water treatment approaches in their cooling water systems. Many facilities are constructing new buildings or expansions where they desire to attain Leadership in Energy and Environmental Design (LEED) accreditation and status by the United States Green Building Council (USGBC). LEED accreditation points are provided with water treatment technology that can provide significantly increased water use efficiency, minimize or eliminate chemical use and utilize recycled waste waters. These plants and the public water utilities that supply them water are also targeting increased use of recycled and other waste water sources in evaporative cooling applications to conserve limited fresh water supplies.
An automotive headquarters facility made the change from potable water and traditional
chemical water treatment to begin use of California Title 22 recycled municipal waste water and silica based water chemistry for their cooling water system. To make sure the plant did not experience significant upsets in corrosion during the transition, coupled multielectrode array sensors (CMAS) were installed in the sampling station to monitor the localized corrosion rate. CMAS was used initially to establish a base line corrosion rate for copper exposed to the high total dissolved solids (TDS) using potable makeup water at zero blowdown (ZBD) with silica chemistry. CMAS then monitored the effect on copper corrosion with the transition to recycled water makeup and the presence of ammonia.
The primary system metal components treated in the field cooling system study as well as evaluated in laboratory studies were mild steel and copper. The inhibitor chemistry used to protect mild steel was polymerized silica controlled at saturated equilibrium between amorphous and soluble (monomer) silica, which has been demonstrated as highly effective in prior studies. An azoles copper inhibitor (TTA) was added to inhibit corrosion of copper in the presence of ammonia in a high TDS and high pH control range environment used with the silica chemistry inhibitor and zero tower blow down operation.
EXPERIMENTS
The automotive central plant cooling tower system served chiller and adsorption machines that would utilize reclaim water (California Title 22) as makeup for the ZBD and silica inhibitor treatment method. The makeup water was filtered and ion exchange softened on site to facilitate ZBD and conversion of natural source water silica in the makeup water to a corrosion inhibitor. The tower water was also supplemented with tolytriazole (TTA) corrosion inhibition chemistry to demonstrate field efficacy for inhibiting the attack of copper by ammonia contributed by the recycled waste water in the presence of high TDS / high pH / silica / azoles chemistry as previously reported in laboratory studies by Duke and Yang. 1 Localized Corrosion Rate Monitoring
The coupled multielectrode array sensor technology is a recently emerged technology for
corrosion monitoring. 1-3 A coupled multielectrode array sensor is composed of multiple electrodes made of the same metal whose corrosion rate is to be monitored. These electrodes are insulated from each other and are individually connected to a multi-channel current-measuring device which imposes near zero potential among the electrodes. Therefore, all electrodes are essentially at the same electrochemical potential and simulate the behavior of a single piece of metal. When the metal is immersed in a corrosive liquid solution, or covered by a corrosive electrolyte such as a thin film of liquid formed underneath a layer of defected coating or in air by the deliquescence of aerosols, corrosion may take place. The corrosion is, in most cases, non-uniform or even localized. Some areas of the metal corrode more and other areas corrode less. The areas that corrode more are referred as the more anodic areas and the areas that corrode less are referred as the less anodic or the cathodic areas. Because all aqueous corrosion is electrochemical in nature, electrons released at the anodic areas flow
` 2

to the cathodic areas. Such electron flows represent the localized corrosion taking place on the metal surface. Therefore, CMAS probes are especially suitable for localized corrosion monitoring.
The CMAS probes usually contain 9 or 16 electrodes for industrial monitoring applications. In
this work, a 16-electrode probe was used. The electrodes were made of 1-mm diameter wires of Type 110 copper (UNS C11000). Prior to each test, the sensing surface of the CMAS probe (the tip of the probe) was polished with 400-grit sand paper.
An 18-channel (Model A-18*) nanoCorrTM* CMAS analyzer was used to gather the real time
data from the CMAS probe. The CMAS analyzer was interfaced with a notebook computer which has the CMAS analysis software, CorrVisualTM*. The computer displayed the data from the CMAS analyzer and save them into its memory. Figure 1(a) shows the installation of the copper and a carbon steel CMAS probes in the sampling station of the cooling water system. Because the particular model of the CMAS analyzer available had only 18 channels and can be used only for one 16-electrode probe at a given time, the CMAS analyzer was connected to and only monitored the copper probe during the test due to the priority of affirming copper corrosion control. Figure 1(b) shows the computer and the CMAS analyzer used during the experiment.
General Corrosion Rate Monitoring
Linear polarization resistance (LPR) method is a widely used method in the cooling water
industry for general corrosion monitoring.4 The LPR copper probe was installed in the same station as shown in Figure 1(a). A handheld LPR corrosion rate meter (Aqua Mate†, P/N 710700) was connected periodically to the LPR copper probe to take the general corrosion rate readings.
Copper corrosion coupons were also installed in the same sampling loop assembly for
comparison and confirmation of general corrosion weight loss rates. Tower Water Chemistry Water analyses were performed on samples from the cooling tower system serving the central chiller and adsorption machines in the automotive plant and on the softened recycled municipal waste water (California Title 22) used as makeup for the ZBD / silica inhibited treatment approach. The makeup water was filtered and pre-treatment softened on site for this application to facilitate conversion of source water silica to a corrosion inhibitor in the tower water. Supplemental TTA corrosion inhibitor chemistry was used to demonstrate it’s efficacy in inhibiting corrosion of copper by the ammonia that was present in the recycled makeup water when applied in highly concentrated (high TDS / high pH / ZBD) tower water. Typical chemistry results are shown in Table 1.
RESULTS AND DISCUSSION
Localized Corrosion Rates of Copper Prior to Chemistry Change Because of the unavailability of the CMAS analyzer at the start of the project, only short-term
localized corrosion rate was obtained from the copper probe. Figure 2 shows the short-term maximum localized corrosion rate from the copper CMAS probe. The maximum localized corrosion rate was the rate calculated from the current measured on the electrode that was experiencing the highest corrosion rate. This electrode is called the most corroding electrode and it simulates the behavior of the fastest
* nanoCorr and CorrVisual are tradenames of Corr Instruments, LLC, San Antonio, Texas. † Aqua Mate is a tradename of Rohrback Cosasco Systems, Inc., Santa Fe Springs, California
` 3

growing pit in a pitting corrosion case. The stabilized maximum localized corrosion rate was approximately 0.3 mpy (7.6 µm/yr) for copper.
When the CMAS analyzer was not connected to a probe, its multiple-pin connectors at the end
of the cable was in air. If the air is humid, these pins would corrode in air and gives the corrosion rate of the connector pins in air. If the environment is noisy, the noise signal may also be picked up by the analyzer. Therefore, the connector is equivalent to a dummy probe and the signal from the dummy probe represents the lower detection limit of the CMAS analyzer in the environments. Figure 2 shows that the lower detection limit is 0.01 mpy (0.25 µm/yr) under the test conditions.
Localized Corrosion Rate of Copper after Change from Traditional Chemical Treatment
The transition of the cooling water chemistry at the plant began on May 27, 2007. The transition
process involved initiating softened makeup, then blowing down the tower water to get residual hardness below a maximum level of 30 mg/L before tower blowdown was discontinued to concentrate tower water to the desired control chemistry. Numerous upsets occurred during the transition process due to both scheduled and unscheduled events including prior planned tower cell replacements and tower water dumps, power outages, tower overflows, tower system maintenance, pre-treatment softener system operational issues and hard water contributions to the tower water (other than the softened water system). These upsets primarily required tower water blowdown to reduce hardness, resulting in loss of desired tower water chemistry concentration and control ranges.
The cooling system was initially transitioned with softened potable makeup water, beginning
May 27, to establish control chemistry and passivate system metals before introduction of recycled water with high ammonia content on August 17, 2007. Tower water control residuals had been maintained within desired silica, pH, TDS and azoles ranges before recycled water use was initiated. However, tower water control residuals sometimes fell outside of desired ranges after initiating recycled water use due to some of the transition issues noted above. The accumulative corrosion passivation effects of the control chemistry would be expected to mask some variations in corrosion during such upsets, particularly with copper, as both silica chemistry and azoles chemistry were maintained for copper corrosion inhibition synergy.
Figure 3 shows the maximum localized corrosion rate measured by the copper probe after the
transition of the chemistry was initiated. From August 21 to September 6, 2007, the CMAS analyzer was accidentally turned off and no data were available for this period.
It appears that the maximum localized corrosion rate signal was noisy and there were spikes
especially during the first 20 days. Figure 4 shows one of the spikes that occurred on July 25th while the system was still using potable water; the signal was well defined and does not look like that it was due to the random noise effect. The maximum localized corrosion rate was 0.01 mpy (0.25 µm/yr) prior to the spike and suddenly increased to 0.5 mpy (12.7 µm/yr) within one data interval (15 minutes). Then, the maximum localized corrosion rate gradually decreased to 0.3 mpy (7.6µm/yr) over a period of 23 hours. At the end of the 23-hour period, the maximum localized corrosion rate suddenly dropped to the lower detection limit of the instrument within one data interval.
Therefore, Figure 3 indicates that only low levels of pitting corrosion occurred during the first 20
days and was generally exceptionally low afterwards. The pitting corrosion observed after the first 20 days was mostly short-lived; they lasted only for a few hours or a few days. Soon after the detection of the pitting corrosion, the metal was passivated and the pitting corrosion stopped. The corrosion rates in the first 20 days and thereafter is consistent with the trend of the general corrosion rate data (see discussions below for Figure 5).
Variability of water chemistry and control parameters during both potable and recycled makeup
periods do not permit any assessment or conclusions regarding their impact, with the exception of the
` 4

presence of ammonia only during the recycled makeup period (see below for Tower Chemistry Section). Correlation between localized corrosion spikes and the coolant chemistry was not attempted.
Figure 3 also shows the moving average of the maximum localized corrosion rate and the
overall average maximum localized corrosion rate during operation with potable makeup water followed by the change to recycled makeup water. The moving average of the pitting corrosion rate was well below 0.3 mpy (7.6 µm/yr) except during the first 2-week period when the moving average localized corrosion rate reached 0.8 mpy (20.3 µm/yr). During the first 2-week period, the water chemistry was not stable, due to previously noted transition upsets and operation of tower water chemistry below the desired control ranges.
The change from potable water makeup to ammonia laden recycled water makeup in mid
August appears to have increased the copper corrosion rate from approximately 0.041 mpy (1.0 um/yr) in overall average to 0.09 mpy (2.3 µm/yr) in overall average (see Figure 3). This increase would be expected with the increased corrosive potential of recycled water use, due to ammonia content (see below for Tower Chemistry section). A good example of the increased corrosiveness of the recycled water is that the plant has already had to replace the brass tower makeup control valves (not protected) due to the effects of high ammonia in the makeup water. However, copper corrosion was inhibited well below traditional chemical treatment corrosion rates (low TDS tower water) in this tower system by the control chemistry with this high TDS treatment method. Therefore the silica plus azoles chemistry effectively inhibited localized corrosion of copper in the high dissolved solids chemistry and ammonia content of the cooling tower water.
General Corrosion Rate of Copper after Change from Traditional Chemical Treatment
Figure 5 shows the general copper corrosion rate measured with the LPR method, along with
the moving average of the localized corrosion rate for copper obtained with the CMAS probe. The general corrosion rate was high (from 0.04 to 0.33 mpy) in the first 20 days, and low thereafter (from 0 to 0.03 mpy except for one point of 0.07 mpy). In general, the trend of the general corrosion rate from the LPR probe agrees well with the localized corrosion rate from the CMAS probe. The LPR data were mostly zero when the localized corrosion rate from the CMAS probe averaged 0.05 mpy (1.25 µm/yr) during the study. Prior experience using LPR and weight loss methods to determine corrosion rates indicated that these methods were not effective or sensitive enough to detect changes in corrosion when using the ZBD (high TDS) and silica based technology, due to the extraordinarily low corrosion rates for steel, copper and other metals. Studies with special exposure techniques for weight loss coupons have confirmed that an elevated corrosion rate bias occurs due to under-mount coupon corrosion with the ASTM methods.5,6 Figure 5 demonstrates the small increase in copper corrosion was not detected with LPR in contrast to the shift in copper corrosion rate detected by CMAS data after implementing use of recycled water.
The copper corrosion coupon picture shown in Figure 6, confirms excellent corrosion control
during the study. The corrosion rate was 0.16 mpy for 99 days exposure.
Tower Chemistry Figure 7 shows comparative plots of the water chemistry from the tower. Shortly after the
change from the traditional chemical treatment program to the silica inhibited water chemistry, three key parameters (pH, TDS and Silica) were below the desired treatment control ranges. It took about 2 weeks for those values to reach their steady state target ranges (above 9.5 for pH, greater than 10,000 ppm for TDS and greater than 300 ppm for Silica). The TTA residual was controlled between 20 and 60 ppm. The TTA residual was maintained via small slug dose every two to four weeks since there was minimal loss with zero tower blowdown. Total hardness decreased slowly from 100 to 10 ppm which limited how quickly desired tower water control concentrations could be achieved. The ammonia concentration naturally dropped to 0.5 to 1 ppm in the tower water after the change to recycled water
` 5

due to loss of ammonia gas over the tower with ammonium ion conversion to ammonia gas at tower elevated pH equilibrium. No apparent correlation can be drawn between the corrosion rate and other chemical parameters in these data except for the expected impact with change to tower water with ammonia content.
CONCLUSIONS
Corrosion monitoring was conducted in the cooling water system of a major automotive
headquarters facility in California during the switch from traditional chemical water treatment chemistry to silica plus azoles chemistry. The localized corrosion rate for copper was approximately 0.3 mpy (7.6 µm/yr) prior to the chemistry change. In the first 20 days after the chemistry change, short-lived higher localized corrosion events [mostly up to 2 mpy (50 µm/yr)] was observed due to transition upsets and delays in establishing stabilized targets for tower water control chemistry. After the first 20 days, the tower water attained target treatment control ranges and the overall localized corrosion rate of copper was below 0.1 mpy (2.5 µm/yr) for the remaining 5 month period. However, CMAS was able to detect a small increase in localized copper corrosion from 0.041 mpy to 0.09 mpy with the change from potable water to recycled makeup water that contained ammonia. During the remaining period, low level of localized corrosion events [mostly less than 0.3 mpy (7.6 µm/yr)] was occasionally observed. These low level corrosion events were short-lived and disappeared as the metal became passivated soon after they occurred.
The trend of the general corrosion rate for copper is consistent with the localized corrosion rate,
with higher rate in the first 20 days and zero or near zero rate 20 days after the transition to the new ZBD chemistry with either potable or recycled makeup water. The measurements confirm that the silica-azoles chemistry was effective in terms of inhibiting localized corrosion of copper at this facility when using either potable makeup or ammonia bearing recycled makeup water.
The use of a silica based inhibitor chemistry to protect mild steel in the presence of ammonia,
high TDS, high pH, soft water and zero blow down tower operation proved highly effective, independent of the presence of ammonia and organics from municipal recycled waste water. Further, use of azoles to inhibit copper corrosion in the presence of ammonia, high TDS, high pH and soft water was established as highly effective, and beneficial for treatment of tower systems using recycled water and operating at zero tower blow down.
ACKNOWLEDGMENTS
The authors would like to thank Mr. Mike Collins and Mr. Neil Brine for their assistance during the tests.
REFERENCES
1. L. Yang, “Multielectrode Systems,” in “Corrosion Monitoring Techniques,” L. Yang, ed.,
Woodhead Publishing, Success, UK, (2008), Chapter 8.
2. Dan Duke and L. Yang, “Electrochemical Studies with CMAS Probes on Corrosion Inhibition of Copper and Affected Metals in the Presence of Ammonia and Other Corrosive Ions in Zero Liquid Discharge Cooling Water” CORROSION/2008, paper 08372, (Houston, TX: NACE, 2008).
3. “Laboratory and Field Studies of Localized and General Corrosion Inhibiting Behaviors of Silica
in Zero Liquid Discharge (High TDS Cooling Water) using Real Time Corrosion Monitoring Techniques” Dan Duke, Lietai Yang, CORROSION/2007, paper no. 07626 (Houston, TX: NACE, 2007).
` 6

4 S. Papavinasam, “Electrochemical Techniques for Corrosion Monitoring,” in “Corrosion
Monitoring Techniques,” L. Yang, Ed., Woodhead Publishing, Success, UK (2008), Chapter 3. 5. ASTM G4-01, “Standard Guide for Conducting Corrosion Tests in Field Applications,” Annual
Book of ASTM Standards, Vol.03.02, ASTM 100 Barr Harbor Drive, West Conshohocken, PA 19428.
6. ASTM G1-03, “Standard Practice for Preparing, Cleaning, and Evaluating Corrosion Test
Specimens,” Annual Book of ASTM Standards, Vol.03.02, ASTM 100 Barr Harbor Drive, West Conshohocken, PA 19428.
` 7

Table 1 – ZBD Cooling Tower with Potable Makeup (PMU) and Recycled Makeup (RMU); Control Average Makeup and Tower Water Concentration of Chemistry (COC) Ratios
Automotive Plant Sample / Tests
Soft PMU
Tower PMU
PMU COC
Soft RMU
Tower RMU
RMU COC
TDS, mg/L (Myron L 6P) 350 9000 24 1100 19000 17 pH 7.7 9.8 NA 7.1 9.6 NA Silica, mg/L SiO2 12 250 20 24 280 12 Calcium, mg/L CaCO3 0.1 15 NA 0.2 13 NA Magnesium, mg/L CaCO3 0.1 7 NA 0.1 6 NA Sulfate, mg/L SO4 - - - 127 2030 16 Chloride, mg/L NaCl - - - 214 3640 17 Tot. Alkalinity, mg/L CaCO3 150 3300 22 192 2900 15 Ammonia, mg/L NH4 - - NA 34 0.5 NA Total Phosphate, mg/L PO4 - - - 0.6 9.5 16 TTA, mg/L as tolytriazole - 20 NA NA 25 NA
` 8

Inlet
Outlet
CopperCMAS probe
Carbon steelCMAS probe
Linear polarization probe for general corrosion
Metal coupons
CMAS analyzer
(a)
(b)
Figure 1. The installation of the CMAS and LPR probes in the sampling station and the instruments used in the tests
` 9

0.001
0.01
0.1
1
10
100
13:40 13:50 14:00 14:10Time (hr:min)
Max
Loc
Cor
r Rat
e (m
py)
Figure 2. Short-term localized corrosion rate measured with the copper CMAS probe before the change from traditional chemical treatment. Note: to covert the corrosion rate from mpy to mm/yr, multiply by 0.025.
Figure 3. Maximum localized corrosion rate measured with the copper CMAS probe following the transition from traditional chemical treatment, starting with potable water in late May and later switched to recycled water beginning mid August.
0.001
0.01
0.1
1
10
100
05/08/07 06/07/07 07/07/07 08/06/07 09/05/07 10/05/07 11/04/07Date (Mon/Date/Yr)
Max
Loc
CR
(mpy
)
Original dataMoving average
Moving average
0.3 mpy (7.6 µm/yr)
Traditional Chemistry to Potable Water
Potable Waterto Recycled Water
Overall average in recycled water (0.09 mpy)
Overall average in portable water after stabilized (0.041 mpy)
Copper probe connected
0.3 mpy
CMAS analyzer with dummy probe in air (lower detetion limit)
Copper probe disconnected
Lower detetion limit
` 10
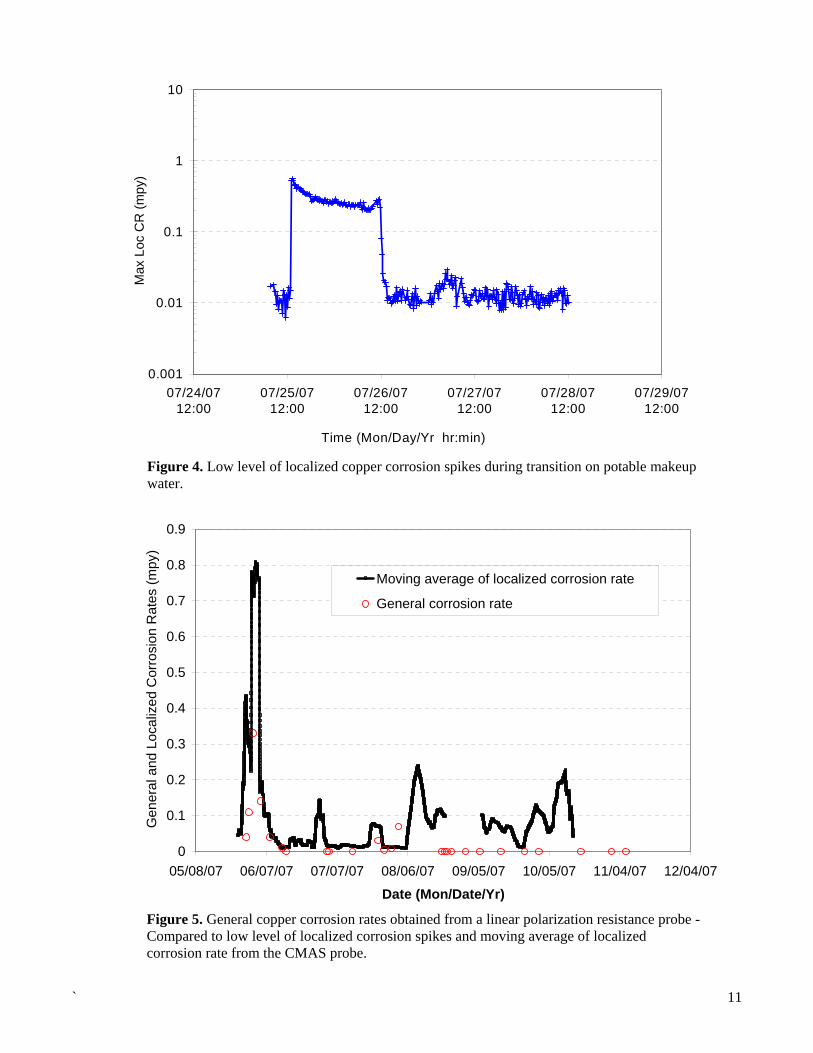
Figure 4. Low level of localized copper corrosion spikes during transition on potable makeup water.
0.001
0.01
0.1
1
10
07/24/0712:00
07/25/0712:00
07/26/0712:00
07/27/0712:00
07/28/0712:00
07/29/0712:00
Time (Mon/Day/Yr hr:min)
Max
Loc
CR
(mpy
)
Figure 5. General copper corrosion rates obtained from a linear polarization resistance probe - Compared to low level of localized corrosion spikes and moving average of localized corrosion rate from the CMAS probe.
0
0.1
0.2
0.3
0.4
0.5
0.6
0.7
0.8
0.9
05/08/07 06/07/07 07/07/07 08/06/07 09/05/07 10/05/07 11/04/07 12/04/07
Date (Mon/Date/Yr)
Gen
eral
and
Loc
aliz
ed C
orro
sion
Rat
es (m
py)
Moving average of localized corrosion rate
General corrosion rate
` 11

Figure 6. Copper coupon, exposed 99 days, for 0.16 mpy corrosion rate.
Figure 7. Chemistry of the tower water during the corrosion monitoring period (TH– total hardness).
0.001
0.01
0.1
1
10
100
1000
10000
100000
05/08/07 06/07/07 07/07/07 08/06/07 09/05/07 10/05/07 11/04/07 12/04/07Date (Mon/Date/Yr)
Con
cent
ratio
ns (p
pm)
7
8
9
10
11
12
13
14
pHTH TDSSiO2 NH3PO4 TTApH
` 12