Local-scale characteristics of high-marsh communities next to developed and undeveloped shorelines...
17
This article was published in the above mentioned Springer issue. The material, including all portions thereof, is protected by copyright; all rights are held exclusively by Springer Science + Business Media. The material is for personal use only; commercial use is not permitted. Unauthorized reproduction, transfer and/or use may be a violation of criminal as well as civil law. ISSN 1015-1621, Volume 72, Number 3
Transcript of Local-scale characteristics of high-marsh communities next to developed and undeveloped shorelines...

This article was published in the above mentioned Springer issue.The material, including all portions thereof, is protected by copyright;all rights are held exclusively by Springer Science + Business Media.
The material is for personal use only;commercial use is not permitted.
Unauthorized reproduction, transfer and/or usemay be a violation of criminal as well as civil law.
ISSN 1015-1621, Volume 72, Number 3

RESEARCH ARTICLE
Local-scale characteristics of high-marsh communities nextto developed and undeveloped shorelines in an ocean-dominatedestuary, Murrells Inlet, SC
Keith Walters • John J. Hutchens Jr. •
Eric T. Koepfler • James O. Luken
Received: 17 July 2009 / Accepted: 22 February 2010 / Published online: 13 March 2010
� Springer Basel AG 2010
Abstract Anthropogenic alteration of terrestrial shore-
lines can have pronounced effects on marine environments
at the upland-marsh boundary. Possible terrestrial devel-
opment effects on several physical and biological variables
of high-marsh habitats were examined along developed and
undeveloped shorelines in an ocean-dominated, southeast-
ern US estuary. Analyses of sediment characteristics
suggested development of the upland boundary affected
physical conditions within the high-marsh. For example,
pore water salinities were greater along undeveloped
shorelines during a non-drought period even after rain
events. Significant floral and faunal differences also existed
between shoreline treatments. Black needle rush stems were
significantly taller and marsh periwinkle densities signifi-
cantly greater, but eastern coffee bean snail densities were
significantly reduced along developed shorelines. Benthic
infaunal community abundance and composition also were
significantly different between shoreline treatments with
sand fly larvae, human pest precursors, either only present
or present in greater densities along developed shorelines.
Sediment respirometry experiments indicated significant
differences in heterotrophic and autotrophic processes
occurring between shoreline treatments. Greater sediment
surface temperatures along developed shorelines provided
one possible mechanism driving high-marsh responses to
boundary alteration. The history and extent of shoreline
development along with a tendency in ocean-dominated
southeastern marshes to resist change likely influenced
current ecological conditions within our high-marsh study
areas. A greater understanding of the driving mechanisms
producing localized effects on salt marshes and recognizing
regional differences in marsh resistance to change will
facilitate predictions of shoreline development conse-
quences and help in proposing effective management
strategies for coastal boundaries.
Keywords Benthic respiration � High-marsh �Insect larvae � Juncus roemerianus �Shoreline development � Wetland boundary
Introduction
The coastal transition zone (CTZ) is a critical environ-
mental boundary or interface between terrestrial/freshwater
and marine systems (e.g., Levin et al. 2001; Talley et al.
2003). Disproportionate to the limited aerial extent glob-
ally, the coastal region including the CTZ provides an
extensive range of necessary human and ecosystem ser-
vices (Costanza et al. 1997). Similar to most boundaries
(Gosz 1992; Wiens et al. 1985; Yarrow and Marın 2007),
the CTZ is defined primarily by abrupt physical gradients
(e.g., salinity) and changes in material flux (e.g., nutrients)
that occur over local, 10s of meters, to landscape scales,
100s of kilometers. For example, in the southeastern USA,
a typical local-scale species gradient from the glycophytic
Morella cerifera (wax myrtle) to the halophytic Spartina
alterniflora (cord grass) is contained within the landscape
scale gradient between the terrestrial watershed and con-
tiguous estuarine environment. Within estuarine river
K. Walters (&) � E. T. Koepfler
Department of Marine Science, Coastal Carolina University,
Conway, SC 29528-6054, USA
e-mail: [email protected]
J. J. Hutchens Jr. � J. O. Luken
Department of Biology, Coastal Carolina University, Conway,
SC 29528-6054, USA
Aquat. Sci. (2010) 72:309–324
DOI 10.1007/s00027-010-0137-8 Aquatic Sciences Author's personal copy
systems, faunal compositions are dependent on changes in
two opposing gradients, one from freshwater to marine and
the other from marine to freshwater (Attrill and Rundle
2002), which produce a dynamic boundary within estuaries
that moves up- and down-stream with changes in climate.
Increasingly, both natural and anthropogenic boundaries
are recognized as profoundly influencing ecosystem
dynamics (e.g., Cadenasso et al. 2003; Ries et al. 2004).
Both the alteration of natural boundaries (e.g., removal of
native vegetation) and creation of anthropogenic bound-
aries (e.g., highways, seawalls) are dependent on human
activities. Worldwide, coastal environments are being
transformed into human-dominated habitats creating and
altering boundaries at an increasing rate (Beach 2002). In
the USA [50% of the population lives or works within
coastal counties (Vernberg et al. 1992), and future popu-
lation growth along the South Atlantic Bight (e.g., North
Carolina, South Carolina and Georgia) is expected to
exceed that of all other regions (Bricker et al. 1999). The
anticipated population-driven development and resultant
changes to terrestrial-marine boundaries could significantly
affect one of the region’s most ecologically and economi-
cally important habitats, the estuarine salt marsh.
Previous research along the eastern USA coast typically
has examined the effects of landscape-scale terrestrial
development within associated tidal creeks and bays.
Nutrient (Mallin et al. 2000a; Valiela and Bowen 2002;
Lewitus et al. 2004; White et al. 2008), fecal coliform
(Mallin et al. 2000b; DiDonato et al. 2009), and phyto-
plankton changes in water quality (White et al. 2004) all
have been attributed to watershed development. Differ-
ences in tidal creek sediment characteristics (Sanger et al.
1999a, b; Van Dolah et al. 2008) and benthic faunal
communities (Lerberg et al. 2000; Bilkovic et al. 2006)
also have been correlated to landscape-scale change
resulting from suburban, urban and industrial alterations of
coastal watersheds. Although less studied, local develop-
ment of the terrestrial-marine boundary also can affect
adjacent marine habitats (Wigand et al. 2001; Bertness
et al. 2002; Pennings et al. 2002; Silliman and Bertness
2004; Bertness and Silliman 2008; Gedan et al. 2009;
Wigand et al. 2010). In the rapidly developing Southeast-
ern USA coastal region, both unknown local- and well-
studied landscape-scale changes (e.g., Lerberg et al. 2000;
Holland et al. 2004; Lewitus et al. 2004) are likely to have
major affects on the terrestrial-marine boundary and adja-
cent marsh habitats.
Direct, local-scale development of the terrestrial-mar-
ine boundary may affect a variety of high marsh physical
and biological characteristics. Removal of natural vege-
tation as a result of shoreline stabilization, suburban
landscaping, or other development could alter thermal
regimes, surface and below-ground water movements,
nutrient and organic inputs, and other factors that con-
tribute to the flux between terrestrial and marine
environments. Small scale horizontal differences in high-
marsh temperatures resulting from alterations to the
thermal environment, such as changes in shading, can
influence heat stress levels experienced by intertidal
organisms (Jost and Helmuth 2007). Altered anthropo-
genic nutrient inputs can affect salt marsh plant
productivity and benthic microbial activity (Morris 1991;
Kiehl et al. 1997; Levine et al. 1998; Morris and Bradley
1999; Van Wijnen and Bakker 1999; Sundareshwar et al.
2003; Hines et al. 2006; Deegan et al. 2007). Nutrient
additions also can alter typical patterns of plant zonation
and modify normal competitive interactions and com-
munity structure (Levine et al. 1998; Emery et al. 2001;
Bertness et al. 2002; Pennings et al. 2005; Crain 2007;
McFarlin et al. 2008; but also see Brewer 2003). Even
the community structure of marsh fauna may be influ-
enced by elevated nutrient inputs (Vince et al. 1981;
Stiven and Kuenzler 1982; Silliman and Zieman 2001;
Denno et al. 2003; but also see Meany et al. 1976).
Anticipated differences in freshwater flux during pre-
cipitation events (e.g., Corbett et al. 1997; Wahl et al.
1997) may result in changes in sediment pore-water
salinities that affect plant production (Mendelssohn and
Morris 2000) and community structure (Pennings and
Callaway 1992). Separate from the landscape-scale
effects of watershed development, alteration of the ter-
restrial-marine boundary likely will have major
consequences for the dynamics of high-marsh
environments.
This paper focuses on identifying the physical (e.g.,
sediment organic content, pore water salinity, surface
temperature) and biological parameters (e.g., plant biomass
and richness, macrofauna density and composition, benthic
respiration) of a typical southeastern USA high-marsh
community that may be affected by development of the
associated terrestrial shoreline. Landscape-scale effects are
factored out by stratifying selection of developed and
undeveloped shorelines within a single marine-dominated
estuary surrounded by a watershed of limited aerial extent.
Development effects on the high-marsh associated with
both barrier land spits and mainland areas were measured.
Shoreline development was expected to increase the flux of
freshwater and nutrients as in previous studies (Wahl et al.
1997; Bertness et al. 2002; Silliman and Bertness 2004),
which would lead to increased autotrophic and heterotro-
phic production and potentially alter floral and faunal
community structure. Results provide the first extensive
study of local-scale terrestrial development effects on the
high-marsh environment in a region experiencing rapid
population growth and increasing terrestrial-marine
boundary alteration.
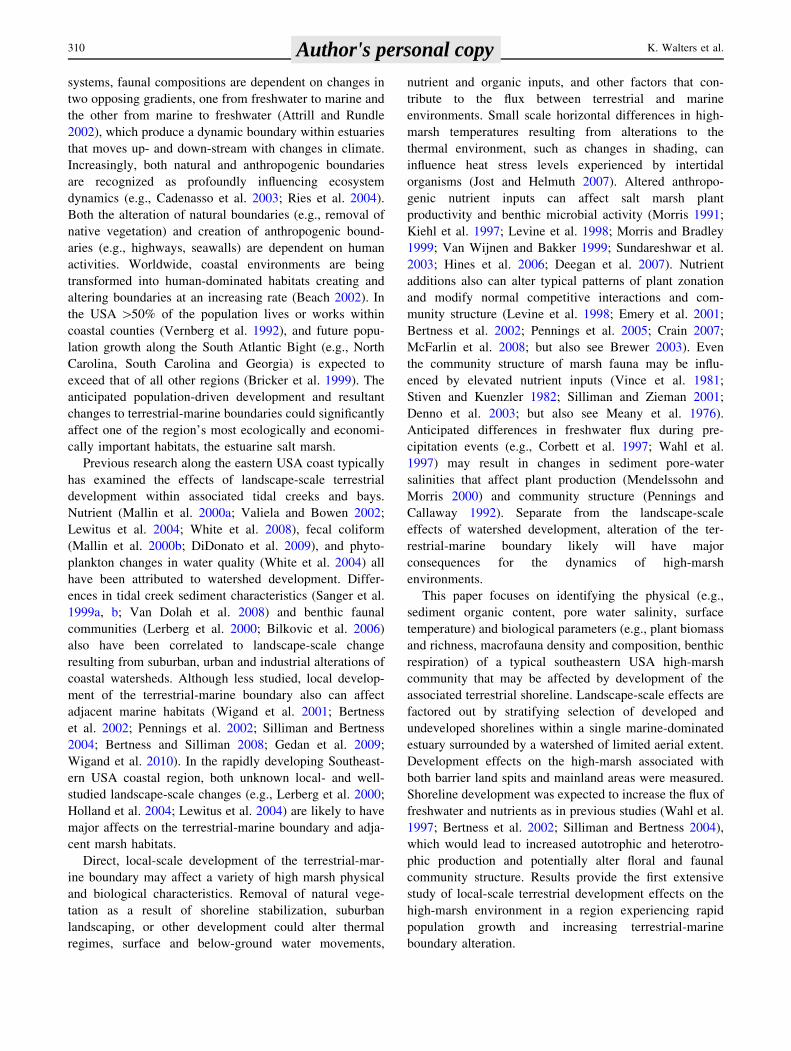
310 K. Walters et al. Author's personal copy
Methods
Study area
The study was conducted within the ocean-dominated
estuary of Murrells Inlet, South Carolina (33:32.70 N,
79:2.7 W) where salinities average [ 30 ppt (Blood and
Vernberg 1991). Within the inlet, approximately equal
semidiurnal tides, mean 1.37 m, vary in timing, ca.
30 min delay, but not height of high tide from north to
south. Freshwater input is restricted to a relatively small,
local watershed (ca. 35.5 km2) without major riverine
influence. Mainland drainage into the estuary can be
divided into eight sub-basins, some of which are emptied
by small creeklets (Tufford et al. 2003). The estuary
covers ca. 26.7 km2 between the barrier land spits and
mainland, almost half of which is salt marsh. A primary
inlet stabilized by the construction of two weir jetties in
1977 splits the estuary roughly in half. The cities of
Murrells Inlet and Garden City are located on the estuary
and have a combined population of 14,876 individuals
(2000 USA census). Murrells Inlet housing density in
2000 was 165.8 units km-2. Surrounding Georgetown
and Horry County populations have increased by up to
36.5% between 1990 and 2000 (1990 and 2000 USA
census). Huntington Beach State Park, an 1,100 ha
undeveloped area, forms the southern boundary of the
inlet.
Regional rainfall averages 138.4 cm year-1 with
115 days year-1 of precipitation, but surrounding counties
experienced intermittent drought conditions throughout the
study period. The South Carolina Department of Natural
Resources, Land, Water, and Conservation Division, State
Climate Office declared statewide severe to extreme
drought conditions ended in April 2003, 2 months prior to
the study’s start. Incipient drought conditions were
declared for Georgetown and Horry counties in June 2004
and downgraded to normal in July 2004. Reduced rainfall
amounts from 12 to 25 cm below normal between Sep-
tember and November 2004, encompassing the study’s last
sampling dates, prompted a November 2004 advisory but
no declaration of drought conditions. Average daily tem-
peratures range from a low of 2.3�C in January to a high of
32.4�C in July.
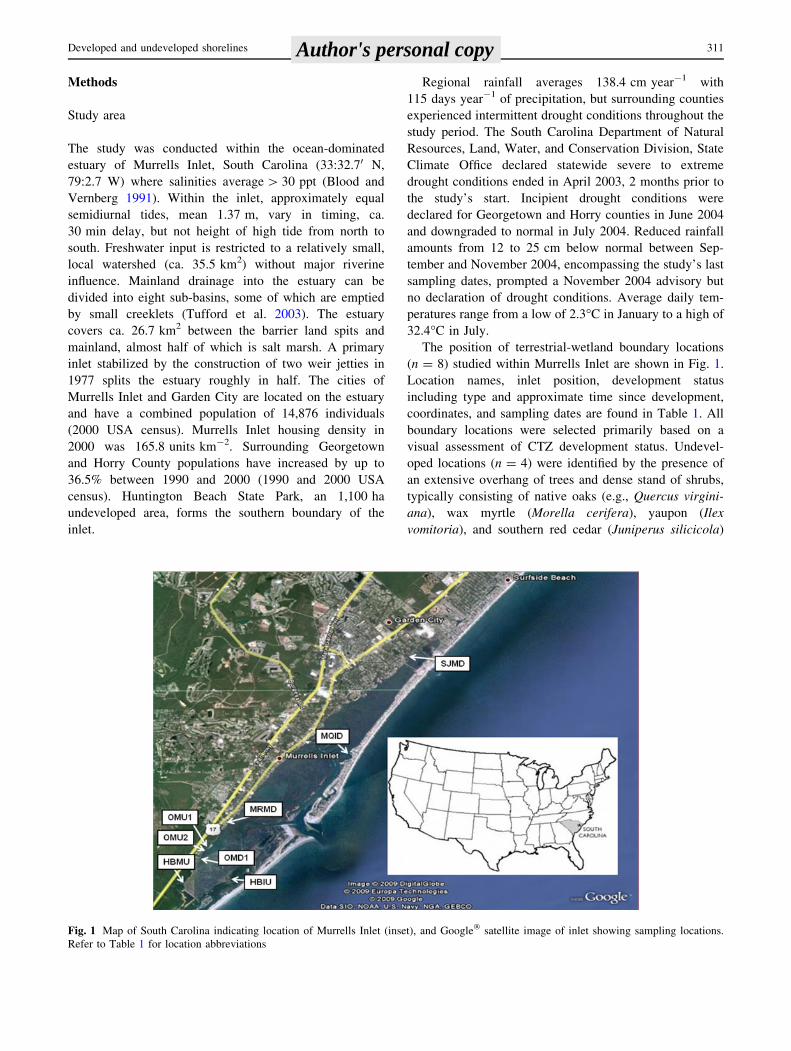
The position of terrestrial-wetland boundary locations
(n = 8) studied within Murrells Inlet are shown in Fig. 1.
Location names, inlet position, development status
including type and approximate time since development,
coordinates, and sampling dates are found in Table 1. All
boundary locations were selected primarily based on a
visual assessment of CTZ development status. Undevel-
oped locations (n = 4) were identified by the presence of
an extensive overhang of trees and dense stand of shrubs,
typically consisting of native oaks (e.g., Quercus virgini-
ana), wax myrtle (Morella cerifera), yaupon (Ilex
vomitoria), and southern red cedar (Juniperus silicicola)
Fig. 1 Map of South Carolina indicating location of Murrells Inlet (inset), and Google� satellite image of inlet showing sampling locations.
Refer to Table 1 for location abbreviations
Developed and undeveloped shorelines 311 Author's personal copy
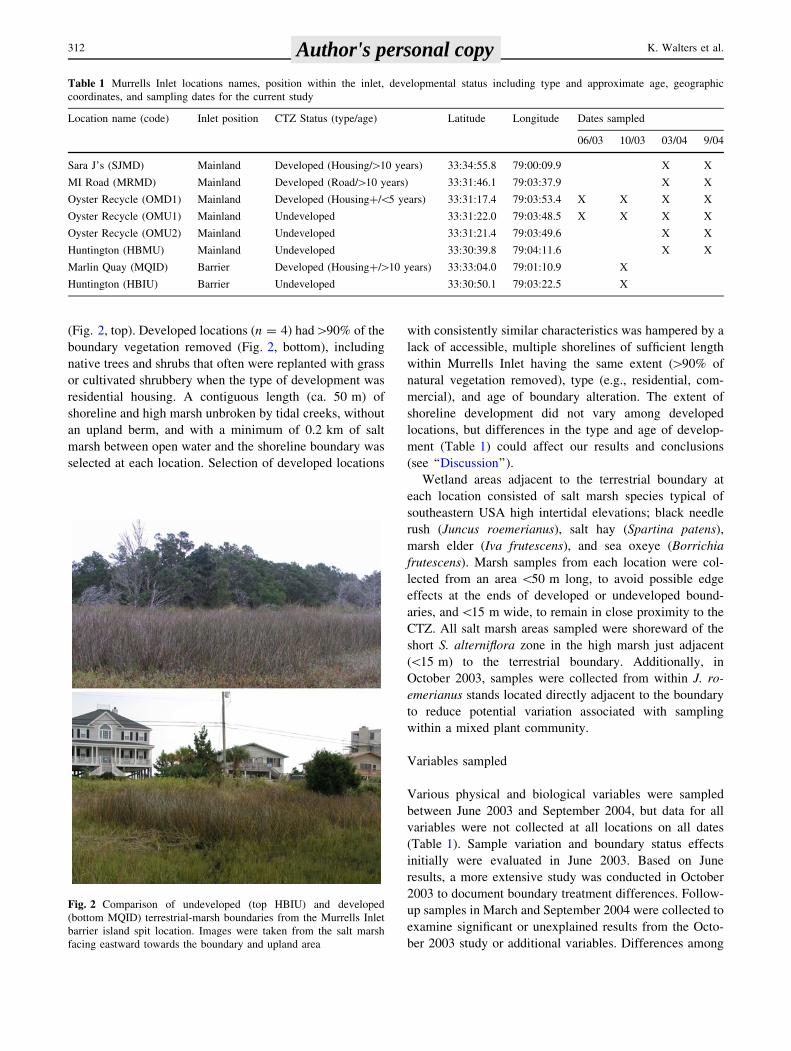
(Fig. 2, top). Developed locations (n = 4) had[90% of the
boundary vegetation removed (Fig. 2, bottom), including
native trees and shrubs that often were replanted with grass
or cultivated shrubbery when the type of development was
residential housing. A contiguous length (ca. 50 m) of
shoreline and high marsh unbroken by tidal creeks, without
an upland berm, and with a minimum of 0.2 km of salt
marsh between open water and the shoreline boundary was
selected at each location. Selection of developed locations
with consistently similar characteristics was hampered by a
lack of accessible, multiple shorelines of sufficient length
within Murrells Inlet having the same extent ([90% of
natural vegetation removed), type (e.g., residential, com-
mercial), and age of boundary alteration. The extent of
shoreline development did not vary among developed
locations, but differences in the type and age of develop-
ment (Table 1) could affect our results and conclusions
(see ‘‘Discussion’’).
Wetland areas adjacent to the terrestrial boundary at
each location consisted of salt marsh species typical of
southeastern USA high intertidal elevations; black needle
rush (Juncus roemerianus), salt hay (Spartina patens),
marsh elder (Iva frutescens), and sea oxeye (Borrichia
frutescens). Marsh samples from each location were col-
lected from an area \50 m long, to avoid possible edge
effects at the ends of developed or undeveloped bound-
aries, and\15 m wide, to remain in close proximity to the
CTZ. All salt marsh areas sampled were shoreward of the
short S. alterniflora zone in the high marsh just adjacent
(\15 m) to the terrestrial boundary. Additionally, in
October 2003, samples were collected from within J. ro-
emerianus stands located directly adjacent to the boundary
to reduce potential variation associated with sampling
within a mixed plant community.
Variables sampled
Various physical and biological variables were sampled
between June 2003 and September 2004, but data for all
variables were not collected at all locations on all dates
(Table 1). Sample variation and boundary status effects
initially were evaluated in June 2003. Based on June
results, a more extensive study was conducted in October
2003 to document boundary treatment differences. Follow-
up samples in March and September 2004 were collected to
examine significant or unexplained results from the Octo-
ber 2003 study or additional variables. Differences among
Table 1 Murrells Inlet locations names, position within the inlet, developmental status including type and approximate age, geographic
coordinates, and sampling dates for the current study
Location name (code) Inlet position CTZ Status (type/age) Latitude Longitude Dates sampled
06/03 10/03 03/04 9/04
Sara J’s (SJMD) Mainland Developed (Housing/[10 years) 33:34:55.8 79:00:09.9 X X
MI Road (MRMD) Mainland Developed (Road/[10 years) 33:31:46.1 79:03:37.9 X X
Oyster Recycle (OMD1) Mainland Developed (Housing?/\5 years) 33:31:17.4 79:03:53.4 X X X X
Oyster Recycle (OMU1) Mainland Undeveloped 33:31:22.0 79:03:48.5 X X X X
Oyster Recycle (OMU2) Mainland Undeveloped 33:31:21.4 79:03:49.6 X X
Huntington (HBMU) Mainland Undeveloped 33:30:39.8 79:04:11.6 X X
Marlin Quay (MQID) Barrier Developed (Housing?/[10 years) 33:33:04.0 79:01:10.9 X
Huntington (HBIU) Barrier Undeveloped 33:30:50.1 79:03:22.5 X
Fig. 2 Comparison of undeveloped (top HBIU) and developed
(bottom MQID) terrestrial-marsh boundaries from the Murrells Inlet
barrier island spit location. Images were taken from the salt marsh
facing eastward towards the boundary and upland area
312 K. Walters et al. Author's personal copy
dates likely affected the variables sampled but not the
proportional effects of boundary development on the
variables. Only data from individual sampling dates were
analyzed statistically to minimize any potential to con-
found date with boundary development effects (see
‘‘Analyses’’).
Up to five plots (0.25 m2) were positioned haphazardly
within the ca. 50 by 15 m sampling area at each developed
and undeveloped boundary location. All snails, exclusively
Littoraria irrorata and Melampus bidentatus, were col-
lected and a haphazard subsample of stem heights (n = 20)
was measured from each plot. Live and standing-dead plant
stem densities were enumerated from one 0.0625 m2 sub-
plot within each plot. Plant biomass was determined by
removing all above-ground material from each sub-plot,
determining dry mass (60�C for 4 days), and calculating
ash-free dry mass (AFDM) after loss from ignition (450�C
for [4 h). Within the same high-marsh elevation, sedi-
ments were sampled (n = 5) using a 2.1 cm diameter corer
to a depth of 5 cm. Individual cores, either whole or
divided into 0–2 and 2–5 cm sections (June 2003 only),
immediately were frozen at -20�C for later determination
of pore water salinity and sediment grain size and organic
content. Pore water salinity (ppt) was measured both in the
lab and field. Salinities in the lab were calculated by adding
20–30 ml of distilled water to a thawed sediment sample,
repeatedly agitating over 48 h, allowing the sediment to
settle, measuring the supernatant salinity with a refrac-
tometer, and correcting for dilution. Field salinities were
measured using an YSI 85 salinometer within 2–3 surface
wells dug to a depth of 30 cm at each site. Sediment grain
sizes were determined by measuring the dry mass of wet-
sieved standard soil size fractions. The sediment organic
content or AFDM (mg g-1) was calculated as the differ-
ence between sediments dried at 60�C and then ashed at
450�C for [4 h. An additional five sediment cores were
collected using a 2.1 cm diameter corer to a depth of 5 cm
to identify benthic infauna. Core samples were preserved
with 10% formaldehyde, processed on a 500-lm sieve in
the lab, and all organisms identified to major taxon and
enumerated.
Sediment samples for benthic respiration incubations
were collected in a 10.2 cm diameter acrylic corer to a
depth of 3 cm. Only at the barrier island location, three
sites 0.0625 m2 in area were selected haphazardly within
developed and undeveloped locations. At each site, three
sediment cores were collected and mixed mechanically,
any root or rhizome material removed, and dispensed into
250-ml acid-washed Pyrex glass bottles. Sediments were
slurried with the addition of 30% by volume of either
0.45 lm filtered seawater (control), filtered seawater with
20 lM nitrogen as ammonium sulphate and 1.25 lM
phosphorus as sodium diphosphate, or filtered seawater
with 200 lM glucose. Samples were placed within a Per-
cival climate controlled chamber at 28�C and incubated
under either light or dark conditions. Benthic respiration
measurements were collected multiple times (n = 4) dur-
ing the 3 h incubation using a Columbus Instruments 30
channel respirometer.
Sediment surface temperatures were determined during
a 2-week period in September 2004 using HOBO� and
Stowaway Tidbit� temperature loggers. Loggers were
placed above the highest high tide level on the terrestrial
side of the boundary at Murrells Inlet mainland locations
(Table 1). Sites where loggers were located differed mainly
in the presence or absence of vegetation [1.5 m in height.
Analyses
Data from our initial June 2003 samples were used to
conduct a prospective or a priori power analysis using
G*Power v3.0 (Faul et al. 2007). Mean differences and
variation between developed and undeveloped locations for
each variable measured were used to calculate initial effect
sizes and estimate appropriate sample sizes to detect sig-
nificant shoreline treatment effects. Sample sizes were
estimated for 2-tailed tests with an error probability or
a = 0.05, power or 1 - b = 0.80, and based on the cal-
culated effect sizes from the June samples. Future sample
sizes and approaches were adjusted based on the results of
power analyses and a qualitative assessment of collection
and processing costs.
Sediment grain size distributions were analyzed sepa-
rately for each inlet side using the Kolmogorov–Smirnov
Z-test for two independent samples. Sediment pore water
salinity and organic content, plant density, height and
biomass, snail and benthic infaunal abundance, and benthic
respiration rate data all were analyzed using parametric
ANOVA models including blocked one-way, nested and
two-way analyses. Data were transformed when necessary
to satisfy critical assumptions of the ANOVA models. Inlet
side (barrier, mainland) in October 2003 and sample dates
without rain in March 2004 (see Table 1) were treated as
block effects, except for the analysis of benthic respiration
which was conducted only at the barrier location. Signifi-
cant differences between undeveloped barrier and
mainland locations, given the range of potential differences
between inlet sides (e.g., groundwater discharge, soil
properties), and between dates without major rainfall
events were anticipated, but inlet side or date differences
were not the focus of the current study. Our primary factor
of interest was shoreline development.
Differences in the taxonomic composition of benthic
infauna were analyzed using PERMANOVA, permuta-
tional multivariate analysis of variance (Anderson 2005).
The PERMANOVA program provides an ANOVA-like
Developed and undeveloped shorelines 313 Author's personal copy
test based on P values generated from permutations of a
distance matrix derived from the original species by sample
data (Anderson 2001, 2005; McArdle and Anderson 2001).
Barrier and mainland location compositional differences
were analyzed separately, abundance data were 4th root
transformed, and distances were based on Bray-Curtis
dissimilarity measures (Anderson 2005).
Results
Prospective power analyses for June 2003 initial data
indicated that detectable effect sizes ranged between 0.5 or
medium and 0.8 or large (see Cohen 1988), but the total
samples required to detect differences at a 0.05 significance
level with 80% power often were large (Table 2). In a
number of instances (e.g., L. irrorata, 3–5 mm AFDM and
pore water) the large effect sizes were detectable with
relatively few samples (Table 2). Based on initial results,
we decided to increase sample sizes where possible to
guarantee a minimum of five samples per location for each
measurement variable, to increase the number of locations
(n = 2–3), and to combine 0–2 and 2–5 cm sediment depth
data into a single sample in an effort to reduce among
sample variability and increase the ability to detect rea-
sonable effect size differences between shoreline
treatments.
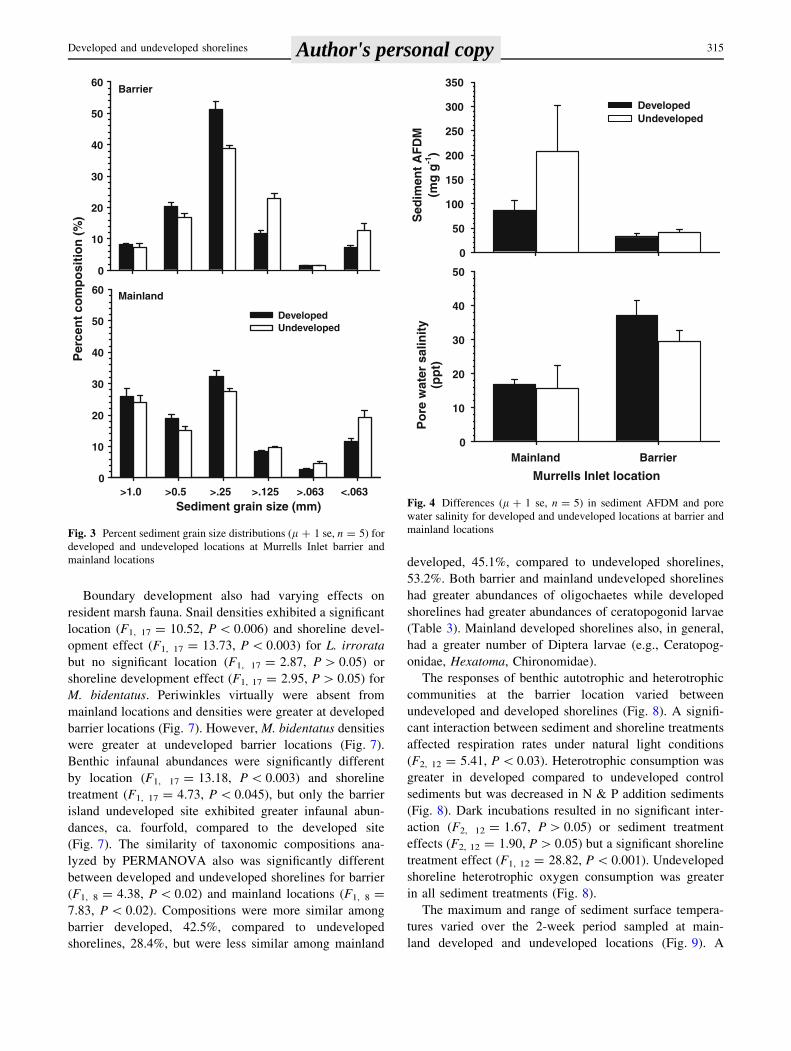
Analyses of sediment characteristics in October 2003
provided suggestive evidence for the effects of boundary
development. No significant difference in sediment particle
size distributions (Fig. 3) existed between developed and
undeveloped locations for either barrier (Z = 0.577,
P [ 0.05) or mainland locations (Z = 0.289, P [ 0.05).
Except for the occasional size-class disparity (e.g.,
[0.125 mm), differences in developed and undeveloped
sediment grain size fractions were similar between barrier
and mainland locations (Fig. 3). Sediment AFDM exhib-
ited significant block (location) effects (F1, 17 = 5.03,
P \ 0.04) but not a significant shoreline development
effect (F1, 17 = 1.67, P [ 0.05). Mainland compared to
barrier sediments contained greater amounts of organic
matter, but among sample variation limited detection of a
significant development effect on sediment AFDM
(Fig. 4). Sediment pore water salinities in October 2003
also exhibited a significant block or location effect
(F1, 16 = 14.83, P \ 0.005) but not a significant shoreline
development effect (F1, 16 = 0.87, P [ 0.05). Barrier
sediment salinities were two times mainland values, but no
consistent difference between developed and undeveloped
locations was identified (Fig. 4). In situ comparison of
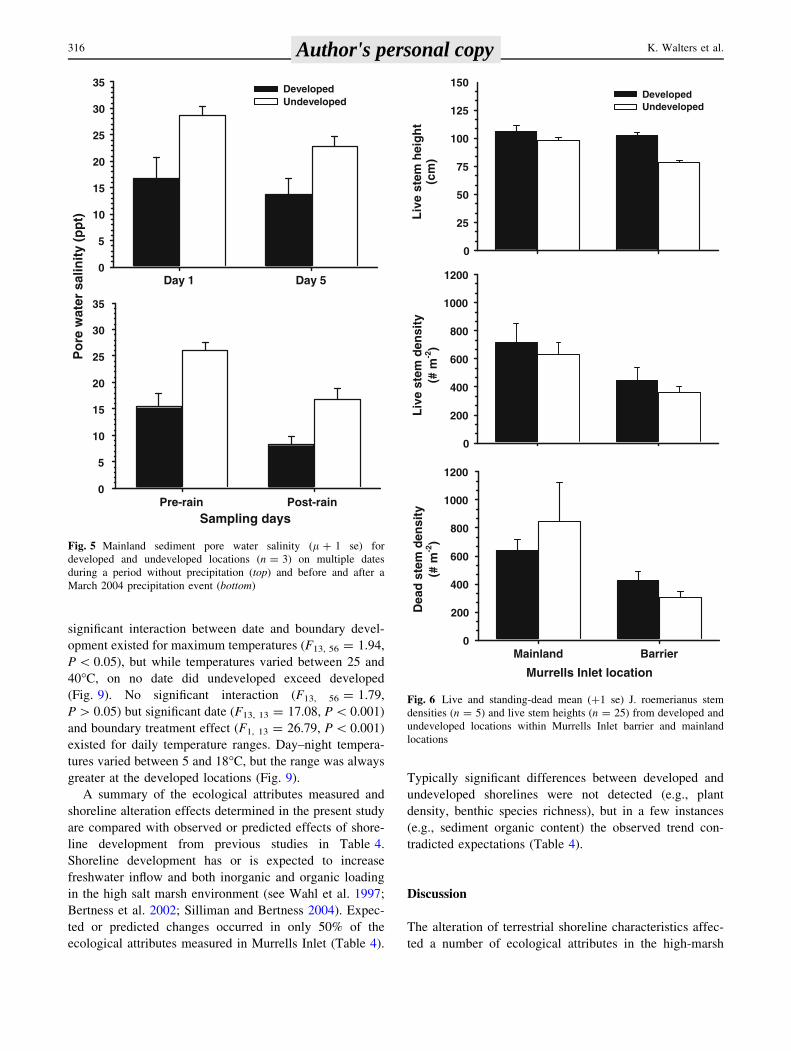
mainland pore water salinities in March 2004 on two dates
5 days apart after 7? days without rain resulted in a
marginally significant date block effect (F1, 20 = 4.10,
P \ 0.057), no significant shoreline development effect
(F1, 4 = 4.84, P [ 0.05) but a significant site effect
(F4, 20 = 4.61, P \ 0.009). Although unable to detect
significant differences, undeveloped location salinities
were ca. two times that of developed locations (Fig. 5).
Comparison of salinity before and after a 0.64–1.3 cm
rain event in March 2004 resulted in nonsignificant
development (F1, 2 = 3.89, P [ 0.05), rain (F1, 2 = 5.17,
P [ 0.05) or interaction effects (F1, 2 = 0.05, P [ 0.05).
However, among site effects again were significant
(F2, 35 = 4.83, P \ 0.03). The rainfall event did not affect
pore water salinities significantly, but undeveloped loca-
tions consistently had greater pore water salinities before
and after the rain event (Fig. 5).
Characteristics of the predominant high-marsh plant at
all locations, J. roemerianus, generally did not exhibit the
effects of shoreline development. Live and dead stem
densities were not significantly different between locations
(F1, 17 = 7.34, P [ 0.05 and F1, 17 = 8.96, P [ 0.05,
respectively) or between shoreline treatments (F1, 17 =
0.35, P [ 0.05 and F1, 17 = 0.48, P [ 0.05, respectively).
Live stems tended to be more abundant at all developed
locations, but dead stems were more numerous at mainland
undeveloped locations (Fig. 6). Stem AFDM also was not
significantly different between locations (F1, 17 = 0.34,
P [ 0.05) or shoreline treatments (F1, 17 = 0.03, P [0.05). However, stem heights were significantly different
between locations (F2, 388 = 1,765.15, P \ 0.001) and
shoreline treatments (F1, 8 = 6.95, P \ 0.04). Stem heights
were greater at both mainland and barrier developed
locations (Fig. 6).
Table 2 Calculations of effect sizes based on a prospective (a priori)
power analyses for mainland developed (OMD1) and undeveloped
locations (OMU1) sampled in June 2003 using G*Power v3.0
Variable Mean SD n Effect
size (d)
Total
samplesD U D U D U
Juncus density (m-2)
Live stems 499 624 286 149 5 5 0.574 26
Dead stems 294 416 309 323 5 5 0.384 56
Snail density (m-2)
L. irrorata 31 4 26 4 5 3 1.814 5
M. bidentatus 98 65 97 32 5 3 0.500 34
Sediment AFDM (mg g-1)
0–2 cm 183.7 121.3 166.9 70.5 3 3 0.545 32
3–5 cm 164.1 69.1 147.3 21.2 3 3 1.127 9
Pore water (%)
0–2 cm 46.9 43.9 20.4 12.2 3 3 0.182 234
3–5 cm 47.1 35.0 19.6 5.8 3 3 0.952 11
Total samples needed to detect the effect size were calculated for
a = 0.05 and 1 - b = 0.80. D developed, U undeveloped
314 K. Walters et al. Author's personal copy
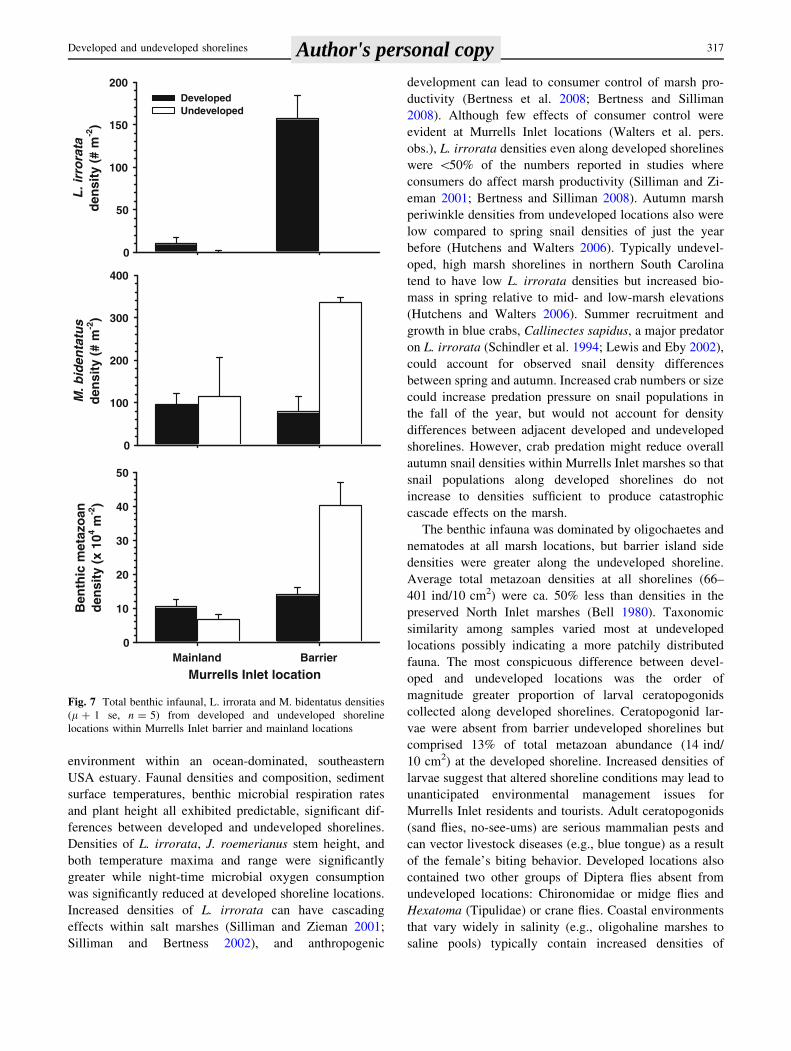
Boundary development also had varying effects on
resident marsh fauna. Snail densities exhibited a significant
location (F1, 17 = 10.52, P \ 0.006) and shoreline devel-
opment effect (F1, 17 = 13.73, P \ 0.003) for L. irrorata
but no significant location (F1, 17 = 2.87, P [ 0.05) or
shoreline development effect (F1, 17 = 2.95, P [ 0.05) for
M. bidentatus. Periwinkles virtually were absent from
mainland locations and densities were greater at developed
barrier locations (Fig. 7). However, M. bidentatus densities
were greater at undeveloped barrier locations (Fig. 7).
Benthic infaunal abundances were significantly different
by location (F1, 17 = 13.18, P \ 0.003) and shoreline
treatment (F1, 17 = 4.73, P \ 0.045), but only the barrier
island undeveloped site exhibited greater infaunal abun-
dances, ca. fourfold, compared to the developed site
(Fig. 7). The similarity of taxonomic compositions ana-
lyzed by PERMANOVA also was significantly different
between developed and undeveloped shorelines for barrier
(F1, 8 = 4.38, P \ 0.02) and mainland locations (F1, 8 =
7.83, P \ 0.02). Compositions were more similar among
barrier developed, 42.5%, compared to undeveloped
shorelines, 28.4%, but were less similar among mainland
developed, 45.1%, compared to undeveloped shorelines,
53.2%. Both barrier and mainland undeveloped shorelines
had greater abundances of oligochaetes while developed
shorelines had greater abundances of ceratopogonid larvae
(Table 3). Mainland developed shorelines also, in general,
had a greater number of Diptera larvae (e.g., Ceratopog-
onidae, Hexatoma, Chironomidae).
The responses of benthic autotrophic and heterotrophic
communities at the barrier location varied between
undeveloped and developed shorelines (Fig. 8). A signifi-
cant interaction between sediment and shoreline treatments
affected respiration rates under natural light conditions
(F2, 12 = 5.41, P \ 0.03). Heterotrophic consumption was
greater in developed compared to undeveloped control
sediments but was decreased in N & P addition sediments
(Fig. 8). Dark incubations resulted in no significant inter-
action (F2, 12 = 1.67, P [ 0.05) or sediment treatment
effects (F2, 12 = 1.90, P [ 0.05) but a significant shoreline
treatment effect (F1, 12 = 28.82, P \ 0.001). Undeveloped
shoreline heterotrophic oxygen consumption was greater
in all sediment treatments (Fig. 8).
The maximum and range of sediment surface tempera-
tures varied over the 2-week period sampled at main-
land developed and undeveloped locations (Fig. 9). A
Per
cen
t co
mp
osi
tio
n (
%)
0
10
20
30
40
50
60
Sediment grain size (mm)>1.0 >0.5 >.25 >.125 >.063 <.063
0
10
20
30
40
50
60
DevelopedUndeveloped
Mainland
Barrier
Fig. 3 Percent sediment grain size distributions (l ? 1 se, n = 5) for
developed and undeveloped locations at Murrells Inlet barrier and
mainland locations
Sed
imen
t A
FD
M(m
g g
-1)
0
50
100
150
200
250
300
350
Murrells Inlet location
Mainland Barrier
Po
re w
ater
sal
init
y(p
pt)
0
10
20
30
40
50
DevelopedUndeveloped
Fig. 4 Differences (l ? 1 se, n = 5) in sediment AFDM and pore
water salinity for developed and undeveloped locations at barrier and
mainland locations
Developed and undeveloped shorelines 315 Author's personal copy
significant interaction between date and boundary devel-
opment existed for maximum temperatures (F13, 56 = 1.94,
P \ 0.05), but while temperatures varied between 25 and
40�C, on no date did undeveloped exceed developed
(Fig. 9). No significant interaction (F13, 56 = 1.79,
P [ 0.05) but significant date (F13, 13 = 17.08, P \ 0.001)
and boundary treatment effect (F1, 13 = 26.79, P \ 0.001)
existed for daily temperature ranges. Day–night tempera-
tures varied between 5 and 18�C, but the range was always
greater at the developed locations (Fig. 9).
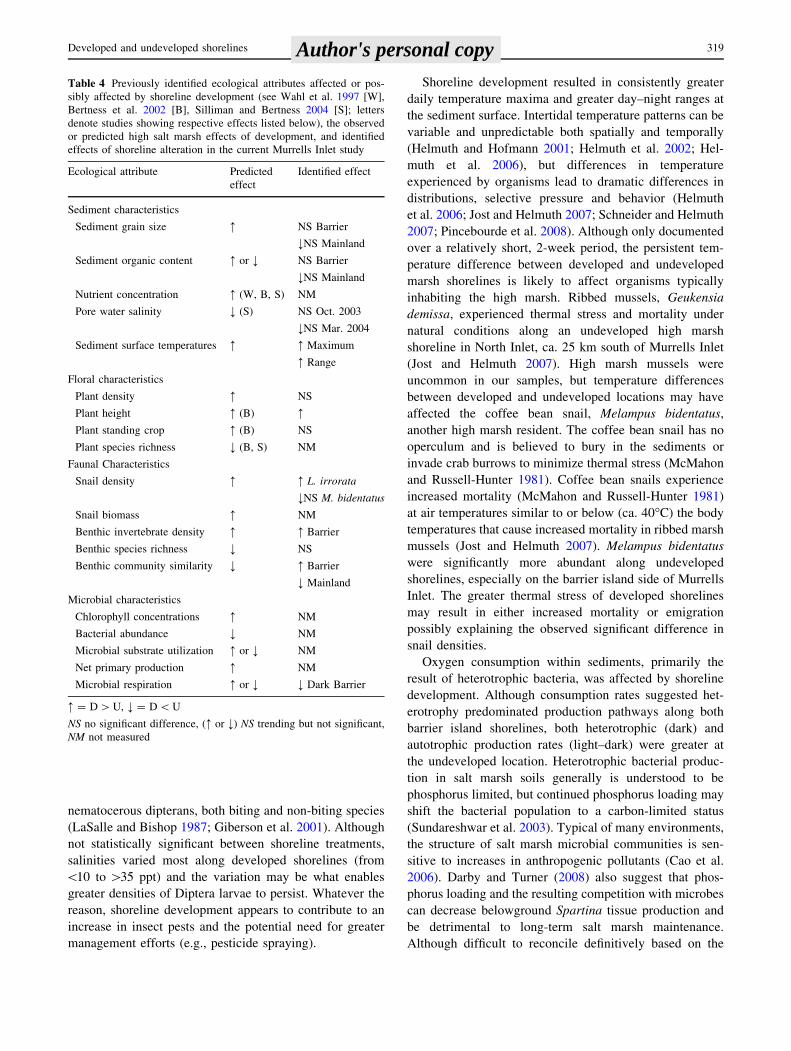
A summary of the ecological attributes measured and
shoreline alteration effects determined in the present study
are compared with observed or predicted effects of shore-
line development from previous studies in Table 4.
Shoreline development has or is expected to increase
freshwater inflow and both inorganic and organic loading
in the high salt marsh environment (see Wahl et al. 1997;
Bertness et al. 2002; Silliman and Bertness 2004). Expec-
ted or predicted changes occurred in only 50% of the
ecological attributes measured in Murrells Inlet (Table 4).
Typically significant differences between developed and
undeveloped shorelines were not detected (e.g., plant
density, benthic species richness), but in a few instances
(e.g., sediment organic content) the observed trend con-
tradicted expectations (Table 4).
Discussion
The alteration of terrestrial shoreline characteristics affec-
ted a number of ecological attributes in the high-marsh
Day 1 Day 50
5
10
15
20
25
30
35
Sampling daysPre-rain Post-rain
Po
re w
ater
sal
init
y (p
pt)
0
5
10
15
20
25
30
35
DevelopedUndeveloped
Fig. 5 Mainland sediment pore water salinity (l ? 1 se) for
developed and undeveloped locations (n = 3) on multiple dates
during a period without precipitation (top) and before and after a
March 2004 precipitation event (bottom)
Murrells Inlet location
Mainland Barrier
Dea
d s
tem
den
sity
(# m
-2)
0
200
400
600
800
1000
1200
Liv
e st
em d
ensi
ty(#
m-2
)0
200
400
600
800
1000
1200
Liv
e st
em h
eig
ht
(cm
)
0
25
50
75
100
125
150DevelopedUndeveloped
Fig. 6 Live and standing-dead mean (?1 se) J. roemerianus stem
densities (n = 5) and live stem heights (n = 25) from developed and
undeveloped locations within Murrells Inlet barrier and mainland
locations
316 K. Walters et al. Author's personal copy
environment within an ocean-dominated, southeastern
USA estuary. Faunal densities and composition, sediment
surface temperatures, benthic microbial respiration rates
and plant height all exhibited predictable, significant dif-
ferences between developed and undeveloped shorelines.
Densities of L. irrorata, J. roemerianus stem height, and
both temperature maxima and range were significantly
greater while night-time microbial oxygen consumption
was significantly reduced at developed shoreline locations.
Increased densities of L. irrorata can have cascading
effects within salt marshes (Silliman and Zieman 2001;
Silliman and Bertness 2002), and anthropogenic
development can lead to consumer control of marsh pro-
ductivity (Bertness et al. 2008; Bertness and Silliman
2008). Although few effects of consumer control were
evident at Murrells Inlet locations (Walters et al. pers.
obs.), L. irrorata densities even along developed shorelines
were \50% of the numbers reported in studies where
consumers do affect marsh productivity (Silliman and Zi-
eman 2001; Bertness and Silliman 2008). Autumn marsh
periwinkle densities from undeveloped locations also were
low compared to spring snail densities of just the year
before (Hutchens and Walters 2006). Typically undevel-
oped, high marsh shorelines in northern South Carolina
tend to have low L. irrorata densities but increased bio-
mass in spring relative to mid- and low-marsh elevations
(Hutchens and Walters 2006). Summer recruitment and
growth in blue crabs, Callinectes sapidus, a major predator
on L. irrorata (Schindler et al. 1994; Lewis and Eby 2002),
could account for observed snail density differences
between spring and autumn. Increased crab numbers or size
could increase predation pressure on snail populations in
the fall of the year, but would not account for density
differences between adjacent developed and undeveloped
shorelines. However, crab predation might reduce overall
autumn snail densities within Murrells Inlet marshes so that
snail populations along developed shorelines do not
increase to densities sufficient to produce catastrophic
cascade effects on the marsh.
The benthic infauna was dominated by oligochaetes and
nematodes at all marsh locations, but barrier island side
densities were greater along the undeveloped shoreline.
Average total metazoan densities at all shorelines (66–
401 ind/10 cm2) were ca. 50% less than densities in the
preserved North Inlet marshes (Bell 1980). Taxonomic
similarity among samples varied most at undeveloped
locations possibly indicating a more patchily distributed
fauna. The most conspicuous difference between devel-
oped and undeveloped locations was the order of
magnitude greater proportion of larval ceratopogonids
collected along developed shorelines. Ceratopogonid lar-
vae were absent from barrier undeveloped shorelines but
comprised 13% of total metazoan abundance (14 ind/
10 cm2) at the developed shoreline. Increased densities of
larvae suggest that altered shoreline conditions may lead to
unanticipated environmental management issues for
Murrells Inlet residents and tourists. Adult ceratopogonids
(sand flies, no-see-ums) are serious mammalian pests and
can vector livestock diseases (e.g., blue tongue) as a result
of the female’s biting behavior. Developed locations also
contained two other groups of Diptera flies absent from
undeveloped locations: Chironomidae or midge flies and
Hexatoma (Tipulidae) or crane flies. Coastal environments
that vary widely in salinity (e.g., oligohaline marshes to
saline pools) typically contain increased densities of
Murrells Inlet locationMainland Barrier
Ben
thic
met
azo
and
ensi
ty (
x 10
4 m-2
)
0
10
20
30
40
50
M. b
iden
tatu
sd
ensi
ty (
# m
-2)
0
100
200
300
400
L. i
rro
rata
den
sity
(#
m-2
)
0
50
100
150
200DevelopedUndeveloped
Fig. 7 Total benthic infaunal, L. irrorata and M. bidentatus densities
(l ? 1 se, n = 5) from developed and undeveloped shoreline
locations within Murrells Inlet barrier and mainland locations
Developed and undeveloped shorelines 317 Author's personal copy
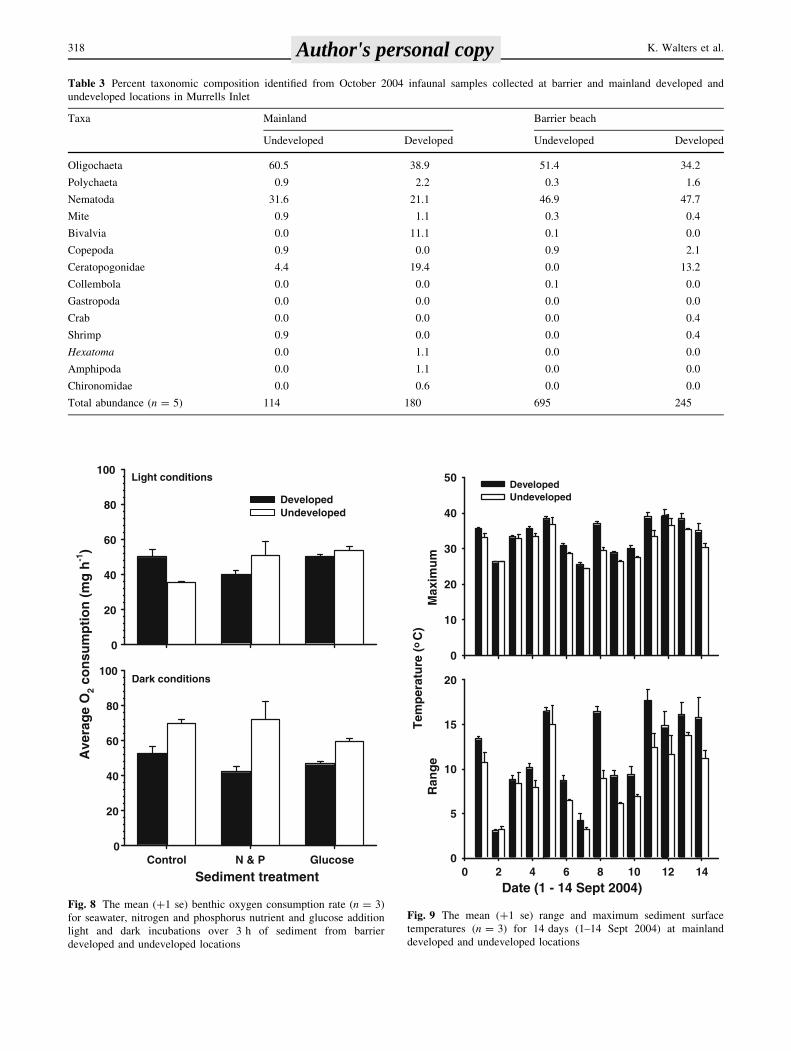
Table 3 Percent taxonomic composition identified from October 2004 infaunal samples collected at barrier and mainland developed and
undeveloped locations in Murrells Inlet
Taxa Mainland Barrier beach
Undeveloped Developed Undeveloped Developed
Oligochaeta 60.5 38.9 51.4 34.2
Polychaeta 0.9 2.2 0.3 1.6
Nematoda 31.6 21.1 46.9 47.7
Mite 0.9 1.1 0.3 0.4
Bivalvia 0.0 11.1 0.1 0.0
Copepoda 0.9 0.0 0.9 2.1
Ceratopogonidae 4.4 19.4 0.0 13.2
Collembola 0.0 0.0 0.1 0.0
Gastropoda 0.0 0.0 0.0 0.0
Crab 0.0 0.0 0.0 0.4
Shrimp 0.9 0.0 0.0 0.4
Hexatoma 0.0 1.1 0.0 0.0
Amphipoda 0.0 1.1 0.0 0.0
Chironomidae 0.0 0.6 0.0 0.0
Total abundance (n = 5) 114 180 695 245
Sediment treatmentControl N & P Glucose
Ave
rag
e O
2 co
nsu
mp
tio
n (
mg
h-1
)
0
20
40
60
80
100
0
20
40
60
80
100
DevelopedUndeveloped
Light conditions
Dark conditions
Fig. 8 The mean (?1 se) benthic oxygen consumption rate (n = 3)
for seawater, nitrogen and phosphorus nutrient and glucose addition
light and dark incubations over 3 h of sediment from barrier
developed and undeveloped locations
Date (1 - 14 Sept 2004)0 2 4 6 8 10 12 14
Ran
ge
0
5
10
15
20
DevelopedUndeveloped
Max
imu
m
0
10
20
30
40
50
Tem
per
atu
re (
oC
)
Fig. 9 The mean (?1 se) range and maximum sediment surface
temperatures (n = 3) for 14 days (1–14 Sept 2004) at mainland
developed and undeveloped locations
318 K. Walters et al. Author's personal copy
nematocerous dipterans, both biting and non-biting species
(LaSalle and Bishop 1987; Giberson et al. 2001). Although
not statistically significant between shoreline treatments,
salinities varied most along developed shorelines (from
\10 to [35 ppt) and the variation may be what enables
greater densities of Diptera larvae to persist. Whatever the
reason, shoreline development appears to contribute to an
increase in insect pests and the potential need for greater
management efforts (e.g., pesticide spraying).
Shoreline development resulted in consistently greater
daily temperature maxima and greater day–night ranges at
the sediment surface. Intertidal temperature patterns can be
variable and unpredictable both spatially and temporally
(Helmuth and Hofmann 2001; Helmuth et al. 2002; Hel-
muth et al. 2006), but differences in temperature
experienced by organisms lead to dramatic differences in
distributions, selective pressure and behavior (Helmuth
et al. 2006; Jost and Helmuth 2007; Schneider and Helmuth
2007; Pincebourde et al. 2008). Although only documented
over a relatively short, 2-week period, the persistent tem-
perature difference between developed and undeveloped
marsh shorelines is likely to affect organisms typically
inhabiting the high marsh. Ribbed mussels, Geukensia
demissa, experienced thermal stress and mortality under
natural conditions along an undeveloped high marsh
shoreline in North Inlet, ca. 25 km south of Murrells Inlet
(Jost and Helmuth 2007). High marsh mussels were
uncommon in our samples, but temperature differences
between developed and undeveloped locations may have
affected the coffee bean snail, Melampus bidentatus,
another high marsh resident. The coffee bean snail has no
operculum and is believed to bury in the sediments or
invade crab burrows to minimize thermal stress (McMahon
and Russell-Hunter 1981). Coffee bean snails experience
increased mortality (McMahon and Russell-Hunter 1981)
at air temperatures similar to or below (ca. 40�C) the body
temperatures that cause increased mortality in ribbed marsh
mussels (Jost and Helmuth 2007). Melampus bidentatus
were significantly more abundant along undeveloped
shorelines, especially on the barrier island side of Murrells
Inlet. The greater thermal stress of developed shorelines
may result in either increased mortality or emigration
possibly explaining the observed significant difference in
snail densities.
Oxygen consumption within sediments, primarily the
result of heterotrophic bacteria, was affected by shoreline
development. Although consumption rates suggested het-
erotrophy predominated production pathways along both
barrier island shorelines, both heterotrophic (dark) and
autotrophic production rates (light–dark) were greater at
the undeveloped location. Heterotrophic bacterial produc-
tion in salt marsh soils generally is understood to be
phosphorus limited, but continued phosphorus loading may
shift the bacterial population to a carbon-limited status
(Sundareshwar et al. 2003). Typical of many environments,
the structure of salt marsh microbial communities is sen-
sitive to increases in anthropogenic pollutants (Cao et al.
2006). Darby and Turner (2008) also suggest that phos-
phorus loading and the resulting competition with microbes
can decrease belowground Spartina tissue production and
be detrimental to long-term salt marsh maintenance.
Although difficult to reconcile definitively based on the
Table 4 Previously identified ecological attributes affected or pos-
sibly affected by shoreline development (see Wahl et al. 1997 [W],
Bertness et al. 2002 [B], Silliman and Bertness 2004 [S]; letters
denote studies showing respective effects listed below), the observed
or predicted high salt marsh effects of development, and identified
effects of shoreline alteration in the current Murrells Inlet study
Ecological attribute Predicted
effect
Identified effect
Sediment characteristics
Sediment grain size : NS Barrier
;NS Mainland
Sediment organic content : or ; NS Barrier
;NS Mainland
Nutrient concentration : (W, B, S) NM
Pore water salinity ; (S) NS Oct. 2003
;NS Mar. 2004
Sediment surface temperatures : : Maximum
: Range
Floral characteristics
Plant density : NS
Plant height : (B) :
Plant standing crop : (B) NS
Plant species richness ; (B, S) NM
Faunal Characteristics
Snail density : : L. irrorata
;NS M. bidentatus
Snail biomass : NM
Benthic invertebrate density : : Barrier
Benthic species richness ; NS
Benthic community similarity ; : Barrier
; Mainland
Microbial characteristics
Chlorophyll concentrations : NM
Bacterial abundance ; NM
Microbial substrate utilization : or ; NM
Net primary production : NM
Microbial respiration : or ; ; Dark Barrier
: = D [ U, ; = D \ U
NS no significant difference, (: or ;) NS trending but not significant,
NM not measured
Developed and undeveloped shorelines 319 Author's personal copy
comparison of barrier island shorelines, the greater oxygen
demand, greater metazoan abundance, and the trend
towards greater organic matter in undeveloped sediments
suggests the presence of a more productive benthic food
web.
The significantly greater heights of J. roemerianus stems
suggest shoreline development is associated with increased
production in the adjacent salt marsh. Juncus roemerianus
is a generalist species tolerating a wide range of conditions
(Woerner and Hackney 1997; Brinson and Christian 1999),
but previous research indicates that biomass production is
greater when grown at relatively low soil salinities (Pen-
nings et al. 2005). Compared to J. roemerianus populations
further from the shoreline, Touchette (2006) also demon-
strated that high marsh plants primarily fed by upland
freshwater were less stressed and had greater biomass.
Although runoff from areas adjacent to our study locations
was not measured directly, salinity results from before and
after a rain event suggest that development and the con-
comitant increased freshwater runoff may be responsible
for decreased pore water salinity and improved growing
conditions for J. roemerianus. In New England, shoreline
development is associated with dramatic changes in plant
community composition, including the aggressive invasion
by Phragmites australis, a non-native reed (Bertness et al.
2002, 2008, 2009; Silliman and Bertness 2004). Although
present in the area (Luken and Walters 2009), shoreline
development in Murrells Inlet has not resulted in an inva-
sion by P. australis (Walters et al. pers. obs.). A number of
factors including limits on chance dispersal and lack of
habitat disturbance (e.g., wrack) could account for the
absence of P. australis in Murrells Inlet. Alternatively,
shoreline development in southeastern marshes may lead to
more subtle changes that modify natural environmental
gradients and trophic structure but do not necessarily alter
the composition of the salt marsh plant community.
The increased freshwater runoff associated with shore-
line development also is accompanied typically with
increased nitrogen loading (Bowen and Valiela 2001;
Bertness et al. 2002, 2009; Wigand et al. 2003) and alter-
ation in the timing of release of mineral nitrogen to
associated near shore habitats (Wahl et al. 1997; Gorman
et al. 2009). In communities comprised of S. alterniflora
and S. patens, nitrogen loading will alter plant growth,
change vegetation structure and modify competitive inter-
actions (Bertness et al. 2002; Wigand et al. 2003). The
common presence of a J. roemerianus zone adjacent to the
upland/marsh boundary in many southeastern marshes
suggests a relatively high degree of plant diversity as a
result of natural gradients in flooding and salinity
(Pennings et al. 2005). As the closest marsh plant to the
terrestrial boundary, the J. roemerianus zone may be
viewed as a secondary buffer that receives and processes
the various effects of shoreline development and possibly
mitigates anticipated consequences on other marsh species.
The regional differences in resistance to shoreline devel-
opment, specifically the types and prevalence of plant
species that may serve as buffers to changing environ-
mental conditions, may explain many of the unanticipated
results in our current study.
Even given the possible regional differences, almost
50% of the predicted effects of shoreline development were
not observed in Murrells Inlet. Aside from variables not
measured or not measured with sufficient power, a number
of factors previously not considered in studies of shoreline
development may have contributed to our inability to
predict consistently the effects of shoreline development in
southeastern marshes: the extent and history of shoreline
modification. The extent of shoreline modification can vary
from no alteration or no removal of the native salt-shrub
thicket bordering a marsh to severe alteration or removal of
all native vegetation and bulk-heading, channeling, ditch-
ing or other modification of the normal tidal flow taking
place. Differences also can occur within a modification
category. In suburbanized Murrells Inlet, housing devel-
opments along the marshes can range from no alteration of
the native vegetation, at least directly along the marsh/
upland boarder, to complete removal of all native vegeta-
tion and alternative landscaping including extensive
planting of turf grasses. Depending on the mindset or
economy, individual households where complete removal
of native vegetation occurs, additionally may experience
weekly, monthly, seasonally, or no nitrogen supplements in
the form of fertilizers along with the possible additional
application of pesticides and herbicides. Although each
Murrells Inlet developed shoreline represented a residential
alteration of the existing habitat, the extent of the bound-
ary’s modification ranged from minimal alteration to
complete removal of native vegetation. Differences in the
extent of shoreline modification likely made detection of
predicted effects difficult.
Any ecological effects of shoreline development also are
likely dependent on the history of boundary alteration.
Significant high-marsh changes may not have had time to
take place along newly altered shorelines depending on the
variable being measured. Based on salt marsh restoration
studies, plant biomass (Broome et al. 1986; Roman et al.
2002), genetic diversity (Travis et al. 2002), fish utilization
(Roman et al. 2002; Able et al. 2004), and sediment
salinities (Walters 2009) can change rapidly within newly
planted marshes, while changes in sediment organic con-
tent (Craft et al. 1999), nutrient cycling (Thompson et al.
1995; Craft et al. 1999), infauna (Sacco et al. 1994; Levin
et al. 1996), and plant canopy (Zedler 1993) tend to require
significant time if not decades. Ecological changes in
Narragansett Bay salt marshes only were detected after two
320 K. Walters et al. Author's personal copy
decades of urbanization (Wigand et al. 2010). The devel-
oped shoreline we studied, OMD1, consisted of recently
built (\5 years) and ongoing building and therefore was a
newly developed shoreline along which high-marsh chan-
ges may not have been expected to have occurred. In
contrast, the barrier island shoreline was developed for at
least 20 years and any differences between shoreline
locations (e.g., benthic infaunal densities) may be
explained in part by the age of boundary development. The
same may be true for any differences between observed
and expected boundary development effects. Basing pre-
dicted effects on studies from Northeastern marshes,
historically experiencing greater impacts from increasing
populations, may not be justified. Southeastern marshes
may be at the very beginning of the shoreline development
trajectory leading ultimately to negative effects on high-
marsh environments.
Historically, humans have either directly or indirectly
altered salt marsh environments (e.g., Gedan et al. 2009),
making an accurate assessment of cumulative historical
effects difficult. From the earliest days of European colo-
nization, South Carolina marshes have been ditched,
dredged, filled and altered to support numerous commercial
or residential pursuits (Gedan et al. 2009). Although overt
direct impacts to South Carolina salt marshes are now less
common, residential development adjacent to salt marshes
is on the increase; there are few signs that development of
land adjacent to salt marshes will be curtailed in the future
as such lots offer numerous amenities (e.g., scenic vistas,
recreation opportunities, investment return). Our research
suggests that development of the marsh shoreline may
produce subtle changes to the adjacent salt marsh. These
subtle changes can be contrasted with the more dramatic
changes in northeastern USA marshes that presumably are
linked to residential development (Bertness et al. 2002,
2008, 2009; Silliman and Bertness 2004).
Future research might focus on two different but related
salt marsh issues. First, our data suggest regional differ-
ences in the resistance (stability) of salt marshes. Although
salt marshes are relatively simple systems and share many
of the same characteristics, understanding why regional
differences occur is important to making effective man-
agement decisions. Experimental results suggest salinity is
an important factor affecting the speed of marsh recovery
following disturbance (Crain et al. 2008), and regional
differences in factors affecting salinity (e.g., drought
periods) may influence the impacts of shoreline develop-
ment. Second, the effects of small changes to marshes may
be cumulative and eventually bring the system to a point
where the marsh will experience a major change. The
invasion of northeast salt marshes by Phragmites australis
is one example where small, cumulative changes in the
nutrient status of marshes eventually set the stage for a
larger ecosystem change (Silliman and Bertness 2004).
Both lines of research are important for understanding how
to manage residential development of shorelines in order to
minimize potential negative effects on coastal marshes.
Acknowledgments We thank the numerous CCU student volun-
teers that were involved in the collection and processing of samples,
including A. Bevington, E. Dukes, C. Flick, L. Greenwood, M. Hicks,
M. Kirschbaum, A. Mauldin, S. Rider, and L. Waite. Comments of
two anonymous reviewers greatly improved the manuscript. This
research was funded in part by NSF-MRI Program Grant OCE-
116536 awarded to E. Koepfler.
References
Able KW, Nemerson DM, Grothues TM (2004) Evaluating salt marsh
restoration in Delaware Bay: analysis of fish response at former
salt hay farms. Estuaries 27:58–69
Anderson MJ (2001) Permutation tests for univariate or multivariate
analysis of variance and regression. Can J Fish Aquat Sci
58:626–639
Anderson MJ (2005) PERMANOVA: a FORTRAN computer
program for permutational multivariate analysis of variance.
Department of Statistics, University of Auckland, New Zealand
Attrill MJ, Rundle SD (2002) Ecotone or ecocline: ecological
boundaries in estuaries. Estuar Coast Shelf Sci 55:929–936
Beach D (2002) Coastal sprawl: the effects of urban design on aquatic
ecosystems in the United States. Pew Oceans Commission,
Arlington, VA.
http://www.pewoceans.org/reports/water_pollution_sprawl.pdf
Bell SS (1980) Meiofauna–macrofauna interactions in a high salt
marsh habitat. Ecol Monogr 50:487–505
Bertness MD, Silliman BR (2008) Consumer control of salt marshes
driven by human disturbance. Conserv Biol 22:618–623
Bertness MD, Ewanchuk PJ, Silliman BR (2002) Anthropogenic
modification of New England salt marsh landscapes. Proc Natl
Acad Sci USA 99:1395–1398
Bertness MD, Cain CM, Holdredge C, Sala N (2008) Eutrophication
and consumer control of New England salt marsh primary
productivity. Conserv Biol 22:131–139
Bertness MD, Silliman BR, Holdredge C (2009) Shoreline develop-
ment and the future of New England salt marsh landscapes. In:
Silliman BR, Grosholz ED, Bertness MD (eds) Human impacts
on salt marshes: a global perspective. University of California
Press, Berkeley, pp 137–148
Bilkovic DM, Roggero M, Hershner CH, Havens KH (2006)
Influence of land use on macrobenthic communities in nearshore
estuarine habitats. Estuaries Coasts 29:1185–1195
Blood ER, Vernberg FJ (1991) Characterization of the physical,
chemical and biological conditions and trends in Winyah Bay
and North Inlet estuaries: 1970–1985. Characterization of the
physical, chemical and biological conditions and trends in three
South Carolina estuaries, vol. 2. South Carolina Sea Grant
Consortium, Charleston, p 117
Bowen JL, Valiela I (2001) The ecological effects of urbanization of
coastal watersheds: historical increases in nitrogen loads and
eutrophication of Waquoit Bay estuaries. Can J Fish Aquat Sci
58:1489–1500
Brewer JS (2003) Nitrogen addition does not reduce belowground
competition in a salt marsh clonal plant community in Missis-
sippi (USA). Plant Ecol 168:93–106
Bricker SB, Clement CG, Pirhalla DE, Orlando SP, Farrow DRG
(1999) National estuarine eutrophication assessment: effects of
Developed and undeveloped shorelines 321 Author's personal copy
nutrient enrichment in the nation’s estuaries. National Oceanic
and Atmospheric Administration, National Ocean Service,
Special Projects Office and the National Centers for Coastal
Ocean Science, Silver Spring, Maryland, 71 pp
Brinson MM, Christian RR (1999) Stability of Juncus roemerianuspatches in a salt marsh. Wetlands 19:65–70
Broome SW, Seneca ED, Woodhouse WW (1986) Long-term growth
and development of transplants of the salt-marsh grass Spartinaalterniflora. Estuaries 9:63–74
Cadenasso ML, Pickett STA, Weathers KC, Jones CG (2003) A
framework for a theory of ecological boundaries. BioScience
53:750–758
Cao Y, Cherr GN, Cordova-Kreylos AL, Fan TW-M, Green PG,
Higashi RM, LaMontagne MG, Scow KM, Vines CA, Yuan J,
Holden PA (2006) Relationships between sediment microbial
communities and pollutants in two California salt marshes.
Microb Ecol 52:619–633
Cohen J (1988) Statistical power analysis for the behavioral sciences,
2nd edn. Lawrence Erlbaum Assoc, Hillsdale, p 567
Corbett CW, Wahl M, Porter DE, Edwards D, Moise C (1997)
Nonpoint source runoff modeling: a comparison of a forested
watershed and an urban watershed on the South Carolina coast. J
Exp Mar Biol Ecol 213:133–149
Costanza R, d’Arge R, de Groot R, Farber S, Grasso M, Hannon B,
Limburg K, Naeem S, O’Neill RV, Paruelo J, Raskin RG, Sutton
P, van den Belt M (1997) The value of the world’s ecosystem
services and natural capital. Nature 387:253–260
Craft C, Reader J, Sacco JN, Broome SW (1999) Twenty-five years of
ecosystem development of constructed Spartina alterniflora(Loisel) marshes. Ecol Appl 9:1405–1419
Crain CM (2007) Shifting nutrient limitation and eutrophication
effects in marsh vegetation across estuarine salinity gradients.
Estuaries Coasts 30:26–34
Crain CM, Albertson LK, Bertness MD (2008) Secondary succession
dynamics in estuarine marshes across landscape-scale salinity
gradients. Ecology 89:2889–2899
Darby FA, Turner RE (2008) Below- and aboveground biomass of
Spartina alterniflora: response to nutrient addition in a Louisiana
salt marsh. Estuaries Coasts 31:326–334
Deegan LA, Bowen JL, Drake D, Fleeger JW, Friedrichs CT, Galvan
KA, Hobbie JE, Hopkinson C, Johnson DS, Johnson JM, LeMay
LE, Miller E, Peterson BJ, Picard C, Sheldon S, Sutherland M,
Vallino J, Warren RS (2007) Susceptibility of salt marshes to
nutrient enrichment and predator removal. Ecol Appl 17(Sup-
plement):S42–S63
Denno RF, Gratton C, Dobel H, Finke DL (2003) Predation risk
affects relative strength of top-down and bottom-up impacts on
insect herbivores. Ecology 84:1032–1044
DiDonato GT, Stewart JR, Sanger DM, Robinson BJ, Thompson BC,
Holland AF, Van Dolah RF (2009) Effects of changing land use
on the microbial water quality of tidal creeks. Mar Pollut Bull
58:97–106
Emery NC, Ewanchuk PJ, Bertness MD (2001) Competition and salt-
marsh plant zonation: stress tolerators may be dominant
competitors. Ecology 82:2471–2485
Faul F, Erdfelder E, Lang A-G, Buchner A (2007) G*Power 3: a
flexible statistical power analysis program for the social,
behavioral, and biomedical sciences. Behav Res Methods
39:175–191
Gedan KB, Silliman BR, Bertness MD (2009) Centuries of human-
driven change in salt marsh ecosystems. Annu Rev Mar Sci
1:117–141
Giberson DJ, Bilyj B, Burgess N (2001) Species diversity and
emergence patterns of Nematocerous flies (Insecta: Diptera)
from three coastal salt marshes in Prince Edward Island, Canada.
Estuaries 24:862–874
Gorman D, Russell BD, Connell SD (2009) Land-to-sea connectivity:
linking human-derived terrestrial subsidies to subtidal habitat
change on open rocky coasts. Ecol Appl 19:1114–1126
Gosz JR (1992) Ecological functions in a biome transition zone:
translating local responses to broad-scale dynamics. In: Hansen
AJ, diCastri F (eds) Landscape boundaries: consequences for
biotic diversity and ecological flows. Springer, New York, pp
55–75
Helmuth B, Hofmann GE (2001) Microhabitats, thermal heterogene-
ity and physiological gradients of stress in the rocky intertidal
zone. Biol Bull 201:374–384
Helmuth B, Harley CDG, Halpin P, O’Donnell M, Hofmann GE,
Blanchette C (2002) Climate change and latitudinal patterns of
intertidal thermal stress. Science 298:1015–1017
Helmuth B, Broitman BR, Blanchette CA, Gilman S, Halpin P,
Harley CDG, O’Donnell MJ, Hofmann GE, Menge B, Strickland
D (2006) Mosaic patterns of thermal stress in the rocky intertidal
zone: implications for climate change. Ecol Monogr 76:461–479
Hines J, Megonigal JP, Denno RF (2006) Nutrient subsidies to
belowground microbes impact aboveground food web interac-
tions. Ecology 87:1542–1555
Holland AF, Sanger DM, Gawle CP, Lerberg SB, Santiago MSS,
Riekerk GHM, Zimmerman LE, Scott GI (2004) Linkages
between tidal creek ecosystems and the landscape and demo-
graphic attributes of their watersheds. J Exp Mar Biol Ecol
298:151–178
Hutchens JJ, Walters K (2006) Gastropod abundance and biomass
relationships with salt marsh vegetation within ocean-dominated
South Carolina, USA estuaries. J Shellfish Res 25:947–953
Jost J, Helmuth B (2007) Morphological and ecological determinants
of body temperature of the Atlantic ribbed mussel, Geukensiademissa, and their effects on mussel mortality. Biol Bull
213:141–151
Kiehl K, Esselink P, Bakker JP (1997) Nutrient limitation and plant
species composition in temperate salt marshes. Oecologia
111:325–330
LaSalle MW, Bishop TD (1987) Seasonal abundance of aquatic
Diptera in two oligohaline tidal marshes in Mississippi. Estuaries
10:303–315
Lerberg SB, Holland AF, Sanger DM (2000) Responses of tidal creek
macrobenthic communities to the effects of watershed develop-
ment. Estuaries 23:838–853
Levin LA, Talley D, Thayer G (1996) Succession of macrobenthos in
a created salt marsh. Mar Ecol Prog Ser 141:67–82
Levin LA, Boesch DF, Covich A, Dahm C, Erseus C, Ewel KC,
Kneib RT, Moldenke A, Palmer MA, Snelgrove P, Strayer D,
Weslawski JM (2001) The function of marine critical transition
zones and the importance of sediment biodiversity. Ecosystems
4:430–451
Levine JM, Brewer JS, Bertness MD (1998) Nutrients, competition and
plant zonation in a New England salt marsh. J Ecol 86:285–292
Lewis DB, Eby LA (2002) Spatially heterogeneous refugia and
predation risk in intertidal salt marshes. Oikos 96:119–129
Lewitus AJ, Kawaguchi T, DiTullio GR, Keesee DM (2004) Iron
limitation of phytoplankton in an urbanized vs. forested south-
eastern U.S. salt marsh estuary. J Exp Mar Biol Ecol 298:233–
254
Luken JO, Walters K (2009) Management of plant invaders within a
marsh: an organizing principle for ecological restoration. In:
Indergit (ed) Management of invasive weeds. Springer, New
York, pp 61–76
Mallin MA, Burkholder JM, Cahoon LB, Posey MH (2000a) North
and South Carolina coasts. Mar Pollut Bull 41:56–75
Mallin MA, Williams KE, Esham EC, Lowe RP (2000b) Effect of
human development on bacteriological water quality in coastal
watersheds. Ecol Appl 10:1047–1056
322 K. Walters et al. Author's personal copy

McArdle BH, Anderson MJ (2001) Fitting multivariate models to
community data: a comment on distance-based redundancy
analysis. Ecology 82:290–297
McFarlin CR, Brewer JS, Buck TL, Pennings SC (2008) Impacts of
fertilization on a salt marsh food web in Georgia. Estuaries
Coasts 31:313–325
McMahon RF, Russell-Hunter WD (1981) The effects of physical
variables and acclimation on survival and oxygen consumption
in the high littoral salt-marsh snail, Melampus bidentatus Say.
Biol Bull 161:246–269
Meany RA, Valiela I, Teal JM (1976) Growth, abundance and
distribution of larval tabanids in experimentally fertilized plots
on a Massachusetts salt marsh. J Appl Ecol 13:323–332
Mendelssohn IA, Morris JT (2000) Eco-physiological controls on the
productivity of Spartina alterniflora Loisel. In: Weinstein MP,
Kreeger DA (eds) Concepts and controversies in tidal marsh
ecology. Kluwer, Dordrecht, pp 59–80
Morris JT (1991) Effects of nitrogen loading on wetland ecosystems
with particular reference to atmospheric deposition. Annu Rev
Ecol Syst 22:257–279
Morris JT, Bradley PM (1999) Effects of nutrient loading on the
preservation of organic carbon in wetland sediments. Limnol
Oceanogr 44:699–702
Pennings SC, Callaway RM (1992) Salt marsh plant zonation: the
relative importance of competition and physical factors. Ecology
73:681–690
Pennings SC, Wall VD, Moore J, Pattanayek M, Buck TL, Alberts JJ
(2002) Assessing salt marsh health: a test of the utility of five
potential indicators. Wetlands 22:405–414
Pennings SC, Grant MB, Bertness MD (2005) Plant zonation in low-
altitude salt marshes: disentangling the roles of flooding, salinity
and competition. J Ecol 93:159–167
Pincebourde S, Sanford E, Helmuth B (2008) Body temperature
during low tide alters the feeding performance of a top intertidal
predator. Limnol Oceanogr 53:1562–1573
Ries L, Fletcher RJ, Battin J, Sisk TD (2004) Ecological responses to
habitat edges: mechanisms, models, and variability explained.
Annu Rev Ecol Syst 35:491–522
Roman CT, Raposa KB, Adamowicz SC, James-Pirri M-J, Catena JG
(2002) Quantifying vegetation and nekton response to tidal
restoration of a New England salt marsh. Restor Ecol 10:450–
460
Sacco JN, Seneca ED, Wentworth TR (1994) Infaunal community
development of artificially established saltmarshes in North
Carolina. Estuaries 17:489–500
Sanger DM, Holland AF, Scott GI (1999a) Tidal creek and salt marsh
sediments in South Carolina Coastal Estuaries: I. Distribution of
trace metals. Arch Environ Contam Toxicol 37:445–457
Sanger DM, Holland AF, Scott GI (1999b) Tidal creek and salt marsh
sediments in South Carolina Coastal Estuaries: II. Distribution of
organic contaminants. Arch Environ Contam Toxicol 37:458–471
Schindler DE, Johnson BM, MacKay NA, Bouwes N, Kitchell JF
(1994) Crab:snail size-structured interactions and salt marsh
predation gradients. Oecologia 97:49–61
Schneider KR, Helmuth B (2007) Spatial variability in habitat
temperature drives patterns of selection between an invasive and
native mussel species. Mar Ecol Prog Ser 339:157–167
Silliman BR, Bertness MD (2002) A trophic cascade regulates salt
marsh primary productivity. Proc Natl Acad Sci USA 99:10500–
10505
Silliman BR, Bertness MD (2004) Shoreline development drives the
invasion of Phragmites australis and the loss of New England
salt marsh plant diversity. Conserv Biol 18:1424–1434
Silliman BR, Zieman JC (2001) Top-down control of Spartinaalterniflora production by periwinkle grazing in a Virginia salt
marsh. Ecology 82:2830–2845
Stiven AE, Kuenzler EJ (1982) The response of two salt marsh mollusks,
Littorina irrorata and Geukensia demissa, to field manipulations of
density and Spartina litter. Ecol Monogr 49:151–171
Sundareshwar PV, Morris JT, Koepfler EK, Fornwalt B (2003)
Phosphorus limitation of coastal ecosystem processes. Science
299:563–565
Talley DM, North EW, Juhl AR, Timothy DA, Conde D, de Brouwer
JFC, Brown CA, Campbell LM, Garstecki T, Hall CJ, Meysman
FJR, Nemerson DM, Souza Filho PW, Wood RJ (2003) Research
challenges at the land-sea interface. Estuar Coast Shelf Sci
58:699–702
Thompson SP, Paerl HW, Go MC (1995) Seasonal patterns of
nitrification and denitrification in a natural and a restored salt
marsh. Estuaries 18:399–408
Touchette BW (2006) Salt tolerance in a Juncus roemerianus brackish
marsh: spatial variation in plant water relations. J Exp Mar Biol
Ecol 337:1–12
Travis SE, Proffitt CE, Lowenfeld RC, Mitchell TW (2002) A
comparative assessment of genetic diversity among differently-
aged populations of Spartina alterniflora on restored versus
natural wetlands. Restor Ecol 10:37–42
Tufford DL, Samarghitan CL, McKellar HN, Porter DE, Hussey JR
(2003) Impacts of urbanization on nutrient concentrations in
small southeastern coastal streams. J Am Water Resour Assoc
39:301–312
Valiela I, Bowen JL (2002) Nitrogen sources to watersheds and
estuaries: role of land cover mosaics and losses within water-
sheds. Environ Pollut 118:239–248
Van Dolah RF, Riekerk GHM, Bergquist DC, Felber J, Chestnut DE,
Holland AF (2008) Estuarine habitat quality reflects urbanization
at large spatial scales in South Carolina’s coastal zone. Sci Total
Environ 390:142–154
Van Wijnen HJ, Bakker JP (1999) Nitrogen and phosphorus limitation
in a coastal barrier salt marsh: the implications for vegetation
succession. J Ecol 87:265–272
Vernberg FJ, Vernberg WB, Blood E, Fortner A, Fulton M, McKellar
H, Michener W, Scott G, Siewicki T, El Figi K (1992) Impact of
urbanization on high-salinity estuaries in the southeastern United
States. Neth J Sea Res 30:239–248
Vince SW, Valiela I, Teal JM (1981) An experimental study of the
structure of herbivorous insect communities in a salt marsh.
Ecology 62:1662–1678
Wahl MH, McKellar HN, Williams TM (1997) Patterns of nutrient
loading in forested and urbanized coastal streams. J Exp Mar
Biol Ecol 213:111–131
Walters K (2009) Integrating structural and functional metrics to
assess the early success of salt marsh restoration. In: Pardue GH,
Olvera TK (eds) Ecological restoration. Nova Science Publish-
ers, Hauppauge, pp 111–139
White DL, Porter DE, Lewitus AJ (2004) Spatial and temporal
analyses of water quality and phytoplankton biomass in an
urbanized versus a relatively pristine salt marsh estuary. J Exp
Mar Biol Ecol 298:255–273
White DL, Porter DE, Lewitus AJ, Keesee J (2008) Spatial gradient
analyses of nutrients and chlorophyll a biomass in an urbanized
lagoonal estuary: a comparison between wet and dry years.
J Coastal Res 24:649–659
Wiens JA, Crawford CS, Gosz JR (1985) Boundary dynamics: a
conceptual framework for studying landscape ecosystems. Oikos
45:421–427
Wigand C, Comeleo R, McKinney R, Thursby G, Chintala M,
Charpentier M (2001) Outline of a new approach to evaluate
ecological integrity of salt marshes. Human Ecol Risk Assess
7:1541–1554
Wigand C, McKinney RA, Charpentier MA, Chintala MM, Thursby
GM (2003) Relationships of nitrogen loadings, residential
Developed and undeveloped shorelines 323 Author's personal copy

development, and physical characteristics with plant structure in
New England salt marshes. Estuaries 26:1494–1504
Wigand C, McKinney R, Chintala M, Lussier S, Heltshe J (2010)
Development of a reference coastal wetland set in Southern New
England (USA). Environ Monit Assess 161:583–598
Woerner LS, Hackney CT (1997) Distribution of Juncus roemerianusin North Carolina tidal marshes: the importance of physical and
biotic variables. Wetlands 17:284–291
Yarrow MM, Marın VI (2007) Toward conceptual cohesiveness: a
historical analysis of the theory and utility of ecological
boundaries and transition zones. Ecosystems 10:462–476
Zedler JB (1993) Canopy architecture of natural and planted
cordgrass marshes: selecting habitat evaluation criteria. Ecol
Appl 3:123–138
324 K. Walters et al. Author's personal copy