Upper Cook Inlet commercial fisheries annual management ...
142
Fishery Management Report No. 06-42 Upper Cook Inlet Commercial Fisheries Annual Management Report, 2005 by Pat Shields July 2006 Alaska Department of Fish and Game Divisions of Sport Fish and Commercial Fisheries
-
Upload
khangminh22 -
Category
Documents
-
view
2 -
download
0
Transcript of Upper Cook Inlet commercial fisheries annual management ...

Fishery Management Report No. 06-42
Upper Cook Inlet Commercial Fisheries Annual Management Report, 2005
by
Pat Shields
July 2006
Alaska Department of Fish and Game Divisions of Sport Fish and Commercial Fisheries

Symbols and Abbreviations The following symbols and abbreviations, and others approved for the Système International d'Unités (SI), are used without definition in the following reports by the Divisions of Sport Fish and of Commercial Fisheries: Fishery Manuscripts, Fishery Data Series Reports, Fishery Management Reports, and Special Publications. All others, including deviations from definitions listed below, are noted in the text at first mention, as well as in the titles or footnotes of tables, and in figure or figure captions. Weights and measures (metric) centimeter cm deciliter dL gram g hectare ha kilogram kg kilometer km liter L meter m milliliter mL millimeter mm Weights and measures (English) cubic feet per second ft3/s foot ft gallon gal inch in mile mi nautical mile nmi ounce oz pound lb quart qt yard yd Time and temperature day d degrees Celsius °C degrees Fahrenheit °F degrees kelvin K hour h minute min second s Physics and chemistry all atomic symbols alternating current AC ampere A calorie cal direct current DC hertz Hz horsepower hp hydrogen ion activity pH (negative log of) parts per million ppm parts per thousand ppt, ‰ volts V watts W
General Alaska Administrative Code AAC all commonly accepted abbreviations e.g., Mr., Mrs.,
AM, PM, etc. all commonly accepted professional titles e.g., Dr., Ph.D., R.N., etc. at @ compass directions:
east E north N south S west W
copyright © corporate suffixes:
Company Co. Corporation Corp. Incorporated Inc. Limited Ltd.
District of Columbia D.C. et alii (and others) et al. et cetera (and so forth) etc. exempli gratia (for example) e.g. Federal Information Code FIC id est (that is) i.e. latitude or longitude lat. or long. monetary symbols (U.S.) $, ¢ months (tables and figures): first three letters Jan,...,Dec registered trademark ® trademark ™ United States (adjective) U.S. United States of America (noun) USA U.S.C. United States
Code U.S. state use two-letter
abbreviations (e.g., AK, WA)
Measures (fisheries) fork length FL mideye-to-fork MEF mideye-to-tail-fork METF standard length SL total length TL Mathematics, statistics all standard mathematical signs, symbols and abbreviations alternate hypothesis HA base of natural logarithm e catch per unit effort CPUE coefficient of variation CV common test statistics (F, t, χ2, etc.) confidence interval CI correlation coefficient (multiple) R correlation coefficient (simple) r covariance cov degree (angular ) ° degrees of freedom df expected value E greater than > greater than or equal to ≥ harvest per unit effort HPUE less than < less than or equal to ≤ logarithm (natural) ln logarithm (base 10) log logarithm (specify base) log2, etc. minute (angular) ' not significant NS null hypothesis HO percent % probability P probability of a type I error (rejection of the null hypothesis when true) α probability of a type II error (acceptance of the null hypothesis when false) β second (angular) " standard deviation SD standard error SE variance population Var sample var

FISHERY MANAGEMENT REPORT NO. 06-42
UPPER COOK INLET COMMERCIAL FISHERIES ANNUAL MANAGEMENT REPORT, 2005
by
Pat Shields, Alaska Department of Fish and Game, Division of Commercial Fisheries, Soldotna
Alaska Department of Fish and Game Division of Sport Fish, Research and Technical Services 333 Raspberry Road, Anchorage, Alaska, 99518-1565
July 2006

The Division of Sport Fish Fishery Management Reports series was established in 1989 for the publication of an overview of Division of Sport Fish management activities and goals in a specific geographic area. Since 2004, the Division of Commercial Fisheries has also used the Fishery Management Report series. Fishery Management Reports are intended for fishery and other technical professionals, as well as lay persons. Fishery Management Reports are available through the Alaska State Library and on the Internet: http://www.sf.adfg.state.ak.us/statewide/divreports/html/intersearch.cfm. This publication has undergone regional peer review.
Pat Shields, Alaska Department of Fish and Game, Division of Commercial Fisheries, 43961 Kalifornsky Beach Road, Suite B, Soldotna, AK 99669-8367, USA
This document should be cited as: Shields, P. 2006. Upper Cook Inlet commercial fisheries annual management report, 2005. Alaska Department of
Fish and Game, Fishery Management Report No. 06-42, Anchorage.
The Alaska Department of Fish and Game administers all programs and activities free from discrimination based on race, color, national origin, age, sex, religion, marital status, pregnancy, parenthood, or disability. The department administers all programs and activities in compliance with Title VI of the Civil Rights Act of 1964, Section 504 of the Rehabilitation Act of 1973, Title II of the Americans with Disabilities Act of 1990, the Age Discrimination Act of 1975, and Title IX of the Education Amendments of 1972. If you believe you have been discriminated against in any program, activity, or facility, or if you desire further information please write to ADF&G, P.O. Box 25526, Juneau, AK 99802-5526; U.S. Fish and Wildlife Service, 4040 N. Fairfax Drive, Suite 300 Webb, Arlington, VA 22203 or O.E.O., U.S. Department of the Interior, Washington DC 20240. For information on alternative formats for this and other department publications, please contact the department ADA Coordinator at (voice) 907-465-6077, (TDD) 907-465-3646, or (FAX) 907-465-6078.

i
TABLE OF CONTENTS Page
LIST OF TABLES.........................................................................................................................................................ii LIST OF FIGURES.......................................................................................................................................................ii LIST OF APPENDICES ...............................................................................................................................................ii ABSTRACT ..................................................................................................................................................................1 INTRODUCTION.........................................................................................................................................................1 Salmon...........................................................................................................................................................................1 Herring...........................................................................................................................................................................2 Smelt..............................................................................................................................................................................3 Razor Clams ..................................................................................................................................................................3 2005 COMMERCIAL SALMON FISHERY................................................................................................................4 Chinook Salmon ............................................................................................................................................................5 Sockeye Salmon ............................................................................................................................................................6 Coho Salmon ...............................................................................................................................................................17 Pink Salmon.................................................................................................................................................................17 Chum Salmon ..............................................................................................................................................................18 Price, Average Weight and Participation.....................................................................................................................18 Salmon Enhancement ..................................................................................................................................................19 Stock Status and Outlook ............................................................................................................................................19 2005 COMMERCIAL HERRING FISHERY.............................................................................................................25 2005 COMMERCIAL SMELT FISHERY..................................................................................................................25 2005 COMMERCIAL RAZOR CLAM FISHERY.....................................................................................................26 SUBSISTENCE...........................................................................................................................................................26 Tyonek Subsistence Salmon Fishery ...........................................................................................................................26 Upper Yentna River Subsistence Salmon Fishery .......................................................................................................27 Kenaitze Tribal Educational Fishery ...........................................................................................................................27 Ninilchik Traditional Council/Native Descendents Educational Fishery ....................................................................27 Ninilchik Emergency Services educational fishery .....................................................................................................28 PERSONAL USE SALMON FISHERY.....................................................................................................................28 2005 Personal Use Fishery ..........................................................................................................................................29 REFERENCES CITED ...............................................................................................................................................30 TABLES AND FIGURES...........................................................................................................................................33 APPENDIX A ...........................................................................................................................................................111

ii
LIST OF TABLES Table Page 1. Offshore test fish sockeye salmon catch results, F/V Americanus, 2005. .....................................................34 2. Upper Cook Inlet sockeye salmon enumeration by river and date, 2005. .....................................................35 3. Commercial Chinook salmon catch by area and date, Upper Cook Inlet, 2005. ...........................................37 4. Commercial sockeye salmon catch by area and date, Upper Cook Inlet, 2005.............................................44 5. Commercial coho salmon catch by area and date, Upper Cook Inlet, 2005. .................................................52 6. Commercial pink salmon catch by area and date, Upper Cook Inlet, 2005...................................................59 7. Commercial chum salmon catch by area and date, Upper Cook Inlet, 2005.................................................66 8. Commercial salmon catch by gear, statistical area and species, Upper Cook Inlet, 2005. ............................73 9. Commercial salmon catch per permit by statistical area, Upper Cook Inlet, 2005........................................74 10. Commercial fishery emergency orders issued during the 2005 Upper Cook Inlet fishing season. ...............75 11. Commercial salmon fishing periods, Upper Cook Inlet, 2005. .....................................................................89 12. Age composition (in percent) of sockeye salmon escapements, Upper Cook Inlet, 2005.............................94 13. Upper Cook Inlet salmon average weights (in pounds) by area, 2005. .........................................................95 14. Major buyers and processors of Upper Cook Inlet fishery products, 2005. ..................................................97 15. Personal use salmon harvest by gear, area, and species, Upper Cook Inlet, 2005..................................................98 16. Age, weight, sex, and size distribution of Pacific herring sampled by gillnet in Upper Cook Inlet, 2005. ...99 17. Seldovia District tide tables, May–August, 2005. .......................................................................................100 18. Total sockeye salmon harvest from all sources in Upper Cook Inlet, 1996-2005. ......................................104 19. Daily commercial harvest of razor clams, Upper Cook Inlet, 2005. ...........................................................105
LIST OF FIGURES Figure Page 1. Major tributaries of the Cook Inlet Basin....................................................................................................106 2. Upper Cook Inlet commercial fisheries Subdistrict fishing boundaries. .....................................................107 3. Upper Cook Inlet commercial fisheries statistical areas..............................................................................108 4. Drift gillnet boundaries for fishing areas 1 and 2. .......................................................................................109 5. Drift gillnet boundaries for fishing areas 3 and 4. .......................................................................................110
LIST OF APPENDICES Appendix Page A1. Upper Cook Inlet commercial Chinook salmon harvest by gear type and area, 1966-2005........................112 A2. Upper Cook Inlet commercial sockeye salmon harvest by gear type and area, 1966-2005. .......................114 A3. Upper Cook Inlet commercial coho salmon harvest by gear type and area, 1966-2005. ............................116 A4. Upper Cook Inlet commercial pink salmon harvest by gear type and area, 1966-2005. .............................118 A5. Upper Cook Inlet commercial pink salmon harvest by gear type and area, 1966-2005. .............................120 A6. Upper Cook Inlet commercial salmon harvest by species, 1956-2005........................................................122 A7. Approximate exvessel value of Upper Cook Inlet commercial salmon harvest by species, 1960-2005. ....123 A8. Commercial herring harvest by fishery, Upper Cook Inlet, 1973–2005..............................................................125 A9. Commercial harvest of razor clams in Cook Inlet, 1919–2005. .........................................................................126 A10. Enumeration goals and counts of sockeye salmon in selected Streams of Upper Cook Inlet, 1978-2005. .127 A11. Average price paid for commercially harvested salmon, Upper Cook Inlet, 1969-2005. ...........................129 A12. Average weight (in pounds) of commercially harvested salmon, Upper Cook Inlet, 1969-2005.......................130 A13. Registered units of gillnet fishing effort by gear type in Cook Inlet, 1966-2005. .............................................131 A14. Forecast and projected commercial harvests of salmon by species, Upper Cook Inlet, 1984–2005. ..........132 A15. Subsistence and educational fishery salmon harvest, Upper Cook Inlet, 1980–2005. ................................133 A16. Summary of salmon harvested from educational fisheries, 1994-2005.......................................................135

1
ABSTRACT The 2005 Upper Cook Inlet (UCI) area management report describes commercial fishing activities monitored by the Alaska Department of Fish and Game Division of Commercial Fisheries in Soldotna. The UCI management area consists of that portion of Cook Inlet north of the latitude of Anchor Point and is divided into the Central and Northern Districts. The Central District is further subdivided into six Subdistricts, while the Northern District is divided into two Subdistricts. At present, all five species of Pacific salmon (sockeye Oncorhynchus nerka, Chinook O. tshawytscha, chum O. keta, coho O. kisutch, and pink O. gorbuscha), razor clams (Siliqua patula), Pacific herring (Clupea pallasi), and eulachon or smelt (Thaleichthys pacificus) are subject to commercial harvest in Upper Cook Inlet. The 2005 UCI commercial harvest of 5.6 million salmon represents the second highest annual harvest in UCI in the past 13 years and was also approximately 32% greater than the average annual harvest from 1966–2004 and 58% greater than the average annual harvest from the previous ten years (1995–2004). The 2005 exvessel value of $31.7 million represents the highest value since 1997 and the 11th highest since 1960. Sockeye salmon escapement is monitored at five systems in UCI. In 2005, none of the final estimated escapement fell within the established goal ranges. The timing of the 2005 sockeye salmon run, measured by a test fishery near the southern boundary of UCI, was 6 days late, which is the latest run ever observed since the test fishery began in 1979.
Key words: Upper Cook Inlet, commercial fishery, personal use fishery, gillnet, escapement, salmon, sockeye, Oncorhynchus nerka, Chinook, O. tshawytscha, chum, O. keta, coho O. kisutch, pink O. gorbuscha, Pacific herring, Clupea pallasi, smelt, eulachon, Thaleichthys pacificus, razor clam, Siliqua patula.
INTRODUCTION The Upper Cook Inlet (UCI) management area consists of that portion of Cook Inlet north of the latitude of Anchor Point and is divided into the Central and Northern Districts (Figures 1 and 2). The Central District is approximately 75 miles long, averages 32 miles in width, and is further subdivided into six subdistricts. The Northern District is 50 miles long, averages 20 miles in width and is divided into two subdistricts. At present, all five species of Pacific salmon (Oncorhynchus), razor clams (Siliqua patula), Pacific herring (Clupea harengus pallasi), and eulachon or smelt (Thaleichthys pacificus) are subject to commercial harvest in Upper Cook Inlet. Harvest statistics are gathered and reported by 5-digit statistical areas and sub-areas (Figure 3).
SALMON Since the inception of a commercial fishery in 1882, many gear types, including fish traps, gillnets, and seines have been employed with varying degrees of success to harvest salmon in UCI. Currently, set (fixed) gillnets are the only gear permitted in the Northern District, while both set and drift gillnets are used in the Central District. The use of seine gear is restricted to the Chinitna Bay Subdistrict, where they are employed sporadically. Drift gillnets have accounted for approximately 50% of the average annual salmon harvest since 1966, with set gillnets harvesting virtually all of the remainder (Appendix A1-A5).
Detailed commercial salmon harvest statistics for UCI specific to gear type and area are available only back to 1966 (Appendix A6). Run-timing and migration routes utilized by all species overlap to such a degree that the commercial fishery is largely mixed-stock and mixed-species in nature. Typically, the UCI harvest represents approximately 5% of the statewide catch. Nearly 10% of all salmon permits issued statewide are for the Cook Inlet area.
In terms of their recent economic value, sockeye salmon (O. nerka) are by far the most important component of the catch followed by Chinook (O. tshawytscha), coho (O. kisutch), chum (O. keta), and pink salmon (O. gorbuscha) (Appendix A7).

2
HERRING Commercial herring fishing began in UCI in 1973 with a modest harvest of bait-quality fish along the east side of the Central District and expanded in the late 1970's to include small-scale sac roe fisheries in Chinitna and Tuxedni Bays (Appendix A8). In 1988, significant decreases in herring abundance were observed in Tuxedni Bay, as well as a shift towards older age class herring, resulting in the closure of Tuxedni Bay to commercial herring fishing prior to the 1992 season. In Chinitna Bay and along the eastside beaches similar declines began to materialize after the 1990 season.
As a result of these declines, the Alaska Department of Fish and Game (ADF&G) submitted a proposal to the Alaska Board of Fisheries (BOF) to open the UCI herring fishery by emergency order only. This proposal passed and became regulation for the 1993 season, ending a long period with fixed opening dates of April 15 on the east side and April 22 on the west side of Cook Inlet. This action effectively closed these fisheries to provide time for herring stocks to recover.
In 1998 the Upper Subdistrict of the Central District and the Eastern Subdistrict of the Northern District were opened to commercial herring fishing to assess the status of the herring population. The herring fisheries on the west side of Cook Inlet remained closed until the status of the east side stocks was determined. Prior to the 1999 season, ADF&G again submitted proposals to the BOF, seeking to restructure the herring fishery to two 30-hour periods per week, beginning on Mondays and Thursdays. These proposals included preseason registration requirements as well as requiring fishermen to report their harvests within 12 hours of the closure of a fishing period.
The proposals were passed in the form of a management plan, (5 AAC 27.409 Central District Herring Recovery Management Plan), which became active for the 1999 season, limiting herring fishing in Upper Cook Inlet to the waters of the Upper, Western, and Chinitna Bay Subdistricts. In the Upper Subdistrict, fishing for herring is not allowed closer than 600 feet of the mean high tide mark on the Kenai Peninsula to reduce the interception of salmon. The management plan was amended by the BOF prior to the 2002 fishing season, extending the closing date for the fishery an additional 11 days to May 31.
In 2001, samples of herring were collected in Chinitna and Tuxedni Bays. Age, sex, and size distribution of the samples revealed that the years of closed fishing in these areas had resulted in an increase of younger fish being recruited into the population. As a result of these analyses, and in accordance with the Central District Herring Recovery Management Plan, the commercial fishery was reopened in 2002 in both the Chinitna Bay and Western Subdistricts. The management plan allows for a very conservative harvest quota, not to exceed 40 and 50 tons, respectively. There has been very little participation in either fishery since they were reopened.
The herring management plan was again modified by the BOF at their 2005 UCI meeting. The Kalgin Island Subdistrict was included in legal waters and fishing periods in the Upper Subdistrict were expanded to 108 hours per week, or from Mondays at 6:00 a.m. until Fridays at 6:00 p.m. The season was open in all areas from April 20 to May 31. Additionally, legal gillnet mesh size was changed to no smaller than 2.0 inches or no greater than 2.5 inches.
Because the glacial waters of UCI preclude the use of aerial surveys to estimate biomass of herring stocks, the management approach utilized has departed from the standard techniques employed in the more traditional herring fisheries. Gillnets are the only legal gear for herring in

3
Upper Cook Inlet, with set gillnets being used almost exclusively. In the Upper Subdistrict, harvests are generally concentrated in the Clam Gulch area, with very little participation in either the Western Subdistrict (Tuxedni Bay) or in Chinitna Bay.
SMELT Prior to adoption of 5 AAC 39.212 Forage Fish Management Plan, the entire Upper Cook Inlet area was open to eulachon (smelt) fishing from October 1 to June 1 (Shields 2005). The only documented commercial harvest of eulachon occurred in 1978, 1980, 1998, and 1999, with catches of 300, 4,000, 18,900, and 100,000 pounds, respectively. Prior to 1998, almost any method and gear type was legal, however, there was some confusion regarding legal gear for harvest of eulachon. Interested fishermen were mistakenly told that gillnets were the only legal gear. Because primary markets required undamaged fish for bait or marine mammal food, this harvest method was unacceptable. In 1998, when the interpretation of the regulations was reviewed and dip nets were allowed, harvests increased to 19,000 pounds and in 1999, the last year of the fishery, 100,000 pounds were harvested, which was the fishery harvest limit at the time. All harvests occurred in salt water near the Susitna River. While no quantitative assessment of the Susitna River smelt stocks has been conducted, they would undoubtedly be measured in thousands of tons, likely even tens of thousands of tons.
At the 1998 BOF meeting, the commercial eulachon fishery was closed, but the regulation did not take effect until after the 1999 season. In 2000, as part of its draft Forage Fish Management Plan, ADF&G recommended that smelt fishing be restricted to the General Subdistrict of the Northern District. Legal gear would be dip nets only, which had the benefit of eliminating non-target species harvest. The area open to fishing was designed to target Susitna River smelt stocks. In this draft policy, ADF&G recommended that active forage fish fisheries be allowed to take place in a tightly controlled and closely monitored manner through the use of an ADF&G Commissioner's Permit, while not allowing any "new" fisheries to begin. The intent was to allow the active low-level fisheries to continue, but prevent them from growing without limit. The harvest in this fishery would be maintained at a low level. When the BOF adopted the current Forage Fish Management Plan, they chose to close the entire commercial smelt fishery.
At the 2005 BOF meetings regarding UCI finfish, the commercial fishery for eulachon was reopened, beginning with the 2005 season and falls under 5 AAC 21.505 Cook Inlet Smelt Fishery Management Plan. This fishery was allowed in salt water from May 1 to June 30 in Cook Inlet from the Chuit River to the Little Susitna River. Legal gear for the fishery was limited to a hand-operated dip net as defined in 5 AAC 39.105. The total harvest was not to exceed 100 tons of smelt. Any salmon caught during the fishery were to be released immediately and returned to the water unharmed. To participate in this fishery, a miscellaneous finfish permit was required as well as a commissioner’s permit, which could be obtained from the ADF&G office in Soldotna.
RAZOR CLAMS The commercial harvest of razor clams from UCI beaches dates back to 1919 (Appendix A9). Harvest levels have fluctuated from no fishery for as many as eight consecutive years to production in excess of half a million pounds (live weight) in 1922. The sporadic nature of the fishery has been more a function of limited market opportunities rather than limited availability of the resource. Razor clams are present in many areas of Cook Inlet, with particularly dense
4
concentrations occurring near Polly Creek on the western shore and from Clam Gulch to Ninilchik on the eastern shore (Nickerson 1975). The eastern shoreline has been set aside for sport harvest exclusively since 1959 and all commercial harvests since that time have come from the west shore, principally from the Polly Creek and Crescent River sandbar areas. A large portion of the Polly Creek beach is approved for the harvest of clams for the human food market. Within this approved area, a limit of 10% shell breakage is allowed for sale as bait clams. No overall harvest limits are in place for any area in regulation; however, ADF&G manages the commercial razor clam fishery to achieve a harvest of no more than 350,000 to 400,000 pounds annually. Virtually all of the commercial harvest has come by hand digging, although regulations prior to 1990 allowed the use of mechanical harvesters (dredges) south of Spring Point, or within a 1-mile section of the Polly Creek beach. Numerous attempts to develop feasible dredging operations were largely unsuccessful due to excessive shell breakage or the limited availability of clams in the area open to this gear. Currently, the use of mechanical harvesters is not permitted in any area of Cook Inlet.
2005 COMMERCIAL SALMON FISHERY The 2005 UCI commercial harvest of 5.6 million salmon (Appendix A6) represents the second highest annual harvest in UCI in the past 13 years and was also approximately 32% greater than the average annual harvest from 1966–2004 and 58% greater than the average annual harvest from the previous 10 years (1995–2004). The 2005 exvessel value of $31.7 million represents the highest value since 1997 and the 11th highest since 1960 (Appendix A7). The recent trend of low ground prices paid for sockeye salmon ($0.60 to $0.65/lb) saw some relief in 2005, as the average grounds price increased to approximately $0.95/lb (Appendix A11).
None of the five sockeye salmon monitored systems in UCI (Westerman and Willette 2003) fell within established goal ranges in 2005 (see table below and Appendix A10). At the 2005 UCI BOF meeting, two escapement goal ranges were modified. The Crescent River goal was changed from a range of 25,000 to 50,000 to 30,000 to 70,000 fish, while the Yentna River goal was modified from 90,000 to 160,000 to 75,000 to 180,000 fish, but only for years when the total run of sockeye salmon to the Kenai River exceeds 4 million. This was the case in 2005.
UCI SOCKEYE SALMON ESCAPEMENT a Goal Escapement Goal Range 2005 System Type Lower Upper Escapement Crescent River BEG 30,000 70,000 125,623 Fish Creek SEG 20,000 70,000 14,215 Kasilof River BEG 150,000 250,000 348,012 Kenai River Inriver 850,000 1,100,000 1,376,452 Yentna River OEG 75,000 180,000 36,921 Note: BEG = biological escapement goal; SEG = sustainable escapement goal; OEG = optimal escapement goal. a Escapement estimates do not account for any harvest above counting sites.
UCI commercial catch statistics refined to gear type, area, and date are available back to 1966. Currently, all commercially harvested salmon, whether sold or kept for personal use, are recorded on fish tickets and entered into the statewide fish ticket database. The 2005 commercial catch by species, gear type, area, and date can be found in Tables 3 through 7. Total harvest by statistical area and average catch per permit are reported in Tables 8 and 9. A summary of

5
emergency orders issued in 2005 can be found in Table 10 while a summary of fishing periods by gear type and area is summarized in Table 11.
CHINOOK SALMON The 2005 harvest of 28,171 Chinook salmon represents the highest commercial catch since 1988, and was the 4th highest since 1966 (Table 3; Appendix A1 and A6). The two fisheries where Chinook salmon are harvested in appreciable numbers occur in set gillnet fisheries in the Northern District and in the Upper Subdistrict of the Central District.
Created by the BOF in 1986, and most recently modified in 2005, the Northern District King Salmon Management Plan (5 AAC 21.366) provides direction to ADF&G regarding management of the Northern District of UCI for the commercial harvest of Chinook (king) salmon with set gillnets. The fishing season opens on the first Monday on or after May 25 and then again on the following two consecutive Monday’s. Prior to the 2005 season, fishing periods were 6 hours long, from 7:00 a.m. to 1:00 p.m. each Monday (Shields and Fox 2005). At the 2005 BOF meetings, however, fishing periods were expanded to 12 hours per period, or from 7:00 a.m. to 7:00 p.m. Each permit holder is still allowed to fish only one 35-fathom set gillnet with a minimum separation of 1,200 feet between nets, which is twice the normal separation between gear. The most productive waters for harvesting Chinook salmon occur from 1 mile south of the Theodore River to the mouth of the Susitna River; however, this area is open to fishing for the second regular Monday period only. The commercial fishery is also limited to a harvest not to exceed 12,500 Chinook salmon.
In 2005, approximately 55 commercial permit holders participated in the Northern District Chinook salmon fishery, with an estimated harvest of 3,144 fish (Table 3). This was the highest catch in this fishery since 1995, yet significantly lower that harvests prior to 1992 when registration requirements went into effect (Appendix A1). Since that time, set gillnet fishermen have had to declare prior to the fishing season which area they intend to fish (either Northern District, Upper Subdistrict, or Greater Cook Inlet) for that year, which eliminated many Upper Subdistrict fishermen from fishing the early Chinook salmon run in the Northern District. The relatively small harvests from this fishery, which don’t seem to be strongly correlated to run strength, can partly be attributed to (1) poor runs during the mid-1990’s; and (2) allowing only one fishing period to occur in the most productive fishing waters for Chinook salmon in the Northern District i.e., that area from 1 mile south of the Theodore River to the mouth of the Susitna River. The doubling of the fishing time from 6 hours to 12 hours per period beginning in 2005 may have resulted in additional Chinook salmon being harvested, but the increase was not substantial. The average number of permit holders participating in the fishery from 2000–2004, was 41, so some of the additional harvest in 2005 was due to approximately 14 more people fishing.
The estimated harvest of Chinook salmon in the Northern District for all of 2005 was approximately 3,373 – which was more than 1,000 fish greater than the previous 10-year average annual harvest and a little more than 100 fish greater than the 1966–2004 average annual harvest (Appendix A1).
In the Northern District, Chinook salmon escapements are enumerated at only one site, the Deshka River weir. In 2005, the Deshka River weir count of 37,725 Chinook salmon was the 3rd highest count since the project began in 1995 (see table below). Since 2000, the average annual Chinook salmon weir count at the Deshka River has nearly doubled the average annual count
6
from 1995–1999. In recent years, the Division of Sport Fish has liberalized the recreational fishery inseason at the Deshka River in response to the strong runs.
In 2005, nearly 79% of UCI’s Chinook salmon commercial harvest occurred in the Upper Subdistrict set gillnet fishery (Appendix A1). The estimated catch of 22,101 fish was the highest harvest ever recorded in this area. The 2004 Chinook salmon harvest from the Upper Subdistrict set gillnet fishery was also very robust (21,683), which was believed to be correlated with a very strong Kenai River late-run Chinook salmon run. The 2004 sonar estimate of late-run Chinook salmon passage of 52,375 into the Kenai River was the second highest escapement index since the initiation of the sonar program in 1987. In 2005, the sonar estimate of passage into the Kenai River was 43,240 - which ranks as the 9th highest since 1987. These estimates of passage do not include harvests and mortalities that occur inriver, which are subtracted from the sonar estimates to determine if the Biological Escapement Goal (BEG) for this system was achieved. The current BEG for Kenai River late-run Chinook salmon is 17,800 to 35,700. The BEG for this stock has changed over the years, but since 1987, the escapement goal has been achieved 18 times, been exceeded 1 time, and has never been missed under the lower end of the range.
The 2005 exvessel value for Chinook salmon in UCI was estimated at $692,000 which represented approximately 2.2% of the total exvessel value for all salmon (Appendix A7).
SOCKEYE SALMON Management of the Upper Cook Inlet sockeye salmon fishery integrates information received from a variety of programs, which together provide an inseason model of the actual return. These programs include offshore test fishing (OTF), escapement enumeration by sonar and weir, comparative analysis of historic commercial harvest and effort levels, and age composition studies.
The OTF program employs a chartered gillnet vessel fishing six fixed stations along a transect crossing Cook Inlet from Anchor Point to the Red River delta (Shields and Willette 2004). The program provides an inseason estimation of sockeye salmon run-strength by determining the fish passage rate, which is an estimate of the number of sockeye salmon that enter the district per index point (catch per unit of effort or CPUE). The cumulative CPUE curve is then compared to historic run-timing profiles so that an estimate can be made of the final CPUE, which in turn provides for an inseason estimate of the total run to UCI. In 2005, the program was conducted aboard the F/V Americanus, captained by Roland Maw.
Hydroacoustic technology is used to quantify sockeye salmon escapement into glacial rivers and was first employed in UCI in the Kenai and Kasilof Rivers in 1968 and expanded to the Susitna River in 1978 and the Crescent River in 1979 (Westerman and Willette 2003). Operations followed standard procedures in all systems in 2005. An adult salmon weir was operated by ADF&G Division of Sport Fish at Fish Creek (Knik Arm) and provided daily escapement counts for this system.
The weir on Packers Creek has not been operational since 2000 and therefore no counts have been available for this drainage since that time. However, in 2005 a remote video camera system was employed at the outlet of Packers Lake to monitor adult salmon escaping into the lake. The video camera began recording on July 16 and stopped on August 24 due to an electronic issue. Therefore, the estimate of escapement provided by this system is to be considered a minimum estimate, as an unknown number of adult salmon escaped the lake after the camera terminated
7
recording. The estimated escapement into Packers Lake in 2005 was 25,516 sockeye salmon. All 2005 UCI sockeye salmon escapement estimates can be found in Table 2, while Appendix A10 provides historical escapement data for these systems.
Inseason analyses of the age composition of sockeye salmon escaping the principle watersheds of UCI provides necessary information for estimating the stock contribution in various commercial fisheries by comparing age and size data in the escapement with that in the commercial harvest. During the 2005 fishery, approximately 33,000 sockeye salmon were examined from catch and escapement samples (T. Tobias, Commercial Fisheries Technician, ADF&G; Soldotna; personal communication January 30, 2006). The age composition of adult sockeye salmon returning to monitored systems is provided in Table 12.
The 2005 UCI preseason forecast projected a total run of 5.6 million sockeye salmon (see table on page 7). Because not all of the sport and personal use harvest data are available yet, the actual total return to each drainage can only be estimated. The 2005 total sockeye salmon run was estimated at 7.9 million fish, or nearly 42% more than projected. Of the forecast of 5.6 million sockeye salmon, approximately 1.5 million fish were allocated to escapement objectives, which left an estimated projection of 4.1 million fish available to harvest for all users. Assuming that sport and personal use harvests would be similar to that observed in 2004, the commercial catch in 2005 was projected to be 3.6 million fish; however, the final commercial sockeye salmon harvest was approximately 5.24 million fish (Table 4), or more than 41% above preseason expectations. Drifters harvested approximately 48% of the total, or 2.52 million fish, while set gillnetters caught 2.72 million fish, or 52% of the total harvest.
2005 Sockeye Salmon Forecast and Return System Forecast Actual Difference Crescent River 160,000 175,376 10% Fish Creek 27,000 22,006 -18% Kasilof River 911,000 1,261,216 38% Kenai River 3,319,000 5,657,432 70% Susitna River 432,000 145,354 -66% Minor Systems 727,000 645,754 -11% All Systems 5,576,000 7,907,138 42%
Sockeye salmon prices averaged $0.90 to $0.95 per pound for the 2005 season (Appendix A11). For the past few years prices have not changed dramatically from the beginning to the end of the season. The total 2005 exvessel value for UCI sockeye salmon was $30.1 million, which was 95% of the total UCI exvessel value for salmon (Appendix A7). This represents the highest exvessel value for this fishery since 1997 and the 8th highest since 1960.
Table 18 summarizes sockeye salmon harvests from all sources in UCI since 1996. In 2005, the estimated harvest from commercial, sport, personal use, and subsistence/educational fisheries was 6.0 million fish, which was the largest harvest during the past 10 years. The personal use fisheries harvest of sockeye salmon has grown from an estimated 146,000 fish in 1996 to nearly 370,000 fish in 2005. More than 70% of the sockeye salmon personal use harvest comes from residents of Anchorage and the Matanuska/Susitna valley areas (Reimer and Sigurdsson 2004).

8
The first commercial sockeye salmon fishery to open in UCI in 2005 was the Big River fishery. The Big River Sockeye Salmon Management Plan (5 AAC 21.368), which was adopted in 1989, allows for a small set gillnet fishery in June in the northwest corner of the Central District. However, at the 2005 BOF meetings, this plan was modified to include as legal waters that area along the west side of Kalgin Island. Between June 1 and June 24, fishing is allowed each Monday, Wednesday, and Friday from 7:00 a.m. to 7:00 p.m. Permit holders are limited to a single 35-fathom gillnet and the minimum distance between nets is 1,800 feet, which is three times the normal separation. Targeting an early run of sockeye salmon returning to Big River, this fishery also encounters Chinook salmon migrating through the area. The management plan for this fishery limits the harvest of Chinook salmon to no more than 1,000 fish per year. In recent years, however, harvests have been well below that level. The 2005 fishery began on June 1 and yielded a total catch of approximately 3,500 sockeye salmon and a Chinook salmon harvest of 531 (Tables 3 and 4). Approximately 84% of the Chinook salmon and 85% of the sockeye salmon were harvested in the Kalgin Island west-side waters, which is statistical area 246-10 (Figure 3). Approximately 20 permit holders participated in the fishery, which was up from recent years, but less than the peak level of effort of 33 permit holders.
The next commercial fishery to open was the set gillnet fishery in the Western Subdistrict of the Central District. Harvesting sockeye salmon bound primarily for the Crescent River, this fishery opens on the first Monday or Thursday on or after June 16th. The regular fishing schedule consists of two 12-hour weekly fishing periods throughout the season, unless modified by emergency order. Commercial harvest data and escapement levels into Crescent River in 2005 indicated early in the season that the lower end of the escapement goal would be met and continuous fishing was allowed in the set gillnet fishery in the Western Subdistrict south of Redoubt Point from June 27 until August 5 (Table 10). The harvest from the Western Subdistrict set gillnet fishery in 2005 was approximately 50,000 sockeye salmon (Table 4). However, relatively few permit holders participated in the fishery, even with all the extra fishing time that was allowed. Therefore, for the 7th straight year, the upper end of the Crescent River sockeye salmon BEG was exceeded; in 2005, goal was surpassed by more than 55,000 fish (Appendix A10), with the final escapement into Crescent Lake estimated at nearly 126,000 sockeye salmon.
In January 2005, the BOF again made substantial changes to the management plans that direct how the commercial fisheries in Upper Subdistrict set gillnet fishery and the Central District drift gillnet fishery are governed. Since 2002, the early part of the drift and set gillnet season was managed under the Kasilof River Salmon Management Plan (KRSMP) (5 AAC 21.365). To provide clarity in what can sometimes be a confusing management scenario, in 2005 the BOF established a new management plan for the drift gillnet fishery, namely the Central District Drift Gillnet Fishery Management Plan (CDDGFMP) (5 AAC 21.353). In both the KRSMP and CDDGFMP, the BOF provided for earlier opening dates, largely in response to strong Kasilof River sockeye salmon runs the past 8 years. Under the new plan, the drift gillnet fishery opened on the third Monday in June, or June 19, whichever was later, and the set gillnet fishery in the Kasilof Section of the Upper Subdistrict opened beginning on June 25, unless ADF&G had estimated that 50,000 sockeye salmon were in the Kasilof River before June 25, at which time the fishery could be opened immediately by emergency order, but not before June 20 (5 AAC 21.310 (b)(2)(C)(i)).

9
Per the KRSMP, from June 25 through July 7 the set gillnet fishery in the Kasilof Section is to be limited to no more than 48-hours of additional fishing time per week (Sunday through Saturday) through emergency order and also is required to be closed for 48 consecutive hours per week. Beginning July 8, the Kasilof Section is managed in combination with the Kenai and East Forelands Sections per the Kenai River Late-Run Sockeye Salmon Management Plan (KRLSSMP) (5 AAC 21.360). Until an assessment of the Kenai River sockeye salmon run strength has been made, which is traditionally on or after July 20, the Upper Subdistrict set gillnet fishery is managed based on the size of the run that was projected in the preseason forecast. In essence, there are three basic options available for the management of this fishery. First, if the Kenai River sockeye salmon run is projected to be less than two million fish, there may be no more than 24-hours of additional fishing time per week in the Upper Subdistrict set gillnet fishery. If the Kenai and East Forelands Sections are not open during regular or additional openings, ADF&G may limit regular and additional periods in the Kasilof Section to an area within ½ mile of the shoreline. There are no mandatory window closures on Kenai River sockeye salmon runs of less than two million fish, but if ADF&G projects that the Kasilof River optimum escapement goal of 300,000 may be exceeded, an additional 24 hours of fishing time per week may be allowed within ½ mile of the shoreline in the Kasilof Section after July 15. The second management option is for Kenai River runs of between two and four million sockeye salmon. In this scenario, the Upper Subdistrict set gillnet fishery will fish regular weekly fishing periods, with no more than 51 additional fishing hours allowed per management week. In addition, the fishery will be closed for one continuous 36-hour period per week beginning between 7:00 p.m. Thursday and 7:00 a.m. Friday, and for an additional 24-hour period during the same management week. Finally, for Kenai River sockeye salmon runs exceeding four million fish, ADF&G may allow up to 84-hours of additional fishing time per week in addition to regular fishing periods, but the fishery will also be closed for one continuous 36-hour period per week beginning between 7:00 p.m. Thursday and 7:00 a.m. Friday. Kenai River sockeye salmon escapement goals also vary according to the size of the run; for runs less than two million fish, the inriver goal range was changed in 2005 from 600,000 to 850,000 fish to 650,000 to 850,000 fish; at run strengths between two and four million fish, the goal is 750,000 to 950,000; and for Kenai River runs greater than four million, the inriver goal is 850,000 to 1.1 million sockeye salmon.
In 2005, the Kasilof Section opened to set gillnet fishing on Monday, June 20, via Emergency Order No. 2 (Table 10) as provided for in the newly modified KRSMP. At midnight on June 19, sockeye salmon escapement into the Kasilof River had surpassed 57,000 fish (Table 2), thus initiating the early opening of the fishery. The CDDGFMP also stipulated that the drift gillnet fishery should open on June 20 in 2005. Emergency Orders No. 3 and 4 extended set gillnetting in the Kasilof Section from 8 a.m. on Tuesday, June 21, until the start of the regular period on Thursday, June 23. In addition, a 1-hour extension to the regular period on June 23 was announced. During this time period, drift gillnetting was also allowed in the Kasilof Section from 8:00 a.m. until 12:00 midnight on June 21; from 5:00 a.m. until 12:00 midnight on June 22; and from 5:00 a.m until 7:00 a.m. and 7:00 p.m. until 8:00 p.m. on June 23. The set gillnet fishery was then closed for 38 consecutive hours, from 8:00 pm on Thursday, June 23, until 10:00 a.m. on Saturday, June 25, at which time, Emergency Order No. 5 opened the set and drift gillnet fishery from 10:00 a.m. until 10:00 p.m. This 12-hour fishing period on June 25 was beyond the 48-hours of additional fishing time that was provided for in the KRSMP, but ADF&G commissioner Campbell granted this additional fishing time after meeting with area and

10
regional staff. At this meeting, the conclusion was that the Kasilof River sockeye salmon escapement level was significantly ahead of where it needed to be at that time of year if the optimal escapement goal (OEG) for this system was to be achieved. The 48-hour window period was also reduced to 38-hours. For the management week of June 19–25, the set gillnet fishery harvested more than 165,000 sockeye salmon, while the drift gillnet fishery caught approximately 14,000 fish (Table 4). The number of sockeye salmon harvested during the 12-hour period granted outside of the management plans was approximately 37,000 in the set gillnet fishery. No mandated window periods or emergency order limitations apply to the drift gillnet fishery.
The management week of June 26 to July 2 began with Emergency Order No. 6 opening set and drift gillnetting in the Kasilof Section on June 26 for 15 hours. The regular 12-hour period was fished on June 27 and was extended via Emergency Order No. 8 for 5 hours. Also on June 27, fishing with set gillnets in the Western Subdistrict south of Redoubt Point was opened 24-hours a day, 7-days a week until further notice. This was in response to the fact that the sockeye salmon escapement level was already well ahead of pace for so early in the run. From midnight on June 27 until 4:00 a.m. on June 29 (28 hours), there was no fishing in the Upper Subdistrict until emergency orders no. 9 and 10 opened set gillnetting for 27 hours prior to the regular 12-hour fishing period on Thursday, July 30. Drift gillnetting was also open during most of these same hours, except for the period from 12:00 midnight until 5:00 a.m., because of darkness and the associated difficulties of enforcement of the fishery during this time. Much like the previous management week, the commissioner and area and regional staff again met to discuss the Kasilof River escapement level and opted for allowing more hours of fishing with set gillnets than were provided for in the KRSMP. Emergency Order No. 12 opened set and drift gillnetting on Saturday, July 2, for 13 hours, all of which were beyond the 48-hours of additional fishing time provided for that management week in the plan. The 48-hour closed window period was also reduced to 36 hours. For the management week, the set gillnet fishery harvested 168,000 sockeye salmon, while drift gillnetters caught 57,000 fish, with 51,000 coming from district-wide regular periods. For the extra fishing period provided for beyond the limitation of the management plan, approximately 31,000 sockeye salmon were harvested by set gillnets in the Kasilof Section. As of midnight on July 2, the Kasilof River sockeye salmon escapement had reached an estimated 146,000 fish, or in other words, the lower end of the OEG had already nearly been achieved with over a month to go in the season.
The next management week (July 3–9) of the 2005 season began with a 15-hour fishing period on Sunday, July 3, in the Kasilof Section via Emergency Order No. 13. Both gear types fished their regular 12-hour period on Monday, July 4, and were also both provided a 3-hour extension to the period. A 36-hour window period was then implemented in the Kasilof Section from 10:00 p.m. on July 4 until 10:00 a.m. on July 6. However, during this time period the Kasilof River Special Harvest Area (KRSHA) was open from 4:00 p.m. on Tuesday, July 5, until 7:00 a.m. on Wednesday, July 6. In the provisions of the KRSMP, the commissioner may, by emergency order, open the KRSHA to set and drift gillnetting when it is projected that the Kasilof River sockeye salmon escapement will exceed 275,000 fish. The KRSHA is defined as those waters within 1½ miles of the navigational light located on the south bank of the Kasilof River, and extends approximately 1 mile south and 1 mile north of the river. Set gillnets may be operated only within 600 feet of the mean high tide mark, and a permit holder may not operate more than one 35-fathom set gillnet. Drift gillnets may not be operated within 600 feet of the mean high tide mark and no more than 50 fathoms of drift gillnet may be used in this area.
11
Fishing time allowed in the KRSHA does not count toward the maximum number of hours provided for in any management plan, nor does it violate the closed window restrictions in the set gillnet fisheries. With more than 150,000 sockeye salmon having escaped the Kasilof River by July 3, the projection that 275,000 fish would ultimately escape was easily made, and thus the KRSHA was opened. Emergency Order No. 16 opened the Kasilof Section from 10:00 am on Wednesday, July 6, until the start of the regular period on July 7. Drifting was also open during this time period in the Kasilof Section, except from 12:00 midnight until 5:00 a.m. on July 7. Both gear types fished the regular period on July 7, at which time a 36-hour window was again implemented in the Kasilof Section. During this window period the KRSHA was opened for 27 hours, from 5:00 a.m. on July 8 until 8:00 a.m. on Saturday, July 9. The Kasilof Section was reopened for 18-hours of fishing to both set and drift gillnetting on July 9 via Emergency Order No. 18. Of these 18-hours, 9 were allowed for within the KRSMP and 9 were beyond the 48-hour limitation. Also, instead of a single 48-hour closed window period, two 36-hour windows were implemented; however, not fulfilling the 48-hour window was outside the plan and therefore had to be authorized by the commissioner, which he did. During this management week, the sockeye salmon harvest by set gillnetters was as follows: 147,000 in the Kasilof Section and 23,000 in the KRSHA for a total of 170,000 fish. Drift gillnetters harvested approximately 5,000 fish in the Kasilof Section, 176,000 in district-wide openers and 12,000 from the KRSHA, for a total of 193,000 fish. Because 9 hours of the 18 fished on Saturday, July 9, were outside the plans, one-half of the harvest for this period was estimated to be fish harvested outside the plans. For set gillnets, this amounted to approximately 17,000 fish. By midnight of July 9, the Kasilof River sockeye salmon escapement had reached 187,000 fish and after 9 days of counting in the Kenai River, the passage there was estimated to be 107,000 fish. The Yentna River sonar counter had only been counting a couple of days by this time, but the Crescent River sonar estimate of passage had reached 37,000 on a goal range of 30,000 to 70,000 fish.
According to the KRSMP, beginning July 8, the set gillnet fishery in the Kasilof Section shall be managed as specified in 5 AAC 21.360(c) Kenai River Late-Run Sockeye Salmon Management Plan (KRLSSMP). So, for the management week of July 10–16, the Kenai, Kasilof, and East Forelands Sections (the entire Upper Subdistrict) fell under management of the KRLSSMP, except for provisions in the KRSMP that were specific to the Kasilof Section. For Kenai River sockeye salmon runs of 2–4 million fish, which is what the 2005 forecast projected, there were to be two window periods in the Upper Subdistrict set gillnet fishery. One was to be 24-hours long and could be implemented as a discretionary window as far as when it went into effect and the second one, 36-hours in duration, was prescribed to begin between 7:00 p.m. on Thursdays and 7:00 a.m. on Fridays. Therefore, in order to fulfill the 24-hour discretionary window, the set gillnet fishery was closed from midnight on Saturday, July 9 until the start of the regular fishing period on Monday, July 11, which actually was 31 hours. During this window period, Emergency Order No. 19 opened the KRSHA from 6:00 a.m. until 12:00 midnight, or for 18 hours. The Kenai and East Forelands Sections were open for the first time in 2005 during the regular 12-hour period on Monday, July 11, marking the first time in the 2005 season that all areas and gear types were open for commercial fishing in UCI. The BOF had also made many changes at their 2005 meeting regarding drift gillnetting in UCI. For the period of July 9 to July 15, the CDDGFMP stated that fishing with drift gillnets during this time period was restricted to the Kenai and Kasilof Sections and Drift Gillnet Area 1, which is that area of the Central District south of the latitude of the southern tip of Kalgin Island (Figure 4). The regular period was

12
extended via emergency order for 4 hours, or until 11:00 p.m., for drift gillnets in the Kenai and Kasilof Sections and for set gillnets in the Upper Subdistrict. Set gillnetting was open in the Upper Subdistrict for 15 hours on both July 12 and July 13, while drift gillnetting was open during the same hours in the full corridor, or the Kenai and Kasilof Sections. All areas and gear types fished the regular 12-hour period on Thursday, July 14, with drifters again fishing drift area 1. The KRSHA was open to set and drift gillnetting from 6:00 a.m. until 5:00 p.m. on Friday, July 15, as the Kasilof River sockeye salmon escapement was still progressing at a rate that would likely result in the upper range of the OEG for this system being exceeded. Also on Friday, July 15, the commissioner allowed for 9 hours of set gillnetting in the Kasilof Section only, which ended up being time outside the 51 hours of fishing time allowed for in the KRLSSMP. Drift gillnetting was also opened in the Kasilof Section during this time period. Then, on Saturday, July 16, set gillnetting in the entire Upper Subdistrict was opened from 7:00 a.m. until 12:00 midnight, or 17 hours. Drifting was open in the Kenai and Kasilof sections for 16 hours on July 16. At the conclusion of a very busy management week, sockeye salmon cumulative passage rate estimates (escapement) were as follows: Kenai River: 318,000; Kasilof River: 238,000; Crescent River: 59,000, and Yentna River: 5,000. For the week, the estimated sockeye salmon harvest in the Upper Subdistrict was 408,000 fish, while drift gillnetters harvested 123,000 in the corridor and 420,000 in district wide openers for a total of 543,000. In the KRSHA, set gillnetters took an additional 13,000 sockeye salmon, while drift gillnetters harvested 4,000 fish. During the 9-hour fishing period on July 15, which was time granted outside the management plan, the estimated set gillnet harvest was 17,000 sockeye salmon. For the season, the estimated UCI total sockeye salmon harvest from all areas and gear types through July 15 was 1.69 million.
The next management week, July 17–23, began like the previous week, that is, there was a 31-hour window in the set gillnet fishery in the Upper Subdistrict from midnight on July 16 until the start of the regular period at 7:00 a.m. on Monday, July 18. Management of the Upper Subdistrict set gillnet fishery was still operating under the guidelines of a Kenai River sockeye salmon run of 2–4 million, so there could be no more than 51-hours of additional fishing time per week, as well as the required implementation of the two window periods described earlier. This is exactly how the set gillnet fishery was managed during this week. The 51-hours of additional fishing time were divided up as follows: 5-hours on July 18; 15 hours on July 19; 14 hours on July 20; 2 hours before the regular period on July 21; and 15 hours on Saturday, July 23, which ended the management week (see Table 10, Emergency Order No.’s 30, 31, 32, 33, and 36). The CDDGFMP, which had been created by the BOF at their 2005 meetings, stated that from July 16–31, for run strengths between two and four million fish, that drift gillnet fishing shall be restricted for two regular 12-hour fishing periods to the Kenai and Kasilof Sections and Drift Gillnet Areas 1 and 2 (Figure 4). For the regular drift gillnet period on July 18, drift gillnetting was restricted to these areas, thereby fulfilling one of the two restricted periods. However, Emergency Order No. 33 restricted drift gillnetting for the regular period on Thursday, July 21, to the Kenai and Kasilof Sections and to that portion of the Central District south of the latitude of the Kalgin buoy (“the can”). This was even more restrictive than required in the management plan, but was done to reduce the exploitation rate on Susitna River sockeye salmon, as the Yentna River sonar estimate of passage was lagging. Emergency Order No. 33 also closed the entire Northern District to commercial salmon fishing on July 21 in response to the depressed Yentna River escapement estimates. Through midnight of July 20, the estimate of sockeye salmon passage at the Yentna River was only 9,000 fish. However both the Kenai and Kasilof

13
River sockeye salmon runs looked very strong. In response to elevated Kasilof River sockeye salmon escapements, the KRSHA was opened twice to set and drift gillnetting during this management week; for 22-hours beginning at 7:00 a.m. on Sunday, July 17, and for 24-hours beginning at 11:00 p.m. on Thursday, July 21. Finally, on Friday, July 22, drift gillnetting was opened in the Kenai and Kasilof Sections while the set gillnet fishery was in the middle of its 36-hour closed window, as prescribed by management plan. The management week ended with cumulative sockeye salmon passage rate estimates as follows: Kenai River – 671,000; Kasilof River – 273,000; Crescent River – 82,000; and Yentna River – 12,000 (Table 2). For the week, the Upper Subdistrict set gillnet fishery harvested more than 500,000 sockeye salmon, while the drift gillnet fishery caught nearly 646,000 fish, for a total of more than 1 million fish combined. There were no fishing hours allowed beyond the limitations of management plans. Of the total harvest just reported, approximately 33,000 came from the KRSHA. The cumulative UCI sockeye salmon harvest through July 23 had now reached approximately 3.08 million fish, with 1.56 million coming from the drift gillnet fishery and 1.52 million from set gillnetters.
An official inseason assessment of the strength of the 2005 sockeye salmon run was made during the management week of July 24–30. On July 26, the UCI commercial fisheries staff estimated that the total UCI sockeye salmon run would likely range between 6.7 and 8.2 million fish. Of that total, it was estimated that the Kenai River component would range between 4.5 and 5.6 million fish. These estimates were based on OTF data (Shields and Willette 2004), with the five best fit-estimates of the current year’s data all tracking runs that were 1 to 4 days late relative to the July 15 mean date of return at the test fish transect. The 2005 run actually ended up being classified as a 6-day late run, or the latest that had ever been observed since the test fish project began in 1979. Because sport fish harvest estimates were not available yet for the 2005 season, the total run of sockeye salmon to UCI in 2005 can only be estimated. However, assuming that sport fish harvests were similar to that realized in 2004, the estimated total run of sockeye salmon to UCI in 2005 was 7.9 million fish, with 5.7 million being of Kenai River origin. Therefore, the final Kenai River run was very close to the top end of the estimated range made inseason using test fish data.
The management week of July 24–30 started out operating under the management plan guidelines of a Kenai River sockeye salmon run of two to four million, but when the official projection on July 26 estimated that the run would likely be greater than four million fish, a new set of guidelines governed the fishery. The total number of emergency order hours now available each management week increased to 84, while the discretionary 24-hour window was dropped, leaving only the 36-hour prescriptive window to be implemented. The inriver sockeye salmon escapement goal range for the Kenai River also increased to 850,000 to 1.1 million, while the Yentna River goal for Kenai River runs greater than 4 million fish changed to 75,000 to 180,000. For the management week, all 84-hours of emergency order authority was utilized in the Upper Subdistrict set gillnet fishery as follows: 15 hours on Monday, July 24; 4 hours on July 25; 17 hours on July 26; 24 hours on July 27; 12 hours on July 28; and 12 hours on July 30 (see Table 10, Emergency Order No. 37, 39, 40, 41, 42, 44, and 46). The 36-hour window period was implemented from midnight on Thursday, July 28 until 12:00 noon on July 30. In response to continued lagging Yentna River sockeye salmon escapement concerns, for the two regular 12-hour fishing periods on Monday, July 25, and Thursday, July 29, the entire Northern District set gillnet fishery was closed, while the drift gillnet fishery in the Central District was restricted. On Monday, July 25, drifting was limited to south of the latitude of the Blanchard Line and on Thursday, July 28, drift gillnetting was restricted to south of a line extending from Collier’s dock

14
to the northwest point on Kalgin Island and then westward to the western shore. Because sockeye salmon estimates of passage continued to be strong in the Kenai and Kasilof Rivers, beginning on Tuesday, July 26, the outside boundary of the drift gillnet corridor (Kenai and Kasilof Sections) was expanded in order to increase harvest rates of Kenai and Kasilof River sockeye salmon stocks (see Table 10, Emergency Order No. 42). The rationale for the decisions involving where to fish the drift fleet was an attempt to reduce exploitation on northern-bound stocks while continuing to harvest sockeye salmon bound for the Kenai and Kasilof Rivers. Drift gillnetting was opened on Saturday, July 30, for 12-hours in the same area that was opened to drifting on Thursday’s restricted regular period. At 5:00 a.m. on Friday, July 29, the KRSHA was opened to set and drift gillnetting for 24-hours, while drift gillnetting was also opened in an expanded corridor for 18 hours. The week of July 24–30 presented a difficult management scenario, in that sockeye salmon stocks are mixed to an unknown degree in the Central District. However, because the Yentna River sockeye salmon run is earlier in timing than the Kenai River run, most of the return is believed to have transited the Central District by late-July. Therefore, limiting drift gillnetters from fishing the northern part of the Central District was warranted. By the end of the week, Saturday, July 30, sockeye salmon escapement estimates in the four major river systems were: Kenai River-810,000; Kasilof River-306,000; Crescent River-106,000; and Yentna River-9,500 (Table 2). The Kenai River was quickly approaching the bottom end of its escapement goal range, while both the Kasilof and Crescent River goal ranges had already been exceeded, and finally, the Yentna River escapement was lagging far below the bottom end of its goal range. Harvest statistics through July 30 revealed that the total UCI sockeye salmon harvest had now reached 4.33 million (Table 4). For the management week, Upper Subdistrict set gillnetters harvested 489,000 sockeye salmon, while drifters caught an additional 737,000 fish. July 30 marked the last day the KRSHA was fished for the year; the table below shows that approximately 748 Chinook salmon and 97,000 sockeye salmon were taken from this area in 2005.
Date Set Drift Set Drift7/5 14 4 3,985 1,6117/6 36 4 4,972 1,3727/8 76 28 11,720 2,6977/9 13 55 2,331 6,318
7/10 40 8 6,523 1,7217/15 60 13 6,215 2,3997/17 109 6 11,743 1,7817/18 18 1,1317/22 91 1 16,559 1,3937/29 141 10,9757/30 31 1,753Total 629 119 77,907 19,292
Sockeye SalmonChinook Salmon2005 Kasilof River Special Harvest Area

15
The management week of July 31 to August 6 presented the same challenges as the week before, that is, how to harvest surplus sockeye salmon swimming to the Kenai and Kasilof Rivers while reducing as much as possible the harvest of sockeye salmon bound for the Susitna River drainage. The KRLRSSMP allowed up to 84-hours of additional fishing beyond the two 12-hour regular periods in the Upper Subdistrict set gillnet fishery, while requiring one 36-hour prescriptive no-fishing window. For the week, 79 of the 84 hours were utilized (see Table 10, emergency orders no. 47, 48, 49, 51, 52, and 55) and the 36-hour window was implemented from 7:00 p.m. on Thursday, August 4, until 7:00 a.m. on Saturday, August 6. In addition, there was a 29-hour period from midnight on Monday, August 1, until 5:00 a.m. on Wednesday, August 3, where the set gillnet fishery was closed. In response to continued lagging sockeye salmon escapement levels in the Yentna River, the regular fishing periods on Monday, August 1, and Thursday, August 4, in the Northern District set gillnet fishery were again closed. This meant that the last five regular periods in a row were closed in the Northern District, which marked the most restrictive actions that had ever been taken in this fishery. Drift gillnetting in the Central District was also restricted on Monday’s regular period to south of a line from Collier’s dock to the northwest point on Kalgin Island and then extending westward to the western shore. However, drifting was allowed inlet-wide on Thursday, August 4, as previous year’s data indicated that there should be very few northern-bound sockeye salmon in the Central District this late in the season. The Kenai and Kasilof Sections were also expanded for drift gillnetting during the management week for the following periods: 18-hours on July 31, 9-hours on August 2 (while the set gillnet fishery was closed), 18-hours on both August 3 and 4, and 4-hours on August 6. Emergency Order No. 54 returned fishing with set gillnets in the Western Subdistrict south of Redoubt Pt. to their regular fishing schedule effective at midnight on Friday, August 5. This was due to the fact that the sockeye salmon run was nearing completion in this system. For the management week, the Upper Subdistrict set gillnet fishery harvested approximately 363,000 sockeye salmon, while drifters captured 167,000. The cumulative harvest total from all of UCI was now estimated at 4.9 million fish. Estimates of sockeye salmon passage at the four sites monitored with sonar had now reached 977,000 (Kenai River), 325,000 (Kasilof River), 122,000 (Crescent River), and 31,000 (Yentna River). In essence, the Kasilof and Crescent Rivers had already exceeded their recommended escapement goal ranges, the Kenai River was at the midpoint of its target goal, and the Yentna River was approximately 45,000 fish short of achieving the lower end of the escapement goal range for this system.
The final management week for the 2005 Upper Subdistrict set gillnet fishery was August 7 to 13. Because the season ended for set gillnetting in this area on Wednesday, August 10, the 36-hour mandatory window for the management week was met after the fishery closed. All 84-hours of additional fishing time allowed in the management plan for the set gillnet fishery was used from 12:00 midnight on Saturday, August 6 through midnight on Wednesday, August 10 (Table 10, Emergency Order No. 56–58). The regular 12-hour period was fished on Monday, August 8. Drift gillnetting was fished in an expanded corridor for 18-hours on August 7, 4-hours on August 8, and 18-hours on August 9 and 10. At the 2005 BOF meetings, the drift gillnet season was expanded beyond the August 10th closure. Specifically, for all regular periods after August 10, unless closed or modified by emergency order, the drift gillnet fleet was allowed to fish in two areas of UCI, named drift gillnet area three and four (Figure 5). Area three consisted of those waters within 1 mile of mean, low, low water on the west side of Cook Inlet south of the West Forelands. Area four was included those waters in the southwest corner of the Central District which make up drift gillnet statistical area 245-90. In 2005, drift areas three and four

16
were opened after August 10 for the remainder of the year; however, the last reported delivery from either area was on September 5 (Table 5). Participation by drifters in these fishing areas was low, likely a result of the long travel distances to the fishing grounds combined with high fuel prices.
Three additional 12-hr fishing periods beyond the two regular 12-hr periods each week were allowed in the Kalgin Island Subdistrict in 2005. These extra periods were provided for in the Packers Creek Sockeye Salmon Management Plan (5 AAC 21.370) and were justified by strong sockeye salmon catches around the island, as well as indication by a remote camera system located at the outlet of Packers Lake that sufficient numbers of sockeye salmon were escaping into the lake. The estimate of sockeye salmon escapement into Packers Lake in 2005 was more than 25,000 fish and was an incomplete count. The estimated sockeye salmon harvest in the Kalgin Island Subdistrict in 2005 was more than 105,000 fish.
All other areas and gear types remained open for regular 12-hr Monday and Thursday fishing periods for the rest of the season. The last reported commercial fishing activity in any area of UCI in 2005 was September 15.
The final estimates of sockeye salmon passage into the major systems of Upper Cook Inlet are summarized in the table below, as well as Tables 2 and A10. As can be seen, none of the escapement goal ranges were achieved, with final passage rate estimates exceeding goal ranges in the Kenai, Kasilof, and Crescent Rivers, while falling short in the Yentna River and Fish Creek.
2005 Sockeye Salmon Passage Rate Estimates System Passage Goal Range Kenai River 1,376,452 850,000–1,100,000 Kasilof River 348,012 150,000–300,000 Crescent River 125,623 30,000–70,000 Yentna River 36,921 75,000–180,000 Fish Creek 14,215 20,000–70,000
The poor sockeye salmon escapement into the Yentna River occurred even while commercial fisheries were restricted more than ever before in an effort to decrease exploitation rates on this stock. For more information on the status of Susitna River sockeye salmon, please see the Stock Status and Outlook section later in this report.
The BOF authorized the use of monofilament mesh gillnet for fishermen in UCI for 2005
(5 AAC 21.331(h)). Set gillnetters were allowed no more than 35 fathoms of monofilament mesh in their total allotment of 105 fathoms of allowable gear per permit. Moreover, no more than one net per permit could have monofilament web. Drift gillnetters could also fish up to one third of their gear as monofilament web, but could divide up the 50 fathoms into different segments in their maximum of 150 fathoms of total gear. Any fishermen wishing to fish monofilament had to register their intent to do so with ADF&G prior to fishing. Approximately 50 of the 489 set gillnet permit holders and 156 of 473 drift gillnet permit holders registered their intent to fish monofilament gear for the 2005 season. The feedback from these trials was mixed. Some fishermen reported significant unhappiness with the gear while others thought it was more

17
efficient than their regular multi-strand mesh. The current monofilament regulation sunsets at the end of the 2007 commercial salmon fishing season.
COHO SALMON The 2005 commercial coho salmon harvest of approximately 225,000 fish (Appendix A3) was just a little less the previous 10-yr average annual harvest of 254,000 fish, but approximately 100,000 fish less than the 1966–2004 average annual harvest. Commercial coho salmon harvests in UCI during the 1980’s and early 1990’s were much higher than the long term average due to good coho production, and also due to strong sockeye salmon runs to Upper Cook Inlet, which resulted in additional fishing time, especially in the Central District, which resulted in increased coho salmon harvests too. Recent coho salmon harvest statistics, however, may or may not be a true indication of run strength, largely due to regulatory changes that were made to reduce coho salmon commercial harvests. For example, since 1996, BOF regulations have reduced fishing time for the drift fleet in the Central District and eliminated additional fishing time directed at coho and sockeye salmon surpluses in the Northern District and Kalgin Island Subdistricts. A special BOF meeting in 2000 further restricted both sport and commercial fisheries targeting coho salmon. From 2000–2004, the commercial set gillnet fishery in the Upper Subdistrict was closed no later than August 7, and no more than one emergency order, not to exceed 24 hours in duration, was allowed during the month of August. All of these actions resulted in marked reductions in commercial coho salmon harvests. Therefore, gauging the strength or weakness of coho salmon stocks based on commercial harvest statistics may be misleading. Interestingly, during the same time period (2000–2004) that BOF restrictions were implemented to conserve coho salmon, UCI experienced some of the largest coho salmon runs on record (based on escapement estimates and increased recreational harvests). Therefore, at the 2005 BOF meetings, the board relaxed the August restrictions to the Upper Subdistrict set gillnet fishery and Central District drift fishery. Both fisheries’ closing dates were changed to no later than August 10, with the set gillnet fishery managed under the same set of weekly guidelines in August that were applicable in July. Drift gillnetters were allowed to fish beyond August 10, but only in areas 3 and 4 (Figure 5) for Monday and Thursday 12-hr periods. The estimated coho salmon harvest by drift gillnetters after August 10 was approximately 11,000. The August 8–10 coho salmon harvest in the Upper Subdistrict set gillnet fishery, which was open all 72-hours during this time period, was approximately 4,300.
The exvessel value of coho salmon from the UCI commercial fishery was approximately $709,000 or 2.2% of the total exvessel value (Appendix A7.). The average price paid for coho salmon was estimated at $0.50/lb (Table A11), which was the highest price paid since 1994.
PINK SALMON Pink salmon runs in UCI are even-year dominant, with odd-year returns usually much smaller in size. In 2005, approximately 49,000 pink salmon were harvested in the commercial fishery, which wasn’t significantly lower that the previous 5-odd years average of 68,000 or the previous 10-odd years average of 72,000 fish. Again, gauging pink salmon run strength based on commercial harvest rates can be misleading. This is especially true in recent history, due to the low prices that pink salmon have brought commercial fishermen as well as restrictions placed on the Upper Subdistrict set gillnet fishery in August, which harvest the large run of pink salmon bound for the Kenai River.
18
The average price paid for pink salmon in 2005 was approximately $0.08 per pound (Appendix A11), resulting in an exvessel value for this species of only $13,000 or less than 0.1% of the total exvessel value (Appendix A7).
CHUM SALMON As a result of the floods of 1986, chum salmon production in much of southcentral Alaska was adversely affected, with commercial harvests since that time well below the long-term average annual harvest of 510,000 (Appendix A5). Beginning in 1995, however, improvements in chum salmon runs were observed, but the 2005 commercial harvest of approximately 70,000 fish was more than 100,000 fish less than the average annual harvest from the previous 10 years. As noted previously though, comparing recent harvest statistics to historical averages for the purpose of making assessments of stock strength can be misleading because of how much differently the commercial fishery is now prosecuted. Numerous drift gillnet fishing periods were restricted in 2005 as well as five consecutive fishing periods being closed in the Northern District to conserve sockeye salmon, which represented the most restrictive actions ever taken in this fishery. Although these measures were taken to conserve northern-bound sockeye salmon, they also resulted in fewer chum salmon being harvested. The recent year’s low price paid for chum salmon (Appendix A11) has also caused drift gillnetters to avoid this stock as much as possible, especially when sockeye salmon are abundant in different areas than chum salmon.
The 2005 exvessel value for chum salmon was approximately $101,000, which was just 0.3% of the overall exvessel value of the 2005 fishery (Appendix A7).
PRICE, AVERAGE WEIGHT AND PARTICIPATION In general, prices paid to fishermen for their catch in 2005 were more than they had received during the previous 5-year period (Appendix A11). Other than the grounds price received for Chinook salmon, which were about the same in 2005 as for the previous decade, all other species experienced increases from recent years, with the average price paid for sockeye salmon of $1.00 being the highest price since 1999. Chinook, coho, pink and chum salmon were sold for $1.00, $0.50, $0.08 and $0.20 per pound, respectively. It should be noted that some fishermen sold a significant portion of their Chinook salmon catches to smaller processors who offered higher prices by catering to niche markets. Average prices reported here are generated from inseason grounds prices and do not reflect any postseason adjustments. It is unknown whether this occurred to any significant degree for fish harvested in 2005.
As determined from fish ticket calculations, the average weight by species in 2005 did not vary significantly from the 1969–2004 average (Table 13; Appendix A12), although all five species average weights for 2005 were slightly less than the 1969–2004 average. The largest variation occurred in pink salmon average weights, with the 2005 average of 3.3 pounds being approximately 8% less than the long-term average of 3.6 pounds. The average weight for Chinook, sockeye, coho and chum salmon were 24.6, 6.1, 6.3, and 7.2 pounds, respectively.
The Commercial Fisheries Entry Commission (CFEC) reported that in 2005 there were 571 active drift gillnet permits for the Cook Inlet area, with 71% issued to Alaskan residents (Appendix A13). Of this total, 472 reported catches for 2005 (Table 9). CFEC also reported that there were 739 active set gillnet permits in Cook Inlet, with 84% being issued to Alaskan residents. From this total, 488 reported fishing in 2005. A total of 37 firms purchased Upper

19
Cook Inlet fishery products during 2005, while 26 catcher/seller permits reported selling fish from their sites. A list of the major fishery processors is identified in Table 14.
SALMON ENHANCEMENT Salmon enhancement through hatchery stocking has been a part of UCI salmon production since the early 1970's. Presently, only a single commercially-oriented hatchery remains operational in UCI, that being the Trail Lakes facility, which is operated by Cook Inlet Aquaculture Association (CIAA) and is located in the upper Kenai River drainage near Moose Pass. Trail Lakes hatchery was originally built and operated by the ADFG’s FRED Division, but was subsequently leased to CIAA in 1990, as the state operating budget declined. This hatchery has functioned to produce primarily sockeye salmon, with minor production of coho and Chinook salmon. In 2005, the wells at Trail Lakes hatchery were unable to supply enough water to rear all the fish in the facility, so some of the fish had to be transferred to the Eklutna Hatchery, a facility owned by CIAA, but not operational for the past few years. Until recently, two lakes located on the Kenai Peninsula, Hidden Lake and Tustumena Lake, were stocked with sockeye salmon, with adult production from these enhancement programs available to both the common property commercial fishery and the personal use and recreational fisheries. All of the sockeye salmon released from this facility were otolith marked and smolt and adult enumeration projects were conducted by CIAA staff as part of their evaluation programs. In general, hatchery-produced sockeye salmon have accounted for substantially less than 10% of the total commercial harvests in UCI.
In December, 2003, the U.S. Ninth Circuit Court of Appeals issued a ruling stating that the 30-year old stocking program in Tustumena Lake amounted to a commercial enterprise and violated provisions of the 1964 Wilderness Act. The Wilderness Society and the Alaska Center for the Environment brought suit against the U.S. Fish and Wildlife Service over the stocking program being conducted by CIAA. In essence, the ruling meant that the 6 million sockeye salmon fry being incubated at Trail Lakes Hatchery could not be released into Tustumena Lake in 2004 and thus would have to be destroyed. At the request of fishing groups and other citizens, Governor Murkowski had asked United States Department of the Interior Secretary, Gale Norton, to request a full hearing before the 9th Circuit Court on the matter. The Department of Justice, which handled the case for the Department of the Interior, instead petitioned only on the issue of the injunction regarding the fate of the fry. The court granted a rehearing on that issue and amended its order halting the stocking program. In the end, the U.S. Ninth Circuit Court of Appeals allowed the district court in Alaska discretion in what to do with the 6 million sockeye salmon fry, which they permitted to be stocked into Tustumena Lake in 2004 only. CIAA did not collect sockeye salmon eggs from Tustumena Lake in either 2004 or 2005 and at this time it appears that the stocking program at Tustumena Lake has been eliminated.
Since 1975, a sockeye salmon enhancement project has been conducted at Big Lake, which is located in the Matanuska-Susitna Valley approximately 24 km west of Wasilla (Figure 1). ADF&G directed the stocking program through 1992, but since then CIAA has conducted the gamete collection, incubation, and fry release activities. Approximately 1.7 million sockeye salmon fry were released in Meadow Creek, a tributary of Big Lake, in 2005 (Dodson 2006).
STOCK STATUS AND OUTLOOK Overall, the status of UCI’s salmon stocks is generally very optimistic, although some areas merit further discussion. In 2005, approximately 5.6 million sockeye salmon were projected to

20
return to UCI, which would have provided some 4.1 million fish for all users to harvest. The forecasted harvest in 2005 was about 0.2 million fish above the 20-year average harvest. In reality, the 2005 estimated sockeye salmon total run of 7.9 million fish produced more than 5.2 million fish that were commercially harvested, with nearly 400,000 taken by personal use fishermen on the Kenai and Kasilof Rivers, and likely 200,000 to 400,000 to sport fishermen throughout UCI. Sockeye salmon escapement goals were exceeded in three of five systems, and fell short in two others (Appendix A10).
Sockeye salmon runs to the Susitna River drainage have been somewhat depressed recently; for example, in 4 of the last 5 years (2000–2005) the escapement goal, which is measured by Yentna River sonar estimates, was not achieved (Appendix A10). However, in 2003, the total sockeye salmon run to the Susitna River drainage was 607,000 fish (Tobias and Willette 2004), or the second largest run in the past 10 years. The 2005 preseason forecast projected a total run of approximately 432,000 fish, which was just slightly less than the recent 10-year average. But, the estimated run in 2005 of 150,000 fish fell significantly short (65%) of the forecast and the estimated inriver escapement at the Yentna River sonar site was only 37,000 fish, which was only 49% of the minimum escapement goal. As mentioned previously in this report, numerous restrictions were made to the drift gillnet fishery in the Central District, as well as five consecutive closures of the Northern District set gillnet fishery, all done in order to reduce harvest rates of northern-bound sockeye salmon. Nevertheless, the escapement goal at the Yentna River was not achieved. Because this level of escapement was the weakest ever estimated, several postseason meetings between the public and ADF&G staff were conducted to identify potential causes for the recent poor sockeye salmon runs to this system. The outcome of these meetings resulted in suggestions for numerous research studies designed to identify and assess the origins for poor sockeye salmon production in the Susitna River drainage. The suggested studies included: (1) a Susitna River drainage mark–recapture study to independently estimate sockeye salmon escapement in both the Susitna and Yentna Rivers; (2) limnological investigations of numerous lakes throughout the drainage, with these studies including fry and smolt population estimates and evaluation of the effects of northern pike (Esox lucius) predation and beaver dams on production; and (3) genetic studies designed to identify and enumerate the stock composition of the commercial fisheries salmon harvest. To conduct some or all of these research projects, additional funds beyond current ADF&G budgets were needed; at the time this report was being written, the Alaskan legislature had been asked to consider appropriating money towards these research objectives. For more details on previous studies pertaining to sockeye salmon production in the Susitna drainage, see Tarbox and Kyle 1989; Kyle et al. 1994; King and Walker 1997; Edmundson et al. 2000; and Todd et al. 2001.
After experiencing record-level runs through the mid to late 1980's, the Crescent River sockeye salmon run declined dramatically and remained depressed throughout most of the 1990’s. In 1996, limnological studies were initiated to determine whether the decline in sockeye salmon production was related to changing conditions in Crescent Lake, the major nursery lake in this watershed. These studies revealed a low abundance of the primary food resource for juvenile sockeye salmon in Crescent Lake, namely, the cyclopoid copepod Cyclops scutifer (Edmundson and Edmundson 2002). Unfortunately, these studies were terminated in 2001 due to lack of funding. However, within the limited scope of these investigations, some hypotheses were developed. First, it was theorized that that increased turbidity levels in the lake prior to 1996 resulted in a reduction in primary production associated with a lack of light penetration, which drives photosynthesis. Another possible source of the decline in production was attributed to a

21
top-down grazing effect on the Cyclops population from sockeye salmon fry produced from large escapements beginning in 1984. In speculating on the mechanisms responsible for the reduced sockeye salmon runs to this system, Edmundson and Edmundson (2000) cited that it was likely some combination of increased turbidity and over-grazing of the forage base. The exact cause for the shift in turbidity could not be isolated before the project was terminated, but the limited data set did provide the grounds for a recommendation that the sockeye salmon BEG for this system should be reduced, which it was beginning in 1999 from 50,000 to 100,000 fish to 25,000 to 50,000 fish. Since 2000, however, sockeye salmon runs to Crescent Lake have improved (see table on page 21). Therefore, in 2005, the BOF acted on recommendations from ADF&G and slightly raised the BEG at Crescent Lake from 25,000 to 50,000 fish to 30,000 to 70,000 fish. The total run estimate of more than 173,000 fish in 2005 was the largest return to Crescent Lake since 1987 and this year’s estimated commercial harvest of approximately 50,000 fish was the third largest since 1988. More than 125,000 sockeye salmon were estimated to have escaped in 2005, which means that since the escapement goal was changed in 1998 and then again in 2005, it has been exceeded every year. For the past few years, set gillnet fishing in the Western Subdistrict south of Redoubt Point has been allowed 24 hours per day nearly all of July; in 2005, this area was open 24-hours per day from June 27 through August 5 (40 days), yet the exploitation rate from 2000 to 2005 has averaged only 32%. This is largely a result of many fishermen and nearly all processors abandoning this fishery during the 1990’s because of diminished returns and considerable restrictions placed on the fishery in order to achieve escapement goals. Perhaps if ground prices continue to increase, more fishermen will move back to this area.
Crescent River Sockeye Salmon Average Annual Average Annual Average Annual Escapement Commercial Harvest Total Run
Decade (thousands) (thousands) (thousands) 1976–1979 75 56 130 1980–1989 87 82 169 1990–1999 50 23 73 2000–2005 91 42 134
Much like the story at Crescent Lake, sockeye salmon runs to Fish Creek, which drains Big Lake and flows into Knik Arm, have been relatively poor, particularly from 1998 to 2001, and again in 2004–2005. The average annual total sockeye salmon run to Big Lake from 1980 to 1997 was 212,000; however, from 1998–2001 the average annual return fell to 52,000 (Tobias and Willette 2004), and during this time period the sockeye salmon BEG of 50,000 was not achieved. For the past two years, the average annual return has only been 33,000 fish. Prior to the 2002 BOF meeting, an escapement goal review team recommended that the Fish Creek goal be changed to an SEG of 20 to 70,000 fish. In 2002 and 2003, escapement into this system exceeded the new SEG by approximately 20,000 fish each year. In addition, the total sockeye salmon run to Fish Creek in 2002 was more than 134,000 fish, and in 2003 it exceeded 147,000 fish. However, the forecasted total run for 2004 was only 33,000 fish, based largely on the 2002 smolt emigration estimate of only 49,000 fish (Dodson 2003). The estimated total run to Fish Creek in 2004 ended up being approximately 41,000 fish, with more than 22,000 counted through the weir

22
(Shields and Fox 2005). Although the run did exceed expectations, the total of 41,000 fish was the second smallest return since 1978. In 2005, the forecasted run of sockeye salmon to Fish Creek was only 27,000 fish, which if realized, meant the minimum escapement goal would likely not be achieved. The estimated total run in 2005 was indeed very small, as only 23,000 Fish Creek sockeye salmon were accounted for and the escapement through the weir was only 14,400 fish. The number of smolt emigrating Big Lake the past three years have been estimated at 117,000 in 2003, 256,000 in 2004 and 151,000 in 2005 (Dodson 2004, 2005, 2006).
A technical review assessing Big Lake sockeye salmon production was completed prior to the 2002 BOF meeting (Litchfield and Willette 2002). This report proposed two likely causes for the decline in sockeye salmon production: (1) degradation of spawning habitat as a result of questionable hatchery practices and (2) placement of a coffer dam at the outlet of the lake, which prevented many wild fry from being able to recruit into the lake as well as causing a productive spawning area at the lake outlet to be filled in with silt and mud. At the 2002 BOF meeting, Fish Creek sockeye salmon were found to be a stock of yield concern and ADF&G proposed additional studies to more clearly define the limitations to sockeye salmon production in this system. As a result of identifying the coffer dam as a barrier to upstream migration of juvenile sockeye salmon fry, modifications were made at the lake outlet that allowed fry to more easily recruit into Big Lake. It is expected that more adults will again utilize this productive spawning area. The long-term outlook for Big Lake sockeye salmon is unclear. The escapement goal was exceeded in 2002 & 2003, narrowly achieved in 2004, and not met in 2005 (Appendix A10). Hatchery practices and stocking procedures have been tightened up, and modifications at the lake outlet should result in more fry being able to recruit into the lake. These improvements led ADF&G to recommend removing Big Lake sockeye salmon as a stock of yield concern and at the 2005 BOF meetings, that recommendation was accepted. Yet, the story of sockeye salmon production from Big Lake remains somewhat of a mystery. Even when the recommended number of spawners for the system has been met, the production of wild-produced smolt is dismal. Furthermore, CIAA has been stocking the lake with sockeye salmon fry for a number of years, but recent fry to smolt survival has also been very poor (Dodson 2006). If the forecasted run to Big Lake in 2006 is achieved, it is likely the minimum escapement goal will be met; nevertheless, Big Lake is not producing sockeye salmon at a level it once did. The forecasted run to Big Lake in 2006 is estimated at 44,000 fish.
Pink salmon runs in UCI are even-year dominant, with odd year average harvests less than 1/7th of even-year harvests (Appendix A4). The 2005 harvest of pink salmon of 49,000 was nearly identical to the harvest in 2003 and only moderately less than the odd-year average annual harvest since 1990. The 2000 and 2002 UCI pink salmon runs were characterized as strong or very strong, thus reversing the trend of diminished returns realized since the flood in 1986. Yet, the 2000 UCI commercial harvest of pink salmon was the smallest even-year harvest since 1966. This mostly can be explained by the fact that the commercial fishery operated under numerous restrictions to ensure that sockeye salmon escapement goals were achieved. The 2004 run of pink salmon was portrayed as average to above average. For example, the escapement count at the Deshka River weir was approximately 390,000, which is significantly less than the average of more than 900,000 observed in 1998, 2000, and 2002. But, the OTF cumulative CPUE of 439 in 2004 was the third highest even-year CPUE in the past 12 even-year cycles. Describing the pink salmon run is difficult and is largely based on commercial fish reports, recreational fishing success, and limited escapement monitoring. There are no enumeration projects in all of UCI designed to specifically monitor pink salmon escapements, but they are counted as part of

23
programs designed to enumerate Chinook, sockeye, and coho salmon. Pink salmon stocks in UCI are maintaining their even-year dominance and continue to return in numbers that reveal that there are no obvious problems with the stock.
While ADF&G lacks long-term quantitative escapement information, chum salmon escapements to streams throughout UCI have undoubtedly been augmented by management actions or regulatory changes aimed principally at other species. These actions include significant reductions in the offshore drift gillnet and Northern District set gillnet fisheries to conserve Yentna River sockeye salmon; the adoption of a Northern District Coho Salmon Management Plan, which further limits these two fisheries to allocate coho salmon for other users; the lack of a directed chum salmon fishery in Chinitna Bay; and finally, harvest avoidance, as much as possible, by the drift fishery as a result of the current low prices being paid for chum salmon. Chum salmon production suffered through about a decade of mediocre runs, beginning in the mid-1980’s, in part due to impacts from fall flooding in the Susitna River Basin in 1986, but in all probability also due to poor general environmental factors. Chum salmon stocks throughout Southcentral Alaska have mirrored Susitna River chum salmon production, both revealing reductions in abundance from the mid-1980’s to the mid-1990’s. Fortunately, beginning in 1995 an improvement in chum salmon production was observed in many areas of South Central Alaska, including UCI. Indications from the OTF project, the commercial fishery, and the few escapement programs where chum salmon are enumerated would in general support the characterization that the 2000–2004 runs were much improved from those realized during the 1990’s. For example, the 2000 OTF cumulative chum salmon CPUE of 672 was the 3rd largest since 1983, the first year chum salmon were enumerated by this project. Aerial census counts of chum salmon in Chinitna Bay estimated an escapement of nearly 23,000 in 2000, which is the largest aerial census estimate ever recorded for this area. The 2002 escapement counts of chum salmon at the Little Susitna River, Willow Creek, and Wasilla Creek weirs were the highest counts ever observed for these systems, while the 2001 chum salmon escapement in the Little Susitna River was the second largest ever observed. The 2004 OTF cumulative chum salmon CPUE would seem to indicate that the 2004 run was of average abundance, as the cumulative CPUE of 447 was very close to the 1988–2003 mean CPUE of 465. Assessing the 2005 run of chum salmon in UCI was difficult. For example, although the 2005 commercial harvest of chum salmon was the lowest observed during the past 40 years, the 2005 OTF cumulative chum salmon CPUE of 300 was only about 35% less than the 1988–2004 average cumulative CPUE of 464. In addition, aerial census counts of chum salmon escapement in Chinitna Bay were also about 34% under the 1971–2004 average annual counts. While chum salmon used to be enumerated at the Little Susitna River weir, this project now focuses only on coho salmon, so any chum salmon counts from this weir are only partial estimates. Therefore, although there is a limited amount of information available for assessing the 2005 chum salmon run, it most likely was weaker than average. Data from the next couple of years will be needed to determine if chum salmon runs to UCI are indeed experiencing a downturn.
UCI’s coho salmon stocks generally benefited from excellent production throughout most of the 1980's and early 1990’s. However, coho salmon runs in 1997 and 1999 were viewed as mediocre to poor, prompting BOF measures in 1997, 1999 and 2000 that resulted in coho salmon conservation restrictions to sport and commercial fishermen in much of UCI. Ironically, the 2000 run appeared to be much improved (see table on page 24), with the 2001 run being even stronger yet, and finally the 2002 run being exceptional, perhaps even a record run (Yanusz et al. 2002). Because coho salmon are strongly dominated by a 4-year cycle, the returns from the 1997 and 1999 brood years
24
occurred primarily in 2001 and 2003. The 2003 run, while not exceptionally strong, still produced escapements nearly three times the level of the 1999 brood year (the aggregate escapement of coho salmon from Cottonwood, Fish, and Wasilla Creeks and Little Susitna River in 1999 was 6,470 and produced an aggregate escapement to these same systems in 2003 of 17,872). In 2004, ADF&G’s Division of Sport Fish terminated coho salmon enumeration at Wasilla Creek, and for the 2005 season they began using escapement counts at the Little Susitna River as a gauge of coho salmon escapement from all Knik Arm stocks. Based on the Little Susitna River coho salmon weir count, the 2004 run appears to have been very strong. The 2005 Little Susitna River weir count of coho salmon was estimated at 16,839; however, the weir was partly submerged due to high water on September 7 and completely submerged beginning September 10, in effect stopping all counting. Therefore, the estimate of escapement was not complete, which means the upper end of the escapement goal of 10,100–17,700 fish was very likely exceeded. The 2005 coho salmon run to the Little Susitna River was categorized as “late, but very strong” (D. Rutz, Sport Fish Biologist, ADF&G, Palmer; personal communication March 1, 2006). It needs to be emphasized though, that these are just weir counts, which do not include commercial and sport harvests below the weir.
Coho Salmon Escapement and Enumeration Cottonwood Fish Little Susitna Wasilla Deep OTF
Year Creek Creek River Creek Creek CPUE 1996 15,803 534 1997 936 2,578 9,894 670 2,017 362 1998 2,114 5,463 15,159 3,777 1,541 403 1999 478 1,766 3,017 1,587 2,267 294 2000 1,888 5,979 14,436 6,154 3,408 766 2001 3,525 10,047 30,587 6,784 3,747 838 2002 4,270 15,187 48,308 13,195 6,132 798 2003 791 2,142 11,127 3,712 368 2004 2,004 3,234a 40,199 785 2005 16,839a 344
a Represents a partial count, the weir was pulled before the coho salmon run was complete. b Weir washed out, count incomplete.
The total return of Kenai River adult coho salmon has been estimated annually by: (A) the population specific harvest in marine commercial fisheries, (B) the inriver sport and personal use harvest, and (C) the spawning escapement (Carlon and Evans In Prep; Massengill, et al. In prep). The sum of these three components (A+B+C) provide the estimate of annual adult production, although no escapement goal has been established for this system. Smolt enumeration studies have been conducted in the Moose River, a Kenai River tributary that has been shown to be a very important rearing environment for juvenile coho salmon. As a result of increasing sport and commercial harvest levels in the early 1990’s, combined with a decreasing trend in smolt production from 1993–1997, the BOF implemented conservation measures at the 1997 & 2000 meetings to reduce sport and commercial exploitation of Kenai River coho salmon. Since 1997, the drainage-wide coho salmon smolt emigrations have stabilized. Interestingly, the 1999 record low adult escapement estimate of 7,364 fish produced a smolt emigration in 2001 that was approximately near the historical average. Conversely, the record low smolt emigration in 1997

25
of 374,225 fish produced what is believed to be a very weak return of adults in 1998, although the total return strength for that year is unknown. Since 1999, Kenai River adult coho salmon returns have been considered good to excellent. In 2004, in response to an emergency petition form the Kenai-Soldotna Fish and Game Advisory Committee, the BOF extended the Kenai River sport fishing season for coho salmon from September 30 to October 31. This decision was based upon ADF&G data that projected an above average Kenai River coho salmon escapement. Adult coho salmon runs to the Kenai River are no longer estimated through mark–recapture studies, fishwheels are still run so that capture rates can be compared to previous year’s data to generally gauge the strength of each year’s run. The 2005 coho salmon run to the Kenai River was characterized as ‘average’ based upon inriver fishwheel catch data (R. Massengill, Sport Fish Biologist, ADF&G, Soldotna; personal communication March 1, 2006). Continued monitoring of smolt and/or adult production will provide valuable information about Kenai River coho salmon returns from various levels of escapements.
In summary, coho salmon stocks throughout UCI appear to be average to above average in strength; therefore, at the 2005 BOF meetings, most of the conservation actions previously taken to protect UCI coho salmon were rescinded.
After experiencing a marked decline in the early to mid 1990s, Northern District Chinook salmon stocks have rebounded, with exceptional runs enumerated at the Deshka River weir. In general, no conservation issues are currently known. In fact, in response to strong Chinook salmon runs, sport fishing seasons and bag limits have been liberalized in some streams in the Northern District. Moreover, in 2005 the BOF lengthened commercial fishing periods during the Northern District Chinook salmon fishery from 6 to 12-hours in response to strong Chinook salmon runs.
Late-run Kenai River Chinook salmon returns have been relatively stable and escapement objectives have been consistently achieved or exceeded. The 2004 run appears to have been one of the strongest runs on record. The early-run Kenai River Chinook salmon return is believed to migrate through Cook Inlet prior to any commercial fishing taking place.
2005 COMMERCIAL HERRING FISHERY The 2005 UCI herring fishery resulted in a harvest of 17.3 tons (Appendix A8), with 17.1 tons coming from the Upper Subdistrict and 0.2 tons from Chinitna Bay. A total of 15 permit holders reported fishing, which is up slightly from previous years. The moderate increase in participation was likely the result of the expansion of fishing hours in the Upper Subdistrict in 2005. Currently, all herring harvested in UCI are used exclusively for personal use or bait. Due to the fact that the Prince William Sound and Kamishak Bay herring fisheries have remained closed for many years, bait herring from UCI has risen in value. Demand by commercial and sport halibut fishermen has resulted in an average price of approximately $0.75/lb or $1,500/ton. Based on this price, the estimated exvessel value of the 2005 commercial herring fishery was $26,000.
2005 COMMERCIAL SMELT FISHERY In 2005, eight permit holders obtained commissioner’s permits from ADF&G, which were required of all fishermen who wished to participate in the newly opened commercial smelt fishery (5 AAC 21.505 Cook Inlet Smelt Fishery Management Plan). However, no processors or fishermen reported any harvest. Conversations with those involved revealed that one processor who was active in the fishery the last time it was open was unable to commit to the fishery in

26
2005. Another reason given for no participation was unfamiliarity with the area where the fishery was open. The commercial dipnet smelt fishery will again be open for the 2006 season and at the time this report was being finalized a few fishermen had already obtained commissioner’s permits.
2005 COMMERCIAL RAZOR CLAM FISHERY Historically the razor clam fishery on the west side of Cook Inlet has been confined to the area between Crescent River and Redoubt Point. All clams harvested in this area are directed by regulation to be sold for human consumption, except for the small percentage (less than 10% of the total harvest) of broken clams, which may be sold for bait. Razor clams are present throughout this area, with especially dense concentrations in the Polly Creek and Crescent River areas. Beginning in 1993, the Department of Environmental Conservation certified additional beach area for harvesting clams for human consumption. The additional area is located north of the existing certified beach at Polly Creek, north to Redoubt Creek. In 1994, this certification was extended further north to Harriet Point. In the remainder of the Upper Cook Inlet Management Area, there are no restrictions on the amount of clams that can be sold for bait. Currently though, there is no directed effort to harvest razor clams for the bait market. The minimum legal size for razor clams is 4.5 inches (114 mm) in shell length.
The 2005 harvest, taken primarily from the Polly Creek/Crescent River area, was approximately 371,000 pounds (Table 19; Appendix A9). A total of 22 diggers participated during the season, reporting harvest from 56 different days, or from May 21 to August 9. Diggers were paid an average of $.62 per pound for their harvest, resulting in an exvessel value of this fishery of $231,000.
The 2005 summer tide schedule can be found in Table 17.
SUBSISTENCE There is a long history of Alaskans harvesting fish and game for their personal consumptive needs under sport, subsistence, and commercial fishing regulations in the Cook Inlet area (Braund 1982). Since 1978, when the State of Alaska passed its first subsistence statute (AS 16.05.258), many changes have occurred in the regulations governing the harvest of fish and game for personal consumption in Cook Inlet. Beginning in 1981, a new category of fisheries was established. Personal use fishing was created to provide for the personal consumptive needs of state residents not able to meet their needs under other fisheries. Since their creation, numerous changes have occurred in the personal use or subsistence fisheries in Cook Inlet as a result of challenges in the State of Alaska Court System, The Alaska State Legislature, or the BOF process. The only personal use or subsistence fishery that has occurred consistently in Cook Inlet during this entire period is the Tyonek Subsistence fishery. A review of the various personal use and subsistence fisheries that have been conducted in Cook Inlet are reported in Brannian and Fox (1996) and Reimer and Sigurdsson (2004).
TYONEK SUBSISTENCE SALMON FISHERY The present subsistence fishery in the Tyonek Subdistrict was created by an Anchorage Superior Court order in May 1980. In March 1981, the Board of Fisheries adopted permanent regulations for this fishery. Originally open only to those individuals living in the village of Tyonek, recent court decisions allow any Alaska resident to participate, although very few non-villagers seek permits. Fishing is allowed only in the Tyonek Subdistrict of the Northern District. A limit of

27
one permit per household can be issued and each permit holder is allowed a single 10-fathom gillnet, having a mesh size no greater than six inches. Fishing is allowed from 4:00 a.m. to 8:00 p.m. each Tuesday, Thursday, and Friday from May 15 to June 15, or until 4,200 Chinook salmon have been harvested. Fishing is again allowed from 6:00 a.m. to 6:00 p.m. each Saturday after June 15, although the opening is delayed until July 1, if 4,200 Chinook salmon were taken before June 16. The permit allows 25 salmon per permit holder and 10 salmon for each additional member. However, 5 AAC 01.595(a)(3) allows for up to 70 Chinook salmon per permit holder in the Tyonek Subsistence fishery. Annual Chinook salmon harvests have ranged from a low of 639 in 1997 to as many as 2,665 in 1983 (Appendix A15). In 2005, preliminary reports from the Tyonek subsistence fishery show a harvest of 720 Chinook, 60 sockeye, 104 coho, 0 pink, and 2 chum salmon.
UPPER YENTNA RIVER SUBSISTENCE SALMON FISHERY A subsistence salmon fishery is allowed in the Yentna River drainage outside the Anchorage-Matsu-Kenai non subsistence area described in 5 AAC 99.015(a)(3). The provisions for this fishery allow for the harvest of 25 salmon per head of household, plus 10 more for each dependent; however, all Chinook salmon and rainbow trout must be returned to the water alive. The specific area open for this fishery is in the main stem Yentna River from its confluence with Martin Creek upstream to its confluence with the Skwenta River. Legal gear consists only of fish wheels. The subsistence fishing season occurs from July 15 through July 31 from 4:00 a.m. to 8:00 p.m. each Monday, Wednesday, and Friday during this time frame. The preliminary harvest reports from the 2005 Yentna River subsistence fishery show that 181 sockeye, 42 coho, 24 pink, and 25 chum salmon were harvested (Appendix A15). There were 18 Yentna River subsistence permits issued in 2005.
KENAITZE TRIBAL EDUCATIONAL FISHERY In 1993 a state court ordered ADF&G to create an educational fishery for the Kenaitze Indian Tribe, pending final court rulings on other subsistence cases. The objectives for educational fisheries are specified in 5 AAC 93.235 as “educating persons concerning historic, contemporary, or experimental methods for locating, harvesting, handling, or processing fishery resources.” Standards, general conditions, and requirements of the educational fishery program are outlined in 5 AAC 93.200–235. Tables A15 and A16. summarize the harvest from the Kenaitze educational fishery since it began in 1994. In 2005, this amounted to 100 Chinook, 6,317 sockeye, 490 coho, and 12 pink salmon, for a total of 6,919 salmon. The 2005 harvest was the most fish ever taken by the Kenaitze’s and was approximately 30% more than the 2004 harvest, but was within the 8,000 total fish harvest range allowed for in the fishery.
NINILCHIK TRADITIONAL COUNCIL/NATIVE DESCENDENTS EDUCATIONAL FISHERY In 1993 the Ninilchik Traditional Council (NTC) applied for and was granted a permit for an educational fishery (Szarzi and Begich 2001). In 1998, a group of NTC members formed a new organization, the Ninilchik Native Descendents (NND), and requested a separate permit with similar goals of passing on traditional knowledge and providing food for needy tribal members. Initially one permit was issued for both groups, but this was not acceptable to the NTC and both groups were allowed to fish concurrently. There have been a number of changes to the annual harvest limits allowed under these permits, but in 2005 the NTC harvested 70 Chinook, 264 sockeye, and 83 coho, salmon (Appendix A15 and A16.). The NND caught 88 Chinook, 84

28
sockeye, 78 coho and 15 pink salmon. The largest reported harvest since the inception of the NNT/NND educational fishery occurred in 2001 when the combined harvest from the two groups was slightly more than 1,500 fish.
NINILCHIK EMERGENCY SERVICES EDUCATIONAL FISHERY In 2004, another group from Ninilchik applied for and was granted approval for an educational fishery. In 2004, the Ninilchik Emergency Services (NES) group harvested 1 Chinook and 77 sockeye salmon, while in 2005, only 5 Chinook salmon were harvested (Appendix A16.).
PERSONAL USE SALMON FISHERY Under the Upper Cook Inlet Personal Use Salmon Fishery Management Plan (5 AAC 77.540), personal use fishing is allowed in limited areas in Cook Inlet. The management plan received substantial changes at the BOF meeting in January of 1996. In 1995, personal use fishing was allowed with set gillnets in most areas of Cook Inlet normally open to commercial set gillnet fishing. However, for the 1996 season, most of this area was closed, but to compensate for the lost opportunity, dip net fisheries were expanded to allow for approximately the same level of harvest that had occurred with gillnets in 1995. Currently, personal use fishing using gillnets is open near the Kasilof River in the waters of UCI normally closed to commercial set gillnet fishing. This area encompasses approximately 1 mile on either side of the Kasilof River, extending out from shore for 1 mile. In addition, dip net fishing is allowed at the terminus of the Kenai and Kasilof Rivers. The personal use management plan was again amended at the 2002 BOF meeting, modifying how the dip net fishery at Fish Creek in Knik Arm was to be managed as well as making time changes to both the Kenai and Kasilof personal use fisheries. The Fish Creek dip net fishery was continued in regulation, but opens only if the upper end of the escapement goal of 70,000 is projected to be exceeded. The Kasilof gillnet fishery was also modified, expanding the days and hours that the fishery was open. The fishery now opens on June 15 and takes place from 6:00 a.m. until 11:00 p.m. daily. Instead of being managed for a harvest goal of 10,000 to 20,000 fish, the fishery remains open until 11:00 p.m. on June 24, regardless of how many fish are harvested. The amended management plan also changed how the Kenai River dip net fishery was prosecuted. This fishery is open from July 10 through July 31, for 7 days per week, but only from 6:00 a.m. to 11:00 p.m. daily. But, if ADF&G determines that the abundance of Kenai River late-run sockeye salmon is greater than two million fish, this fishery may be extended, by emergency order, to 24-hours per day. The Kasilof River dip net personal use fishery occurs from June 25 through August 7, 24-hours per day.
A permit issued by ADF&G, along with a valid resident sport fishing license, or an exemption from licensing under AS 16.05.400, is required to participate in the personal use fisheries. The annual bag and possession limits are 25 salmon per head of household, with an additional 10 salmon for each household member. In the Kasilof River dip net fishery, however, Chinook salmon may not be retained and must be released immediately to the water unharmed. In the Kenai River dip net fishery, one Chinook salmon may be retained per household. There are no Chinook salmon limitations in the Kasilof River gillnet personal use fishery. Legal gear under the management plan are set gillnets and dip nets. A set gillnet cannot exceed 10 fathoms (60 feet) in length or 45 meshes in depth. Mesh size must be greater than 4 inches, but may not exceed 6 inches. Gillnets must be set at least 100 feet apart at all times. A legal dip net has been defined in regulation (5 AAC 39.105) as a bag-shaped net supported on all sides by a rigid frame. The maximum straight-line distance between any two points on the net frame, as

29
measured through the net opening, may not exceed 5 feet. The depth of the bag must be at least one-half of the greatest straight-line distance, as measured through the net opening. No portion of the bag may be constructed of webbing that exceeds a stretched measurement of 4.5 inches; the frame must be attached to a single rigid handle and be operated by hand.
2005 PERSONAL USE FISHERY The personal use fishery using gillnets at the mouth of the Kasilof River opened on June 15 and closed at 11:00 p.m. on Saturday, June 25. Personal Use Emergency Order No. 1 allowed for a 24-hour extension of the fishery (June 24 to June 25) in response to strong sockeye salmon sonar counts in the Kasilof River. Approximately 32,600 sockeye salmon were harvested in this fishery (Table 15), which is approximately 7,200 fish more than were harvested in 2004 and 23,000 fish (243%) more than the previous maximum number harvested in 1996 (Table 18). It should be noted though that there were a number of personal use permits that were returned where the river of harvest was unknown. For the purposes of this report, these fish were allocated to the different rivers and gear types based upon the proportion of the known harvest. There will be some minor refinements to the database later in the year. The total harvest of all salmon in the Kasilof River personal use gillnet fishery was approximately 33,000.
The Kasilof River dip net fishery was open from June 25 to August 7. However, in response to projections that the upper end of the Kasilof River sockeye salmon OEG would be exceeded, the Division of Sport Fish liberalized the area that was open to shore dipnetting, extending it from the current closed marker in the Kasilof River upstream to the bridge at the Sterling highway (emergency order 2-RS-1-12-05). Dipnetting from boats in the Kasilof River was also liberalized, with the upstream limit being Trujillo’s landing. Both liberalizations were in effect from June 25 through July 31. The total sockeye salmon harvest in the Kasilof River dip net fishery in 2005 was approximately 46,000 fish (Table 15), which was approximately 2,600 fish less than 2004, but sill marked the 5th time in the past 10 years that the harvest from this fishery was between 40,000 and 50,000 fish (Table 18). The total harvest of all salmon in this fishery was nearly 47,000 fish.
The dip net fishery in the Kenai River opened on July 10 and closed, as scheduled, at midnight on July 31. In compliance with the management plan, the fishery was open from 6:00 a.m. to 11:00 p.m. daily. But, on July 20, an emergency order (2-RS-1-20-04) was announced by the Division of Sport Fish expanding dip net hours to 24-hours per day, which was provided for in the management plan when Kenai River sockeye salmon runs exceed 2 million fish. Approximately 291,000 sockeye salmon were harvested in the 2005 Kenai River dip net fishery (Table 15), which exceeded the previous maximum harvest of 263,000 in 2004 by more than 28,000 fish, or an increase of approximately 11% (Table 18). It also marked the 5th straight year where more sockeye salmon were harvested than the year before, with the 2005 harvest approximately 193,000 fish more than the 2000 harvest. The total yield of all species of salmon from the Kenai River dip net fishery was approximately 296,000 fish.
The Fish Creek personal use dip net fishery was not opened in 2005.
A summary of the harvest of sockeye salmon from the personal use fisheries in the Kenai and Kasilof Rivers reveals that approximately 370,000 fish were taken in 2005. This total exceeded the 2004 sockeye salmon harvest, which had been the highest harvest to date, by nearly 20,000 fish. The 2005 harvest also represents an increase of nearly 200% (126,000 to 370,000) from the harvest observed in these rivers in 1996 (Table 18).

30
REFERENCES CITED Brannian, L. and J. Fox. 1996. Upper Cook Inlet subsistence and personal use fisheries report to the Alaska Board
of Fisheries, 1996. Alaska Department of Fish and Game, Division of Commercial Fisheries, Regional Information Report 2S96-03, Anchorage.
Braund, S. R. 1982. Cook Inlet subsistence salmon fishery. Alaska Department of Fish and Game, Division of Subsistence Technical Paper 54, Juneau.
Carlon, J. A. and D. Evans In Prep. Abundance of adult coho salmon of Kenai River origin, 1999-2003. Alaska Department of Fish and Game, Fishery Data Series, Anchorage.
Dodson, T. T. 2003. Big Lake sockeye salmon enhancement progress report, 2002. Cook Inlet Aquaculture Association. Soldotna, Alaska.
Dodson, T. T. 2004. Big Lake sockeye salmon enhancement progress report, 2003. Cook Inlet Aquaculture Association. Soldotna, Alaska.
Dodson, T. T. 2005. Big Lake sockeye salmon enhancement progress report, 2004. Cook Inlet Aquaculture Association. Soldotna, Alaska.
Dodson, T. T. 2006. Big Lake sockeye salmon enhancement progress report, 2005. Cook Inlet Aquaculture Association. Soldotna, Alaska.
Edmundson, J. A., V. P. Litchfield, and D. M. Cialek. 2000. An assessment of trophic status of 25 lakes in the Matanuska-Susitna borough, Alaska. Alaska Department of Fish and Game, Division of Commercial Fisheries, Regional Information Report 2A00-26.
Edmundson, J. M. and J. A. Edmundson. 2002. Sockeye salmon production relative to changes in rearing capacity of Crescent Lake, Upper Cook Inlet. Alaska Department of Fish and Game, Division of Commercial Fisheries, Regional Information Report 2A02-08, Anchorage.
King, B. E., and S. C. Walker. 1997. Susitna River sockeye salmon fry studies, 1994 and 1995. Alaska Department of Fish and Game, Commercial Fisheries Management and Development Division, Regional Information Report 2A97-26, Anchorage.
Litchfield, V. P. and T. M. Willette. 2002. Fish Creek sockeye salmon technical review. Alaska Department of Fish and Game, Division of Commercial Fisheries, Regional Information Report 2A01-32, Anchorage.
Massengill, R. L. and J. A. Carlon. In Prep. Assessment of coho salmon from the Kenai River, Alaska, 2003. Alaska Department of Fish and Game, Fishery Data Series, Anchorage.
Nickerson, R. B. 1975. A critical analysis of some razor clam populations in Alaska. Alaska Department of Fish and Game, Fisheries Rehabilitation, Enhancement and Development Division, Juneau.
Reimer, A. M., and D. Sigurdsson. 2004. Upper Cook Inlet personal use salmon fisheries, 1996-2003. Alaska Department of Fish and Game, Fishery Data Series No. 04-31, Anchorage.
Shields, P. A. and T. M. Willette. 2004. An estimate of the migratory timing and abundance of sockeye salmon into Upper Cook Inlet, Alaska, in 2003. Alaska Department of Fish and Game, Division of Commercial Fisheries, Regional Information Report 2A04-15, Anchorage.
Shields, P. 2005. Upper Cook Inlet commercial herring and smelt fisheries through 2004. Alaska Department of Fish and Game, Special Publication No. 05-14, Anchorage.
Shields, P. and J. Fox. 2005. Upper Cook Inlet commercial fisheries annual management report, 2004. Alaska Department of Fish and Game, Division of Commercial Fisheries, Regional Information Report No. 2A05-01, Anchorage.
Szarzi, N. and R. Begich. 2004. Recreational fisheries in the Lower Cook Inlet Management Area, 1995-2000. Alaska Department of Fish and Game, Fishery Management Report No. 04-06, Anchorage.
31
REFERENCES CITED (Continued) Tarbox, K. E. and G. B. Kyle. 1989. An estimate of adult sockeye salmon Oncorhynchus nerka production based
on euphotic volume for the Susitna River Drainage, Alaska. Alaska Department of Fish and Game, Division of Commercial Fisheries, Regional Information Report No. 2S89-01.
Tobias, T. M. and T. M. Willette. 2004. Abundance, age, sex and size of Chinook, sockeye, coho, and chum salmon returning to Upper Cook Inlet, Alaska in 2003. Alaska Department of Fish and Game, Division of Commercial Fisheries, Regional Information Report 2A04-10, Anchorage.
Tobias, T. M. and T. M. Willette. 2004. An estimate of total return of sockeye salmon to Upper Cook Inlet, Alaska, 1976-2003. Alaska Department of Fish and Game, Division of Commercial Fisheries, Regional Information Report 2A04-11, Anchorage.
Todd, G. L., S. R. Carlson, P. A. Shields, D. L. Westerman, and L. K. Brannian. 2001. Sockeye and coho salmon escapement studies in the Susitna drainage. Alaska Department of Fish and Game, Division of Commercial Fisheries. Regional Information Report 2A01-11. Anchorage.
Westerman, D. L. and T. M. Willette. 2003. Upper Cook Inlet escapement studies, 2003. Alaska Department of Fish and Game, Division of Commercial Fisheries, Regional Information Report 2A04-03, Anchorage.
Yanusz, R., J. Carlon, D. Bosch, and R. Clark. 2002. Stock status of coho salmon in Upper Cook Inlet, a report to the Alaska Board of Fisheries. Located at: Alaska Department of Fish and Game, Division of Sport Fish, 333 Raspberry Road, Anchorage.

32

33
TABLES AND FIGURES

34
Table 1.–Offshore test fish sockeye salmon catch results, F/V Americanus, 2005.
Number Fishing Mean Water Air Beginning Ending of Time Cum Cum Length Temp Temp Salinity Wind Wind
Date Stations (min) Catch Catch Index Index (mm) (c) (c) (ppm) Vel Dir Vel Dir 01-Jul 6 231.5 47 47 35 35 556 11.2 11.8 29.0 5 NW 5 SW 02-Jul 6 230.0 43 90 33 68 544 11.0 10.7 29.3 9 S 5 SW 03-Jul 6 240.0 142 232 98 165 559 11.3 12.0 29.3 7 SW 15 S 04-Jul 6 227.5 46 278 36 201 560 11.6 11.7 28.9 5 S 5 S 05-Jul 6 239.7 68 346 47 249 568 11.5 13.8 29.6 2 S 2 S 06-Jul 6 241.0 94 440 68 317 563 11.0 13.5 29.9 5 S 5 S 07-Jul 6 246.5 171 611 118 434 565 11.2 12.8 29.9 4 S 8 S 08-Jul 6 256.0 196 807 127 561 566 11.4 12.3 29.2 10 SW 5 S 09-Jul 6 252.5 199 1,006 124 685 572 12.2 15.4 29.2 1 S 4 S 10-Jula 4 236.2 66 1,072 46 731 569 11.6 12.9 29.3 25 SW 4 S 11-Jul 6 235.0 50 1,122 36 767 568 11.9 12.8 29.0 7 SW 10 S 12-Jul 6 233.5 81 1,203 60 827 565 12.1 11.7 28.9 2 SE 2 SE 13-Jul 6 235.5 100 1,303 76 903 569 11.6 12.8 29.4 11 NE 8 NW 14-Jul 6 225.5 38 1,341 30 932 568 11.1 14.9 30.2 8 NW 3 NW 15-Jul 6 267.0 217 1,558 136 1,068 572 12.6 14.8 28.7 9 SW 13 S 16-Jul 6 252.5 35 1,593 25 1,093 578 11.7 13.1 28.9 12 NE 11 NE 17-Jul 6 227.0 39 1,632 30 1,122 570 12.3 14.0 28.4 4 SW 7 S 18-Jul 6 234.0 56 1,688 37 1,160 577 11.9 14.4 29.0 6 S 2 S 19-Jul 6 220.0 37 1,725 29 1,188 570 12.0 14.0 28.8 1 NW 4 SW 20-Jul 6 245.5 149 1,874 95 1,283 572 11.3 14.4 29.8 4 S 4 SW 21-Jul 6 267.5 294 2,168 168 1,451 576 11.1 13.2 30.4 14 S 6 S 22-Jul 6 242.0 136 2,304 94 1,545 565 11.9 15.0 29.7 4 SW 4 SE 23-Jul 6 257.0 212 2,516 133 1,678 569 11.3 13.7 30.8 2 SW 5 SW 24-Jul 6 243.0 128 2,644 91 1,769 565 11.3 13.1 30.5 5 N 16 N 25-Jul 6 256.0 238 2,882 153 1,922 567 11.5 13.1 30.3 14 NW 1 S 26-Jul 6 258.0 227 3,109 149 2,071 570 11.5 13.2 30.5 6 NW 4 NW 27-Jul 6 222.0 25 3,134 19 2,090 567 12.9 12.8 29.5 4 N 13 NW 28-Jul 6 243.5 196 3,330 148 2,238 572 11.8 13.1 30.0 5 SW 10 E 29-Jul 6 260.0 311 3,641 196 2,435 575 12.4 12.9 28.4 2 S 9 SW 30-Jul 6 287.0 467 4,108 208 2,643 571 13.1 12.8 27.8 15 SW 20 SE
a Two of the six stations were not fished due to rough water; the missing values for these stations were interpolated from day before and day after data.

35
Table 2.–Upper Cook Inlet sockeye salmon enumeration by river and date, 2005.
Kenai River Kasilof River Crescent River Yentna River Fish Creek Date Daily Cum Daily Cum Daily Cum Daily Cum Daily Cum
15-Jun 7,624 7,624
16-Jun 7,395 15,019
17-Jun 10,559 25,578
18-Jun 14,488 40,066
19-Jun 17,172 57,238
20-Jun 16,292 73,530
21-Jun 9,405 82,935
22-Jun 2,552 85,487
23-Jun 1,801 87,288
24-Jun 3,563 90,851 1,548 1,548
25-Jun 7,802 98,653 2,742 4,290
26-Jun 6,818 105,471 1,989 6,279
27-Jun 4,462 109,933 1,899 8,178
28-Jun 4,441 114,374 1,717 9,895
29-Jun 9,274 123,648 1,606 11,501
30-Jun 2,099 125,747 2,262 13,763
01-Jul 5,393 5,393 8,399 134,146 3,075 16,838
02-Jul 8,034 13,427 12,287 146,433 2,094 18,932
03-Jul 7,253 20,680 5,859 152,292 2,292 21,224
04-Jul 11,666 32,346 7,315 159,607 3,763 24,987
05-Jul 13,475 45,821 8,405 168,012 3,199 28,186
06-Jul 12,331 58,152 6,256 174,268 1,679 29,865
07-Jul 9,858 68,010 3,276 177,544 1,935 31,800 264 264 0 0
08-Jul 11,975 79,985 5,950 183,494 2,419 34,219 354 618 0 0
09-Jul 27,106 107,091 3,441 186,935 2,864 37,083 152 770 0 0
10-Jul 22,372 129,463 4,073 191,008 3,292 40,375 248 1,018 0 0
11-Jul 38,176 167,639 11,457 202,465 2,808 43,183 290 1,308 0 0
12-Jul 48,794 216,433 10,751 213,216 2,234 45,417 212 1,520 0 0
13-Jul 26,336 242,769 9,581 222,797 3,937 49,354 601 2,121 0 0
14-Jul 16,116 258,885 4,961 227,758 3,659 53,013 865 2,986 0 0
15-Jul 14,063 272,948 3,697 231,455 1,725 54,738 1,030 4,016 0 0
16-Jul 45,271 318,219 6,562 238,017 1,482 56,220 820 4,836 0 0
17-Jul 61,711 379,930 4,084 242,101 3,190 59,410 573 5,409 0 0 -continued-

36
Table 2.–Page 2 of 2.
Kenai River Kasilof River Crescent River Yentna River Fish Creek
Date Daily Cum Daily Cum Daily Cum Daily Cum Daily Cum 18-Jul 50,363 430,293 7,089 249,190 4,151 63,561 700 6,109 0 0 19-Jul 75,219 505,512 5,215 254,405 3,246 66,807 1,459 7,568 1,668 1,668 20-Jul 36,053 541,565 4,638 259,043 2,125 68,932 1,364 8,932 1,080 2,748 21-Jul 20,939 562,504 3,575 262,618 5,120 74,052 1,155 10,087 25 2,773 22-Jul 25,510 588,014 3,815 266,433 3,372 77,424 1,107 11,194 339 3,112 23-Jul 52,498 640,512 6,749 273,182 4,970 82,394 854 12,048 80 3,192 24-Jul 55,524 696,036 5,956 279,138 3,668 86,062 1,413 13,461 0 3,192 25-Jul 29,920 725,956 5,288 284,426 1,058 87,120 2,415 15,876 70 3,262 26-Jul 18,444 744,400 4,291 288,717 5,566 92,686 2,049 17,925 875 4,137 27-Jul 11,737 756,137 2,696 291,413 2,430 95,116 1,142 19,067 2,234 6,371 28-Jul 9,185 765,322 2,897 294,310 2,964 98,080 590 19,657 1,992 8,363 29-Jul 12,976 778,298 5,202 299,512 2,848 100,928 819 20,476 662 9,025 30-Jul 31,379 809,677 6,678 306,190 5,198 106,126 972 21,448 479 9,504 31-Jul 35,725 845,402 3,271 309,461 3,602 109,728 1,732 23,180 440 9,944
01-Aug 24,704 870,106 2,367 311,828 2,147 111,875 1,831 25,011 316 10,260 02-Aug 15,052 885,158 2,185 314,013 1,524 113,399 1,485 26,496 466 10,726 03-Aug 21,349 906,507 2,935 316,948 2,557 115,956 1,778 28,274 268 10,994 04-Aug 17,563 924,070 1,333 318,281 2,939 118,895 978 29,252 369 11,363 05-Aug 15,494 939,564 2,793 321,074 1,197 120,092 651 29,903 221 11,584 06-Aug 37,665 977,229 3,598 324,672 1,962 122,054 1,243 31,146 495 12,079 07-Aug 33,614 1,010,843 1,200 325,872 3,569 125,623 1,892 33,038 339 12,418 08-Aug 14,048 1,024,891 1,234 327,106 805 33,843 469 12,887 09-Aug 11,524 1,036,415 1,229 328,335 1,142 34,985 342 13,229 10-Aug 9,949 1,046,364 1,229 329,564 768 35,753 268 13,497 11-Aug 15,150 1,061,514 2,462 332,026 401 36,154 251 13,748 12-Aug 52,466 1,113,980 4,767 336,793 462 36,616 220 13,968 13-Aug 61,273 1,175,253 4,402 341,195 305 36,921 138 14,106 14-Aug 37,822 1,213,075 3,835 345,030 109 14,215 15-Aug 42,888 1,255,963 2,982 348,012 16-Aug 39,696 1,295,659 17-Aug 27,561 1,323,220 18-Aug 16,218 1,339,438 19-Aug 9,004 1,348,442 20-Aug 15,778 1,364,220 21-Aug 12,232 1,376,452

37
Table 3.–Commercial Chinook salmon catch by area and date, Upper Cook Inlet, 2005.
Upper Subdistrict Set Gillnet 244-21 244-22 244-25 244-31 244-32 244-41 244-42 Ninilchik Cohoe Kasilof Terminal South K. Beach North K. Beach Salamatof E. Forelands TOTAL
Date Daily Cum Daily Cum Daily Cum Daily Cum Daily Cum Daily Cum Daily Cum Daily Cum 6/20 25 25 26 26 19 19 70 70 6/21 35 60 16 42 16 35 67 137 6/22 22 82 37 79 25 60 84 221 6/23 48 130 50 129 22 82 120 341 6/25 28 158 54 183 31 113 113 454 6/26 34 192 62 245 26 139 122 576 6/27 59 251 46 291 33 172 138 714 6/29 85 336 225 516 49 221 359 1,073 6/30 108 444 191 707 80 301 379 1,452 7/02 64 508 76 783 53 354 193 1,645 7/03 66 574 127 910 103 457 296 1,941 7/04 58 632 114 1,024 103 560 275 2,216 7/05 14 14 14 2,230 7/06 71 703 112 1,136 36 50 62 622 281 2,511 7/07 220 923 218 1,354 178 800 616 3,127 7/08 76 126 76 3,203 7/09 103 1,026 162 1,516 13 139 114 914 392 3,595 7/10 40 179 40 3,635 7/11 62 1,088 164 1,680 132 1,046 173 173 174 174 11 11 716 4,351 7/12 60 1,148 185 1,865 126 1,172 119 292 190 364 15 26 695 5,046 7/13 95 1,243 87 1,952 50 1,222 81 373 120 484 5 31 438 5,484 7/14 111 1,354 97 2,049 57 1,279 93 466 91 575 3 34 452 5,936 7/15 95 1,449 96 2,145 60 239 34 1,313 285 6,221
-continued-

38
Table 3.–Page 2 of 7.
Upper Subdistrict Set Gillnet 244-21 244-22 244-25 244-31 244-32 244-41 244-42 Ninilchik Cohoe Kasilof Terminal South K. Beach North K. Beach Salamatof E. Forelands TOTAL
Date Daily Cum Daily Cum Daily Cum Daily Cum Daily Cum Daily Cum Daily Cum Daily Cum 7/16 133 1,582 184 2,329 147 1,460 104 570 351 926 4 38 923 7,144 7/17 109 348 109 7,253 7/18 65 1,647 208 2,537 18 366 239 1,699 134 704 496 1,422 14 52 1,174 8,427 7/19 110 1,757 180 2,717 150 1,849 127 831 362 1,784 0 52 929 9,356 7/20 92 1,849 139 2,856 105 1,954 146 977 266 2,050 10 62 758 10,114 7/21 59 1,908 128 2,984 130 2,084 149 1,126 252 2,302 11 73 729 10,843 7/22 91 457 91 10,934 7/23 60 1,968 107 3,091 211 2,295 252 1,378 262 2,564 50 123 942 11,876 7/24 33 2,001 157 3,248 171 2,466 119 1,497 246 2,810 366 489 1,092 12,968 7/25 39 2,040 133 3,381 179 2,645 161 1,658 362 3,172 18 507 892 13,860 7/26 101 2,141 80 3,461 218 2,863 157 1,815 301 3,473 12 519 869 14,729 7/27 83 2,224 129 3,590 238 3,101 279 2,094 426 3,899 157 676 1,312 16,041 7/28 142 2,366 188 3,778 205 3,306 189 2,283 283 4,182 10 686 1,017 17,058 7/29 141 598 141 17,199 7/30 84 2,450 96 3,874 31 629 114 3,420 73 2,356 77 4,259 2 688 477 17,676 7/31 36 2,486 151 4,025 178 3,598 187 2,543 136 4,395 7 695 695 18,371 8/01 65 2,551 133 4,158 131 3,729 120 2,663 229 4,624 2 697 680 19,051 8/03 26 2,577 149 4,307 101 3,830 75 2,738 164 4,788 0 697 515 19,566 8/04 12 2,589 109 4,416 131 3,961 129 2,867 174 4,962 4 701 559 20,125 8/06 16 2,605 107 4,523 97 4,058 68 2,935 142 5,104 3 704 433 20,558 8/07 20 2,625 147 4,670 88 4,146 138 3,073 140 5,244 2 706 535 21,093 8/08 23 2,648 88 4,758 83 4,229 109 3,182 108 5,352 3 709 414 21,507 8/09 21 2,669 64 4,822 95 4,324 73 3,255 89 5,441 1 710 343 21,850 8/10 25 2,694 28 4,850 80 4,404 29 3,284 81 5,522 8 718 251 22,101
-continued-

39
Table 3.–Page 3 of 7.
Central District - West Side Set Gillnet
245-10 245-20 245-30 245-40 245-50 245-55 245-60 246-10 246-20
Chinitna Bay Silv. Salmon Tuxedni Bay Polly Cr. L. J. Slough Big River W. Forelands Kalgin - West Kalgin - East Total
Date Daily Cum Daily Cum Daily Cum Daily Cum Daily Cum Daily Cum Daily Cum Daily Cum Daily Cum Daily Cum
6/01 40 40 40 40
6/03 26 26 30 70 56 96
6/06 31 57 57 127 88 184
6/08 2 59 2 186
6/10 8 67 69 196 77 263
6/13 199 395 199 462
6/15 19 86 22 417 41 503
6/16 15 15 15 518
6/17 9 426 9 527
6/20 1 87 8 434 9 536
6/22 6 440 6 542
6/23 12 27 12 554
6/24 4 444 4 558
6/27 39 66 4 448 1 1 44 602
6/28 9 75 2 2 11 613
6/29 11 86 11 624
6/30 7 93 3 451 10 634
7/02 7 100 7 641 -continued-

40
Table 3.–Page 4 of 7.
Central District - West Side Set Gillnet 245-10 245-20 245-30 245-40 245-50 245-55 245-60 246-10 246-20 Chinitna Bay Silv. Salmon Tuxedni Bay Polly Cr. L. J. Slough Big River W. Forelands Kalgin - West Kalgin - East Total
Date Daily Cum Daily Cum Daily Cum Daily Cum Daily Cum Daily Cum Daily Cum Daily Cum Daily Cum Daily Cum 7/03 14 114 14 655 7/04 1 1 4 118 5 660 7/05 8 126 8 668 7/06 13 139 13 681 7/07 12 151 5 7 2 453 19 700 7/08 5 156 5 705 7/09 6 162 5 12 11 716 7/11 3 165 2 455 5 721 7/12 1 166 1 13 2 723 7/14 1 167 1 724 7/16 1 168 1 725 7/17 1 169 1 726 7/21 1 170 1 727 7/25 1 456 2 3 3 730 7/28 1 457 1 731 7/29 1 171 1 732 7/30 1 4 1 733 801 1 172 1 734 8/08 2 459 2 736 8/15 1 173 1 737 8/18 2 175 2 739
-continued-
41
Table 3.–Page 5 of 7.
Northern District Set Gillnet
247-10 247-20 247-30 247-41 247-42 247-43 247-70 247-80 247-90
Trading Bay Tyonek Beluga Su. Flats Pt. McKenzie Fire Island Pt. Posession Birch Hill #3 Bay Total
Date Daily Cum Daily Cum Daily Cum Daily Cum Daily Cum Daily Cum Daily Cum Daily Cum Daily Cum Daily Cum
30-May 166 166 320 320 224 224 203 203 85 85 160 160 5 5 1,163 1,163
6-Jun 103 269 430 750 290 290 97 321 60 263 69 154 65 225 18 18 31 36 1,163 2,326
13-Jun 26 295 385 1,135 98 419 113 376 129 283 33 258 34 52 818 3,144
18-Jul 68 358 68 3,212
20-Jun 6 1,141 6 3,218
27-Jun 92 1,233 7 426 3 379 5 288 1 259 52 1 37 109 3,327
30-Jun 15 1,248 4 430 1 289 1 38 21 3,348
4-Jul 1 1,249 2 360 1 431 3 382 7 3,355
7-Jul 2 1,251 4 435 2 384 8 3,363
11-Jul 1 436 1 3,364
14-Jul 1 53 1 3,365
18-Jul 2 1,253 2 438 1 385 5 3,370
8-Aug 1 39 1 3,371
15-Aug 1 260 1 3,372
29-Aug 1 40 1 3,373 -continued-

42
Table 3.–Page 6 of 7.
Central District Drift Gillnet 244-25 244-61 244-55 244-60 Kasilof Terminal Kasilof Section Kenai/Kasilof Section District Wide Total
Date Deliveries Daily Cum Daily Cum Daily Cum Daily Cum Daily Cum 6/20 28 9 9 9 6/23 104 18 18 27 6/25 11 4 4 31 6/26 7 6 6 37 6/27 197 52 52 89 6/29 34 16 16 105 6/30 249 143 143 248 7/02 50 6 6 254 7/03 5 2 2 256 7/04 360 159 159 415 7/05 35 4 4 419 7/06 47 4 7 11 430 7/07 316 112 112 542 7/08 24 28 28 570 7/09 122 55 33 88 658 7/10 14 8 8 666 7/11 405 63 63 729 7/12 160 38 38 767 7/13 204 59 59 826 7/14 440 53 53 879 7/15 237 13 40 53 932 7/16 346 105 105 1,037 7/17 7 6 6 1,043
-continued-

43
Table 3.–Page 7 of 7.
Central District Drift Gillnet 244-25 244-61 244-55 244-60 Kasilof Terminal Kasilof Section Kenai/Kasilof Section District Wide Total
Date Deliveries Daily Cum Daily Cum Daily Cum Daily Cum Daily Cum 7/18 448 80 80 1,123 7/19 280 100 100 1,223 7/20 283 171 171 1,394 7/21 424 63 63 1,457 7/22 327 1 58 59 1,516 7/23 308 59 59 1,575 7/24 206 43 43 1,618 7/25 425 37 37 1,655 7/26 244 39 39 1,694 7/27 301 51 51 1,745 7/28 393 77 77 1,822 7/29 245 32 32 1,854 7/30 268 9 9 1,863 7/31 141 8 8 1,871 8/01 362 14 14 1,885 8/02 71 7 7 1,892 8/03 97 16 16 1,908 8/04 256 14 14 1,922 8/05 122 10 10 1,932 8/06 63 5 5 1,937 8/08 183 12 12 1,949 8/09 61 4 4 1,953 8/10 17 1 1 1,954 8/11 38 2 2 1,956 8/15 20 2 2 1,958
44
Table 4.–Commercial sockeye salmon catch by area and date, Upper Cook Inlet, 2005.
Upper Subdistrict Set Gillnet
244-21 244-22 244-25 244-31 244-32 244-41 244-42
Ninilchik Cohoe Kasilof Terminal South K. Beach North K. Beach Salamatof E. Forelands TOTAL
Date Daily Cum Daily Cum Daily Cum Daily Cum Daily Cum Daily Cum Daily Cum Daily Cum
6/20 7,562 7,562 12,909 12,909 14,037 14,037 34,508 34,508
6/21 12,908 20,470 7,475 20,384 7,477 21,514 27,860 62,368
6/22 11,813 32,283 12,117 32,501 13,665 35,179 37,595 99,963
6/23 9,996 42,279 8,721 41,222 9,467 44,646 28,184 128,147
6/25 12,733 55,012 14,053 55,275 10,694 55,340 37,480 165,627
6/26 9,408 64,420 7,673 62,948 9,799 65,139 26,880 192,507
6/27 12,509 76,929 8,501 71,449 7,516 72,655 28,526 221,033
6/29 15,841 92,770 17,378 88,827 11,529 84,184 44,748 265,781
6/30 12,572 105,342 10,626 99,453 13,313 97,497 36,511 302,292
7/02 13,212 118,554 9,974 109,427 7,663 105,160 30,849 333,141
7/03 11,689 130,243 10,353 119,780 11,185 116,345 33,227 366,368
7/04 8,399 138,642 8,976 128,756 11,033 127,378 28,408 394,776
7/05 138,642 128,756 3,985 3,985 127,378 3,985 398,761
7/06 7,661 146,303 8,393 137,149 4,972 8,957 5,840 133,218 26,866 425,627
7/07 10,961 157,264 8,472 145,621 8,957 9,763 142,981 29,196 454,823
7/08 157,264 145,621 11,720 20,677 142,981 11,720 466,543
7/09 12,269 169,533 11,117 156,738 2,331 23,008 10,795 153,776 36,512 503,055
7/10 169,533 156,738 6,523 29,531 153,776 6,523 509,578
7/11 12,895 182,428 13,450 170,188 29,531 12,692 166,468 26,686 26,686 37,186 37,186 5,740 5,740 108,649 618,227
7/12 6,432 188,860 14,162 184,350 29,531 15,166 181,634 13,448 40,134 48,580 85,766 8,842 14,582 106,630 724,857
7/13 4,024 192,884 3,898 188,248 29,531 6,308 187,942 9,894 50,028 13,054 98,820 1,999 16,581 39,177 764,034
7/14 3,437 196,321 2,824 191,072 29,531 2,011 189,953 4,818 54,846 10,380 109,200 1,704 18,285 25,174 789,208
7/15 5,161 201,482 4,752 195,824 6,215 35,746 6,934 196,887 54,846 109,200 18,285 23,062 812,270 -continued-
45
Table 4.–Page 2 of 8.
Upper Subdistrict Set Gillnet 244-21 244-22 244-25 244-31 244-32 244-41 244-42 Ninilchik Cohoe Kasilof Terminal South K. Beach North K. Beach Salamatof E. Forelands TOTAL
Date Daily Cum Daily Cum Daily Cum Daily Cum Daily Cum Daily Cum Daily Cum Daily Cum7/16 6,404 207,886 7,568 203,392 35,746 23,137 220,024 33,637 88,483 36,984 146,184 4,283 22,568 112,013 924,2837/17 207,886 203,392 11,743 47,489 220,024 88,483 146,184 22,568 11,743 936,0267/18 9,897 217,783 9,344 212,736 1,131 48,620 27,504 247,528 48,613 137,096 61,867 208,051 7,313 29,881 165,669 1,101,6957/19 6,336 224,119 5,820 218,556 48,620 10,372 257,900 10,591 147,687 18,301 226,352 888 30,769 52,308 1,154,0037/20 5,098 229,217 4,631 223,187 48,620 4,341 262,241 5,560 153,247 29,226 255,578 4,307 35,076 53,163 1,207,1667/21 3,801 233,018 4,470 227,657 48,620 7,111 269,352 7,947 161,194 40,142 295,720 5,723 40,799 69,194 1,276,3607/22 233,018 227,657 16,559 65,179 269,352 161,194 295,720 40,799 16,559 1,292,9197/23 5,153 238,171 7,753 235,410 65,179 14,940 284,292 14,195 175,389 74,696 370,416 15,394 56,193 132,131 1,425,0507/24 5,907 244,078 9,566 244,976 65,179 12,427 296,719 8,640 184,029 50,650 421,066 9,798 65,991 96,988 1,522,0387/25 6,056 250,134 8,275 253,251 65,179 8,860 305,579 7,574 191,603 27,883 448,949 6,059 72,050 64,707 1,586,7457/26 6,713 256,847 11,035 264,286 65,179 10,827 316,406 6,462 198,065 16,224 465,173 5,200 77,250 56,461 1,643,2067/27 13,351 270,198 17,185 281,471 65,179 9,042 325,448 6,339 204,404 16,993 482,166 5,794 83,044 68,704 1,711,9107/28 18,030 288,228 45,303 326,774 65,179 11,564 337,012 14,849 219,253 19,911 502,077 6,704 89,748 116,361 1,828,2717/29 288,228 326,774 10,975 76,154 337,012 219,253 502,077 89,748 10,975 1,839,2467/30 3,411 291,639 5,010 331,784 1,753 77,907 5,210 342,222 6,442 225,695 43,272 545,349 10,018 99,766 75,116 1,914,3627/31 16,697 308,336 21,410 353,194 77,907 15,828 358,050 15,580 241,275 24,928 570,277 7,273 107,039 101,716 2,016,0788/01 12,312 320,648 15,032 368,226 77,907 9,202 367,252 9,718 250,993 8,703 578,980 2,806 109,845 57,773 2,073,8518/03 2,888 323,536 12,297 380,523 77,907 11,101 378,353 7,485 258,478 21,468 600,448 2,234 112,079 57,473 2,131,3248/04 1,993 325,529 4,126 384,649 77,907 6,635 384,988 10,805 269,283 33,039 633,487 6,793 118,872 63,391 2,194,7158/06 944 326,473 2,860 387,509 77,907 4,836 389,824 6,518 275,801 55,493 688,980 12,488 131,360 83,139 2,277,8548/07 917 327,390 3,357 390,866 77,907 4,823 394,647 10,097 285,898 38,852 727,832 15,692 147,052 73,738 2,351,5928/08 1,189 328,579 2,764 393,630 77,907 7,647 402,294 12,317 298,215 30,767 758,599 14,581 161,633 69,265 2,420,8578/09 572 329,151 1,237 394,867 77,907 3,463 405,757 4,971 303,186 22,529 781,128 10,844 172,477 43,616 2,464,4738/10 672 329,823 784 395,651 77,907 7,904 413,661 8,359 311,545 29,574 810,702 22,075 194,552 69,368 2,533,841
-continued-

46
Table 4.–Page 3 of 8.
Central District - West Side Set Gillnet
245-10 245-20 245-30 245-40 245-50 245-55 245-60 246-10 246-20 Chinitna Bay Silv. Salmon Tuxedni Bay Polly Cr. L. J. Slough Big River W. Forelands Kalgin - West Kalgin - East Total
Date Daily Cum Daily Cum Daily Cum Daily Cum Daily Cum Daily Cum Daily Cum Daily Cum Daily Cum Daily Cum6/01 666 666 666 6666/03 727 727 1,833 2,499 2,560 3,2266/06 456 1,183 2,523 5,022 2,979 6,2056/08 424 1,607 490 5,512 914 7,1196/10 433 2,040 1,097 6,609 1,530 8,6496/13 67 2,107 1,270 7,879 1,337 9,9866/15 124 2,231 798 8,677 922 10,9086/16 366 366 47 47 413 11,3216/17 47 793 9,470 793 12,1146/20 47 174 2,405 1,455 10,925 1,629 13,7436/22 47 1,349 12,274 1,349 15,0926/23 1,011 1,377 47 1,011 16,1036/24 47 1,180 13,454 1,180 17,2836/27 4 4 621 1,998 20 20 50 97 1,915 15,369 263 263 2,873 20,1566/28 4 1,202 3,200 99 119 97 1,301 21,4576/29 4 894 4,094 97 894 22,3516/30 4 1,473 5,567 33 152 97 975 16,344 280 543 2,761 25,1127/02 4 1,809 7,376 140 292 97 1,949 27,061
-continued-

47
Table 4.–Page 4 of 8.
Central District - West Side Set Gillnet
245-10 245-20 245-30 245-40 245-50 245-55 245-60 246-10 246-20
Chinitna Bay Silv. Salmon Tuxedni Bay Polly Cr. L. J. Slough Big River W. Forelands Kalgin - West Kalgin - East Total
Date Daily Cum Daily Cum Daily Cum Daily Cum Daily Cum Daily Cum Daily Cum Daily Cum Daily Cum Daily Cum
7/03 1,080 8,456 1,080 28,141
7/04 12 12 880 9,336 593 16,937 181 724 1,666 29,807
7/05 1,660 10,996 1,660 31,467
7/06 705 11,701 705 32,172
7/07 208 220 1,969 13,670 32 324 1,008 17,945 3,217 35,389
7/08 1,816 15,486 1,816 37,205
7/09 1,522 17,008 176 500 1,698 38,903
7/11 5 9 1,381 18,389 20 117 4,703 22,648 6,109 45,012
7/12 1,695 20,084 66 566 1,761 46,773
7/14 2,410 22,494 29 595 540 657 1,726 24,374 565 1,289 5,270 52,043
7/16 1,314 23,808 1,314 53,357
7/17 1,515 25,323 18 613 1,533 54,890
7/18 4 13 389 25,712 42 655 406 1,063 79 79 3,191 27,565 1,642 2,931 5,753 60,643
7/19 396 26,108 396 61,039
7/21 1,491 27,599 415 1,478 63 142 9,199 36,764 3,990 6,921 15,158 76,197
7/23 3,125 30,724 3,125 79,322
7/25 1,331 32,055 96 238 7,437 44,201 3,143 10,064 12,007 91,329
7/28 2,485 34,540 528 2,006 2,125 46,326 1,396 11,460 6,534 97,863-continued-

48
Table 4.–Page 5 of 8.
Central District - West Side Set Gillnet
245-10 245-20 245-30 245-40 245-50 245-55 245-60 246-10 246-20
Chinitna Bay Silv. Salmon Tuxedni Bay Polly Cr. L. J. Slough Big River W. Forelands Kalgin - West Kalgin - East Total
Date Daily Cum Daily Cum Daily Cum Daily Cum Daily Cum Daily Cum Daily Cum Daily Cum Daily Cum Daily Cum
7/29 1,863 36,403 1,863 99,726
7/30 1,050 37,453 1,918 48,244 623 12,083 3,591 103,317
8/01 1,633 39,086 582 2,588 2,214 50,458 1,512 13,595 5,941 109,258
8/03 462 39,548 462 109,720
8/04 1,053 40,601 510 3,098 7,583 58,041 4,173 17,768 13,319 123,039
8/05 1,095 41,696 1,095 124,134
8/06 3,049 61,090 2,086 19,854 5,135 129,269
8/08 986 42,682 23 2,428 4,631 65,721 1,954 21,808 7,594 136,863
8/10 4,745 70,466 2,678 24,486 7,423 144,286
8/11 595 43,277 772 3,870 3,800 74,266 1,768 26,254 6,935 151,221
8/15 293 43,570 685 4,555 1,390 75,656 1,552 27,806 3,920 155,141
8/17 69 75,725 388 28,194 457 155,598
8/18 74 43,644 394 4,949 305 76,030 220 28,414 993 156,591
8/22 175 5,124 114 28,528 289 156,880
8/25 110 5,234 209 76,239 120 28,648 439 157,319
8/29 191 76430 55 28,703 246 157,5659/01 34 76464 34 157,599
9/08 13 76477 13 157,612-continued-

49
Table 4.–Page 6 of 8.
Northern District Set Gillnet 247-10 247-20 247-30 247-41 247-42 247-43 247-70 247-80 247-90 Trading Bay Tyonek Beluga Su. Flats Pt. McKenzie Fire Island Pt. Posession Birch Hill #3 Bay Total
Date Daily Cum Daily Cum Daily Cum Daily Cum Daily Cum Daily Cum Daily Cum Daily Cum Daily Cum Daily Cum5/30 146 146 22 22 2 2 11 11 11 11 5 5 144 144 426 426 112 112 879 8796/06 52 198 34 56 12 14 101 112 2 13 9 14 314 458 58 484 185 297 767 1,6466/13 33 231 11 67 14 3 115 12 25 5 19 67 525 484 297 131 1,7776/20 231 6 73 14 115 25 19 525 484 297 6 1,7836/27 231 481 554 14 14 129 13 38 16 35 6 531 484 367 664 897 2,6806/30 231 739 1,293 14 23 152 9 47 102 137 531 484 700 1,364 1,573 4,2537/04 231 380 1,673 49 63 144 296 164 211 35 172 655 1,186 86 570 554 1,918 2,067 6,3207/07 231 480 2,153 230 293 125 421 196 407 172 594 1,780 570 401 2,319 2,026 8,3467/11 231 2,153 1,671 1,964 222 643 160 567 397 569 814 2,594 871 1,441 212 2,531 4,347 12,6937/14 63 294 375 2,528 1,964 161 804 199 766 194 763 191 2,785 1,441 93 2,624 1,276 13,9697/18 294 391 2,919 1,964 716 1,520 293 1,059 179 942 620 3,405 1,441 621 3,245 2,820 16,7898/01 294 2,919 1,964 1,520 1,059 942 3,405 435 1,876 3,245 435 17,2248/04 294 2,919 113 2,077 1,520 1,059 942 3,405 437 2,313 3,245 550 17,7748/08 25 319 478 3,397 17 2,094 65 1,585 90 1,149 232 1,174 1,092 4,497 222 2,535 692 3,937 2,913 20,6878/11 319 103 3,500 14 2,108 136 1,721 71 1,220 110 1,284 242 4,739 137 2,672 1,280 5,217 2,093 22,7808/15 319 3,500 37 2,145 201 1,922 39 1,259 64 1,348 689 5,428 2,672 284 5,501 1,314 24,0948/18 319 30 3,530 2 2,147 19 1,941 9 1,268 21 1,369 92 5,520 2,672 5,501 173 24,2678/22 319 3,530 2,147 13 1,954 1,268 1,369 5,520 11 2,683 5,501 24 24,2918/25 319 3,530 2,147 9 1,963 5 1,273 10 1,379 5,520 13 2,696 5,501 37 24,3288/29 319 3,530 2,147 1,963 1,273 2 1,381 72 5,592 1 2,697 177 5,678 252 24,5809/01 319 3,530 2,147 1,963 1,273 1,381 38 5,630 4 2,701 44 5,722 86 24,6669/05 319 3,530 2,147 1,963 1,273 1,381 27 5,657 2,701 5,722 27 24,6938/08 319 3,530 2,147 1,963 1,273 1,381 46 5,703 2,701 5,722 46 24,7399/12 319 3,530 2,147 1,963 1,273 1,381 12 5,715 2,701 0 5,722 12 24,7519/15 319 3,530 2,147 1,963 1,273 1,381 5,715 2,701 2 5,724 2 24,753
-continued-

50
Table 4.–Page 7 of 8.
Central District Drift Gillnet 244-25 244-61 244-55 244-60 Kasilof Terminal Kasilof Section Kenai/Kasilof Section District Wide Total
Date Deliveries Daily Cum Daily Cum Daily Cum Daily Cum Daily Cum6/20 28 1,759 1,759 1,759 1,7596/21 <4 81 81 81 1,8406/22 5 778 859 778 2,6186/23 104 10,552 12,311 10,552 13,1706/25 11 482 1,341 482 13,6526/26 7 503 1,844 503 14,1556/27 197 20,384 32,695 20,384 34,5396/29 34 3,159 5,003 3,159 37,6986/30 249 30,723 63,418 30,723 68,42170/2 50 1,974 6,977 1,974 70,3957/03 5 145 7,122 145 70,5407/04 360 63,795 127,213 63,795 134,3357/05 35 1,611 1,611 1,611 135,9467/06 47 1,372 2,983 1,270 8,392 2,642 138,5887/07 316 112,174 239,387 112,174 250,7627/08 24 2,697 5,680 2,697 253,4597/09 122 6,318 11,998 3,939 12,331 10,257 263,7167/10 14 1,721 13,719 1,721 265,4377/11 405 244,130 483,517 244,130 509,5677/12 160 26,229 26,229 26,229 535,7967/13 204 25,206 51,435 25,206 561,0027/14 440 176,127 659,644 176,127 737,1297/15 237 2,399 16,118 71,455 83,786 73,854 810,9837/16 346 103,333 154,768 103,333 914,3167/17 7 1,781 17,899 1,781 916,0977/18 448 230,353 889,997 230,353 1,146,4507/19 280 53,055 207,823 53,055 1,199,505
-continued-

51
Table 4.–Page 8 of 8.
Central District Drift Gillnet 244-25 244-61 244-55 244-60 Kasilof Terminal Kasilof Section Kenai/Kasilof Section District Wide Total Date Deliveries Daily Cum Daily Cum Daily Cum Daily Cum Daily Cum 7/20 283 36,628 244,451 36,628 1,236,133 7/21 424 142,653 1,032,650 142,653 1,378,786 7/22 327 1,393 19,292 99,334 343,785 100,727 1,479,513 7/23 308 80,801 424,586 80,801 1,560,314 7/24 206 35,388 459,974 35,388 1,595,702 7/25 425 127,842 1,160,492 127,842 1,723,544 7/26 244 52,595 512,569 52,595 1,776,139 7/27 301 102,456 615,025 102,456 1,878,595 7/28 393 262,056 1,422,548 262,056 2,140,651 7/29 245 61,979 677,004 61,979 2,202,630 7/30 268 95,034 1,517,582 95,034 2,297,664 7/31 141 29,714 706,718 29,714 2,327,378 8/01 362 38,493 1,556,075 38,493 2,365,871 8/02 71 3,150 709,868 3,150 2,369,021 8/03 97 21,409 731,277 21,409 2,390,430 8/04 256 48,811 1,604,886 48,811 2,439,241 8/05 122 16,280 747,557 16,280 2,455,521 8/06 63 8,813 756,370 8,813 2,464,334 8/07 45 8,265 764,635 8,265 2,472,599 8/08 183 29,515 1,634,401 29,515 2,502,114 8/09 61 7,986 772,621 7,986 2,510,100 8/10 17 2,938 775,559 2,938 2,513,038 8/11 38 4,542 1,638,943 4,542 2,517,580 8/15 20 2,042 1,640,985 2,042 2,519,622 8/18 6 313 1,641,298 313 2,519,935 8/22 6 30 775,589 136 1,641,434 166 2,520,101 8/25 5 190 1,641,624 190 2,520,291 8/29 1 9 1,641,633 9 2,520,300

52
Table 5.–Commercial coho salmon catch by area and date, Upper Cook Inlet, 2005.
Upper Subdistrict Set Gillnet
244-21 244-22 244-25 244-31 244-32 244-41 244-42
Ninilchik Cohoe Kasilof Terminal South K. Beach N. K. beach Salamatof E. Forelands TOTAL
Date Daily Cum Daily Cum Daily Cum Daily Cum Daily Cum Daily Cum Daily Cum Daily Cum
6/22 1 1 1 1
6/29 1 1 1 2 2 3
6/30 1 3 1 4
7/02 1 2 1 5
7/04 2 4 2 7
7/06 2 6 1 1 3 10
7/07 10 13 0 1 10 20
7/09 1 7 2 2 2 3 5 25
7/11 2 9 4 17 2 5 4 4 10 10 13 13 35 60
7/12 1 10 2 19 17 22 1 5 8 18 32 45 61 121
7/13 7 17 4 23 11 33 1 6 11 29 18 63 52 173
7/14 1 18 1 24 0 33 19 48 10 73 31 204
7/15 190 208 1 25 1 34 6 48 73 192 396
7/16 7 215 3 28 2 36 1 7 80 128 160 233 253 649
7/17 28 1 3 36 7 128 233 1 650
7/18 12 227 3 31 1 37 8 15 131 259 531 764 686 1,336
7/19 15 242 15 46 1 38 3 18 54 313 34 798 122 1,458 -continued-

53
Table 5.–Page 2 of 7.
Upper Subdistrict Set Gillnet
244-21 244-22 244-25 244-31 244-32 244-41 244-42
Ninilchik Cohoe Kasilof Terminal South K. Beach North K. Beach Salamatof E. Forelands TOTAL
Date Daily Cum Daily Cum Daily Cum Daily Cum Daily Cum Daily Cum Daily Cum Daily Cum
7/20 2 244 0 46 1 39 1 19 51 364 101 899 156 1,614
7/21 3 247 1 47 1 20 73 437 202 1,101 280 1,894
7/22 1 4 20 1 1,895
7/23 10 257 3 50 12 32 90 527 237 1,338 352 2,247
7/24 6 263 13 63 5 44 6 38 120 647 211 1,549 361 2,608
7/25 12 275 16 79 5 49 5 43 65 712 166 1,715 269 2,877
7/26 17 292 12 91 8 57 6 49 107 819 120 1,835 270 3,147
7/27 57 349 86 177 36 93 23 72 125 944 119 1,954 446 3,593
7/28 441 790 1,471 1,648 312 405 164 236 1,164 2,108 310 2,264 3,862 7,455
7/29 50 54 236 50 7,505
7/30 51 841 74 1,722 4 58 40 445 7 243 614 2,722 280 2,544 1,070 8,575
7/31 201 1,042 387 2,109 83 528 86 329 722 3,444 377 2,921 1,856 10,431
8/01 254 1,296 249 2,358 53 581 72 401 424 3,868 445 3,366 1,497 11,928
8/03 89 1,385 142 2,500 25 606 32 433 128 3,996 118 3,484 534 12,462
8/04 81 1,466 50 2,550 19 625 34 467 203 4,199 156 3,640 543 13,005
8/06 67 1,533 115 2,665 47 672 77 544 322 4,521 212 3,852 840 13,845
8/07 119 1,652 241 2,906 84 756 156 700 526 5,047 316 4,168 1,442 15,287
8/08 133 1,785 172 3,078 61 817 263 963 486 5,533 395 4,563 1,510 16,797
8/09 40 1,825 187 3,265 110 927 132 1,095 465 5,998 129 4,692 1,063 17,860
8/10 139 1,964 114 3,379 178 1,105 152 1,247 624 6,622 476 5,168 1,683 19,543 -continued-

54
Table 5.–Page 3 of 7.
Central District - West Side Set Gillnet
245-10 245-20 245-30 245-40 245-50 245-55 245-60 246-10 246-20
Chinitna Bay Silv. Salmon Tuxedni Bay Polly Cr. L. J. Slough Big River W. Forelands Kalgin - West Kalgin - East Total
Date Daily Cum Daily Cum Daily Cum Daily Cum Daily Cum Daily Cum Daily Cum Daily Cum Daily Cum Daily Cum
6/27 1 1 2 2 1 1 4 4
6/29 12 13 12 16
6/30 1 14 5 7 6 22
70/2 1 15 1 23
7/03 1 16 1 24
7/04 1 17 3 10 4 28
7/05 4 21 4 32
7/06 1 22 1 33
7/07 6 28 18 28 24 57
7/08 20 48 20 77
7/09 7 55 7 84
7/11 1 1 14 69 87 115 102 186
7/12 23 92 23 209
7/14 84 176 6 6 228 343 53 54 371 580
7/16 92 268 92 672
7/17 105 373 105 777
7/18 4 5 25 398 10 16 42 42 628 971 137 191 846 1,623
7/19 26 424 26 1,649 7/21 126 550 47 63 56 98 1,007 1,978 279 470 1,515 3,164 7/23 369 919 369 3,533
-continued-

55
Table 5.–Page 4 of 7.
Central District - West Side Set Gillnet
245-10 245-20 245-30 245-40 245-50 245-55 245-60 246-10 246-20
Chinitna Bay Silv. Salmon Tuxedni Bay Polly Cr. L. J. Slough Big River W. Forelands Kalgin - West Kalgin - East Total
Date Daily Cum Daily Cum Daily Cum Daily Cum Daily Cum Daily Cum Daily Cum Daily Cum Daily Cum Daily Cum
7/25 274 1,193 58 156 1,722 3,700 582 1,052 2,636 6,169
7/28 537 1,730 378 441 1,493 5,193 459 1,511 2,867 9,036
7/29 196 1,926 196 9,232
7/30 295 2,221 1,509 6,702 78 1,589 1,882 11,114
8/01 215 2,436 160 601 2,692 9,394 792 2,381 3,859 14,973
8/03 153 2,589 153 15,126
8/04 449 3,038 208 809 2,041 11,435 374 2,755 3,072 18,198
8/05 718 3,756 718 18,916
8/06 661 12,096 645 3,400 1,306 20,222
8/08 563 4,319 256 256 1,193 13,289 651 4,051 2,663 22,885
8/10 562 13,851 198 4,249 760 23,645
8/11 397 4,716 323 1,132 187 443 774 14,625 391 4,640 2,072 25,717
8/15 517 5,233 526 1,658 948 15,573 328 4,968 2,319 28,036
8/17 30 15,603 56 5,024 86 28,122
8/18 97 5,330 467 2,125 79 15,682 13 5,037 656 28,778
8/22 13 18 267 2,392 94 5,131 374 29,152
8/25 120 2,512 38 15,720 10 5,141 168 29,320
8/29 16 15,736 20 5,161 36 29,356
9/01 26 15,762 26 29,3829/08 36 15,798 36 29,418
9/12 84 15,882 84 29,502-continued-

56
Table 5.–Page 5 of 7.
Northern District Set Gillnet
247-10 247-20 247-30 247-41 247-42 247-43 247-70 247-80 247-90
Trading Bay Tyonek Beluga Su. Flats Pt. McKenzie Fire Island Pt. Possession Birch Hill #3 Bay Total
Date Daily Cum Daily Cum Daily Cum Daily Cum Daily Cum Daily Cum Daily Cum Daily Cum Daily Cum Daily Cum
6/27 1 1 1 1 2 2
6/30 0 1 1 2 1 3
7/04 7 8 3 5 2 2 1 1 13 16
7/07 0 8 4 9 4 6 5 5 1 2 14 30
7/11l 8 9 9 15 24 8 14 27 27 6 11 3 5 68 98
7/14 78 78 129 137 42 51 52 76 38 52 20 47 29 40 3 8 391 489
7/18l 78 442 579 2,406 2,457 277 353 256 308 100 147 176 216 167 167 30 38 3,854 4,343
8/08 65 143 1,981 2,560 87 2,544 725 1,078 737 1,045 644 791 451 667 163 330 15 53 4,868 9,211
8/11 1,335 3,895 46 2,590 1,308 2,386 1,085 2,130 941 1,732 109 776 129 459 94 147 5,047 14,258
8/15 372 4,267 460 3,050 1,584 3,970 700 2,830 1,169 2,901 1,318 2,094 872 1,331 256 403 6,731 20,989
8/18 752 5,019 120 3,170 238 4,208 136 2,966 444 3,345 360 2,454 325 1,656 143 546 2,518 23,507
8/22 113 4,321 2,966 3,345 2,454 1,656 677 1,223 790 24,297
8/25 128 4,449 145 3,111 424 3,769 500 2,954 631 2,287 1,223 1,828 26,125
8/29 4,449 84 3,195 259 4,028 387 3,341 55 2,342 542 1,765 1,327 27,452
9/01 34 4,483 41 3,236 537 3,878 390 2,732 508 2,273 1,510 28,962
9/05 10 3,246 427 4,305 139 2,871 2,273 576 29,538
9/08 333 4,638 497 3,368 2,273 830 30,368
9/12 120 4,758 124 3,492 48 2,321 292 30,660
9/15 199 2,520 199 30,859-continued-

57
Table 5.–Page 6 of 7.
Central District Drift Gillnet
244-25 244-61 244-55 244-60
Kasilof Terminal Kasilof Section Kenai/Kasilof Section District Wide Total
Date Deliveries Daily Cum Daily Cum Daily Cum Daily Cum Daily Cum
6/20 28 1 1 1 1
6/23 104 7 8 7 8
6/27 197 26 34 26 34
6/30 249 94 128 94 128
7/04 360 286 414 286 414
7/07 316 1,025 1,439 1,025 1,439
7/08 24 8 8 1,439 8 1,447
7/09 122 1 9 5 5 1,439 6 1,453
7/11 405 9 5 1,776 3,215 1,776 3,229
7/12 160 9 5 35 35 3,215 35 3,264
7/13 204 9 5 37 72 3,215 37 3,301
7/14 440 9 5 72 1,989 5,204 1,989 5,290
7/15 237 1 10 69 74 72 5,204 70 5,360
7/16 346 10 501 573 5,204 501 5,861
7/18 448 10 573 4,965 10,169 4,965 10,826
7/19 280 10 654 1,227 10,169 654 11,480
7/20 283 10 417 1,644 10,169 417 11,897
7/21 424 10 1,644 14,844 25,013 14,844 26,741
7/22 327 1 11 1,418 3,062 25,013 1,419 28,160
7/23 308 783 3,845 25,013 783 28,943
7/24 206 614 4,459 25,013 614 29,557 -continued-
58
Table 5.–Page 7 of 7.
Central District Drift Gillnet
244-25 244-61 244-55 244-60
Kasilof Terminal Kasilof Section Kenai/Kasilof Section District Wide Total
Date Deliveries Daily Cum Daily Cum Daily Cum Daily Cum Daily Cum
7/25 425 4,459 16,637 41,650 16,637 46,194
7/26 244 1,587 6,046 41,650 1,587 47,781
7/27 301 4,750 10,796 41,650 4,750 52,531
7/28 393 10,796 39,827 81,477 39,827 92,358
7/29 245 3,437 14,233 81,477 3,437 95,795
7/30 268 14,233 9,637 91,114 9,637 105,432
7/31 141 4,653 18,886 91,114 4,653 110,085
8/01 362 18,886 6,918 98,032 6,918 117,003
8/02 71 139 19,025 98,032 139 117,142
8/03 97 953 19,978 98,032 953 118,095
8/04 256 19,978 8,613 106,645 8,613 126,708
8/05 122 664 20,642 106,645 664 127,372
8/06 63 390 21,032 106,645 390 127,762
8/07 45 299 21,331 106,645 299 128,061
8/08 183 21,331 5,188 111,833 5,188 133,249
8/09 61 450 21,781 111,833 450 133,699
8/10 17 102 21,883 111,833 102 133,801
8/11 38 21,883 3,951 115,784 3,951 137,752
8/15 20 21,883 3,160 118,944 3,160 140,912
8/18 6 21,883 1,674 120,618 1,674 142,586
8/22 6 22,186 797 121,415 797 143,383
8/25 5 752 122,167 752 144,135
8/29 <4 32 122,199 32 144,167
9/05 <4 586 122,785 586 144,753

59
Table 6.–Commercial pink salmon catch by area and date, Upper Cook Inlet, 2005.
Upper Subdistrict Set Gillnet 244-21 244-22 244-25 244-31 244-32 244-41 244-42 Ninilchik Cohoe Kasilof Terminal South K. Beach North K. Beach Salamatof E. Forelands TOTAL
Date Daily Cum Daily Cum Daily Cum Daily Cum Daily Cum Daily Cum Daily Cum Daily Cum 6/20 25 25 7 7 4 4 36 36 6/21 31 56 6 13 9 13 46 82 6/22 45 101 14 27 6 19 65 147 6/23 63 164 60 87 7 26 130 277 6/25 79 243 23 110 10 36 112 389 6/26 38 281 39 149 17 53 94 483 6/27 104 385 36 185 23 76 163 646 6/29 186 571 167 352 28 104 381 1,027 6/30 191 762 194 546 62 166 447 1,474 70/2 200 962 108 654 42 208 350 1,824 7/03 224 1,186 155 809 35 243 414 2,238 7/04 165 1,351 165 974 42 285 372 2,610 7/05 1,351 974 34 34 285 34 2,644 7/06 436 1,787 264 1,238 77 111 44 329 821 3,465 7/07 530 2,317 262 1,500 111 72 401 864 4,329 7/08 2,317 1,500 91 202 401 91 4,420 7/09 1,076 3,393 414 1,914 21 223 99 500 1,610 6,030 7/10 3,393 1,914 43 266 500 43 6,073 7/11 222 3,615 142 2,056 266 54 554 16 16 65 65 75 75 574 6,647 7/12 305 3,920 154 2,210 266 52 606 14 30 58 123 145 220 728 7,375 7/13 254 4,174 93 2,303 266 32 638 12 42 55 178 91 311 537 7,912 7/14 234 4,408 160 2,463 266 14 652 7 49 39 217 54 365 508 8,420 7/15 158 4,566 54 2,517 43 309 18 670 49 217 365 273 8,693
-continued-

60
Table 6.-Page 2 of 7.
Upper Subdistrict Set Gillnet 244-21 244-22 244-25 244-31 244-32 244-41 244-42 Ninilchik Cohoe Kasilof Terminal South K. Beach North K. Beach Salamatof E. Forelands TOTAL
Date Daily Cum Daily Cum Daily Cum Daily Cum Daily Cum Daily Cum Daily Cum Daily Cum 7/16 206 4,772 132 2,649 18 688 13 62 64 281 154 519 587 9,280 7/17 2,649 46 355 46 9,326 7/18 145 4,917 68 2,717 5 360 32 720 11 73 79 360 359 878 699 10,025 7/19 266 5,183 139 2,856 25 745 6 79 70 430 1 879 507 10,532 7/20 107 5,290 44 2,900 17 762 4 83 56 486 95 974 323 10,855 7/21 76 5,366 63 2,963 9 771 12 95 59 545 135 1,109 354 11,209 7/22 28 388 28 11,237 7/23 35 5,401 10 2,973 16 787 13 108 39 584 90 1,199 203 11,440 7/24 28 5,429 23 2,996 18 805 5 113 35 619 102 1,301 211 11,651 7/25 51 5,480 29 3,025 7 812 2 115 18 637 40 1,341 147 11,798 7/26 34 5,514 22 3,047 4 816 3 118 24 661 48 1,389 135 11,933 7/27 79 5,593 41 3,088 10 826 13 131 45 706 77 1,466 265 12,198 7/28 115 5,708 107 3,195 18 844 10 141 78 784 86 1,552 414 12,612 7/29 17 405 141 17 12,629 7/30 21 5,729 22 3,217 5 849 1 142 10 794 52 1,604 111 12,740 7/31 91 5,820 73 3,290 14 863 3 145 34 828 70 1,674 285 13,025 8/01 70 5,890 24 3,314 3 866 7 152 25 853 114 1,788 243 13,268 8/03 21 5,911 12 3,326 4 870 0 152 8 861 7 1,795 52 13,320 8/04 19 5,930 18 3,344 4 874 2 154 36 897 25 1,820 104 13,424 8/06 21 5,951 6 3,350 2 876 1 155 8 905 12 1,832 50 13,474 8/07 24 5,975 9 3,359 4 880 2 157 9 914 8 1,840 56 13,530 8/08 25 6,000 8 3,367 2 882 3 160 6 920 11 1,851 55 13,585 8/09 11 6,011 3 3,370 2 884 1 921 1 1,852 18 13,603 8/10 8 6,019 1 3,371 1 922 6 1,858 16 13,619
-continued-

61
Table 6.-Page 3 of 7.
Central District - West Side Set Gillnet
245-10 245-20 245-30 245-40 245-50 245-55 245-60 246-10 246-20 Chinitna Bay Silv. Salmon Tuxedni Bay Polly Cr. L. J. Slough Big River W. Forelands Kalgin - West Kalgin - East Total
Date Daily Cum Daily Cum Daily Cum Daily Cum Daily Cum Daily Cum Daily Cum Daily Cum Daily Cum Daily Cum6/23 14 14 14 146/24 5 5 5 196/27 20 20 85 99 13 13 42 47 160 1796/28 125 224 125 3046/29 106 330 106 4106/30 82 412 4 4 24 71 110 5207/02 109 521 109 6297/03 95 616 95 7247/04 29 645 25 96 54 7787/05 80 725 80 8587/06 43 768 43 9017/07 24 24 188 956 7 11 122 218 341 1,2427/08 62 1,018 62 1,3047/09 129 1,147 0 11 129 1,4337/11 10 30 61 1,208 0 13 11 229 82 1,5157/12 88 1,296 0 11 88 1,6037/14 104 1,400 0 11 23 36 201 430 54 54 382 1,9857/16 27 1,427 27 2,012
-continued-
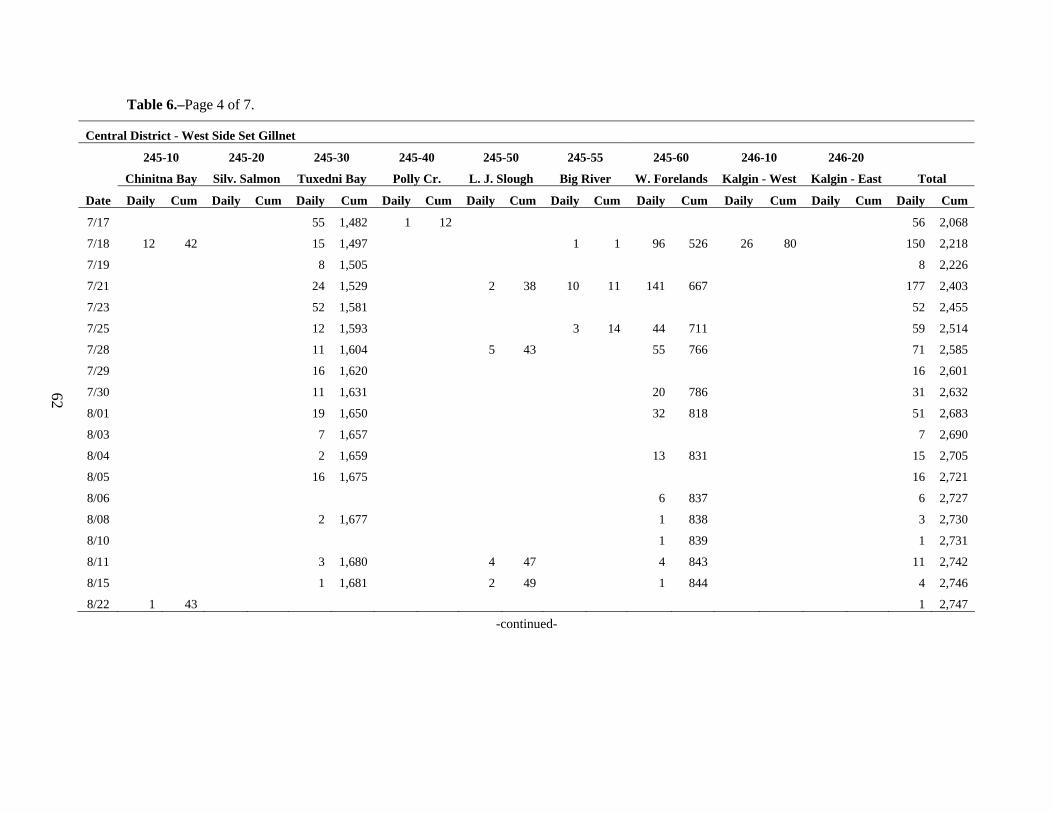
62
Table 6.–Page 4 of 7.
Central District - West Side Set Gillnet
245-10 245-20 245-30 245-40 245-50 245-55 245-60 246-10 246-20
Chinitna Bay Silv. Salmon Tuxedni Bay Polly Cr. L. J. Slough Big River W. Forelands Kalgin - West Kalgin - East Total
Date Daily Cum Daily Cum Daily Cum Daily Cum Daily Cum Daily Cum Daily Cum Daily Cum Daily Cum Daily Cum
7/17 55 1,482 1 12 56 2,068
7/18 12 42 15 1,497 1 1 96 526 26 80 150 2,218
7/19 8 1,505 8 2,226
7/21 24 1,529 2 38 10 11 141 667 177 2,403
7/23 52 1,581 52 2,455
7/25 12 1,593 3 14 44 711 59 2,514
7/28 11 1,604 5 43 55 766 71 2,585
7/29 16 1,620 16 2,601
7/30 11 1,631 20 786 31 2,632
8/01 19 1,650 32 818 51 2,683
8/03 7 1,657 7 2,690
8/04 2 1,659 13 831 15 2,705
8/05 16 1,675 16 2,721
8/06 6 837 6 2,727
8/08 2 1,677 1 838 3 2,730
8/10 1 839 1 2,731
8/11 3 1,680 4 47 4 843 11 2,742
8/15 1 1,681 2 49 1 844 4 2,746
8/22 1 43 1 2,747 -continued-

63
Table 6.–Page 5 of 7.
Northern District Set Gillnet
247-10 247-20 247-30 247-41 247-42 247-43 247-70 247-80 247-90
Trading Bay Tyonek Beluga Su. Flats Pt. McKenzie Fire Island Pt. Possession Birch Hill #3 Bay Total
Date Daily Cum Daily Cum Daily Cum Daily Cum Daily Cum Daily Cum Daily Cum Daily Cum Daily Cum Daily Cum
6/27 1 1 5 5 6 6
6/30 67 72 67 73
7/04 20 21 2 2 92 92 21 93 135 208
7/07 2 23 10 12 61 153 23 116 96 304
7/11 1 1 14 37 3 15 15 15 50 203 5 5 10 126 98 402
7/14 5 42 5 20 16 31 24 227 8 134 58 460
7/18 12 12 168 169 6 48 17 48 70 297 3 8 74 208 350 810
7/29 180 228 180 990
8/08 4 52 2 299 1 209 7 997
8/11 1 53 2 211 3 1,000
8/15 1 54 1 1,001
8/18 1 13 1 55 2 1,003-continued-

64
Table 6.–Page 6 of 7.
Central District Drift Gillnet
244-25 244-61 244-55 244-60
Kasilof Terminal Kasilof Section Kenai/Kasilof Section District Wide Total
Date Deliveries Daily Cum Daily Cum Daily Cum Daily Cum Daily Cum 6/20 28 11 11 11 11 6/22 5 8 8 11 8 19 6/23 104 8 245 256 245 264 6/25 11 25 33 256 25 289 6/26 7 8 41 256 8 297 6/27 197 41 677 933 677 974 6/29 34 62 103 933 62 1,036 6/30 249 103 1,602 2,535 1,602 2,638 7/02 50 61 164 2,535 61 2,699 7/03 5 4 168 2,535 4 2,703 7/04 360 168 2,346 4,881 2,346 5,049 7/05 35 14 14 168 4,881 14 5,063 7/06 47 23 37 46 214 4,881 69 5,132 7/07 316 37 214 3,371 8,252 3,371 8,503 7/08 24 7 44 214 8,252 7 8,510 7/09 122 69 113 254 468 8,252 323 8,833 7/10 14 14 127 468 8,252 14 8,847 7/11 405 127 468 4,805 13,057 4,805 13,652 7/12 160 127 468 339 339 13,057 339 13,991 7/13 204 127 468 325 664 13,057 325 14,316 7/14 440 127 468 664 2,296 15,353 2,296 16,612 7/15 237 16 143 166 634 664 15,353 182 16,794 7/16 346 143 280 944 15,353 280 17,074 7/17 7 1 144 944 15,353 1 17,075
-continued-

65
Table 6.–Page 7 of 7. Central District Drift Gillnet 244-25 244-61 244-55 244-60 Kasilof Terminal Kasilof Section Kenai/Kasilof Section District Wide Total
Date Deliveries Daily Cum Daily Cum Daily Cum Daily Cum Daily Cum7/18 448 144 944 2,305 17,658 2,305 19,3807/19 280 144 426 1,370 17,658 426 19,8067/20 283 144 450 1,820 17,658 450 20,2567/21 424 144 1,820 3,791 21,449 3,791 24,0477/22 327 1 145 604 2,424 21,449 605 24,6527/23 308 307 2,731 21,449 307 24,9597/24 206 138 2,869 21,449 138 25,0977/25 425 2,869 1,688 23,137 1,688 26,7857/26 244 464 3,333 23,137 464 27,2497/27 301 679 4,012 23,137 679 27,9287/28 393 4,012 1,355 24,492 1,355 29,2837/29 245 265 4,277 24,492 265 29,5487/30 268 4,277 620 25,112 620 30,1687/31 141 241 4,518 25,112 241 30,4098/01 362 4,518 299 25,411 299 30,7088/02 71 3 4,521 25,411 3 30,7118/03 97 58 4,579 25,411 58 30,7698/04 256 4,579 285 25,696 285 31,0548/05 122 57 4,636 25,696 57 31,1118/06 63 18 4,654 25,696 18 31,1298/07 45 9 4,663 25,696 9 31,1388/08 183 4,663 46 25,742 46 31,1848/09 61 4 4,667 25,742 4 31,1888/10 17 2 4,669 25,742 2 31,1908/11 38 30 25,772 30 31,2208/15 20 6 25,778 6 31,2268/18 6 4 25,782 4 31,230

66
Table 7.–Commercial chum salmon catch by area and date, Upper Cook Inlet, 2005.
Upper Subdistrict Set Gillnet
244-21 244-22 244-25 244-31 244-32 244-41 244-42
Ninilchik Coho Kasilof Terminal South K. Beach N. K. beach Salamatof E. Forelands TOTAL
Date Daily Cum Daily Cum Daily Cum Daily Cum Daily Cum Daily Cum Daily Cum Daily Cum
6/22 2 2 2 2
6/27 1 1 2 1 3
6/29 1 6 6 2 6 9
7/02 2 3 6 2 4 4 13
7/03 1 4 6 4 1 14
7/04 4 6 1 5 1 15
7/06 1 5 6 5 1 16
7/07 5 6 1 6 1 17
7/09 5 5 11 5 11 10 27
7/11 7 12 3 14 11 6 6 16 43
7/12 1 13 14 1 12 2 8 3 3 7 50
7/13 13 1 15 12 5 13 2 5 8 58
7/14 1 14 15 12 1 1 1 14 1 6 4 62
7/16 3 17 1 16 12 1 7 21 22 28 33 95
7/18 17 16 12 1 2 23 24 52 26 121
7/19 2 19 1 17 12 3 4 8 31 3 55 17 138
7/20 19 17 12 4 6 37 2 57 8 146
7/21 1 20 17 1 13 4 4 41 15 72 21 167 -continued-

67
Table 7.–Page 2 of 7.
Upper Subdistrict Set Gillnet
244-21 244-22 244-25 244-31 244-32 244-41 244-42
Ninilchik Cohoe Kasilof Terminal South K. Beach North K. Beach Salamatof E. Forelands TOTAL
Date Daily Cum Daily Cum Daily Cum Daily Cum Daily Cum Daily Cum Daily Cum Daily Cum
7/22 20 17 1 1 13 4 41 72 1 168
7/23 2 22 17 1 13 4 2 43 12 84 16 184
7/24 22 2 19 1 1 14 4 43 12 96 15 199
7/25 1 23 3 22 1 1 15 4 5 48 14 110 24 223
7/26 1 24 2 24 1 15 4 48 7 117 10 233
7/27 24 5 29 1 2 17 4 4 52 24 141 35 268
7/28 10 34 18 47 1 17 1 5 29 81 29 170 87 355
7/29 34 47 1 2 17 5 81 170 1 356
7/30 2 36 1 48 17 1 6 2 83 8 178 14 370
7/31 22 58 16 64 3 20 6 19 102 47 225 107 477
8/01 11 69 6 70 20 1 7 14 116 35 260 67 544
8/03 5 74 3 73 2 22 7 12 128 6 266 28 572
8/04 5 79 2 75 2 24 7 14 142 14 280 37 609
8/06 2 81 3 78 7 11 153 12 292 28 637
8/07 81 2 80 2 9 4 157 13 305 21 658
8/08 3 84 1 81 8 17 2 159 18 323 32 690
8/09 84 2 19 2 161 4 327 8 698
8/10 1 85 3 164 8 335 12 710 -continued-

68
Table 7.–Page 3 of 7.
Central District - West Side Set Gillnet
245-10 245-20 245-30 245-40 245-50 245-55 245-60 246-10 246-20 Chinitna Bay Silv. Salmon Tuxedni Bay Polly Cr. L. J. Slough Big River W. Forelands Kalgin - West Kalgin - East Total
Date Daily Cum Daily Cum Daily Cum Daily Cum Daily Cum Daily Cum Daily Cum Daily Cum Daily Cum Daily Cum6/20 2 2 2 26/29 1 1 1 36/30 2 4 2 57/02 1 2 1 67/03 1 3 1 77/04 1 4 3 7 4 117/06 1 5 1 127/07 2 7 0 7 2 147/08 2 9 2 167/09 5 14 5 217/11 1 1 10 24 10 17 21 427/12 16 40 16 587/14 30 70 1 1 18 35 49 1077/15 0 1077/16 22 92 22 1297/17 39 131 39 1687/18 2 3 8 139 1 2 16 51 1 1 28 196
-continued-

69
Table 7.–Page 4 of 7.
Central District - West Side Set Gillnet
245-10 245-20 245-30 245-40 245-50 245-55 245-60 246-10 246-20 Chinitna Bay Silv. Salmon Tuxedni Bay Polly Cr. L. J. Slough Big River W. Forelands Kalgin - West Kalgin - East Total
Date Daily Cum Daily Cum Daily Cum Daily Cum Daily Cum Daily Cum Daily Cum Daily Cum Daily Cum Daily Cum7/19 6 145 6 2027/21 51 196 52 103 103 3057/23 62 258 62 3677/25 24 282 64 167 88 4557/28 78 360 7 9 56 223 37 38 178 6337/29 202 562 202 8357/30 45 607 156 379 4 42 205 1,0408/01 135 742 69 448 50 92 254 1,2948/03 22 764 22 1,3168/04 163 927 4 13 88 536 23 115 278 1,5948/05 124 1,051 124 1,7188/06 33 569 33 148 66 1,7848/08 52 1,103 101 670 32 180 185 1,9698/10 113 783 17 197 130 2,0998/11 89 1,192 9 22 109 892 11 208 218 2,3178/15 160 1,352 10 32 31 923 53 261 254 2,5718/17 4 927 2 263 6 2,5778/18 17 1,369 22 949 39 2,6168/22 9 12 5 268 14 2,6308/25 2 951 2 2,632
-continued-

70
Table7.–Page 5 of 7.
Northern District Set Gillnet
247-10 247-20 247-30 247-41 247-42 247-43 247-70 247-80 247-90
Trading Bay Tyonek Beluga Su. Flats Pt. McKenzie Fire Island Pt. Possession Birch Hill #3 Bay Total
Date Daily Cum Daily Cum Daily Cum Daily Cum Daily Cum Daily Cum Daily Cum Daily Cum Daily Cum Daily Cum
6/30 4 4 4 4
7/04 5 5 1 1 3 3 9 13
7/04 1 6 3 4 4 7 8 21
7/11 1 1 18 24 2 6 1 8 22 43
7/14 1 1 22 46 36 42 1 1 5 13 65 108
7/18 28 28 255 256 38 84 10 52 4 5 6 6 3 7 344 452
8/08 44 72 72 156 27 79 10 15 8 21 2 8 1 8 164 616
8/11 36 192 5 20 1 9 1 9 43 659
8/15 19 211 23 102 3 24 9 18 3 12 57 716
8/18 6 78 1 257 2 213 9 725
8/22 1 214 1 726
8/29 1 103 1 727-continued-
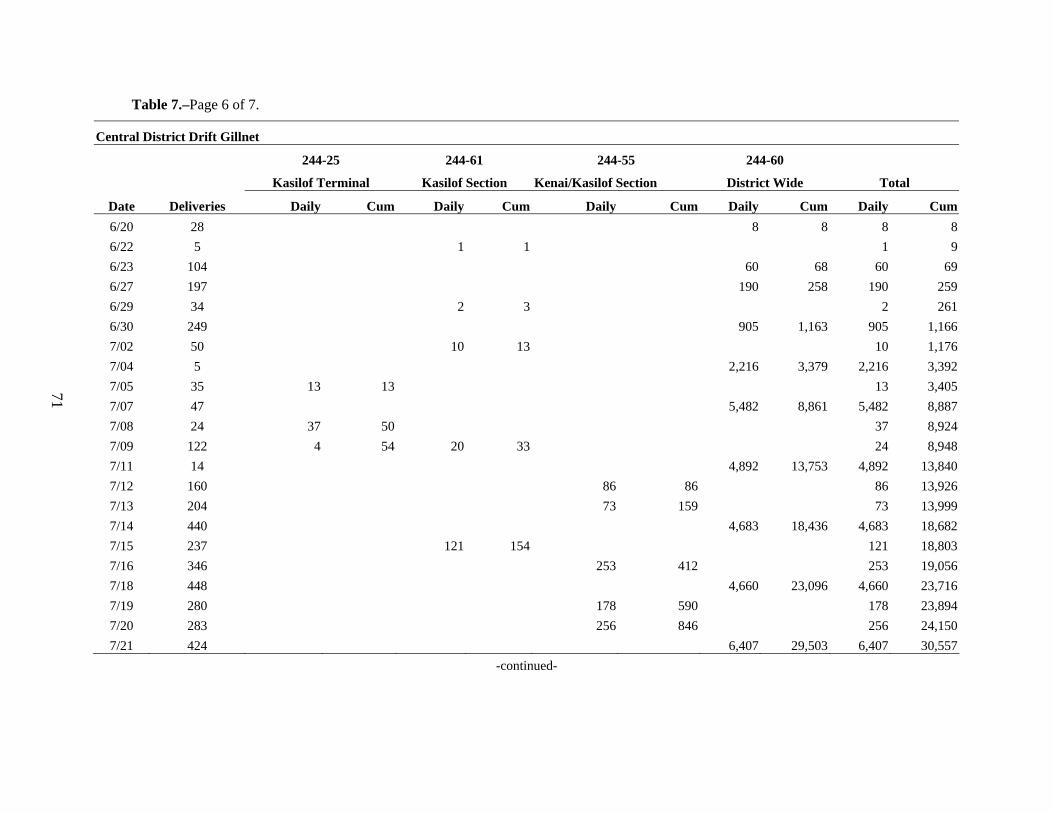
71
Table 7.–Page 6 of 7.
Central District Drift Gillnet
244-25 244-61 244-55 244-60
Kasilof Terminal Kasilof Section Kenai/Kasilof Section District Wide Total
Date Deliveries Daily Cum Daily Cum Daily Cum Daily Cum Daily Cum6/20 28 8 8 8 86/22 5 1 1 1 96/23 104 60 68 60 696/27 197 190 258 190 2596/29 34 2 3 2 2616/30 249 905 1,163 905 1,1667/02 50 10 13 10 1,1767/04 5 2,216 3,379 2,216 3,3927/05 35 13 13 13 3,4057/07 47 5,482 8,861 5,482 8,8877/08 24 37 50 37 8,9247/09 122 4 54 20 33 24 8,9487/11 14 4,892 13,753 4,892 13,8407/12 160 86 86 86 13,9267/13 204 73 159 73 13,9997/14 440 4,683 18,436 4,683 18,6827/15 237 121 154 121 18,8037/16 346 253 412 253 19,0567/18 448 4,660 23,096 4,660 23,7167/19 280 178 590 178 23,8947/20 283 256 846 256 24,1507/21 424 6,407 29,503 6,407 30,557
-continued-

72
Table 7.–Page 7 of 7.
Central District Drift Gillnet 244-25 244-61 244-55 244-60 Kasilof Terminal Kasilof Section Kenai/Kasilof Section District Wide Total
Date Deliveries Daily Cum Daily Cum Daily Cum Daily Cum Daily Cum7/22 327 325 1,171 325 30,8827/23 308 259 1,430 259 31,1417/24 206 266 1,696 266 31,4077/25 425 7,036 36,539 7,036 38,4437/26 244 1,336 3,032 1,336 39,7797/27 301 2,654 5,686 2,654 42,4337/28 393 11,209 47,748 11,209 53,6427/29 245 824 6,510 824 54,4667/30 268 2,082 49,830 2,082 56,5487/31 141 1,312 7,822 1,312 57,8608/01 362 2,658 52,488 2,658 60,5188/02 71 69 7,891 69 60,5878/03 97 211 8,102 211 60,7988/04 256 2,648 55,136 2,648 63,4468/05 122 471 8,573 471 63,9178/06 63 204 8,777 204 64,1218/07 45 125 8,902 125 64,2468/08 183 929 56,065 929 65,1758/09 61 101 9,003 101 65,2768/10 17 29 9,032 29 65,3058/11 38 258 56,323 258 65,5638/15 20 103 56,426 103 65,6668/18 6 1 56,427 1 65,6678/22 6 1 56,428 1 65,6688/25 5 3 56,431 3 65,671

73
Table 8.–Commercial salmon catch by gear, statistical area and species, Upper Cook Inlet, 2005.
Gear District Subdistrict Stat Are Permits Chinook Sockeye Coho Pink Chum Total
Drift Central All All 472 1,958 2,520,300 144,753 31,230 65,671 2,763,912
Set Central Upper 24421 94 2,694 329,823 1,964 6,019 85 340,585
24422 116 4,850 395,651 3,379 3,371 81 407,332
24425 81 629 77,907 58 405 2 79,001
24431 83 4,404 413,661 1,105 884 24 420,078
24432 55 3,284 311,545 1,247 160 19 316,255
24441 75 5,522 810,702 6,622 922 164 823,932
24442 53 718 194,552 5,168 1,858 335 202,631
All 361 22,101 2,533,841 19,543 13,619 710 2,589,814
Kalgin Is. 24610 23 459 76,477 15,882 844 951 94,613
24620 9 4 28,703 5,161 80 268 34,216
All 26 463 105,180 21,043 924 1,219 128,829
Chinitna 24510 <4 0 13 18 43 12 86
Western 24520 4 1 220 0 24 0 245
24530 26 175 43,644 5,330 1,681 1,369 52,199
24540 <4 13 655 0 12 0 680
24550 <4 0 5,234 2,512 49 32 7,827
All 26 189 49,753 7,842 1,766 1,401 60,951
Kustatan 24555 8 87 2,428 443 0 0 2,958
24560 <4 0 238 156 14 0 408
All 9 87 2,666 599 14 0 3,366
All All 393 22,840 2,691,453 49,045 16,366 3,342 2,783,046
Northern General 24710 8 295 319 143 0 1 758
24720 16 1253 3530 5,019 13 78 9,893
24730 13 360 2,147 3,170 169 257 6,103
24741 11 438 1,963 4,483 55 214 7,153
24742 7 385 1,273 3,246 20 103 5,027
24743 7 289 1,519 4,028 228 20 6,084
All 55 3,020 10,751 20,089 485 673 35,018
Eastern 24770 17 260 6,132 4,758 299 24 11,473
24780 10 53 3114 3,492 8 18 6,685
24790 14 40 6,556 2,520 211 12 9,339
All 24 353 15,802 10,770 518 54 27,497
All All 75 3,373 26,553 30,859 1,003 727 62,515
All All All 488 26,213 2,718,006 79,904 17,369 4,069 2,845,561
Seine All All All 0 0 0 0 0 0 0
All All All All 960 28,171 5,238,306 224,657 48,599 69,740 5,609,473

74
Table 9.–Commercial salmon catch per permit by statistical area, Upper Cook Inlet, 2005.
Gear Dist. SubDist. Stat Permits Chinook Sockeye Coho Pink Chum Total Drift Central All All 472 4 5,340 307 66 139 5,856 Set Central Upper 24421 94 29 3,509 21 64 1 3,623
24422 116 42 3,411 29 29 1 3,511 24425 81 8 962 1 5 0 975 24431 83 53 4,984 13 11 0 5,061 24432 55 60 5,664 23 3 0 5,750 24441 75 74 10,809 88 12 2 10,986 24442 53 14 3,671 98 35 6 3,823 All 361 61 7,019 54 38 2 7,174 Kalgin Is. 24610 23 20 3,325 691 37 41 4,114 24620 9 0 3,189 573 9 30 3,802 All 26 18 4,045 809 36 47 4,955 Chinitna 24510 <4 0 13 18 43 12 86 Western 24520 4 0 55 0 6 0 61 24530 26 7 1,679 205 65 53 2,008 24540 <4 7 328 0 6 0 340 24550 <4 0 1,745 837 16 11 2,609 All 26 7 1,914 302 68 54 2,344 Kustatan 24555 8 11 304 55 0 0 370 24560 <4 0 238 156 14 0 408 All 9 10 296 67 2 0 374 All All 393 58 6,848 125 42 9 7,082 Northern General 24710 8 37 40 18 0 0 95 24720 16 78 221 314 1 5 618 24730 13 28 165 244 13 20 469 24741 11 40 178 408 5 19 650 24742 7 55 182 464 3 15 718 24743 7 41 217 575 33 3 869 All 55 55 195 365 9 12 637 Eastern 24770 17 15 361 280 18 1 675 24780 10 5 311 349 1 2 669 24790 14 3 468 180 15 1 667
All 24 15 658 449 22 2 1,146 All All 75 45 354 411 13 10 834 All All All 488 54 5,570 164 36 8 5,831
Seine All All All - - - - - - - All All All All 960 29 5,457 234 51 73 5,843

75
Table 10.–Commercial fishery emergency orders issued during the 2005 Upper Cook Inlet fishing season.
Emergency Effective Order No. Date Action Reason
1 20-Jun Allowed for the use of up to 50 fathoms of monofilament mesh web per permit for drift gillnets. For set gillnets, no more than 35 fathoms of the allowable 105 fathoms per permit may be monofilament mesh web and no more than one net per permit may contain monofilament mesh web.
To comply with new regulations passed by the Alaska Board of Fisheries.
2 20-Jun Opened the season in the Kasilof Section of the Upper
Subdistrict for set gillnetting beginning on Monday, June 20, 2005 at 7:00 a.m. The Kasilof Section was now open during regular periods on Mondays and Thursdays from 7:00 a.m. to 7:00 p.m. for set and drift gillnets unless changed by future emergency orders.
To reduce the escapement rate of Kasilof River sockeye salmon.
3 21-Jun Opened set gillnetting in the Kasilof Section of the Upper
Subdistrict from 8:00 a.m. until 8:00 p.m. on Tuesday, June 21, 2005. Drift gillnetting was opened in the Kasilof Section of the Upper Subdistrict on Tuesday, June 21, 2005 from 8:00 a.m. until 8:00 p.m.
To reduce the escapement rate of Kasilof River sockeye salmon.
4 21-Jun Extended set gillnetting in the Kasilof Section of the Upper
Subdistrict from 8:00 p.m. on Tuesday, June 21, until 7:00 a.m. on Thursday June 23. In addition, a one-hour extension of the regular period (from 7:00 p.m. until 8:00 p.m.) was announced for Thursday, June 23, 2005. Drift gillnetting was opened in the Kasilof Section on Tuesday, June 21, 2005 from 8:00 p.m. until 12:00 midnight and on Wednesday, June 22, 2005 from 5:00 a.m. until 12:00 midnight and on Thursday, June 23, 2005 from 5:00 a.m. until 7:00 a.m. and from 7:00 p.m. until 8:00 p.m.
To reduce the escapement rate of Kasilof River sockeye salmon.
5 25-Jun Opened set gillnetting in the Kasilof Section of the Upper
Subdistrict from 10:00 a.m. until 10:00 p.m. on Saturday, June 25, 2005. Drift gillnetting was opened in the Kasilof Section of the Upper Subdistrict from 10:00 a.m. until 10:00 p.m. on Saturday, June 25, 2005.
To reduce the escapement rate of Kasilof River sockeye salmon.
6 26-Jun Opened set gillnetting in the Kasilof Section of the Upper
Subdistrict from 7:00 a.m. until 10:00 p.m. on Sunday, June 26. Drift gillnetting was opened in the Kasilof Section of the Upper Subdistrict from 7:00 a.m. until 10:00 p.m. on Sunday, June 26, 2005.
To reduce the escapement rate of Kasilof River sockeye salmon.
-continued-

76
Table 10–Page 2 of 14.
Emergency Effective Order No. Date Action Reason
7 27-Jun Extended commercial salmon fishing with set gillnets in that portion of the Western Subdistrict of the Central District south of the latitude of Redoubt Point from 7:00 P.M. on Monday, June 27, 2005 until further notice.
To reduce the escapement rate of Crescent River sockeye salmon.
8 27-Jun Extended set gillnetting in the Kasilof Section of the Upper
Subdistrict from 7:00 p.m. until 12:00 midnight on Monday, June 27, 2005. Drift gillnetting was opened in the Kasilof Section of the Upper Subdistrict from 7:00 p.m. until 12:00 midnight on Monday, June 27, 2005.
To reduce the escapement rate of Kasilof River sockeye salmon.
9 29-Jun Opened set gillnetting in the Kasilof Section of the Upper
Subdistrict from 4:00 a.m. until 7:00 p.m. on Wednesday, June 29, 2005. Drift gillnetting was opened in the Kasilof Section of the Upper Subdistrict from 4:00 a.m. until 7:00 p.m. on Wednesday, June 29, 2005.
To reduce the escapement rate of Kasilof River sockeye salmon.
10 29-Jun Extended set gillnetting in the Kasilof Section of the Upper
Subdistrict from 7:00 p.m. on Wednesday, June 29, 2005 until 7:00 a.m. on Thursday, June 30, 2005. Drift gillnetting was opened in the Kasilof Section of the Upper Subdistrict from 7:00 p.m. until 12:00 midnight on Wednesday, June 29, and from 5:00 a.m. to 7:00 a.m. on Thursday, June 30, 2005.
To reduce the escapement rate of Kasilof River sockeye salmon.
11 1-Jul Redescribed the fifth point of Drift Area Number 2 on page
85 of the current 2005 regulation book to a point at 600 20.43’ North Latitude, 1510 28.00’ West Longitude. This change remained in effect for the 2005 fishing season unless changed by subsequent emergency order.
To correct a misprint in the 2005 Commercial Fishing Regulations for 5 AAC 39.120 (a)(3)
12 2-Jul Opened set gillnetting in the Kasilof Section of the Upper
Subdistrict from 7:00 a.m. until 8:00 p.m. on Saturday, July 2, 2005. Drift gillnetting was opened in the Kasilof Section of the Upper Subdistrict from 7:00 a.m. until 8:00 p.m. on Saturday, July 2, 2005.
To reduce the escapement rate of Kasilof River sockeye salmon.
13 3-Jul Opened set gillnetting in the Kasilof Section of the Upper
Subdistrict from 7:00 a.m. until 10:00 p.m. on Sunday, July 3, 2005. Drift gillnetting was opened in the Kasilof Section of the Upper Subdistrict from 7:00 a.m. until 10:00 p.m. on Sunday, July 3, 2005.
To reduce the escapement rate of Kasilof River sockeye salmon.
-continued-

77
Table 10.–Page 3 of 14.
Emergency Effective Order No. Date Action Reason
14 4-Jul Extended set gillnetting in the Kasilof Section of the Upper Subdistrict from 7:00 p.m. until 10:00 p.m. on Monday, July 4, 2005. Drift gillnetting was opened in the Kasilof Section of the Upper Subdistrict from 7:00 p.m. until 10:00 p.m. on Monday July 4, 2005.
To reduce the escapement rate of Kasilof River sockeye salmon.
15 5-Jul Opened set and drift gillnetting in the Kasilof River Special
Harvest Area from 4:00 p.m. on Tuesday, July 5, 2005 until further notice.
To reduce the escapement rate of Kasilof River sockeye salmon.
16 6-Jul Closed the Kasilof River Special Harvest Area at 7:00 a.m.
on Wednesday, July 6, 2005 for both set and drift gillnets. Set gillnetting was opened in the Kasilof Section of the Upper Subdistrict from 10:00 a.m. on Wednesday, July 6th, 2005 until 7:00 a.m. on Thursday, July 7, 2005. Drift gillnetting was opened in the Kasilof Section of the Upper Subdistrict from 10:00 a.m. to 12:00 midnight on Wednesday, July 6th, 2005 and from 5:00 a.m. to 7:00 a.m. on Thursday, July 7, 2005.
To reduce the escapement rate of Kasilof River sockeye salmon.
17 8-Jul Opened set and drift gillnetting in the Kasilof River Special
Harvest Area from 5:00 a.m. on Friday, July 8, 2005 until further notice.
To reduce the escapement rate of Kasilof River sockeye salmon.
18 9-Jul Closed the Kasilof River Special Harvest Area at 8:00 a.m.
on Saturday, July 9, 2005 to both set and drift gillnetting. Set and drift gillnetting were opened in the Kasilof Section of the Upper Subdistrict on Saturday, July 9, 2005 from 6:00 a.m. until 12:00 midnight.
To reduce the escapement rate of Kasilof River sockeye salmon.
19 10-Jul Opened set and drift gillnetting in the Kasilof River Special
Harvest Area from 6:00 a.m. on Sunday, July 10, 2005 until further notice.
To reduce the escapement rate of Kasilof River sockeye salmon.
20 10-Jul Closed set and drift gillnetting in the Kasilof River Special
Harvest Area at 10:00 p.m. on Sunday, July 10, 2005. To reduce the
escapement rate of Kasilof River sockeye salmon.
-continued-

78
Table 10.–Page 4 of 14.
Emergency Effective Order No. Date Action Reason
21 10-Jul Delayed the closure of set and drift gillnetting in the Kasilof River Special Harvest Area until midnight on Sunday, July 10, 2005.
To reduce the escapement rate of Kasilof River sockeye salmon.
22 11-Jul Extended set gillnetting in the Kenai, Kasilof and East Forelands sections of the Upper Subdistrict from 7:00 p.m. until 11:00 p.m. on Monday, July 11, 2005. Drift gillnetting was opened in the Kenai and Kasilof sections of the Upper Subdistrict from 7:00 p.m. until 11:00 p.m. on Monday, July 11, 2005.
To reduce the escapement rate of Kenai and Kasilof River sockeye salmon.
23 12-Jul Opened set gillnetting in the Kenai, Kasilof and East Forelands sections of the Upper Subdistrict from 8:00 a.m. until 11:00 p.m. on Tuesday, July 12, 2005. Drift gillnetting was opened in the Kenai and Kasilof sections of the Upper Subdistrict from 8:00 a.m. until 11:00 p.m. on Tuesday, July 12, 2005.
To reduce the escapement rate of Kenai and Kasilof River sockeye salmon.
24 13-Jul Opened set gillnetting in the Kenai, Kasilof and East Forelands Sections of the Upper Subdistrict from 9:00 a.m. until 12:00 midnight on Wednesday July 13, 2005. Drift gillnetting was opened in the Kenai and Kasilof Sections of the Upper Subdistrict from 9:00 a.m. until 12:00 midnight on Wednesday, July 13, 2005.
To reduce the escapement rate of Kenai and Kasilof River sockeye salmon.
25 15-Jul Opened set and drift gillnetting in the Kasilof River Special Harvest Area from 6:00 a.m. on Friday July 15, 2005 until further notice.
To reduce the escapement rate of Kasilof River sockeye salmon.
26 15-Jul Closed set and drift gillnetting in the Kasilof River Special Harvest Area at 5:00 p.m. on Friday July 15, 2005. Set gillnetting was opened in the Kasilof Section of the Upper Subdistrict from 3:00 p.m. until 12:00 midnight on Friday, July 15, 2005. Drift gillnetting was opened in the Kasilof Section of the Upper Subdistrict from 3:00 p.m. until 12:00 midnight on Friday, July 15, 2005.
To reduce the escapement rate of Kasilof River sockeye salmon.
27 16-Jul Opened set gillnetting in the Kenai, Kasilof and East Forelands sections of the Upper Subdistrict from 7:00 a.m. until 12:00 midnight on Saturday July 16, 2005. Drift gillnetting was opened in the Kenai and Kasilof sections of the Upper Subdistrict from 7:00 a.m. until 11:00 p.m. on Saturday, July 16, 2005.
To reduce the escapement rate of Kenai and Kasilof River sockeye salmon.
-continued-

79
Table 10.–Page 5 of 14.
Emergency Effective Order No. Date Action Reason
28 17-Jul Opened set and drift gillnetting in the Kasilof River Special Harvest Area from 7:00 a.m. on Sunday, July 17, 2005 until further notice.
To reduce the escapement rate of Kasilof River sockeye salmon.
29 18-Jul Closed set and drift gillnetting in the Kasilof River Special Harvest Area at 5:00 a.m. on Monday July 18. Drift gillnetting was restricted to the Kenai and Kasilof Sections of the Upper Subdistrict and to drift gillnet areas 1 and 2 for the regular period on Monday July 18, 2005.
To reduce the exploitation rate on Susitna River sockeye salmon.
30 18-Jul Extended set gillnetting in the Kenai, Kasilof and East Forelands Sections of the Upper Subdistrict from 7:00 p.m. until 12:00 midnight on Monday, July 18, 2005. Drift gillnetting was opened in the Kenai and Kasilof Sections of the Upper Subdistrict from 7:00 p.m. until 11:00 p.m. on Monday, July 18, 2005.
To reduce the escapement rate of Kenai and Kasilof River sockeye salmon.
31 19-Jul Opened set gillnetting in the Kenai, Kasilof and East Forelands Sections of the Upper Subdistrict from 9:00 a.m. until 12:00 midnight on Tuesday, July 19, 2005. Drift gillnetting will be open in the Kenai and Kasilof Sections of the Upper Subdistrict from 9:00 a.m. until 11:00 p.m. on Tuesday, July 19, 2005.
To reduce the escapement rate of Kenai and Kasilof River sockeye salmon.
32 20-Jul Opened set gillnetting in the Kenai, Kasilof and East Forelands Sections of the Upper Subdistrict from 10:00 a.m. until 12:00 midnight on Wednesday, July 20, 2005. Drift gillnetting was opened in the Kenai and Kasilof Sections of the Upper Subdistrict from 10:00 a.m. until 11:00 p.m. on Wednesday, July 20, 2005.
To reduce the escapement rate of Kenai and Kasilof River sockeye salmon.
33 21-Jul Closed commercial salmon fishing in the Northern District of Upper Cook Inlet on Thursday, July 21, 2005 from 7:00 a.m. to 7:00 p.m. Set gillnetting was opened in the Kenai, Kasilof and East Forelands Sections of the Upper Subdistrict from 5:00 a.m. until 7:00 a.m. on Thursday, July 21, 2005. Drift gillnetting was opened in the Kenai and Kasilof Sections of the Upper Subdistrict from 5:00 a.m. until 7:00 a.m. on Thursday, July 21, 2005. For the regular period from 7:00 a.m. to 7:00 p.m. on Thursday, July 21, 2005, drift gillnetting will be closed in all areas of the Central District, except in the Kenai and Kasilof Sections of the Upper Subdistrict and in that portion of the Central District south of 600 04.70 minutes North Latitude which, is approximately the latitude of the Kalgin buoy.
To reduce the exploitation rate on Susitna River sockeye salmon and to reduce the escapement rate of Kenai and Kasilof River sockeye salmon.
-continued-

80
Table 10.–Page 6 of 14.
Emergency Effective Order No. Date Action Reason
34 21-Jul Opened set and drift gillnetting in the Kasilof River Special Harvest Area from 11:00 p.m. on Thursday, July 21, 2005 until further notice.
To reduce the escapement rate of Kasilof River sockeye salmon.
35 22-Jul Drift gillnetting was opened in the Kenai and Kasilof Sections of the Upper Subdistrict from 5:00 a.m. until 11:00 p.m. on Friday July 22.
To reduce the escapement rate of Kenai and Kasilof River sockeye salmon.
36 22-Jul Closed set and drift gillnetting in the Kasilof River Special Harvest Area at 11:00 p.m. on Friday, July 22, 2005. Set gillnetting was opened in the Kenai, Kasilof and East Forelands Sections of the Upper Subdistrict from 7:00 a.m. until 10:00 p.m. on Saturday, July 23, 2005. Drift gillnetting was opened in the Kenai and Kasilof Sections of the Upper Subdistrict from 7:00 a.m. until 10:00 p.m. on Saturday, July 23, 2005.
To reduce the escapement rate of Kenai and Kasilof River sockeye salmon.
37 24-Jul Opened set gillnetting in the Kenai, Kasilof and East Forelands Sections of the Upper Subdistrict from 8:00 a.m. until 11:00 p.m. on Sunday, July 24, 2005. Drift gillnetting was opened in the Kenai and Kasilof Sections of the Upper Subdistrict from 5:00 a.m. until 11:00 p.m. on Sunday, July 24, 2005.
To reduce the escapement rate of Kenai and Kasilof River sockeye salmon.
38 25-Jul Closed commercial salmon fishing in the Northern District of Upper Cook Inlet on Monday, July 25, 2005 from 7:00 a.m. to 7:00 p.m. Commercial salmon fishing with drift gillnets was closed in all areas of the Central District of Upper Cook Inlet, except in the Kenai Section of the Upper Subdistrict and that portion of the Central District south of 600 27.10’ North Latitude, which is the latitude of the Blanchard Line, on Monday, July 25, 2005 from 7:00 a.m. to 7:00 p.m. In addition, for clarification purposes, the longitude of the northwest point of the Kenai Section at Colliers Dock is 1510 26.33’ W. longitude.
To reduce the escapement rate of Kenai and Kasilof River sockeye salmon.
39 25-Jul Extended set gillnetting in the Kenai, Kasilof and East Forelands Sections of the Upper Subdistrict from 7:00 p.m. until 11:00 p.m. on Monday, July 25, 2005. Drift gillnetting was opened in the Kenai and Kasilof Sections of the Upper Subdistrict from 7:00 p.m. until 11:00 p.m. on Monday, July 25, 2005.
To reduce the escapement rate of Kasilof River sockeye salmon.
-continued-

81
Table 10.–Page 7 of 14.
Emergency Effective Order No. Date Action Reason
40 26-Jul Opened set gillnetting in the Kenai, Kasilof and East Foreland Sections of the Upper Subdistrict from 7:00 a.m. until 12:00 midnight on Tuesday, July 26, 2005. Drift gillnetting was opened in the Kenai and Kasilof Sections of the Upper Subdistrict, from 5:00 a.m. until 11:00 p.m. on Tuesday, July 26, 2005. During the entire fishing period on Tuesday July 26, the offshore boundary of the Kenai and Kasilof Sections was expanded for drift gillnetting to include the waters out to the following four points:
1. 600 40.35’ N. Lat. and 1510 27.00’ W. Long. 2. 600 27.10’ N. Lat. and 1510 29.50’ W. Long 3. 600 12.75’ N. Lat. and 1510 38.30’ W. Long. 4. 600 04.02’ N. Lat. and 1510 52.60’ W. Long.
To reduce the escapement rate of Kenai and Kasilof River sockeye salmon.
41 27-Jul Extended set gillnetting in the Kenai, Kasilof and East Forelands Sections of the Upper Subdistrict from 12:00 midnight on Tuesday, July 26, 2005 until 7:00 p.m. on Wednesday, July 27, 2005. Drift gillnetting was opened in the Kenai and Kasilof Sections of the Upper Subdistrict, from 5:00 a.m. until 7:00 p.m. on Wednesday, July 27, 2005. During the fishing period on Wednesday, July 27, the offshore boundary of the Kenai and Kasilof Sections was expanded for drift gillnetting to include the waters out to the following four points:
1. 600 40.35’ N. Lat. and 1510 27.00’ W. Long. 2. 600 27.10’ N. Lat. and 1510 29.50’ W. Long 3. 600 12.75’ N. Lat. and 1510 38.30’ W. Long. 4. 600 04.02’ N. Lat. and 1510 52.60’ W. Long.
To reduce the escapement rate of Kenai and Kasilof River sockeye salmon.
-continued-

82
Table 10.–Page 8 of 14.
Emergency Effective Order No. Date Action Reason
42 27-Jul Extended set gillnetting in the Kenai, Kasilof and East Forelands Sections of the Upper Subdistrict from 7:00 p.m. on Wednesday, July 27, 2005 until 7:00 a.m. on Thursday, July 28, 2005. Drift gillnetting was opened in the Kenai and Kasilof Sections of the Upper Subdistrict from 7:00 p.m. until 11:00 p.m. on Wednesday, July 27, 2005. During the fishing period on Wednesday, July 27, 2005, the offshore boundary of the Kenai and Kasilof Sections was expanded for drift gillnetting to include the waters out to the following four points:
1. 600 40.35’ N. Lat. and 1510 27.00’ W. Long. 2. 600 27.10’ N. Lat. and 1510 29.50’ W. Long 3. 600 12.75’ N. Lat. and 1510 38.30’ W. Long. 4. 600 04.02’ N. Lat. and 1510 52.60’ W. Long.
To reduce the escapement rate of Kenai and Kasilof River sockeye salmon.
43 28-Jul Closed commercial salmon fishing in the Northern District of Upper Cook Inlet from 7:00 a.m. until 7:00 p.m. on Thursday, July 28, 2005. Drift gillnetting was opened in the Kenai and Kasilof Sections of the Upper Subdistrict, from 5:00 a.m. until 7:00 a.m. on Thursday, July 28, 2005. Commercial salmon fishing with drift gillnets was closed in all areas of the Central District, except in that portion of the Central District south of a line from Collier’s Dock at 600 40.35’N. Latitude 1510 23.00’ W. Longitude to Northwest Point on Kalgin Island at 600 31.25’ N. Latitude 1510 55.75’ W. Longitude to a point on the western shore at 600 31.25’ N. Latitude from 7:00 a.m. to 7:00 p.m. on Thursday, July 28, 2005.
To reduce the exploitation rate on Susitna River sockeye salmon and to reduce the escapement rate of Kenai and Kasilof River sockeye salmon.
44 28-Jul Extended set gillnetting in the Kenai, Kasilof and East Forelands sections of the Upper Subdistrict from 7:00 p.m. until 12:00 midnight on Thursday, July 28, 2005. Drift gillnetting was opened in the Kenai and Kasilof Sections of the Upper Subdistrict, from 7:00 p.m. until 11:00 p.m. on Thursday, July 28, 2005. During the fishing period, the offshore boundary of the Kenai and Kasilof Sections was expanded for drift gillnetting to include the waters out to the following four points:
1. 600 40.35’ N. Lat. and 1510 27.00’ W. Long. 2. 600 27.10’ N. Lat. and 1510 29.50’ W. Long 3. 600 12.75’ N. Lat. and 1510 38.30’ W. Long. 4. 600 04.02’ N. Lat. and 1510 52.60’ W. Long.
To reduce the escapement rate of Kasilof River sockeye salmon.
-continued-

83
Table 10.–Page 9 of 14.
Emergency Effective Order No. Date Action Reason
45 29-Jul Opened set and drift gillnetting in the Kasilof River Special Harvest Area from 5:00 a.m. on Friday, July 29, 2005 until 5:00 a.m. on Saturday, July 30, 2005. Drift gillnetting was opened in the Kenai and Kasilof Sections of the Upper Subdistrict from 5:00 a.m. until 11:00 p.m. on Friday, July 29, 2005. During this fishing period, the offshore boundary of the Kenai and Kasilof Sections was expanded for drift gillnetting to include the waters out to the following four points:
1. 600 40.35’ N. Lat. and 1510 27.00’ W. Long. 2. 600 27.10’ N. Lat. and 1510 29.50’ W. Long 3. 600 12.75’ N. Lat. and 1510 38.30’ W. Long. 4. 600 04.02’ N. Lat. and 1510 52.60’ W. Long.
To reduce the escapement rate of Kenai and Kasilof River sockeye salmon.
46 30-Jul Opened set gillnetting in the Kenai, Kasilof and East
Forelands Sections of the Upper Subdistrict from 12:00 noon until 12:00 midnight on Saturday, July 30, 2005. Set gillnetting will be open in the Kalgin Island Subdistrict of the Central District from 7:00 a.m. until 7:00 p.m. on Saturday, July 30, 2005. Commercial salmon fishing with drift gillnets was opened in that portion of the Central District south of a line from Collier’s Dock at 600 40.35’N. Latitude 1510 23.00’ W. Longitude to Northwest Point on Kalgin Island at 600 31.25’ N. Latitude 1510 55.75’ W. Longitude to a point on the western shore at 600 31.25’ N. Latitude from 7:00 a.m. to 7:00 p.m. on Saturday, July 30, 2005. Drift gillnetting was opened in the Kenai and Kasilof Sections of the Upper Subdistrict from 7:00 p.m. until 11:00 p.m. on Saturday, July 30, 2005.
To reduce the escapement rate of Kenai and Kasilof River sockeye salmon and Packers Lake sockeye salmon.
-continued-
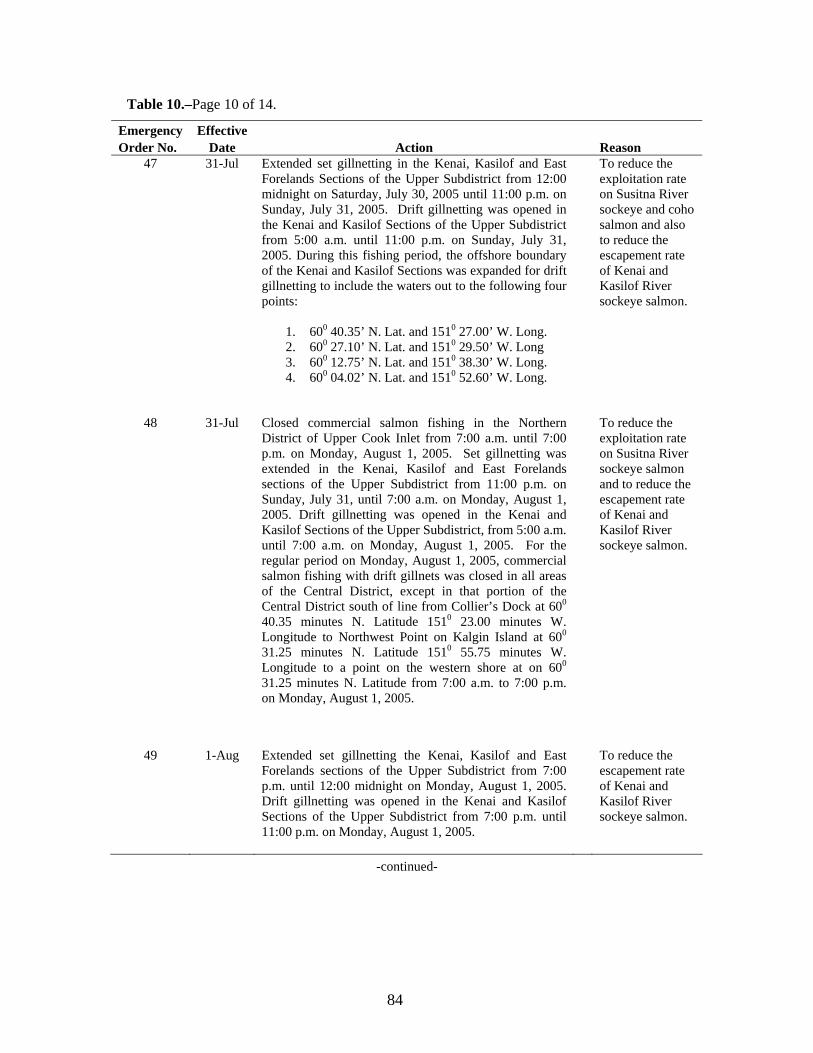
84
Table 10.–Page 10 of 14.
Emergency Effective Order No. Date Action Reason
47 31-Jul Extended set gillnetting in the Kenai, Kasilof and East Forelands Sections of the Upper Subdistrict from 12:00 midnight on Saturday, July 30, 2005 until 11:00 p.m. on Sunday, July 31, 2005. Drift gillnetting was opened in the Kenai and Kasilof Sections of the Upper Subdistrict from 5:00 a.m. until 11:00 p.m. on Sunday, July 31, 2005. During this fishing period, the offshore boundary of the Kenai and Kasilof Sections was expanded for drift gillnetting to include the waters out to the following four points:
1. 600 40.35’ N. Lat. and 1510 27.00’ W. Long. 2. 600 27.10’ N. Lat. and 1510 29.50’ W. Long 3. 600 12.75’ N. Lat. and 1510 38.30’ W. Long. 4. 600 04.02’ N. Lat. and 1510 52.60’ W. Long.
To reduce the exploitation rate on Susitna River sockeye and coho salmon and also to reduce the escapement rate of Kenai and Kasilof River sockeye salmon.
48 31-Jul Closed commercial salmon fishing in the Northern District of Upper Cook Inlet from 7:00 a.m. until 7:00 p.m. on Monday, August 1, 2005. Set gillnetting was extended in the Kenai, Kasilof and East Forelands sections of the Upper Subdistrict from 11:00 p.m. on Sunday, July 31, until 7:00 a.m. on Monday, August 1, 2005. Drift gillnetting was opened in the Kenai and Kasilof Sections of the Upper Subdistrict, from 5:00 a.m. until 7:00 a.m. on Monday, August 1, 2005. For the regular period on Monday, August 1, 2005, commercial salmon fishing with drift gillnets was closed in all areas of the Central District, except in that portion of the Central District south of line from Collier’s Dock at 600 40.35 minutes N. Latitude 1510 23.00 minutes W. Longitude to Northwest Point on Kalgin Island at 600 31.25 minutes N. Latitude 1510 55.75 minutes W. Longitude to a point on the western shore at on 600 31.25 minutes N. Latitude from 7:00 a.m. to 7:00 p.m. on Monday, August 1, 2005.
To reduce the exploitation rate on Susitna River sockeye salmon and to reduce the escapement rate of Kenai and Kasilof River sockeye salmon.
49 1-Aug Extended set gillnetting the Kenai, Kasilof and East Forelands sections of the Upper Subdistrict from 7:00 p.m. until 12:00 midnight on Monday, August 1, 2005. Drift gillnetting was opened in the Kenai and Kasilof Sections of the Upper Subdistrict from 7:00 p.m. until 11:00 p.m. on Monday, August 1, 2005.
To reduce the escapement rate of Kenai and Kasilof River sockeye salmon.
-continued-

85
Table 10.–Page 11 of 14.
Emergency Effective Order No. Date Action Reason
50 2-Aug Opened drift gillnetting in the Kenai and Kasilof sections of the Upper Subdistrict, from 2:00 p.m. until 11:00 p.m. on Tuesday, August 2, 2005. During this fishing period, the offshore boundary of the Kenai and Kasilof Sections was expanded for drift gillnetting to include the waters out to the following four points:
1. 600 40.35’ N. Lat. and 1510 27.00’ W. Long. 2. 600 27.10’ N. Lat. and 1510 29.50’ W. Long 3. 600 12.75’ N. Lat. and 1510 38.30’ W. Long. 4. 600 04.02’ N. Lat. and 1510 52.60’ W. Long.
To reduce the escapement rate of Kenai and Kasilof River sockeye salmon.
51 3-Aug Opened set gillnetting the Kenai, Kasilof and East Forelands Sections of the Upper Subdistrict from 5:00 a.m. until 12:00 midnight on Wednesday, August 3, 2005. Drift gillnetting was opened in the Kenai and Kasilof Sections of the Upper Subdistrict from 5:00 a.m. until 11:00 p.m. on Wednesday, August 3, 2005. During this fishing period, the offshore boundary of the Kenai and Kasilof Sections was expanded for drift gillnetting to include the waters out to the following four points:
1. 600 40.35’ N. Lat. and 1510 27.00’ W. Long. 2. 600 27.10’ N. Lat. and 1510 29.50’ W. Long 3. 600 12.75’ N. Lat. and 1510 38.30’ W. Long. 4. 600 04.02’ N. Lat. and 1510 52.60’ W. Long.
To reduce the escapement rate of Kenai and Kasilof River sockeye salmon.
52 4-Aug Closed commercial salmon fishing in the Northern District of Upper Cook Inlet from 7:00 a.m. until 7:00 p.m. on Thursday, August 4, 2005. Set gillnetting in the Kenai, Kasilof and East Forelands Sections of the Upper Subdistrict was opened from 12:00 midnight on Wednesday, August 3, until 7:00 a.m. on Thursday, August 4, 2005. Drift gillnetting was opened in the Kenai and Kasilof Sections of the Upper Subdistrict from 5:00 a.m. until 7:00 a.m. on Thursday, August 4, 2005.
To reduce the exploitation rate on Susitna River sockeye and coho salmon and also to reduce the escapement rate of Kenai and Kasilof River sockeye salmon.
-continued-

86
Table 10.–Page 12 of 14.
Emergency Effective Order No. Date Action Reason
53 5-Aug Opened drift gillnetting in the Kenai and Kasilof Sections of the Upper Subdistrict from 5:00 a.m. until 11:00 p.m. on Friday, August 5, 2005. During this fishing period, the offshore boundary of the Kenai and Kasilof Sections was expanded for drift gillnetting to include the waters out to the following four points:
1. 600 40.35’ N. Lat. and 1510 27.00’ W. Long. 2. 600 27.10’ N. Lat. and 1510 29.50’ W. Long 3. 600 12.75’ N. Lat. and 1510 38.30’ W. Long. 4. 600 04.02’ N. Lat. and 1510 52.60’ W. Long.
To reduce the escapement rate of Kenai and Kasilof River sockeye salmon and to reduce the exploitation rate of Susitna River sockeye and coho salmon.
54 5-Aug Rescinded Emergency Order Number 7 effective at 12:00
midnight on Friday, August 5, 2005. Fishing in the Western Subdistrict South of Redoubt Point was closed at 12:00 midnight on Friday, August 5, 2005 and returned to the regular fishing schedule from 7:00 a.m. to 7:00 p.m. on Mondays and Thursdays only.
To reduce the exploitation rate of coho salmon in the Western Subdistrict
55 6-Aug Opened set gillnetting in the Kenai, Kasilof and East
Forelands Sections of the Upper Subdistrict from 7:00 a.m. until 12:00 midnight on Saturday, August 6, 2005. Set gillnetting was opened in the Kalgin Island Subdistrict of the Central District from 7:00 a.m. until 7:00 p.m. on Saturday, August 6, 2005. Drift gillnetting was opened in the Kenai and Kasilof Sections of the Upper Subdistrict from 7:00 a.m. until 11:00 p.m. on Saturday, August 6, 2005. During this fishing period, the offshore boundary of the Kenai and Kasilof Sections was expanded for drift gillnetting to include the waters out to the following four points:
1. 600 40.35’ N. Lat. and 1510 27.00’ W. Long. 2. 600 27.10’ N. Lat. and 1510 29.50’ W. Long 3. 600 12.75’ N. Lat. and 1510 38.30’ W. Long. 4. 600 04.02’ N. Lat. and 1510 52.60’ W. Long.
To reduce the escapement rate of Kenai and Kasilof River sockeye salmon and Packers Lake sockeye salmon.
-continued-

87
Table 10.–Page 13 of 14.
Emergency Effective Order No. Date Action Reason
56 7-Aug Extended set gillnetting in the Kenai, Kasilof and East Forelands Sections of the Upper Subdistrict from 12:00 midnight on Saturday, August 6, 2005 until 7:00 a.m. on Monday, August 8, 2005. Drift gillnetting was opened in the Kenai and Kasilof Sections of the Upper Subdistrict, from 5:00 a.m. until 11:00 p.m. on Sunday, August 7 and from 5:00 a.m. to 7:00 a.m. on Monday, August 8, 2005. During these fishing periods, the offshore boundary of the Kenai and Kasilof Sections was expanded for drift gillnetting to include the waters out to the following four points:
1. 600 40.35’ N. Lat. and 1510 27.00’ W. Long. 2. 600 27.10’ N. Lat. and 1510 29.50’ W. Long 3. 600 12.75’ N. Lat. and 1510 38.30’ W. Long. 4. 600 04.02’ N. Lat. and 1510 52.60’ W. Long.
To reduce the escapement rate of Kenai and Kasilof River sockeye salmon.
57 8-Aug Extended set gillnetting in the Kenai, Kasilof and East
Forelands Sections of the Upper Subdistrict from 7:00 p.m. on Monday, August 8, 2005 until 11:00 p.m. on Tuesday, August 9, 2005. Drift gillnetting was opened in the Kenai and Kasilof Sections of the Upper Subdistrict, from 7:00 p.m. until 11:00 p.m. on Monday, August 8, and from 5:00 a.m. to 11:00 p.m. on Tuesday, August 9, 2005. During these fishing periods, the offshore boundary of the Kenai and Kasilof Sections was expanded for drift gillnetting to include the waters out to the following four points:
1. 600 40.35’ N. Lat. and 1510 27.00’ W. Long. 2. 600 27.10’ N. Lat. and 1510 29.50’ W. Long 3. 600 12.75’ N. Lat. and 1510 38.30’ W. Long. 4. 600 04.02’ N. Lat. and 1510 52.60’ W. Long.
To reduce the escapement rate of Kenai and Kasilof River sockeye salmon.
-continued-

88
Table 10.–Page 14 of 14.
Emergency Effective Order No. Date Action Reason
58 9-Aug Extended set gillnetting in the Kenai, Kasilof and East Forelands Sections of the Upper Subdistrict from 11:00 p.m. on Tuesday, August 9 until 12:00 midnight on Wednesday, August 10, 2005. Set gillnetting was open in the Kalgin Island Subdistrict of the Central District from 7:00 a.m. until 7:00 p.m. on Wednesday, August 10, 2005. Drift gillnetting was opened in the Kenai and Kasilof Sections of the Upper Subdistrict from 5:00 a.m. until 11:00 p.m. on Wednesday, August 10, 2005. During this fishing period, the offshore boundary of the Kenai and Kasilof Sections was expanded for drift gillnetting to include the waters out to the following four points:
1. 600 40.35’ N. Lat. and 1510 27.00’ W. Long. 2. 600 27.10’ N. Lat. and 1510 29.50’ W. Long 3. 600 12.75’ N. Lat. and 1510 38.30’ W. Long. 4. 600 04.02’ N. Lat. and 1510 52.60’ W. Long.
To reduce the escapement rate of Kenai and Kasilof River sockeye salmon.
59 17-Aug Emergency Order Number 2S-59-05 opens set gillnetting in
the Kalgin Island Subdistrict of the Central District from 7:00 a.m. until 7:00 p.m. on Wednesday, August 17, 2005.
To reduce the escapement rate of Packers Lake sockeye salmon.

89
Table 11.–Commercial salmon fishing periods, Upper Cook Inlet, 2005.
Date Day Time Set Gill Net Drift Gill Net 30-May Mon 0700-1900 Northern District 1-Jun Wed 0700-1900 Kustatan - Big River - Kalgin Island 3-Jun Fri 0700-1900 Kustatan - Big River - Kalgin Island 6-Jun Mon 0700-1900 N. Dist.-Kustatan-Big River-Kalgin Island 8-Jun Wed 0700-1900 Kustatan - Big River - Kalgin Island
10-Jun Fri 0700-1900 Kustatan - Big River - Kalgin Island 13-Jun Mon 0700-1900 N. Dist.-Kustatan-Big River-Kalgin Island 15-Jun Wed 0700-1900 Kustatan - Big River - Kalgin Island 16-Jun Thu 0700-1900 Western Subdistrict 17-Jun Fri 0700-1900 Kustatan - Big River - Kalgin Island 20-Jun Mon 0700-1900 Kasilof Section All
0700-1900 Kustatan - Big River - Kalgin Island 0700-1900 Western Subdistrict
21-Jun Tue 0800-2400 Kasilof Section Kasilof Section 22-Jun Wed 0000-2400 Kasilof Section
0500-2400 Kasilof Section 0700-1900 Kustatan - Big River - Kalgin Island
23-Jun Thu 0000-2000 Kasilof Section 0500-0700 Kasilof Section 0700-1900 Kustatan - Big River - Kalgin Island All 0700-1900 Western Subdistrict 1900-2000 Kasilof Section
24-Jun Fri 0700-1900 Kustatan - Big River - Kalgin Island 25-Jun Sat 1000-2200 Kasilof Section Kasilof Section 26-Jun Sun 0700-2200 Kasilof Section Kasilof Section 27-Jun Mon 0000-2400 Kasilof Section
0000-2400 W. Subdistrict South of Redoubt Pt. 0700-1900 All Except Kenai & E. Forelands Sections All 1900-2400 Kasilof Section
28-Jun Tue 0000-2400 W. Subdistrict South of Redoubt Pt. 29-Jun Wed 0000-2400 W. Subdistrict South of Redoubt Pt.
0400-2400 Kasilof Section Kasilof Section 30-Jun Thu 0000-2400 W. Subdistrict South of Redoubt Pt.
0000-1900 Kasilof Section 0500-0700 Kasilof Section 0700-1900 All
-continued-

90
Table 11.–Page 2 of 5.
Date Day Time Set Gill Net Drift Gill Net 1-Jul Fri 0000-2400 W. Subdistrict South of Redoubt Pt. 2-Jul Sat 0000-2400 W. Subdistrict South of Redoubt Pt.
0700-2000 Kasilof Section Kasilof Section 3-Jul Sun 0000-2400 W. Subdistrict South of Redoubt Pt.
0700-2200 Kasilof Section Kasilof Section 4-Jul Mon 0000-2400 W. Subdistrict South of Redoubt Pt.
0700-1900 Kasilof Section All 1900-2200 Kasilof Section Kasilof Section
5-Jul Tue 0000-2400 W. Subdistrict South of Redoubt Pt. 1600-2400 Kasilof River Special Harvest Area Kasilof River Special Harvest Area
6-Jul Wed 0000-2400 W. Subdistrict South of Redoubt Pt. 0000-0700 Kasilof River Special Harvest Area Kasilof River Special Harvest Area 1000-2400 Kasilof Section Kasilof Section
7-Jul Thu 0000-2400 W. Subdistrict South of Redoubt Pt. 0000-1900 Kasilof Section 0500-0700 Kasilof Section 0700-1900 All
8-Jul Fri 0000-2400 W. Subdistrict South of Redoubt Pt. 0500-2400 Kasilof River Special Harvest Area Kasilof River Special Harvest Area
9-Jul Sat 0000-2400 W. Subdistrict South of Redoubt Pt. 0000-0800 Kasilof River Special Harvest Area Kasilof River Special Harvest Area 0600-2400 Kasilof Section Kasilof Section
10-Jul Sun 0000-2400 W. Subdistrict South of Redoubt Pt. 0600-2400 Kasilof River Special Harvest Area Kasilof River Special Harvest Area
11-Jul Mon 0000-2400 W. Subdistrict South of Redoubt Pt. 0700-1900 All Drift Area 1 & Kenai/Kasilof Sections 1900-2300 Kenai, Kasilof, & East Forelands Sections Kenai & Kasilof Sections
12-Jul Tue 0000-2400 W. Subdistrict South of Redoubt Pt. 0800-2300 Kenai, Kasilof, & East Forelands Sections Kenai & Kasilof Sections
13-Jul Wed 0000-2400 W. Subdistrict South of Redoubt Pt. 0900-2400 Kenai, Kasilof, & East Forelands Sections Kenai & Kasilof Sections
14-Jul Thu 0000-2400 W. Subdistrict South of Redoubt Pt. 0700-1900 All Drift Area 1 & Kenai/Kasilof Sections
15-Jul Fri 0000-2400 W. Subdistrict South of Redoubt Pt. 0600-1700 Kasilof River Special Harvest Area Kasilof River Special Harvest Area 1500-2400 Kasilof Section Kasilof Section
-continued-

91
Table 11.–Page 3 of 5.
Date Day Time Set Gill Net Drift Gill Net
16-Jul Sat 0000-2400 W. Subdistrict South of Redoubt Pt.
0700-2400 Kenai, Kasilof, & East Forelands Sections
0700-2300 Kenai & Kasilof Sections
17-Jul Sun 0000-2400 W. Subdistrict South of Redoubt Pt.
0700-2400 Kasilof River Special Harvest Area Kasilof River Special Harvest Area
18-Jul Mon 0000-2400 W. Subdistrict South of Redoubt Pt.
0000-0500 Kasilof River Special Harvest Area Kasilof River Special Harvest Area
0700-1900 All Drift Areas 1 & 2, plus Ken/Kas Sections
1900-2400 Kenai, Kasilof, & East Forelands Sections
1900-2300 Kenai & Kasilof Sections
19-Jul Tue 0000-2400 W. Subdistrict South of Redoubt Pt.
0900-2400 Kenai, Kasilof, & East Forelands Sections
0900-2300 Kenai & Kasilof Sections
20-Jul Wed 0000-2400 W. Subdistrict South of Redoubt Pt.
1000-2400 Kenai, Kasilof, & East Forelands Sections
1000-2300 Kenai & Kasilof Sections
21-Jul Thu 0000-2400 W. Subdistrict South of Redoubt Pt.
0500-0700 Kenai, Kasilof, & East Forelands Sections
0700-1900 All except Northern District South of Kalgin Island Buoy
2300-2400 Kasilof River Special Harvest Area Kasilof River Special Harvest Area
22-Jul Fri 0000-2400 W. Subdistrict South of Redoubt Pt.
0000-2300 Kasilof River Special Harvest Area Kasilof River Special Harvest Area
0500-2300 Kenai & Kasilof Sections
23-Jul Sat 0000-2400 W. Subdistrict South of Redoubt Pt.
0700-2200 Kenai, Kasilof, & East Forelands Sections Kenai & Kasilof Sections
24-Jul Sun 0000-2400 W. Subdistrict South of Redoubt Pt.
0500-2300 Kenai & Kasilof Sections
0800-2300 Kenai, Kasilof, & East Forelands Sections
25-Jul Mon 0000-2400 W. Subdistrict South of Redoubt Pt.
0700-1900 All except Northern District South of Blanchard Line
1900-2300 Kenai, Kasilof, & East Forelands Sections Kenai & Kasilof Sections
26-Jul Tue 0000-2400 W. Subdistrict South of Redoubt Pt.
0500-2300 Expanded Kenai & Kasilof Sections
0700-2400 Kenai, Kasilof, & East Forelands Sections
27-Jul Wed 0000-2400 W. Subdistrict South of Redoubt Pt.
0000-2400 Kenai, Kasilof, & East Forelands Sections
0500-2300 Expanded Kenai & Kasilof Sections -continued-

92
Table 11.–Page 4 of 5.
Date Day Time Set Gill Net Drift Gill Net
28-Jul Thu 0000-2400 W. Subdistrict South of Redoubt Pt.
0000-0700 Kenai, Kasilof, & East Forelands Sections
0700-1900 All except Northern District South of North End of Kalgin Island
1900-2400 Kenai, Kasilof, & East Forelands Sections
1900-2300 Expanded Kenai & Kasilof Sections
29-Jul Fri 0000-2400 W. Subdistrict South of Redoubt Pt.
0500-2400 Kasilof River Special Harvest Area Kasilof River Special Harvest Area
0500-2300 Expanded Kenai & Kasilof Sections
30-Jul Sat 0000-2400 W. Subdistrict South of Redoubt Pt.
0000-0500 Kasilof River Special Harvest Area Kasilof River Special Harvest Area
0700-1900 Kalgin Island Subdistrict South of North End of Kalgin Island
1200-2400 Kenai, Kasilof, & East Forelands Sections
1900-2300 Kenai & Kasilof Sections
31-Jul Sun 0000-2400 W. Subdistrict South of Redoubt Pt.
0000-2300 Kenai, Kasilof, & East Forelands Sections
0500-2300 Expanded Kenai & Kasilof Sections
1-Aug Mon 0000-2400 W. Subdistrict South of Redoubt Pt.
0500-0700 Kenai & Kasilof Sections
0700-1900 All except Northern District South of North End of Kalgin Island
1900-2400 Kenai, Kasilof, & East Forelands Sections
1900-2300 Kenai & Kasilof Sections
2-Aug Tue 0000-2400 W. Subdistrict South of Redoubt Pt.
1400-2300 Expanded Kenai & Kasilof Sections
3-Aug Wed 0000-2400 W. Subdistrict South of Redoubt Pt.
0500-2400 Kenai, Kasilof, & East Forelands Sections
0500-2300 Expanded Kenai & Kasilof Sections
4-Aug Thu 0000-2400 W. Subdistrict South of Redoubt Pt.
0000-0700 Kenai, Kasilof, & East Forelands Sections
0500-0700 Kenai & Kasilof Sections
0700-1900 All except Northern District All
5-Aug Fri 0000-2400 W. Subdistrict South of Redoubt Pt.
0500-2300 Expanded Kenai & Kasilof Sections
6-Aug Sat 0700-2400 Kenai, Kasilof, & East Forelands Sections
0700-2300 Expanded Kenai & Kasilof Sections
0700-1900 Kalgin Island Subdistrict
-continued-

93
Table 11.–Page 5 of 5.
Date Day Time Set Gill Net Drift Gill Net
7-Aug Sun 0000-2400 Kenai, Kasilof, & East Forelands Sections
0500-2300 Expanded Kenai & Kasilof Sections
8-Aug Mon 0000-0700 Kenai, Kasilof, & East Forelands Sections
0500-0700 Expanded Kenai & Kasilof Sections
0700-1900 All All
1900-2400 Kenai, Kasilof, & East Forelands Sections
1900-2300 Expanded Kenai & Kasilof Sections
9-Aug Tue 0000-2400 Kenai, Kasilof, & East Forelands Sections
0500-2300 Expanded Kenai & Kasilof Sections
10-Aug Wed 0000-2400 Kenai, Kasilof, & East Forelands Sections
0500-2300 Expanded Kenai & Kasilof Sections
0700-1900 Kalgin Island Subdistrict
11-Aug Thu 0700-1900 All except Upper Subdistrict Drift Areas 3 & 4
15-Aug Mon 0700-1900 All except Upper Subdistrict Drift Areas 3 & 4
17-Aug Wed 0700-1900 Kalgin Island Subdistrict
18-Aug Thu 0700-1900 All except Upper Subdistrict Drift Areas 3 & 4
22-Aug Mon 0700-1900 All except Upper Subdistrict Drift Areas 3 & 4
25-Aug Thu 0700-1900 All except Upper Subdistrict Drift Areas 3 & 4
29-Aug Mon 0700-1900 All except Upper Subdistrict Drift Areas 3 & 4
1-Sep Thu 0700-1900 All except Upper Subdistrict Drift Areas 3 & 4
5-Sep Mon 0700-1900 All except Upper Subdistrict Drift Areas 3 & 4
8-Sep Thu 0700-1900 All except Upper Subdistrict Drift Areas 3 & 4
12-Sep Mon 0700-1900 All except Upper Subdistrict Drift Areas 3 & 4
15-Sep Thu 0700-1900 All except Upper Subdistrict Drift Areas 3 & 4

94
Table 12.–Age composition (in percent) of sockeye salmon escapements, Upper Cook Inlet, 2005.
Age Group Stream 0.2 1.1 0.3 1.2 2.1 1.3 2.2 1.4 2.3 3.2 2.4 3.3 Total Kenai River 0.1 0.2 2.8 0.2 81.3 2.8 0.3 11.8 0.5 0.1 100 Kasilof River 0.7 38.8 0.3 32.8 18.7 8.8 0.1 100 Yentna River 0.5 1.7 4.0 22.7 0.1 54.4 6.2 0.1 10.1 0.1 100 Crescent River 0.4 13.3 51.6 8.7 25.8 0.2 100 Fish Creek 14.5 3.4 56.2 1.1 10.5 12.9 1.3 100
Note: Hidden Creek scales were immersed in water and then dried to a molded block and were therefore unusable.

95
Table 13.–Upper Cook Inlet salmon average weights (in pounds) by area, 2005.
Fishery Chinook Sockeye Coho Pink Chum
Upper Cook Inlet Total 24.6 6.1 6.3 3.3 7.3
A. Northern District Total 16.5 5.7 6.0 3.4 6.8
1. Northern District West 16.7 5.4 5.9 3.3 6.9
a. Trading Bay 247-10 16.5 6.1 5.5 11.0
b. Tyonek 247-20 16.3 5.6 5.5 3.2 6.1
c. Beluga 247-30 18.3 5.6 4.3 3.3 7.7
d. Susitna Flat 247-41 18.2 4.9 6.1 2.6 6.9
e. Pt. Mackenzie 247-42 17.3 4.9 6.8 3.2 5.7
f. Fire Island 247-43 14.0 5.6 6.5 3.5 3.9
2. Northern District East 14.5 5.9 6.3 3.4 6.5
a. Pt. Possession 247-70 13.8 6.1 6.3 3.3 6.8
b. Birch Hill 247-80 15.6 6.0 6.4 7.4 6.6
c. Number 3 Bay 247-90 17.4 5.5 6.1 3.4 5.8
B. Central District Total 25.7 6.1 6.4 3.3 7.3
1. East Side Set Total 26.8 5.9 6.2 3.2 6.3
a. Salamatof/EastForelands 24.9 6.3 6.2 3.4 6.3
1. Salamatof 244-41 26.7 6.3 6.3 3.5 6.6
2. East Forelands 244-42 10.7 6.2 6.0 3.4 6.2
b. Kalifonsky Beach 28.4 5.8 6.4 3.0 6.8
1. South K. Beach 244-31 27.2 5.4 6.3 2.9 7.4
2. North K. Beach 244-32 30.1 6.2 6.4 3.2 6.1
c. Kasilof Terminal 244-25 26.4 4.7 3.6 3.2 5.5
d. Cohoe/Ninilchik 26.8 5.5 6.1 3.1 6.3
1. Cohoe 244-22 25.8 5.5 6.0 3.2 6.1
2. Ninilchik 244-21 28.5 5.5 6.2 3.1 6.5
2. West Side Set Total 24.9 5.7 6.0 3.1 7.2
a. Little Jack Slough 245-50 4.8 6.0 3.2 7.0
b. Polly Creek 245-40 23.1 5.8 3.1
c. Tuxedni Bay 245-30 25.1 5.8 6.0 3.1 7.2
d. Silver Salmon 245-20 10.0 4.2 2.3 -continued-

96
Table 13.–Page 2 of 2.
Fishery Chinook Sockeye Coho Pink Chum
3. Kustatan Total 25.6 4.9 7.3 3.4
a. Big River 245-55 25.6 4.8 6.9
b. West Foreland 245-60 5.9 8.2 3.4
4. Kalgin Island Total 17.0 5.7 6.1 3.4 6.4
a. West Side 246-10 16.9 5.8 6.1 3.4 6.4
b. East Side 246-20 32.3 5.4 6.2 3.2 6.5
5. Chinitna Bay Total
a. Set 245-10
6. Central District Set Total 26.6 5.8 6.1 3.2 6.7
7. Central District Drift Total 14.9 6.3 6.4 3.4 7.3
a. West Side 245-70,80,90 6.0 6.5 4.1 6.6
b. East Side 244-50,60,70 12.8 6.3 6.5 3.4 7.3
c. East Side Corridor Total 16.3 6.4 6.4 3.4 7.1 2. Kasilof Corridor 244-61 18.2 6.2 6.1 3.2 7.5 3. E. Side Corridor 244-55 16.0 6.4 6.4 3.4 7.1 e. Kasilof Terminal 244-25 19.7 5.1 6.6 3.2 7.4
Note: Average weights determined from total pounds of fish divided by numbers of fish from commercial harvest tickets.

97
Table 14.–Major buyers and processors of Upper Cook Inlet fishery products, 2005.
Buyer/Processor Code Plant Site Contact Address 10th and M Seafoods F4323 Anchorage Judy 1020 M St. Anchorage, AK 99501 Alaska Salmon Purchasers F4665 Kenai Mark Powell HC01 Box 240 Kenai, AK 99611-0240 Coal Point Seafood Co. F1757 Homer John 4306 Homer Spit Homer, AK 99603 Copper River Seafoods F6426 Kasilof Daryl 4000 W. 50th, Suite 2 Anchorage, AK 99502 Deep Cr. Custom Packing F1051-5 Ninilchik Jeff Berger P.O. Box 39229 Ninilchik Ak. 99639 Favco F0398 Anchorage Greg Favretto P.O. Box 190968 Anchorage, AK 99519 Fishhawk Fisheries F1540-1 Kenai Steve Fick P.O. Box 715 Astoria Or. 97103 Fishermen's Express F5584-3 Anchorage Cade 417 D. St. Anchorage, AK 99501 The Fish Factory F4449 Homer Mike McCune 800 Fish Dock Rd Homer, AK Fred's AK Wholesale S.foods F19092 Anchorage Fred D Thoerner 230 E Potter # 11 Anchorage, AK 99502 Icicle Seafoods F0135 Seward Melody Jordan P.O. Box 79003 Seattle Wa. 98119 Inlet Fisheries Inc. F4682-0 Kenai Patrick Klier P.O. Box 530 Kenai Ak. 99611 Inlet Fish Producers F2806 Kenai Ellie Tikka 200 Columbia St Kenai, AK 99611 Mayflower F/V F6374 Kenai Rich King 40789 K. Beach Rd. Kenai, AK 99611 Ocean Beauty F5204 Kenai Pat Hardina Box 8163 Nikiski Ak. 99635 Pacific Star Seafoods F1834 Kenai Dan Foley 520 Bridge Access Rd. Kenai, AK 99611 Peninsula Processing F3789-6 Soldotna Annette 720 K. Beach Rd. Soldotna, AK 99669 R & J Seafoods F6087-5 Kasilof Randy Meier P.O. Box 165 Kasilof, AK 99610 Salamatof Seafoods F0037-1 Kenai Wylie Reed P.O. Box 1450 Kenai Ak. 99615 Snug Harbor Seafoods F3894 Kenai Paul Dale P.O. Box 701 Kenai, AK 99611

98
Table 15.–Number of personal use salmon harvested by gear, area, and species, Upper Cook Inlet, 2005.
Harvest Fishery Chinook Sockeye Coho Pink Chum Total Kasilof Gillnet 87 32,603 326 16 1 33,033 Kasilof Dip Net 14 45,753 476 580 91 46,914 Kenai Dip Net 775 291,421 1,998 1,462 241 295,897 Fish Creek Dip Net 0 No Site Reported 0 Total 876 369,777 2,800 2,058 333 375,844
Note: When no fishery was reported or was non-legible on returned permits, the harvested was divided up amongst the three personal use fisheries in proportion to the known harvest. Preliminary data.

99
Table 16.–Age, weight, sex, and size distribution of Pacific herring sampled by gillnet in Upper Cook Inlet, 2005.
Sample date = May 27, 2005 Numbers of Fish Percent Weight Length
Sample Imm. Ripe Spawned of Mean No. Mean No. Period Age Male Female Female Female Unknown Total Total (g) SD Weighed (mm) SD Measured ESSN 3 2 1 3 1.4 116 11.6 3 189 13.2 3
4 15 15 6 36 17.0 123 28.8 36 193 13.5 36 5 32 40 21 93 43.9 138 22.4 93 199 11.2 93 6 24 16 20 60 28.3 146 24.5 60 207 11.7 60 7 9 4 5 18 8.5 169 28.3 18 218 12.5 18 8 1 1 2 0.9 176 4.2 2 223 3.5 2 9
Sample Total 81 0 77 54 0 212 100.0 140 27.2 212 202 13.7 212 Sex Composition 38.2% 0.0% 36.3% 25.5% 0.0% Sample date = May 25, 2005
Numbers of Fish Percent Weight Length Sample Imm. Ripe Spawned of Mean No. Mean No. Period Age Male Female Female Female Unknown Total Total (g) SD Weighed (mm) SD Measured
CHINITNA 3 1 2 3 1.3 120 12.9 3 193 5.3 3 BAY 4 27 53 80 35.4 143 14.6 81 205 7.8 81
5 30 65 95 42.0 157 22.4 95 211 10.3 95 6 14 16 2 32 14.2 175 24.4 32 221 11.8 32 7 3 4 1 8 3.5 175 29.2 8 219 11.1 8 8 3 4 7 3.1 190 34.7 7 225 11.9 7 9 1 1 0.4 212 NA 1 232 NA 1
Sample Total 79 0 144 3 0 226 100.0 156 24.8 227 211 11.5 227 Sex Composition 35.0% 0.0% 63.7% 1.3% 0.0%
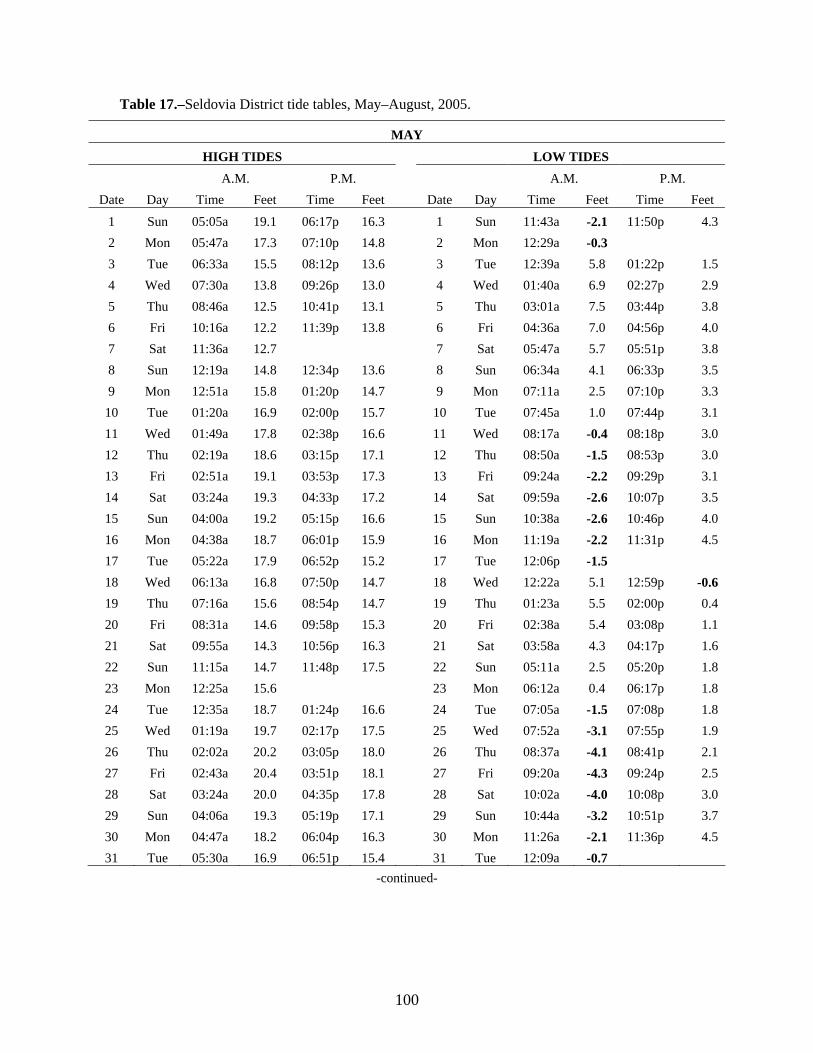
100
Table 17.–Seldovia District tide tables, May–August, 2005.
MAY
HIGH TIDES LOW TIDES A.M. P.M. A.M. P.M. Date Day Time Feet Time Feet Date Day Time Feet Time Feet
1 Sun 05:05a 19.1 06:17p 16.3 1 Sun 11:43a -2.1 11:50p 4.3 2 Mon 05:47a 17.3 07:10p 14.8 2 Mon 12:29a -0.3 3 Tue 06:33a 15.5 08:12p 13.6 3 Tue 12:39a 5.8 01:22p 1.5 4 Wed 07:30a 13.8 09:26p 13.0 4 Wed 01:40a 6.9 02:27p 2.9 5 Thu 08:46a 12.5 10:41p 13.1 5 Thu 03:01a 7.5 03:44p 3.8 6 Fri 10:16a 12.2 11:39p 13.8 6 Fri 04:36a 7.0 04:56p 4.0 7 Sat 11:36a 12.7 7 Sat 05:47a 5.7 05:51p 3.8 8 Sun 12:19a 14.8 12:34p 13.6 8 Sun 06:34a 4.1 06:33p 3.5 9 Mon 12:51a 15.8 01:20p 14.7 9 Mon 07:11a 2.5 07:10p 3.3
10 Tue 01:20a 16.9 02:00p 15.7 10 Tue 07:45a 1.0 07:44p 3.1 11 Wed 01:49a 17.8 02:38p 16.6 11 Wed 08:17a -0.4 08:18p 3.0 12 Thu 02:19a 18.6 03:15p 17.1 12 Thu 08:50a -1.5 08:53p 3.0 13 Fri 02:51a 19.1 03:53p 17.3 13 Fri 09:24a -2.2 09:29p 3.1 14 Sat 03:24a 19.3 04:33p 17.2 14 Sat 09:59a -2.6 10:07p 3.5 15 Sun 04:00a 19.2 05:15p 16.6 15 Sun 10:38a -2.6 10:46p 4.0 16 Mon 04:38a 18.7 06:01p 15.9 16 Mon 11:19a -2.2 11:31p 4.5 17 Tue 05:22a 17.9 06:52p 15.2 17 Tue 12:06p -1.5 18 Wed 06:13a 16.8 07:50p 14.7 18 Wed 12:22a 5.1 12:59p -0.6 19 Thu 07:16a 15.6 08:54p 14.7 19 Thu 01:23a 5.5 02:00p 0.4 20 Fri 08:31a 14.6 09:58p 15.3 20 Fri 02:38a 5.4 03:08p 1.1 21 Sat 09:55a 14.3 10:56p 16.3 21 Sat 03:58a 4.3 04:17p 1.6 22 Sun 11:15a 14.7 11:48p 17.5 22 Sun 05:11a 2.5 05:20p 1.8 23 Mon 12:25a 15.6 23 Mon 06:12a 0.4 06:17p 1.8 24 Tue 12:35a 18.7 01:24p 16.6 24 Tue 07:05a -1.5 07:08p 1.8 25 Wed 01:19a 19.7 02:17p 17.5 25 Wed 07:52a -3.1 07:55p 1.9 26 Thu 02:02a 20.2 03:05p 18.0 26 Thu 08:37a -4.1 08:41p 2.1 27 Fri 02:43a 20.4 03:51p 18.1 27 Fri 09:20a -4.3 09:24p 2.5 28 Sat 03:24a 20.0 04:35p 17.8 28 Sat 10:02a -4.0 10:08p 3.0 29 Sun 04:06a 19.3 05:19p 17.1 29 Sun 10:44a -3.2 10:51p 3.7 30 Mon 04:47a 18.2 06:04p 16.3 30 Mon 11:26a -2.1 11:36p 4.5 31 Tue 05:30a 16.9 06:51p 15.4 31 Tue 12:09a -0.7
-continued-

101
Table 17–Page 2 of 4.
JUNE HIGH TIDES LOW TIDES
A.M. P.M. A.M. P.M. Date Day Time Feet Time Feet Date Day Time Feet Time Feet
1 Wed 11:06a 14.2 11:36p 17.2 1 Wed 5:01a 2.3 5:07p 2.2 2 Thu * * 12:17p 14.7 2 Thu 6:04a 0.8 6:04p 2.7 3 Fri 12:24a 17.8 1:17p 15.4 3 Fri 6:56a -0.6 6:54p 3.0 4 Sat 1:06a 18.3 2:07p 16.0 4 Sat 7:42a -1.7 7:40p 3.3 5 Sun 1:46a 18.6 2:52p 16.5 5 Sun 8:23a -2.3 8:22p 3.4 6 Mon 2:23a 18.7 3:33p 16.8 6 Mon 9:02a -2.6 9:02p 3.6 7 Tue 3:00a 18.6 4:12p 16.8 7 Tue 9:39a -2.6 9:41p 3.9 8 Wed 3:36a 18.3 4:50p 16.5 8 Wed 10:16a -2.2 10:20p 4.2 9 Thu 4:13a 17.7 5:29p 16.0 9 Thu 10:53a -1.6 10:59p 4.7
10 Fri 4:51a 17.0 6:09p 15.5 10 Fri 11:30a -0.8 11:40p 5.2 11 Sat 5:31a 16.1 6:51p 14.9 11 Sat * * 12:09p 0.1 12 Sun 6:14a 15.0 7:35p 14.5 12 Sun 12:24a 5.7 12:50p 1.2 13 Mon 7:03a 13.9 8:20p 14.2 13 Mon 1:14a 6.1 1:34p 2.2 14 Tue 8:01a 12.9 9:07p 14.3 14 Tue 2:12a 6.2 2:22p 3.3 15 Wed 9:10a 12.2 9:54p 14.6 15 Wed 3:17a 5.8 3:17p 4.1 16 Thu 10:25a 12.2 10:42p 15.3 16 Thu 4:24a 4.9 4:17p 4.8 17 Fri 11:37a 12.7 11:29p 16.1 17 Fri 5:25a 3.4 5:16p 5.0 18 Sat * * 12:41p 13.8 18 Sat 6:17a 1.7 6:12p 4.9 19 Sun 12:16a 17.2 1:37p 15.0 19 Sun 7:06a -0.2 7:05p 4.5 20 Mon 1:04a 18.3 2:27p 16.2 20 Mon 7:52a -2.0 7:55p 3.9 21 Tue 1:52a 19.4 3:15p 17.2 21 Tue 8:38a -3.5 8:44p 3.2 22 Wed 2:40a 20.2 4:02p 17.9 22 Wed 9:24a -4.6 9:32p 2.7 23 Thu 3:30a 20.7 4:49p 18.3 23 Thu 10:11a -5.1 10:22p 2.2 24 Fri 4:20a 20.6 5:36p 18.4 24 Fri 10:58a -5.0 11:13p 2.1 25 Sat 5:12a 20.0 6:24p 18.2 25 Sat 11:46a -4.2 * * 26 Sun 6:06a 18.8 7:14p 18.0 26 Sun 12:06a 2.1 12:35p -2.9 27 Mon 7:04a 17.3 8:05p 17.6 27 Mon 1:04a 2.2 1:26p -1.2 28 Tue 8:08a 15.6 8:58p 17.3 28 Tue 2:07a 2.4 2:21p 0.7 29 Wed 9:20a 14.3 9:52p 17.0 29 Wed 3:16a 2.3 3:19p 2.5 30 Thu 10:39a 13.5 10:48p 16.8 30 Thu 4:28a 1.9 4:23p 4.0
-continued-

102
Table 17.–Page 3 of 4.
JULY HIGH TIDES LOW TIDES
A.M. P.M. A.M. P.M. Date Day Time Feet Time Feet Date Day Time Feet Time Feet
1 Fri 11:58a 13.5 11:42p 16.8 1 Fri 5:36a 1.2 5:27p 5.0 2 Sat * * 1:06p 14.1 2 Sat 6:35a 0.4 6:27p 5.4 3 Sun 12:34a 16.9 2:01p 14.8 3 Sun 7:26a -0.4 7:20p 5.4 4 Mon 1:22a 17.1 2:47p 15.5 4 Mon 8:10a -1.0 8:07p 5.1 5 Tue 2:05a 17.4 3:26p 16.0 5 Tue 8:50a -1.4 8:49p 4.7 6 Wed 2:45a 17.7 4:01p 16.4 6 Wed 9:27a -1.7 9:28p 4.4 7 Thu 3:24a 17.9 4:36p 16.7 7 Thu 10:02a -1.7 10:06p 4.2 8 Fri 4:02a 17.9 5:10p 16.7 8 Fri 10:36a -1.6 10:44p 4.1 9 Sat 4:39a 17.6 5:43p 16.6 9 Sat 11:10a -1.1 11:22p 4.1
10 Sun 5:17a 0:00 6:16p 16.4 10 Sun 11:43a -0.4 * * 11 Mon 5:56a 16.1 6:50p 16.2 11 Mon 12:00a 4.3 12:17p 0.5 12 Tue 6:37a 15.1 7:24p 15.9 12 Tue 12:41a 4.5 12:52p 1.7 13 Wed 7:25a 13.9 8:01p 15.7 13 Wed 1:26a 4.6 1:30p 3.1 14 Thu 8:22a 12.9 8:43p 15.5 14 Thu 2:18a 4.6 2:15p 4.4 15 Fri 9:34a 12.2 9:34p 15.6 15 Fri 3:20a 4.2 3:13p 5.6 16 Sat 10:58a 12.2 10:33p 16.0 16 Sat 4:30a 3.4 4:23p 6.4 17 Sun 12:18p 13.1 11:37p 16.8 17 Sun 5:39a 2.0 5:36p 6.4 18 Mon 1:23p 14.4 * * 18 Mon 6:41a 0.3 6:42p 5.7 19 Tue 12:39a 17.9 2:17p 15.9 19 Tue 7:36a -1.6 7:40p 4.5 20 Wed 1:37a 19.3 3:04p 17.4 20 Wed 8:26a -3.3 8:32p 3.2 21 Thu 2:32a 20.5 3:48p 18.6 21 Thu 9:13a -4.6 9:22p 1.9 22 Fri 3:23a 21.3 4:31p 19.5 22 Fri 9:58a -5.2 10:11p 0.9 23 Sat 4:14a 21.5 5:14p 20.0 23 Sat 10:42a -5.1 11:00p 0.2 24 Sun 5:03a 21.0 5:56p 20.1 24 Sun 11:26a -4.2 11:49p 0.1 25 Mon 5:54a 16:48 6:38p 19.7 25 Mon * * 12:09p -2.6 26 Tue 6:46a 18.0 7:22p 18.9 26 Tue 12:41a 0.4 12:54p -0.5 27 Wed 7:44a 16.0 8:08p 17.9 27 Wed 1:36a 1.0 1:41p 1.9 28 Thu 8:49a 14.2 8:58p 16.8 28 Thu 2:37a 1.8 2:34p 4.2 29 Fri 10:09a 13.0 9:57p 15.9 29 Fri 3:48a 2.4 3:38p 6.0 30 Sat 11:43a 12.8 11:05p 15.3 30 Sat 5:06a 2.4 4:55p 7.1 31 Sun * * 1:03p 13.4 31 Sun 6:18a 2.0 6:12p 7.2
-continued-

103
Tabe17.–Page 4 of 4.
AUGUST
HIGH TIDES LOW TIDES A.M. P.M. A.M. P.M. Date Day Time Feet Time Feet Date Day Time Feet Time Feet
1 Mon 12:13a 15.4 1:58p 14.4 1 Mon 7:16a 1.2 7:13p 6.6 2 Tue 1:11a 16 2:39p 15.3 2 Tue 8:01a 0.4 8:00p 5.8 3 Wed 1:57a 16.8 3:12p 16.2 3 Wed 8:39a -0.3 8:39p 4.9 4 Thu 2:37a 17.6 3:42p 16.9 4 Thu 9:12a -0.9 9:15p 4.0 5 Fri 3:13a 18.3 4:11p 17.5 5 Fri 9:43a -1.3 9:49p 3.3 6 Sat 3:48a 18.6 4:39p 18.0 6 Sat 10:13a -1.4 10:23p 2.8 7 Sun 4:23a 18.6 5:07p 18.1 7 Sun 10:42a -1.0 10:57p 2.6 8 Mon 4:58a 18.2 5:34p 18.1 8 Mon 11:12a -0.3 11:31p 2.6 9 Tue 5:33a 17.3 6:02p 17.9 9 Tue 11:42a 0.7 - -
10 Wed 6:11a 16.2 6:31p 17.5 10 Wed 12:06a 2.7 12:13p 2.1 11 Thu 6:53a 14.9 7:03p 16.9 11 Thu 12:44a 3.0 12:47p 3.6 12 Fri 7:45a 13.6 7:43p 16.4 12 Fri 1:29a 3.3 1:28p 5.2 13 Sat 8:57a 12.5 8:38p 15.8 13 Sat 2:27a 3.6 2:25p 6.7 14 Sun 10:32a 12.1 9:52p 14:24 14 Sun 3:45a 3.5 3:46p 7.6 15 Mon 12:08p 13.0 11:15p 16.3 15 Mon 5:12a 2.6 5:17p 7.4 16 Tue - - 1:15p 14.7 16 Tue 6:27a 0.8 6:32p 6.1 17 Wed 12:30a 17.7 2:04p 16.6 17 Wed 7:24a -1.1 7:32p 4.2 18 Thu 1:32a 19.4 2:47p 18.4 18 Thu 8:13a -2.9 8:23p 2.2 19 Fri 2:26a 20.9 3:26p 19.9 19 Fri 8:57a -4.2 9:10p 0.3 20 Sat 3:15a 22.0 4:05p 21.1 20 Sat 9:39a -4.6 9:56p -1.0 21 Sun 4:03a 22.2 4:42p 21.6 21 Sun 10:19a -4.3 10:41p -1.7 22 Mon 4:49a 21.6 5:20p 21.5 22 Mon 10:59a -3.1 11:25p -1.7 23 Tue 5:36a 20.3 5:57p 20.8 23 Tue 11:39a -1.2 - - 24 Wed 6:24a 18.4 6:36p 19.6 24 Wed 12:11a -0.9 12:19p 1.1 25 Thu 7:16a 16.2 7:16p 17.9 25 Thu 1:00a 0.3 1:02p 3.5 26 Fri 8:17a 14.2 8:04p 16.2 26 Fri 1:54a 1.8 1:51p 5.9 27 Sat 9:40a 12.8 9:06p 14.7 27 Sat 3:02a 3.2 2:57p 7.7 28 Sun 11:32a 12.5 10:33p 14.0 28 Sun 4:33a 3.9 4:34p 8.6 29 Mon - - 12:56p 9:36 29 Mon 6:03a 3.5 6:09p 8.1 30 Tue 12:03a 14.3 1:45p 14.6 30 Tue 7:04a 2.6 7:09p 6.9 31 Wed 1:05a 15.4 2:18p 15.7 31 Wed 7:46a 1.5 7:50p 5.6
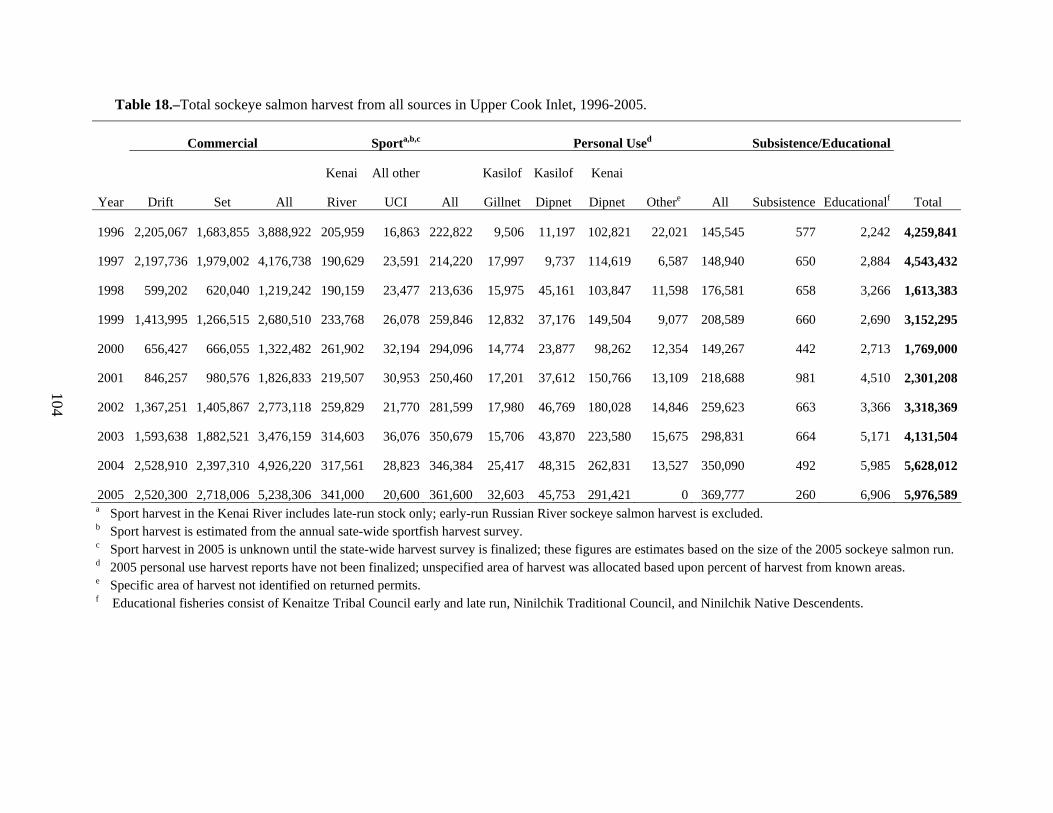
104
Table 18.–Total sockeye salmon harvest from all sources in Upper Cook Inlet, 1996-2005.
Commercial Sporta,b,c Personal Used Subsistence/Educational
Kenai All other Kasilof Kasilof Kenai
Year Drift Set All River UCI All Gillnet Dipnet Dipnet Othere All Subsistence Educationalf Total
1996 2,205,067 1,683,855 3,888,922 205,959 16,863 222,822 9,506 11,197 102,821 22,021 145,545 577 2,242 4,259,841
1997 2,197,736 1,979,002 4,176,738 190,629 23,591 214,220 17,997 9,737 114,619 6,587 148,940 650 2,884 4,543,432
1998 599,202 620,040 1,219,242 190,159 23,477 213,636 15,975 45,161 103,847 11,598 176,581 658 3,266 1,613,383
1999 1,413,995 1,266,515 2,680,510 233,768 26,078 259,846 12,832 37,176 149,504 9,077 208,589 660 2,690 3,152,295
2000 656,427 666,055 1,322,482 261,902 32,194 294,096 14,774 23,877 98,262 12,354 149,267 442 2,713 1,769,000
2001 846,257 980,576 1,826,833 219,507 30,953 250,460 17,201 37,612 150,766 13,109 218,688 981 4,510 2,301,208
2002 1,367,251 1,405,867 2,773,118 259,829 21,770 281,599 17,980 46,769 180,028 14,846 259,623 663 3,366 3,318,369
2003 1,593,638 1,882,521 3,476,159 314,603 36,076 350,679 15,706 43,870 223,580 15,675 298,831 664 5,171 4,131,504
2004 2,528,910 2,397,310 4,926,220 317,561 28,823 346,384 25,417 48,315 262,831 13,527 350,090 492 5,985 5,628,012
2005 2,520,300 2,718,006 5,238,306 341,000 20,600 361,600 32,603 45,753 291,421 0 369,777 260 6,906 5,976,589a Sport harvest in the Kenai River includes late-run stock only; early-run Russian River sockeye salmon harvest is excluded. b Sport harvest is estimated from the annual sate-wide sportfish harvest survey. c Sport harvest in 2005 is unknown until the state-wide harvest survey is finalized; these figures are estimates based on the size of the 2005 sockeye salmon run. d 2005 personal use harvest reports have not been finalized; unspecified area of harvest was allocated based upon percent of harvest from known areas. e Specific area of harvest not identified on returned permits. f Educational fisheries consist of Kenaitze Tribal Council early and late run, Ninilchik Traditional Council, and Ninilchik Native Descendents.

105
Table 19.–Daily commercial harvest of razor clams, Upper Cook Inlet, 2005.
Date Lbs No. Diggers Date Lbs No. Diggers
5/21 6,398 22 7/02 4,357 21
5/22 8,604 22 7/03 5,553 22
5/23 9,692 22 7/04 6,177 22
5/25 6,908 22 7/05 7,369 22
5/26 6,656 22 7/06 7,447 22
5/27 6,672 22 7/07 6,462 22
5/29 8,303 22 7/08 6,523 22
5/30 5,659 22 7/09 6,507 22
6/02 5,070 22 7/10 6,070 22
6/03 7,657 22 7/11 3,657 22
6/04 8,319 22 7/18 6,238 21
6/05 7,527 22 7/19 6,683 22
6/06 7,637 22 7/20 5,945 22
6/07 7,676 22 7/21 6,167 22
6/09 6,468 22 7/22 6,183 22
6/10 6,526 22 7/23 6,141 22
6/11 8,097 22 7/24 6,217 22
6/12 5,682 22 7/25 5,147 22
6/19 8,254 22 7/26 5,016 22
6/20 7,644 22 7/27 2,303 22
6/21 7,620 22 8/01 5,279 22
6/22 7,687 22 8/02 6,180 22
6/23 7,667 22 8/03 4,227 21
6/24 7,635 22 8/04 6,492 22
6/25 11,055 22 8/05 6,914 22
6/26 6,487 22 8/06 7,381 22
6/27 1,021 3 8/07 6,166 21
6/28 4,803 22 8/08 7,623 22
8/09 5,547 22
Total for Year = 371,395

106
Kenai
AnchorPoint
NorthernDistrict
Seward
Gulf of Alaska
Central District
SusitnaRiver
Wasilla Creek
CottonwoodCreek
Kenai River
HighwaySystem
Moose River
Homer
Swanson River
Ninilchik River
Deep Creek
Stariski Creek
Anchor River
Theodore RiverBeluga River
Chuitna River
Kustatan River
Big River
Drift River
Harriet Creek
Redoubt Cr.Crescent River
N
ALASKA
CookInlet
Kasilof River
YentnaRiver
Tuxedni BayTustumena Lake
Skilak Lake Kenai LakeKalginIsland
Fish Creek
Big Lake
LittleSusitna
River
Chinitna Bay
PointBoulder
Figure 1.–Major tributaries of the Cook Inlet Basin.
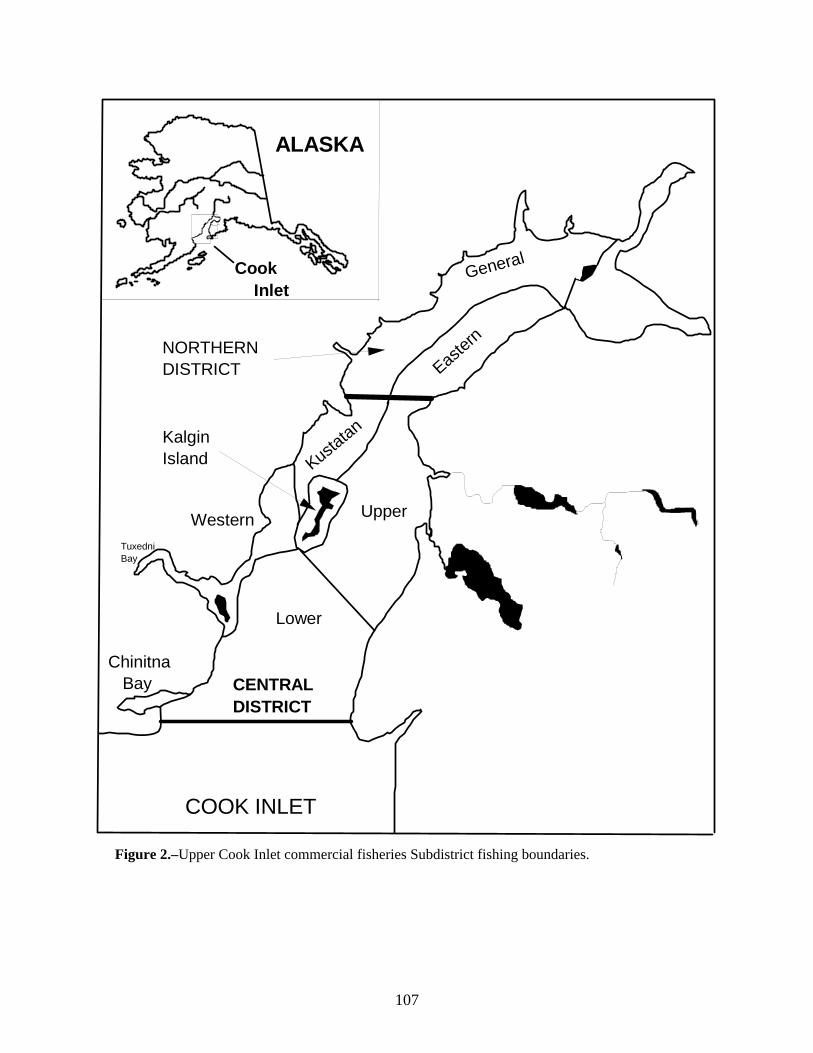
107
Easter
n
General
Upper
Lower
COOK INLET
Chinitna Bay
Western
KustatanKalgin
Island
ALASKA
Cook Inlet
CENTRAL DISTRICT
NORTHERN DISTRICT
TuxedniBay
Figure 2.–Upper Cook Inlet commercial fisheries Subdistrict fishing boundaries.

108
Cook Inlet
Kenai
AnchorPoint
244-41
Homer
Anchorage
247-50
247-42
247-43
247-41
247-30
247-20
247-10
247-70
247-80
247-90
244-22
244-21244-60
244-31
244-50
244-70245-90245-20245-10
245-30
245-80
245-40
245-50
245-70
246-10
246-20
245-55
245-60
N
ALASKA
CookInlet
244-32
244-42
244-61
244-51
NORTHERN DISTRICTGeneral SubDistrict247-10 Trading Bay247-20 Tyonek247-30 Beluga247-41 Susitna Flats247-42 Pt. McKenzie247-43 Fire Island247-50 Knik247-60 Turnagain
Eastern SubDistrict247-70 Pt. Possession247-80 Birch Hill247-90 #3 Bay
CENTRAL DISTRICT
East Side Set244-42 East Forelands244-41 Salamatof244-32 North K-Beach244-31 South K-Beach244-22 Cohoe244-21 Ninilchik
West Side Set245-50 Little Jack Slough245-40 Polly Creek245-30 Tuxedni Bay245-20 Silver Salmon
Kustatan245-55 Big River245-60 West Foreland
Kalgin Island246-10 West Side246-20 East Side
Chinitna245-10 Set245-10 Drift
Drift Gillnet244-50,60,70245-70,80,90
Drift Gillnet Corridor244-51 Kenai244-61 Kasilof244-55 Full
Kenai SectionKasilof Section
Figure 3.–Upper Cook Inlet commercial fisheries statistical areas.
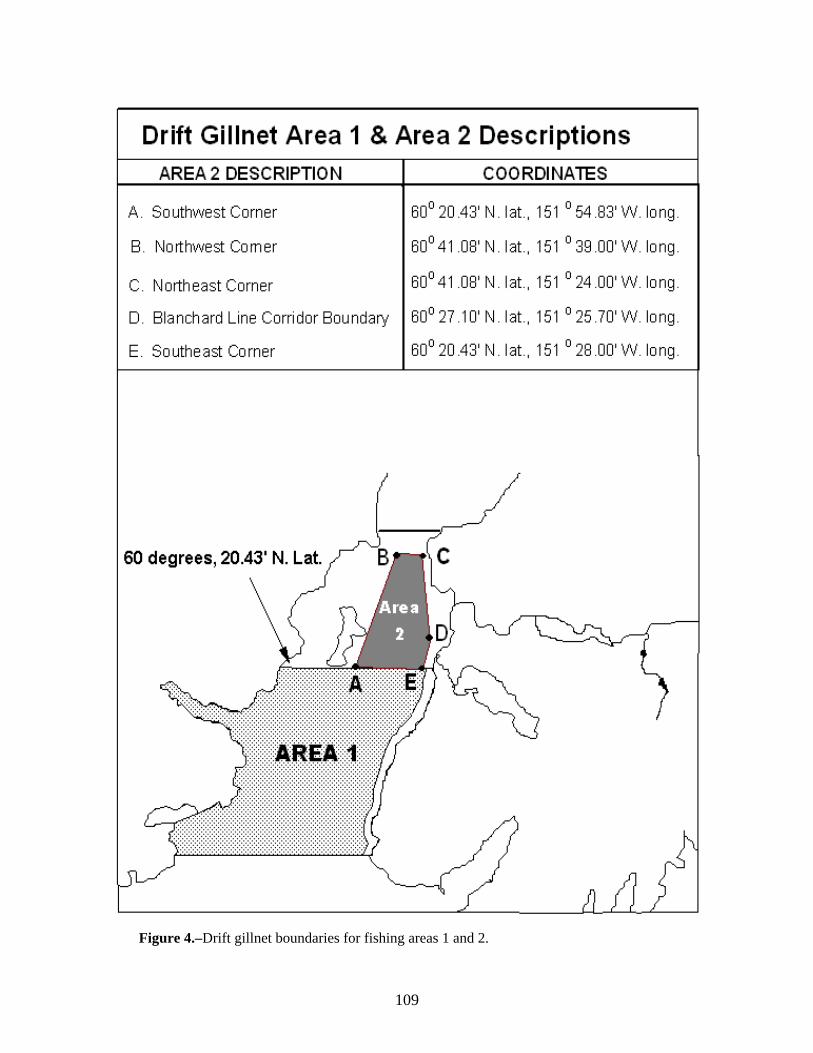
109
Figure 4.–Drift gillnet boundaries for fishing areas 1 and 2.

110
Figure 5.–Drift gillnet boundaries for fishing areas 3 and 4.

111
APPENDIX A

112
Appendix A1.–Upper Cook Inlet commercial Chinook salmon harvest by gear type and area, 1966-2005.
Central District Central District Set Gillnet Northern District
Drift Gillnet East Side Kalgin/West Side Set Gillnet
Year Numberb % Numberb % Numberb % Numberb % Total
1966 392 4.6 7,329 85.8 401 4.7 422 4.9 8,544
1967 489 6.2 6,686 85.1 500 6.4 184 2.3 7,859
1968 182 4.0 3,304 72.8 579 12.8 471 10.4 4,536
1969 362 2.9 5,834 47.1 3,286 26.5 2,904 23.4 12,386
1970 356 4.3 5,368 64.4 1,152 13.8 1,460 17.5 8,336
1971 237 1.2 7,055 35.7 2,875 14.5 9,598 48.6 19,765
1972 375 2.3 8,599 53.5 2,199 13.7 4,913 30.5 16,086
1973 244 4.7 4,411 84.9 369 7.1 170 3.3 5,194
1974 422 6.4 5,571 84.5 434 6.6 169 2.6 6,596
1975 250 5.2 3,675 76.8 733 15.3 129 2.7 4,787
1976 690 6.4 8,249 75.9 1,469 13.5 457 4.2 10,865
1977 3,411 23.1 9,730 65.8 1,084 7.3 565 3.8 14,790
1978 2,072 12.0 12,468 72.1 2,093 12.1 666 3.8 17,299
1979 1,089 7.9 8,671 63.1 2,264 16.5 1,714 12.5 13,738
1980 889 6.4 9,643 69.9 2,273 16.5 993 7.2 13,798
1981 2,320 19.0 8,358 68.3 837 6.8 725 5.9 12,240
1982 1,293 6.2 13,658 65.4 3,203 15.3 2,716 13.0 20,870
1983 1,125 5.5 15,042 72.9 3,534 17.1 933 4.5 20,634
1984 1,377 13.7 6,165 61.3 1,516 15.1 1,004 10.0 10,062 -continued-

113
Appendix A1.–Page 2 of 2.
Central District Central District Set Gillnet Northern District Drift Gillnet East Side Kalgin/West Side Set Gillnet
Year Numberb % Numberb % Numberb % Numberb % Total 1985 2,048 8.5 17,723 73.6 2,427 10.1 1,890 7.8 24,088 1986 1,834 4.7 19,824 50.5 2,108 5.4 15,488 39.5 39,254 1987 4,552 11.5 21,150 53.6 1,029 2.6 12,700 32.2 39,431 1988 2,237 7.7 12,870 44.3 1,137 3.9 12,836 44.1 29,080 1989 10,914 40.8 3,092 11.6 12,731 47.6 26,737 1990 621 3.9 4,139 25.7 1,763 10.9 9,582 59.5 16,105 1991 246 1.8 4,893 36.1 1,544 11.4 6,859 50.6 13,542 1992 615 3.6 10,718 62.4 1,284 7.5 4,554 26.5 17,171 1993 765 4.1 14,079 74.6 720 3.8 3,307 17.5 18,871 1994 464 2.3 15,562 78.0 730 3.7 3,185 16.0 19,941 1995 594 3.3 12,068 67.4 1,101 6.2 4,130 23.1 17,893 1996 389 2.7 11,564 80.8 395 2.8 1,958 13.7 14,306 1997 627 4.7 11,325 85.2 207 1.6 1,133 8.5 13,292 1998 335 4.1 5,087 62.6 155 1.9 2,547 31.4 8,124 1999 575 4.0 9,463 65.8 1,533 10.7 2,812 19.6 14,383 2000 270 3.7 3,684 50.1 1,089 14.8 2,307 31.4 7,350 2001 619 6.7 6,009 64.6 856 9.2 1,811 19.5 9,295 2002 415 3.3 9,478 74.5 926 7.3 1,895 14.9 12,714 2003 1,240 6.7 14,810 80.1 770 4.2 1,670 9.0 18,490 2004 1,526 5.6 21,683 78.9 2,208 8.0 2,058 7.5 27,475 2005 1,958 7.0 22,101 78.5 739 2.6 3,373 12.0 28,171
1966-04 Avg a 988 6 9,893 66 1,389 10 3,235 18 15,505 1995-04 Avg 659 4 10,517 72 924 6 2,232 18 14,332
a 1989 not used in average as the drift fleet did not fish due to the Exxon Valdez oil spill; this had an effect on all other fisheries. b Harvest data prior to 2005 reflect minor adjustments to historical catch database.

114
Appendix A2.–Upper Cook Inlet commercial sockeye salmon harvest by gear type and area, 1966-2005.
Central District Central District Set Gillnet Northern District
Drift Gillnet East Side Kalgin/West Side Set Gillnet
Year Numberb % Numberb % Numberb % Numberb % Total
1966 1,103,261 59.6 485,330 26.2 132,443 7.2 131,080 7.1 1,852,114
1967 890,152 64.5 305,431 22.1 66,414 4.8 118,065 8.6 1,380,062
1968 561,737 50.8 317,535 28.7 85,049 7.7 140,575 12.7 1,104,896
1969 371,747 53.7 210,834 30.5 71,184 10.3 38,050 5.5 691,815
1970 460,690 62.9 142,701 19.5 62,723 8.6 66,458 9.1 732,572
1971 423,107 66.5 111,505 17.5 61,144 9.6 40,533 6.4 636,289
1972 506,281 57.5 204,599 23.3 83,176 9.5 85,755 9.7 879,811
1973 375,695 56.1 188,816 28.2 59,973 8.9 45,614 6.8 670,098
1974 265,771 53.5 136,889 27.5 52,962 10.7 41,563 8.4 497,185
1975 368,124 53.8 177,336 25.9 73,765 10.8 65,526 9.6 684,751
1976 1,055,786 63.4 476,376 28.6 62,338 3.7 69,649 4.2 1,664,149
1977 1,073,098 52.3 751,178 36.6 104,265 5.1 123,750 6.0 2,052,291
1978 1,803,479 68.8 660,797 25.2 105,767 4.0 51,378 2.0 2,621,421
1979 454,707 49.2 247,359 26.8 108,422 11.7 113,918 12.3 924,406
1980 770,247 48.9 559,812 35.6 137,882 8.8 105,647 6.7 1,573,588
1981 633,380 44.0 496,003 34.5 60,217 4.2 249,662 17.3 1,439,262
1982 2,103,429 64.5 971,423 29.8 66,952 2.1 118,060 3.6 3,259,864
1983 3,222,428 63.8 1,508,511 29.9 134,575 2.7 184,219 3.6 5,049,733
1984 1,235,337 58.6 490,273 23.3 162,139 7.7 218,965 10.4 2,106,714 -continued-

115
Appendix A2.–Page 2 of 2.
Central District Central District Set Gillnet Northern District Drift Gillnet East Side Kalgin/West Side Set Gillnet
Year Numberb % Numberb % Numberb % Numberb % Total 1985 2,032,957 50.1 1,561,200 38.4 285,081 7.0 181,191 4.5 4,060,429 1986 2,837,857 59.2 1,658,161 34.6 153,714 3.2 141,830 3.0 4,791,562 1987 5,638,916 59.6 3,454,470 36.5 208,036 2.2 164,572 1.7 9,465,994 1988 4,139,358 60.5 2,428,385 35.5 146,377 2.1 129,713 1.9 6,843,833 1989 4,543,492 90.7 186,831 3.7 280,801 5.6 5,011,124 1990 2,305,331 64.0 1,117,581 31.0 84,949 2.4 96,398 2.7 3,604,259 1991 1,118,115 51.3 844,156 38.8 99,859 4.6 116,201 5.3 2,178,331 1992 6,069,495 66.6 2,838,076 31.2 131,304 1.4 69,478 0.8 9,108,353 1993 2,558,732 53.8 1,941,783 40.8 108,181 2.3 146,633 3.1 4,755,329 1994 1,901,452 53.3 1,458,162 40.9 85,830 2.4 120,142 3.4 3,565,586 1995 1,773,873 60.1 961,216 32.6 107,640 3.6 109,098 3.7 2,951,827 1996 2,205,067 56.7 1,483,008 38.1 96,719 2.5 104,128 2.7 3,888,922 1997 2,197,736 52.6 1,832,824 43.9 48,723 1.2 97,455 2.3 4,176,738 1998 599,202 49.1 512,225 42.0 47,165 3.9 60,650 5.0 1,219,242 1999 1,413,995 52.8 1,092,946 40.8 114,454 4.3 59,115 2.2 2,680,510 2000 656,427 49.6 529,747 40.1 92,477 7.0 43,831 3.3 1,322,482 2001 846,257 46.3 870,019 47.6 59,709 3.3 50,848 2.8 1,826,833 2002 1,367,251 49.3 1,303,158 47.0 69,609 2.5 33,100 1.2 2,773,118 2003 1,593,638 45.8 1,746,841 50.3 87,193 2.5 48,487 1.4 3,476,159 2004 2,528,910 51.3 2,235,810 45.4 134,356 2.7 27,144 0.6 4,926,220 2005 2,520,300 48.1 2,533,841 48.4 157,612 3.0 26,553 0.5 5,238,306
1966-04 Avg a 1,617,448 56 1,008,223 34 101,389 5 100,223 5 2,827,283 1995-04 Avg 1,518,236 51 1,256,779 43 85,805 3 63,386 3 2,924,205 a 1989 not used in average as the drift fleet did not fish due to the Exxon Valdez oil spill; this had an effect on all other fisheries. b Harvest data prior to 2005 reflect minor adjustments to historical catch database.

116
Appendix A3.–Upper Cook Inlet commercial coho salmon harvest by gear type and area, 1966-2005.
Central District Central District Set Gillnet Northern District
Drift Gillnet East Side Kalgin/West Side Set Gillnet
Year Numberb % Numberb % Numberb % Numberb % Total
1966 80,901 27.9 68,877 23.8 59,509 20.5 80,550 27.8 289,837
1967 53,071 29.9 40,738 22.9 40,066 22.5 43,854 24.7 177,729
1968 167,383 35.8 80,828 17.3 63,301 13.5 156,648 33.5 468,160
1969 33,053 32.8 18,988 18.9 28,231 28.0 20,412 20.3 100,684
1970 110,070 40.0 30,114 10.9 52,299 19.0 82,722 30.1 275,205
1971 35,491 35.4 16,589 16.5 26,188 26.1 22,094 22.0 100,362
1972 21,577 26.7 24,673 30.5 15,300 18.9 19,346 23.9 80,896
1973 31,784 30.4 23,901 22.9 24,784 23.7 23,951 22.9 104,420
1974 75,640 37.8 36,837 18.4 40,610 20.3 47,038 23.5 200,125
1975 88,579 39.0 46,209 20.3 59,537 26.2 33,051 14.5 227,376
1976 80,712 38.7 47,873 22.9 42,243 20.2 37,835 18.1 208,663
1977 110,184 57.2 23,693 12.3 38,093 19.8 20,623 10.7 192,593
1978 76,259 34.8 34,134 15.6 61,711 28.2 47,089 21.5 219,193
1979 114,496 43.2 29,284 11.0 68,306 25.8 53,078 20.0 265,164
1980 89,510 33.0 40,281 14.8 51,527 19.0 90,098 33.2 271,416
1981 226,366 46.7 36,024 7.4 88,390 18.2 133,625 27.6 484,405
1982 416,274 52.5 108,393 13.7 182,205 23.0 85,352 10.8 792,224
1983 326,965 63.3 37,694 7.3 97,796 18.9 53,867 10.4 516,322
1984 213,423 47.4 37,166 8.3 84,618 18.8 114,786 25.5 449,993 -continued-

117
Appendix A3.–Page 2 of 2.
Central District Central District Set Gillnet Northern District Drift Gillnet East Side Kalgin/West Side Set Gillnet
Year Numberb % Numberb % Numberb % Numberb % Total 1985 357,388 53.6 70,657 10.6 147,331 22.1 91,837 13.8 667,213 1986 506,818 66.9 76,461 10.1 85,932 11.4 88,108 11.6 757,319 1987 202,506 44.8 74,923 16.6 74,930 16.6 97,062 21.9 449,421 1988 278,828 49.6 54,975 9.9 77,403 13.8 149,742 26.7 560,948 1989 743 0.2 82,333 24.1 81,004 23.9 175,738 51.8 339,818 1990 247,357 49.3 40,351 8.0 73,429 14.6 140,506 28.0 501,643 1991 175,782 41.2 30,435 7.1 87,968 20.6 132,302 31.0 426,487 1992 267,300 57.0 57,078 12.2 53,419 11.4 91,133 19.4 468,930 1993 121,829 39.7 43,098 14.0 35,661 11.6 106,294 34.6 306,882 1994 310,114 52.7 68,449 11.9 61,166 10.5 144,064 24.8 583,793 1995 241,473 54.0 44,750 10.0 71,431 16.0 89,300 20.0 446,954 1996 171,434 53.3 40,724 12.6 31,405 9.8 78,105 24.3 321,668 1997 78,662 51.6 19,668 12.9 16,705 11.0 37,369 24.5 152,404 1998 83,338 51.9 18,677 11.6 24,286 15.1 34,359 21.4 160,660 1999 64,814 51.5 11,923 9.3 17,725 14.1 31,446 25.1 125,908 2000 131,478 55.5 11,078 4.7 22,840 9.6 71,475 30.2 236,871 2001 39,418 34.8 4,246 3.7 23,719 20.9 45,928 40.5 113,311 2002 125,831 51.1 35,153 14.3 35,005 14.2 50,292 20.4 246,281 2003 52,432 51.5 10,171 10.0 15,138 14.9 24,015 23.6 101,756 2004 199,585 64.2 30,154 9.7 36,498 11.7 44,819 14.4 311,056 2005 144,753 64.4 19,543 8.7 29,502 13.1 30,859 13.7 224,657
1966-04 Avg a 158,109 45 40,139 14 55,703 18 71,426 23 325,376 1995-04 Avg 136,234 52 26,818 10 32,356 13 59,197 24 254,606
a 1989 not used in average as the drift fleet did not fish due to the Exxon Valdez oil spill; this had an effect on all other fisheries. b Harvest data prior to 2005 reflect minor adjustments to historical catch database.

118
Appendix A4.–Upper Cook Inlet commercial pink salmon harvest by gear type and area, 1966-2005.
Central District Central District Set Gillnet Northern District
Drift Gillnet East Side Kalgin/West Side Set Gillnet
Year Numberb % Numberb % Numberb % Numberb % Total
1966 593,654 29.6 969,624 48.3 70,507 3.5 371,960 18.5 2,005,745 1967 7,475 23.2 13,038 40.5 3,256 10.1 8,460 26.2 32,229 1968 880,512 38.7 785,887 34.5 75,755 3.3 534,839 23.5 2,276,993 1969 8,233 25.3 10,968 33.7 5,711 17.6 7,587 23.3 32,499 1970 334,737 41.1 281,067 34.5 24,763 3.0 174,193 21.4 814,760 1971 6,433 18.1 18,097 50.8 2,637 7.4 8,423 23.7 35,590 1972 115,117 18.3 403,706 64.2 18,913 3.0 90,830 14.5 628,566 1973 91,901 28.2 80,596 24.7 16,437 5.0 137,250 42.1 326,184 1974 140,432 29.0 291,408 60.2 9,014 1.9 42,876 8.9 483,730 1975 113,868 33.9 112,423 33.4 19,086 5.7 90,953 27.0 336,330 1976 599,594 47.7 479,024 38.1 30,030 2.4 148,080 11.8 1,256,728 1977 286,308 51.7 125,817 22.7 25,212 4.6 116,518 21.0 553,855 1978 934,442 55.3 372,601 22.1 54,785 3.2 326,614 19.3 1,688,442 1979 19,554 26.8 19,983 27.4 7,061 9.7 26,382 36.1 72,980 1980 964,526 54.0 299,444 16.8 47,963 2.7 474,488 26.6 1,786,421 1981 53,888 42.4 15,654 12.3 4,276 3.4 53,325 41.9 127,143 1982 270,380 34.2 432,715 54.7 14,242 1.8 73,307 9.3 790,644 1983 26,629 37.9 18,309 26.0 3,785 5.4 21,604 30.7 70,327 1984 273,565 44.3 220,895 35.8 16,708 2.7 106,284 17.2 617,452
-continued-

119
Appendix A4.–Page 2 of 2.
Central District Central District Set Gillnet Northern District Drift Gillnet East Side Kalgin/West Side Set Gillnet
Year Numberb % Numberb % Numberb % Numberb % Total
1985 34,228 39.0 17,715 20.2 5,653 6.4 30,232 34.4 87,828 1986 615,522 47.3 530,955 40.8 15,460 1.2 139,002 10.7 1,300,939 1987 38,714 35.4 47,235 43.2 5,229 4.8 18,203 16.6 109,381 1988 227,885 48.4 176,043 37.4 12,938 2.7 54,210 11.5 471,076 1989 1 0.0 37,982 56.3 5,580 8.3 23,878 35.4 67,441 1990 323,759 53.7 225,429 37.4 10,302 1.7 43,944 7.3 603,434 1991 5,791 39.5 2,670 18.2 1,049 7.2 5,153 35.1 14,663 1992 423,738 60.9 244,068 35.1 4,250 0.6 23,805 3.4 695,861 1993 46,463 46.0 41,690 41.3 2,313 2.3 10,468 10.4 100,934 1994 256,248 49.0 234,827 44.9 3,178 0.6 29,181 5.6 523,434 1995 64,632 48.4 53,420 40.0 3,810 2.9 11,713 8.8 133,575 1996 122,728 50.5 95,717 39.4 3,792 1.6 20,674 8.5 242,911 1997 29,917 42.2 32,046 45.2 4,701 6.6 4,269 6.0 70,933 1998 200,382 36.3 332,092 60.2 7,231 1.3 11,555 2.1 551,260 1999 3,552 22.0 9,355 57.8 2,674 16.5 593 3.7 16,174 2000 90,508 61.8 23,746 16.2 11,983 8.2 20,245 13.8 146,482 2001 31,218 43.0 32,998 45.5 3,988 5.5 4,355 6.0 72,559 2002 224,229 50.2 214,771 48.1 1,736 0.4 6,224 1.4 446,960 2003 30,369 62.3 16,474 33.8 375 0.8 1,564 3.2 48,782 2004 235,524 65.8 107,838 30.1 12,560 3.5 2,017 0.6 357,939 2005 31,230 64.3 13,619 28.0 2,747 5.7 1,003 2.1 48,599
1966-05 Avg a 229,649 42 194,483 37 14,825 5 85,563 17 524,520 1995-04 Avg 103,306 48 91,846 42 5,285 5 8,321 5 208,758
a 1989 not used in average as the drift fleet did not fish due to the Exxon Valdez oil spill; this had an effect on all other fisheries. b Harvest data prior to 2005 reflect minor adjustments to historical catch database.

120
Appendix A5.–Upper Cook Inlet commercial pink salmon harvest by gear type and area, 1966-2005.
Central District Central District Set Gillnet Northern District
Drift Gillnet East Side Kalgin/West Side Set Gillnet
Year Numberb % Numberb % Numberb % Numberb % Total
1966 424,972 79.8 7,461 1.4 64,725 12.1 35,598 6.7 532,756 1967 233,041 78.5 399 0.1 25,013 8.4 38,384 12.9 296,837 1968 1,002,900 90.5 1,563 0.1 44,986 4.1 58,454 5.3 1,107,903 1969 238,497 89.1 399 0.1 16,954 6.3 11,836 4.4 267,686 1970 678,448 90.4 1,228 0.2 48,591 6.5 22,507 3.0 750,774 1971 274,567 84.8 128 0.0 32,647 10.1 16,603 5.1 323,945 1972 564,726 90.2 1,727 0.3 40,179 6.4 19,782 3.2 626,414 1973 605,738 90.7 1,965 0.3 29,019 4.3 30,851 4.6 667,573 1974 344,496 86.8 506 0.1 15,346 3.9 36,492 9.2 396,840 1975 886,474 93.2 980 0.1 33,347 3.5 30,787 3.2 951,588 1976 405,769 86.5 1,484 0.3 47,882 10.2 14,045 3.0 469,180 1977 1,153,454 93.5 1,413 0.1 54,708 4.4 23,861 1.9 1,233,436 1978 489,119 85.5 4,563 0.8 40,946 7.2 37,151 6.5 571,779 1979 609,239 93.8 867 0.1 30,342 4.7 9,310 1.4 649,758 1980 339,970 87.7 2,147 0.6 28,970 7.5 16,728 4.3 387,815 1981 756,922 91.0 2,386 0.3 26,461 3.2 46,208 5.6 831,977 1982 1,348,510 94.1 4,777 0.3 36,647 2.6 43,006 3.0 1,432,940 1983 1,044,636 93.7 2,822 0.3 38,079 3.4 29,321 2.6 1,114,858 1984 568,097 83.5 3,695 0.5 34,207 5.0 74,727 11.0 680,726
-continued-

121
Appendix A5.–Page 2 of 2.
Central District Central District Set Gillnet Northern District Drift Gillnet East Side Kalgin/West Side Set Gillnet
Year Numberb % Numberb % Numberb % Numberb % Total
1985 700,848 90.7 4,133 0.5 31,746 4.1 36,122 4.7 772,849 1986 1,012,669 89.2 7,030 0.6 39,078 3.4 76,040 6.7 1,134,817 1987 211,745 60.7 16,605 4.8 53,558 15.4 66,901 19.2 348,809 1988 582,699 82.0 11,763 1.7 40,425 5.7 75,728 10.7 710,615 1989 72 0.1 12,326 10.1 27,705 22.7 81,948 67.1 122,051 1990 289,447 82.4 4,611 1.3 21,355 6.1 35,710 10.2 351,123 1991 215,469 76.9 2,387 0.9 22,974 8.2 39,393 14.1 280,223 1992 232,955 84.9 2,867 1.0 13,180 4.8 25,301 9.2 274,303 1993 88,826 72.4 2,977 2.4 5,566 4.5 25,401 20.7 122,770 1994 249,748 82.4 2,927 1.0 10,443 3.4 40,059 13.2 303,177 1995 468,224 88.4 3,711 0.7 13,820 2.6 43,667 8.2 529,422 1996 140,968 90.1 1,448 0.9 2,314 1.5 11,771 7.5 156,501 1997 92,163 89.4 1,222 1.2 1,770 1.7 7,881 7.6 103,036 1998 88,036 92.0 688 0.7 2,953 3.1 3,977 4.2 95,654 1999 166,612 95.5 373 0.2 3,567 2.0 3,989 2.3 174,541 2000 118,074 92.9 325 0.3 4,386 3.5 4,284 3.4 127,069 2001 75,599 89.5 248 0.3 6,445 7.6 2,202 2.6 84,494 2002 224,587 94.4 1,790 0.8 6,671 2.8 4,901 2.1 237,949 2003 106,467 88.2 1,933 1.6 7,861 6.5 4,483 3.7 120,744 2004 137,040 93.8 2,019 1.4 4,957 3.4 2,148 1.5 146,164 2005 65,671 94.2 710 1.0 2,632 3.8 727 1.0 69,740
1966-04 Avg a 441,985 87 2,883 1 25,845 5 29,095 7 509,712 1995-04 Avg 161,777 91 1,376 1 5,474 3 8,930 4 177,557
a 1989 not used in average as the drift fleet did not fish due to the Exxon Valdez oil spill; this had an effect on all other fisheries. b Harvest data prior to 2005 reflect minor adjustments to historical catch database.

122
Appendix A6.–Upper Cook Inlet commercial salmon harvest by species, 1956-2005.
Year Chinook Sockeye Coho Pink Chum Total 1966 8,544 1,852,114 289,837 2,005,745 532,756 4,688,996 1967 7,859 1,380,062 177,729 32,229 296,837 1,894,716 1968 4,536 1,104,896 468,160 2,276,993 1,107,903 4,962,488 1969 12,386 691,815 100,684 32,499 267,686 1,105,070 1970 8,336 732,572 275,205 814,760 750,774 2,581,647 1971 19,765 636,289 100,362 35,590 323,945 1,115,951 1972 16,086 879,811 80,896 628,566 626,414 2,231,773 1973 5,194 670,098 104,420 326,184 667,573 1,773,469 1974 6,596 497,185 200,125 483,730 396,840 1,584,476 1975 4,787 684,751 227,376 336,330 951,588 2,204,832 1976 10,865 1,664,149 208,663 1,256,728 469,180 3,609,585 1977 14,790 2,052,291 192,593 553,855 1,233,436 4,046,965 1978 17,299 2,621,421 219,193 1,688,442 571,779 5,118,134 1979 13,738 924,406 265,164 72,980 649,758 1,926,046 1980 13,798 1,573,588 271,416 1,786,421 387,815 4,033,038 1981 12,240 1,439,262 484,405 127,143 831,977 2,895,027 1982 20,870 3,259,864 792,224 790,644 1,432,940 6,296,542 1983 20,634 5,049,733 516,322 70,327 1,114,858 6,771,874 1984 10,062 2,106,714 449,993 617,452 680,726 3,864,947 1985 24,088 4,060,429 667,213 87,828 772,849 5,612,407 1986 39,254 4,791,562 757,319 1,300,939 1,134,817 8,023,891 1987 39,431 9,465,994 449,421 109,381 348,809 10,413,036 1988 29,080 6,843,833 560,948 471,076 710,615 8,615,552 1989 26,737 5,011,124 339,818 67,441 122,051 5,567,171 1990 16,105 3,604,259 501,643 603,434 351,123 5,076,564 1991 13,542 2,178,331 426,487 14,663 280,223 2,913,246 1992 17,171 9,108,353 468,930 695,861 274,303 10,564,618 1993 18,871 4,755,329 306,882 100,934 122,770 5,304,786 1994 19,962 3,565,586 583,793 523,434 303,177 4,995,952 1995 17,893 2,951,827 446,954 133,575 529,422 4,079,671 1996 14,306 3,888,922 321,668 242,911 156,501 4,624,308 1997 13,292 4,176,738 152,404 70,933 103,036 4,516,403 1998 8,124 1,219,242 160,660 551,260 95,654 2,034,940 1999 14,383 2,680,510 125,908 16,174 174,541 3,011,516 2000 7,350 1,322,482 236,871 146,482 127,069 1,840,254 2001 9,295 1,826,833 113,311 72,559 84,494 2,106,492 2002 12,714 2,773,118 246,281 446,960 237,949 3,717,022 2003 18,490 3,476,159 101,756 48,782 120,767 3,765,931 2004 27,475 4,926,220 311,056 357,939 146,164 5,768,854 2005 28,171 5,238,306 224,657 48,599 69,740 5,609,473
Averages 1966-2004 Avg 15,794 2,883,279 325,746 512,800 499,772 4,237,389 1995-2004 Avg 14,332 2,924,205 221,687 208,758 177,560 3,546,539
Note: Catch statistics prior to 2005 reflect minor adjustments to harvest database.
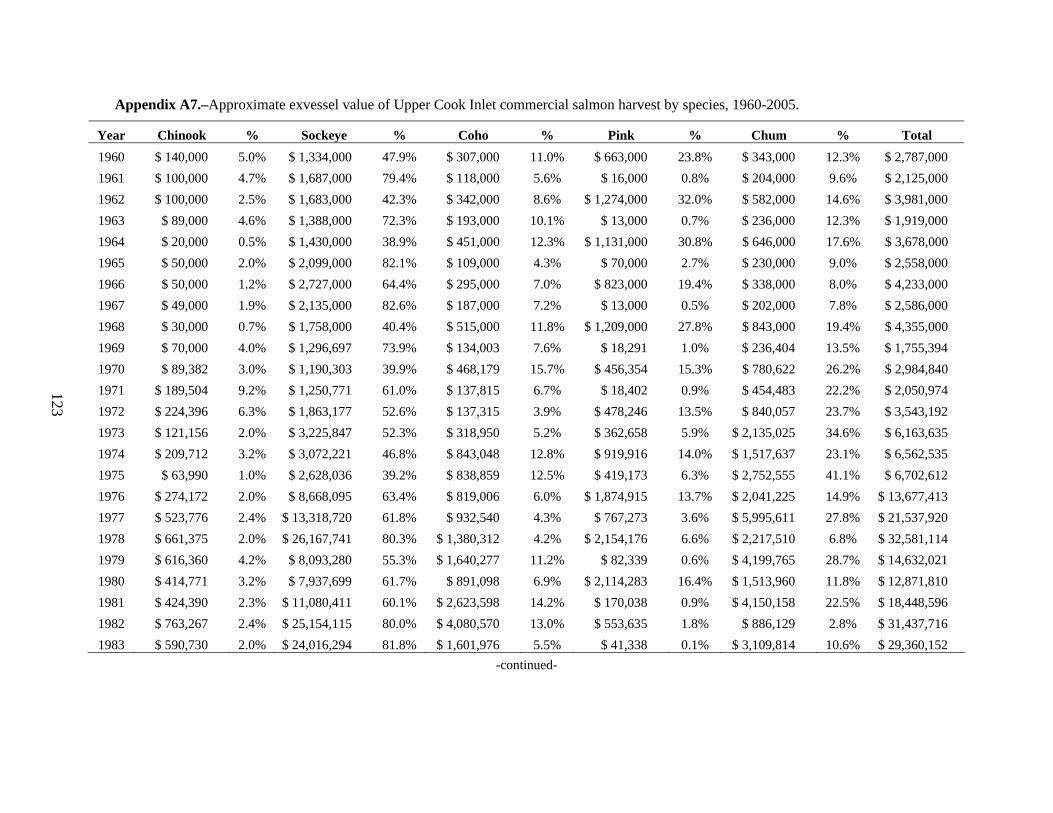
123
Appendix A7.–Approximate exvessel value of Upper Cook Inlet commercial salmon harvest by species, 1960-2005.
Year Chinook % Sockeye % Coho % Pink % Chum % Total 1960 $ 140,000 5.0% $ 1,334,000 47.9% $ 307,000 11.0% $ 663,000 23.8% $ 343,000 12.3% $ 2,787,000 1961 $ 100,000 4.7% $ 1,687,000 79.4% $ 118,000 5.6% $ 16,000 0.8% $ 204,000 9.6% $ 2,125,000 1962 $ 100,000 2.5% $ 1,683,000 42.3% $ 342,000 8.6% $ 1,274,000 32.0% $ 582,000 14.6% $ 3,981,000 1963 $ 89,000 4.6% $ 1,388,000 72.3% $ 193,000 10.1% $ 13,000 0.7% $ 236,000 12.3% $ 1,919,000 1964 $ 20,000 0.5% $ 1,430,000 38.9% $ 451,000 12.3% $ 1,131,000 30.8% $ 646,000 17.6% $ 3,678,000 1965 $ 50,000 2.0% $ 2,099,000 82.1% $ 109,000 4.3% $ 70,000 2.7% $ 230,000 9.0% $ 2,558,000 1966 $ 50,000 1.2% $ 2,727,000 64.4% $ 295,000 7.0% $ 823,000 19.4% $ 338,000 8.0% $ 4,233,000 1967 $ 49,000 1.9% $ 2,135,000 82.6% $ 187,000 7.2% $ 13,000 0.5% $ 202,000 7.8% $ 2,586,000 1968 $ 30,000 0.7% $ 1,758,000 40.4% $ 515,000 11.8% $ 1,209,000 27.8% $ 843,000 19.4% $ 4,355,000 1969 $ 70,000 4.0% $ 1,296,697 73.9% $ 134,003 7.6% $ 18,291 1.0% $ 236,404 13.5% $ 1,755,394 1970 $ 89,382 3.0% $ 1,190,303 39.9% $ 468,179 15.7% $ 456,354 15.3% $ 780,622 26.2% $ 2,984,840 1971 $ 189,504 9.2% $ 1,250,771 61.0% $ 137,815 6.7% $ 18,402 0.9% $ 454,483 22.2% $ 2,050,974 1972 $ 224,396 6.3% $ 1,863,177 52.6% $ 137,315 3.9% $ 478,246 13.5% $ 840,057 23.7% $ 3,543,192 1973 $ 121,156 2.0% $ 3,225,847 52.3% $ 318,950 5.2% $ 362,658 5.9% $ 2,135,025 34.6% $ 6,163,635 1974 $ 209,712 3.2% $ 3,072,221 46.8% $ 843,048 12.8% $ 919,916 14.0% $ 1,517,637 23.1% $ 6,562,535 1975 $ 63,990 1.0% $ 2,628,036 39.2% $ 838,859 12.5% $ 419,173 6.3% $ 2,752,555 41.1% $ 6,702,612 1976 $ 274,172 2.0% $ 8,668,095 63.4% $ 819,006 6.0% $ 1,874,915 13.7% $ 2,041,225 14.9% $ 13,677,413 1977 $ 523,776 2.4% $ 13,318,720 61.8% $ 932,540 4.3% $ 767,273 3.6% $ 5,995,611 27.8% $ 21,537,920 1978 $ 661,375 2.0% $ 26,167,741 80.3% $ 1,380,312 4.2% $ 2,154,176 6.6% $ 2,217,510 6.8% $ 32,581,114 1979 $ 616,360 4.2% $ 8,093,280 55.3% $ 1,640,277 11.2% $ 82,339 0.6% $ 4,199,765 28.7% $ 14,632,021 1980 $ 414,771 3.2% $ 7,937,699 61.7% $ 891,098 6.9% $ 2,114,283 16.4% $ 1,513,960 11.8% $ 12,871,810 1981 $ 424,390 2.3% $ 11,080,411 60.1% $ 2,623,598 14.2% $ 170,038 0.9% $ 4,150,158 22.5% $ 18,448,596 1982 $ 763,267 2.4% $ 25,154,115 80.0% $ 4,080,570 13.0% $ 553,635 1.8% $ 886,129 2.8% $ 31,437,716 1983 $ 590,730 2.0% $ 24,016,294 81.8% $ 1,601,976 5.5% $ 41,338 0.1% $ 3,109,814 10.6% $ 29,360,152
-continued-

124
Appendix A7.–Page 2 of 2.
Year Chinook % Sockeye % Coho % Pink % Chum % Total 1984 $ 310,899 1.8% $ 12,450,532 71.8% $ 2,039,681 11.8% $ 522,795 3.0% $ 2,011,253 11.6% $ 17,335,160 1985 $ 799,318 2.3% $ 27,497,929 80.0% $ 3,359,824 9.8% $ 57,412 0.2% $ 2,644,995 7.7% $ 34,359,478 1986 $ 915,189 2.0% $ 38,683,950 83.3% $ 2,909,043 6.3% $ 724,367 1.6% $ 3,197,973 6.9% $ 46,430,522 1987 $ 1,609,777 1.6% $ 95,915,522 94.9% $ 2,373,254 2.3% $ 84,439 0.1% $ 1,116,165 1.1% $ 101,099,156 1988 $ 1,120,885 0.9% $111,537,736 91.3% $ 4,738,463 3.9% $ 650,931 0.5% $ 4,129,002 3.4% $ 122,177,017 1989 $ 803,494 1.4% $ 56,194,753 95.0% $ 1,674,393 2.8% $ 86,012 0.1% $ 415,535 0.7% $ 59,174,188 1990 $ 436,822 1.1% $ 35,804,485 88.0% $ 2,422,214 6.0% $ 512,591 1.3% $ 1,495,827 3.7% $ 40,671,938 1991 $ 348,522 2.3% $ 12,249,200 80.4% $ 1,996,049 13.1% $ 5,478 0.0% $ 643,400 4.2% $ 15,242,649 1992 $ 634,466 0.6% $ 96,026,864 96.0% $ 2,261,862 2.3% $ 404,772 0.4% $ 740,294 0.7% $ 100,068,258 1993 $ 617,092 2.1% $ 27,969,409 93.1% $ 1,081,175 3.6% $ 36,935 0.1% $ 322,205 1.1% $ 30,026,815 1994 $ 642,291 1.9% $ 29,441,442 85.5% $ 3,297,865 9.6% $ 240,545 0.7% $ 831,121 2.4% $ 34,453,264 1995 $ 474,475 2.2% $ 19,168,077 87.1% $ 1,295,353 5.9% $ 53,114 0.2% $ 1,023,926 4.7% $ 22,014,944 1996 $ 402,980 1.4% $ 28,238,578 95.0% $ 800,423 2.7% $ 44,386 0.1% $ 225,751 0.8% $ 29,712,117 1997 $ 365,316 1.1% $ 31,439,536 97.1% $ 434,327 1.3% $ 12,004 0.0% $ 143,244 0.4% $ 32,394,427 1998 $ 181,318 2.1% $ 7,686,993 88.5% $ 497,050 5.7% $ 187,759 2.2% $ 132,025 1.5% $ 8,685,145 1999 $ 337,482 1.6% $ 20,095,838 95.5% $ 329,164 1.6% $ 5,995 0.0% $ 265,026 1.3% $ 21,033,505 2000 $ 183,044 2.2% $ 7,115,614 87.2% $ 626,287 7.7% $ 47,065 0.6% $ 186,385 2.3% $ 8,158,395 2001 $ 169,593 2.2% $ 7,135,690 92.3% $ 297,387 3.8% $ 20,312 0.3% $ 111,028 1.4% $ 7,734,010 2002 $ 326,051 2.8% $ 10,682,051 91.7% $ 329,031 2.8% $ 84,922 0.7% $ 224,148 1.9% $ 11,646,203 2003 $ 358,688 2.9% $ 11,659,037 95.1% $ 132,079 1.1% $ 8,659 0.1% $ 99,850 0.8% $ 12,258,313 2004 $ 675,885 3.3% $ 19,404,381 93.8% $ 416,193 2.0% $ 65,861 0.3% $ 129,794 0.6% $ 20,692,113 2005 $ 692,161 2.2% $ 30,156,928 95.2% $ 708,793 2.2% $ 12,830 0.0% $ 101,123 0.3% $ 31,671,835

125
Appendix A8.–Commercial herring harvest by fishery, Upper Cook Inlet, 1973–2005.
Harvest (Tons)
Upper Year Subdistrict Chinitna Bay Tuxedni Bay Kalgin Island Total 1973 13.8 - - not open 13.8 1974 36.7 - - not open 36.7 1975 6.2 - - not open 6.2 1976 5.8 - - not open 5.8 1977 17.3 - - not open 17.3 1978 8.3 55.3 - not open 63.6 1979 67.3 96.2 24.8 not open 188.3 1980 37.4 20 86.5 not open 143.9 1981 86.2 50.5 84.9 not open 221.6 1982 60.2 91.8 50.2 not open 202.2 1983 165.3 49.2 238.2 not open 452.7 1984 117.5 90.6 159 not open 367.1 1985 121.7 47.4 220.5 not open 389.6 1986 178.9 111.1 191.9 not open 481.9 1987 130.5 65.1 152.5 not open 348.1 1988 50.7 23.4 14.1 not open 88.2 1989 55.2 122.3 34.3 not open 211.8 1990 55.4 55.9 16.1 not open 127.4 1991 13.4 15.7 1.6 not open 30.7 1992 24.7 10.4 - not open 35.1 1993 - - - not open - 1994 - - - not open - 1995 - - - not open - 1996 - - - not open - 1997 - - - not open - 1998 19.5 - - not open 19.5 1999 10.4 - - not open 10.4 2000 14.7 - - not open 14.7 2001 9.9 - - not open 9.9 2002 16.2 1.9 0 not open 18.1 2003 3.7 0 0 not open 3.7 2004 6.7 0.1 0 not open 6.8 2005 17.1 0.2 0 0 17.3

126
Appendix A9.–Commercial harvest of razor clams in Cook Inlet, 1919–2005.
Year Pounds Year Pounds 1919 76,963 1963 0 1920 11,952 1964 0 1921 72,000 1965 0 1922 510,432 1966 0 1923 470,280 1967 0 1924 156,768 1968 0 1925 0 1969 0 1926 0 1970 0 1927 25,248 1971 14,755 1928 0 1972 31,360 1929 0 1973 34,415 1930 0 1974 0 1931 No Record 1975 10,020 1932 93,840 1976 0 1933 No Record 1977 1,762 1934 No Record 1978 45,931 1935 No Record 1979 144,358 1936 No Record 1980 140,420 1937 8,328 1981 441,949 1938 No Record 1982 460,639 1939 No Record 1983 269,618 1940 No Record 1984 261,742 1941 0 1985 319,034 1942 0 1986 258,632 1943 0 1987 312,349 1944 0 1988 399,376 1945 15,000 1989 222,747 1946 11,424 1990 323,602 1947 11,976 1991 201,320 1948 2,160 1992 296,727 1949 9,672 1993 310,481 1950 304,073 1994 355,165 1951 112,320 1995 248,358 1952 0 1996 355,448 1953 0 1997 366,532 1954 0 1998 371,877 1955 0 1999 352,910 1956 0 2000 369,397 1957 0 2001 348,917 1958 0 2002 338,938 1959 0 2003 411,403 1960 372,872 2004 419,697 1961 277,830 2005 371,395 1962 195,650

127
Appendix A10.–Enumeration goals and counts of sockeye salmon in selected Streams of Upper Cook Inlet, 1978-2005.
Kenai River Kasilof River Fish Creek
Enumeration Enumeration Enumeration Enumeration Enumeration Enumeration
Year Goal Estimate a,f Goal Estimate a,f Goal Estimateb
1978 350,000-500,000 398,900 75,000-150,000 116,600 0 3,555
1979 350,000-500,000 285,020 75,000-150,000 152,179 0 68,739
1980 350,000-500,000 464,038 75,000-150,000 184,260 0 62,828
1981 350,000-500,000 407,639 75,000-150,000 256,625 0 50,479
1982 350,000-500,000 619,831 75,000-150,000 180,239 50,000 28,164
1983 350,000-500,000 630,340 75,000-150,000 210,271 50,000 118,797
1984 350,000-500,000 344,571 75,000-150,000 231,685 50,000 192,352
1985 350,000-500,000 502,820 75,000-150,000 505,049g 50,000 68,577
1986 350,000-500,000 501,157 75,000-150,000 275,963 50,000 29,800
1987 400,000-700,000 1,596,871 150,000-250,000 249,250 50,000 91,215
1988 400,000-700,000 1,021,469 150,000-250,000 204,000d 50,000 71,603
1989 400,000-700,000 1,599,959 150,000-250,000 158,206 50,000 67,224
1990 400,000-700,000 659,520 150,000-250,000 144,289 50,000 50,000
1991 400,000-700,000 647,597 150,000-250,000 238,269 50,000 50,500
1992 400,000-700,000 994,798 150,000-250,000 184,178 50,000 71,385
1993 400,000-700,000 813,617 150,000-250,000 149,939 50,000 117,619
1994 400,000-700,000 1,003,446 150,000-250,000 205,117 50,000 95,107
1995 450,000-700,000 630,447 150,000-250,000 204,935 50,000 115,000
1996 550,000-800,000 797,847 150,000-250,000 249,944 50,000 63,160
1997 550,000-825,000 1,064,818 150,000-250,000 266,025 50,000 54,656
1998 550,000-850,000 767,558 150,000-250,000 273,213 50,000 22,853
1999 750,000-950,000 803,379 150,000-250,000 312,587 50,000 26,667
2000 600,000-850,000 624,578 150,000-250,000 256,053 50,000 19,533
2001 600,000-850,000 650,036 150,000-250,000 307,570 50,000 43,469
2002 750,000-950,000 957,924 150,000-250,000 226,682 20,000-70,000 90,483
2003 750,000-950,000 1,181,309 150,000-250,000 359,633 20,000-70,000 92,298
2004 850,000-1,100,000 1,385,981 150,000-250,000 577,581 20,000-70,000 22,157
2005 850,000-1,100,000 1,376,452 150,000-250,000 348,012 20,000-70,000 14,215
-continued-

128
Appendix A10.–Page 2 of 2.
Yentna River Crescent River Packers Creek
Enumeration Enumeration Enumeration Enumeration Enumeration Enumeration
Year Goal Estimate a,f Goal Estimate a,f Goal Estimate b,g
1978 100,000 0 N/C 0 N/C
1979 100,000 50,000 86,654 0 N/C
1980 100,000 50,000 90,863 0 16,477
1981 100,000 139,401 50,000 41,213 0 13,024
1982 100,000 113,847 50,000 58,957 0 15,687
1983 100,000 104,414 50,000 92,122 0 18,403
1984 100,000 149,375 50,000 118,345 0 30,684
1985 100,000 107,124 50,000 128,628 0 36,850
1986 100,000-150,000 92,076 50,000 20,385 e 0 29,604
1987 100,000-150,000 66,054 50,000-100,000 120,219 0 35,401
1988 100,000-150,000 52,330 50,000-100,000 57,716 15,000-25,000 18,607
1989 100,000-150,000 96,269 50,000-100,000 71,064 15,000-25,000 22,304
1990 100,000-150,000 140,290 50,000-100,000 52,238 15,000-25,000 31,868
1991 100,000-150,000 109,632 50,000-100,000 44,578 15,000-25,000 41,275
1992 100,000-150,000 66,054 50,000-100,000 58,229 15,000-25,000 28,361
1993 100,000-150,000 141,694 50,000-100,000 37,556 15,000-25,000 40,869
1994 100,000-150,000 128,032 50,000-100,000 30,355 15,000-25,000 30,788
1995 100,000-150,000 121,479 50,000-100,000 52,311 15,000-25,000 29,473
1996 100,000-150,000 90,781 50,000-100,000 28,729 15,000-25,000 19,095
1997 100,000-150,000 157,822 50,000-100,000 70,768 15,000-25,000 33,846
1998 100,000-150,000 119,623 50,000-100,000 62,257 15,000-25,000 17,732
1999 100,000-150,000 99,029 25,000-50,000 66,519 15,000-25,000 25,648
2000 100,000-150,000 133,094 25,000-50,000 56,599 15,000-25,000 20,151
2001 100,000-150,000 83,532 25,000-50,000 78,081 15,000-25,000 no count
2002 90,000-160,000 78,591 25,000-50,000 62,833 15,000-25,000 no count
2003 90,000-160,000 180,813 25,000-50,000 122,457 15,000-25,000 no count
2004 90,000-160,000 71,281 25,000-50,000 103,201 15,000-25,000 no count
2005 90,000-160,000 36,921 25,000-50,000 125,623 15,000-25,000 25,516 a Derived from sonar counters unless otherwise noted. b Weir counts. c Yentna River escapement goal only. d Combined counts from weirs on Bear and Glacier Flat Creeks and surveys of remaining spawning streams; sonar
count was 151,856. e Counts through 16-July only. f Enumeration estimates prior to 2004 reflect minor adjustments to the escapement database. g Escapement estimate of all salmon via remote camera; an unknown number of salmon escaped into the lake after
the camera was removed.

129
Appendix A11.–Average price paid for commercially harvested salmon, Upper Cook Inlet, 1969-2005.
Year Chinook Sockeye Coho Pink Chum 1969 0.38 0.28 0.19 0.14 0.12 1970 0.40 0.28 0.25 0.14 0.14 1971 0.37 0.30 0.21 0.15 0.15 1972 0.47 0.34 0.27 0.19 0.20 1973 0.62 0.65 0.50 0.30 0.42 1974 0.88 0.91 0.66 0.46 0.53 1975 0.54 0.63 0.54 0.35 0.41 1976 0.92 0.76 0.61 0.37 0.54 1977 1.26 0.86 0.72 0.38 0.61 1978 1.16 1.32 0.99 0.34 0.51 1979 1.63 1.41 0.98 0.34 0.88 1980 1.15 0.85 0.57 0.34 0.53 1981 1.46 1.20 0.83 0.38 0.65 1982 1.27 1.10 0.72 0.18 0.49 1983 0.97 0.74 0.45 0.18 0.36 1984 1.08 1.00 0.64 0.21 0.39 1985 1.20 1.20 0.70 0.20 0.45 1986 0.90 1.40 0.60 0.15 0.38 1987 1.40 1.50 0.80 0.22 0.45 1988 1.30 2.47 1.20 0.37 0.76 1989 1.25 1.70 0.75 0.40 0.47 1990 1.20 1.55 0.75 0.25 0.60 1991 1.20 1.00 0.77 0.12 0.35 1992 1.50 1.60 0.75 0.15 0.40 1993 1.20 1.00 0.60 0.12 0.45 1994 1.00 1.45 0.80 0.12 0.40 1995 1.00 1.15 0.45 0.12 0.27 1996 1.00 1.15 0.40 0.05 0.19 1997 1.00 1.15 0.45 0.05 0.19 1998 1.00 1.15 0.45 0.09 0.19 1999 1.00 1.30 0.45 0.12 0.19 2000 1.10 0.85 0.40 0.09 0.19 2001 1.00 0.65 0.40 0.08 0.19 2002 1.15 0.60 0.20 0.05 0.12 2003 0.95 0.60 0.20 0.05 0.12 2004 1.00 0.65 0.20 0.05 0.12 2005 1.00 0.95 0.50 0.08 0.20
Note: Price is expressed as dollars per pound. Data Source: 1969–1983, Commercial Fisheries Entry Commission; 1984-2005, random fish ticket averages, which do not include bonuses or postseason adjustments.

130
Appendix A12.–Average weight (in pounds) of commercially harvested salmon, Upper Cook Inlet, 1969-2005.
Year Chinook Sockeye Coho Pink Chum 1969 17.1 6.7 7.0 3.9 7.3 1970 26.8 5.8 6.8 4.0 7.2 1971 25.9 6.6 6.5 3.4 9.3 1972 29.7 6.2 6.3 4.0 6.7 1973 37.6 7.4 6.1 3.7 7.6 1974 36.1 6.8 6.4 4.1 7.2 1975 24.8 6.1 6.8 3.6 7.1 1976 27.4 6.9 6.4 4.0 8.1 1977 28.1 7.6 6.7 3.7 8.0 1978 33.0 7.6 6.4 3.8 7.6 1979 27.5 6.2 6.3 3.3 7.3 1980 26.1 5.9 5.8 3.5 7.3 1981 23.8 6.4 6.5 3.5 7.7 1982 28.8 7.0 7.1 3.9 8.2 1983 29.5 6.4 6.9 3.3 7.8 1984 28.6 5.9 7.1 4.0 7.6 1985 27.7 5.6 7.2 3.3 7.6 1986 25.9 5.8 6.4 3.7 7.4 1987 29.0 6.7 6.6 3.5 7.1 1988 29.7 6.6 7.1 3.7 7.7 1989 24.0 6.6 6.6 3.2 7.3 1990 22.6 6.4 6.5 3.4 7.1 1991 21.5 5.6 6.1 3.1 6.6 1992 24.6 6.6 6.4 3.9 6.8 1993 27.5 5.9 5.9 3.1 5.8 1994 31.7 5.7 7.1 3.9 6.9 1995 26.6 5.7 6.4 3.3 7.2 1996 28.3 6.3 6.2 3.7 7.6 1997 27.6 6.6 6.3 3.4 7.3 1998 22.7 5.5 6.9 3.8 7.3 1999 23.9 5.8 5.8 3.1 8.0 2000 22.6 6.3 6.6 3.6 7.7 2001 18.2 6.0 6.6 3.5 6.9 2002 22.3 6.4 6.7 3.8 7.9 2003 20.4 5.6 6.5 3.6 6.9 2004 24.6 6.1 6.7 3.7 7.4
1969–2004 Avg 26.4 6.3 6.5 3.6 7.4 2005 24.6 6.1 6.3 3.3 7.2
Note: Total poundage divided by numbers of fish from fish ticket totals.

131
Appendix A13.–Registered units of gillnet fishing effort by gear type in Cook Inlet, 1966-2005.
DRIFT GILLNET SET GILLNET Year Resident Non-Resident Subtotal Resident Non-Resident Subtotal Total 1966 328 176 504 580 48 628 1,132 1967 350 186 536 554 50 604 1,140 1968 407 204 611 638 43 681 1,292 1969 497 208 705 686 42 728 1,433 1970 537 220 757 707 65 772 1,529 1971 519 191 710 693 38 731 1,441 1972 419 152 571 672 35 707 1,278 1973 516 146 662 632 43 675 1,337 1974 436 149 585 698 54 752 1,337 1975 539 245 784 695 63 758 1,542 1976 410 186 596 675 44 719 1,315 1977 387 188 575 690 43 733 1,308 1978 401 190 591 701 46 747 1,338 1979 410 189 599 705 44 749 1,348 1980 407 190 597 699 48 747 1,344 1981 412 186 598 687 60 747 1,345 1982 413 178 591 695 53 748 1,339 1983 415 172 587 684 61 745 1,332 1984 423 165 588 670 74 744 1,332 1985 418 173 591 669 76 745 1,336 1986 412 176 588 665 78 743 1,331 1987 415 171 586 662 81 743 1,329 1988 421 164 585 660 83 743 1,328 1989 415 170 585 645 98 743 1,328 1990 412 173 585 644 99 743 1,328 1991 412 172 584 642 103 745 1,329 1992 404 179 583 636 109 745 1,328 1993 398 185 583 633 112 745 1,328 1994 395 187 582 628 117 745 1,327 1995 393 189 582 622 123 745 1,327 1996 392 190 582 621 124 745 1,327 1997 392 189 581 621 124 745 1,326 1998 394 185 579 621 124 745 1,324 1999 391 184 575 621 124 744 1,319 2000 395 181 576 621 124 742 1,318 2001 396 178 574 625 119 740 1,314 2002 397 175 572 620 123 738 1,310 2003 401 171 572 618 124 737 1,309 2004 403 168 571 617 122 737 1,308 2005 405 166 571 609 128 728 1,299
Source: 1966–1974 ADF&G unpublished reports, 1975–2005 Commercial Fisheries Entry Commission. http://www.cfec.state.ak.us/SPCS/MENUS.HTM

132
Appendix A14.–Forecast and projected commercial harvests of salmon by species, Upper Cook Inlet, 1984–2005.
Sockeye Coho Pink Chum Chinook
Year Forecasta Actualb,d Error Projected Actualc,d Error Projected Actualc,d Error Projected Actualc,d Error Projected Actualc,d Error
1984 2,200,000 2,216,553 1% 250,000 442,619 77% 1,700,000 622,510 -63% 350,000 684,124 95% 14,000 8,819 -37% 1985 3,700,000 4,248,506 15% 250,000 667,213 167% 112,500 87,828 -22% 700,000 772,829 10% 17,500 24,086 38% 1986 4,200,000 4,981,255 14% 450,000 756,830 68% 1,250,000 1,299,360 4% 900,000 1,134,173 26% 32,500 39,240 21% 1987 4,800,000 9,859,418 98% 500,000 449,421 -10% 150,000 348,809 -27% 1,000,000 348,809 -65% 30,000 39,431 32% 1988 5,300,000 7,087,976 29% 400,000 560,948 40% 400,000 710,615 17% 800,000 710,615 -11% 35,000 29,080 -17% 1989 2,500,000 5,443,946 100% 400,000 339,818 -15% 100,000 122,051 -33% 800,000 122,051 -85% 30,000 26,737 -11% 1990 4,300,000 3,822,864 -16% 250,000 501,643 101% 600,000 351,123 -41% 400,000 351,123 -12% 25,000 16,105 -36% 1991 3,200,000 2,549,310 -32% 400,000 426,487 7% 90,000 280,223 211% 500,000 280,223 -44% 20,000 13,542 -32% 1992 3,600,000 9,502,392 153% 400,000 468,930 17% 400,000 274,303 -31% 350,000 274,303 -22% 20,000 17,171 -14% 1993 2,500,000 5,042,799 90% 450,000 306,882 -32% 25,000 122,770 391% 350,000 122,770 -65% 15,000 18,871 26% 1994 2,000,000 3,826,508 78% 400,000 583,793 46% 600,000 303,177 -49% 250,000 303,177 21% 15,000 19,962 33% 1995 2,700,000 3,224,087 9% 400,000 446,954 12% 100,000 529,422 429% 250,000 529,422 112% 15,000 17,893 19% 1996 3,300,000 4,312,193 18% 400,000 321,668 -20% 600,000 156,501 -74% 350,000 156,501 -55% 15,000 14,306 -5% 1997 5,300,000 4,565,608 -21% 400,000 152,404 -62% 100,000 103,036 3% 250,000 103,036 -59% 15,000 13,292 -11% 1998 2,500,000 1,626,594 -51% 300,000 160,660 -46% 300,000 95,654 -68% 200,000 95,654 -52% 17,000 8,124 -52% 1999 2,000,000 3,179,342 59% 300,000 125,908 -58% 75,000 174,541 133% 200,000 174,541 -13% 16,000 14,383 -10% 2000 3,000,000 1,786,241 -40% 150,000 236,871 58% 500,000 127,069 -75% 200,000 127,069 -36% 15,000 7,350 -51% 2001 2,700,000 2,312,491 -14% 300,000 113,311 -62% 50,000 84,494 69% 250,000 84,494 -66% 13,000 9,295 -29% 2002 2,200,000 3,331,388 51% 160,000 246,281 54% 170,000 237,949 40% 120,000 237,949 98% 10,000 12,714 27% 2003 2,400,000 4,144,897 73% 170,000 101,756 -40% 80,000 120,767 51% 140,000 120,767 -14% 10,000 18,490 85% 2004 3,700,000 5,636,700 52% 160,000 308,449 93% 380,000 357,283 -6% 150,000 145,073 -3% 10,000 27,448 174% 2005 4,100,000 5,738,306 40% 200,000 224,657 12% 70,000 48,599 -31% 140,000 69,740 -50% 10,000 28,171 182%
Avg. 3,242,857 4,414,337 32% 328,095 367,564 19% 370,595 309,975 41% 405,238 327,557 -11% 18,571 18,873 7% a Harvest forecasts have typically been prepared using average return per spawner values, parent-year escapements and average marine maturity schedules or
time series modeling tempered by available juvenile production data or combinations of these data sets. b Sockeye salmon harvest estimates include, commercial, sport, personal use, and educational fisheries. c Harvest projections are prepared using subjective estimates of parent-year escapements, gross trends in harvest, and expected intensity of fishery. d Actual harvests prior to 2005 reflect minor adjustments to the harvest database.

133
Appendix A15.–Subsistence and educational fishery salmon harvest, Upper Cook Inlet, 1980–2005.
Fishery No. Permits Chinook Sockeye Coho Pink Chum Tyonek Subsistence
1980 67 1,757 235 0 0 0 1981 70 2,002 269 64 32 15 1982 69 1,590 310 113 14 4 1983 75 2,665 187 59 0 6 1984 75 2,200 266 79 3 23 1985 76 1,472 164 91 0 10 1986 65 1,676 203 223 50 46 1987 64 1,610 166 149 10 24 1988 47 1,587 91 253 8 12 1989 49 1,250 85 115 0 1 1990 42 781 66 352 20 12 1991 57 902 26 58 0 0 1992 57 907 75 234 7 19 1993 62 1,370 57 77 19 17 1994 49 770 85 101 0 22 1995 55 1,317 45 153 0 15 1996 49 1,039 68 137 21 7 1997 42 639 101 137 0 8 1998 74 978 163 64 1 2 1999 76 1,230 144 94 32 11 2000 60 1,157 63 87 6 0 2001 84 976 172 49 4 6 2002 102 1,080 209 115 9 4 2003 91 1,183 111 44 7 10 2004 97 1,345 93 130 0 0 2005 81 720 60 104 0 2
Yentna Subsistence 1996 17 0 242 46 115 51 1997 24 0 549 83 30 10 1998 21 0 495 113 30 15 1999 18 0 516 48 18 13 2000 19 0 379 92 4 7 2001 16 0 545 50 10 4 2002 25 0 454 133 14 31 2003 19 0 553 67 2 8 2004a 21 0 441 146 36 3 2005 18 0 181 42 25 24
-continued-

134
Appendix A15.–Page 2 of 2.
Fishery No. Permits Chinook Sockeye Coho Pink Chum
Educational Fisheriesa 1994 na 57 1,907 948 134 - 1995 na 40 1,498 953 35 - 1996 na 105 2,242 648 211 - 1997 na 236 2,884 290 60 - 1998 na 252 3,266 843 135 - 1999 na 283 2,690 690 28 - 2000 na 220 2,713 835 680 - 2001 na 353 4,510 805 166 - 2002 na 200 3,366 1,122 545 - 2003 na 307 5,171 616 91 - 2004 na 162 4,784 927 440 - 2005 na 163 6,665 161 15 0
a Educational fisheries consist of Kenaitze Tribal, Ninilchik Traditional Council, Ninilchik Native Descendents, and Ninilchik Emergency Services (see Appendix A16 for individual fishery harvests).

135
Appendix A16.–Summary of salmon harvested from educational fisheries, 1994-2005.
Year Fishery Chinook Sockeye Coho Pink Chum
1994 Kenaitze 57 1,907 829 134
NTC 119
NND
Total 57 1,907 948 134 0
1995 Kenaitze 40 1,498 868 35
NTC 85
NND
Total 40 1,498 953 35 0
1996 Kenaitze 105 2,242 592 211
NTC 56
NND
Total 105 2,242 648 211 0
1997 Kenaitze 142 2,410 191 5
NTC 94 474 99 55
NND
Total 236 2,884 290 60 0
1998 Kenaitze 133 2,621 638 58
NTC 67 506 95 57
NND 52 139 110 20
Total 252 3,266 843 135 0
1999 Kenaitze 118 1,944 530 5
NTC 109 442 84 6
NND 56 304 76 17
Total 283 2,690 690 28 0
2000 Kenaitze 130 2,088 656 617
NTC 40 423 82 48
NND 50 202 97 15
Total 220 2,713 835 680 0 -continued-
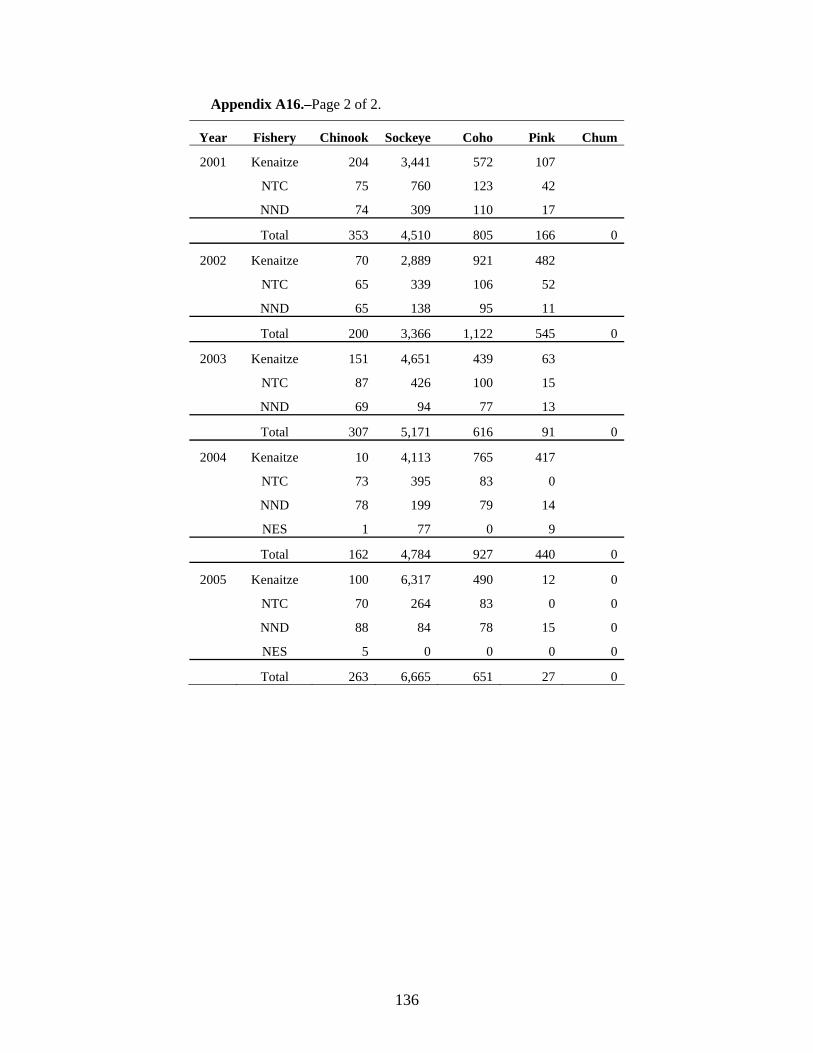
136
Appendix A16.–Page 2 of 2.
Year Fishery Chinook Sockeye Coho Pink Chum
2001 Kenaitze 204 3,441 572 107
NTC 75 760 123 42
NND 74 309 110 17
Total 353 4,510 805 166 0
2002 Kenaitze 70 2,889 921 482
NTC 65 339 106 52
NND 65 138 95 11
Total 200 3,366 1,122 545 0
2003 Kenaitze 151 4,651 439 63
NTC 87 426 100 15
NND 69 94 77 13
Total 307 5,171 616 91 0
2004 Kenaitze 10 4,113 765 417
NTC 73 395 83 0
NND 78 199 79 14
NES 1 77 0 9
Total 162 4,784 927 440 0
2005 Kenaitze 100 6,317 490 12 0
NTC 70 264 83 0 0
NND 88 84 78 15 0
NES 5 0 0 0 0
Total 263 6,665 651 27 0