Liver-specific deletion of prohibitin 1 results in spontaneous liver injury, fibrosis, and...
22
Liver-Specific Deletion of Prohibitin 1 Results in Spontaneous Liver Injury, Fibrosis, and Hepatocellular Carcinoma in Mice Kwang Suk Ko 1 , Maria Lauda Tomasi 1 , Ainhoa Iglesias-Ara 1 , Barbara A French 2,3 , Samuel W. French 2,3 , Komal Ramani 1,2 , Juan José Lozano 4 , Pilsoo Oh 1 , Lina He 5 , Bangyan L. Stiles 5 , Tony W. H. Li 1 , Heping Yang 1 , M Luz Martínez-Chantar 6 , José M. Mato 6,* , and Shelly C. Lu 1,2,* 1 Division of Gastroenterology and Liver Diseases, USC Research Center for Liver Diseases, Keck School of Medicine USC, Los Angeles, CA 90033 2 Southern California Research Center for ALPD and Cirrhosis, Keck School of Medicine USC, Los Angeles, CA 90033 3 Department of Pathology, Harbor-UCLA Medical Center, Torrance, CA 90509 4 Plataforma de Bioinformatica, Center for Cooperative Research in Biosciences, CIBERehd, Hospital Clinic, Barcelona, Spain 5 Pharmacology and Pharmaceutical Sciences, University of Southern California, Los Angeles, CA 90089 6 CIC Biogune, Center for Cooperative Research in Biosciences, CIBERehd, Parque Tecnológico de Bizkaia, Derio, Bizkaia Abstract Background and rationale—Prohibitin 1 (PHB1) is a highly conserved, ubiquitously expressed protein that participates in diverse processes including mitochondrial chaperone, growth and apoptosis. The role of PHB1 in vivo is unclear and whether it is a tumor suppressor is controversial. Mice lacking methionine adenosyltransferase 1A (MAT1A) have reduced PHB1 expression, impaired mitochondrial function, and spontaneously develop hepatocellular carcinoma (HCC). To see if reduced PHB1 expression contributes to the Mat1a knockout (KO) phenotype, we generated liver-specific Phb1 KO mice. Methods—Expression was determined at the mRNA and protein levels. PHB1 expression in cells was varied by siRNA or overexpression. Results—At 3 weeks, KO mice exhibit biochemical and histologic liver injury. Immunohistochemistry revealed apoptosis, proliferation, oxidative stress, fibrosis, bile duct epithelial metaplasia, hepatocyte dysplasia, and increased staining for stem cell and preneoplastic markers. Mitochondria are swollen and many have no discernible cristae. Differential gene expression revealed genes that are associated with proliferation, malignant transformation and liver fibrosis highly up-regulated. From 20 weeks on, KO mice have multiple liver nodules and from 35 to 46 weeks, 38% have multi-focal HCC. PHB1 protein levels were higher in normal human hepatocytes as compared to human HCC cell lines Huh-7 and HepG2. Knockdown of PHB1 in murine non-transformed AML12 cells raised cyclin D1 expression, increased E2F binding to cyclin D1 promoter, and proliferation. The opposite occurred with PHB1 Contact information. Shelly C. Lu, M.D. Division of Gastrointestinal and Liver Diseases; HMR Bldg., 415, Department of Medicine, Keck School of Medicine USC, 2011 Zonal Ave., Los Angeles, CA, 90033. Phone: (323) 442-2441. Fax: (323) 442-3234. [email protected].. * Share senior corresponding authorship NIH Public Access Author Manuscript Hepatology. Author manuscript; available in PMC 2011 December 1. Published in final edited form as: Hepatology. 2010 December ; 52(6): 2096–2108. doi:10.1002/hep.23919. NIH-PA Author Manuscript NIH-PA Author Manuscript NIH-PA Author Manuscript
Transcript of Liver-specific deletion of prohibitin 1 results in spontaneous liver injury, fibrosis, and...

Liver-Specific Deletion of Prohibitin 1 Results in SpontaneousLiver Injury, Fibrosis, and Hepatocellular Carcinoma in Mice
Kwang Suk Ko1, Maria Lauda Tomasi1, Ainhoa Iglesias-Ara1, Barbara A French2,3, SamuelW. French2,3, Komal Ramani1,2, Juan José Lozano4, Pilsoo Oh1, Lina He5, Bangyan L.Stiles5, Tony W. H. Li1, Heping Yang1, M Luz Martínez-Chantar6, José M. Mato6,*, and ShellyC. Lu1,2,*
1Division of Gastroenterology and Liver Diseases, USC Research Center for Liver Diseases,Keck School of Medicine USC, Los Angeles, CA 900332Southern California Research Center for ALPD and Cirrhosis, Keck School of Medicine USC,Los Angeles, CA 900333Department of Pathology, Harbor-UCLA Medical Center, Torrance, CA 905094Plataforma de Bioinformatica, Center for Cooperative Research in Biosciences, CIBERehd,Hospital Clinic, Barcelona, Spain5Pharmacology and Pharmaceutical Sciences, University of Southern California, Los Angeles, CA900896CIC Biogune, Center for Cooperative Research in Biosciences, CIBERehd, Parque Tecnológicode Bizkaia, Derio, Bizkaia
AbstractBackground and rationale—Prohibitin 1 (PHB1) is a highly conserved, ubiquitouslyexpressed protein that participates in diverse processes including mitochondrial chaperone, growthand apoptosis. The role of PHB1 in vivo is unclear and whether it is a tumor suppressor iscontroversial. Mice lacking methionine adenosyltransferase 1A (MAT1A) have reduced PHB1expression, impaired mitochondrial function, and spontaneously develop hepatocellular carcinoma(HCC). To see if reduced PHB1 expression contributes to the Mat1a knockout (KO) phenotype,we generated liver-specific Phb1 KO mice.
Methods—Expression was determined at the mRNA and protein levels. PHB1 expression incells was varied by siRNA or overexpression.
Results—At 3 weeks, KO mice exhibit biochemical and histologic liver injury.Immunohistochemistry revealed apoptosis, proliferation, oxidative stress, fibrosis, bile ductepithelial metaplasia, hepatocyte dysplasia, and increased staining for stem cell and preneoplasticmarkers. Mitochondria are swollen and many have no discernible cristae. Differential geneexpression revealed genes that are associated with proliferation, malignant transformation andliver fibrosis highly up-regulated. From 20 weeks on, KO mice have multiple liver nodules andfrom 35 to 46 weeks, 38% have multi-focal HCC. PHB1 protein levels were higher in normalhuman hepatocytes as compared to human HCC cell lines Huh-7 and HepG2. Knockdown ofPHB1 in murine non-transformed AML12 cells raised cyclin D1 expression, increased E2Fbinding to cyclin D1 promoter, and proliferation. The opposite occurred with PHB1
Contact information. Shelly C. Lu, M.D. Division of Gastrointestinal and Liver Diseases; HMR Bldg., 415, Department of Medicine,Keck School of Medicine USC, 2011 Zonal Ave., Los Angeles, CA, 90033. Phone: (323) 442-2441. Fax: (323) [email protected]..*Share senior corresponding authorship
NIH Public AccessAuthor ManuscriptHepatology. Author manuscript; available in PMC 2011 December 1.
Published in final edited form as:Hepatology. 2010 December ; 52(6): 2096–2108. doi:10.1002/hep.23919.
NIH
-PA Author Manuscript
NIH
-PA Author Manuscript
NIH
-PA Author Manuscript

overexpression. Knockdown or overexpression of PHB1 in Huh-7 cells did not affect proliferationsignificantly or sensitize cells to sorafenib-induced apoptosis.
Conclusions—Hepatocyte-specific PHB1 deficiency results in marked liver injury, oxidativestress and fibrosis with development of HCC by 8 months. These results support PHB1 as a tumorsuppressor in hepatocytes.
KeywordsMethionine adenosyltransferase 1A; mitochondria; liver-specific knockout; microarray; cyclin D1
INTRODUCTIONProhibitin (PHB) proteins are highly conserved and ubiquitously expressed proteins thathave diverse cellular functions (1,2). There are two PHB proteins, PHB1 and PHB2, whichare encoded by genes located on different chromosomes and form a large multimericcomplex (PHB complex) that is found largely in the inner mitochondrial membrane where itexerts a chaperone-like function to stabilize newly synthesized mitochondrial proteins (3).They are essential for mitochondrial function and biogenesis in yeast (4). PHB1 is alsofound in the nucleus, where it has been shown to interact with Rb and p53 among otherproteins to bring about a change in transcriptional activities of E2F (5) and p53 (6). Thesenuclear events have been associated with inhibition of cell cycle progression (5) andinduction of apoptosis (6). In addition, PHB1 is also localized to the plasma membrane ofcertain cell types and may function as surface receptor although the ligand(s) remains to beidentified, found in circulation, and found in the gastrointestinal tract (muscularis,muscularis mucosa and epithelial layers) where it has been implicated to protect againstinfection and inflammation (7,8). PHB1 was originally cloned in 1989 and identified ashaving antiproliferative activity and thought to be a tumor suppressor (hence its name) (9).However, this was later found to be associated with the 3′-UTR of PHB1 mRNA and notdue to the protein itself (3). The tumor suppressor activity of PHB1 is highly controversialas PHB1 expression is actually higher in many transformed cells and tumors (1). The mostwell characterized function of PHB1 is its role as a mitochondrial chaperone. While manystudies have examined the effects of PHB1 in cell lines and yeast, little is known about thein vivo function of these proteins in mammals and nothing has been reported about thefunction of PHB1 in mammalian liver. The reason for this is that deletion of PHB1 leads toembryonic lethality (Lexicon Knockout Mice Phenotype Data Summary NIH-1165,http://www.informatics.jax.org/external/ko/lexicon/2210.html).
We identified PHB1 to be down-regulated at the protein level from the time of birth in micelacking methionine adenosyltransferase 1A (MAT1A) and in mice and patients at risk fordevelopment of non-alcoholic steatohepatitis (10). Mat1a knockout (KO) mice haveincreased hepatic oxidative stress, impaired mitochondrial function and developsteatohepatitis and hepatocellular carcinoma (HCC) spontaneously (11,12). MAT1A isexpressed largely by mature hepatocytes where it encodes for the enzyme MAT that isresponsible for the biosynthesis of S-adenosylmethionine (SAMe) (13). We found thatPHB1 was down-regulated at the protein level when intracellular SAMe level fell (10).Since PHB1 was down-regulated in the livers of the Mat1a KO mice at birth and persistedup to the development of steatohepatitis (10), the purpose of the current work was to see ifliver-specific Phb1 KO mice can recapitulate some of the phenotype of the Mat1a KO mice,specifically impaired mitochondrial function, oxidative stress, steatohepatitis and malignanttransformation. Our findings show the importance of PHB1 in maintaining normal liverfunction and support its role as a tumor suppressor in hepatocytes.
Ko et al. Page 2
Hepatology. Author manuscript; available in PMC 2011 December 1.
NIH
-PA Author Manuscript
NIH
-PA Author Manuscript
NIH
-PA Author Manuscript

MATERIALS AND METHODSMaterials
α-32P-dCTP (3,000 Ci/mmol) was purchased from PerkinElmer (Boston, MA). All otherreagents were of analytical grade and obtained from commercial sources.
Generation of the liver-specific Phb1 KO miceLiver-specific Phb1 KO mouse (C57BL/6J) was developed by serial breeding ofPhb1loxP/loxP and Albumin-Cre+/+(Alb-Cre+/+) mice as shown in supplemental Figure 1 anddescribed in detail in Supplemental Methods.
All experiments were reviewed and approved by the Institutional Animal Care and UseCommittee at the University of Southern California. Ages between 3 and 46 weeks micewere used for the experiments. Please see Supplemental Methods for details of specimenhandling. Isolated hepatocytes were obtained by the Cell Culture Core of the USC ResearchCenter for Liver Diseases as described (14).
Cell Cultures, PHB1 knockdown or overexpressionA normal mouse hepatocyte cell line, AML12, was purchased from American Type CultureCollection (ATCC, Manassas, VA), while HepG2 and Huh-7 cells were provided by the CellCulture Core and cultured in recommended media in a humidified incubator with 37°Ctemperature and 5% of CO2. Cells with passage number less than 18 were used for theexperiments. Primary human hepatocytes were obtained from CellzDirect (Pittsboro, NC).Cells were washed with phosphate-buffered saline three times and protein was extracted forWestern blot analysis as described below.
The pre-designed small interfering RNA (siRNA) targeting mouse Phb1 (sense sequence:AGAGCGAGCGGCAACAUUUtt or AGAAACCAAUUAUCUUUGAtt) and negativecontrol siRNA were purchased from Ambion (Austin, TX). AML12 and Huh-7 cells in 6well plates (0.2×10⁶ cells/well) were transfected using RNAiMax (5μL/well) fromInvitrogen (Carlsbad, CA) with PHB1 siRNA (12nM) or negative control siRNA for 18h(AML12) and 48h (Huh-7) for mRNA or protein expression, or 24h (AML12) and 48h(Huh-7) for proliferation or apoptosis assays, following the manufacturer’s manual.
Phb1 overexpression vector (PHB1-pcDNA3.1) and negative control empty vector werekindly provided by Dr Mehta (Illinois Institute of Technology Research Institute, Chicago,IL). Transient transfection was done using 3μL of Lipofectamine 2000 (Invitrogen,Carlsbad, CA) and 1.4μg of target plasmid per well of 6 well plates. After 4h, transfectionmedium was changed to normal medium and cells were cultured for an additional 44h formRNA, protein expression, proliferation or apoptosis assays.
Nucleic acid isolationsGenomic DNA for genotyping was isolated from hepatocytes and various organs by themethod of Strauss (15). Total RNA was isolated from livers, AML12 and Huh-7 cells usingTrizol reagent (Invitrogen, Carlsbad, CA) and then purified by total RNA isolation kit(Bioland Scientific LLC., Cerritos, CA) following the manufacturer’s manuals.
GenotypingGenotyping was determined by PCR and described in detail in Supplemental Methods.
Ko et al. Page 3
Hepatology. Author manuscript; available in PMC 2011 December 1.
NIH
-PA Author Manuscript
NIH
-PA Author Manuscript
NIH
-PA Author Manuscript

Gene and protein expressionNorthern blot analysis, autoradiography and densitometry were done as previous described(12). The specific probes for mouse Phb1 exon 2 and Gapdh were designed to correspond topublished mRNA sequences from +52 to +154 (Phb1, NM_008831.3) and +221 to +810(Gapdh, NM_008084), respectively. Both were labeled with α-32P-dCTP using a randomprimed DNA labeling kit (DECAprime™ II, Ambion Inc., Austin, TX) as described (12).Results of Northern blot analysis were normalized to Gapdh.
See Supplemental Methods for details of the microarray analysis, which examineddifferential mRNA expression profiles, and quantitative real-time PCR for confirmation.
Protein expression was examined using Western blot analysis performed as described (16)using anti-PHB1, PHB2 and β-actin antibodies (Abcam, Cambridge, MA).
Chromatin immunoprecipitation (ChIP) assayPlease see Supplemental Methods for details.
Histology, immunohistochemistry, immunocytofluorescence and EMHistologic exam was done in blinded fashion as to the genotype or age of the animal. Pleasesee Supplemental Methods for details of these procedures.
Plasma alkaline phosphatase (ALP), bilirubin and alanine transaminase (ALT) levelsPlasma bilirubin, ALT and ALP were determined by total bilirubin kit (Thermo ElectronCorporation, Waltham, MA), ALT reagent (Raichem, Cliniqa Corporation, San Marcos,CA) and ALP assay kit (Biovision Incorporated, Mountain View, CA), respectively,following manufacture’s protocols.
Plasma and hepatic triglyceride and cholesterol levelsLipid portion of liver was extracted as method of Folch (17) using chloroform/methanol(2/1, v/v) as solvent matrix. Evaporated and reconstituted lipid from liver and frozen andthawed plasma were subjected to the assays for cholesterol and triglyceride usingcommercial kits (Thermo DMA, Louisville, CO) following manufacturer’s manuals.
Cell Proliferation and apoptosis assaysCell proliferation in PHB1 silenced cells for 24h or 48h was measured by the incorporationrate of bromodeoxyuridine (BrDU) into DNA using a BrDU assay kit (CalBiochem, SanDiego, CA) as described (18) with 3,000 cells per well in 96 well plates and 4h or 1h ofBrDU incorporation time for AML12 or Huh-7 cells, respectively. Apoptosis was measuredby Hoechst staining as previously described (18) in Huh-7 cells treated with sorafenib(10μM, last 24h of knockdown or overexpression).
Statistical analysisData are given as mean±SEM. Statistical analysis for the microarray data is described in thatsection separately. For the rest of the results, statistical analysis was performed usingunpaired Student’s t-test. For changes in mRNA and protein levels, ratios of various genesand proteins to housekeeping gene or protein densitometric values were compared.Significance was defined by p<0.05.
Ko et al. Page 4
Hepatology. Author manuscript; available in PMC 2011 December 1.
NIH
-PA Author Manuscript
NIH
-PA Author Manuscript
NIH
-PA Author Manuscript

RESULTSGeneration of the liver-specific Phb1 KO mice
Following the scheme shown in supplemental Figure 1, liver-specific Phb1 KO wasgenerated. Of the 120 mice genotyped from 18 litters of heterozygous mating (Phb1loxP/+;Alb-Cre+/−), 10% were liver-specific KOs (Phb1loxP/loxP; Alb-Cre+/+ or Alb-Cre+/−), 73%were heterozygotes (Phb1loxP/+), and 17% were WT (Phb1+/+).
Figure 1A shows deletion of Phb1 occurred only in the liver of 3-week old KO mice.However, deletion was not complete at this age, as there remains a faint band thatcorresponds to the wild type gene in both liver and isolated hepatocytes. Consistent withthis, Northern blot analysis using Phb1 exon 2 as the cDNA probe shows 80% reduction inPhb1 mRNA level (Fig. 1B) and Western blot analyses show a comparable reduction in thePHB1 protein level in the liver and hepatocytes but not in the kidney (Fig. 1C). PHB2protein level was also reduced, but to a lesser degree to 30-40% of controls in the liver andhepatocytes (Fig. 1C).
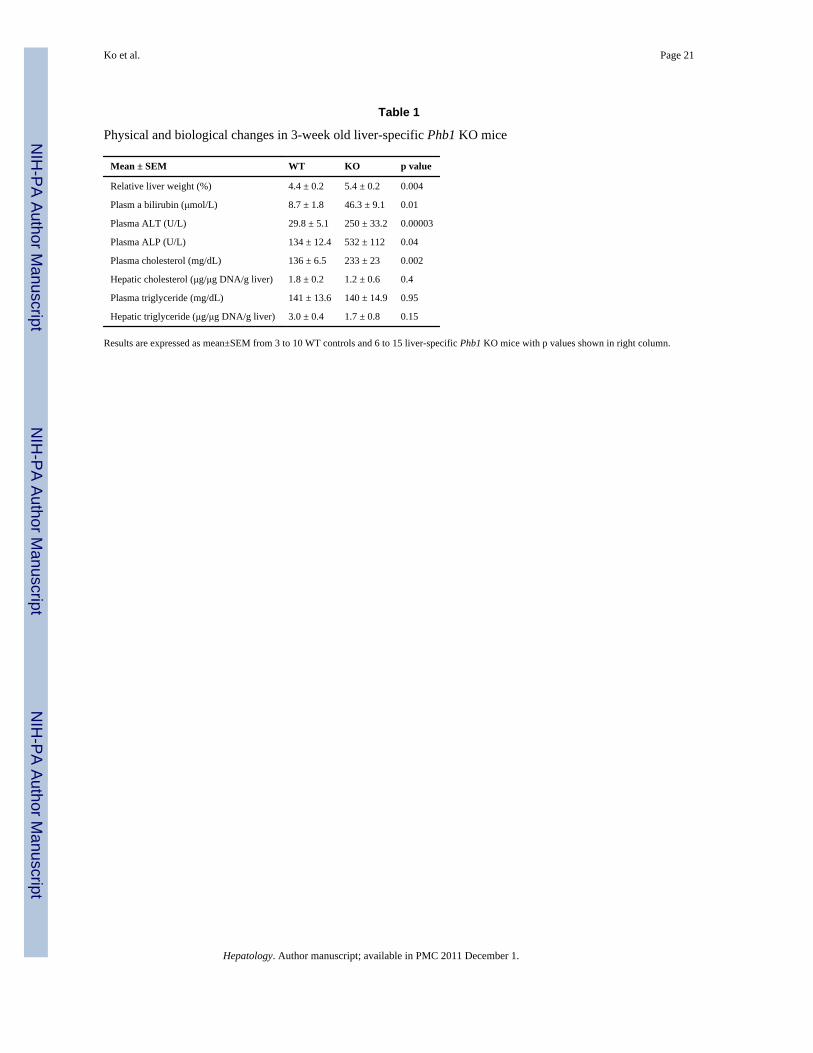
Physical and biological changes in the liver-specific Phb1 KO miceFrom the time of birth, there is variability in the weight and health of the KO mice. 15% ofthe pubs (115 of 768) died before weaning (3 weeks old). Although most were notgenotyped, of the ones that died before weaning and examined, they were all liver-specificKOs. KOs that survived passed 3 weeks weighed less than WT control littermates and thisdifference persisted up to 14 weeks of age (supplemental Figures 2 and 3). The relative liverto body weight was higher in the KO mice (Table 1). At 3-weeks of age, many KO miceappeared ill and liver injury is evident biochemically (Table 1). Liver injury is confirmedhistologically by marked necrosis and inflammation seen throughout the liver (Fig. 2B, C).There is also bile duct metaplasia (Fig. 2D), anisocytosis of hepatic nuclei (Fig. 2E) andpositive staining for OV-6, an oval cell marker (Fig. 3B) and glutathione S-transferase Pi(GSTP) (Fig. 3D), a preneoplastic marker in the 3-week old KO liver.
Mat1a KO mice have higher hepatic triglyceride levels (11) and develop steatohepatitis (12).This prompted us to measure lipid levels in the liver-specific Phb1 KO mice. Liver-specificPhb1 KO mice have elevated plasma cholesterol levels but hepatic cholesterol levels andboth plasma and hepatic triglyceride levels were unchanged from WT controls (Table 1).
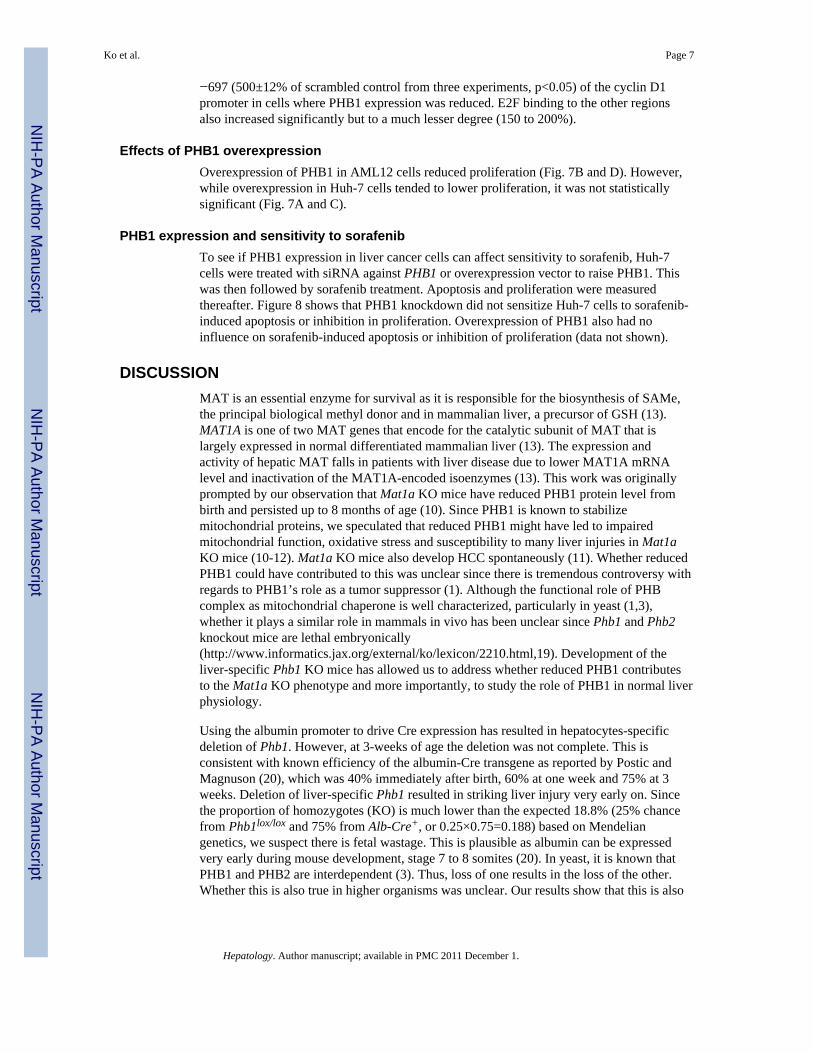
As the mice grew older, by 14 weeks hepatic nodule can be seen in some liver sections butnot on gross examination (Fig. 2F). By 38 weeks, many KO livers stain positive for AFP(Fig. 3F). Since PHB1 is a mitochondrial chaperone protein, we examined mitochondrialmorphology by EM. Supplemental Figure 4 (A and B) shows that mitochondria in the 3-week old KO liver appear swollen and many have no discernible cristae. Consistent withimpaired mitochondrial function is positive 4-hydroxynonenal (4-HNE) staining fromincreased lipid peroxidation in the KO liver as compared to WT control liver (SupplementalFig. 4C and D). As the KO mice grew older, there is progressive apoptosis as shown byactivated caspase 3 staining (Fig. 4 top row), persistent proliferation as indicated byproliferating cellular nuclear antigen (PCNA) staining (Fig. 4 middle row), and progressivefibrosis on reticulin staining (Fig. 4 bottom row). No frank cancer was noted in 8 KO miceby 14 weeks on a normal diet based on histologic examination. However, by 20 weeks, allmice have multiple liver nodules on gross exam of the liver (Fig. 5B) and between the agesof 35 to 46 weeks, 38% (5 of 13, 1 of 5 male and 4 of 8 female mice) have multi-focal HCC(Fig. 5C and D).
Ko et al. Page 5
Hepatology. Author manuscript; available in PMC 2011 December 1.
NIH
-PA Author Manuscript
NIH
-PA Author Manuscript
NIH
-PA Author Manuscript

Since Phb1 KO mice develop HCC, we next compared PHB1 protein expression in normalprimary human hepatocytes to that of human HCC cell lines Huh-7 and HepG2. Figure 5Eshows that the protein level of PHB1 is markedly decreased in the two liver cancer cell lines.
Differential gene expression in the 3-week old liver-specific Phb1 KO mice liversDifferential gene expression was examined using microarray. Supplemental figure 5 showsthe heatmap generated from the microarray data demonstrating the striking difference ingene expression between KO and controls. Note the controls were very similar regardless ofage. Microarray analysis (25,000 genes) revealed that 402 genes were up-regulated and 182genes were down-regulated (fold-change > 2.0; p < 0.05) (see Supplemental Table 2 and 3for complete list). Quantitative real-time PCR confirmed these changes in more than 15genes (Table 2). Many of the genes differentially expressed in Phb1 KO mice liver areinvolved in growth such as H19, CDC20, PRC1, IGF2B, cyclin D1 (CCND1), EGFR1,RASAL1, and SRC (Table 2). Several genes involved in fibrogenesis are also markedly up-regulated including many collagen genes and tissue inhibitor of metalloproteinase 1(TIMP1). Interestingly, many enzymes are markedly down-regulated, including severalcytochrome P450 (CYP450) family members and UDP glycosyltransferase (Table 2). Genesdifferentially expressed fall into many different pathways including angiogenesis,cytoskeletal regulation, signaling pathways involved in epidermal growth factor receptor,heterotrimeric G-protein, inflammation, integrin, interleukin, p53, phosphoinositide 3-kinase(PI3K), platelet-derived growth factor (PDGF), Ras, and vascular endothelial growth factor(VEGF). Supplemental Tables 6 to 19 describe changes in mRNA level based on differentsignaling pathways and biological functions.
Localization of PHB1 in hepatocytesPHB1 subcellular localization in hepatocytes has not been examined. Using confocalmicroscopy, Supplemental figure 6A shows that the bulk of PHB1 is localized in themitochondria but there is also staining in the nuclei of normal mouse hepatocytes. PHB1staining is diminished in both compartments in the hepatocytes isolated from the KO mouse(Supplemental Fig. 6B). Both mitochondrial and nuclear staining can also be seen inAML12 cells (Supplemental Fig. 6C).
Effects of acute PHB1 knockdown in non-transformed AML12 cellsTo better assess whether the changes observed in the KO mice are due to direct or indirecteffects (compensatory proliferation in response to injury) of PHB1 deficiency, we employedacute knockdown with siRNA against Phb1 in non-transformed AML12 cells. Figure 6Ashows that after 18 hours of siRNA treatment, the efficiency of PHB1 knockdown is about90% at the mRNA level while PHB1 protein level fell by only 30% (Fig. 6B). After 18hours of siRNA treatment, a number of the genes picked up on in vivo microarray analysisalso exhibited a similar change, but with much smaller magnitude, for instance, cyclin D1(CCND1) was increased 64% instead of 4-fold. Some of the genes exhibited similarmagnitude of change as in vivo microarray, such as KRT18, which increased by 69% andp53, which increased by 48%. Some of the genes actually showed the opposite change as invivo microarray, such as CYP4A12A, which more than doubled instead of being 20-foldreduced and CYP2F2, which increased by 31% instead of a 10-fold reduction (Fig. 6C andSupplemental Table 3). Acute reduction of PHB1 for 24 hours resulted in a 50% increase incell proliferation (Fig. 6D).
To see if the effect of PHB1 knockdown on cyclin D1 expression may be exerted at the levelof E2F binding to its consensus sites on the cyclin D1 promoter, we performed ChIPanalysis comparing E2F binding to different regions of the promoter that contain E2Fbinding sites. Figure 6E shows that E2F binding increased particularly in region −513 to
Ko et al. Page 6
Hepatology. Author manuscript; available in PMC 2011 December 1.
NIH
-PA Author Manuscript
NIH
-PA Author Manuscript
NIH
-PA Author Manuscript
−697 (500±12% of scrambled control from three experiments, p<0.05) of the cyclin D1promoter in cells where PHB1 expression was reduced. E2F binding to the other regionsalso increased significantly but to a much lesser degree (150 to 200%).
Effects of PHB1 overexpressionOverexpression of PHB1 in AML12 cells reduced proliferation (Fig. 7B and D). However,while overexpression in Huh-7 cells tended to lower proliferation, it was not statisticallysignificant (Fig. 7A and C).
PHB1 expression and sensitivity to sorafenibTo see if PHB1 expression in liver cancer cells can affect sensitivity to sorafenib, Huh-7cells were treated with siRNA against PHB1 or overexpression vector to raise PHB1. Thiswas then followed by sorafenib treatment. Apoptosis and proliferation were measuredthereafter. Figure 8 shows that PHB1 knockdown did not sensitize Huh-7 cells to sorafenib-induced apoptosis or inhibition in proliferation. Overexpression of PHB1 also had noinfluence on sorafenib-induced apoptosis or inhibition of proliferation (data not shown).
DISCUSSIONMAT is an essential enzyme for survival as it is responsible for the biosynthesis of SAMe,the principal biological methyl donor and in mammalian liver, a precursor of GSH (13).MAT1A is one of two MAT genes that encode for the catalytic subunit of MAT that islargely expressed in normal differentiated mammalian liver (13). The expression andactivity of hepatic MAT falls in patients with liver disease due to lower MAT1A mRNAlevel and inactivation of the MAT1A-encoded isoenzymes (13). This work was originallyprompted by our observation that Mat1a KO mice have reduced PHB1 protein level frombirth and persisted up to 8 months of age (10). Since PHB1 is known to stabilizemitochondrial proteins, we speculated that reduced PHB1 might have led to impairedmitochondrial function, oxidative stress and susceptibility to many liver injuries in Mat1aKO mice (10-12). Mat1a KO mice also develop HCC spontaneously (11). Whether reducedPHB1 could have contributed to this was unclear since there is tremendous controversy withregards to PHB1’s role as a tumor suppressor (1). Although the functional role of PHBcomplex as mitochondrial chaperone is well characterized, particularly in yeast (1,3),whether it plays a similar role in mammals in vivo has been unclear since Phb1 and Phb2knockout mice are lethal embryonically(http://www.informatics.jax.org/external/ko/lexicon/2210.html,19). Development of theliver-specific Phb1 KO mice has allowed us to address whether reduced PHB1 contributesto the Mat1a KO phenotype and more importantly, to study the role of PHB1 in normal liverphysiology.
Using the albumin promoter to drive Cre expression has resulted in hepatocytes-specificdeletion of Phb1. However, at 3-weeks of age the deletion was not complete. This isconsistent with known efficiency of the albumin-Cre transgene as reported by Postic andMagnuson (20), which was 40% immediately after birth, 60% at one week and 75% at 3weeks. Deletion of liver-specific Phb1 resulted in striking liver injury very early on. Sincethe proportion of homozygotes (KO) is much lower than the expected 18.8% (25% chancefrom Phb1lox/lox and 75% from Alb-Cre+, or 0.25×0.75=0.188) based on Mendeliangenetics, we suspect there is fetal wastage. This is plausible as albumin can be expressedvery early during mouse development, stage 7 to 8 somites (20). In yeast, it is known thatPHB1 and PHB2 are interdependent (3). Thus, loss of one results in the loss of the other.Whether this is also true in higher organisms was unclear. Our results show that this is also
Ko et al. Page 7
Hepatology. Author manuscript; available in PMC 2011 December 1.
NIH
-PA Author Manuscript
NIH
-PA Author Manuscript
NIH
-PA Author Manuscript

true in mammalian liver as PHB2 was also reduced (although to a lesser degree) when PHB1was markedly reduced.
Many of the liver-specific Phb1 KO mice died before weaning and at only 3 weeks of age,there is biochemical and histological evidence of marked liver injury. Histologically theliver is characterized by necrosis and inflammation at 3 weeks. There is also increasedapoptosis, which progressed as the mice grew to 14 weeks. Consistent with its known role asa mitochondrial chaperone, marked reduction in PHB1 resulted in abnormal mitochondrialmorphology and oxidative stress. There is also increased proliferation, as indicated byPCNA staining. Interestingly as early as 3-weeks of age, there is already increased stainingfor OV-6 and GSTP, oval cell and preneoplastic markers, respectively. By 14-weeks,dysplastic hepatic nodules were evident microscopically and by 20-weeks, all mice havemultiple hepatic nodules on gross examination. By 35 to 46 weeks, more than 1/3 of themice developed multi-focal HCC. Since increased proliferation and stem cell expansionobserved in the livers of the KO mice may be due to a compensatory response to injury, weexamined the effect of acute reduction in PHB1 on cell proliferation in non-transformedAML12 cells. Acute loss of PHB1 in a non-transformed hepatocyte resulted in increasedproliferation whereas overexpression of PHB1 resulted in the opposite. Although PHB1expression also tended to have a similar effect in Huh-7 cells, changes were not statisticallysignificant. Taken together, these observations would support a role for PHB1 as a tumorsuppressor, at least in normal hepatocytes. It is possible that the effect of PHB1 on growth isdifferent in normal versus malignant hepatocytes as many signaling pathways are altered incancer. This is an area that will require further investigation.
There is compelling data from several laboratories using a variety of techniques that supportpresence of PHB1 in the nucleus in steroid-responsive cells (breast and prostate cancer celllines) and physical interaction with Rb, E2F, and p53 as well as other proteins to repress thetranscriptional activity of E2F (5,21,22) and activate the transcriptional activity of p53 (6).Our results show that in hepatocytes, a small amount of PHB1 can be found in the nucleus.Furthermore, reduced PHB1 expression in AML12 cells resulted in increased E2F binding tothe cyclin D1 promoter and cyclin D1 expression. However, if PHB1 inhibits cell cycleprogression and induces apoptosis, as these studies suggest, why would it be highlyexpressed in many human cancers? Although it is highly expressed in many types of cancer(23), it has not been well studied in HCC and whether it is functionally normal has not beenexamined. Indeed, we found much higher PHB1 protein level in normal human hepatocyteswhen compared to two human liver cancer cell lines. PHB1 expression level also doesn’tequate function. A recent study found liver cells and transgenic mice that express hepatitis Cvirus core protein have increased mitochondrial PHB1 protein level but despite higher level,it is functionally impaired (24). Thus, it would be of interest to see if there is a difference insubcellular localization of PHB1 in various cancers and whether it is functionally intact.Consistent with this notion, a recent study found lung cancer cells that have increasedmembrane associated PHB1 (cell surface and microsomal membrane fractions) were moreresistant to paclitaxel (23) and interestingly, total whole cell levels of PHB1 wereunchanged. We did not observe any difference in sensitivity to sorafenib in Huh-7 cellswhen PHB1 expression was varied. Thus, the effect of PHB1 may be cancer and cell linespecific.
The microarray data revealed many pathways are affected by reduced PHB1 expression.Many are growth related and oncogenes. Interestingly, cyclin D1 and PCNA, which are up-regulated in Mat1a KO (25) and Phb1 KO livers, are known E2F targets (26). Thesefindings, along with our current observations, would support PHB1’s repressive role on E2Ftranscriptional activity in mouse liver. We also examined whether these genes are similarlyaffected after acute knockdown of PHB1 in AML12 cells. Although many of the growth-
Ko et al. Page 8
Hepatology. Author manuscript; available in PMC 2011 December 1.
NIH
-PA Author Manuscript
NIH
-PA Author Manuscript
NIH
-PA Author Manuscript

related genes are similarly affected, the magnitude of change is much smaller than in vivo.This may be partly due to the fact that PHB1 protein level fell only by 30% after 18 hours ofsiRNA treatment even though the mRNA level fell by 90%. PHB1 protein appears to bequite stable with a half-life that exceeds 10 hours (27). Interestingly, CYP4A12A andCYP2F2 are both increased in the AML12 cells following PHB1 knockdown, which is theopposite of what happened in the KO livers. This likely reflects some adaptive changes thatoccurred in vivo and influence of the in vivo microenvironment.
Recently, conditional deletion of Phb2 using mouse embryonic fibroblasts (MEFs) fromhomozygous Phb2fl/fl embryos transduced with Cre-recombinase was reported (19). Loss ofPHB2 in MEFs was accompanied by loss of PHB1, confirming their interdependence inmammalian system. Loss of PHB2 resulted in aberrant mitochondrial cristae morphogenesisand increased apoptosis, which is similar to Phb1 KO. However, loss of PHB2 in MEFs ledto impaired cellular proliferation (19). Given that these two proteins function as a complexat least in the mitochondria, it is intriguing that they should have such different effects ongrowth. Our findings are consistent with an earlier report during liver regeneration in ratswhere the expression of PHB1 is abundant in quiescent hepatocytes and nearly absent duringthe 3 to 12 hour period following 2/3 partial hepatectomy and returning to normal levels at24 hours (28). These changes correlated with entry of hepatocytes into the cell cycle andsupport the notion that a fall in PHB1 facilitates cell cycle entry and proliferation.
Based on the findings thus far, reduced PHB1 expression that occurs in the Mat1a KO liverscan contribute to liver injury, increased oxidative stress, impaired mitochondrial function,expansion of liver progenitor cells and development of HCC in the Mat1a KO mouse model(10-12,29). However, whether it also contributes to the susceptibility to develop fatty liverin the Mat1a KO mice (12) is not clear. Although there is no evidence for increased fataccumulation in Phb1 KO livers up to 14 weeks of age, there is increased plasma cholesterollevel, which may signal impairment in cholesterol uptake by the liver. This possibility willrequire further investigation.
In summary, liver-specific deletion of Phb1 results in marked liver injury at an early age thatis characterized by necrosis, apoptosis, swollen mitochondria, oxidative stress, fibrosis andincreased expression of progenitor cell and preneoplastic markers. Multi-focal HCC occursby 8 months. Marked reduction of PHB1 alters the expression of genes involved in multiplecellular pathways, ranging from growth, inflammation, and xenobiotic metabolism. Ourstudy demonstrates for the first time a vital role for PHB1 in normal liver physiology andsupports PHB1 as a tumor suppressor in liver.
Supplementary MaterialRefer to Web version on PubMed Central for supplementary material.
AcknowledgmentsFinancial support. This work was supported by NIH grants DK51719 (S. C. Lu), AA8116 (S. W. French),AT1576 (S. C. Lu and J. M. Mato), pilot/feasibility funding from the USC Research Center for Liver Diseases(P30DK48522) (B. Stiles) and SAF 2008-04800, HEPADIP-EULSHM-CT-205 and ETORTEK-2008 (J. M. Mato).Ciberehd is funded by the Instituto de Salud Carlos III. Isolated mouse hepatocytes were prepared by the CellCulture Core, while liver tissue sectioning and H&E staining were performed by the Cell and Tissue Imaging Coreof the USC Research Center for Liver Diseases (P30DK48522). Immunohistochemistry for 4-HNE, reticulin,OV-6, GSTP, and AFP were done by the Morphology Core of the Southern California Research Center forAlcoholic Liver and Pancreatic Diseases and Cirrhosis (P50AA11999). Liver-specific Phb1 KO mouse wasgenerated with the help of the Transgenic Mouse Core and Microarray was performed by the Microarray Core ofthe Norris Cancer Center at the Keck School of Medicine USC.
Ko et al. Page 9
Hepatology. Author manuscript; available in PMC 2011 December 1.
NIH
-PA Author Manuscript
NIH
-PA Author Manuscript
NIH
-PA Author Manuscript

List of abbreviations (in alphabetical order)
4-HNE 4-hydroxynonenal
AFP alpha-fetoprotein
ALP alkaline phosphatase
ALT alanine transaminase
BrDU bromodeoxyuridine
ChIP chromatin immunoprecipitation
EM electron microscopy
GSTP glutathione S-transferase Pi
HCC hepatocellular carcinoma
KO knockout
MAT methionine adenosyltransferase
MEF mouse embryonic fibroblasts
PCR polymerase chain reaction
PCNA proliferating cellular nuclear antigen
PDGF platelet-derived growth factor
PHB1 prohibitin 1
PHB2 prohibitin 2
PI3K phosphoinositide 3-kinase
ROS reactive oxygen species
SAMe S-adenosylmethionine
TIMP1 tissue inhibitor of metalloproteinase 1
VEGF vascular endothelial growth factor
REFERENCES1. Nijtmans LGJ, Sanz MA, Grivell LA, Coates PJ. The mitochondrial PHB complex: roles in
mitochondrial respiratory complex assembly, ageing and degenerative disease. Cell Mol Life Sci.2002; 59:143–155. [PubMed: 11852914]
2. Mishra S, Murphy LC, Murphy LJ. The Prohibitins: emerging roles in diverse functions. J Cell MolMed. 2006; 10:353–363. [PubMed: 16796804]
3. Nijtmans LG, de Jong L, Sanz M Artal, Coates PJ, Berden JA, Back JW, et al. Prohibitins act as amembrane-bound chaperone for the stabilization of mitochondrial proteins. EMBO J. 2000;19:2444–2451. [PubMed: 10835343]
4. Steglich G, Neupert W, Langer T. Prohibitins regulate membrane protein degradation by the m-AAA protease in mitochondria. Mol Cell Biol. 1999; 19:3435–3442. [PubMed: 10207067]
5. Wang S, Fusaro G, Padmanabhan J, Chellappan SP. Prohibitin co-localizes with Rb in the nucleusand recruits N-CoR and HDAC1 for transcriptional repression. Oncogene. 2002; 21:8388–8396.[PubMed: 12466959]
6. Fusaro G, Dasgupta P, Rastogi S, Joshi B, Chellappan S. Prohibitin induces the transcriptionalactivity of p53 and is exported from the nucleus upon apoptotic signaling. J Biol Chem. 2003;278:47853–47861. [PubMed: 14500729]
Ko et al. Page 10
Hepatology. Author manuscript; available in PMC 2011 December 1.
NIH
-PA Author Manuscript
NIH
-PA Author Manuscript
NIH
-PA Author Manuscript

7. Mishra S, Murphy LC, Nyomba BLG, Murphy LJ. Prohibitin: a potential target for newtherapeutics. TRENDS Mol. Med. 2005; 11:192–197. [PubMed: 15823758]
8. Theiss AL, Vijay-Kumar M, Obertone TS, Jones DP, Hansen JM, Gewirtz AT, et al. Prohibitin is anovel regulator of antioxidant response that attenuates colonic inflammation in mice.Gastroenterology. 2009; 137:199–208. [PubMed: 19327358]
9. McClung JK, Danner DB, Stewart DA, Smith JR, Schneider EL, Lumpkin CK, et al. Isolation of acDNA that hybrid selects antiproliferative mRNA from rat liver. Biochem Biophys Res Comm.1989; 164:1316–1322. [PubMed: 2480116]
10. Santamaria E, Avila MA, Latasa MU, Rubio A, Martin-Duce A, Lu SC, et al. Functionalproteomics of nonalcoholic steatohepatitis: mitochondrial proteins as targets of S-adenosylmethionine. Proc Nat Acad Sci USA. 2003; 100:3065–3070. [PubMed: 12631701]
11. Martínez-Chantar ML, Corrales FJ, Martínez-Cruz LA, García-Trevijano ER, Huang ZZ, Chen L,et al. Spontaneous oxidative stress and liver tumors in mice lacking methionineadenosyltransferase 1A. FASEB J. 2002; 10 1096/fj.02-0078fje.
12. Lu SC, Alvarez L, Huang ZZ, Chen L, An W, Corrales FJ, et al. Methionine adenosyltransferase1A knockout mice are predisposed to liver injury and exhibit increased expression of genesinvolved in proliferation. Proc Natl Acad Sci USA. 2001; 98:5560–5565. [PubMed: 11320206]
13. Mato JM, Lu SC. Role of S-adenosyl-L-methionine in liver health and injury. Hepatology. 2007;45:1306–1312. [PubMed: 17464973]
14. Moldeus P, Hogberg J, Orrenius S. Isolation and use of liver cells. Methods Enzymol. 1978;51:60–70. [PubMed: 672656]
15. Strauss WM. Preparation of genomic DNA from mammalian tissue. Curr Protoc Mol Biol. 2001Chapter 2:Unit 2.2.
16. Ko K, Yang H, Noureddin M, Iglesia-Ara A, Xia M, Wagner C, et al. Changes in S-adenosylmethionine and GSH homeostasis during endotoxemia in mice. Lab Invest. 2008;88:1121–1129. [PubMed: 18695670]
17. Folch J, Lees M, Stanley GH Sloane. A simple method for the isolation and purification of totallipids from animal tissues. J Biol Chem. 1957; 226:497–509. [PubMed: 13428781]
18. Ramani K, Yang H, Kuhlenkamp J, Tomasi ML, Tsukamoto H, Mato JM, et al. Changes in theexpression of methionine adenosyltransferase genes and S-adenosylmethionine homeostasis duringhepatic stellate cell activation. Hepatology. 2010; 51:986–995. [PubMed: 20043323]
19. Merkwirth C, Dargazanli S, Tatsuta T, Geimer S, Löwer B, Wunderlich FT, et al. Prohibitinscontrol cell proliferation and apoptosis by regulating OPA1-dependent cristae morphogenesis inmitochondria. Genes & Develop. 2008; 22:476–488. [PubMed: 18281461]
20. Postic C, Magnuson MA. DNA excision in liver by an albumin-Cre transgene occurs progressivelywith age. Genesis. 2000; 26:149–150. [PubMed: 10686614]
21. Wang S, Zhang B, Faller DV. BRG1/BRM and prohibitin are required for growth suppression byestrogen antagonists. EMBO J. 2004; 23:2293–2303. [PubMed: 15141164]
22. Choi D, Lee SJ, Kim IH, Kang S. Prohibitin interacts with RNF2 and regulates E2F1 function viadual pathways. Oncogene. 2008; 27:1716–1725. [PubMed: 17873902]
23. Patel N, Chatterjee SK, Vrbanac V, Chung I, Mu CJ, Olsen RR, et al. Rescue of paclitaxelsensitivity by repression of prohibitin1 in drug-resistant cancer cells. PNAS. 2010; 107:2503–2508. [PubMed: 20133800]
24. Tsutsumi T, Matsuda M, Aizaki H, Moriya K, Miyoshi H, Fujie H, et al. Proteomics analysis ofmitochondrial proteins reveals overexpression of a mitochondrial protein chaperon, prohibitin, incells expressing hepatitis C virus core protein. Hepatology. 2009; 50:378–386. [PubMed:19591124]
25. Chen L, Zeng Y, Yang H, Lee TD, French SW, Corrales FJ, et al. Impaired liver regeneration inmice lacking methionine adenosyltransferase 1A. FASEB J. 2004; 10 1096/fj.03-1204fje.
26. Narita M, Nũnez S, Heard E, Narita M, Lin AW, Hearn SA, et al. Rb-mediated heterochromatinformation and silencing of E2F target genes during cellular senescence. Cell. 2003; 113:703–716.[PubMed: 12809602]
Ko et al. Page 11
Hepatology. Author manuscript; available in PMC 2011 December 1.
NIH
-PA Author Manuscript
NIH
-PA Author Manuscript
NIH
-PA Author Manuscript

27. He B, Feng Q, Mukherjee A, Lonard DM, DeMayo FJ, Katzenellenbogen BS, et al. A repressiverole for prohibitin in estrogen signaling. Mol. Endocrinol. 2008; 22:344–360. [PubMed:17932104]
28. Tanno S, Fukuda I, Saito Y, Ogawa K. Prohibitin expression is decreased in the regenerating liverbut not in chemically induced hepatic tumors in rats. Jpn J Cancer Res. 1997; 88:1155–1164.[PubMed: 9473733]
29. Rountree CB, Senadheera S, Mato JM, Crooks GM, Lu SC. Expansion of liver cancer stem cellsduring aging in methionine adenosyltransferase 1A-deficient mice. Hepatology. 2008; 47:1288–1297. [PubMed: 18167064]
Ko et al. Page 12
Hepatology. Author manuscript; available in PMC 2011 December 1.
NIH
-PA Author Manuscript
NIH
-PA Author Manuscript
NIH
-PA Author Manuscript

Fig 1.Confirmation of deletion of Phb1 in DNA, mRNA and protein levels. Genotyping of Phb1exon 2 region including loxP flanking Phb1 exon 2 sites shows the same size of bands(predicted 731 bp) in all of the organs tested (A, left) in WT control mice. However, deletionof loxP flanking Phb1 exon 2 sequence (predicted 334 bp) is detected only in liver andhepatocytes but not in other organs from liver-specific Phb1 KO mice (A, right), whichindicated that Phb1 exon 2 is deleted only in the liver of liver-specific Phb1 KO mice.Northern blots of total RNA from the livers of WT control and liver-specific Phb1 KO miceshow that Phb1 exon 2 is significantly removed in the livers of liver-specific Phb1 KO micecompared to those of WT control littermates (B, left). The graph on the right showsdensitometric changes in % of WT control, which is expressed as mean±SEM from 2 ineach group (B, right), *p<0.01. Protein expression of PHB1 and PHB2 by Western blotsshows only PHB1 protein expression is dramatically decreased in whole livers andhepatocytes, but not in kidney (C, top). PHB2 expression is also decreased along with PHB1protein in the whole livers and hepatocytes in liver-specific Phb1 KO mice (C, top). Thegraph shows densitometric changes in % of WT control, which is expressed as mean±SEMfrom 2 mice each for kidneys and hepatocytes and 8 mice each for livers (C, bottom),*p<0.01.
Ko et al. Page 13
Hepatology. Author manuscript; available in PMC 2011 December 1.
NIH
-PA Author Manuscript
NIH
-PA Author Manuscript
NIH
-PA Author Manuscript

Fig 2.Histologic changes in liver-specific Phb1 KO livers. A to D (×400), E (×800) and F (×200)show H&E staining of livers from 3-week old WT control (A) and liver-specific Phb1 KO(B to E) mice (except for F, 14-week old KO). Characteristic findings in liver-specific Phb1KO livers are (B) foci of necrosis, (C) increased inflammatory cell infiltrate, (D) bile ductmetaplasia as indicated by arrow, and (E) anisocytosis (varying sizes) of hepatic nuclei asindicated by arrows, consistent with hepatocyte dysplasia. Consistent with this, 14-week oldKO mouse exhibits dysplastic nodule (F, ×200).
Ko et al. Page 14
Hepatology. Author manuscript; available in PMC 2011 December 1.
NIH
-PA Author Manuscript
NIH
-PA Author Manuscript
NIH
-PA Author Manuscript
Fig 3.Liver-specific Phb1 livers exhibit increased staining for oval cell and preneoplastic markers.OV6 staining is negative in 3-week old WT control (A, ×800) but positive in 3-week old KOmice (bright green staining, B, ×800). GSTP staining with DAPI co-staining for nucleishows negative GSTP in 3-week old WT control (C, ×800) but positive cells in 3-week oldKO (D, red staining, ×800). Note these GSTP positive cells are also OV6 positive (B). Aand C show the same microscopic field as B and D, double OV6/GSTP immunofluorescentstaining. AFP staining was negative in 38-week old WT control (E, ×400) but stronglypositive in KO (F, ×400).
Ko et al. Page 15
Hepatology. Author manuscript; available in PMC 2011 December 1.
NIH
-PA Author Manuscript
NIH
-PA Author Manuscript
NIH
-PA Author Manuscript
Fig 4.Changes in liver-specific Phb1 KO livers from 3-week to 14-week of age. Apoptosis isdetected by immunohistochemical staining for active caspase 3 (top row, ×200). SlightlyIncreased number of active caspase 3 positive cells (brown staining) was found in the liverof 3-week old liver-specific Phb1 KO mouse, which progressed as the mice aged.Proliferation is detected by immunohistochmical staining for PCNA (middle row, ×400).Liver-specific Phb1 KO mice have more PCNA positive cells (brown staining) regardless oftheir age than those of their control littermates. Fibrosis is detected by reticulin staining(bottom row, ×200 except for 14-week WT, ×400). Significant amount of reticulin isaccumulated in the liver of 3-week old liver-specific Phb1 KO mouse, which progressed inthe 14-week old KO livers.
Ko et al. Page 16
Hepatology. Author manuscript; available in PMC 2011 December 1.
NIH
-PA Author Manuscript
NIH
-PA Author Manuscript
NIH
-PA Author Manuscript

Fig 5.Development of HCC in the liver-specific Phb1 KO mice and PHB1 expression in humanliver cancer cell lines. Histologic changes on H&E are shown below the gross picture ofeach liver. A shows no significant change in the liver of WT mouse on gross or histologicexam (×200). B shows multiple nodules (arrows) on the surface of the liver of a 35-week oldKO mouse, one of which shows well differentiated HCC with fat deposit on H&E staining(×400). C shows different stages of HCC development in the liver of a 46-week KO mouse(arrows), where neoplastic cells (arrows) are clearly observed on H&E staining (×800), andD shows multi-focal HCC in a 38-week KO mouse by gross exam (arrows) and on H&E(×600). PHB1 protein level as determined by Western blot analysis (E) is much lower inHuh-7 and HepG2 cells as compared to normal primary human hepatocytes (PHH).Densitometric analyses from three independent experiments are shown below the blot andare expressed as mean±SEM % of PHH, p<0.05 between Huh-7 or HepG2 and PHH.
Ko et al. Page 17
Hepatology. Author manuscript; available in PMC 2011 December 1.
NIH
-PA Author Manuscript
NIH
-PA Author Manuscript
NIH
-PA Author Manuscript

Fig 6.Effects of Phb1 siRNA treatment in AML12 cell line. AML12 cells were treated withsiRNA of Phb1 for 18 (expression) or 24 (growth and ChIP) hours. PHB1 mRNA level wasreduced by 90% as compared to control and scrambled siRNA (SC) (A, n=6) and PHB1protein expression decreased by 30% (B, n=3). C (n=4 to 6) shows mRNA levels in Phb1siRNA treated AML12 cells for the genes that are up- or down-regulated most in the liversof liver-specific Phb1 KO mice. All of mRNA expression changes in C are statisticallysignificant against control and/or scrambled siRNA (p<0.05, Supplement Table 3). D showsPhb1 siRNA treated AML12 cells have increased proliferation rate measured by BrDUincorporation into DNA for 4 hours (n=4). *p<0.005 vs. control and scrambled siRNA. Eshows the effect of Phb1 siRNA on E2F binding to different regions of the cyclin D1promoter (numbers are in reference to the transcription start site). E2F binding is increasedin all four regions but particularly to the region −513~−697. These changes were measureddensitometrically and were significantly different from SC control with p<0.05.
Ko et al. Page 18
Hepatology. Author manuscript; available in PMC 2011 December 1.
NIH
-PA Author Manuscript
NIH
-PA Author Manuscript
NIH
-PA Author Manuscript
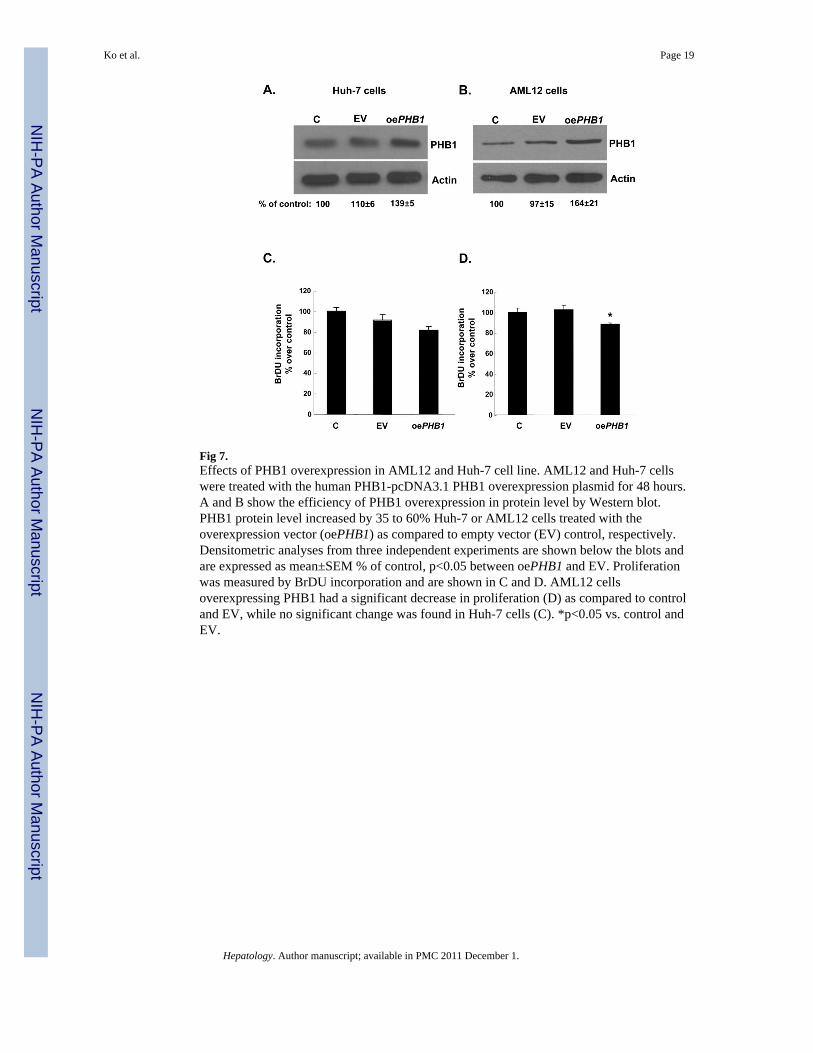
Fig 7.Effects of PHB1 overexpression in AML12 and Huh-7 cell line. AML12 and Huh-7 cellswere treated with the human PHB1-pcDNA3.1 PHB1 overexpression plasmid for 48 hours.A and B show the efficiency of PHB1 overexpression in protein level by Western blot.PHB1 protein level increased by 35 to 60% Huh-7 or AML12 cells treated with theoverexpression vector (oePHB1) as compared to empty vector (EV) control, respectively.Densitometric analyses from three independent experiments are shown below the blots andare expressed as mean±SEM % of control, p<0.05 between oePHB1 and EV. Proliferationwas measured by BrDU incorporation and are shown in C and D. AML12 cellsoverexpressing PHB1 had a significant decrease in proliferation (D) as compared to controland EV, while no significant change was found in Huh-7 cells (C). *p<0.05 vs. control andEV.
Ko et al. Page 19
Hepatology. Author manuscript; available in PMC 2011 December 1.
NIH
-PA Author Manuscript
NIH
-PA Author Manuscript
NIH
-PA Author Manuscript

Fig 8.Effects of Phb1 siRNA and sorafenib (SF) treatments in Huh-7 cells. Huh-7 cells weretreated with Phb1 siRNA or SC for 48 hours and sorafenib was added during the last 24hours. PHB1 siRNA reduced PHB1 protein level by 50% as shown on Western blot (A, n=3,results are mean±SEM densitometric values expressed as % of control). B shows % overcontrol apoptosis in Huh-7 cells treated with siPHB1 or SC control, with or without SF.Randomly selected 10× optic magnification fields were taken and apoptotic cells to normalcells ratio was calculated in 4 fields in each group. siPHB1 treatment did not affectapoptosis or sensitize cells to apoptosis induced by SF. C shows proliferation changes insimilarly treated Huh-7 cells. SF inhibited proliferation and this was not affected by siPHB1.*p<0.05 vs. DMSO control.
Ko et al. Page 20
Hepatology. Author manuscript; available in PMC 2011 December 1.
NIH
-PA Author Manuscript
NIH
-PA Author Manuscript
NIH
-PA Author Manuscript
NIH
-PA Author Manuscript
NIH
-PA Author Manuscript
NIH
-PA Author Manuscript
Ko et al. Page 21
Table 1
Physical and biological changes in 3-week old liver-specific Phb1 KO mice
Mean ± SEM WT KO p value
Relative liver weight (%) 4.4 ± 0.2 5.4 ± 0.2 0.004
Plasm a bilirubin (μmol/L) 8.7 ± 1.8 46.3 ± 9.1 0.01
Plasma ALT (U/L) 29.8 ± 5.1 250 ± 33.2 0.00003
Plasma ALP (U/L) 134 ± 12.4 532 ± 112 0.04
Plasma cholesterol (mg/dL) 136 ± 6.5 233 ± 23 0.002
Hepatic cholesterol (μg/μg DNA/g liver) 1.8 ± 0.2 1.2 ± 0.6 0.4
Plasma triglyceride (mg/dL) 141 ± 13.6 140 ± 14.9 0.95
Hepatic triglyceride (μg/μg DNA/g liver) 3.0 ± 0.4 1.7 ± 0.8 0.15
Results are expressed as mean±SEM from 3 to 10 WT controls and 6 to 15 liver-specific Phb1 KO mice with p values shown in right column.
Hepatology. Author manuscript; available in PMC 2011 December 1.

NIH
-PA Author Manuscript
NIH
-PA Author Manuscript
NIH
-PA Author Manuscript
Ko et al. Page 22
Tabl
e 2
Con
firm
atio
n of
gen
e ex
pres
sion
cha
nges
by
QR
T-PC
R
Gen
esA
cces
sion
Num
ber
Mic
roar
ray
Fold
Cha
nges
p V
alue
QR
T-P
CR
Fold
Cha
nges
SEM
p V
alue
H19
NR
_001
592.
114
6.8
<0.0
0000
0125
2.8
48.3
0.00
2
CD
C20
NM
_023
223.
114
.80.
0000
0125
.312
.70.
076
LPL
NM
_008
509.
214
.50.
0009
3.5
0.9
0.04
PRC
1N
M_1
4515
0.1
11.4
0.00
0006
36.4
6.3
0.03
AN
XA
2N
M_0
0758
5.3
11.1
0.00
0005
10.1
1.5
0.00
1
TUB
B2B
NM
_023
716.
28.
70.
0000
013.
10.
20.
004
TIM
P1N
M_0
1159
3.2
5.1
0.00
004
11.2
2.0
0.00
2
IGF2
BP3
NM
_023
670.
25.
10.
0005
2.5
0.3
0.02
GA
DD
45A
NM
_007
836.
14.
70.
001
5.8
1.2
0.00
7
CC
ND
1N
M_0
0763
1.2
4.0
0.00
24.
00.
50.
006
EGR
1N
M_0
0791
3.5
3.4
NA
4.6
0.9
0.06
RA
SAL1
NM
_013
832.
33.
20.
0000
0358
.18.
30.
0005
SRC
NM
_001
0253
95.2
2.8
0.00
032.
80.
40.
02
KR
T18
NM
_010
664.
12.
20.
0000
31.
50.
10.
03
CD
83N
M_0
0985
6.1
1.8
0.00
012.
40.
50.
034
CO
L4A
1N
M_0
0993
1.1
6.0
0.00
07N
AN
AN
A
CO
L6A
1N
M_0
0993
3.2
5.4
0.00
06N
AN
AN
A
CO
L5A
1N
M_0
1573
4.1
4.2
0.00
03N
AN
AN
A
CO
L4A
2N
M_0
0993
2.2
3.8
0.00
02N
AN
AN
A
CO
L1A
1N
M_0
0774
2.2
3.4
0.00
03N
AN
AN
A
CO
L6A
2N
M_1
4600
7.1
1.9
0.00
03N
AN
AN
A
CO
L1A
2N
M_0
0774
3.2
NA
NA
6.1
0.6
0.00
7
p53
NM
_011
640.
1N
AN
A1.
50.
20.
02
CY
P4A
12A
NM
_177
406.
3−110.4
<0.0
0000
01−20.4
8.0
0.04
CY
P2F2
NM
_007
817.
2−9.7
0.00
01−42.0
9.2
0.00
01
UG
T3A
2N
M_1
4484
5.3
−8.7
0.00
0002
−35.5
10.1
<0.0
0000
01
Qua
ntita
tive
real
-tim
e PC
R (Q
RT-
PCR
) was
don
e in
3 W
T co
ntro
ls a
nd 7
Phb
1 K
Os.
See
Supp
lem
enta
l Tab
le 1
for g
ene
nam
es.
Hepatology. Author manuscript; available in PMC 2011 December 1.