LITERATURE REVIEW A1.1 General - Transportation ...
80
NCHRP 12-96, Final Report A-1 APPENDIX A: LITERATURE REVIEW A1.1 General ............................................................................................................................ A-2 A1.2 Examples of innovative connection details and full depth precast deck panel systems developed in the past 25 years........................................................................... A-3 A1.2.1 NCHRP 12-41: University of Nebraska-Lincoln (1994-1998)........................ A-3 A1.2.2 University of Illinois at Chicago (1998-2006) ................................................. A-5 A1.2.3 NCHRP 12-65: George Washington University/University of Nebraska- Lincoln (2003-2008) ........................................................................................ A-6 A1.2.4 PCI Northeast Chapter ................................................................................... A-10 A1.2.5 Virginia Polytechnic Institute and State University (2007-2011).................. A-11 A1.2.6 Purdue University (2008- 2010) .................................................................... A-12 A1.2.7 Utah State University (2010-2012) ................................................................ A-13 A1.2.8 Nebraska Department of Roads/University of Nebraska-Lincoln (2013) ..... A-14 A1.2.9 Princess Margaret Bridge Rehabilitation (2012) ........................................... A-18 A1.2.10 NCHRP 12-69: Longitudinal Joints of Integral Deck Bulb Tees (2009)....... A-20 A1.2.11 FHWA: UHPFRC for Prefabricated Bridge Component Connections.......... A-21 A1.2.11.1 Panel-to-Girder Composite Connection Detail ............................ A-22 A1.2.11.2 Panel-to-Panel Connection Detail ............................................... A-27 A1.3 Shear Connector Spacing ................................................................................................. A-28 A1.4 Suehiro Viaduct, Kansai International Airport Line, Japan ............................................ A-29 A1.5 FHWA Experimental Program ........................................................................................ A-32
-
Upload
khangminh22 -
Category
Documents
-
view
1 -
download
0
Transcript of LITERATURE REVIEW A1.1 General - Transportation ...

NCHRP 12-96, Final Report A-1
APPENDIX A: LITERATURE REVIEW
A1.1 General ............................................................................................................................ A-2
A1.2 Examples of innovative connection details and full depth precast deck panel systems developed in the past 25 years........................................................................... A-3
A1.2.1 NCHRP 12-41: University of Nebraska-Lincoln (1994-1998) ........................ A-3
A1.2.2 University of Illinois at Chicago (1998-2006) ................................................. A-5
A1.2.3 NCHRP 12-65: George Washington University/University of Nebraska-Lincoln (2003-2008) ........................................................................................ A-6
A1.2.4 PCI Northeast Chapter ................................................................................... A-10
A1.2.5 Virginia Polytechnic Institute and State University (2007-2011) .................. A-11
A1.2.6 Purdue University (2008- 2010) .................................................................... A-12
A1.2.7 Utah State University (2010-2012) ................................................................ A-13
A1.2.8 Nebraska Department of Roads/University of Nebraska-Lincoln (2013) ..... A-14
A1.2.9 Princess Margaret Bridge Rehabilitation (2012) ........................................... A-18
A1.2.10 NCHRP 12-69: Longitudinal Joints of Integral Deck Bulb Tees (2009) ....... A-20
A1.2.11 FHWA: UHPFRC for Prefabricated Bridge Component Connections.......... A-21
A1.2.11.1 Panel-to-Girder Composite Connection Detail ............................ A-22
A1.2.11.2 Panel-to-Panel Connection Detail ............................................... A-27
A1.3 Shear Connector Spacing ................................................................................................. A-28
A1.4 Suehiro Viaduct, Kansai International Airport Line, Japan ............................................ A-29
A1.5 FHWA Experimental Program ........................................................................................ A-32

NCHRP 12-96, Final Report A-2
A1.1 General Public inconvenience and loss of income during bridge construction and rehabilitation have prompted exploration of rapid construction methods. In 2001, Federal Highway Administration (FHWA) launched the Accelerated Bridge Construction (ABC) initiative (Accelerated Bridge Construction Manual, FHWA 2011). ABC is bridge construction that uses innovative planning, design, materials, and construction methods in a safe and cost-effective manner to reduce the construction time associated with maintenance of traffic when building new bridges or replacing and rehabilitating existing bridges.
Cast-in-place (CIP) bridge deck slab represents a significant part of construction of stringer-type bridge superstructures as much of the construction time is consumed in deck forming, placement and tying of steel bars, and placement and curing of CIP deck concrete. Also, studies conducted by bridge owners, such as Oregon DOT (Johnson 2012), have shown that CIP deck is considered one of the major elements of highway bridges that require continuous maintenance, i.e. patching, sealing, and overlays. This is because CIP deck poses low durability performance due to shrinkage cracking and high permeability.
As a result, full-depth precast concrete deck panel systems have been increasingly used to replace CIP decks to enhance speed of deck construction. In addition to high construction speed, full-depth precast concrete deck panel systems have many advantages such as high quality plant production under tight tolerances, low permeability, and much reduced volume changes cracking due to shrinkage and temperature effects during initial curing. High quality precast concrete decks, often two-way prestressed, have a lower life-cycle cost even though they may have higher costs in some US market. As a result, use of full-depth precast concrete deck panel systems have been steadily increasing, specially, over the past 10 years.
Development of the full-depth, precast concrete deck panel systems has been made in three distinct periods. The first period was from early 1960s to early 1980s, where no standard geometry, connection details or specifications were used. The second stage was from early 1980s to the end of the second millennium, where more experimental efforts were set towards studying the structural behavior of full-depth precast concrete deck panel systems made composite with the supporting girders (Issa et al. PCI J. 1995, Issa et al. PCI J. 1998). Towards the end of the second stage, new innovative ideas of connecting the precast panels with the supporting girders were developed, such as the development of the large size 1.25 in. diameter steel studs (Badie et al. ASCE BJ 2002), the dovetail steel connection (Tadros & Baishya NCHRP 407, 1998) and the debonded shear key detail for concrete I-girders (Tadros et al. PCI J. 2002). Also, during this era new full-depth precast concrete deck panel systems that have high construction speed were developed and tested (Yamane et al. PCI J. 1998, Badie et al. PCI J. 1998, Badie et al. ACI CI 1999).
The third period started in 2000 and has continued since then. Most of the research activities in this period have been focused on developing standard geometry and connection details that ensure high construction speed (overnight construction) and reduced future maintenance. Among these efforts were research conducted at the University of Wisconsin Madison (Carter III et al. PCI J. 2007), research conducted jointly by the George Washington University and University of Nebraska-Lincoln (Badie & Tadros, NCHRP 584, 2008), research conducted at Purdue University (Frosch et al. 2010), research conducted at Virginia Tech. (Scholz et al. VTRC 2007, Sullivan et al. PCI J. 2011), research conducted at Utah State University (Wells et al. 2012),

NCHRP 12-96, Final Report A-3
and the in-progress research being conducted at University of Nebraska-Lincoln. The goals of these research projects can be summarized as follows: (1) examine the possibility of extending the spacing of the shear pockets, (2) simplify panel-to-panel and panel-to-girder connection details, and (3) develop recommended guidelines for design, detailing, fabrication, installation, and construction for the AASHTO LRFD Bridge Design Specifications (ASSHTO LRFD 2017).
A summary of the notable relevant connection details for full-depth precast concrete deck panel systems developed in the past 25 years is given in the following sections. More information can be found in the following references (Issa et al. PCI J. 1995, Tadros & Baishya NCHRP 407 1998, Markowski et al. 2005, Carter III et al. PCI J. 2007, Scholz et al. VTRC 2007, Badie & Tadros, NCHRP 584- 2008, Sullivan et al. PCI J. 2011, Frosch et al. 2010, Wells et al. 2012). A summary of these details and systems can be found in the state-of-the-art repot on full-depth precast concrete deck panels (PCI SOA -01-1911, 2011). Also, useful cast-in-place connection details can be found in NCHRP 10-71 (French et al. 2011). Although the research conducted in the NCHRP 10-71 was for precast/pretensioned members connected longitudinally, some of the developed connection details can be used for full depth precast concrete deck panels supported by concrete/steel girders.
A1.2 Examples of innovative connection details and full depth precast deck panel systems developed in the past 25 years
A1.2.1 NCHRP 12-41: University of Nebraska-Lincoln (1994-1998) The major goal of the NCHRP 12-41 project was to develop precast deck panel systems with connection details that provide for rapid replacement of bridge decks (Tadros & Baishya NCHRP 407 1998). The following products were developed and experimentally validated.
(1) Debonded shear key system for prestressed concrete bridge girders made composite with the concrete deck (Tadros et al. PCI J 2002): The system utilizes the mechanical anchorage of concrete shear keys created on the top flange of a concrete girder combined with shear reinforcement crossing the interface, as shown in Figure 1. Sealant is applied to the top surface of the girder to break the bond between the top flange and the concrete deck. The system has the advantage of facilitating future deck removal, while protecting the top flange of the girder from damage. Although this system was developed for CIP deck slabs, it can be used also with full depth precast deck panel systems.
(2) Large size 1.25 inch diameter shear studs for composite action in steel girders (Badie et al. ASCE BJ 2002, Badie et al. AISC J. 2007): Shear studs used in composite steel bridge construction are typically 3/4 in. or 7/8 in. in diameter. This researcher developed the 1.25 in. diameter stud, as shown in Figure 2, because it has about twice the strength and a higher fatigue capacity than the 7/8 in. diameter stud. Thus, fewer studs are required along the length of the steel girder. This would increase bridge construction speed in future deck replacement, and reduce the possibility of damage to the studs and girder top flange during deck removal. The idea of using large size bars as shear connectors was extended to concrete girders in NCHRP 12-65 (Badie & Tadros NCHRP 584) as will be discussed later in this section.
(3) NUDECK System: The system was originally a continuous partial depth system (Badie et al. PCI J 1998), but quickly evolved into a full-depth system (Fallaha et al. PCI J 2004). The deck panels are typically 8 in. thick and use a female-to-female transverse joint, as shown in Figure 3. The connection to the supporting structure is accomplished through an 8 in. wide gap over the girder that runs the length of the panel where shear connectors are extended in the gap, as shown in Figure 2. The system is pretensioned transversely.

NCHRP 12-96, Final Report A-4
(4) In the longitudinal direction, the system can be post-tensioned where the post-tensioning tendons are provided in the 8-in. gap over the girder lines as shown in Figure 2, or it can be conventionally reinforced by splicing the longitudinal bars utilizing high strength spirals as shown in Figure 4 (Badie 1997).
(5) Full depth precast deck panel system (Yamane et al. PCI J 1998): This system provides a stemmed precast panel provided with blind shear pockets. The shear connectors and pockets were designed to create full composite action with the supporting girders utilizing a mix of headed and headless studs to facilitate deck removal. The system is transversely pretensioned and longitudinally post-tensioned.
Figure 1. Debonded shear key system (Tadros et
al. PCI J 2002) Figure 2. 1.25 inch studs used on the Skyline
Bridge, Omaha, NE (Fallaha et al. PCI J 2004)
Figure 3. Full-depth NUDECK System
Figure 4. Splicing longitudinal bars using high strength spirals (Badie 1997)

NCHRP 12-96, Final Report A-5
A1.2.2 University of Illinois at Chicago (1998-2006)
Issa et al. (PCI J. 1998) performed finite element modeling of both simply supported and continuous bridge spans. The purpose was to determine the amount of longitudinal post-tensioning required to keep the transverse joints of precast bridge deck panels in compression. The modeled simple span bridge was the Culpeper Bridge in VA, which spans 54.5 ft and is 30 ft wide. The modeled continuous span bridge was the Well and River Bridge, located near the city of Niagara Falls. Both modeled bridges had steel girders as the deck support structure. Based on the finite element models, it was determined that a minimum compressive stress in the deck of 200 psi is required for simply supported spans and 450 psi for the interior supports of continuous spans. The design recommendations have been used by the Illinois Department of Transportation in at least five bridge deck replacement projects.
Issa et al. (PCI J. 2003) conducted 28 push-out tests consisting of 14 full scale and 14 quarter scale specimens. The precast panels were connected to each flange of an A36 steel beam using welded shear studs, as shown in Figure 5. The variables tested include the number of shear studs in each pocket and also the number of pockets present on the specimen. The pocket spacing was kept consistent at 2 ft. Therefore, as the number of pockets increased, so did the length of the specimen. The study provided several findings. First, the number of shear studs in each pocket does not proportionally increase the load capacity. Second, the load necessary to induce slippage is affected by the configuration and number of studs in the pocket. Third, the ultimate strength increases with an increase in the number of shear pockets. However, the rate of increase is dependent on the number of shear studs per pocket. Finally, the AASHTO LRFD specifications are conservative in determining horizontal shear resistance of shear connectors. The authors also stated that push-off specimens with up to two grout pockets are reliable in evaluating composite behavior.
Issa et al. (PCI J. 2006) conducted 11 small scale tests on a panel-to-concrete girder connection. The specimens consisted of a concrete girder section with a precast panel attached to either side, as shown in Figure 6. The tests evaluated the effect of the number and configuration of shear studs per pocket on the shear strength of the connection, as well as embedment depth of the shear stud in the panel. The test results showed that: (1) the shear strength of the connection increased proportionally with the number of studs, (2) the configuration of shear studs in the pocket affected the load at which slippage was induced, (3) the embedment depth of the shear stud in the panel affected the amount of slippage the specimen could undergo before failure, and (4) threaded bolts could be used as a shear stud for use with concrete girders.
Figure 5. Push-out specimen used by Issa et al. (PCI J. 2003)

NCHRP 12-96, Final Report A-6
Figure 6. Push-out specimen used by Issa et al. (PCI J. 2006)
A1.2.3 NCHRP 12-65: George Washington University/University of Nebraska-Lincoln
(2003-2008) The objectives of the NCHRP 12-65 project (Badie & Tadros, NCHRP 584, 2008) were to develop: (a) recommended guidelines and LRFD specifications language for design, fabrication and construction of full-depth, precast-concrete bridge deck panel systems without the use of post-tensioning or overlays, and (b) connection details for new deck panels systems that can be summarized as follow:.
(1) Panel-to-panel connection details: Two panel-to-panel connection details were developed. The connection details were developed to splice the longitudinal reinforcing bars to fully develop their yield strength while minimizing the required development length utilizing steel tubes to confine the spliced bars, as shown in Figure 7. Detail #1 uses a hidden steel tube on one edge of the panel and the longitudinal bars extend outside the panel on the other edge. Detail #2 uses a hidden steel tube, on both edges that are provided with a top surface slot where the splice bar can be inserted. This detail has been used successfully on implementation bridges by TX DOT and Utah DOT, as shown in Figure 8. These details provide minimum exposure of the grouted area to the environment and full longitudinal continuity of the panels without using longitudinal post-tensioning.

NCHRP 12-96, Final Report A-7
Figure 7. Panel-to-panel connection details developed in NCHRP 584 (Badie & Tadros 2008)
Figure 8. NCHRP 584 panel-to-panel connection Detail #2 used on Live Oak Bridge, TX
(2) Panel-to-girder connection details: New connection details were developed based on extending the spacing between shear pockets to 48 inches that exceeds the 24 inch LRFD specification limit (Badie et al. ASCE BJ 2010, Badie et al. ASCE BJ 2011). The analytical and experimental programs conducted using these details with the extended spacing showed that full composite action can be achieved. The panel-to-concrete girder connection detail was developed using a cluster of three 1¼ in. double headed studs embedded in the top flange of the concrete girder, as shown in Figure 9. This detail solves the mismatching problem currently encountered between the vertical shear reinforcement of the girder and the shear pockets of the precast panels.
1'-2" 2'-0" 1'-7" 2'-0" 1'-2"
9 1/2" 9" 9 1/2" 9 1/2"9 1/2" 5" 5" 5" 5"
3 3/
4"4
1/4"
3/4"1 1/4"3/4" 1'-0"
HSS 4x12x3/8", 4" long with top slot
Detail 1: using hidden steel tube #6 bar @ 13.33 in.
3/4"
1'-2" 2'-0" 1'-7" 2'-0" 1'-2"
9 1/2" 9" 9 1/2" 9 1/2"9 1/2" 5" 5" 5" 5"
3 3/
4"4
1/4"
7 1/2"
6 3/4"
1" grouting pipe
HSS 4x12x3/8", 4" long
Detail 2: using hidden steel tube with a top slot
1/2" strand #5 bar #6 bar
1/2" strand #5 bar #6 bar
#6, 24.5" longsplic e bar
2'-0"
Deta il D 2
3 3/
4"4
1/4"
+1/4
"*
11 1/2" 1" 11 1/2"
X2
X2
#6 #6
11" 11"
1'-0"
#6
1"3/4"1'-0"
7 1/2"
Detail 1: using hidden steel tube Detail 2: using hidden steel tube with a top slot

NCHRP 12-96, Final Report A-8
The panel-to-steel girder connection detail was developed using 1¼ in. (31.8 mm) studs clustered in group 48 in. apart, as shown in Figure 9. This detail was used by some state DOTs such Utah DOT and TX DOT.
Figure 9. NCHRP 584 panel-to-girder connection for steel & concrete girders (Badie & Tadros
2008)
(3) Full depth panel systems: Two systems were developed. Both systems do not use longitudinal post-tensioning. The first system is transversely pretensioned with discrete shear pockets at 48 inch spacing and uses the connection details shown in Figures 5 to 7.
The second system is conventionally reinforced in both directions. The precast panel has a hidden (blind) continuous channel at the girder lines to house the shear connectors extending from the girder top flange into the deck. After the precast panels are installed and their elevation is adjusted using leveling screws, the continuous channels are filled with non-shrink grout through grouting pipes. The panel has three layers of reinforcement, two transverse layers (top & bottom) for the flexural design of the deck, and one longitudinal layer provided at the middle.
5"
3" + 1/4" **
1"
1'-0"
2" groutingpipe
1 1/4" double headed stud
Section E-E1" backer rod
4 1/
2"9
1/2"
Pane l- to-steel girder connetion
Pane l- to-concrete girder connetion
5" 3 1/2"3 1/2"
1'-0"
1 1/4" studs
1"
2" groutingpipe
Section E-E
5"3"
+1/4
"*
Light weight angles used as grout barrier and to adjust for the panel e leva tion
Rectangular bar
Top sur face of the concrete girder flange 3- 1 1/4" double headed studs
5"
1'-2" 2'-0" 1'-7" 2'-0" 1'-2"
9 1/2" 9" 9 1/2" 9 1/2"9 1/2" 5" 5" 5" 5"
3"+1
/4"*3/4" vent 2" grouting pipe
1'-4 1/2" 1'-2" 2'-10" 1'-2" 1'-4 1/2"
7" 7"7" 7"
HSS 14x10x1/4", 6" high piece
1"
5"3"
+1/4
"*
3" 4" 4" 3"
Pane l- to-concrete girder connetion
Pane l- to-concrete girder connetion
1'-2" 2'-0" 1'-7" 2'-0" 1'-2"
9 1/2" 9" 9 1/2" 9 1/2"9 1/2" 5" 5" 5" 5"
1'-4 1/2" 1'-2" 2'-10" 1'-2" 1'-4 1/2"
7" 7"7" 7"
9" 2 1/2"2 1/2" 8- 1 1/4" studs
5"3"
+1/4
"*3/4" vent 2" grouting pipe HSS 14x10x1/4", 6" high piece
1"
5"3"
+1/4
"*
Top sur face of the steel girder flange
Pane l- to-steel girder connetion

NCHRP 12-96, Final Report A-9
The longitudinal reinforcement is spliced at the transverse edges of the panel using a mechanical coupling system that utilizes a steel tube and heavy duty nuts. Details of this system are provided in Figures 10 and 11.
Figure 10. NCHRP 584 panel-to-girder connection of the second system (Badie & Tadros 2008)
3"5"
9'-0"
Top surface of the flange of the concrete girder
K
K
3"5"
9'-0"
Section K-K
5"3"
+ 1
/4" *
1'-0"
Steel studs
1"
2" groutingpipe
5"1"
1'-0"
Shear connector
3" +
1/4
" *2" groutingpipe
2"
Top surface of the flange of the steel girder
5 1/
2"
K
K
1/2" strand #5 bar

NCHRP 12-96, Final Report A-10
Figure 11. NCHRP 584 panel-to-panel connection of the second system (Badie & Tadros 2008)
A1.2.4 PCI Northeast Chapter In 2001, the Northeast chapter of PCI published the first edition of “Full Depth Deck Panels Guidelines for Accelerated Bridge Deck Replacement or Construction” (PCINER-11-FDDP 2011). The second edition of this publication was released in 2011. Appendix A of this publication provides details for various components of full depth precast deck panel systems. Among them is the following panel-to-girder connection for concrete girders, where a steel plate is installed on the top surface of the concrete girder, as shown in Figure 12. The steel plate is anchored to the top flange using headed steel studs. The shear connection between the precast deck and the concrete girder is established using headed steel studs welded to the steel plate and embedded in the precast panel shear pockets. These studs can be welded to the steel plate before the precast panels are installed, if hidden (blind) shear pockets are used, or after the panels are installed, if open shear pockets are used.
Figure 12. Panel-to-girder connection details provided in PCINER-11-FDDP 2011
8'-11"
9'-0"
5"
1/2" 1/2"
#8 bar with 5" longthread ends
2"1"
10"
3/4"
3/4"6" 4" 4"
4"4"2"
6"+
1/4"
*
1/4" 1/4"
HSS 8x4x3/16", A36
9"
8 5/8"
1/4"2" 2 5/8" 2"
1/4"
4"
3 5/
8"
? =
2"
3" 2"
??
= 1
1/4"
Section G-G
1" ? ? all thread bar,150 ksi
Section F-F
6" +
1/4
" *
2 1/4"
3 1/2"
1/4"
HSS 8x4x3/16"GG
1"? ? Hex nut with1/4" thick washer
F1"1/
2"1/
2"
F
4"4"
2"
6"5"1/
2"1/
2"
3/4"
8"

NCHRP 12-96, Final Report A-11
A1.2.5 Virginia Polytechnic Institute and State University (2007-2011) The goals of the study conducted at Virginia Tech. (Scholz et al. FHWA/VTRC 2007 ,Sullivan et al. PCI J 2011) were to: (1) examine the possibility of extending the spacing between the shear pockets beyond the 24 inch limit mandated by the LRFD Specifications, (2) study the structural behavior of the shear connection developed by the PCI Northeast region (shown in Figure 10), (3) compare the structural behavior of a match cast panel-to-panel connection detail with that of a male-female grouted connection. A full scale mockup was built and tested in the lab, as shown in Figure 13. The panels were post-tensioned longitudinally. Test results showed that: (1) full composite action is achievable using either hooked reinforcing bars or shear studs as shear connectors in both 2 ft pocket spacing and 4 ft pocket spacing, (2) although the match cast and male-female panel-to-panel connection details showed almost similar performance, the researchers recommends using the female-female connection detail as it provides high fabrication and construction tolerances. The research also recommended new formulas to design for the horizontal shear connection between the steel plane and the supporting girder and between the steel plane and the precast panel.
Figure 13. Full scale mock up used by Sullivan et al. (PCI J 2011)

NCHRP 12-96, Final Report A-12
A1.2.6 Purdue University (2008- 2010) The researcher in this project (Frosch et al. 2010) tried to overcome some of the fabrication, construction and durability issues exist with the details developed by other research projects. One of these issues is penetration of the shear pockets and transverse panel-to-panel connection to the top surface of the deck that may affect the long term durability of the finished product. Although hidden (blind) shear pockets, as those developed in NCHRP 584 can be used to reduce the scale of the problem, they complicate fabrication of the panels and block visual inspection of the grout.
The research program was conducted in four phases. First, the New England Region (NER) system was evaluated in a series of large scale tests in which the panels were placed on a 40 ft prestressed concrete girder and subjected to three-point loading to evaluate its constructability and composite behavior. Second, the strength and geometry of the current and a new panel to girder joint detail were evaluated and compared in a series of direct shear tests. Third, the strength and geometry of both the current and a new panel-to-panel joint detail were evaluated and compared in a series of direct shear tests. Finally, a large scale specimen was designed, constructed, and evaluated to fully evaluate the new system. In summary, the research project focused on:
(1) Developing new details for the panel-to-girder connection, where the shear pockets for the shear connectors are created in a trough formed in the girder top flange and the shear connectors were built integrally with the precast panels during fabrication, as shown in Figure 14 and 15.
Figure 14. Modified New England Region girder with the continuous keyed-trough created in the
top flange (Frosch et al. 2010)

NCHRP 12-96, Final Report A-13
(a) Precast panel with a match-cast, circular, male-
female panel-to-panel connection
(b) double headed shear connectors
used with the proposed system
Figure 15. Details of the precast panels (Frosch et al. 2010)
Validation of the new connection details was confirmed through direct push-off shear specimen and a full scale mock-up. The following are the findings of the experimental program: (a) use keyed trough surface, (b) minimum stud embedment is 6 in. for #4 - #6 studs, (c) provide minimum 4,000 psi concrete strength in trough, (d) detail girder to resist outward thrust, and (e) the horizontal strength of the joint can be estimated based on the shear stud strength provided by Vn = Asfu.
(2) Developing new details for the panel-to-panel connection, where match cast circular male-female joints were used, as shown In Figure 15. Experimental results showed that: (a) checking the shear strength of the joint is not required, (b) either the 6 in. or 8 in. radius joint is recommended, however, the 8 in. radius joint may be preferable for constructability, and (c) commercial cementitious or epoxy based grout can be used to join the precast panels.
A1.2.7 Utah State University (2010-2012)
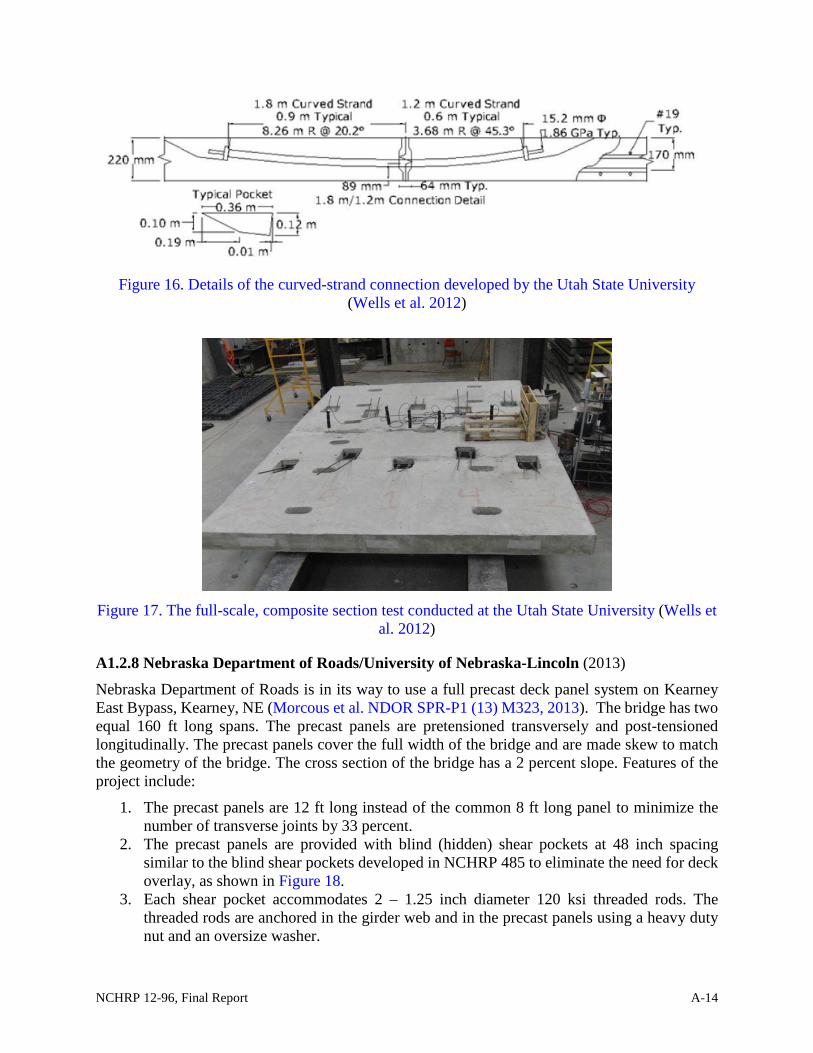
Researchers at the Utah State University developed a grouted post-tensioned, curved-strand connection that allows for a single panel replacement (Wells et al. 2012). Figure 16 shows the details of the proposed connection. Curved longitudinal PT tendons are used to compress only the transverse panel-to-panel connection to protect it against leakage. The tendons extend about 3 ft at each edge of the precast panel.
Blockouts, provided with a single-strand anchorage device, are created on the top surface of the precast panels to install tendons. Stress analysis conducted using the finite element method showed high stress concentration in the vicinity of the blockouts generated by the applied PT force. Therefore, additional top and bottom transverse steel bars at 3-inch spacing were provided at the edges to protect the panel from cracking. The proposed connection detail was tested for flexure and vertical shear. Also, a full-scale, composite section was constructed using precast panels on steel I-girders to investigate the behavior of the proposed connection due to negative moment, as shown in Figure 17. The test results have shown satisfactory performance in positive moment and vertical shear. However, the full-scale composite test showed that the connection could not deliver the required flexural capacity (i.e. the failure load was about 75 percent of the load calculated using the method of transformed sections).
NCHRP 12-96, Final Report A-14
Figure 16. Details of the curved-strand connection developed by the Utah State University
(Wells et al. 2012)
Figure 17. The full-scale, composite section test conducted at the Utah State University (Wells et
al. 2012)
A1.2.8 Nebraska Department of Roads/University of Nebraska-Lincoln (2013) Nebraska Department of Roads is in its way to use a full precast deck panel system on Kearney East Bypass, Kearney, NE (Morcous et al. NDOR SPR-P1 (13) M323, 2013). The bridge has two equal 160 ft long spans. The precast panels are pretensioned transversely and post-tensioned longitudinally. The precast panels cover the full width of the bridge and are made skew to match the geometry of the bridge. The cross section of the bridge has a 2 percent slope. Features of the project include:
1. The precast panels are 12 ft long instead of the common 8 ft long panel to minimize the number of transverse joints by 33 percent.
2. The precast panels are provided with blind (hidden) shear pockets at 48 inch spacing similar to the blind shear pockets developed in NCHRP 485 to eliminate the need for deck overlay, as shown in Figure 18.
3. Each shear pocket accommodates 2 – 1.25 inch diameter 120 ksi threaded rods. The threaded rods are anchored in the girder web and in the precast panels using a heavy duty nut and an oversize washer.

NCHRP 12-96, Final Report A-15
4. In order to accommodate the camber of the girder and maintain a uniform embedment of the shear connectors in the shear pockets, the threaded rods are covered with grease to break the bond between them and the concrete girder. After the girders are installed on the bridge, the threaded rods elevation will be adjusted by turning them up or down.
5. The longitudinal post-tensioned tendons (12 – 0.6 in. strands per girder line) are provided in the haunch between the precast panels and the girder, as shown in Figure 18. The minimum height of the haunch at the tip of the girder is adjusted to 2 inches to provide adequate space for the post-tensioned tendons. The longitudinal post-tensioning force is designed to provide for a full continuity over the intermediate pier for superimposed dead and live loads.
6. A harping device is anchored to the top flange at each end of the bridge. This device is used to harp the strands into the first and last panel on the bridge, as shown in Figure 19.
7. A special end panel is required at each end of the bridge to accommodate the anchorage device of the longitudinal post-tensioned tendons.
8. Two continuous bent plates, welded to metal tabs embedded in the girder top flange, are used to form for the haunch.
Construction steps are follows:
1. The girders are installed and the haunch barrier forms are set of the girder top flange. Elevation of the side bent plates is surveyed to adjust for the elevation of the finished deck.
2. The elevation of the shear connectors (threaded rods) is surveyed to guarantee full penetration in the shear pockets.
3. The tendons are laid on the top flange and through the harping devices at each end of the bridge.
4. Deck panels are installed using the special lifting inserts provided at the shear pocket locations to minimize deck penetrations.
5. All transverse joints are filled with non-shrink grout and cured. When the grout reaches 3.5-ksi compressive strength, the longitudinal strands are post-tensioned and anchored at the end special panels.
6. Finally, the haunches are filled with flowable concrete/grout poured from the 4-inch diameter sleeves provided at the pocket locations.

NCHRP 12-96, Final Report A-16
Figure 18. Details of the shear pockets and the shear connectors (Morcous et al. NDOR SPR-P1 (13) M323, 2013)

NCHRP 12-96, Final Report A-17
Figure 19. Details of the anchorage and harping devices of the longitudinal post-tensioning reinforcement (Morcous et al. NDOR
SPR-P1 (13) M323, 2013)

NCHRP 12-96, Final Report A-18
A1.2.9 Princess Margaret Bridge Rehabilitation (2012) Rehabilitation of the Princess Margaret Bridge, New Brunswick, Canada, required using a full depth precast deck panel system to minimize the construction time and closure period (Zaki & Girgis 2012). The old superstructure consisted of a cast-in-place concrete deck slab supported on traverse floor beams at 9 ft - 2 in. spacing. The floor beams were supported on two longitudinal deck trusses at 31 ft - 6 in. spacing in one stretch of the bridge and two plate girders at 31 ft - 6 in. spacing in another stretch.
The new precast deck system used at the deck trusses and plate girders area consisted of precast double tee panels with the pretensioned ribs oriented transverse to the direction of traffic. A typical double tee was 14 ft - 9 in. wide and 31 ft - 6 in. long as shown in Figure 20. The ribs were orientated in the transverse direction to comprise the floor beams and to span between the two main girder lines as shown in Figure 21. The double tees were longitudinally post-tensioned, which totally eliminated coupling of the longitudinal reinforcement. The longitudinal post-tensioned tendons were installed in two ducts located just below the deck slab of the double tee and directly above the longitudinal supporting deck trusses and plate girders, as shown in Figure 22.
Figure 20. The precast double tee system used on the Princess Margaret Bridge, New Brunswick,
Canada (Courtesy of SNC Lavalin and eConstruct USA LLc)

NCHRP 12-96, Final Report A-19
Figure 21. Cross section of the precast double tee system used on the Princess Margaret Bridge,
New Brunswick, Canada (1 in. = 25.4 mm) (Courtesy of SNC Lavalin and eConstruct USA LLc)
Figure 22. Cross section of the precast double tee system used on the Princess Margaret Bridge,
New Brunswick, Canada (1 in. = 25.4 mm) (Courtesy of SNC Lavalin and eConstruct USA LLc)
The double tees were made composite with the longitudinal supporting deck trusses/plate girders through a cast in place concrete spine beams located directly above the deck trusses and plate girders, as shown in Figure 22. Steel studs welded to the top flange of deck trusses/plate girders and embedded in the spine beams were used to create the composite action between the deck trusses/plate girders and the spine beams. The spine beams were made composite with the double tees by creating eight shear pockets per every double tee (four shear pockets over every longitudinal deck truss/plate girder. U-shape reinforcing bars embedded in the spine beams and extended through the shear pockets provided for the required horizontal shear reinforcement, as shown in Figure 23. Concrete of the spine beams was cast through the shear pockets.

NCHRP 12-96, Final Report A-20
Figure 23. Details of the spine beam used on the Princess Margaret Bridge, New Brunswick,
Canada to create the composite action (1 in. = 25.4 mm) (Courtesy of SNC Lavalin and eConstruct USA LLc)
A1.2.10 NCHRP 12-69: Longitudinal Joints of Integral Deck Bulb Tees (2009)
Integral deck bulb-tees are precast, prestressed concrete I-beams, bulb-tees, or multi-stemmed girders with an integral deck that is cast monolithically and prestressed with the girder (Oesterle et al. 2009). These girders are manufactured in precast concrete plants under closely controlled and monitored conditions, transported to the construction site, and placed side by side in the bridge. Load transfer between adjacent units is accomplished using specially designed longitudinal connections along with a grouted shear key.
The most widely used longitudinal connection between deck bulb-tees is a combination of a continuously grouted shear key and welded transverse ties, as shown in Figure 24. This type of connection is intended to transfer shear and prevent relative vertical displacements across the longitudinal joints. The survey conducted in NCHRP 12-69 (Oesterle et al. 2009) has shown that this connection detail is susceptible to cracking due to shrinkage of the grout filling the shear key, temperature change effects and twisting of the individual girders about their shear center, which is above the flange.

NCHRP 12-96, Final Report A-21
Figure 24. Typical connection detail using grouted shear key and welded steel plates (Oesterle et
al. 2009)
NCHRP 12-69 (Oesterle et al. 2009, Li et al. 2010) has developed a longitudinal joint detail that includes headed reinforcement bars lap spliced and grouted within a narrow joint formed at the longitudinal edges of the precast deck portion of the precast girders. The geometry and the reinforcement for the alternate joint are shown in Figure 25. The headed steel bars are staggered at 6 in. spacing and extended outside the longitudinal edge of the integral deck. The headed bars help in developing the yield strength of the spliced bars in a short distance, about 6 in. of lap splice. Two No. 5 longitudinal bars are set in the grouted shear key to help in confining the headed studs and develop their yield strength. Laboratory testing indicated that the joint detail has sufficient strength, fatigue characteristics, and crack control for the maximum loads determined from the analytical studies for all combinations of span length, girder spacing, girder depth, and bridge skew used in the analytical studies of NCHRP 12-69.
Figure 25. New connection detail (Li et al. 2010)
A1.2.11 FHWA: UHPFRC for Prefabricated Bridge Component Connections Advanced cementitious composite materials, whose mechanical and durability properties far exceed those of conventional concretes, present an opportunity to significantly enhance the performance of field-cast connections, thus facilitating the wider use of modular prefabricated systems.

NCHRP 12-96, Final Report A-22
Ultra high performance fiber reinforced concrete (UHPFRC) represents a class of such advanced cementitious composite materials. Of particular interest for full depth precast concrete deck panel systems, UHPFRCs can significantly shorten the development length of embedded discrete steel reinforcement and can exhibit exceptional bond when cast against previously cast concrete. These properties allow for a redesign of the modular component connection to facilitate accelerated construction and enhanced long-term system performance. A research, development, and deployment effort focused on UHPFRC connections has been conducted by the U.S. Federal Highway Administration (Graybeal & Swenty 2012). This program is building on a decade of experience with UHPFRC applications (Graybeal 2011) along with past efforts specifically focused on UHPFRC connections (Aarup et al. 2000, Hansen & Jensen 1999) to create practical solutions which address clear needs within the American highway transportation system.
More recently, the concept of using UHPC properties to redesign connections between modular bridge components has been recognized in North America. As of early 2012, field-cast UHPC connections between prefabricated bridge components were implemented in 18 bridges in the United States and Canada. These bridges use a range of details to connect different precast concrete modular bridge components, including adjacent box beams, full-depth precast deck panels, and deck-bulb-tee girders.
Two fundamental differences between the field-cast UHPFRC connection concept and conventional modular component connection concept are simplicity and performance. The UHPFRC connection concept allows for small, simple connections while delivering better overall performance. The exceptional durability of UHPFRC has been well documented. Of particular importance, UHPFRC contains no coarse aggregate, so it does not exhibit early-age micro cracking common to conventional concrete. This feature, combined with the discontinuous pore structure in the homogeneous cementitious matrix, results in concrete with an extremely low permeability. Table 1 presents a select set of material properties for the UHPC investigated in the study conducted by FHWA.
Table 1. Material properties for the UHPFRC investigated in the study conducted by FHWA
The FHWA study developed design details for the: (1) Panel-to-girder composite connection, and (2) panel-to-panel connection. The connection designs deployed have tended to mimic non-contact lap splice connections with a female-female shear key profile.
A1.2.11.1 Panel-to-Girder Composite Connection Detail (Graybeal FHWA-HRT-12-041) Figures 26 and 27 provide schematic illustrations of this connection for precast concrete deck panels supported by steel and concrete girders, respectively. The connection detail consists of a hidden continuous open channel provided at every girder line on the underside of the precast deck panel through, which the bottom mat of transverse deck reinforcement passes.

NCHRP 12-96, Final Report A-23
The continuous channel accommodates the shear connectors, which are steel studs welded to the top flange of the steel girders or reinforcing bars embedded in the web of the concrete girders and extended outside the top flange. The channel is provided with grouting holes that provide access to fill the channel with grout. The concept of the continuous open channel was originally developed in the NCHRP 12-65 (Badie & Tadros NCHRP 584 2007). However, the primary difference is that the extension height of the shear connectors is reduced so as to not interfere with the precast deck.
Figure 26. Schematic illustrations of the composite connection for precast concrete deck panels
supported by steel girders (Graybeal FHWA-HRT-12-041)
Figure 27. Schematic illustrations of the composite connection for precast concrete deck panels
supported by concrete girders (Graybeal FHWA-HRT-12-041)
The connection detail was tested using two 39-ft long concrete beam/deck specimens. The two test specimens had the same basic precast panel and girder designs, but one beam (Beam 1) was built as a conventional specimen with conventional composite connection details, and the other beam (Beam 2) was built as a UHPFRC specimen with the new connection detail. For each beam, one half of the beam simulated a steel girder connection and the other half simulated a concrete girder connection. Figures 28 to 31 show the connection details used on these beams.
The field-cast panel-to-girder connection of Beam 1 used Harris Construction Grout, a pre-bagged, non-shrink construction grout, which yielded 7.95 and 7.99 ksi compressive strength at 28 and 106 days respectively. The first batch of conventional grout placed into the connection had an inappropriate rheology and thus was not able to be fully consolidated to fill all of the void space. The grout was too stiff, and thus it filled the blockouts in the deck panels and the areas immediately around the stud clusters, but left some voids in areas farther away from the stud clusters. This issue was encountered on the easternmost 8 ft of the test specimen, with the grout for the remainder of the specimen being of appropriate consistency. After the initial placement had set, void spaces were filled by placing fluid grout into the void spaces laterally via accessible areas on the sides and ends of the haunch. The inappropriate consistency and the secondary grout casting both resulted in greater than anticipated shrinkage cracking of the grout in the haunch connection within the easternmost 8 ft of the test specimen. Figures 32 & 33 provide representative examples of the cracking observed in the haunch connection grout near the east end of the specimen.

NCHRP 12-96, Final Report A-24
Figure 28. Beam 1 (Conventional composite connection): Transverse cross section of emulative
steel girder connection (Graybeal FHWA-HRT-12-041)
Figure 29. Beam 1 (Conventional composite connection): Transverse cross section of emulative
concrete girder connection (Graybeal FHWA-HRT-12-041)

NCHRP 12-96, Final Report A-25
Figure 30. Beam 2 (UHPC composite connection): Transverse cross section of emulative steel
girder connection (Graybeal FHWA-HRT-12-041)
Figure 31. Beam 2 (UHPC composite connection): Transverse cross section of emulative
concrete girder connection (Graybeal FHWA-HRT-12-041)
The field-cast panel-to-girder connection of Beam 2 used a UHPFRC mix, which yielded 22.1, 27.0, 27.7 and 29.7 ksi compressive strength at 21, 97, 180 and 270 days respectively. The UHPFRC mix design included 317.5 kg (700 lbs) of Ductal Premix, 20.3 kg (44.8 lbs) of water, 4.3 kg (9.5 lbs) of Chryso Premia 150 superplasticizer, and 22.6 kg (50 lbs) of 12.7 mm long by 0.2 mm diameter (0.5 in. long by 0.008 in. diameter) straight steel fibers.

NCHRP 12-96, Final Report A-26
Figure 32. Cracking apparent on north face of haunch near east end of the Beam 1 prior to start
of structural loading (Graybeal FHWA-HRT-12-041)
Figure 33. Cracking apparent on top of deck at grout pocket near east end of Beam 1 prior to
start of structural loading (Graybeal FHWA-HRT-12-041)
The test program for each specimen included two phases. First, each test specimen was subjected to cyclic loads in order to simulate the type of service-level fatigue loadings commonly applied to highway bridge structures. A four-stage loading program was used, where the first three stages each subjected the test specimen to more than 2 million cycles of structural loading. The final stage subjected the test specimen to more than 5 million additional cycles of structural loading. The vertical shear force range was increased by approximately one-third at each successive stage, resulting in the final stage applying twice the vertical shear force range as the initial stage.
The results of the cyclic load test clearly demonstrate that the horizontal shear interface of Beam 1 remained intact throughout the entirely of the cyclic loading. No differential movement was observed electronically or visually at various levels of the cyclic load. The conventional grout remained well bonded to the precast surfaces with no indication of cracking, delamination, or debonding. The new connection detail of Beam 2 succeeded in resisting all cyclic structural loads to which they were subjected throughout the testing program. No damage was observed within the UHPFRC composite connection or in the adjoining steel connectors throughout the duration of this testing. After the completion of the cyclic loading program, each specimen was subjected to static loading. During the static testing to failure, the UHPFRC test specimen carried a peak applied shear load of 498 kips (2215 kN), which corresponds to a horizontal shear per unit length of 12.0 kips/inch (2.1 kN/mm).

NCHRP 12-96, Final Report A-27
At this load, the prestressed girder began to fail in a combination of horizontal and vertical shear in the web and top flange of the girder. Horizontal shear distress was also observed in the precast deck elements adjacent to the haunch. The conventional test specimen carried a peak applied shear load of 445 kips (1980 kN), which corresponds to a horizontal shear per unit length of 10.45 kips/inch (1.83 kN/mm). More details of the cyclic and static tests can be found in the following reference: Graybeal FHWA-HRT-12-041. A1.2.11.2 Panel-to-Panel Connection Detail (Graybeal, FHWA-HRT-11-023) The connection detail is made of a female-female cast-in-place as shown in Figure 34. No. 5 bars, which represent the deck reinforcement, extend inside the connection.
Figure 34. UHPC longitudinal connection specimen with non-contact, lap-splice detail
(Graybeal, FHWA-HRT-11-023)
The No. 5 bars of adjacent panels are staggered in order to avoid interference inside the connection. Two No. 5 bars are set in the connection parallel to the transverse edge of the panel to provide confinement that helps in reducing the development length of the spliced bars. UHPC mix is used to fill the connection. The connection detail was tested for fatigue and ultimate. The tested components simulated a 94.5 by 84.7-inch portion of a bridge deck that included a 6 inch (152 mm) wide field-cast UHPC connection.

NCHRP 12-96, Final Report A-28
The specimens were loaded on a simple span, with the load applied through a simulated wheel patch placed adjacent to the connection near midspan. Cyclic loads were applied first, with the test program including at least 2 million cycles to a load just below the cracking strength of the specimen followed by at least 5 million cycles to a load larger than the cracking strength of the specimen. After the completion of the cyclic testing, each test specimen was statically loaded to failure. The tests showed satisfactory behavior of the connection detail.
A1.3 Shear Connector Spacing The AASHTO LRFD Specifications (AASHTO LRFD 2012) state that spacing between the shear connectors for steel or concrete girders should not exceed 24 in. The original sources of the current maximum connector spacing of 24 in. are unclear. An investigation described in NCHRP Report 584 (Badie & Tadros 2008) on full-depth precast concrete deck panels, attributes that limit to a “rule of thumb” in design suggested in 1943 (Newmark & Siess 1943). The 24-in. limit first appeared in the 4th edition of the AASHTO Standard Specifications for Highway Bridges in 1944 and was kept without any changes in the following editions until the latest edition of the AASHTO Standard Specifications (AASHTO Standard 2002). When the first edition of the AASHTO LRFD Specifications appeared in 1994, the 24 in. limit was adopted and it was kept without any changes in the following editions until the 6th edition (AASHTO LRFD 2012). It is very important to remember that the 24. in. recommended by Newmark & Siess (1943) was developed for shear connectors uniformly distributed along the length of the supporting girders, which is the common case when cast-in-place decks are used, and not for clusters of studs, which is the case for when full depth precast concrete deck panels are used.
During the last 15 years, extending the spacing between the shear connection clusters of precast composite concrete bridge decks and girders has received great interests. There are two important reasons why closely spaced blockouts are undesirable in precast concrete deck panels. First, each blockout requires special labor for fabrication and grouting. Second, a precast concrete deck panel manufactured with blockouts spaced at 24 in. may have a definite plane of weakness through the blockout openings. Special care must be taken to reinforce this weak section, particularly for effects of moving and handling to avoid cracking. In both cases, minimizing the number of connectors and blockouts is preferred (Oliva & Okumus 2013).
These connections using steel studs were the focus of a push-off investigation by Issa et al. (2003) in which clusters of studs in a pocket were found to have less capacity than the sum of individual studs. The AASHTO “Qn” capacity value for studs in Article 6.10.10.4 of the 2012 AASHTO LRFD Specifications, however, matched Issa’s measured capacity for two stud clusters in a single pocket. The test data showed a 15 to 25% capacity reduction when the number of studs was increased or the number of pockets increased. AASHTO does not specifically change capacity with the number of studs in a cluster, but taking the capacity as 85% or less of AASHTO’s value when more than two studs are clustered in a pocket is recommended based on Issa’s work.
Since push-off specimens do not provide accurate representation of the composite deck/girder behavior due to their limited size and lack of stability of the specimens during testing, a series of recent research activities has re-examined the needs of composite deck connections through testing of full scale composite beams. Testing of panels connected to 84-ft-long steel girders with both 24-in. and 48-in. connector spacing was conducted at the University of Wisconsin (Markowski et al. 2005) and found no reduction in composite action stiffness or strength with the wider spacing, even after 2 million cycles of repeated service loading.

NCHRP 12-96, Final Report A-29
On testing to the theoretical ultimate capacity, no deck uplift was detected and the 48-in. connector spacing provided an actual ultimate load capacity higher than predicted using AASHTO procedures, even though no capacity reduction was taken for multiple studs per pocket.
In NCHRP 12-65, Badie & Tadros (NCHRP 584, 2008) tested two composite beams where spacing between the shear connectors clusters was set at 24 and 48 in. The beams consisted of a full depth precast deck panels supported on steel girders. The composite beams were exposed to two million cycles of fatigue load and then tested to failure. The test results have shown that extending the stud spacing from 24 to 48 in. has no detrimental effect either on the composite beam stiffness or the ultimate flexural capacity. The study recommended providing special confinement of the shear connector individual clusters in order to guarantee full development of the steel studs.
Another study was conducted at Virginia Tech. (Scholz et al. 2007 ,Sullivan et al. 2011) were to examine the possibility of extending the spacing between the shear pockets beyond the 24 inch limit mandated by the LRFD Specifications. A full scale mockup was built and tested in the lab, where the spacing between the shear connector clusters was set at 48 in. The test results have shown that: (1) full composite action is achievable using either hooked reinforcing bars or shear studs as shear connectors in both 2 ft pocket spacing and 4 ft pocket spacing. The research also, recommended new formulas to design for the horizontal shear connection between the steel plane and the supporting girder and between the steel plane and the precast panel.
As a result of these studies, forty-eight-inch spacing was successfully used on implementation projects in NE, TX, VA and Wisconsin. At its 2013 annual meeting, the AASHTO Highway Subcommittee on Bridges and Structures approved a change to Article 5.7.4.5 of the LRFD Bridge Design Specifications to permit a longitudinal spacing up to 48 in. but not greater than the beam depth.
A1.4 Suehiro Viaduct, Kansai International Airport Line, Japan The RT added this and the following section to the literature review that was submitted in Interim Report 1. This section is about a full-depth precast system that was developed in Japan in early 1990s, which uses a variable depth panel and a system of discrete haunches.
The next section is about the experimental program that is in progress at the Federal Highway Administration at Turner Fairbank Highway Research Center. The FHWA project has been investigating the possibility of extending spacing of the shear connectors beyond the current 24 inch limit for steel girders.
This section gives a summary of the Suehiro Viaduct, Kansai International Airport Line, Japan (Matsui et al. 1994, Manabe & Matsui 2004). Some of the features of the precast deck panel system used on this bridge are similar to the main features of precast deck panel system that was developed in this project. Features of the deck panel system used on the Suehiro Viaduct project included:
• Deck panel had variable depth: A precast slab system was adopted in constructing of the Suehiro Viaduct on the Kansai International Airport Line because of its proven labor saving and higher durability. A variable depth precast panel (Π-shape), as shown in Figure 35, was adopted. The thickened ends of the panel provide enough space to support the panel and accommodate the leveling bolt system used to adjust for the panel’s elevation.

NCHRP 12-96, Final Report A-30
Figure 35: Cross section of the precast panel (Matsui et al. 1994, Manabe & Matsui 2004)
• Shear connectors were provided only at the transverse panel-to-panel joints and at a wide spacing of 4 ft–11 in. (1500 mm), which simplified the production of the precast panels because no shear pockets were created in the panel, as shown in Figure 36.
• Discrete haunches, rather than continuous haunch, were used, where only the space between the steel girder and the thickened ends of the panels was filled with grout.
• The precast panels were transversely pretensioned, and the completed deck was longitudinally post-tensioned, as shown in Figure 37.
• The longitudinal PT was applied after the panel-to-panel joints were grouted and cured, but before the panel-to-girder and the panel-to-panel joints were grouted. Therefore, the full PT force was applied only on the deck.
• The superstructure was designed as non-composite girder, conforming to the Japanese specification.
Using this system helped the design engineer to:
1. Reduce the self-weight of the deck
2. Allow for splicing of the supporting steel girders without the need of using a thick haunch.
3. Reduce the amount of labor and material required to fill the haunch.
4. Reduce the construction time by about 40% compared to a cast-in-place slab.
Figure 36. The precast deck during construction showing the wide spacing of the shear connectors and the grout barrier for the panel-to-girder connection (Matsui et al. 1994)

NCHRP 12-96, Final Report A-31
Figure 37. The precast deck before grouting the panel-to-panel and panel-to-girder joints
(Matsui et al. 1994)
An experimental program was developed to validate the concept, which included:
• Single slab test to check mode of failure for the individual precast panels (Figure 38): Testing showed that panels with PT failed in flexure by crushing of concrete, while panels without PT failed in punching shear. The failure load was 1.27 to 1.52 times higher than the design value.
• Continuous slab test to measure the strength of the panel-to-panel joint (Figure 39): Three specimens were built using two panels that were made continuous. Three levels of PT stress were applied across the panel-to-panel joint: 78, 50 and 28 ksi (539, 343 and 196 N/mm2). Under service loads, there was no noticeable difference in deflection or strains. However, the specimen with the 28 ksi (196 N/mm2) PT stress showed a wider crack at failure at the bottom surface of the joint.
The specimens were subjected to 1.5 million cycles of fatigue loading to test for possible leakage. No leakage was reported. Later, these specimens were tested to failure. Failure strength was about 1.7 times higher than that of a single panel, which proved that the panel-to-panel connection is stronger that the panel.
Figure 38. Single slab test setup (Matsui et al. 1994)

NCHRP 12-96, Final Report A-32
Figure 39. Continuous slab test setup (Matsui et al. 1994)
In August 2015, the research team contacted Dr. Hideki Manabe, president of the CORE institute of Technology Corporation, Japan, and received the following information:
• No problems have been reported since the precast panels were put into service.
• The level of longitudinal post-tensioning was designed considering safety factor for cracking and introduced 290 psi (2.0 N/mm2) of the floor region depth of the panel.
• The superstructure was designed as non-composite girder, conforming to the Japanese specification. The design results were verified using finite element analysis.
• Transverse section of panel was designed as a one-way channel-Shaped slab. On the other hands, longitudinal section of panel was designed as a flat plate.
• This system has been used on 4 bridges in Japan
Comments from the research team on this system:
There are many similarities between the precast panel system used in the Suehiro Viaduct and the precast panel system developed by the research team.
The only difference between these systems is that the deck of the Suehiro Viaduct Bridge was designed as non-composite with the girder. Therefore, small amount of shear connectors were used to just anchor the precast slab with the supporting girders. However, the field instrumentation and analysis conducted by Dr. Manabe (Manabe & Matsui 2004) on the bridge found that the superstructure behave as a partial composite system.
It is a common practice in the United States that slab/I-girder assemblies are designed as composite structures due to superimposed loads. Article 6.10.1.2 of the LRFD Specifications (AASHTO LRFD 2017) states that non-composite sections are not recommended but are permitted.
A1.5 FHWA Experimental Program (Provines and Ocel 2014, NABC & WSBS) Researchers at the Turner-Fairbank Highway Research Center, FHWA has been evaluating if the current AASHTO strength and fatigue limit states are applicable to clustered shear studs used for precast deck panel systems. Based on a review of the current domestic and international shear stud specifications, the researchers found that the AASHTO provisions warrant revisiting. The fatigue provisions may be overly conservative, while the strength provisions may be unconservative.

NCHRP 12-96, Final Report A-33
The experimental program includes 16 large-scale tests using four different configurations of shear stud spacings, which range from a typical cast in place deck detail with studs every 12 or 24 in. to configurations more conducive to precast panels with clustered shear studs spaced at 36 and 48 in. Of the 16 large-scale tests, 4 are static and 12 are fatigue tests to evaluate both the strength and fatigue AASHTO limit states. Upon completion of the large-scale tests, small-scale (push out) fatigue and static tests will also be conducted. Cast in place and precast push out tests will be performed to compare the two methods of concrete placement. The static tests will focus on evaluating the AASHTO minimum longitudinal and transverse stud spacing, while the fatigue tests will focus on evaluating the AASHTO shear stud constant amplitude fatigue limit of 3.5 ksi.
Each large-scale test in this study consists of a 30 ft. long W27x84 rolled steel beam and two concrete deck panels fabricated by a PCI certified precast producer, as shown in Figure 40. Pockets were cast into the deck panels and were sized depending on the number of studs in each pocket. Table 2 presents the experimental test matrix with the four different shear stud cluster spacings.
Figure 40. Large-scale test beam with 36" cluster spacing (Provines and Ocel 2014)
Table 2. Large-scale experimental test matrix (Provines and Ocel 2014)
The beams were designed to induce a shear failure in the studs for the static tests and to accelerate fatigue testing. The 12 studs in each shear span correspond to approximately 38% composite action. Since beams were designed as partially composite and AASHTO does not allow partial composite action, the AISC specifications were used to determine the flexural resistance and rigidity.

NCHRP 12-96, Final Report A-34
Prior to placing the concrete deck panels on the steel beams, the top flange was coated with a thin layer of grease so the majority of shear force transferred between the steel beam and the deck panels was transmitted through the shear studs. Grout with an expected strength of approximately 8.0 ksi was used to fill the pockets, haunch, and transverse joint in the center of the beam.
The beams have two load points with an 11’-6” shear span on each end of the beam. All of the shear studs have a diameter of 7/8 in. and were selected due to their use in typical bridge construction. Clustered studs are spaced longitudinally at a pitch of 3.5 in. (4 times the stud diameter, 4d), which is slightly less than the minimum AASHTO LRFD spacing of 6d. The smaller pitch was chosen to minimize the length of the pockets and is currently allowed by some bridge owners such as Texas DOT.
Table 3 provides a summary of the fatigue tests and includes the following information: the naming convention, basic stud geometry, initial average stress range on the shear studs in each shear span, and the number of cycles to failure. To date, 4 large-scale static and 7 large-scale fatigue tests have been completed.
Table 3. Summary of S-N data for large-scale fatigue tests (Provines and Ocel 2014)
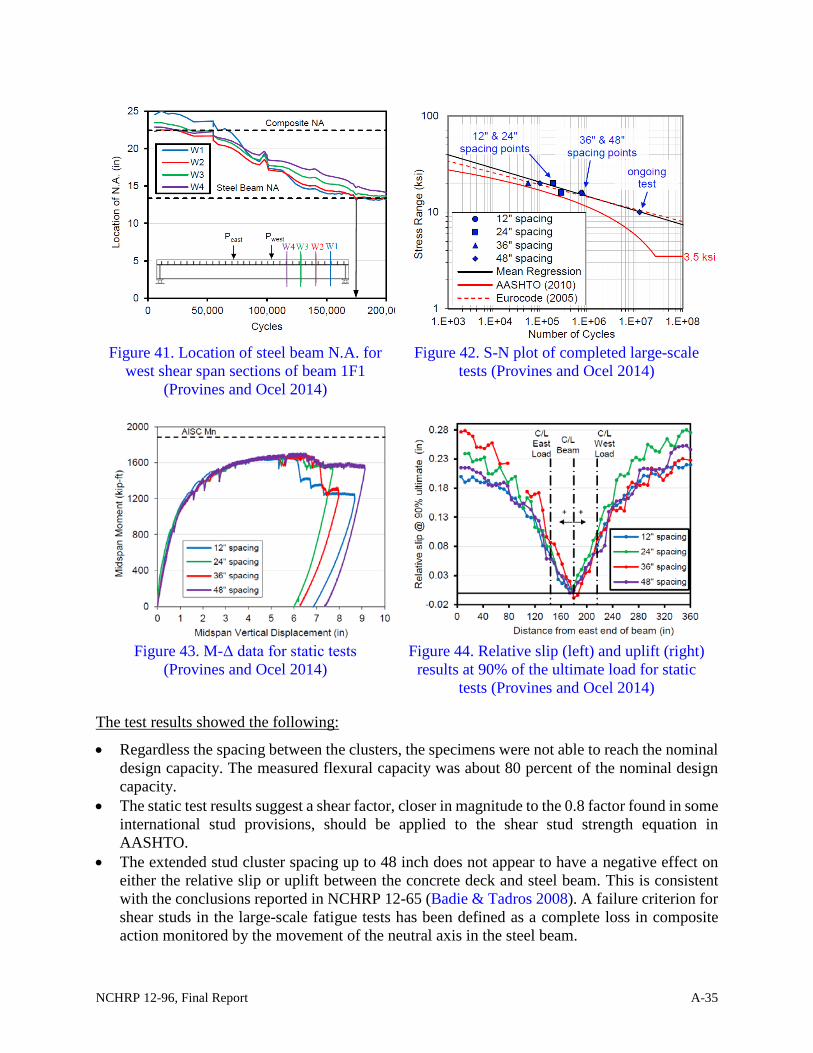
Throughout fatigue testing, measurements from the strain gauges in both the steel beam and the concrete deck were used to calculate the location of the neutral axis (N.A.). Figure 41 shows a plot of the location of the N.A. for the steel beam at four cross steel cross sections along the west shear span for beam 1F1. The calculated N.A. locations were then used to determine how composite action was affected during cycling. When testing began, the steel beam and concrete deck were expected to behave as one composite section. As the studs failed due to fatigue, the beam and deck were expected to behave as two separate flexural members because horizontal shear force was no longer being transferred between the two elements.
The composite section and bare steel beam N.A. are also provided as a reference. Figure 42 shows S-N plot of completed large-scale tests obtained from the fatigue tests. Figures 43 & 44 shows the results obtained from the static tests. Figure 43 shows the moment-displacement curve for each of the four static tests. Figure 44 shows relative slip and uplift results at 90% of the ultimate load for static tests.
NCHRP 12-96, Final Report A-35
Figure 41. Location of steel beam N.A. for
west shear span sections of beam 1F1 (Provines and Ocel 2014)
Figure 42. S-N plot of completed large-scale tests (Provines and Ocel 2014)
Figure 43. M-Δ data for static tests
(Provines and Ocel 2014) Figure 44. Relative slip (left) and uplift (right)
results at 90% of the ultimate load for static tests (Provines and Ocel 2014)
The test results showed the following:
• Regardless the spacing between the clusters, the specimens were not able to reach the nominal design capacity. The measured flexural capacity was about 80 percent of the nominal design capacity.
• The static test results suggest a shear factor, closer in magnitude to the 0.8 factor found in some international stud provisions, should be applied to the shear stud strength equation in AASHTO.
• The extended stud cluster spacing up to 48 inch does not appear to have a negative effect on either the relative slip or uplift between the concrete deck and steel beam. This is consistent with the conclusions reported in NCHRP 12-65 (Badie & Tadros 2008). A failure criterion for shear studs in the large-scale fatigue tests has been defined as a complete loss in composite action monitored by the movement of the neutral axis in the steel beam.

NCHRP 12-96, Final Report A-36
It is important to mention that no special confinement was provided to the stud clusters in any of the specimens tested at FHWA. The only source of confinement was provided by the slab reinforcement that was designed using the LRFD Empirical Design Method.
Experimental results obtained in NCHRP 12-65 (Badie & Tadros 2008) and recently at the University of Nebraska (Morcous et al. 2013) showed that full strength of the studs can be developed if special confinement in the form of steel tubes or individual ties is provided around the shear pockets. The research team strongly believes that confinement plays a critical role in developing the design capacity of the shear connectors, especially when the spacing extended spacing between stud clusters is used.

NCHRP 12-96, Final Report B-1
APPENDIX B ANALYTICAL PROGRAM
This appendix was created to keep the size of the main report within a reasonable size. It presents the detailed results of some the issues investigated in the analytical program that are reported in Chapter 3 of the report.
Table of contents B.1 Design Requirement No 6: Flexure Design of the Composite Section ........................... B-2
B.2 Design Requirement No 7: Deflection of the Composite Section ................................... B-7
B.3 Design Requirement No 8: Interface Shear ................................................................... B-11
B.4 Design Requirement No 9: Vertical Shear .................................................................... B-16
B.5 Design Requirement No 10: Distribution Factors ......................................................... B-18

NCHRP 12-96, Final Report B-2
B.1 Design Requirement No 6: Flexure Design of the Composite Section The vierendeel model was loaded only with the following combination of composite loads:
DC Loads: Barrier weight = (2 barriers)(0.3 k/ft/barrier)/(6 beams)
DW Loads: Wearing surface = (girder spacing)(2 inch thick layer)(0.150 kcf)
Live Load: HL93 with distribution factor for moment determined using the LRFD Specifications
SERVICE I limit state was used to determine the load factors. The loads were applied on the top chord of the vierendeel model.
The following procedure was used to obtain the flexural stresses from the vierendeel model. At the section where the highest moment in the girder was recorded, moment in the top chord (slab) and in the bottom chord (beam) was recorded. The moment was used to determine the flexural stresses in the slab and the girder using their individual inertia and geometrical properties.
Table 1 shows the matrix used in the parametric study. The same matrix and design criteria were also used to investigate interface shear and deflection of the composite section.
Table 1. Matrix of the parametric study for flexure design of the composite section
Note: Highlighted cells show the changes compared to the baseline case
Results of the parametric study are reported in Tables 2 to 4. For every case, the results obtained from the vierendeel model are compared with the results obtained using the simple Euler-Bernoulli beam analysis, where the composite beam is analyzed as a simply supported beam. Analysis of the results reported in Tables 2 to 4 shows that:
Parametric investigation using the Vierendeel Model:
1. Increasing the spacing between the joints leads to: • Insignificant decrease in the compressive stresses at top fiber of the slab (the maximum
decrease is about 100 psi) • Insignificant increase in the compressive stresses at bottom fiber of the slab (the maximum
increase is about 139 psi)
Case No. Span-to-depth ratio SPAN (ft)
Girder spacing
(ft)Deck thicness (in) Haunch thickness (in) haunch size (ftxft) Haunch
Spacing
1 (Baseline) 6 7.5 2 2x2
2 6 7.5 6 2x2 3 6 7.5 2 1x14 12 7.5 2 2x2 5 6 10 2 2x2 6 6 10 6 2x2 7
(baseline) 6 7.5 2 2x2
8 6 7.5 6 2x2 9 6 7.5 2 1x1
10 12 7.5 2 2x2 11 6 10 2 2x2 12 6 10 6 2x2
35
20
80, 144
& 216
2ft, 4ft, 6ft,
& 8ft

NCHRP 12-96, Final Report B-3
• Insignificant increase in the compressive stresses at top fiber of the girder (the maximum increase is about 83 psi for the concrete examples, i.e. 80 and 144 ft span, and about 183 psi for the steel girder case, i.e. 216 ft span)
• Insignificant increase in the tensile stresses at bottom fiber of the girder (the maximum increase is about 59 psi for the concrete examples, i.e. 80 and 144 ft span, and about 252 psi for the steel girder case, i.e. 216 ft span)
2. Insignificant change in normal stresses is reported when: • Increasing the thickness of the haunch from 2 to 6 inches (Compare case 1 versus Case 2, and
Case 7 versus Case 8) • Changing the dimensions of the haunch from 24x24 inches to 12x12 inches (Compare case 1
versus Case 3, and Case 7 versus Case 9). • Changing the girder spacing from 6 ft to 12 ft (Compare case 1 versus Case 4, and Case 7 versus
Case 10). • Changing thickness of the slab from 7.5 inches to 10 inches (Compare case 1 versus Case 5,
and Case 7 versus Case 11). 3. Changing the span-to-depth ratio (from 20 to 35) or the span length (from 80 to 216 ft) does not
have any impact on the reported trends. 4. Changing the type of girder (concrete versus steel) does not have any impact on the reported trends. 5. In addition to the parameters shown in 9, the effect of changing the minimum specified strength of
the concrete girder, for the 80 ft and 144 ft spans, was examined. It was found that changing the concrete strength from 6 ksi to 12 ksi resulted in insignificant change in the normal stresses.
Comparison between the vierendeel and simplified models:
The simplified model gives very comparable results to the vierendeel model.
Recommendation for determining flexural stresses in the composite section:
It is safe to use the simplified model to determine the flexural stresses in the composite beam due to the superimposed dead and live loads. The simplified model utilizes the Euler-Bernoulli beam theory using the composite section properties.

NCHRP 12-96, Final Report B-4
Table 2. Normal stresses (80-ft span)
Haunch Spacing (ft)
Haunch thickness
(in.)
Top of deck (ksi)
Bottom of deck (ksi)
Top of girder (ksi)
Bottom of girder (ksi)
Haunch Spacing (ft)
Haunch thickness
(in.)
Top of deck (ksi)
Bottom of deck (ksi)
Top of girder (ksi)
Bottom of girder (ksi)
2 2 -0.737 -0.324 -0.415 1.106 2 2 -1.318 -0.521 -0.514 2.0224 2 -0.722 -0.334 -0.431 1.119 4 2 -1.308 -0.523 -0.551 2.0536 2 -0.683 -0.367 -0.451 1.133 6 2 -1.279 -0.542 -0.595 2.0868 2 -0.639 -0.402 -0.472 1.147 8 2 -1.244 -0.563 -0.642 2.120
-0.098 0.079 0.057 -0.040 -0.074 0.043 0.128 -0.098Simplified model NA NA -0.632 -0.419 -0.397 1.099 Simplified model NA NA -1.223 -0.603 -0.480 2.004
-0.105 0.095 -0.018 0.008 -0.095 0.082 -0.035 0.018
2 6 -0.716 -0.327 -0.327 1.013 2 6 -1.196 -0.528 -0.296 1.7164 6 -0.701 -0.336 -0.347 1.028 4 6 -1.188 -0.526 -0.340 1.7506 6 -0.663 -0.366 -0.371 1.043 6 6 -1.161 -0.542 -0.390 1.7898 6 -0.620 -0.399 -0.395 1.059 8 6 -1.128 -0.560 -0.442 1.827
-0.097 0.072 0.068 -0.046 -0.068 0.032 0.146 -0.112Simplified model NA NA -0.485 -0.315 -0.196 0.995 Simplified model NA NA -0.940 -0.483 -0.129 1.702
-0.231 -0.012 -0.130 0.018 -0.256 -0.045 -0.168 0.014
2 2 -0.733 -0.337 -0.401 1.100 2 2 -1.317 -0.526 -0.509 2.0204 2 -0.719 -0.345 -0.424 1.118 4 2 -1.311 -0.524 -0.546 2.0506 2 -0.688 -0.369 -0.443 1.131 6 2 -1.290 -0.535 -0.589 2.0828 2 -0.651 -0.398 -0.464 1.145 8 2 -1.263 -0.547 -0.635 2.116
-0.082 0.062 0.063 -0.045 -0.054 0.021 0.126 -0.095Simplified model NA NA -0.636 -0.422 -0.400 1.099 Simplified model NA NA -1.228 -0.607 -0.484 2.002
-0.097 0.085 -0.001 0.001 -0.089 0.081 -0.025 0.018
2 2 -0.745 -0.207 -0.319 1.589 2 2 -1.235 -0.308 -0.262 2.8134 2 -0.724 -0.224 -0.346 1.609 4 2 -1.252 -0.286 -0.319 2.8596 2 -0.701 -0.241 -0.379 1.632 6 2 -1.241 -0.287 -0.390 2.9118 2 -0.668 -0.265 -0.417 1.656 8 2 -1.222 -0.294 -0.467 2.966
-0.077 0.059 0.098 -0.067 -0.013 -0.014 0.205 -0.153Simplified model NA NA -0.609 -0.341 -0.296 1.578 Simplified model NA NA -1.147 -0.398 -0.217 2.785
-0.136 0.135 -0.023 0.011 -0.088 0.089 -0.045 0.028
2 2 -0.604 -0.196 -0.270 0.976 2 2 -1.083 -0.255 -0.260 1.7304 2 -0.594 -0.202 -0.284 0.986 4 2 -1.067 -0.266 -0.291 1.7556 2 -0.580 -0.212 -0.303 0.999 6 2 -1.060 -0.265 -0.331 1.7868 2 -0.556 -0.229 -0.324 1.012 8 2 -1.047 -0.268 -0.363 1.805
-0.048 0.033 0.054 -0.037 -0.036 0.013 0.104 -0.075Simplified model NA NA -0.514 -0.281 -0.257 0.970 Simplified model NA NA -0.992 -0.343 -0.234 1.716
-0.090 0.086 -0.013 0.006 -0.091 0.088 -0.026 0.015
2 6 -0.586 -0.191 -0.200 0.890 2 6 -0.964 -0.274 -0.106 1.4714 6 -0.568 -0.204 -0.218 0.902 4 6 -0.950 -0.281 -0.143 1.5006 6 -0.554 -0.211 -0.239 0.916 6 6 -0.946 -0.277 -0.188 1.5348 6 -0.532 -0.226 -0.264 0.932 8 6 -0.936 -0.277 -0.238 1.571
-0.054 0.035 0.064 -0.043 -0.028 0.003 0.132 -0.099Simplified model NA NA -0.419 -0.228 -0.123 0.886 Simplified model NA NA -0.819 -0.317 -0.017 1.491
-0.167 0.037 -0.077 0.004 -0.145 0.042 -0.089 -0.020
Case 11
Case 12
Vierendeel Change slab thickness to
10 in.(Case 2 ft - Case 8 ft)
Vierendeel (Case 2 ft) - Simplified
Vierendeel Change slab thickness to
10 in. and Haunch thickness to 6 in.
(Case 2 ft - Case 8 ft)
Vierendeel (Case 2 ft) - Simplified
Vierendeel Change slab thickness to
10 in.(Case 2 ft - Case 8 ft)
Vierendeel (Case 2 ft) - Simplified
Vierendeel Change slab thickness to
10 in. and Haunch thickness to 6 in.
(Case 2 ft - Case 8 ft)
Vierendeel (Case 2 ft) - Simplified
Case 1
Case 2
Span-to-depth ratio = 20, span = 80 ft Span-to-depth ratio = 35, span = 80 ft
Case 7
Case 8
(Case 2 ft - Case 8 ft)
Vierendeel Baseline
Haunch: 24x24x2 in.Slab Thickness: 7.5 in.
Girder spacing: 6 ft
Vierendeel (Case 2 ft) - Simplified
Vierendeel Baseline
Haunch: 24x24x2 in.Slab Thickness: 7.5 in.
Girder spacing: 6 ft (Case 2 ft - Case 8 ft)
Vierendeel (Case 2 ft) - Simplified
Case 3
Case 4
Case 5
Case 6
Vierendeel Change haunch
thickness to 6 in.(Case 2 ft - Case 8 ft)
Vierendeel (Case 2 ft) - Simplified
Vierendeel Change haunch
dimensions to 12x12 in.(Case 2 ft - Case 8 ft)
Vierendeel (Case 2 ft) - Simplified
Vierendeel Change girder spacing to
12 ft(Case 2 ft - Case 8 ft)
Vierendeel (Case 2 ft) - Simplified
Vierendeel Change haunch
thickness to 6 in.(Case 2 ft - Case 8 ft)
Vierendeel (Case 2 ft) - Simplified
Vierendeel Change haunch
dimensions to 12x12 in.(Case 2 ft - Case 8 ft)
Vierendeel (Case 2 ft) - Simplified
Vierendeel Change girder spacing to
12 ft(Case 2 ft - Case 8 ft)
Vierendeel (Case 2 ft) - Simplified
Case 9
Case 10

NCHRP 12-96, Final Report B-5
Table 3. Normal stresses (144-ft span)
Haunch Spacing (ft)
Haunch thickness
(in.)
Top of deck (ksi)
Bottom of deck (ksi)
Top of girder (ksi)
Bottom of girder (ksi)
Haunch Spacing (ft)
Haunch thickness
(in.)
Top of deck (ksi)
Bottom of deck (ksi)
Top of girder (ksi)
Bottom of girder (ksi)
2 2 -0.832 -0.472 -0.598 1.231 2 2 -1.462 -0.832 -0.891 2.3704 2 -0.816 -0.486 -0.605 1.236 4 2 -1.449 -0.842 -0.906 2.3816 2 -0.776 -0.523 -0.613 1.242 6 2 -1.414 -0.872 -0.923 2.3948 2 -0.732 -0.563 -0.621 1.248 8 2 -1.375 -0.905 -0.941 2.406
-0.099 0.091 0.023 -0.016 -0.087 0.073 0.049 -0.036Simplified model NA NA -0.716 -0.572 -0.585 1.227 Simplified model NA NA -1.358 -0.910 -0.866 2.363
-0.116 0.100 -0.014 0.004 -0.105 0.078 -0.025 0.008
2 6 -0.830 -0.481 -0.534 1.175 2 6 -1.422 -0.844 -0.699 2.1724 6 -0.812 -0.494 -0.543 1.181 4 6 -1.407 -0.852 -0.718 2.1856 6 -0.773 -0.528 -0.552 1.188 6 6 -1.373 -0.881 -0.738 2.1998 6 -0.730 -0.567 -0.562 1.194 8 6 -1.335 -0.911 -0.758 2.213
-0.100 0.086 0.028 -0.019 -0.088 0.067 0.059 -0.041Simplified model NA NA -0.540 -0.421 -0.357 1.140 Simplified model NA NA -1.042 -0.684 -0.436 2.145
-0.290 -0.060 -0.177 0.035 -0.381 -0.160 -0.263 0.027
2 2 -0.807 -0.509 -0.591 1.231 2 2 -1.460 -0.844 -0.884 2.3694 2 -0.808 -0.505 -0.599 1.237 4 2 -1.446 -0.852 -0.900 2.3806 2 -0.775 -0.534 -0.607 1.242 6 2 -1.418 -0.874 -0.917 2.3938 2 -0.737 -0.570 -0.614 1.248 8 2 -1.386 -0.900 -0.935 2.405
-0.071 0.061 0.024 -0.017 -0.074 0.057 0.050 -0.036Simplified model NA NA -0.720 -0.576 -0.589 1.228 Simplified model NA NA -1.366 -0.917 -0.874 2.363
-0.087 0.068 -0.002 0.003 -0.093 0.074 -0.011 0.006
2 2 -0.811 -0.383 -0.516 1.718 2 2 -1.342 -0.626 -0.648 3.2464 2 -0.807 -0.384 -0.527 1.725 4 2 -1.354 -0.610 -0.671 3.2636 2 -0.782 -0.406 -0.541 1.736 6 2 -1.334 -0.626 -0.700 3.2848 2 -0.748 -0.438 -0.556 1.746 8 2 -1.306 -0.649 -0.731 3.305
-0.063 0.054 0.040 -0.028 -0.036 0.023 0.083 -0.059Simplified model NA NA -0.681 -0.506 -0.503 1.713 Simplified model NA NA -1.247 -0.712 -0.624 3.237
-0.129 0.122 -0.013 0.005 -0.095 0.086 -0.025 0.009
2 2 -0.681 -0.337 -0.437 1.109 2 2 -1.190 -0.539 -0.581 2.0894 2 -0.674 -0.341 -0.443 1.114 4 2 -1.181 -0.546 -0.593 2.0986 2 -0.659 -0.355 -0.450 1.119 6 2 -1.168 -0.555 -0.609 2.1108 2 -0.634 -0.377 -0.459 1.125 8 2 -1.147 -0.571 -0.627 2.122
-0.047 0.040 0.022 -0.015 -0.043 0.032 0.046 -0.033Simplified model NA NA -0.585 -0.423 -0.428 1.107 Simplified model NA NA -1.103 -0.613 -0.565 2.084
-0.096 0.086 -0.009 0.003 -0.087 0.074 -0.017 0.005
2 6 -0.674 -0.341 -0.380 1.054 2 6 -1.138 -0.549 -0.426 1.9064 6 -0.665 -0.347 -0.388 1.059 4 6 -1.127 -0.555 -0.441 1.9176 6 -0.649 -0.359 -0.398 1.066 6 6 -1.115 -0.562 -0.461 1.9318 6 -0.625 -0.379 -0.407 1.072 8 6 -1.096 -0.576 -0.482 1.945
-0.049 0.038 0.027 -0.018 -0.042 0.027 0.056 -0.039Simplified model NA NA -0.467 -0.329 -0.269 1.039 Simplified model NA NA -0.899 -0.495 -0.277 1.907
-0.207 -0.012 -0.111 0.016 -0.240 -0.054 -0.149 -0.001
Vierendeel (Case 2 ft) - Simplified Vierendeel (Case 2 ft) - Simplified
Vierendeel Change girder spacing to
12 ft
Vierendeel Change girder spacing to
12 ft(Case 2 ft - Case 8 ft) (Case 2 ft - Case 8 ft)
Vierendeel (Case 2 ft) - Simplified
Vierendeel Baseline
Haunch: 24x24x2 in.Slab Thickness: 7.5 in.
Girder spacing: 6 ft
Case 5 Case 11
Case 6 Case 12
Vierendeel (Case 2 ft) - Simplified Vierendeel (Case 2 ft) - Simplified
Vierendeel Change slab thickness to
10 in.
Vierendeel Change slab thickness to
10 in.(Case 2 ft - Case 8 ft) (Case 2 ft - Case 8 ft)
Vierendeel (Case 2 ft) - Simplified Vierendeel (Case 2 ft) - Simplified
Vierendeel Change slab thickness to
10 in. and Haunch thickness to 6 in.
Vierendeel Change slab thickness to
10 in. and Haunch thickness to 6 in.
(Case 2 ft - Case 8 ft) (Case 2 ft - Case 8 ft)
(Case 2 ft - Case 8 ft)
Vierendeel (Case 2 ft) - Simplified
Vierendeel Change haunch thickness
to 6 in.
Vierendeel Change haunch thickness
to 6 in.(Case 2 ft - Case 8 ft)
Case 4 Case 10
Case 2 Case 8
Case 3 Case 9
Vierendeel Change haunch
dimensions to 12x12 in.
Vierendeel Change haunch
dimensions to 12x12 in.(Case 2 ft - Case 8 ft) (Case 2 ft - Case 8 ft)
Vierendeel (Case 2 ft) - Simplified Vierendeel (Case 2 ft) - Simplified
(Case 2 ft - Case 8 ft)
Vierendeel (Case 2 ft) - Simplified Vierendeel (Case 2 ft) - Simplified
Vierendeel Baseline
Haunch: 24x24x2 in.Slab Thickness: 7.5 in.
Girder spacing: 6 ft
Span-to-depth ratio = 20, span = 144 ft Span-to-depth ratio = 35, span = 144 ft
Case 1 Case 7
(Case 2 ft - Case 8 ft)

NCHRP 12-96, Final Report B-6
Table 4. Normal stresses (216-ft span)
Haunch Spacing (ft)
Haunch thickness
(in.)
Top of deck (ksi)
Bottom of deck (ksi)
Top of girder (ksi)
Bottom of girder (ksi)
Haunch Spacing (ft)
Haunch thickness
(in.)
Top of deck (ksi)
Bottom of deck (ksi)
Top of girder (ksi)
Bottom of girder (ksi)
2 2 -0.940 -0.749 -5.025 11.299 2 2 -1.679 -1.188 -7.458 22.3924 2 -0.922 -0.765 -5.054 11.323 4 2 -1.663 -1.202 -7.518 22.4386 2 -0.898 -0.788 -5.087 11.350 6 2 -1.639 -1.221 -7.599 22.4958 2 -0.868 -0.817 -5.123 11.384 8 2 -1.610 -1.246 -7.673 22.549
-0.071 0.068 0.098 -0.085 -0.069 0.057 0.215 -0.157Simplified model NA NA -0.901 -0.763 -4.911 11.258 Simplified model NA NA -1.635 -1.192 -7.261 22.331
-0.038 0.014 -0.114 0.041 -0.044 0.003 -0.197 0.060
2 6 -0.943 -0.754 -4.627 10.932 2 6 -1.661 -1.203 -6.210 21.1264 6 -0.924 -0.770 -4.664 10.960 4 6 -1.644 -1.214 -6.288 21.1776 6 -0.899 -0.792 -4.701 10.988 6 6 -1.428 -1.428 -6.363 21.2358 6 -0.869 -0.820 -4.740 11.016 8 6 -1.592 -1.258 -6.445 21.293
-0.074 0.066 0.113 -0.084 -0.068 0.055 0.235 -0.167Simplified model NA NA -0.664 -0.547 -3.072 10.549 Simplified model NA NA -1.240 -0.870 -3.877 20.877
-0.279 -0.207 -1.555 0.383 -0.421 -0.333 -2.334 0.249
2 2 -0.943 -0.752 -5.008 11.308 2 2 -1.683 -1.189 -7.443 22.4064 2 -0.928 -0.767 -5.034 11.335 4 2 -1.671 -1.199 -7.498 22.4446 2 -0.907 -0.788 -5.063 11.359 6 2 -1.652 -1.215 -7.558 22.4948 2 -0.879 -0.815 -5.094 11.386 8 2 -1.626 -1.238 -7.627 22.544
-0.064 0.062 0.085 -0.078 -0.057 0.049 0.183 -0.138Simplified model NA NA -0.908 -0.769 -4.953 11.268 Simplified model NA NA -1.646 -1.202 -7.329 22.339
-0.035 0.017 -0.055 0.039 -0.038 0.013 -0.114 0.067
2 2 -0.864 -0.638 -4.274 15.434 2 2 -1.490 -0.906 -5.457 30.4254 2 -0.856 -0.644 -4.327 15.477 4 2 -1.485 -0.910 -5.560 30.5096 2 -0.839 -0.660 -4.385 15.523 6 2 -1.470 -0.923 -5.676 30.6018 2 -0.817 -0.680 -4.447 15.570 8 2 -1.449 -0.938 -5.811 30.676
-0.047 0.042 0.173 -0.136 -0.042 0.032 0.355 -0.252Simplified model NA NA -0.829 -0.661 -4.173 15.389 Simplified model NA NA -1.457 -0.924 -5.287 30.356
-0.035 0.024 -0.101 0.045 -0.033 0.017 -0.170 0.069
2 2 -0.768 -0.568 -3.788 10.406 2 2 -1.375 -0.833 -5.125 20.4594 2 -0.763 -0.571 -3.816 10.429 4 2 -1.371 -0.835 -5.183 20.5056 2 -0.750 -0.583 -3.849 10.455 6 2 -1.359 -0.845 -5.250 20.5588 2 -0.732 -0.599 -3.885 10.482 8 2 -1.343 -0.857 -5.339 20.617
-0.036 0.032 0.097 -0.077 -0.032 0.024 0.214 -0.157Simplified model NA NA -0.741 -0.580 -3.707 10.376 Simplified model NA NA -1.347 -0.840 -4.993 20.422
-0.027 0.012 -0.080 0.030 -0.028 0.006 -0.132 0.038
2 6 -0.765 -0.570 -3.428 10.039 2 6 -1.343 -0.843 -4.054 19.2324 6 -0.760 -0.573 -3.462 10.065 4 6 -1.339 -0.844 -4.130 19.2866 6 -0.746 -0.584 -3.503 10.095 6 6 -1.328 -0.852 -4.206 19.3458 6 -0.729 -0.599 -3.544 10.124 8 6 -1.313 -0.864 -4.288 19.404
-0.036 0.030 0.116 -0.085 -0.030 0.021 0.235 -0.172Simplified model NA NA -0.580 -0.440 -2.410 9.830 Simplified model NA NA -1.094 -0.657 -2.671 19.215
-0.185 -0.130 -1.018 0.210 -0.249 -0.186 -1.382 0.016
Vierendeel Change girder spacing to
12 ft(Case 2 ft - Case 8 ft)
Vierendeel (Case 2 ft) - Simplified
Vierendeel Change slab thickness to
10 in.(Case 2 ft - Case 8 ft)
Vierendeel (Case 2 ft) - Simplified
Vierendeel Change slab thickness to
10 in. and Haunch thickness to 6 in.
(Case 2 ft - Case 8 ft)
Vierendeel (Case 2 ft) - Simplified
Vierendeel Change girder spacing to
12 ft(Case 2 ft - Case 8 ft)
Vierendeel (Case 2 ft) - Simplified
Vierendeel Change haunch thickness
to 6 in.(Case 2 ft - Case 8 ft)
Vierendeel (Case 2 ft) - Simplified
Vierendeel Change slab thickness to
10 in. and Haunch thickness to 6 in.
(Case 2 ft - Case 8 ft)
Vierendeel (Case 2 ft) - Simplified
Vierendeel (Case 2 ft) - Simplified
Span-to-depth ratio = 20, span = 216 ft Span-to-depth ratio = 35, span = 216 ft
Case 1 Case 7Vierendeel
BaselineHaunch: 24x24x2 in.
Slab Thickness: 7.5 in.Girder spacing: 6 ft (Case 2 ft - Case 8 ft)
Vierendeel Baseline
Haunch: 24x24x2 in.Slab Thickness: 7.5 in.
Girder spacing: 6 ft (Case 2 ft - Case 8 ft)
Case 4 Case 10
Case 2 Case 8
Case 3 Case 9
Vierendeel (Case 2 ft) - Simplified
Vierendeel Change haunch
thickness to 6 in.(Case 2 ft - Case 8 ft)
Vierendeel (Case 2 ft) - Simplified
Vierendeel Change haunch
dimensions to 12x12 in.(Case 2 ft - Case 8 ft)
Vierendeel (Case 2 ft) - Simplified
Vierendeel Change haunch
dimensions to 12x12 in.(Case 2 ft - Case 8 ft)
Vierendeel (Case 2 ft) - Simplified
Case 5 Case 11
Case 6 Case 12
Vierendeel Change slab thickness to
10 in.(Case 2 ft - Case 8 ft)
Vierendeel (Case 2 ft) - Simplified

NCHRP 12-96, Final Report B-7
B.2 Design Requirement No 7: Deflection of the Composite Section The vierendeel model was loaded only with the live load (i.e. HL93 model) with distribution factor for moment = 1.0, 1.33 dynamic effect added to the HS20 truck, and 1.0 load factor. The load was applied on the top chord of the vierendeel model.
Results of the parametric study are reported in Tables 5 to 7. For every case, the results obtained from the vierendeel model are compared with the results obtained using the simple Euler-Bernoulli beam analysis, where the composite beam is analyzed as a simply supported beam. Analysis of the results reported in Tables 5 to 7 shows that:
Parametric investigation using the Vierendeel Model:
1. Deflection increases when the spacing between joints increases. The maximum increase reported is about 5%, when the spacing between joints is set at 8 ft.
2. Deflection decreases when the thickness of haunch, girder spacing or thickness of the slab increases. This is due to the increase of the top chord inertia.
3. Changing the haunch dimensions has no effect on deflection.
Comparison between the vierendeel and simplified models:
Comparison between the vierendeel and simplified models showed that the vierendeel model showed a 5 to 7 percent increase in the deflection compared to the simple beam model when: (1) a thicker deck or haunch was used, (2) a higher span-to-depth ratio was ued, and (3) wider spacing between the shear connector joints was used. This observation showed that the simple beam model still can be used to determine the deflection of the composite beam after considering a proper reduction factor for the composite beam stiffness. This observation is acknowledged by the American Institute of Steel Structures Manual (AISC, 17th edition 2017), where Section I3 states that “Comparison to short-term deflection tests indicate that the effective moment of inertia, Ieff, is 15 to 30 percent lower than that calculated based on linear elastic theory, Iequiv. Therefore, for realistic deflection calculations, Ieff should be taken 0.75 Iequiv”. This issue was further investigated in the experimental program and a more accurate reduction factor of the composite beam stiffness was developed, as shown in Sections 3.2 and 3.3 of the report.

NCHRP 12-96, Final Report B-8
Table 5. Deflection due to Live Loads (80-ft span)
Haunch Spacing (ft)
Haunch thickness
(in.)
Deflection Due to LL
(Vierendeel Model) in.
Difference % Deflection (Simplified Model) in.
Haunch Spacing (ft)
Haunch thickness (in.)
Deflection Due to LL
(Vierendeel Model) in.
Difference % Deflection (Simplified Model) in.
2 2 0.94 0.0% 2 2 2.81 0.0%
4 2 0.95 1.7% 4 2 2.83 0.8%
6 2 0.96 2.4% 6 2 2.85 1.4%
8 2 0.97 3.4% 8 2 2.88 2.4%
2 6 0.83 0.0% 2 6 2.22 0.0%4 6 0.85 2.2% 4 6 2.25 1.4%6 6 0.86 3.3% 6 6 2.27 2.6%8 6 0.87 4.8% 8 6 2.31 4.3%
2 2 0.94 1.0% 2 2 2.81 0.4%4 2 0.96 2.3% 4 2 2.83 1.1%6 2 0.96 3.0% 6 2 2.85 1.8%8 2 0.97 4.0% 8 2 2.88 2.9%
2 2 0.77 0.0% 2 2 2.24 0.0%4 2 0.78 2.0% 4 2 2.26 1.0%6 2 0.79 3.2% 6 2 2.28 1.9%8 2 0.80 4.7% 8 2 2.31 3.2%
2 2 0.82 0.0% 2 2 2.31 0.0%4 2 0.83 1.8% 4 2 2.33 0.9%6 2 0.84 2.9% 6 2 2.35 1.7%8 2 0.85 4.2% 8 2 2.38 2.9%
2 6 0.72 0.0% 2 6 1.82 0.0%4 6 0.74 2.3% 4 6 1.85 1.6%6 6 0.75 3.8% 6 6 1.88 3.0%8 6 0.76 5.9% 8 6 1.92 5.0%
Change slab thickness to 10 in. and Haunch thickness to 6 in.
Change slab thickness to 10 in. and Haunch thickness to 6 in.
1.80
Span-to-depth ratio = 20, span = 80 ft Span-to-depth ratio = 35, span = 80 ft
Case 7Vierendeel
BaselineHaunch: 24x24x2 in.
Slab Thickness: 7.5 in.Girder spacing: 6 ft
2.82
Case 8
Case 9
Case 10
Case 11
Case 12
Change haunch thickness to 6 in.
Change haunch thickness to 6 in.
2.10
Change haunch dimensions to 12x12 in.
Change haunch dimensions to 12x12 in.
2.82
Change girder spacing to 12 ft
Change girder spacing to 12 ft
2.26
Change slab thickness to 10 in.
Change slab thickness to 10 in.
2.340.85
Case 6
0.71
Case 2
0.86
Case 3
0.80
0.96
Case 1
0.96
Case 4
Case 5
Vierendeel Baseline
Haunch: 24x24x2 in.Slab Thickness: 7.5 in.
Girder spacing: 6 ft

NCHRP 12-96, Final Report B-9
Table 6. Deflection due to Live Loads (144-ft span)
Haunch Spacing (ft)
Haunch thickness
(in.)
Deflection Due to LL
(Vierendeel Model) in.
Difference % Deflection (Simplified Model) in.
Haunch Spacing (ft)
Haunch thickness
(in.)
Deflection Due to LL
(Vierendeel Model) in.
Difference % Deflection (Simplified Model) in.
2 2 1.94 0% 2 2 6.17 0%
4 2 1.97 2% 4 2 6.21 1%
6 2 1.99 2% 6 2 6.22 1%
8 2 2.00 3% 8 2 6.24 1%
2 6 1.82 0% 2 6 5.44 0%4 6 1.86 2% 4 6 5.48 1%6 6 1.87 3% 6 6 5.50 1%8 6 1.88 3% 8 6 5.53 2%
2 2 1.93 0% 2 2 6.16 0%4 2 1.96 1% 4 2 6.18 0%6 2 1.98 2% 6 2 6.21 1%8 2 1.99 3% 8 2 6.22 1%
2 2 1.60 0% 2 2 5.02 0%4 2 1.63 2% 4 2 5.06 1%6 2 1.65 3% 6 2 5.09 1%8 2 1.66 4% 8 2 5.11 2%
2 2 1.74 0% 2 2 5.38 0%4 2 1.77 2% 4 2 5.41 1%6 2 1.79 3% 6 2 5.43 1%8 2 1.80 4% 8 2 5.46 1%
2 6 1.62 0% 2 6 4.70 0%4 6 1.65 2% 4 6 4.74 1%6 6 1.67 3% 6 6 4.77 2%8 6 1.69 4% 8 6 4.80 2%
Span-to-depth ratio = 20, span = 144 ft Span-to-depth ratio = 35, span = 144 ft
Case 1 Case 7
Case 8
Case 9
Case 10
Case 11
Case 12
6.19
5.47
6.21
5.09
5.43
1.88Change haunch thickness
to 6 in.
Case 3
1.99
Vierendeel Baseline
Haunch: 24x24x2 in.Slab Thickness: 7.5 in.
Girder spacing: 6 ftCase 2
Vierendeel Baseline
Haunch: 24x24x2 in.Slab Thickness: 7.5 in.
Girder spacing: 6 ft
Change haunch thickness to 6 in.
1.67Change girder spacing to
12 ft
Case 5
1.99Change haunch
dimensions to 12x12 in.
Case 4
Change haunch dimensions to 12x12 in.
Change girder spacing to 12 ft
1.57Change slab thickness to
10 in. and Haunch thickness to 6 in.
1.80Change slab thickness to
10 in.
Case 6
Change slab thickness to 10 in.
Change slab thickness to 10 in. and Haunch thickness to 6 in.
4.51

NCHRP 12-96, Final Report B-10
Table 7. Deflection due to Live Loads (216-ft span)
Haunch Spacing (ft)
Haunch thickness
(in.)
Deflection Due to LL
(Vierendeel Model) in.
Difference % Deflection (Simplified Model) in.
Haunch Spacing (ft)
Haunch thickness
(in.)
Deflection Due to LL
(Vierendeel Model) in.
Difference % Deflection (Simplified Model) in.
2 2 3.89 0.0% 2 2 13.23 0.0%
4 2 3.90 0.1% 4 2 13.24 0.0%
6 2 3.90 0.1% 6 2 13.25 0.1%
8 2 3.90 0.2% 8 2 13.25 0.1%
2 6 3.71 0.0% 2 6 12.11 0.0%4 6 3.72 0.1% 4 6 12.12 0.1%6 6 3.72 0.2% 6 6 12.13 0.2%8 6 3.72 0.3% 8 6 12.14 0.3%
2 2 3.89 0.0% 2 2 13.23 0.0%4 2 3.89 0.1% 4 2 13.24 0.1%6 2 3.90 0.1% 6 2 13.24 0.1%8 2 3.90 0.2% 8 2 13.25 0.2%
2 2 3.23 0.0% 2 2 11.12 0.0%4 2 3.24 0.2% 4 2 11.13 0.1%6 2 3.24 0.2% 6 2 11.14 0.2%8 2 3.24 0.3% 8 2 11.15 0.3%
2 2 3.53 0.0% 2 2 11.87 0.0%4 2 3.54 0.1% 4 2 11.88 0.1%6 2 3.54 0.2% 6 2 11.89 0.1%8 2 3.54 0.3% 8 2 11.90 0.2%
2 6 3.35 0.0% 2 6 10.79 0.0%4 6 3.36 0.2% 4 6 10.81 0.1%6 6 3.36 0.3% 6 6 10.82 0.3%8 6 3.37 0.5% 8 6 10.84 0.4%
BaselineHaunch: 24x24x2 in.
Slab Thickness: 7.5 in.Girder spacing: 6 ft
BaselineHaunch: 24x24x2 in.
Slab Thickness: 7.5 in.Girder spacing: 6 ft
Change haunch thickness to 6 in.
Change haunch dimensions to 12x12 in.
Change girder spacing to 12 ft
Change slab thickness to 10 in.
Change slab thickness to 10 in. and Haunch thickness to
6 in.
Change haunch thickness to 6 in.
Change haunch dimensions to 12x12 in.
Change girder spacing to 12 ft
Change slab thickness to 10 in.
Change slab thickness to 10 in. and Haunch thickness to 6 in.
Case 1 Case 7
Case 8
Case 9
Case 10
Case 11
Case 12
13.16
11.82
13.20
11.10
3.18
3.52
Case 6
11.84
10.40
3.23
Case 5
3.88
Case 4
3.57
Case 3
3.87
Case 2
Span-to-depth ratio = 20, span = 216 ft Span-to-depth ratio = 35, span = 216 ft

NCHRP 12-96, Final Report B-11
B.3 Design Requirement No 8: Interface Shear The vierendeel model was loaded with the following combination of composite loads:
DC Loads: Barrier weight = (2 barriers)(0.3 k/ft/barrier)/(6 beams)
DW Loads: Wearing surface = (girder spacing)(2 inch thick layer)(0.150 kcf)
Live Load: HL93 with distribution factor for moment determined using the LRFD Specifications
STRENGTH I limit state was used to determine the load factors. The loads were applied on the top chord of the vierendeel model.
The following procedure was used to obtain the interface shear from the vierendeel model:
• The maximum shear generated in the joints (middle element of the vertical members of the vierendeel model) at a distance “dv” from the end support is recorded.
• The shear flow = Maximum shear force/haunch spacing
The results obtained from the vierendeel model are compared with the results obtained from the simple beam model. The simple beam model utilizes the Euler-Bernoulli Beam Theory with the composite section properties. The shear flow from the simplified model is determined as follows:
• The maximum vertical shear force at a distance “dv” from the end support is recorded. • The shear flow = Maximum shear force/ dv
For both models, the distance “dv” is taken as the greater of 0.9de and 0.72hc, where:
de = effective depth from the extreme compression fiber to the resultant of the tensile reinforcement (an average value of 0.9hc was used)
hc = overall depth of the composite section
Results of the parametric study are reported in Tables 8 to 10. For every case, the results obtained from the vierendeel model are compared with the results obtained using the simple Euler-Bernoulli beam analysis, where the composite beam is analyzed as a simply supported beam. Analysis of the results reported in Tables 8 to 10 shows that:
Parametric investigation using the Vierendeel Model:
1. Interface shear (i.e. shear flow) decreases when the spacing between joints increases. Regardless the span length or the span-to-depth ratio, the interface shear decreases by about 10 percent when the spacing between joints increases from 2 ft to 8 ft.
2. Changing the thickness of the haunch or the slab has a small effect on the interface shear, especially when the span-to-depth ratio is low.
3. Interface shear decreases when the span length increases.
Comparison between the vierendeel and simplified models:
Interface shear determined by the simple beam model is always higher than the interface shear determined by the vierendeel model. Ratio of shear flow determined by the simple beammodel to the shear flow determined by the vierendeel model is about 1.15 to 1.30 across the board.
Recommendation for determining interface shear in the composite section:
It is safe and reasonable to use the simplified model as an approximate approach. In this case, it is expected that the horizontal shear reinforcement will be somewhat overestimated.

NCHRP 12-96, Final Report B-12
A more accurate estimate of the interface shear can be determined using the vierendeel model.
Please, note that the values of horizontal shear reported in Tables 8 to 10, developed by using the vierendeel or simple beam model, are not intended to be used for design of real bridges. These tables are only developed to conduct the parametric study and to compare the vierendeel model with the simple beam model.

NCHRP 12-96, Final Report B-13
Table 8. Interface shear (80-ft span)
2 2 71.16 35.58 2 2 133.75 66.874 2 135.87 33.97 4 2 256.88 64.226 2 180.71 31.62 6 2 340.17 59.538 2 245.76 30.72 8 2 463.35 57.92
2 6 68.23 34.11 2 6 122.89 61.454 6 126.73 31.68 4 6 230.58 57.656 6 171.24 29.97 6 6 310.91 54.418 6 231.50 28.94 8 6 420.80 52.60
2 2 79.74 39.87 2 2 135.55 67.784 2 144.05 36.01 4 2 259.84 64.966 2 185.95 32.54 6 2 341.18 59.718 2 252.26 31.53 8 2 464.61 58.08
2 2 115.70 57.85 2 2 206.51 103.264 2 220.00 55.00 4 2 395.19 98.806 2 294.00 51.45 6 2 525.66 91.998 2 398.45 49.81 8 2 714.04 89.26
2 2 75.96 37.98 2 2 136.20 68.104 2 145.23 36.31 4 2 261.69 65.426 2 192.76 33.73 6 2 364.35 63.768 2 262.14 32.77 8 2 471.81 58.98
2 6 72.00 36.00 2 6 123.58 61.794 6 134.26 33.57 4 6 232.24 58.066 6 180.46 31.58 6 6 312.67 54.728 6 243.64 30.46 8 6 423.23 52.90
Span-to-depth ratio = 35, span = 80 ft
Change haunch thickness to 6 in.
Change haunch thickness to 6 in.
Change haunch dimensions to 12x12 in.
Change haunch dimensions to 12x12 in.
Change girder spacing to 12 ft
Change girder spacing to 12 ft
Change slab thickness to 10 in.
Change slab thickness to 10 in.
Change slab thickness to 10 in. and Haunch thickness to 6 in.
Change slab thickness to 10 in. and Haunch
thickness to 6 in.
Case 3 Case 9
Case 4 Case 10
Case 5 Case 11
Case 6 Case 12
Haunch Spacing (ft) Haunch
thickness (in.)
Maximum horizontal shear -
Vierendeel Model (kips)
Shear flow - Vierendeel
Model (kip/ft.)
Simplified Model (V/dv)
(kip/ft)
Haunch Spacing (ft)
Haunch thickness
(in.)
Maximum horizontal shear - Vierendeel Model
(kips)
Shear flow - Vierendeel
Model (kip/ft.)
Simplified Model (V/dv)
(kip/ft)
Vierendeel Baseline
Haunch: 24x24x2 in.Slab Thickness: 7.5 in.
Vierendeel Baseline
Haunch: 24x24x2 in.Slab Thickness: 7.5 in.
Case 1 Case 7
Span-to-depth ratio = 20, span = 80 ft
106.10
47.94 76.45
47.46 75.71
44.17 68.00
Case 2 Case 8
42.31 63.89
45.35 70.70
66.56

NCHRP 12-96, Final Report B-14
Table 9. Interface shear (144-ft span)
2 2 51.46 25.73 2 2 97.56 48.78
4 2 98.42 24.61 4 2 187.19 46.80
6 2 144.83 24.14 6 2 275.70 45.95
8 2 188.61 23.58 8 2 359.19 44.90
2 6 50.64 25.32 2 6 94.14 47.074 6 96.10 24.02 4 6 179.79 44.956 6 138.55 23.09 6 6 260.17 43.368 6 180.72 22.59 8 6 340.37 42.55
2 2 36.17 36.17 2 2 55.68 55.684 2 64.97 32.48 4 2 105.45 52.726 2 112.59 28.15 6 2 195.87 48.978 2 157.30 26.22 8 2 282.01 47.00
2 2 86.11 43.06 2 2 155.45 77.724 2 164.02 41.01 4 2 297.13 74.286 2 241.46 40.24 6 2 438.20 73.038 2 314.50 39.31 8 2 571.07 71.38
2 2 56.81 28.41 2 2 104.31 52.154 2 109.08 27.27 4 2 200.40 50.106 2 159.89 26.65 6 2 294.78 49.138 2 207.86 25.98 8 2 383.84 47.98
2 6 55.64 27.82 2 6 99.54 49.774 6 105.48 26.37 4 6 189.87 47.476 6 152.38 25.40 6 6 275.28 45.888 6 197.88 24.73 8 6 359.50 44.94
Change haunch thickness to 6 in.
Change haunch dimensions to 12x12 in.
Change girder spacing to 12 ft
Change slab thickness to 10 in.
Change slab thickness to 10 in. and Haunch thickness to 6 in.
Span-to-depth ratio = 20, span = 144 ft Span-to-depth ratio = 35, span = 144 ft
Vierendeel Baseline
Haunch: 24x24x2 in.Slab Thickness: 7.5 in.
Girder spacing: 6 ft
Vierendeel Baseline
Haunch: 24x24x2 in.Slab Thickness: 7.5 in.
Girder spacing: 6 ft
Case 6 Case 12
35.90 57.69Change slab thickness to
10 in. and Haunch thickness to 6 in.
Case 5 Case 11
37.46 61.61
Case 4 Case 10
52.74 88.05Change girder spacing to
12 ft
Change slab thickness to 10 in.
Case 3 Case 9
38.73 64.70
38.51 64.34
Case 2 Case 8
36.86 60.08Change haunch thickness
to 6 in.
Change haunch dimensions to 12x12 in.
Case 1 Case 7
Haunch Spacing (ft)
Haunch thickness (in.)
Maximum horizontal shear
- Vierendeel Model (kips)
Shear flow - Vierendeel
Model (kip/ft.)
Simplified Method (V/dv) (kip/ft)
Haunch Spacing (ft) Haunch
thickness (in.)
Maximum horizontal shear -
Vierendeel Model (kips)
Shear flow - Vierendeel
Model (kip/ft.)
Simplified Method (V/dv) (kip/ft)

NCHRP 12-96, Final Report B-15
Table 10. Interface shear (216-ft span)
2 2 46.93 23.47 2 2 85.88 42.944 2 91.09 22.77 4 2 166.48 41.626 2 134.03 22.34 6 2 245.92 40.998 2 163.12 20.39 8 2 298.05 37.26
2 6 46.25 23.12 2 6 84.19 42.094 6 89.60 22.40 4 6 163.49 40.876 6 130.75 21.79 6 6 237.33 39.568 6 160.52 20.07 8 6 291.97 36.50
2 2 52.81 26.41 2 2 89.55 44.784 2 99.65 24.91 4 2 171.77 42.946 2 143.16 23.86 6 2 250.20 41.708 2 172.99 21.62 8 2 303.20 37.90
2 2 76.70 38.35 2 2 134.51 67.264 2 149.20 37.30 4 2 261.21 65.306 2 218.20 36.37 6 2 384.20 64.038 2 267.44 33.43 8 2 468.29 58.54
2 2 51.58 25.79 2 2 92.22 46.114 2 100.19 25.05 4 2 178.81 44.706 2 147.16 24.53 6 2 263.85 43.978 2 179.27 22.41 8 2 320.10 40.01
2 6 50.54 25.27 2 6 89.60 44.804 6 97.86 24.46 4 6 173.96 43.496 6 142.81 23.80 6 6 252.55 42.098 6 175.14 21.89 8 6 310.57 38.82
BaselineHaunch: 24x24x2 in.
Slab Thickness: 7.5 in.Girder spacing: 6 ft
Change haunch thickness to 6 in.
Change haunch dimensions to 12x12 in.
Change girder spacing to 12 ft
Change slab thickness to 10 in.
Change slab thickness to 10 in. and Haunch thickness to 6 in.
BaselineHaunch: 24x24x2 in.
Slab Thickness: 7.5 in.Girder spacing: 6 ft
Change haunch thickness to 6 in.
Change haunch dimensions to 12x12 in.
Change girder spacing to 12 ft
Change slab thickness to 10 in.
Change slab thickness to 10 in. and Haunch
thickness to 6 in.
Span-to-depth ratio = 20, span = 216 ft Span-to-depth ratio = 35, span = 216 ft
Haunch thickness
(in.)
Maximum horizontal shear - Vierendeel Model
(kips)
Shear flow - Vierendeel
Model (kip/ft)
Simplified Method (V/dv) (kip/ft)
Case 1 Case 7
Haunch Spacing (ft)
Haunch thickness
(in.)
Maximum horizontal shear - Vierendeel Model
(kips)
Shear flow - Vierendeel
Model (kip/ft)
Simplified Method (V/dv) (kip/ft)
Haunch Spacing (ft)
Case 3 Case 9
33.83 57.83
33.70 57.61
Case 2 Case 8
32.69 54.87
Case 5 Case 11
33.06 55.87
Case 4 Case 10
45.35 77.47
Case 6 Case 12
32.09 53.29

NCHRP 12-96, Final Report B-16
B.4 Design Requirement No 9: Vertical Shear Since the slab is supported on the girder only at the locations of the discrete joints, only the web of the girder should be used in the design of the vertical shear reinforcement, without any help from the slab.
In a typical bridge, the non-composite loads (i.e. girder, haunch and slab weight) are supported by the girder, while the composite loads (i.e. parapet, wearing surface and transient loads) are supported on the composite slab-girder system. The shear force due to the non-composite loads can be easily determined using the simple Euler-Bernoulli Beam Theory.
The shear force due to the composite loads can be determined using one of the following models. The first model is the vierendeel model as discussed earlier. This model gives a more realistic picture of the behavior of the slab-girder system because the slab is connected with the girder only at the locations of the discrete joints. In this case, the shear force that is reported in the bottom chord of the vierendeel model (i.e. the girder), should be used to design for the vertical reinforcement in the girder. The second model is the simplified model using the simple Euler-Bernoulli Beam Theory.
In order to compare the effect of using both models on the amount of vertical reinforcement in the girder, the research team selected Case 1 through Case 5 for the 80 ft span, and ran the analysis using these models. The following loads were considered in the analysis:
Non-composite loads:
Girder weight = 0.798 kip/ft
Slab weight = (0.150 kcf)(Slab thickness)(Girder spacing)
Composite loads:
Barrier weight = (2 barriers)(0.3 k/ft/barrier)/(6 beams)
Wearing surface = (girder spacing)(2 inch thick layer)(0.150 kcf)
Live Load: HL93 with distribution factor for moment determined using the LRFD Specifications
STRENGTH I limit state was used to determine the load factors.
Table 11 gives a summary of the parametric study as well as the results of the required shear reinforcement. The last two columns of this table show the comparison of the required spacing of 2 No. 5 bars, between the vierendeel and the simplified model.
Analysis of the results has shown that the shear force due to the composite loads obtained from the simplified model is about 10 percent higher than the shear forces obtained from the vierendeel model, regardless the haunch spacing, haunch dimensions, girder spacing or thickness of the slab. However, this increase has a small effect on the spacing of the shear reinforcement.
Recommendations for determining vertical shear in composite sections:
• It is safe and reasonable to use the simplified model to determine the vertical shear due to composite.
• The girder web without any help from the slab should be used to check for vertical shear.

NCHRP 12-96, Final Report B-17
Table 11. Vertical Shear due to non-composite and composite loads
* dv was determined based on the height of the girder
Vertical Shear (Vierendeel
model)
Vertical Shear
(Simplified model)
Vierendeel model
Simplified model
Vierendeel model
Simplified model
Vierendeel model
Simplified model
4 160.10 223.02 206.19 6.93
8 167.80 230.72 214.74 6.65
4 160.20 223.12 206.30 6.928 167.00 229.92 213.85 6.68
4 162.90 225.82 209.30 6.838 166.48 229.40 213.28 6.70
4 203.97 291.78 282.59 5.058 223.30 311.11 304.07 4.70
4 142.10 213.10 195.17 7.328 157.19 228.19 211.93 6.74
41.61 339.44 4.21
41.61 240.83 5.93
Vc (kips)
Beta = 2.0, f'c = 6 ksi, bv = 7 in., dv = 38.4 in.
Vs = (Vu/0.9)-Vc(kips)
Spacing of 2#5 bars (in.)
231.85 6.1641.61
41.61 231.85 6.16
41.61 231.85 6.16
246.12
246.12
342.95
254.20
Vertical shear due to composite loads (kips)
case 1
Case 2
Case 3
Case 4
Case 5
Haunch Spacing (ft) 80-ft span,
Span-to-depth = 20
Change girder spacing to 12 ft
255.14
Change slab thickness to 10 in.
183.20
Vertical shear due to non-
composite loads (kips)
62.92
62.92
62.92
87.81
71.00
Vierendeel Baseline
Haunch: 24x24x2 in.Slab Thickness: 7.5 in.
Girder spacing: 6 ft
183.20
Change haunch thickness to 6 in.
183.20
Change haunch dimensions to 12x12 in.
183.20
Total Vertical Shear (kips)
246.12

NCHRP 12-96, Final Report B-18
B.5 Design Requirement No 10: Distribution Factors B.5.1 Finite element (FE) details Distribution factor for moment and shear are key components for design of a bridge superstructure. Article 4.6.2.2 of the AASHTO LRFD Specifications provides a group of tables that are used to determine these factors for interior and exterior beams of slab-beam bridges. Provisions of this article come primarily from the research conducted by Zokaie et al. (1991), where the slab was assumed to be supported by a continuous haunch. The RT ran the following investigation to make sure that the provisions of Article 4.6.2.2 are safe to be used with slab-beam bridges where the slab is supported by a system of discrete joints.
A three-dimensional (3D) finite element (FE) model was used in the investigation. In this model, the full superstructure of a bridge was modeled. The slab and the haunch were modeled using the 8-node linear reduced integration brick elements (C3D8R). Each supporting girder was modeled using a set of 8 equivalent beams spread over a distance equal to the width of the top flange of the girder. The equivalent beams were modeled using 3D frame elements that take into consideration the shift of the girder centroid from the bottom soffit of the haunch in their stiffness matrix. Geometrical properties of each set of equivalent beams (including height, moment of inertia and cross sectional area) were equal to those of a single beam line. The contact surfaces between the slab and the discrete joints, and between the discrete joints and the girders were fully tied to emulate full composite action. Figure 1 shows a schematic of the FE model used in the investigation.
Figure 1. Details of the FE model used in the investigation for the distribution factors
Discrete joints were spaced at 2, 4, 6, and 8 ft, on center (Cases B2, B4, B6 and B8 respectively). Dimensions of the discrete joints for all these cases were taken as follow:
Length (parallel to traffic) = 12 in.
Width (normal to traffic) = width of the top flange of the supporting girder
ABAQUS, a commercial finite element (FE) package; was used to build the FE models.
The analysis was conducted at the Colonial One High Performance Computing Facility at the George Washington University. The following steps were used to determine the Live load distribution factor for moment (DFM):
1. Each FE model was then analyzed due to non-composite and composite dead loads plus the LRFD HL-93 live load. Three live load scenarios were considered; i.e. one lane loaded, two lanes loaded and three lanes loaded. In each live load scenario, stresses at the point of maximum bending moment of the interior girder were collected and the resulting bending moment was calculated.

NCHRP 12-96, Final Report B-19
2. Distribution factor for moment was determined as follows.
( ) ( )
1
jj n
ii
M mDFM
M=
=
∑
Where: DFMj = Live load distribution factor for moment of girder j Mj = Live load bending moment of girder j (determined form Step 1)
1
n
ii
M=∑ = Sum of live load moment for all girders
m = LRFD multi presence factor
= 1.2 for one lane loaded, 1.0 for two lanes loaded, 0.85 for three lanes loaded
The steps used to determine the live load distribution factor for shear (DFV) were similar to the steps used to determine the DFM except that the location of the HL-93 live load model was adjusted to maximize the shear force towards the end of the girder. The DFV was calculated as follow:
( ) ( )
1
jj n
ii
V mDFV
V=
=
∑
Where: DFVj = Live load distribution factor for shear of girder j Vj = Live load shear of girder j
1
n
ii
V=∑ = Sum of live load shear for all girders
m = LRFD multi presence factor
= 1.2 for one lane loaded, 1.0 for two lanes loaded, 0.85 for three lanes loaded
B.5.2 Calibration of the FE model This case was used to validate the FE methodology developed to model the girders with a set of equivalent beams. The case study consisted of a single 60 ft long, 23.82 inch wide x 72 inch deep beam, and an 8-inch thick slab made composite with the beam. The dimensions of the beam were selected to match the height and moment of inertia of the Florida new I-Beam (FIB72). Three values were considered for the slab width; 1.986 ft, 6 ft and 10 ft. For each slab width, the RT built two FE models. Both models used the 8-node brick element to model the slab. The first model used the 8-node brick element to model the girder, and the slab and beam are connected using surface-to-surface tying. The second model used the equivalent beams concept to model the girder, where the original beam was replaced by 5 equivalent beams as shown in Figure 2, and the slab and beam are connected using surface-to-node tying. The composite slab-beam system was analyzed under the weight of the beam and the slab assuming elastic material behavior, '
cf = 5 ksi and cw = 150 pcf for the slab and beam.

NCHRP 12-96, Final Report B-20
Figure 2. Case study No. 1: The FE models using the 5 equivalent beam lines
Table 12 shows the comparison of the maximum deflection between the two models as well as the comparison with the analytical solution using the Bernoulli-Euler Beam Theory that is commonly used in the analysis. Table 13 shows the normal stress distribution at midspan for the case with 120-inch wide slab.
Table 12. Case study No. 1: Deflection at midspan (inch)
FE Model 1 (Brick Elements for
the girder)
FE Model 2 (5 equivalent beams for
the girder)
Analytical solution (Bernoulli-Euler Beam
Theory) 1.986 ft wide slab 0.13291 0.13685 0.13290
6 ft wide slab 0.12052 0.11822 0.11320 10 ft wide slab 0.11903 0.11633 0.10951
(Positive deflection indicates downward displacement) Table 13. Case study No. 1: Normal stresses in the slab (ksi) for slab width = 120 inch
Distance from top surface of the slab (in.)
FE Model 1 (Brick Elements for
the girder)
FE Model 2 (5 equivalent beams
for the girder)
Analytical solution (Bernoulli-Euler Beam Theory)
0 (Slab top surface) -0.249090 -0.241012 -0.25776 2 -0.240882 -0.236619 -0.24037 4 -0.224429 -0.227858 -0.22299 6 -0.209201 -0.219192 -0.20560
8 (slab bottom surface) -0.198836 -0.214896 -0.18821 8 (beam top surface) -0.198836 -0.214896 -0.18821
80 (beam bottom surface) +0.43776 +0.43776 +0.43774 (Positive stress indicates tension)
B.5.3 Parametric study The RT selected four design examples that represent a wide range of parameters that are commonly used on bridges today. Table 14 summarizes the basic design criteria of these examples. Example 2 was adopted from Design Example 9.1(b) of the PCI Bridge Design Manual (2011), and Example 3 was adopted from Design Example 1 of the American Iron and Steel Institute (1999), with some minor changes.

NCHRP 12-96, Final Report B-21
Table 14. Basic design criteria of the design examples
The DFM and DFV determined for the four examples was compared with the distribution factors determined according to the AASHTO LRFD Specifications. For each case, the analysis was conducted for a case with a continuous haunch (Case B0) and a haunch spacing from 2 to 8 ft (Cases B2 to B8).
In order to study the effect of changing some of the basic criteria on the distribution factors, the following parametric investigation was conducted, as shown in Table 15.

NCHRP 12-96, Final Report B-22
Table 15. Criteria of the parametric investigation
The distribution factors for moment and shear obtained from the FE analysis and the LRFD Specifications are given in Tables 16 through 19, and Figures 3 through 12.
Figure 3 and 4 show the percentage of bending moment generated by the girder and the slab/haunch, respectively. These figures give a clear idea about the effect of increasing the haunch spacing on the distribution of the total moment between the slab and the girder.
Table 20 gives the distribution factors after changing some of the basic criteria, and compare them with the distribution factors obtained from the basic example and the distribution factor obtained from the LRFD Specifications as well.
The FE investigation on the distribution factors shows that:
1. The DFM and DFV of the AASHTO LRFD Specifications are always higher than those obtained by the FE analysis regardless the number of loaded lanes, spacing between the discrete joints, type of the supporting girders, and span length of the bridge.
This observation is consistent with the results obtained from similar previous studies that provided comparison between the LRFD DFM with DFM determined by FE analysis. For example, Parr et al. (2001) found that the DFM obtained from the FE analysis was 6 to 28 percent lower than that obtained using the LRFD DFM. Also, see May (2008) and Gheitasi and Harris (2014) had similar observations. The RT team believes that modeling the slab as a continuum using solid brick elements allows the analysis to capture the arching effect inside the slab and to realistically distribute the live load to a relatively large number of girders. Also, the RT believes that the grillage analysis, that was used in early 1990s (Zokaie et al. 1991) to develop the formulas for the distribution factors and adopted by the LRFD Specifications (2015), was modeled the slab as “wire frame” element, and therefore did not fully capture the multi-dimensional behavior of the slab. It led to relatively high (conservative) values of distribution factors.
2. The DFM and DFV increases as the spacing between the discrete joints increases. However, this increase is insignificant.
3. Investigation of the DFM shows that percentage of moment resisted by the girder (compared to that resisted by the slab) slightly increases when the spacing between the discrete joints increases from 2 to 8 ft. This behavior is illustrated in Figures 11 and 12, which give the breakdown of the bending moment between the slab and the girder. The FE analysis also shows almost no increase of the bending moment resisted by the girder alone as the spacing between joints increases from 2 to 6 ft.
4. The DFV is not sensitive to the spacing between the discrete joints.
Parameters1- Girder concrete strength2- Slab concrete strength3- Slab thickness4- Haunch length 5- Haunch thickness Example 3 From 2 in. to 6 in.
Example 1 From 4 ksi to 8 ksi
Example 3 From 12 in. to 24 in.Example 1 From 7.5 in. to 10 in.
From 8 ksi to 12 ksiExample 1Example considered in the investigation Change

NCHRP 12-96, Final Report B-23
6. The RT believes that lower values of DFM and DFV could be achieved from the FE analysis if the traffic barriers and intermediate diaphragms were incorporated in the analysis. This is because the barriers and diaphragms increase the stiffness of the deck and enhance its ability to distribute live load to more girders. For this reason and also there are many variations of barriers and intermediate diaphragms across the United States, the RT did not incorporate these elements into the analysis.
7. The parametric study conducted to study the effect of changing some of the basic criteria and reported in Table 16 shows that:
• Increasing the girder stiffness, increases the girder ability to attract more loads and leads to a minor increase in the distribution factors (Parameter 1).
• Increasing the slab stiffness, increases the slab ability to distribute the loads to a larger number of girders and leads to a minor decrease in the distribution factors (Parameters 2 & 3).
• Increasing the haunch thickness or length does have almost no effect on the distribution factors (Parameters 4 & 5).
Recommendation:
It is conservative and reasonable to use the distribution factor for moment and shear given by the LRFD Specifications for slab-I Beam bridges, where the slab is supported by discrete joints up to 8 ft spacing.

NCHRP 12-96, Final Report B-24
Figure 3. Example 1: Span 100 ft, New FIB-36
Figure 4. Example 2: Span 120 ft, PCI AASHTO BT-72

NCHRP 12-96, Final Report B-25
Figure 5. Example 3: Span 160 ft, Built-up Steel Girder
Figure 6. Example 4: Span 216 ft, Built-up Steel Girder

NCHRP 12-96, Final Report B-26
Table 16. Distribution factors of Example 1
Table 17. Distribution factors of Example 2
Table 18. Distribution factors of Example 3
Table 19. Distribution factors of Example 4
DFM Number of lanes B0 B2 B4 B6 B8
1 0.257 0.259 0.256 0.264 0.2652 0.390 0.398 0.391 0.391 0.40312
DFV Number of lanes B0 B2 B4 B6 B8
1 0.500 0.500 0.510 0.510 0.5102 0.680 0.690 0.690 0.690 0.69012
LRFD
FE
FE
LRFD
Haunch Spacing
Haunch Spacing
Example 1
Example 1
0.3850.533
0.6000.671
DFM Number of lanes B0 B2 B4 B6 B8
1 0.448 0.454 0.463 0.472 0.4732 0.638 0.645 0.655 0.665 0.66512
DFV Number of lanes B0 B2 B4 B6 B8
1 0.602 0.590 0.580 0.580 0.6002 0.641 0.670 0.664 0.667 0.65512
Example 2 Haunch Spacing
0.720
0.499
FE
LRFD0.884
Example 2 Haunch Spacing
0.732
FE
LRFD
DFM Number of lanes B0 B2 B4 B6 B8
1 0.420 0.420 0.428 0.425 0.4212 0.652 0.627 0.663 0.652 0.65012
DFV Number of lanes B0 B2 B4 B6 B8
1 0.801 0.801 0.793 0.801 0.7822 1.060 1.061 1.063 1.061 1.06212
FE
LRFD 0.8701.130
Example 3 Haunch Spacing
FE
LRFD 0.5330.830
Example 3 Haunch Spacing
DFM Number of lanes B0 B2 B4 B6 B8
1 0.335 0.336 0.420 0.419 0.4292 0.487 0.489 0.501 0.494 0.50612
DFV Number of lanes B0 B2 B4 B6 B8
1 0.617 0.620 0.625 0.625 0.6242 0.773 0.774 0.774 0.773 0.77312
Example 4 Haunch Spacing
FE
LRFD 0.7600.952
Example 4 Haunch Spacing
FE
LRFD 0.4340.674

NCHRP 12-96, Final Report B-27
Figure 7. Distribution factors of Example 1
0.000
0.100
0.200
0.300
0.400
0.500
0.600
0.700
0.800
0.900
1.000
1.100
1.200
B0 B2 B4 B6 B8
DFM
Haunch Spacing
One-Lane
Two Lanes
LRFD: One lane
LRFD: Two lanes
0.000
0.100
0.200
0.300
0.400
0.500
0.600
0.700
0.800
0.900
1.000
1.100
1.200
B0 B2 B4 B6 B8
DFM
Haunch Spacing
One-Lane
Two Lanes
LRFD: One lane
LRFD: Two lanes

NCHRP 12-96, Final Report B-28
Figure 8. Distribution factors of Example 2
0.000
0.100
0.200
0.300
0.400
0.500
0.600
0.700
0.800
0.900
1.000
1.100
1.200
B0 B2 B4 B6 B8
DFM
Haunch Spacing
FE: One Lane
FE: Two Lanes
LRFD: One lane
LRFD: Two lanes
0.000
0.100
0.200
0.300
0.400
0.500
0.600
0.700
0.800
0.900
1.000
1.100
1.200
B0 B2 B4 B6 B8
DFV
Haunch Spacing
FE: One Lane
FE: Two Lanes
LRFD: One lane
LRFD: Two lanes

NCHRP 12-96, Final Report B-29
Figure 9. Distribution factors of Example 3
0.000
0.100
0.200
0.300
0.400
0.500
0.600
0.700
0.800
0.900
1.000
1.100
1.200
B0 B2 B4 B6 B8
DFM
Haunch Spacing
FE: One Lane
FE: Two Lanes
LRFD: One lane
LRFD: Two lanes
0.000
0.100
0.200
0.300
0.400
0.500
0.600
0.700
0.800
0.900
1.000
1.100
1.200
B0 B2 B4 B6 B8
DFV
Haunch Spacing
FE: One Lane
FE: Two Lanes
LRFD: One lane
LRFD: Two lanes

NCHRP 12-96, Final Report B-30
Figure 10. Distribution factors of Example 4
0.000
0.100
0.200
0.300
0.400
0.500
0.600
0.700
0.800
0.900
1.000
1.100
1.200
B0 B2 B4 B6 B8
DFM
Haunch Spacing
FE: One Lane
FE: Two Lanes
LRFD: One lane
LRFD: Two lanes
0.000
0.100
0.200
0.300
0.400
0.500
0.600
0.700
0.800
0.900
1.000
1.100
1.200
B0 B2 B4 B6 B8
DFV
Haunch Spacing
FE: One Lane
FE: Two Lanes
LRFD: One lane
LRFD: Two lanes

NCHRP 12-96, Final Report B-31
Figure 11: Percentage of the live load moment generated by the girder (Design Example 2,
Concrete Girder, Span = 120 ft)
Figure 12: Percentage of the live load moment generated by the slab and the haunch (Design
Example 2, Concrete Girder, Span = 120 ft)
50
55
60
65
70
75
80
85
90
95
100
0 2 4 6 8
Perc
enta
ge
Haunch Spacing (ft)
one Lane
Two Lanes
Three Lanes
Percentage of moment resisted by Girder
0
5
10
15
20
25
30
35
40
45
50
0 2 4 6 8
Perc
enta
ge
Haunch Spacing (ft)
one Lane
Two Lanes
Three Lanes
Percentage of moment resisted by Slab & Haunch

NCHRP 12-96, Final Report B-32
Table 20. Effect of changing the design parameters on the distribution factor
Parameter under investigation B6 B8 LRFD B6 B8 LRFD
Base line (Concrete St. = 8 ksi) 0.391 0.403 0.690 0.690
(Concrete St. = 12 ksi) 0.397 0.414 0.694 0.694
Base line (Concrete St. = 4 ksi) 0.391 0.403 0.690 0.690
(Concrete St. = 8 ksi) 0.365 0.376 0.679 0.679
Base line (Thickness = 7.5 in.) 0.391 0.403 0.690 0.690
(Thickness = 10 in.) 0.366 0.360 0.540 0.540
Base line (Length = 12 in.) 0.652 0.650 1.061 1.061
(Length = 24 in.) 0.649 0.640 1.061 1.062
Base line (tThickness = 2 in.) 0.652 0.650 1.061 1.061
(Thickness = 6 in.) 0.667 0.657 1.071 1.071
5- Change haunch thickness of Example 3 From 2 in. to 6 in.
0.830 1.130
0.671
3- Change slab thickness of Example 1 From 7.5 in. to 10 in.
0.533 0.671
4- Change haunch length of Example 3 From 12 in. to 24 in.
0.830 1.130
DFM (Two lanes) DFV (Two lanes)
1- Change girder concrete strength of Example 1 From 8 ksi to 12 ksi
0.533 0.671
2- Change slab concrete strength of Example 1 From 4 ksi to 8 ksi
0.533

NCHRP 12-96, Final Report C-1
APPENDIX C SHOP DRAWINGS
This appendix presents the shop drawings and pictures taken during production of the Precast Panels and Large Scale Concrete Beam used in the experimental program

NCHRP 12-96, Final Report C-2
Figure 1. Details of the 3-ft long precast panels used for all push-off specimens (with concrete
and steel girders)
NOTE: The top lip of the shear key was made of solid thickness of 2 inches during fabrication

NCHRP 12-96, Final Report C-3
Figure 2. Details of the 6-ft long precast panels used for the large scale beam with concrete girder
NOTE: The top lip of the shear key was made of solid thickness of 2 inches during fabrication

NCHRP 12-96, Final Report C-4
Figure 3. Details of the 2-ft long precast panels used for the large scale beam with concrete girder
NOTE: The top lip of the shear key was made of solid thickness of 2 inches during fabrication

NCHRP 12-96, Final Report C-5
Figure 4. Details of the 6-ft long precast panels used for the large scale beam with steel girder
NOTE: The top lip of the shear key was made of solid thickness of 2 inches during fabrication

NCHRP 12-96, Final Report C-6
Figure 5. Details of the 2-ft long precast panels used for the large scale beam with steel girder
NOTE: The top lip of the shear key was made of solid thickness of 2 inches during fabrication

NCHRP 12-96, Final Report C-7
Figure 6. Wood forms used for fabrication of the precast deck panels
Figure 7. 2-ft long precast panels used for the large scale beam with concrete girder

NCHRP 12-96, Final Report C-8
Figure 8. 2-ft long precast panels used for the large scale beam with steel girder
Figure 9. Precast deck panels in the storage yard
Figure 10. 6-ft long precast deck panels in the storage yard used for the large scale beam with
concrete girder

NCHRP 12-96, Final Report C-9
Figure 11. 6-ft long precast deck panels in the storage yard used for the large scale beam with
steel girder
Figure 12. Shear key after sand blasting

NCHRP 12-96, Final Report C-10
Figure 13. General dimensions of the concrete girder

NCHRP 12-96, Final Report C-11
Figure 14. Details of the concrete girder

NCHRP 12-96, Final Report C-12
Figure 15. Details of the shear connector assembly
Figure 16. Shear connector assembly