Linking Neighborhood Characteristics to Food Insecurity in Older Adults: The Role of Perceived...
22
Journal of Urban Health Linking Neighborhood Characteristics to Food Insecurity in Older Adults: The Role of Perceived Safety, Social Cohesion, and Walkability --Manuscript Draft-- Manuscript Number: JURH1191R1 Full Title: Linking Neighborhood Characteristics to Food Insecurity in Older Adults: The Role of Perceived Safety, Social Cohesion, and Walkability Article Type: Original Research Keywords: Food insecurity; nutrition; neighborhood effects; social cohesion; Safety; walkability; Multi-level models Corresponding Author: William Gallo, Ph.D CUNY School of Public Health New York, NY UNITED STATES Corresponding Author Secondary Information: Corresponding Author's Institution: CUNY School of Public Health Corresponding Author's Secondary Institution: First Author: Wai Ting Chung, MPH First Author Secondary Information: All Authors: Wai Ting Chung, MPH William Gallo, Ph.D Nancy Giunta, PhD Maureen E Canavan, MPH Nina S Parikh, PhD Marianne C Fahs, PhD All Authors Secondary Information: Abstract: Among the 14.6% of American households experiencing food insecurity, approximately two million are occupied by older adults. Food insecurity among older adults has been linked to poor health, lower cognitive function, and poor mental health outcomes. While evidence of the association between individual or household-level factors and food insecurity has been documented, the role of neighborhood-level factors is largely understudied. This study uses data from a representative sample of 1,870 New York City senior center participants in 2008 to investigate the relationship between three neighborhood-level factors (walkability, safety, and social cohesion) and food insecurity among the elderly. Issues relating to food security were measured by three separate outcome measures: whether the participant had a concern about having enough to eat this past month (concern about food security); whether the participant was unable to afford food during the past year (insufficient food intake related to financial resources); and whether the participant experienced hunger in the past year related to not being able to leave home (mobility-related food insufficiency). Unadjusted and adjusted logistic regression was performed for each measure of food insecurity. Results indicate that neighborhood walkability is an important correlate of mobility-related food insufficiency and concern about food insecurity, even after controlling the effects of other relevant factors. Powered by Editorial Manager® and Preprint Manager® from Aries Systems Corporation
-
Upload
hunter-cuny -
Category
Documents
-
view
0 -
download
0
Transcript of Linking Neighborhood Characteristics to Food Insecurity in Older Adults: The Role of Perceived...

Journal of Urban Health
Linking Neighborhood Characteristics to Food Insecurity in Older Adults: The Role ofPerceived Safety, Social Cohesion, and Walkability
--Manuscript Draft--
Manuscript Number: JURH1191R1
Full Title: Linking Neighborhood Characteristics to Food Insecurity in Older Adults: The Role ofPerceived Safety, Social Cohesion, and Walkability
Article Type: Original Research
Keywords: Food insecurity; nutrition; neighborhood effects; social cohesion; Safety; walkability;Multi-level models
Corresponding Author: William Gallo, Ph.DCUNY School of Public HealthNew York, NY UNITED STATES
Corresponding Author SecondaryInformation:
Corresponding Author's Institution: CUNY School of Public Health
Corresponding Author's SecondaryInstitution:
First Author: Wai Ting Chung, MPH
First Author Secondary Information:
All Authors: Wai Ting Chung, MPH
William Gallo, Ph.D
Nancy Giunta, PhD
Maureen E Canavan, MPH
Nina S Parikh, PhD
Marianne C Fahs, PhD
All Authors Secondary Information:
Abstract: Among the 14.6% of American households experiencing food insecurity, approximatelytwo million are occupied by older adults. Food insecurity among older adults has beenlinked to poor health, lower cognitive function, and poor mental health outcomes. Whileevidence of the association between individual or household-level factors and foodinsecurity has been documented, the role of neighborhood-level factors is largelyunderstudied. This study uses data from a representative sample of 1,870 New YorkCity senior center participants in 2008 to investigate the relationship between threeneighborhood-level factors (walkability, safety, and social cohesion) and food insecurityamong the elderly. Issues relating to food security were measured by three separateoutcome measures: whether the participant had a concern about having enough to eatthis past month (concern about food security); whether the participant was unable toafford food during the past year (insufficient food intake related to financial resources);and whether the participant experienced hunger in the past year related to not beingable to leave home (mobility-related food insufficiency). Unadjusted and adjustedlogistic regression was performed for each measure of food insecurity. Results indicatethat neighborhood walkability is an important correlate of mobility-related foodinsufficiency and concern about food insecurity, even after controlling the effects ofother relevant factors.
Powered by Editorial Manager® and Preprint Manager® from Aries Systems Corporation

Linking Neighborhood Characteristics to Food Insecurity in Older Adults: The Role of
Perceived Safety, Social Cohesion, and Walkability
Wai Ting Chung, MPH
William T. Gallo, PhD
Nancy Giunta, PhD
Maureen E. Canavan, MPH
Nina S. Parikh, PhD
Marianne C. Fahs, PhD
ABSTRACT
Among the 14.6% of American households experiencing food insecurity, approximately
two million are occupied by older adults. Food insecurity among older adults has been linked to
poor health, lower cognitive function, and poor mental health outcomes. While evidence of the
association between individual or household-level factors and food insecurity has been
documented, the role of neighborhood-level factors is largely understudied. This study uses
data from a representative sample of 1,870 New York City senior center participants in 2008 to
investigate the relationship between three neighborhood-level factors (walkability, safety, and
social cohesion) and food insecurity among the elderly. Issues relating to food security were
measured by three separate outcome measures: whether the participant had a concern about
having enough to eat this past month (concern about food security); whether the participant was
unable to afford food during the past year (insufficient food intake related to financial resources);
and whether the participant experienced hunger in the past year related to not being able to
leave home (mobility-related food insufficiency). Unadjusted and adjusted logistic regression
was performed for each measure of food insecurity. Results indicate that neighborhood
walkability is an important correlate of mobility-related food insufficiency and concern about food
insecurity, even after controlling the effects of other relevant factors.
ManuscriptCommon.Links.ClickHereToDownload Common.Links.ClickHereToViewLinkedReferences

INTRODUCTION
Food security is a vital aspect of well-being; however, according to the U.S. Household
Food Security Survey, 14.6% of American households were found to be insecure with regard to
food accessibility in 2008. Among these 17 million food-insecure households, approximately 2
million were occupied by older adults. Research indicates that, for the elderly, limited access to
nutritionally adequate foods may increase the risk of poor nutritional and health status.1 In
addition, studies of elder subpopulations have associated levels of inadequate nutrition with
depressive symptomatology2 and lower cognitive function.3
More broadly, the salience of food insecurity has been underscored by its links to
cardiovascular risk,4, 5 self-rated health,6 body mass index or obesity,7-9 risk of emergent and
overnight care,10 and non-adherence to pharmaceutical regimes.10, 11 In older adults specifically,
food insecurity has been found to predict poor nutritional outcomes,12 including lower caloric
intake, fewer meals per day and foods lower in nutrients.13, 14 Such outcomes are significantly
more prevalent among older adults with lower incomes.13 Moreover, food insecurity among
older adults is associated with poor self-reported health1 increased functional impairment,15,16
and lower quality of life.17 While studies have documented that both individual or household-
level factors are associated with food insecurity among both the elderly and non-elderly,18-20
research on contextual, neighborhood-level contributors to nutritional insecurity is limited to a
single investigation of the effect of neighborhood-level social factors.21 The absence of such
useful information exists despite the growing body of research on the role of neighborhoods as
an important contributor to health.22, 23 The purpose of this study, therefore, is to address this
gap in research by examining the relationship between neighborhood-level factors and food
insecurity among the elderly.
A number of neighborhood elements have been investigated in relation to health.
Neighborhood socioeconomic status (SES) has been isolated as a particularly protective factor,

whose strong correlation with individual SES underscores the robustness of this finding.24
Elements of the built environment, which include land use, urban design, and transportation,
have also been linked to well-being.25 Studies have suggested that the built environment may
promote walkability26 and encourage healthful nutrition practices,27 which in turn, may affect
obesity,28 self-rated health,29 and chronic conditions such as hypertension.30 Neighborhood
safety may also influence individual varied domains of health. For example, safety’s effect on
social interactions and outdoor activities, in addition to its potential prevention of psychological
stress, may have positive effects on both psychological and physiological markers of health.31
Neighborhood-level social factors are, to our knowledge, the only such variables that have been
studied in relation to food insecurity.21 This research, which found that high community-level
social capital significantly reduces the risk of hunger, suggested that social cohesion and
community trust may increase the likelihood that nutritionally insecure individuals will borrow
food from neighbors in times of need, or that higher social capital will encourage informal credit
agreements for food purchases by the food insecure.21
Using data obtained from participants of 56 senior centers across New York City (NYC),
the present study investigates the relationship of three neighborhood-level factors–walkability,
safety, and social cohesion–to measures related to food insecurity.
METHODS
Data Source
Data and Sample: The data used for this study were taken from the 2008 Health
Indicators Project (HIP), the first representative health and social assessment of older adults
attending senior centers in NYC. Among other domains of well-being, the HIP survey assessed
health status, utilization patterns, and barriers to health care. Conducted by the Brookdale
Center for Healthy Aging and Longevity, it employed a multistage stratified random sample of

1,870 older adults attending 56 randomly selected senior centers out of the 278 centers located
throughout NYC.
The HIP sampling plan involved stratification of the sample by borough, and by size of
the senior center. The primary stratum of borough was created by determining the percentage
of senior centers per borough as a proportion of the number of senior centers citywide, using
information provided by the New York City Department for the Aging (DFTA). At the time the
survey was conducted, there were 278 senior centers throughout the five boroughs, and the
sampling scheme was designed to reflect their distribution. The secondary stratum, center size,
was based on reported daily lunch count as a proxy for a daily census. All centers operating
under DFTA were divided into quartiles based on size. Senior centers were then randomly
chosen among those in the specified strata, yielding 10 of the 51 centers in the Bronx, 16 of the
80 centers in Brooklyn, 13 of the 63 centers in Manhattan, 14 of the 68 centers in Queens, and
3 of the 16 centers in Staten Island.
Each senior center maintained daily sign-in sheets as a means of record keeping for the
daily ―lunch count.‖ One interviewer monitored the sign-in process, ensuring that participants
signed in upon entering the senior center. Survey respondents were chosen from these sign-in
sheets. Every third eligible individual was selected for recruitment. Interviewers from the
research team were then directed to the prospective participant, and the interviewer briefly
outlined the study using the recruitment script and invited the subject to participate in the study.
All interviews were completely voluntary and anonymous, which was communicated to the
participants during the informed consent process. If the individual met the inclusion criteria (age
≥ 60; spoke at least one of the available interview languages) and expressed willingness to
participate, he or she was led to a private room where the informed consent form was read
aloud. Following informed consent, face-to-face interviews were conducted in the senior center
in the respondent’s preferred language (English, Spanish, Chinese, Russian, or Italian).

Trained bilingual research assistants administered the interviews, which took an average of 75
minutes to complete.
A comprehensive structured survey instrument was designed for the HIP using
standardized questionnaire items validated in national and local surveys, such as the Behavioral
Risk Factor Surveillance System (BRFSS), the Medicare Current Beneficiary Survey, the
National Health Interview Survey, and the New York City Community Health Survey. Additional
survey items were drawn from the New York City Age-Friendly Cities Project. The survey was
translated into Spanish, Chinese, Russian, and Italian and then back-translated into English to
identify any inconsistencies.
The overall response rate was 76.7%, with a refusal rate of 20.3%. The data collection
took place between April and November 2008. The study was approved by the Hunter College
Institutional Review Board for the Protection of Human Subjects.
Study Sample
The sample used in our analysis is 1650. We arrived at this final study sample by
eliminating from the full HIP sample (N = 1870) all observations with missing data in one or
more study variables (n = 643), and then restoring observations (n = 423) based on multiple
imputation of the 3 independent neighborhood variables of interest. We found no statistically
significant differences, among the explanatory variables, between the 220 deleted observations
and the 1650 observations used in our analysis. The multiple imputation of neighborhood
walkability, safety, and social cohesion—each of which is a scale variable comprising multiple
items—was accomplished with an ordinal logistic model in STATA version 11.0, in which all
other study variables, in addition to the senior center site, were used to predict 10 values for the
missing components.
Outcome Variables

Three binary measures of food insecurity were studied in relation to neighborhood
characteristics. The first of these considers concern about food security, and is based on the
question: In the past 30 days, have you been concerned about having enough food to eat? This
binary variable was coded 1 if respondents answered yes, and 0 if no. An identical coding
mechanism (1 = yes; 0 = no) was used for the other two food insecurity-related variables, one of
which measured insufficient food intake related to financial resources (In the past 12 months,
did you ever eat less than you felt you should because there wasn’t enough money to buy food?)
and the other of which measured mobility-related food insufficiency (In the past 12 months, were
you hungry, but did not eat because you weren’t able to get out to buy food?).
Explanatory Variables
Neighborhood Factors
Neighborhood safety was assessed by a scale that combined participants’ responses to
the following three safety-related survey statements: People often get mugged or attacked in my
neighborhood; People sell or use drugs in my neighborhood; I feel safe at night in my
neighborhood. To create the scale, we reverse-coded original Likert responses (1=very true to
4=not at all true) for the first two items, and then summed respondents’ values for the three
items (range: 3-12; Cronbach’s alpha=.70), where higher scores represent a greater level of
perceived safety.
Neighborhood social cohesion was represented by a scale consisting of summed
responses to five survey items. The items were: People around here are willing to help their
neighbors; This is a close-knit neighborhood; People in this neighborhood can be trusted;
People in this neighborhood generally don't get along with each other; and, People in this
neighborhood do not share the same values. As with construction of the safety variable, we
reverse-coded Likert responses (1=very true to 4=not at all true) of the final two items, and

summed responses over the 5 variables. In the resulting scale (range: 5-20; alpha=.75), higher
values represent stronger neighborhood social cohesion.
An eight-item composite variable for walkability was created to capture this feature of the
neighborhood’s built environment. The survey items were related to continuous paved
sidewalks, curb cuts, crossable intersections, lighting at night, benches on which to sit, cracks in
sidewalks, uneven sidewalks, and excessive (extra) noise from traffic, car alarms, trains, etc.
After reverse-coding binary responses to the three negatively presented items, responses for
the eight items were summed, with scores ranging from 0-8 (alpha=.48), in which higher scores
represented better neighborhood walkability.
Because transportation may play a key role in food access and security, 25 a variable
based on a four-question Likert-scaled battery on transportation was considered for inclusion in
the built environment measure. However, lack of response variation (over 90% of participants
rated each of the four items positively) suggested that doing so would simply scale the measure
upward, and would not add any additional information.
Covariates
Covariates and potential confounders were selected from six domains of individual-level
factors: demographic, physical disability, mental health, chronic conditions, social support, and
income.
Demographic Variables
Sex was a binary variable (female=1). Age was a continuous variable. Education was
represented by five dummy variables (less than high school (HS), completed HS, more than HS,
completed college, and post-college). Marital status was dichotomized (married or living
together with someone as a couple vs. other). Race was captured by five dummy variables,
representing Asian, Black, White, Hispanic, and other races.

Physical Disability
Physical disability, used as a proxy for physical health status, was based on seven
questions in which survey respondents ranked their degree of difficulty performing the following
tasks: eating, dressing, bathing; moving in/out of a bed or chair; grasping/handling small objects;
walking indoors; walking several blocks; walking one block or climbing one flight of stairs;
bending, kneeling, stooping. Responses available were none, some, much, can’t due to health
and don’t do this activity. Answers of none and don’t do this activity, were re-coded into a value
of 0 and all other responses were coded as 1. A composite variable was created by summing
the codes, establishing scores ranging from 0-7 where higher scores represent greater disability.
Mental Health
Depression was assessed using the nine-item Patient Health Questionnaire (PHQ)-9,
whose validity and reliability have been demonstrated.32 Responses for each item were scored
from 0 (not at all) to 3 (nearly every day); with a total score ranging from 0-27. Scores from 0 to
4 indicate no depression, 5 to 14 suggest mild to moderate depression and 15 or greater signify
severe depression.
Chronic Conditions
This variable was a continuous measure based on self-report of 25 conditions, including
diabetes, high blood pressure, high cholesterol, bronchitis, asthma, osteoporosis, and heart
disease. The conditions were re-coded into binary values of 1=yes and 0 = no, then summed to
determine the total number of chronic conditions. Totals could range from 0 to 25.
Individual Social Support

With five survey items, respondents were asked about their availability to a person who
could help you if you were confined to a bed; give you good advice about a crisis; love you and
make you feel wanted; get together with for relaxation; or confide in or talk to about your
problems. Likert scale responses ranged from a score of 0 (none of the time) to 4 (all of the
time). After summing responses, the individual social support variable score ranged from 0-20,
with higher scores indicating greater support.
Income
Income was a categorical variable represented by 2 dummy variables: 1 = less than or
equal to $19,999; 2 = greater than or equal to $20,000. Because over 29% of original
categorical responses were missing, we created a third dummy variable for missing responses.
In a robustness check, we replaced the income dummy variables with a binary variable that
measured difficulty meeting regular expenses. Our results were qualitatively similar to those
presented.
Statistical Methods
We calculated means (with standard deviations) and proportions to describe the sample.
We used binomial logistic regression to conduct the multivariate analyses, accounting for the
multiple imputation missing values in the three neighborhood variables. In this way, our logistic
models reflect the average model estimates over 10 full-model estimations. Two specifications
were fitted to analyze the effect of neighborhood-level factors for each outcome variable. The
first specification estimated the effect of neighborhood variables only; the second, fully adjusted,
specification added all covariates to the first model specification. The exception to full
adjustment is in the analysis of insufficient nutritional intake related to financial resources (In the
past 12 months, did you ever eat less than you felt you should because there wasn’t enough
money to buy food?) For this outcome, our adjusted analyses omitted the measure of income
because of its implicit inclusion in the outcome variable.
We estimated all models in a multi-level framework, wherein the clustering of individuals
within a senior center was statistically controlled to correct the standard errors for non-
independence and the denominator degrees of freedom were corrected for the number of
clusters. Due to the differing response distributions among the neighborhood variables, these
were standardized so that the results reflect on one standard deviation change in the
neighborhood variable on the log odds of food insecurity. We used STATA, version 11.1, to
perform all statistical analyses.
RESULTS
Respondent Characteristics
Characteristics of the study sample are presented in Table 1. The study sample, of
which the majority of respondents were female (64%), had a mean age of 75.4 (range 60-96).
The largest proportion of the sample consisted of White participants (40%), followed by Hispanic
(24%), Black (20%) and Asian (14%) respondents. Educational attainment varied but was
somewhat evenly distributed across three groups: respondents who did not complete high
school (36%), those who completed high school (33%), and those who completed more than a
high school level of education (30%). More than one in three respondents (38%) indicated
extreme or some difficulty with meeting regular expenses such as rent, food, and gas. Mean
depression severity, as measured by the PHQ-9, was 3.56 on a scale of 0-27. Respondents
reported an average of four chronic conditions, and two functional limitations. Additionally,
sample members had a mean social support score of 13.41 out of 20.0.
Regarding variables of interest, 10% of participants reported being concerned about
having enough food to eat. About 9% indicated that in the past year they ate less due to
financial insecurity, while roughly 5% reported that they went hungry because they were not

able to get out and purchase food. Neighborhood safety had a mean of 6.83 (range: 3-12); the
mean of neighborhood social cohesion was 12.29 (range: 5-20). The average walkability score
among study sample respondents was 5.26 out of 8.0.
Multivariate Logistic Regression Results
Concern about food security
The results obtained from the unadjusted model specification (Table 2, column 2)
suggest that higher neighborhood safety and walkability independently influence concern about
food security. For each one-standard deviation (1 SD) increase in neighborhood safety, the log
odds of indicating concern about having enough to eat are reduced by about 8% (safety Odds
Ratio (OR) = 0.92; 95% Confidence Interval (CI) = 0.85, 1.0). The effect of perceived
neighborhood walkability is more pronounced. In this case, each 1 SD increase in the
walkability scale reduces the odds of concern about nutritional adequacy by 21% (OR = 0.79;
95% CI = 0.70, 0.88). With adjustment for covariates (Table 2, column 3), the effect of
neighborhood safety becomes statistically non-significant. However, the effect of neighborhood
walkability remains significant, its magnitude only slightly reduced by the addition of the control
variables (OR = 0.83; 95% CI = 0.73, 0.95). Among the adjustment variables, the results
indicate that being Hispanic (vs. White) and having higher depression score were associated
with increased odds of reporting concern about nutritional adequacy. Higher age and lower
income (relative to the missing category) were associated with reduced odds of the outcome.
Insufficient food intake related to financial resources
In the unadjusted model specification (Table 2, column 4), higher neighborhood social
cohesion and walkability were associated with lower odds of experiences of not being able to
afford food in the past year. For each 1 SD increase in social cohesion, the risk of insufficient
food intake decreased by 5% (OR = 0.95; CI = 0.92, 0.98). For neighborhood walkability, each
1 SD increase was associated with a 19% reduced risk of insufficient food intake (OR = 0.81; CI

= 0.72, 0.91). In the adjusted model specification (Table 2, column 5) neighborhood social
cohesion becomes statistically non-significant, while neighborhood walkability remains
suggestive of an association (OR = 0.87; CI = 0.75, 1.00; p =.056). Among covariates, age and
social support were negatively related to the outcome, whereas depression was positively
associated with the outcome. Asian, Black, and Hispanic participants were all at higher risk of
eating less due to lack of financial resources compared with White participants.
Mobility-related food insufficiency
Prior to controlling covariates (Table 2, column 6), our results suggest that higher
neighborhood social cohesion and walkability were associated with lower odds of having
experienced hunger because of the inability to leave home. For each 1 SD increase in social
cohesion, the risk of mobility-related food insufficiency decreased by 6% (OR = 0.94; CI = 0.89,
0.99); for each 1 SD increase in walkability, a 25% reduced risk of reduced of hunger was
observed (OR = 0.75; CI = 0.65, 0.87). After adjustment for covariates (Table 2, column 7) only
neighborhood walkability remained statistically significant (OR = 0.84; CI = 0.70, 0.99). Among
covariates, age, Hispanic race/ethnicity, depression, and individual social support were
significant and in the expected direction.
DISCUSSION
In this study, we assessed the effect of three different neighborhood level variables—
safety, social cohesion, and walkability—on outcomes related to food insecurity among senior
center participants in New York City. Our results indicate that neighborhood walkability is an
important correlate of food insecurity, even after controlling the effects of other relevant factors.
While previous research has suggested that dietary intake is influenced by accessibility to food,1,
33 our results additionally underscore the possible significance of the walking environment.
These results support both qualitative findings by Wolfe et al.19 and the conceptual notion that

neighborhoods designed to encourage walking may promote accessibility to affordable food
outlets, which can be an important determinant of food security, particularly among elders with
lower income.15 On the other hand, our results depart from the findings of Martin and
colleagues,21 in that neighborhood social cohesion was not associated with reduced risk of food
insecurity in any of our fully-adjusted models. One possibility for the divergent findings is
differences in the question pertaining to mobility-related food insufficiency. Our survey question
(In the past 12 months, were you hungry, but did not eat because you weren’t able to get out to
buy food?) combines hunger with problems leaving the home, which may be a more nuanced
measure than the one used by Martin et al. Confirming previous research,4, 7 our models
suggest that individuals who reported lower income and those who experienced more
depressive symptoms had a higher likelihood of food insecurity.
This study contributes to the current body of knowledge in several ways. It draws from
the first city-level representative sample of ethnically, racially, and linguistically diverse senior
center participants. Second, it examines older adults’ perceptions of their living environments,
which may have a greater impact on behavior than observed neighborhood characteristics. This
is also the first study of senior center participants to inquire about their perceptions of
neighborhood characteristics and nutritional risk.
Several limitations should nonetheless be noted. The first concerns the walkability
measure. Despite its being designed as a single scale, the walkability measure has low internal
consistency. Nevertheless, factor analysis of the component items offered no suggestion of
more than one underlying latent factor. Moreover, the measure, having been adapted from
existing instruments developed in semi-urban areas, may lack components that are more
appropriate to a heavily urbanized area such as New York City. Second, our sample is not a
true catchment area sample. In other words, it is possible that survey participants travel to
senior centers outside of their immediate neighborhoods, in which case their appraisals of
neighborhood attributes may apply to the neighborhoods in which they live, rather than the

neighborhoods in which the senior centers are located. While the perceived nature of the
neighborhood assessment helps to circumvent many of the possible problems with this scenario,
there remains the potential for bias, as our data clusters are statistically controlled at the level of
the senior center. Finally, individuals who attend senior centers may not be representative of
the larger elderly population.34 Research has suggested that senior center participants may be
more mobile and healthier than non-participants.34 This potential shortcoming is nonetheless
circumscribed by supplementary analyses whose results suggest that our sample is largely
representative of older adults in New York City.
A note on inference may also be useful. Causal inference between neighborhood
factors and food insecurity cannot be made due to the cross-sectional nature of the study.
Moreover, although it might be argued that neighborhood factors, particularly walking
environments, precipitate problems that lead to food insecurity, selection may be an equally
plausible explanation. In this way, elderly individuals who are concerned about food insecurity
may be more likely to reside in less walkable, safe, or socially cohesive neighborhoods. In a
related way, as our study only captured self-reported data, our empirical findings are subject to
same-source bias35—the idea that individuals who reported being concerned about food
insecurity may be more likely to report negative perceptions about their health, social, or
community status.
Many questions still remain unanswered concerning how the neighborhood may affect
older adults’ food insecurity. Further research on this topic will provide additional understanding
to the growing body of evidence regarding the impact of community and environmental
determinants on health.

REFERENCES
1. Lee JS, Frongillo EA, Jr. Nutritional and health consequences are associated with food
insecurity among U.S. elderly persons. J Nutr. 2001;131:1503-1509.
2. Laraia BA, Siega-Riz AM, Kaufman JS, Jones SJ. Proximity of supermarkets is
positively associated with diet quality index for pregnancy. Prev Med. 2004;39:869-875.
3. Gao X, Scott T, Falcon LM, Wilde PE, Tucker KL. Food insecurity and cognitive
function in Puerto Rican adults. Am J Clin Nutr. 2009;89:1197-1203.
4. Seligman HK, Bindman AB, Vittinghoff E, Kanaya AM, Kushel MB. Food insecurity is
associated with diabetes mellitus: results from the National Health Examination and
Nutrition Examination Survey (NHANES) 1999-2002. J Gen Intern Med. 2007;22:1018-
1023.
5. Seligman HK, Laraia BA, Kushel MB. Food insecurity is associated with chronic disease
among low-income NHANES participants. J Nutr. 2010;140:304-310.
6. Gucciardi E, Vogt JA, DeMelo M, Stewart DE. Exploration of the relationship between
household food insecurity and diabetes in canada. Diabetes Care. 2009;32:2218-2224.
7. Dinour LM, Bergen D, Yeh M-C. The food insecurity-obesity paradox: a review of the
literature and the role food stamps may play. J Am Diet Assoc. 2007;107:1952-1961.
8. Holben DH PA. Diabetes risk and obesity in food-insecure households in rural
Appalachian Ohio. Prev Chronic Disease. 2006;3:A82.
9. Wilde PE, Peterman JN. Individual weight change is associated with household food
security status. J Nutr. 2006;136:1395-1400.
10. Kushel M, Gupta R, Gee L, Haas J. Housing instability and food insecurity as barriers to
health care among low-income americans. J Gen Intern Med. 2006;21:71-77.
11. Bengle R, Sinnett S, Johnson T, Johnson MA, Brown A, Lee JS. Food insecurity is
associated with cost-related medication non-adherence in community-dwelling, low-
income older adults in Georgia. J Nutr Elder. 2010;29:170 - 191.
12. Bhattacharya J, Currie J, Haider S. Poverty, food insecurity, and nutritional outcomes in
children and adults. Journal Health Econ. 2004;23:839–862.
13. Guthrie JF, Lin B-H. Overview of the Diets of Lower- and Higher-Income Elderly and
Their Food Assistance Options. J Nutr Educ Behav. 2002;34:S31-S41.
14. Lee JS, Frongillo EA Jr. Nutritional and health consequences are associated with food
insecurity among U.S. elderly persons. J Nutr. 2001;131:1503-1509.
15. Lee JS, Frongillo EA Jr. Factors associated with food insecurity among U.S. elderly
persons: importance of functional impairments. J Gerontol B Psychol Sci Soc Sci.
2001;56:S94-S99.
16. Wolfe W, Frongillo EA, Valois P. Understanding the experience of food insecuirty by
elders suggests ways to improve its measurement. J Nutr 2003;133:2762-2769.
17. Frongillo EA, Horan CM. Hunger and Aging (2004, October 1). Generations, pp. 28-33.
18. Duerr L. Prevalence of food insecurity and comprehensiveness of its measurement for
older adult congregate meals program participants. J Nutr Elder. 2007;25:121-146.
19. Wolfe WS, Olson CM, Kendall A, Frongillo EA Jr. Understanding food insecurity in the
elderly: a conceptual framework. J Nutr Educ. 1996;28:92-100.
20. Frongillo EA, Valois P, Wolfe WS. Using a concurrent events approach to understand
social support and food insecurity among elders. Fam Econ Nutr Rev. 2003;15:25-32.
21. Martin KS, Rogers BL, Cook JT, Joseph HM. Social capital is associated with decreased
risk of hunger. Soc Sci Med. 2004;58:2645-2654.

22. Diez Roux AV. Investigating neighborhood and area effects on health. Am J Public
Health. 2001;91:1783-1789.
23. Ellen IG, Mijanovich T, Dillman KN. Neighborhood effects on health: exploring the
links and assessing the evidence. J Urban Aff. 2001;23:391-408.
24. Ross CE, Mirowsky J. Neighborhood disadvantage, disorder, and health. J Health Soc
Behav. 2001;42:258-276.
25. Handy SL, Boarnet MG, Ewing R, Killingsworth RE. How the built environment affects
physical activity: views from urban planning. Am J Prev Med. 2002;23:64-73.
26. Gordon-Larsen P, Nelson MC, Page P, Popkin BM. Inequality in the built environment
underlies key health disparities in physical activity and obesity. Pediatrics.
2006;117:417-424.
27. Booth KM, Pinkston MM, Poston WS. Obesity and the built environment. J Am Diet
Assoc. 2005;105:110-117.
28. Lake A, Townshend T. Obesogenic environments: exploring the built and food
environments. J R Soc Promot Health. 2006;126:262-267.
29. Doyle S, Kelly-Schwartz A, Schlossberg M, Stockard J. Active community environments
and health: the relationship of walkable and safe communities to individual health. J Am
Plann Assoc. 2006;72:19-31.
30. Mujahid MS, Diez Roux AV, Morenoff JD, et al. Neighborhood characteristics and
hypertension. Epidemiology. 2008;19:590-598.
31. Stafford M, Chandola T, Marmot M. Association between fear of crime and mental
health and physical functioning. Am J Public Health. 2007;97:2076-2081.
32. Kroenke K, Spitzer R, Williams JB. The PHQ-9: Validity of a brief depression severity
measure. J Gen Intern Med. 2001;16:606-613.
33. Nord M, Andrews M, Carlson S; U.S. Department of Agriculture, Economic Research
Service. Household Food Security in the United States, 2008.
http://www.ers.usda.gov/publications/err83/err83.pdf. Published November 2009.
Accessed October 2, 2011.
34. Morland K, Filomena S. The utilization of local food environments by urban seniors.
Prev Med. 2008;47:289-293.
35. Diez Roux AV. Neighborhoods and health: where are we and were do we go from here?
Rev Epidemiol Sante Publique. 2007;55:13-21.
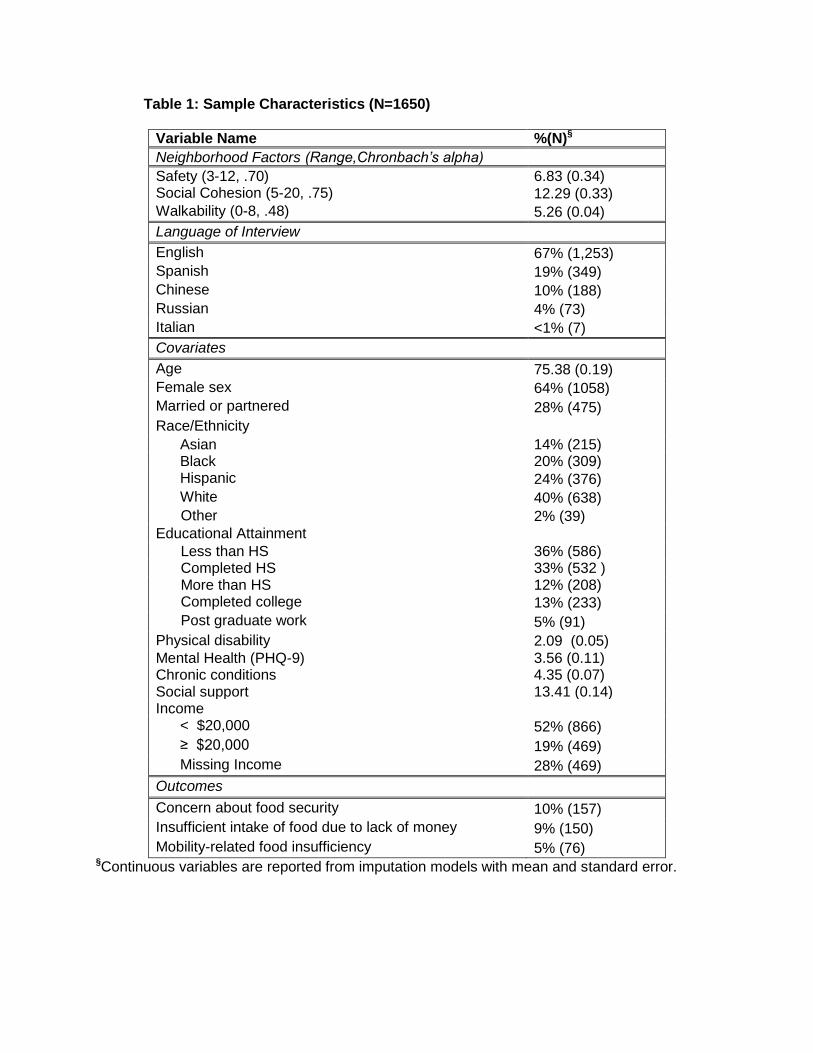
Table 1: Sample Characteristics (N=1650)
Variable Name %(N)§
Neighborhood Factors (Range,Chronbach’s alpha)
Safety (3-12, .70) 6.83 (0.34) Social Cohesion (5-20, .75) 12.29 (0.33)
Walkability (0-8, .48) 5.26 (0.04)
Language of Interview
English 67% (1,253)
Spanish 19% (349)
Chinese 10% (188)
Russian 4% (73)
Italian <1% (7)
Covariates
Age 75.38 (0.19)
Female sex 64% (1058)
Married or partnered 28% (475)
Race/Ethnicity
Asian 14% (215) Black 20% (309) Hispanic 24% (376)
White 40% (638)
Other 2% (39)
Educational Attainment
Less than HS 36% (586) Completed HS 33% (532 ) More than HS 12% (208) Completed college 13% (233)
Post graduate work 5% (91)
Physical disability 2.09 (0.05)
Mental Health (PHQ-9) 3.56 (0.11) Chronic conditions 4.35 (0.07) Social support 13.41 (0.14) Income < $20,000 52% (866)
≥ $20,000 19% (469)
Missing Income 28% (469)
Outcomes
Concern about food security 10% (157)
Insufficient intake of food due to lack of money 9% (150)
Mobility-related food insufficiency 5% (76) §Continuous variables are reported from imputation models with mean and standard error.

Table 2. Influence of neighborhood variables on food insecurity (N=1650): Odds Ratios (Confidence Intervals)
Variable Name Concern about food security Insufficient intake of food
due to lack of money Mobility-related food insufficiency
Unadjusted Adjusted Unadjusted Adjusted Unadjusted Adjusted
Neighborhood Factors
Safety .92 (.85, 1.00)* .97 (.91, 1.04) .99 (.92, 1.06) 1.05 (.98, 1.13) .99 (.89, 1.10) 1.07 (.96, 1.20) Social Cohesion .98 (.95 ,1.02) 1.0 (.96, 1.04) .95 (.92, .99)** .97 (.92, 1.01) .94 (.89, .99)** .96 (.90, 1.03) Walkability .79 (.70, .88)*** .83 (.73, .95)** .81 (.71, .91)*** .87 (.75, 1.00) .75 (.65, .87)*** .84 (.70, 0.99)*
Covariates
Age -- .95 (.92, .97)* -- .96 (.94, .98)*** -- .96 (.93, 1.00)* Female sex -- 1.01 (.68, 1.50) -- .89 (.57, 1.37) -- .99 (.50, 1.95) Married or partnered
-- .80 (.48, 1.31) -- .66 (.42, 1.06) -- .68 (.35, 1.32)
Race/Ethnicity
Asian -- .52 (.23, 1.18) -- 2.73 ( 1.60, 4.66)*** -- 1.38 (.55, 3.46) Black -- 1.75 (.90, 3.42) -- 2.43 (1.20, 4.91)* -- 2.33 (.89, 6.16) Hispanic -- 1.91 (1.16, 3.13)* -- 3.51 (2.16, 5.70)*** -- 2.32 (1.19, 4.53)*
Other Race -- 1.34 (.63, 2.83) -- 1.28 (.56, 2.92) -- 1.04 (.41, 2.69)
Education Less than HS -- .79 (.38, 1.64) -- .74 (.36, 1.55) -- .81 (.29, 2.27) Completed HS -- .83 (.38, 1.81) -- .54 (.27, 1.11) -- .56 (.19, 1.68) More than HS -- .64 (.27, 1.48) -- .64 (.28, 1.46) -- 1.43 (.53, 3.85) Completed college
-- .88 (.34, 2.24) -- .65 (.28, 1.49) -- .89 (.24, 3.24)
Physical disability
-- 1.11 (.99, 1.24) -- 1.10 (.99, 1.22) -- 1.13 (1.01, 1.27)
Mental Health -- 1.08 (1.03, 1.13)*** -- 1.08 (1.03, 1.14)*** -- 1.12 (1.06, 1.18)*** Chronic conditions
-- .99 (.93, 1.07) -- 1.05 (.99, 1.12) -- 1.01 (.92, 1.12)
Social support -- .97 (.94, 1.01) -- .95 (.91, .99)* -- .94 (.90, .98)** Income < $20,000 -- .35 (.19, .66)*** -- -- -- .51 (.18, 1.49) ≥ $20,000 -- .84 (.56, 1.24) -- -- -- .94 (.41, 2.16)

*p<.05; **p<.01; ***p<.001

Response to Reviewer Comments Manuscript Name: Linking Neighborhood Characteristics to Nutritional Insecurity in Older Adults: The Role of Perceived Safety, Social Cohesion, and Walkability Manuscript Number: JURH1191 Reviewer #1 (Note: only reviewer) Comment 1: The paper needs editing with respect to the use of terms. The title uses "nutritional insecurity." The first sentence of the abstract refers to "food insecurity." In the abstract and the introduction, "hunger" and "food security" also appear. Later, "nutritional adequacy" and "nutritional inadequacy" are also used. This creates confusion for the reader. In food security research, these terms are not used interchangeably. The authors need to decide which concepts are being studied and measured and then explain their terms. Response: The reviewer makes an important point. We have made certain, in the revised study, to use only the term “food insecurity” when referring to the general construct, and the individual outcome names when referring to them. The outcome measures are also better elucidated in the context of food insecurity. (See response to Comment 2 for further detail.) Comment 2: Since there is an established 18-item USDA household food security survey tool, it would be useful for the authors to describe how the questions they used correspond or not to the items in the USDA tool, where the items used for this study came from. Response: Because the intention of the HIP survey was to generate a baseline general health assessment of older adults who use New York City’s senior centers, no one health dimension was given particular emphasis. For this reason—and to maintain low response burden—we used only three items to measure food insecurity. One of the items (In the past 12 months, did you ever eat less than you felt you should because there wasn’t enough money to buy food?) was taken from the USDA household food security tool. Another item (In the past 30 days, have you been concerned about having enough food to eat?) was a slight adaptation of a BRFSS question, the adaptation having been created by the investigators of the New York City Community Health Survey (CHS). The final item (In the past 12 months, were you hungry, but did not eat because you weren’t able to get out to buy food?) was developed by the investigators of the New York City Housing Authority (NYCHA) Senior Survey. We selected this item so that we could compare this component of food insecurity across our samples. For the reviewer’s information, we now refer to the variable that is based on the USDA item as “insufficient food intake related to financial resources,” the variable based on the BRFSS/CHS item as “concern about food security,” and that based on the NYCHA item as “mobility-related food insufficiency.” Comment 3: Slightly less important, but still necessary for revision, is the use of "older adults" and "elderly." I also saw the use of both "African American" and "Black." Response: We have omitted synonymous language that may be misleading or confusing. Comment 4: The second paragraph of the introduction provides background on the health consequences of food insecurity. With one exception (reference #11), the articles are not specific to older adults. There is a body of research about health effects of food insecurity for older adults. It would be more appropriate to refer to that literature here.
*Response to Reviewer Comments

Response: We have added references to studies of the consequences of food insecurity in older adults. Comment 5: In the methods section, in the description of the recruitment, 56 senior centers were selected, how many total senior centers are there? Every Nth individual was selected to participate in the survey, what is the "Nth" (i.e. 10th? 25th?)? Was this based on people walking in the front door on a given day or days? …until a certain total was reached? A little more detail would be helpful. Response: The section describing sampling, recruitment, and administration of the survey has been edited for clarity. We provide greater detail on each of these elements in the revised manuscript. Comment 6: Respondents with "overt mental illness" were excluded. How was this determined? What were the criteria? Response: This particular exclusion criterion, though considered after pilot testing, was not ultimately used in the HIP demonstration. That is, it was not assessed by the interviewers for the participants in the study, and its mention has therefore been removed from the text in the manuscript revision. Comment 7: In Table 1, The column label for the top three neighborhood factors is confusing. These are not %'s and n's. Response: A footnote was added to Table 1 indicating that data presented for continuous variables consists of mean scores and standard errors. Comment 8: In Table 1, I would like to see the number of people who answered the survey in English, Russian, Spanish, Chinese, or Italian. Response: Language of interview was added to Table 1, listing the frequency and percent of respondents who answered the survey in each language.