Documentation for the Food Insecurity Hotspots Data Set
11
NASA Socioeconomic Data and Applications Center (SEDAC) Documentation for the Food Insecurity Hotspots Data Set, v1 (2009-2019) 1 Documentation last revised July 22, 2020 Documentation for the Food Insecurity Hotspots Data Set July 2020 Center for International Earth Science Information Network (CIESIN), Columbia University Abstract This document outlines the methodology and data sets used to construct the Food Insecurity Hotspots Data Set, along with use cases, limitations, and use constraints. The Food Insecurity Hotspots Data Set, Version 1 (2009-2019) consists of grids at 250 meter (~7.2 arc seconds) resolution that identify the level of intensity and frequency of food insecurity over the 10 years between 2009 and 2019, as well as hotspot areas that have experienced consecutive food insecurity events. The gridded data are based on sub-national food security analysis provided by FEWS NET (Famine Early Warning Systems Network) in five (5) regions, including Central America and the Caribbean, Central Asia, East Africa, Southern Africa, and West Africa. Based on the Integrated Food Security Phase Classification (IPC), food insecurity is defined as Minimal, Stressed, Crisis, Emergency, and Famine. Data set citation: Center for International Earth Science Information Network (CIESIN), Columbia University. 2020. Food Insecurity Hotspots Data Set. Palisades, NY: NASA Socioeconomic Data and Applications Center (SEDAC). https://doi.org/10.7927/cx02-2587. Accessed DAY MONTH YEAR. Suggested citation for this document: Center for International Earth Science Information Network (CIESIN), Columbia University. 2020. Documentation for the Food Insecurity Hotspots Data Set. Palisades, NY: NASA Socioeconomic Data and Applications Center (SEDAC). https://doi.org/10.7927/yh9d-mv37. Accessed DAY MONTH YEAR. We appreciate feedback regarding this data set, such as suggestions, discovery of errors, difficulties in using the data, and format preferences. Please contact: NASA Socioeconomic Data and Applications Center (SEDAC) Center for International Earth Science Information Network (CIESIN) Columbia University Phone: 1 (845) 365-8920 Email: [email protected]
-
Upload
khangminh22 -
Category
Documents
-
view
2 -
download
0
Transcript of Documentation for the Food Insecurity Hotspots Data Set
NASA Socioeconomic Data and Applications Center (SEDAC) Documentation for the Food Insecurity Hotspots Data Set, v1 (2009-2019)
1 Documentation last revised July 22, 2020
Documentation for the Food Insecurity Hotspots Data Set
July 2020
Center for International Earth Science Information Network (CIESIN),
Columbia University Abstract This document outlines the methodology and data sets used to construct the Food Insecurity Hotspots Data Set, along with use cases, limitations, and use constraints. The Food Insecurity Hotspots Data Set, Version 1 (2009-2019) consists of grids at 250 meter (~7.2 arc seconds) resolution that identify the level of intensity and frequency of food insecurity over the 10 years between 2009 and 2019, as well as hotspot areas that have experienced consecutive food insecurity events. The gridded data are based on sub-national food security analysis provided by FEWS NET (Famine Early Warning Systems Network) in five (5) regions, including Central America and the Caribbean, Central Asia, East Africa, Southern Africa, and West Africa. Based on the Integrated Food Security Phase Classification (IPC), food insecurity is defined as Minimal, Stressed, Crisis, Emergency, and Famine. Data set citation: Center for International Earth Science Information Network (CIESIN), Columbia University. 2020. Food Insecurity Hotspots Data Set. Palisades, NY: NASA Socioeconomic Data and Applications Center (SEDAC). https://doi.org/10.7927/cx02-2587. Accessed DAY MONTH YEAR. Suggested citation for this document: Center for International Earth Science Information Network (CIESIN), Columbia University. 2020. Documentation for the Food Insecurity Hotspots Data Set. Palisades, NY: NASA Socioeconomic Data and Applications Center (SEDAC). https://doi.org/10.7927/yh9d-mv37. Accessed DAY MONTH YEAR.
We appreciate feedback regarding this data set, such as suggestions, discovery of errors, difficulties in using the data, and format preferences. Please contact:
NASA Socioeconomic Data and Applications Center (SEDAC)
Center for International Earth Science Information Network (CIESIN) Columbia University
Phone: 1 (845) 365-8920 Email: [email protected]

NASA Socioeconomic Data and Applications Center (SEDAC) Documentation for the Food Insecurity Hotspots Data Set, v1 (2009-2019)
2 Documentation last revised July 22, 2020
Contents
I. Introduction .............................................................................................................................2 II. Data and Methodology .............................................................................................................3 III. Data Set Description(s) ............................................................................................................8 IV. How To Use the Data ..............................................................................................................9 V. Potential Use Cases ..................................................................................................................9 VI. Limitations ...............................................................................................................................9 VII. Acknowledgments ...................................................................................................................9 VIII. Disclaimer ...............................................................................................................................9 IX. Use Constraints .....................................................................................................................10 X. Recommended Citation(s).....................................................................................................10 XI. Source Code ..........................................................................................................................10 XII. References ............................................................................................................................10 XIII. Documentation Copyright and License .................................................................................10 Appendix 1. Data Revision History ...............................................................................................10 Appendix 2. Contributing Authors & Documentation Revision History ......................................11 Appendix 3. FEWS NET Readme .................................................................................................11
I. Introduction The Food Insecurity Hotspots Data Set, Version 1 (2009-2019) consists of grids that identify the level of intensity and frequency of food insecurity over the 10 years between 2009 and 2019, as well as hotspot areas that have experienced consecutive food insecurity events. The gridded data are based on sub-national food security analysis provided by FEWS NET (Famine Early Warning Systems Network) in five (5) regions, including Central America and the Caribbean, Central Asia, East Africa, Southern Africa, and West Africa (see Table 1 for a list of countries included). Based on the Integrated Food Security Phase Classification (IPC), food insecurity is defined as Minimal, Stressed, Crisis, Emergency, and Famine. The Famine Early Warning Systems Network (FEWS NET) is a leading provider of early warning and analysis on acute food insecurity. FEWS NET analysts, working in more than 35 countries, continuously gather evidence of the current food security situation in areas of concern. Data are collected from a variety of sources, including U.S. science agencies, national ministries of trade and agriculture, international organizations, and NGOs. In some countries, FEWS NET also employs networks of monitors to report localized data such as staple food prices and rainfall. Periodically, CIESIN staff members collaborate with partners on household surveys as well as joint assessments on issues ranging from crop production to livelihood zoning to market functioning.
NASA Socioeconomic Data and Applications Center (SEDAC) Documentation for the Food Insecurity Hotspots Data Set, v1 (2009-2019)
3 Documentation last revised July 22, 2020
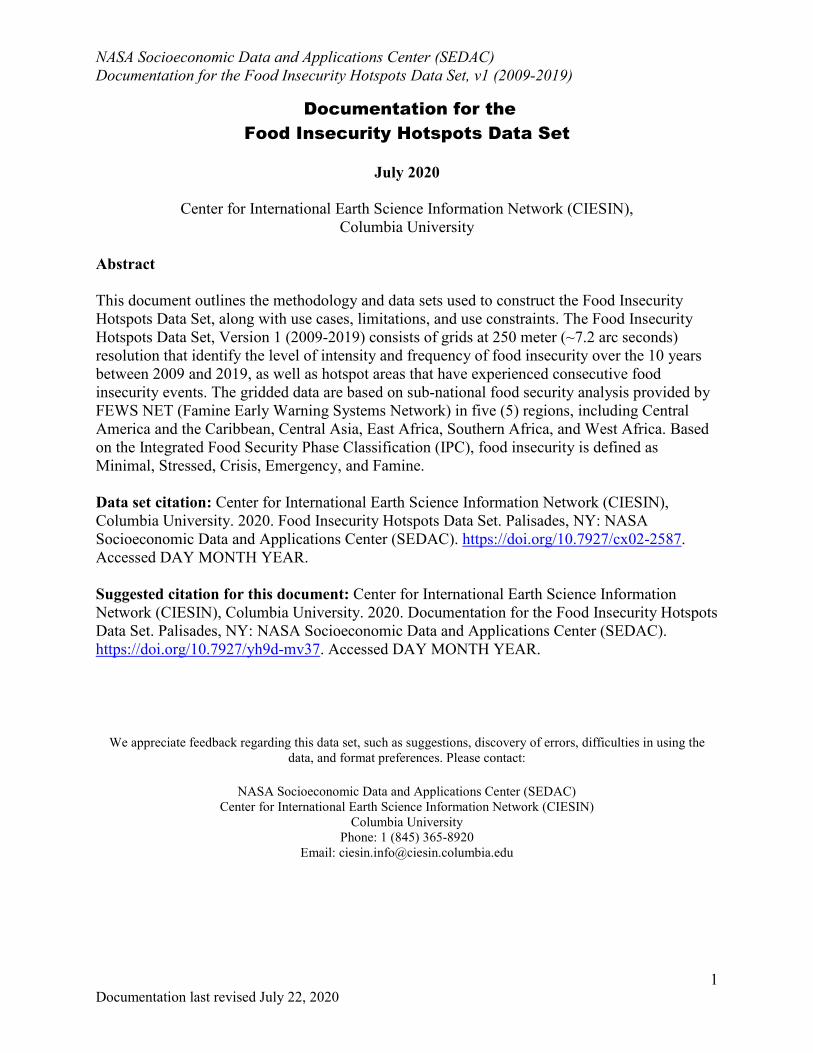
FEWS NET has 20 “presence” countries, where locally based analysts work full time from a national office. In addition, FEWS NET monitors nine countries remotely, typically from a nearby country office. In these “non-presence” countries, analysis centers identify anomalies and spotlight deteriorating conditions. Based on a lighter, scalable version of FEWS NET's traditional methodology, remote monitoring reports may offer less depth and detail than those from presence countries, where at least one full-time analyst is devoted to data collection and analysis. To describe the anticipated severity of acute food insecurity, FEWS NET analysts use the Integrated Food Security Phase Classification (IPC 2.0). Widely accepted by the humanitarian relief community around the world, this five-level scale uses common language and standards. It is intended to help governments and other humanitarian actors quickly understand a crisis (or potential crisis) and take action. II. Data and Methodology Input data Vector data was downloaded from FEWS NET (https://fews.net/fews-data/333) for the historical and current situation (non-projection) corresponding to food security between 2009 and 2019 (for more information, see Appendix 3. FEWS NET Readme). Data are reported for five (5) regions, including Central America and the Caribbean, Central Asia, East Africa, Southern Africa, and West Africa (see Table 1 for a list of countries included). Table 1: Countries monitored as part of FEWS NET
West Africa East Africa Southern Africa Central Asia Central America and Caribbean
Burkina Faso Burundi Angola *Afghanistan El Salvador
Central Africa Republic Djibouti
*Democratic Republic of the
Congo Tajikistan *Guatemala
*Chad *Ethiopia Lesotho *Haiti Cameroon *Kenya *Madagascar Honduras *Guinea Rwanda *Malawi Nicaragua Liberia *Somalia *Mozambique *Mali *South Sudan *Zambia
Mauritania *Sudan *Zimbabwe *Niger Tanzania
*Nigeria *Uganda Senegal Yemen
Sierra Leone *Presence countries
NASA Socioeconomic Data and Applications Center (SEDAC) Documentation for the Food Insecurity Hotspots Data Set, v1 (2009-2019)
4 Documentation last revised July 22, 2020
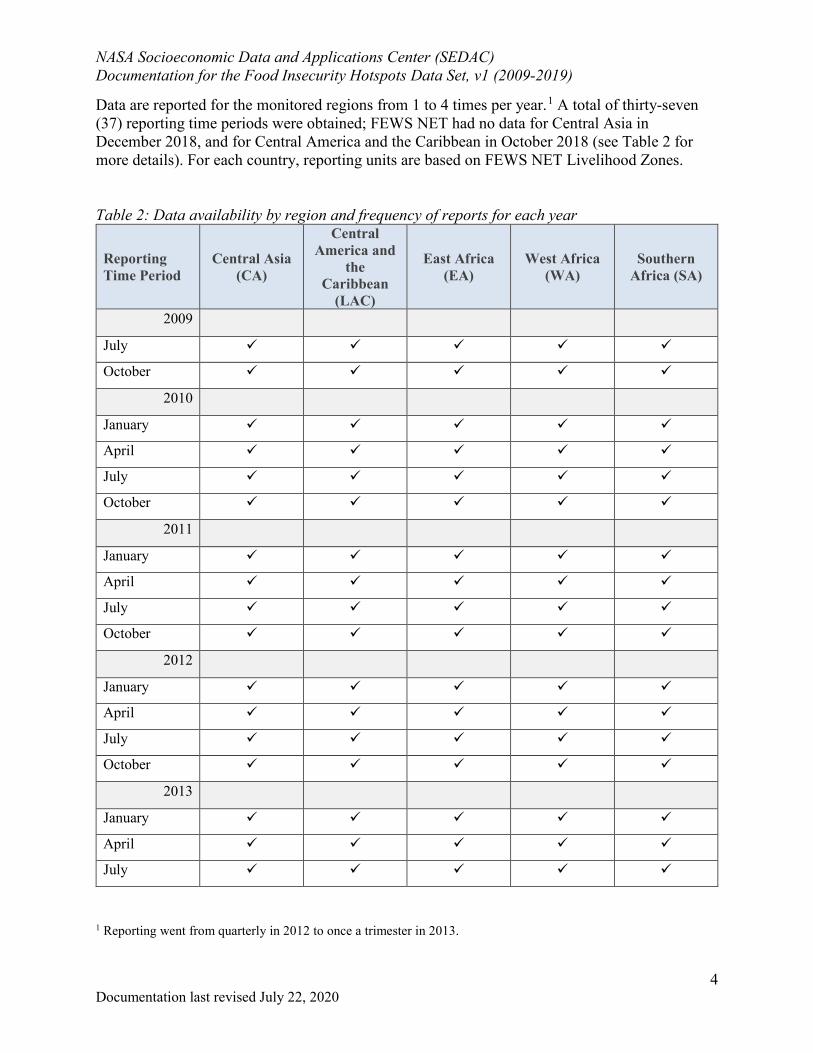
Data are reported for the monitored regions from 1 to 4 times per year.1 A total of thirty-seven (37) reporting time periods were obtained; FEWS NET had no data for Central Asia in December 2018, and for Central America and the Caribbean in October 2018 (see Table 2 for more details). For each country, reporting units are based on FEWS NET Livelihood Zones. Table 2: Data availability by region and frequency of reports for each year
Reporting Time Period
Central Asia (CA)
Central America and
the Caribbean
(LAC)
East Africa (EA)
West Africa (WA)
Southern Africa (SA)
2009
July
October
2010
January
April
July
October
2011
January
April
July
October
2012
January
April
July
October
2013
January
April
July
1 Reporting went from quarterly in 2012 to once a trimester in 2013.

NASA Socioeconomic Data and Applications Center (SEDAC) Documentation for the Food Insecurity Hotspots Data Set, v1 (2009-2019)
5 Documentation last revised July 22, 2020
Reporting Time Period
Central Asia (CA)
Central America and
the Caribbean
(LAC)
East Africa (EA)
West Africa (WA)
Southern Africa (SA)
October
2014
January
April
July
October
2015
January
April
July
October
2016
February
June
October
2017
February
June
October
2018
February
June
October *
December *
2019
February
*FEWS NET had no data for Central Asia in December 2018, and for Central America and the Caribbean in October 2018.

NASA Socioeconomic Data and Applications Center (SEDAC) Documentation for the Food Insecurity Hotspots Data Set, v1 (2009-2019)
6 Documentation last revised July 22, 2020
Within the obtained data, the food security attribute value ranges from 1 to 5, which represent the food insecurity level for the reporting period. Only some of the reporting periods include three additional attribute values that represent areas of water, parks, forests, reserves, no data or missing data. For data reported after March 2011, the food security phases refer to the scale using the IPC. Data from before March 2011 uses FEWS NET Food Insecurity Severity Scale (FNFIS), a scale similar to the IPC, but with different classification criteria (see Table 3). Table 4 provides details on the IPC Acute Food Insecurity Phase Descriptions (see VI. Limitations for further information about assumptions and limited documentation about phase classifications). The FNFIS and IPC classifications systems both use scales ranging from 1 to 5. The IPC describes the severity of food emergencies and is widely accepted by the international community. Based on common standards and language, this five-phase scale is intended to help governments and other humanitarian actors quickly understand a crisis (or potential crisis) and take action. The IPC allows analysts to classify households and areas according to a five-phase scale. The essence of each phase is captured in the phase descriptions, described in Table 4. The classification is based on a convergence of available data and evidence, including indicators related to food consumption, livelihoods, malnutrition, and mortality. With this evidence, analysts use the IPC reference tables, which provide illustrative thresholds for each of the five phases, to classify the severity of the current or projected food security situation. Table 3: FEWS NET Food Insecurity Severity Scale Descriptions
Source: https://www.fews.net/sites/default/files/documents/reports/FEWS_NET_Poster_2009_03_final.pdf

NASA Socioeconomic Data and Applications Center (SEDAC) Documentation for the Food Insecurity Hotspots Data Set, v1 (2009-2019)
7 Documentation last revised July 22, 2020
Table 4: IPC Acute Food Insecurity Phase Descriptions
Source: https://fews.net/IPC Methods The input data were obtained in vector form, specifically one shapefile for each reporting time period per region, in geographic coordinate system WGS 1984. The data were converted to Mollweide projection and the regions were merged to produce a globally gridded raster data layer per reporting time period. Not all regions are included for each reporting time period. In order to have a consistent spatial extent, each data layer was edited to include a feature with an attribute value of 0, where no data existed. Because no data existed for Central Asia and Central America and the Caribbean in December 2018 and October 2018 respectively, these areas were assigned features with an attribute value of 0. The original FEWS NET data were filtered to maintain only areas representing a phase of food insecurity; areas of water, parks, forests, and reserves were removed. Thus, the final attribute values were integrated phase classifications (IPC) ranging from 1 to 5, with 1: Minimal, 2: Stressed, 3: Crisis, 4: Emergency, and 5: Famine. The original shapefiles and grid versions of the

NASA Socioeconomic Data and Applications Center (SEDAC) Documentation for the Food Insecurity Hotspots Data Set, v1 (2009-2019)
8 Documentation last revised July 22, 2020
quarterly (or trimesterly) reports are provided as inputs. The data layers were combined to calculate the frequency of each IPC class (one layer for each class) as well as the duration. The duration grids report, for each IPC class separately, the longest consecutive duration in terms of number of reporting periods over the 10-year period. In other words, if the maximum duration of Phase 2 (Stressed) lasted for 16 consecutive reporting periods, then the grid value for that IPC class and location will report 16. Similarly, if Phase 3 (Crisis) lasted for 7 consecutive reporting periods, then the value of the grid cell is 7. Finally, the statistics grids provide the average and standard deviation of quarterly/trimesterly IPC reported classes over the 10 years. III. Data Set Description(s) Data set description: The Food Insecurity Hotspots Data Set, Version 1 (2009-2019) consists of grids that identify the level of intensity and frequency of food insecurity over the 10 years between 2009 and 2019, as well as hotspot areas that have experienced consecutive food insecurity events. The gridded data are based on sub-national food security analysis provided by FEWS NET (Famine Early Warning Systems Network) in five (5) regions, including Central America and the Caribbean, Central Asia, East Africa, Southern Africa, and West Africa. Based on the Integrated Food Security Phase Classification (IPC), food insecurity is defined as Minimal, Stressed, Crisis, Emergency, and Famine. Data set web page: SEDAC URL: https://sedac.ciesin.columbia.edu/data/set/food-food-insecurity-hotspots Permanent URL: https://doi.org/10.7927/cx02-2587 Data set format: The data are available in GeoTIFF format and vector feature classes in Shapefile (.SHP) format. The downloadables are compressed zip files containing: 1) GeoTIFF or Shapefile, and 2) PDF documentation Data set downloads: food-food-insecurity-hotspots-duration-geographic-geotiff.zip food-food-insecurity-hotspots-duration-mollweide-geotiff.zip food-food-insecurity-hotspots-frequency-geographic-geotiff.zip food-food-insecurity-hotspots-frequency-mollweide-geotiff.zip food-food-insecurity-hotspots-inputs-geographic-geotiff.zip food-food-insecurity-hotspots-inputs-geographic-shp.zip food-food-insecurity-hotspots-inputs-mollweide-geotiff.zip food-food-insecurity-hotspots-inputs-mollweide-shp.zip food-food-insecurity-hotspots-statistics-geographic-geotiff.zip food-food-insecurity-hotspots-statistics-mollweide-geotiff.zip

NASA Socioeconomic Data and Applications Center (SEDAC) Documentation for the Food Insecurity Hotspots Data Set, v1 (2009-2019)
9 Documentation last revised July 22, 2020
IV. How To Use the Data The raster data in GeoTIFF format and vector data in Shapefile format, can be used in any standard Geographic Information System (GIS) and software package for direct mapping and geospatial analysis. V. Potential Use Cases The Food Insecurity Hotspots Data Set, Version 1 (2009-2019) has many potential applications. For example, a researcher wanting to understand the frequency and severity of food security crises in regions that are food insecure (or a given country) could use this data set to understand the spatial patterns and potential driving-forces such as conflict, crop failures, and/or poor governance. Researchers could also examine how climate variability contributes to food security crises. VI. Limitations As discussed above, a decision was made to use the IPC classifications for the entire 10-year hotspot data set even though the first 3 years were classified using a different FEWS NET classification schema. The data set also has limits in terms of the spatial resolution of the reporting units, which are inherited from the original FEWS NET reporting units. VII. Acknowledgments Funding for development and dissemination of this data set was provided under the U.S. National Aeronautics and Space Administration (NASA) contract 80GSFC18C0111 for the continued operation of the Socioeconomic Data and Applications Center (SEDAC), which is operated by the Center for International Earth Science Information Network (CIESIN) of Columbia University. The original FEWS NET data are developed with funding from the U.S. Agency for International Development (USAID). VIII. Disclaimer CIESIN follows procedures designed to ensure that data disseminated by CIESIN are of reasonable quality. If, despite these procedures, users encounter apparent errors or misstatements in the data, they should contact SEDAC User Services at [email protected]. Neither CIESIN nor NASA verifies or guarantees the accuracy, reliability, or completeness of any data provided. CIESIN provides this data without warranty of any kind whatsoever, either expressed or implied. CIESIN shall not be liable for incidental, consequential, or special damages arising out of the use of any data provided by CIESIN.

NASA Socioeconomic Data and Applications Center (SEDAC) Documentation for the Food Insecurity Hotspots Data Set, v1 (2009-2019)
10 Documentation last revised July 22, 2020
IX. Use Constraints This work is licensed under the Creative Commons Attribution 4.0 International License (https://creativecommons.org/licenses/by/4.0). Users are free to use, copy, distribute, transmit, and adapt the work for commercial and non-commercial purposes, without restriction, as long as clear attribution of the source is provided. X. Recommended Citation(s) Data set(s): Center for International Earth Science Information Network (CIESIN), Columbia University. 2020. Food Insecurity Hotspots Data Set. Palisades, NY: NASA Socioeconomic Data and Applications Center (SEDAC). https://doi.org/10.7927/cx02-2587. Accessed DAY MONTH YEAR. XI. Source Code No source code is provided for this data set. XII. References FEWS NET Data Center, Food Security Classification Data, https://www.fews.net/fews-data/333 (downloaded on April 19, 2019). XIII. Documentation Copyright and License Copyright © 2020. The Trustees of Columbia University in the City of New York. This document is licensed under a Creative Commons Attribution 4.0 International License (https://creativecommons.org/licenses/by/4.0/). Appendix 1. Data Revision History No revisions have been made to this data set

NASA Socioeconomic Data and Applications Center (SEDAC) Documentation for the Food Insecurity Hotspots Data Set, v1 (2009-2019)
11 Documentation last revised July 22, 2020
Appendix 2. Contributing Authors & Documentation Revision History
Revision Date ORCID Contributors Revisions July 22, 2020
0000-0002-8875-4864
Dara Mendeloff, A. de Sherbinin
This document is the 1st instance of documentation.
Appendix 3. FEWS NET Readme This folder contains historical FEWS NET and current situation (non-projection) Shapefiles. The content is divided into regional folders, which each contain data dating back to July 2009. The Shapefiles use the following naming format: XXYYYYZZ_CS. XX refers to the region, YYYY refers to the four-digit year, and ZZ to the month. Thus, a file named WA201602_CS would include the February 2016 current situation data for West Africa. Within the Shapefiles, the CS column contains the phase classification for the month. For Shapefiles dated after March 2011 this refers to the phase using Integrated Phase Classification (https://www.fews.net/IPC), Data from before March 2011 uses FEWS NET Food Insecurity Severity Scale (FNFIS), a scale similar to the IPC, but with differing classification criteria. Starting in March 2011, FEWS NET began implementing the IPC humanitarian assistance protocol in maps and data. This is captured in the HA0 column. If HA0 = 1, then the phase classification would likely be at least one phase worse without current or programmed humanitarian assistance. In FEWS NET and IPC maps, this is represented by an exclamation mark (!). Three layer files are also included for reference: 1. IPC_Legend: official IPC color scheme 2. IPC_HumanitarianAssistance: Official IPC symbology (!) for humanitarian assistance 3. FEWS NET_Legend: Standard color scheme for the FNFIS scale For additional details on our food security data please click here (https://shapefiles.fews.net.s3.amazonaws.com/HFIC/FEWS_NET_Food_Security_Data.pdf). Additional FEWS NET data is available at: https://www.fews.net/fews-data/333.