kodiak hd belt drive laveuse à pression à entraînement par ...
Vol. 190: 37-51, 1999 MARINE ECOLOGY PROGRESS SERIES
Mar Ecol Prog Ser miblished December 14
Linking community structure of small demersal fishes around Kodiak Island, Alaska, to
environmental variables
Franz J. Mueter', Brenda L. Norcross
Institute of Marine Science, University of Alaska Fairbanks, PO Box 757220, Fairbanks. Alaska 99775-7220, USA
ABSTRACT: Juveniles and small adults of at least 75 species of demersal fishes rvere identified in trawl catches from the nearshore waters of Kodiak Island, Alaska, in August 1991 and 1992. We derived sev- eral indices to characterize community structure at each site, identified key environmental gradients along w h c h community structure was organized, and identified those species whose abundances varied most strongly along these gradients. tVe related species richness, species diversity, and total catch per unit effort to environmental variables observed at each site. Species richness and diversity were highly variable among sites, but decreased significantly with salinity and were significantly higher on hetero- geneous sediments. Standardized catch per unit effort for all species combined differed significantly among 5 geographic areas and was significantly higher on sediments with a high sand and/or mud con- tent. Indices of species composition for each sampling site were 0btainc.d as the Scores of ordination axes based on non-metric multidimensional scaling of Bray-Curtis dissimilarities bettveen sites. The indices summarized different aspects of community composition and werc associated with different species groups. The first and major index was primarily related to the depth-ternperature gradient and con- trasted a shallow, warm water species group with a deep, cold water group. Non-linedr depth effects on most indices suggest relatively rapid changes in species composition in shallow water (0 to 50 m), and more gradual changes in the lower part of the depth range. While the depth-ternperature gradient was the most important gradient along which species composition was structured, sediment composition and geographic area accounted for a significant proportion of the variance of each of the indices. While species composition changed most strongly along the depth-temperature gradient, species richness, diversity, and total abundance tvere not related to depth or temperature, suggesting that species composition changed independently of the overail abundance and of species richness and diverstity.
KEY WORDS: Cornmunity structure . Demersal fish . Depth . Kodiak lsland, Nearshore Zone . Non- metric multidimensional scaling - Sediment composition
INTRODUCTION
The early juvenile stages of demersal fishes have rarely been studied in the Gulf of Alaska. Ichthyo- plankton studies in the Kodiak Island region have provided information on the timing, distribution, and abundance of the eggs and larvae of many species on the continental shelf and inside bays (Dunn et al. 1981. Kendall et al. 1981, Kendall & Dunn 1984, Hermann et
'Present address: School of Resource and Environmental Management, Simon Fraser University, 8888 University Drive, Burnaby, British Columbia V5A 1S6, Canada
al. 1996). The nearshore Zone and bays around Kodiak are important nursery areas for larval and juvenile stages of numerous fish species (Harris & Hartt 1977, Blackburn 1979, Walters et al. 1985, Rogers et al. 1986).
While the nearshore area clearly plays an important role in the early life history of many commercial and non-commercial species, we know very little about the structure of these communities or of their distribution in relation to environmental variables in the North Pacific. Norcross et al. (1995, 1997) identified nursery area characteristics of the 4 most common flatfish spe- cies collected around Kodiak Island and found depth
O Inter-Research 1999 Resale oi iull article not permitted
38 Mar Ecol Prog Ser
and sediment composition to be key variables in deter- mining the distnbution of juveniles of these species in the estuarine and nearshore zones.
In the deep ocean, many benthic communities are zoned with depth (Haednch et al. 1980, Bianchi 1992a,b). The causes for the zonation are not clear but it has typically been related to differences in the phys- ical environment, including temperature, sediment type, strength of currents, and topography (Day & Pearcy 1968, Rowe & Menzies 1969, Haedrich et al. 1975, Bianchi 1991, 1992a,b). Bianchi (1992a) exam- ined the structure of the demersal community on the continental shelf and upper slope of Angola and found that groupings are primarily structured along the ther- mal, depth-dependent gradient and secondarily along gradients of bottom type and latitude. Depth is also the main gradient along which the fauna of the continental shelf and slope edge between the Gulf of Tehuantepec and the Gulf of Papagayo changes (Bianchi 1991), and similar results hold for the demersal assemblages of the continental shelf and upper slope off Congo and Gabon (Bianchi 1992b).
With the exception of coral reef studies (e.g. Alevi- zon et al. 1985, Sale et al. 1994), there have been few studies examining similar gradients in nearshore dem- ersal fish communities. Blaber et al. (1994a) exarnined the community structure of demersal fishes in the Gulf of Carpentaria. They found that the distribution pat- terns of fishes are related to depth but not to other fac-
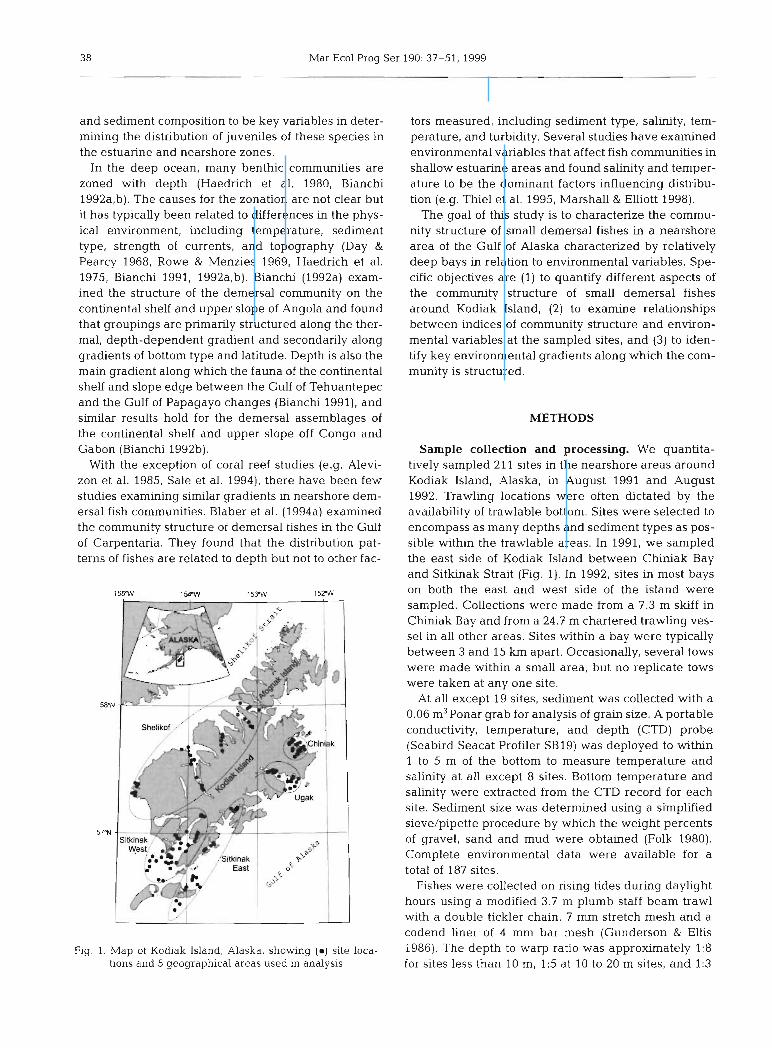
Fig. 1. Map of Kodiak Island, Alaska, showing (m) site loca- tions and 5 geographical areas used in analysis
tors measured, including sedirnent type, salinity, tem- perature, and turbidity. Several studies have examined environmental variables that affect fish communities in shallow estuarine areas and found salinity and temper- ature to be the dominant factors influencing distribu- tion (e.g. Thiel et al. 1995, Marshall & Elliott 1998).
The goal of this study is to characterize the commu- nity structure of small demersal fishes in a nearshore area of the Gulf of Alaska characterized by relatively deep bays in relation to environmental variables. Spe- cific objectives are (1) to quantify different aspects of the community structure of small demersal fishes around Kodiak Island, (2) to exarnine relationships between indices of community structure and environ- mental variables at the sampled sites, and (3) to iden- tify key environmental gradients along which the com- munity is structured.
METHODS
Sample collection and processing. We quantita- tively sampled 21 1 sites in the nearshore areas around Kodiak Island, Alaska, in August 1991 and August 1992. Trawling locations were often dictated by the availability of trawlable bottom. Sites were selected to encompass as many depths and sedirnent types as pos- sible within the trawlable areas. In 1991, we sampled the east side of Kodiak Island between Chiniak Bay and Sitkinak Strait (Fig. 1). In 1992, sites in most bays on both the east and West side of the island were sampled. Coliections were made from a 7.3 m skiff in Chiniak Bay and from a 24.7 m chartered trawling ves- sel in all other areas. Sites within a bay were typically between 3 and 15 km apart. Occasionally, several tows were made within a small area, but no replicate tows were taken at any one site.
At all except 19 sites, Sediment was collected with a 0.06 m3Ponar grab for analysis of grain size. A portable conductivity, temperature, and depth (CTD) probe (Seabird Seacat Profiler SB19) was deployed to within 1 to 5 m of the bottom to measure temperature and salinity at all except 8 sites. Bottom temperature and salinity were extracted from the CTD record for each site. Sediment size was determined using a simplified sieve/pipette procedure by which the weight percents of gravel, Sand and mud were obtained (Folk 1980). Complete environmental data were available for a total of 187 sites.
Fishes were collected on rising tides during daylight hours using a modified 3.7 m plumb staff beam trawl with a double tickler chain, 7 mm Stretch mesh and a codend liner of 4 mm bar mesh (Gunderson & Ellis 1986). The depth to Warp ratio was approximately 1:8 for sites less than 10 m, 1:5 at 10 to 20 m sites, and 1:3

Mueter & Norcross: Comrnunity structure of smaii dernersal fishes 3 9
at deeper sites. Tows from both skiff and trawler were of 10 min duration at a towing speed of approximately 0.5 to 1 m s-'.
AU fishes were identified in the field to the highest possible taxonomic separation or frozen and returned whole to the laboratory for identification. Fishes were counted and total length was measured to the nearest mm. Catches were standardized to CPUE as individu- als 1000 m-2. The towing distance was estimated based on GPS positions where available or on the average speed and tow duration. The area swept was computed from the estimated tow distance and effective width of the net (Gunderson & ELlis 1986).
Environmental variables. We analyzed catch com- position in relation to depth, bottom temperature, bot- tom salinity, and percentages of gravel, sand, and mud in the sediment. We further investigated differences between 5 distinct geographical areas (Fig. 1). The areas were Chiniak (84 stations), Ugak Bay (21), Sitki- nak East (26), Sitkinak West (44), and Shelikof (36). Areas Sitkinak East (SE) and Sitkinak West (SW) were separated in the analysis because they are physically separated by a relatively narrow and shallow Sill in Sitkinak Strait and are subject to different oceano- graphic influences (Chilton 1997). All bays on the She- likof Strait side were combined for analysis due to the relatively small number of samples within each bay. An electronic copy of the data including species abun- dances and environmental information is available from the authors upon request.
The environmental variables included 2 groups of highly correlated variables. Depth and temperature were highly correlated, thus their effects could not be separated reliably. Likewise, the percentages of gravel, sand, and mud in the sediment were naturally highly correlated. To reduce the number of variables and avoid problems with collinearity we extracted major principal components from each of these groups (Johnson & Wichern 1992).
Indices of community structure. We computed 4 descriptive measures of community structure for our analysis: (1) the number of species captured at each site, (2) species diversity, estimated by the complement of Simpson's index (Magurran 1988, Krebs 1989), (3) total CPUE of all species combined at each site, and (4) indices of species composition based on an ordina- tion of pair-wise site dissimilarities.
In analyzing the number of species per site and spe- cies diversity, we assumed that each sample estimated the composition of the local community at the sampling site. Thus, indices were computed for each site and related to environmental variables associated with that site. The number of species per site is a measure of species richness for the habitat represented by the site. Because we expected the nurnber of species, and pos-
sibly species diversity, to be related to the area sam- pled by the trawl, we included area swept as one ex- planatory variable when examining Patterns in species nchness and diversity. The complement of Simpson's D (1-D) is a measure of species diversity, which can be interpreted as the probability that 2 randomly chosen individuals belong to different species (Krebs 1989) Simpson's D is independent of any theory of the fre- quency distribution of species abundances, but tends to be positively correlated with sample size. We exam- ined trends in diversity with sample size prior to analy- sis and found no significant relationship.
As another quantitative descnptor of the fish com- munity we calculated total CPUE as an index of total fish abundance at each site. For statistical comparisons we used log-transformed CPUE since the raw CPUE values were approximately log-normally distnbuted.
Indices of species composition were obtained for each site from a site-by-species matnx of the standard- ized CPUE of all species by site. For each genus or fam- ily that contained specimens that were not identified to species, data were combined and analyzed as a group. Rare species were eliminated prior to further analysis as recommended by Saila et al. (1996). A genus or a species was included in the analysis if it occurred at more than 5% of the sites (>I0 sites), yielding 35 taxa for consideration (Table 1).
Indices of species composition were related to envi- ronmental variables using indirect gradient analysis (Gauch 1982, Digby & Kempton 1987, Ter Braak 1995). Specifically, we used non-metric multidimensional
Tahle 1 Number of species collected in August 1991 and August 1992 around Kodiak Island, Alaska, by family. : no
fish were identified to the species level
Family No. of species
Cottidae 23 Pleuronectidae 12 Agonidae 10 Stichaeidae 7 Gadidae 4 Hexagrammidae 4 Osmeridae 2 Bathymasteridae 2 Zoarcidae 2 Rajidae 1 Clupeidae 1 Cyclopteridae 1 Cryptacanthodidae 1 Pholidae 1 Zaprondae 1 Tnchodontidae 1 Ammodytidae 1 Bothidae 1 Scorpaenidae Lipandinae

Mueter & Norcross: Cornmunity structure of smail dernersal fishes 4 1
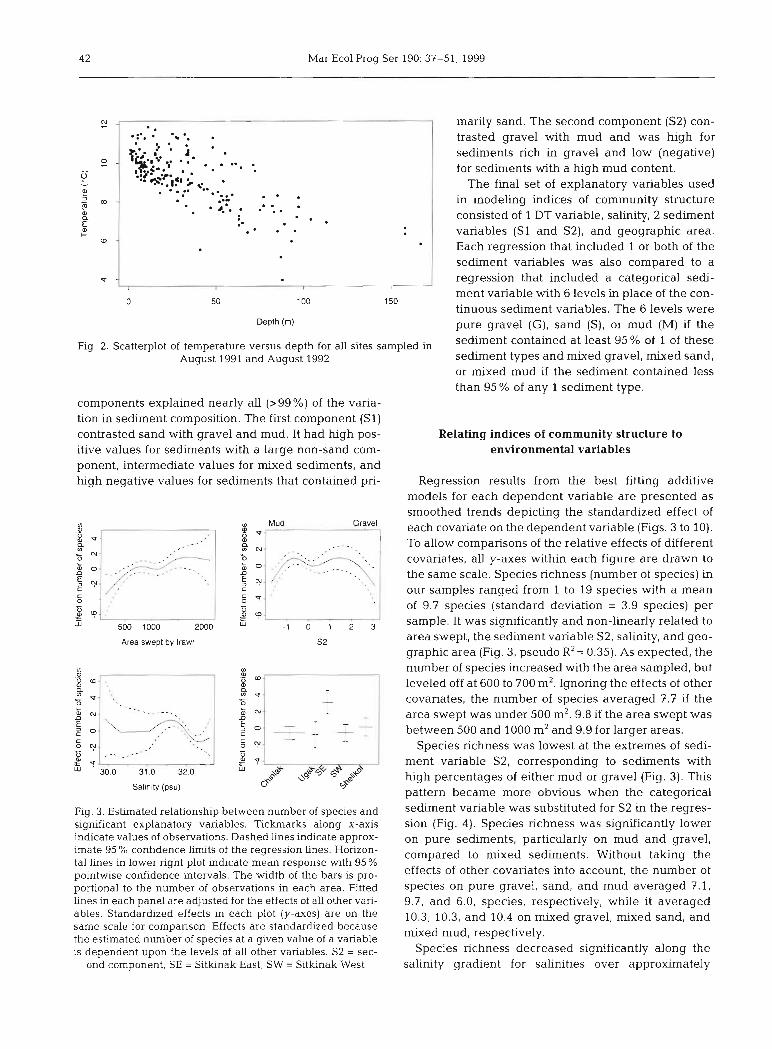
between depth and temperature (r = 0.72, Fig. 2). Because of the strong correlation, we were unable to separate temperature and depth effects. Therefore we used the first pnncipal component from a pnncipal component analysis of depth and temperature in place of the original variables. The new depth-temperature (DT) variable explained 86% of the vanation in depth and temperature and had correlations of -0.92 and 0.92 with depth and temperature respectively. DT was positive at warm, shallow sites and negative at deep, cold sites.
Salinities at most sites ranged from 29.9 to 32.7 psu, with a few unusually high (>33 psu) and 2 unusually lotv values (27.1 and 24.0 psu). The percentage OE gravel in the sediment ranged from 0 to 10OnCu and had
a bimodal distribution. Ninety-eight sites did not con- tain any gravel and over 75 % of the sites had less than 5% gravel. There were relatively few sites with inter- mediate percentages but a number of sites sampled contained 90 to 100% gravel in sediment samples. The distnbution of sand was skewed towards higher per- centages because of the large number of trawls on sandy sediment. Mud content in sediment samples ranged from 0 to 99 %, with a relatively uniform distiib- ution over the entire sampled range. A few sites con- tained some cobble in the sediment. Video observations and torn nets confirmed the presence of occasional large boulders on sandy or gravelly sediment.
Gravel, sand. and mud content of the sediment were naturally highly correlated and their first 2 principal
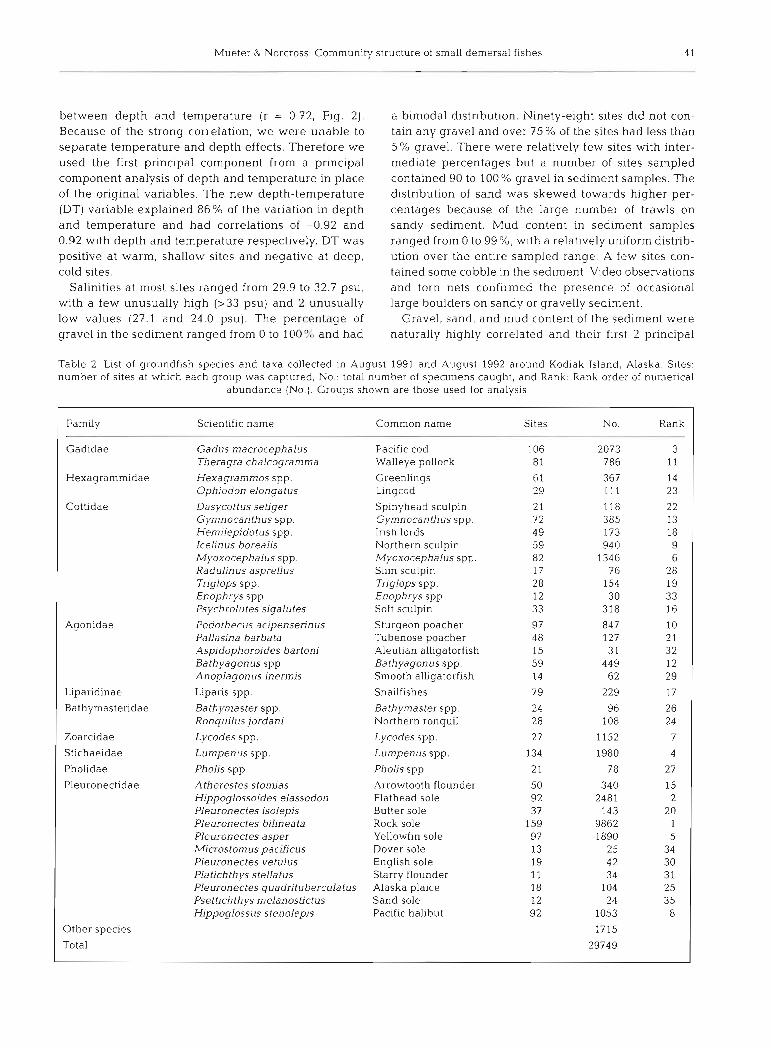
Table 2 List o f groundfish species and taxa collected in August 1991 and August 1992 around Kodiak Island, Alaska Sites number of sites at which each group was captured, No total nurnber o f specunens caught, and Rank Rank order of nurnerical
abundance (No ) Groups shown are those used for analysis
Family Scientific name Common name Sites No. Rank
Gadidae Gadus macrocephalus Pacific cod 106 2073 3 Theragra chalcogramma Walleye pollock 81 786 11
Hexagrammidae Hexagrammes sp p. Greenlings 61 367 14 Ophiodon elongatus Lingcod 29 1 1 1 23
Cottidae Dasycottus setiger Spinyhead sculpin 2 1 118 22 Gymnocanthus spp. Gymnocanthus spp. 72 385 13 Hemjlepidotus spp. lnsh lords 4 9 173 18 Icelin us borealis Northern sculpin 59 940 9 Myoxocephalus spp. Myoxocephalus spp. 82 1346 6 Radulinus asprellus Slim sculpin 17 7 6 2 8 Triglops spp. Triglops spp. 28 154 19 Enophrys spp. Enophrys spp. 12 30 33 Psychrolutes sigalutes Soft sculpin 33 318 16
Agonidae Podothec~is acipensennus Sturgeon poacher 97 847 10 Pallasina barbata Tubenosepoacher 48 127 2 1 Aspidophoroides bartoni Aleutian alligatorfish 15 3 1 3 2 Bathyagonus spp. Bathyagonus spp. 59 449 12 Anoplagonus inermis Smooth alligatorfish 14 62 29
Liparidinae Lipans spp. Snailfishes 7 9 229 17
Bathymastendae Bathymaster spp. Bathymaster spp. 24 96 2 6 Ronquilus jordani Northern ronquil 28 108 24
Zoarcidae Lycodes spp. Lycodes spp. 27 1152 7
Stichaeidae Lumpenus spp. Lurnpenus spp. 134 1980 4
Pholidae Pholis spp. Pholis spp. 21 78 27
Pleuronectidae A therestes stomias Arrowtooth flounder 50 340 15 Hippoglossoides elassodon Flathead sole 92 2481 2 Pleuronectes isolepis Butter sole 3 7 143 20 Pleuronectes biljneata Rock sole 159 9862 1 Pleuronectes asper Yellowfin sole 97 1890 5 Microstonius pacificus Dover sole 13 25 34 Pleuronectes vetulus English sole 19 4 2 30 Platichthys stellatus Starry flounder 11 34 3 1 Pleuronectes quadrituberculatus Alaska plaice 18 104 25 Psettichthys rnelanostictus Sand sole 12 24 35 Hippoglossus stenolepis Pacific halibut 92 1053 8
Other species 1715
Total 29749
4 2 Mar Ecol Prog Ser 190: 37-51, 1999
Depth (m)
marily sand. The second component (S2) con- trasted gravel with mud and was high for sediments rich in gravel and low (negative) for sedirnents with a high mud content.
The final Set of explanatory variables used in modeling indices of comrnunity structure consisted of 1 DT variable, salinity, 2 sediment variables (SI and S2), and geographic area. Each regression that included 1 or both of the sediment variables was also compared to a
2 .. . :.. .. .. . 3 . : . . J. a ! P+.> . .
7 . . .. . , . * ..
W -
Fig. 2. Scatterplot of temperature versus depth for all sites sa August 1991 and August 1992
0 - P 2 m - m E C"
w -
regression that included a categorical sedi-
components explained nearly all (>99%) of the varia- tion in sediment composition. The first component (SI) contrasted Sand with gravel and mud. It had high pos- itive values for sedirnents with a large non-sand com- ponent, intermediate values for mixed sedirnents, and high negative values for sediments that contained pn-
*. *:.I!' > ,;. . -... . --... . . . .-- .. . ' , ' 8.'. . .. . .* .. . .
, ment variable with 6 levels in place of the con-
0 50 100 150 tinuous sediment variables. The 6 levels were
Gravel ... .. -
Z : N . . , . , 0 ,/X, ',,--- m 0 ;,--.-T- ,-..-- n -, ', 5 " , . C ,
\ ~
6 71
Area swept by irawl S2
Fig. 3. Estirnated relationship between number of species and significant explanatory variables. Tickmarks along X-axis indicate values of observations. Dashed lines indicate approx- imate 95 % confidence iirnits of the regression iines. Horizon- tal lines in lower right plot indicate mean response with 95 % pointwise confidence intervals. The width of the bars is pro- portional to the number of observations in each area. Fitted lines in each panel are adjusted for the effects of all other vari- ables. Standardized effects in each plot (y-axes) are on the Same scale for comparison. Effects are standardized because the estimated number of species at a given value of a variable is dependent upon the levels of all other variables. S2 = sec-
ond component, SE = Sitkinak East, SW = Sitkinak West
pure gravel (G), Sand (S), or mud (M) if the
lmpled in sediment contained at least 95 % of 1 of these sediment types and mixed gravel, mixed sand, or mixed mud if the sediment contained less than 95 % of any 1 sediment type.
Relating indices of community structure to environmental variables
Regression results from the best fitting additive models for each dependent variable are presented as smoothed trends depicting the standardized effect of each covariate on the dependent variable (Figs. 3 to 10). To allow comparisons of the relative effects of different covanates, all y-axes within each figure are drawn to the same scale. Species richness (number of species) in our samples ranged from 1 to 19 species with a mean of 9.7 species (standard deviation = 3.9 species) per sample. I t was significantly and non-linearly related to area swept, the sediment variable S2, salinity, and geo- graphic area (Fig. 3, pseudo R2= 0.35). As expected, the number of species increased with the area sampled, but leveled off at 600 to 700 m2. Ignoring the effects of other covanates, the number of species averaged 7.7 if the area swept was under 500 m2, 9.8 if the area swept was between 500 and 1000 m2 and 9.9 for larger areas.
Species nchness was lowest at the extremes of sedi- ment variable S2, correspondiny to sediments with high percentages of either mud or gravel (Fig. 3). This Pattern became more obvious when the categorical sediment variable was substituted for S2 in the regres- sion (Fig. 4 ) . Species richness was significantly lower on pure sediments, particularly on mud and gravel, compared to mixed sediments. Without taking the effects of other covariates into account, the number of species on pure gravel, sand, and mud averaged 7.1, 9.7, and 6.0, species, respectively, while it averaged 10.3, 10.3, and 10.4 on rnixed gravel, mixed sand, and rnixed mud, respectively.
Species nchness decreased significantly along the salinity gradient for salinities over approximately

Mueter & Norcross: Community structure of smaii demersal fishes 4 3
Sediment type
Fig. 4. Estimated effect of sediment type on the number of species. after accounting for effects of area swept and differ- ences among geographic areas with 95% pointwise confi-
dence intervals. G = gravel, S = sand, M = mud
Area swept by lrawl Salinity (psu)
Fig. 5. Estirnated relationship between species diversity and significant explanatory variables. For explanation of plots, See
Fig. 3. G = gravel. S = sand, M = mud
31.7 psu. No clear effect of saiinity on the number of species was apparent at salinities below 31.7 psu, due to wide confidence intervals resulting from the small number of samples (Fig. 3). Species nchness was sig- nificantly higher in area SE compared to all other areas. The number of species averaged 12.6 in SE, while the mean in the other areas ranged from 8.9 to 10.3.
Species diversity as measured by the complement of Sirnpson's index was highly variable, but was signifi- cantly related to area swept, saiinity, geographic area, and sediment type (Fig. 5). Only a very small portion (pseudo R2 = 0.17) of the vanability in species diversity was accounted for by the model. In parallel with spe- cies nchness, diversity increased with area swept, leveling off at approximately 600 m2. Diversity de-
,high Sand low Sand Mud Gravel
- W 3 a 2 Fig. 6. Estimated relation- g s - 0 - ship between total abun- C dance (log[CPUE+ 1 1 ) and - U environrnentd variables. For
W O explanation of plots, see
Fig. 3. S1 = first component, S2 = second component
creased linearly with salinity over the range of salini- ties sampled. Like species richness, diversity was highest in area SE. Species diversity tended to be sig- nificantly lower on pure sand, pure mud, and mixed mud Sediments (Fig. 5); however, the effect was less pronounced than for species nchness. Trends in diver- sity closely followed those in species nchness, with the possible exception of a relatively high diversity on pure gravel, in spite of a low number of species.
Total abundance, as measured by log(CPUE+ I) , decreased significantly along the sediment gradients S1 and S2 and differed significantly among the 5 geo- graphical areas (Fig. 6); however, only a very small proportion (pseudo R2 = 0.18) of the overall vanability was explained by these trends
CPUE tended to be lower on sediment with a high non-sand component (large SI ) and a high gravel con- tent (large S2). A comparison of CPUE among the 6 sediment types confirmed that, on average, the lowest abundances were obtained on gravel, and the highest values were observed on sand, mixed mud, and mixed Sand Sediments (Table 3). Among the 5 areas, highest abundances were observed in areas SE and Chiniak Bay (Fig. 6).
Six indices of species composition were obtained for each site by an NMDS ordination based on site dissim- ilarities. Six dimensions were required to reduce the Stress of the final NMDS configuration to 0.092, below our target value of 0.1. Each of the 6 indices was mod- eled separately as a function of the explanatory vari- ables. The indices will be referred to as Axis 1 through Axis 6. The 6 dimensions accounted for 33, 17, 14, 13, 12, and 10% of the overall variation, respectively. Thus the first 2 axes accounted for approximately half the variation in the NMDS ordination.

44 Mar Ecol Prog Ser 190: 37-51, 1999
deep shallow high Sand low Sand b
0 50 100 150 Deplh (m)
Fig. 7. (a) Estimated relationship between Axis 1 and environmental variables (for explanation of plots, See Fig. 3, DT = depth- temperature, SI = first component, S2 = second component) and (b) scatterplot of the total abundances of the 2 species groups defined by Axis 1 against depth. Combined abundance of shallow water group (G. macrocephalus, Hexagrammos spp., 0. elon- gatus, Myoxocephalus spp., P. acipenseruius, P. barbata. P. bilineata, and H. stenolepis) indicated by crosses and solid line. Com- bined abundance of deep water group (D. setiger, Psychrolutes spp., Bathyagonus spp., Lycodes spp., A. stomias, and H. elas- sodon) indicated by circles and dotted Line. Smoothed abundance trends were estirnated using a robust, locaLiy weighted
smoother. See Table 2 for fuü genus names
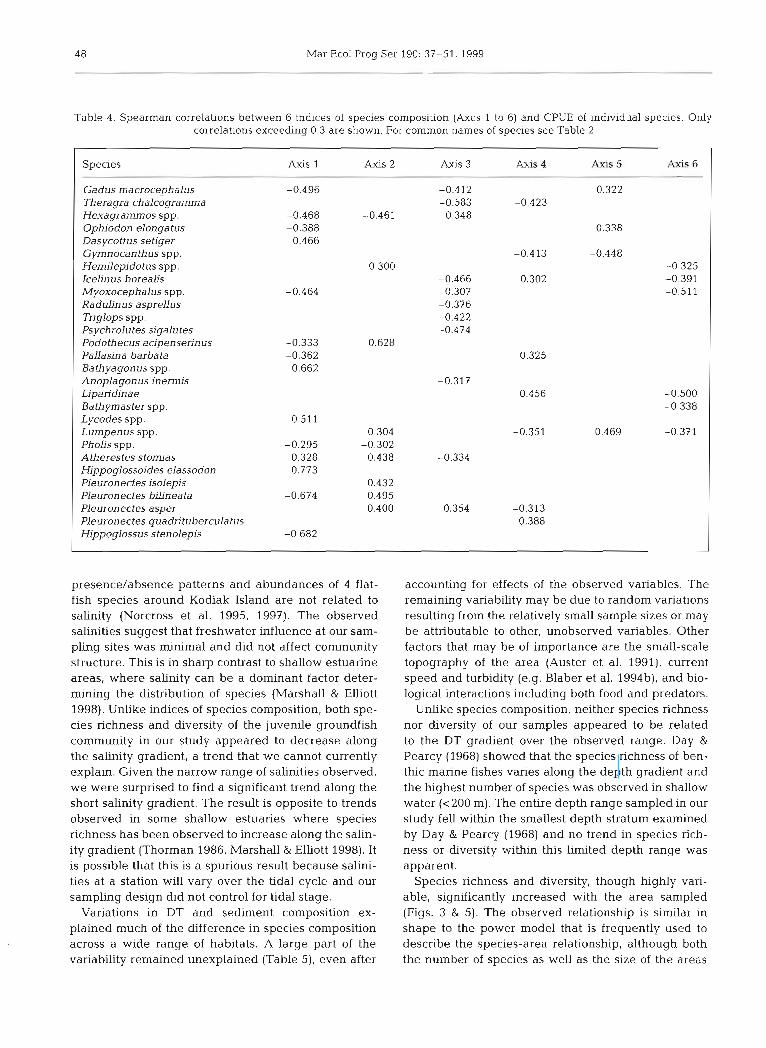
To aid interpretation of the indices we first related each of the 6 indices to the CPUEs of all species. Scat- terplots of individual species CPUEs against Axes 1 to 6 indicated that relationships were generally mono- tone. Therefore, we used simple Spearman rank corre- lations to summaiize relationships between the indices of species composition and the CPUE of individual spe- cies (Table 4 ) . A species was considered to be associ- ated with an index if it had a rank correlation with the index of 0.3 or higher. This value was chosen after examining the scatterplots, which showed clearly obvi- ous relationships between a species and an index for all correlations larger than 0.3. For example, the first index (Axis 1) had strong positive rank correlations with the CPUE of Dasycottus setiger, Bathyagonus spp., Lycodes spp., Atherestes stomias, and Hippoglos-
Table 3 Mean CPUE I 1 standard deviation (SD) by sediment type for 208 samples with known sediment type collected in
1991and1992
Sediment type Mean CPUE (No. 1000 m-2)
Gravel Sand 156 146 Mud Mixed gravel Mixed sand Mixed mud
soides elassodon, and strong negative rank correla- tions with the CPUE of a group of 9 other species (Table 4) , thus contrasting these 2 groups of species.
All variables except salinity explained a significant proportion of the variance of 1 or more of the indices. The first 4 indices of species composition were signifi- cantly related to the DT variable and to both sediment variables. Axes 5 and 6 had very low pseudo coeffi- cients of determination even for the best fits (pseudo R2 = 0.19 and 0.22, respectively) and were difficult to interpret in terms of species composition. They were therefore not considered further for this study.
The first index was primarily related to the DT gradi- ent (Fig. 7a). The variable DT had by far the largest coefficient of partial determination for Axis 1 (Table 5). Thus, species that were positively correlated with Axis 1 were more abundant at the deeper, colder sites, while those that are negatively correlated with Axis 1 tended to be shailow water or warm water species (Table 4, Fig. 7b). Axis 1 was also weakly associated with area, indicating that the deep water group was more abundant in areas SE and Shelikof on the west side of Kodiak island, while the shallow water group was more abundant in areas Chiniak, Ugak, and SE on the east side of the island. Linear relationships be- tween Axis 1 and the sediment variables indicated a preference of the shallow water group for sediments with a relatively high Sand content (SI small) and more gravel than nlud (S2 large), compared to the deep water group (Fig. 7a).

Miteter & Norcross: Community structure oi small demersal fishes 45
deep shallow high S z d _-P- low Sand Fig 8. (a) Estimated relationship between Axis 2 and environ- . - - -
mental variables (for explanation of plots, See Fig. 3, DT = i N- depth-temperature, S I = first component, S2 = second cornpo-
r n 7 .- --
Y> O X 0
.- X -- --
I: a -1 nent) and (b) smoothed trend surfaces of abundance for thc 2 C X - species groups defined by Axis 2 as a function of depth and - 7 , 4 sand. A group that is more abundant at intermediate to deep :o. ai t W . W sites on sediments rich in sand (combined abundance o f P.
m m ; ac~penserinus, Lumpenus spp . A. stoniias, P. isolepis, P. bilin-
-. ~- --- 4 4' -. . .. eata, and P. asper shown on left) is contrasted with a group
-4 -2 0 2 - 1 0 1 2 DT SI that tends to be rnore abundant on cuarser sedimcnts with a
Gravel high gravel content and in very shallow water (cornbined Mud
abundante of Hexagrammos spp., Hemllepidotus spp , and Pholis spp. as shown on right). S m o o t h ~ d trend suriaces were estirnated using a robust, locally tvcighted smoother. See
Table 2 for full genus names
Axis 2 was primari1.y related to the first Sediment variable (Table 5, Fig. 8a). Species positively corre- lated with the index (Table 4) tended to be more abun- dant on sandy and muddy sediments compared to spe- cies negatively correlated with the index, which were more cornmonly found on coarse sediments with a low sand and high gravel content. The value of Axis 2 also dropped sharply at high values of the DT variable (shallow, warm sites), indicating that the group of pos- itively correlated species tended to have low abun- dances at shallow or warm sites, whereas species that were negatively correlated with the index tended to be niore abundant in intermediate to deep or cold water. These general trends are obvious in the smoothed trends of the abundances of the 2 groups plotted by depth and percent sand (Fig. 8b).
Species that were positively correlated with Axis 3 (Table 4 ) comprise a species group that was more abundant on fine muddy sediments (S2 small) with a low sand content and in very shallow, warm water (SI large, Table 5, Fig. 9a). These species are contrasted with a group on sediments high in sand and gravel,
which had a deeper distnbution. The trends in abundance were more obvious for the latter group (Fig. 9b).
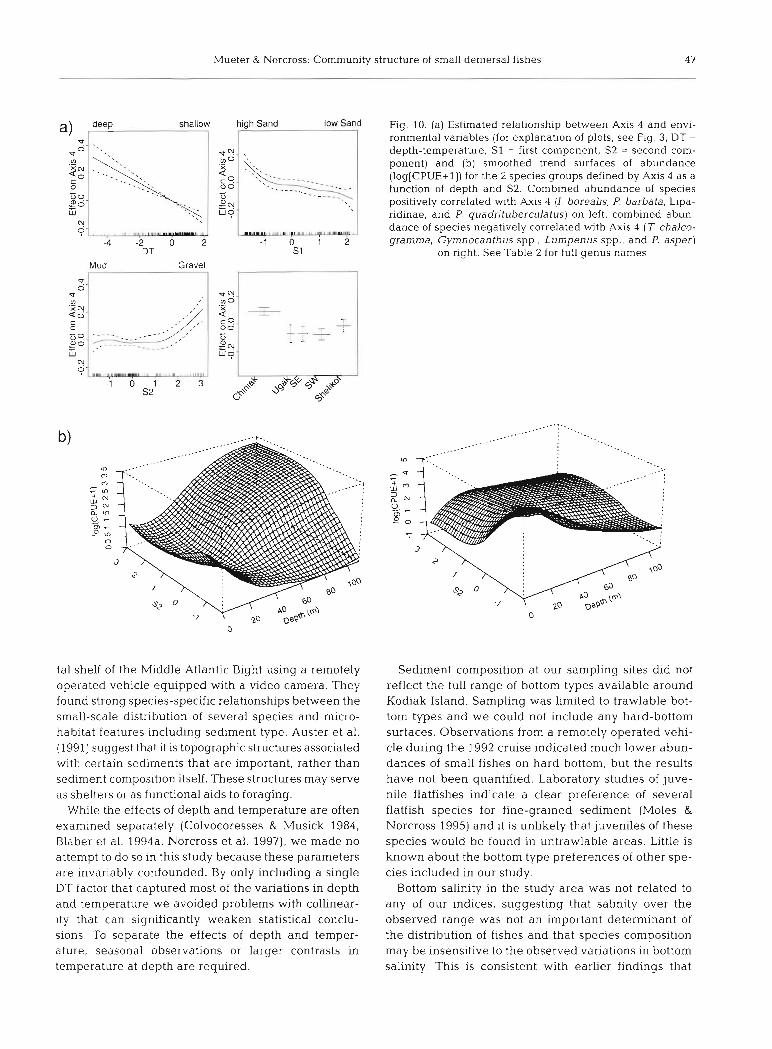
Axis 4 was primarily related to area and depth (Table 5). Species that were negatively correlated with the index (Table 4 ) comprise another shallow water group. Unlike the shallow group defined by Axis 1, this group tended to be more abundant on muddy sedi- ments (S2 small) with a relatively low sand content (Fig. 10a). Species that were positively correlated with the index were more abundant in Chiniak Bay, at greater depths and on sediments with a high percent- age of gravel (Fig. 10a). Smoothed abundance trends by depth and S2 (Fig. lob) indicate the presence of interactions between these variables, as the trend in abundance along S2 appeared to depend on depth.
DISCUSSION
Our study suggests that the small demersal fish com- munity in shallow nearshore areas around Kodiak

4 6 Mar Ecol Prog Ser 190: 37-51, 1999
shallow
0
-4 -2 0 2 DT
Mud Gravel
high Sand low Sand Fig. 9. (a) Estimated relationship behveen Axis 2 and environ- mental variables (for explanation of plots, See Fig. 3, DT =
N @Y depth-temperature, SI =First component, S2 = second compo-
nent) and (b) smoothed trend surfaces of abundance a " , / so. ._..---- (log[CPUE+l]) for the 2 species groups defined by Axis 3 as a
W. function of sediment variables. Combined abundance of spe- g . .-- cies positively correlated with Axis 3 (Hexagrammes spp., W Myoxocephalus spp., and P. asper) plotted on left, combined : L-. abundante of species negatively correlated with Axis 3 (G.
- 1 0 1 2 macrocephaius, T. chalcogramma, I. borealis, R. asprellus, SI Triglops spp., and Psychrolutes spp.) on right. Smoothed
trend surfaces were estirnated using a robust, localiy weigh- ted smoother. See Table 2 for fuU genus names
U - L
W N 4
Island was primanly structured along gradients of DT and sediment composition. Our analysis encompassed cornrnunities from a wide range of habitats including shallow nearshore areas at the heads of long fjords, areas within deep muddy portions of several bays, as well as the Sitkinak Strait area which is subject to very strong tidal currents. It is remarkable that across all these habitats there existed a consistent, strong gradi- ent in species cornposition along the DT gradient (Figs. 7 to 10).
Strong depth-dependent gradients are also found in the dernersal fish cornrnunities inhabiting continental slope regions of the North Atlantic and Mediterranean Sea (Bianchi 1991, 1992a, Moranta et al. 1998), the continental shelf off Oregon (Day & Pearcy 1968), the abyssal North Atlantic (Haedrich & Krefft 1978, Mer- rett 1992), and the continental shelf off Sendai Bay, Japan (Fujita et al. 1995). In contrast to these studies we sampled a much narrower depth range and our sites were primanly located inshore.
Blaber et al. (1994a) examined the comrnunity struc- ture of demersal fishes in the Gulf of Carpentaria over a depth range sirnilar to the one in our study. They found that the distribution Patterns of fishes are related to depth but not to other factors measured, including sedi- ment type. Sirnilarly, there is no correlation between adult fish assemblages and sedirnent type off the north- eastern United States (Colvocoresses & Musick 1984). Unlike Blaber et al. (1994a) and Colvocoresses & Musick (1984), we found a strong relationship between indices of species composition and sediment variables (Table 5). This discrepancy may be due to differences in the re- sponses of juvenile or smail fishes and large adults to sediment composition. While both Blaber et al. (1994a) and Colvocoresses & Musick (1984) sarnpled primanly large adult fishes, our study sampled juveniles and srnail adults only. Furthermore, the beam trawl used in our study sampled fishes on a much smaller spatial scale. Auster et al. (1991) investigated the small-scale distrib- ution of fish and sheiifish species on the outer continen-
Mueter & Norcross: Cornmunity structure of small demersal fishes 47
shallow high Sand iow Sand Fig. 10. (a) Estimated relationship between Axis 4 and envi- ronmental variables (for explanation of plots, See Fig. 3. DT = depth-temperature, S1 = first component, S2 = second com- ponent) and (b) smoothed trend surfaces of abundance (log[CPUE+l]) for the 2 species groups defined by Axis 4 as a function of depth and S2. Combined abundance of species
5 0 Co' pocitively correlated with Axis 4 (1. borealis, P. barbata, Lipa-
ridinae, and P. quadntuberculatus) on left, combined abun- dance of species negatively correlated with Axis 4 (T chalco-
-4 -2 0 2 - 1 0 1 2 gramma, Gymnocanthus spp., Lumpenus spp., and P asper) DT S 1 on nght. See Table 2 for full genus names
Gravel
T
- - - - -0 _ _ -. - E0 722-L - - W ,' _------.__ - - _ _ i??,
W 0
tal shelf of the Middle Atlantic Bight using a remotely operated vehicle equipped with a video camera. They found strong species-specific relationships between the small-scale distribution of several species and micro- habitat features including Sediment type. Auster et al. (1991) suggest that it is topographic structures associated with certain Sediments that are important, rather than sediment composition itself. These structures may serve as shelters or as functional aids to foraging.
While the effects of depth and temperature are often examined separately (Colvocoresses & Musick 1984, Blaber et al. 1994a, Norcross et al. 1997), we made no attempt to do so in this study because these Parameters are invanably confounded. By only including a single DT factor that captured most of the variations in depth and temperature we avoided problems with collinear- ity that can significantly weaken statistical conclu- sions. To separate the effects of depth and temper- ature, seasonal observations or larger contrasts in temperature at depth are required.
Sediment composition at our sampling sites did not reflect the full range of bottom types available around Kodiak Island. Sampling was limited to trawlable bot- tom types and we could not include any hard-bottom surfaces. Observations from a remotely operated vehi- cle dunng the 1992 cruise indicated much lower abun- dances of small fishes on hard bottom, but the results have not been quantified. Laboratory studies of juve- nile flatfishes indicate a clear preference of several flatfish species for fine-grained sediment (Moles & Norcross 1995) and it is unlikely that juveniles of these species would be found in untrawlable areas. Little is known about the bottom type preferences of other spe- cies included in our study.
Bottom salinity in the study area was not related to any of our indices, suggesting that salinity over the observed range was not an important determinant of the distnbution of fishes and that species composition may be insensitive to the observed vanations in bottom salinity. This is consistent with earlier findings that
4 8 Mar Ecol Prog Ser 190: 37-51, 1999
Table 4. Spearman correlations between 6 indices of species composition (Axes 1 to 6) and CPUE of individual species. Only correlations exceeding 0.3 are shown. For common names of species see Table 2
Species Axis 1 Axis 2 Axis 3 Axis 4 Axis 5 Axis 6
Gadus rnacrocephalus -0.496 -0.412 0.322 Theragra chalcogramma -0.583 -0.423 Hexagramnlos spp. -0.468 -0.461 0.348 Ophiodon elongatus -0.388 0.338 Dasycottus setiger 0.466 Gymnocanthus spp. -0.413 -0.448 Hemilepidotus spp. -0.300 -0.325 I c ehus borealis -0.466 0.302 -0.391 Myoxocephalus spp. 0.307 -0.51 1 Radulinus asprellus -0.376 Tiiglops SPP. -0.422 Psychrolutes sigalutes -0.474 Podothecus acipenserinus -0.333 PaUasina barbata -0.362 0.325 Bathyagonus spp. 0.662 Anoplagon us inermis Liparidina e 0.456 -0.500 Bathymaster spp. -0.338 Lycodes spp. 0.511 Lurnpenus spp. 0.304 -0.351 0.469 -0.371 PhoLis spp. -0.295 -0.302 Atherestes stomias 0.328 0.438 -0.334 Hippoglossoides elassodon 0.773 Pleuronectes isolepis 0.432 Pleuronectes bilineata -0.674 0.495 Pleuronectes asper 0.400 0.354 -0.313 Pleuronectes quadntuberculatus 0.388 Hippoglossus stenolepis -0.682
presence/absence patterns and abundances of 4 flat- fish species around Kodiak Island are not related to salinity (Norcross et al. 1995, 1997). The obsemed salinities suggest that freshwater influence at our sam- pling sites was minimal and did not affect comrnunity structure. This is in sharp contrast to shallow estuarine areas, where salinity can be a dominant factor deter- mining the distribution of species (Marshall & Elliott 1998). Unlike indices of species composition, both spe- cies nchness and diversity of the juvenile groundfish comrnunity in our study appeared to decrease along the salinity gradient, a trend that we cannot currently explain. Given the narrow range of salinities obsemed, we were surprised to find a significant trend along the short salinity gradient. The result is opposite to trends observed in some shallow estuanes where species richness has been observed to increase along the salin- ity gradient (Thorman 1986, Marshall& Elliott 1998). It is possible that this is a spunous result because salini- ties at a station will vary over the tidal cycle and our sampling design did not control for tidal stage.
Variations in DT and Sediment composition ex- plained much of the difference in species composition across a wide range of habitats. A large part of the vanability remained unexplained (Table 5), even after
accounting for effects of the obsemed variables. The remaining variability may be due to random variations resulting from the relatively small sample sizes or may be attnbutable to other, unobsemed variables. Other factors that may be of importance are the small-scale topography of the area (Auster et al. 1991), current speed and turbidity (e.g. Blaber et al. 1994b). and bio- logical interactions including both food and predators.
Unlike species composition, neither species richness nor diversity of our samples appeared to be related to the DT gradient over the observed range. Day & Pearcy (1968) showed that the species richness of ben- thic marine fishes vanes along the depth gradient and the highest number of species was observed in shallow water (<200 m). The entire depth range sampled in our study fell within the smallest depth stratum examined by Day & Pearcy (1968) and no trend in species rich- ness or diversity within this limited depth range was apparent.
Species nchness and diversity, though highly vari- able, significantly increased with the area sampled (Figs. 3 & 5). The observed relationship is sirnilar in shape to the power model that is frequently used to describe the species-area relationship, although both the number of species as well as the size of the areas

Mueter & Norcross: Community structure of smaU demersal fishes 4 9
considered were much smaller in our study. On aver- age, species richness was significantly lower on 'pure' sediments, particularly on mud and gravel (Fig. 4). Species diversity showed a similar Pattern, but tended to be higher on gravel than on sand and mud, and lower on mixed mud compared to other mixed sedi- ments. Mixed mud sediments typically consisted of rel- atively homogenous areas with sediments ranging from fine sand to mud. Mixed sand, mixed gravel, and gravel typically contained large amounts of shell hash in various sizes and appeared to be the most heteroge- neous and structurally coniplex bottom types in the area, based on video observations (Norcross unpubl. obs.). Spatial heterogeneity is typically associated with a higher diversity of animal species (Begon et al. 1990) and may explain the observed patterns.
Table 5. Contribution of each variable to the 'best-fit' models for Axes 1 to 4. The deviance for each of the variables refers to the deviance of a reduced model in which that variable is excluded from the model. Smooth non-linear functions of a variable were used if approximate F-tests and scatterplots indicated the presence of non-linear relationships. These variables are indicated by I( ). Pseudo R2- pseudo coefficient of determination for the best model (= 1 - deviance of best modeVdeviance of null model) and to the pseudo coefficient of partial determination for reduced models (= 1 - deviance of best model/deviance of reduced model). Variables are listed in the order of their contribution to the fit. For further details
See 'Methods'
1 Axis Model df Deviance Preudo R' I 1
Null model Best model f ( D T ) Area S 1 S2
2 Null model Best model
f ( D T ) s 2
3 Null model Best model S2 Area S I f ( D T )
4 Null model Best model Area DT f(S2) f ( S l )
Total numerical abundance (CPUE) of small fishes provides a rough indicator of the capacity of a given area, but because it aggregates a variety of species and sizes it is at best a crude measure. Total CPUE tended to decrease as the gravel content in the sedi- ment increased (Fig. 6), possibly indicating decreased abundances of small demersal fishes on coarse bot- tom. The presence of coarse sediment in this area is indicative of high current velocities due to strong tidal currents or of strong wind mixing in shallow areas. Tidal currents and strong mixing rnay repre- sent sources of environmental Stress that limit the abundance of small groundfishes. This trend could possibly be due to sampling difficulties reculting from strong currents, which niay decrease the effective- ness of the beam trawl. However, video observations seem to confirm that abundances of juvenile fishes are lower on coarse sediments (Norcross & Mueter 1999).
The 4 indices of species composition examined in our analysis descnbe different, independent aspects of community composition. Each index can be inter- preted as representing 2 groups of species that were highly correlated (positively or negatively) with the index (Table 4), and each index in turn was related to different aspects of the environment (Table 5). Thus, species associated with each index appeared to re- spond to different environmental gradients or in dif- ferent ways to the Same gradients. Each index con- trasted groups that respond in opposite ways to these gradients.
Relating indices to environmental variables allowed us to draw general conclusions regarding the re- sponse of an assemblage of fishes to environmental gradients, but the actual response of individual spe- cies may sometimes vary from that predicted. The more highly correlated the CPUE of an individual species is with one of the indices, the more likely it will follow the Same trends ac that in relation to envi- ronmental variables.
A potential drawback of using such indices of spe- cies composition is that species are not assigned to unique groups, as for example in cluster analysis. Sev- eral species in our analysis were strongly associated with 2 or more indices (Table 4). The principal advan- tage of using indices is the fact that they are statisti- cally well behaved, unlike the CPUEs of individual species, which do not lend themselves to a straightfor- ward statistical analysis. Our main goal was to search for generalizations and detect major patterns in spe- cies composition. The use of a reduced number of indices allowed us to detect general patterns in the relationship between species composition and envi- ronmental variables and to assess their statistical significance.

50 Mar Ecol Prog Ser
All 4 indices that we examined were significantly re- lated to the DT variable and to both sediment variables, suggesting that small groundfishes partition the avail- able habitat to a considerable degree based on these variables. A strong depth or DT gradient in bottom fishes and other benthic organisms has been obsemed in many studies and has even been compared to the elevation gradient in the terrestrial environment (Brown & Lomolino 1998). However, it is not clear whether depth, temperature, or other confounding pa- rameters are responsible for establishing and maintain- ing the gradient. Sirnilarly, the association of species and species groups with sediment composition may in- dicate a true preference for a specific sediment type, or may be related to other parameters like the availability of food or shelter. At least some benthic fishes display clear sediment preferences, regardless of the availabil- ity of food or other parameters (Moles & Norcross 1995).
The sirnplest explanation for the observed patterns is that the juveniles of each species display distinct depth preferences, similar to adult groundfishes (Day & Pearcy 1968), and select their preferred sediment type within the occupied depth range. The causes of depth zonation are poorly understood but may be related to oceanographic conditions, the history of larval settle- ment in the area, physical factors Like temperature, light, and pressure, and biotic interactions (Moyle & Cech 1988). Our analysis suggests strong non-linear effects of depthkemperature on ali indices of species composition (Figs. 7 to 10). The patterns of change along the DT variable suggest that species composition changes rapidly in relatively shaliow, warm water and more gradually in deeper, colder water. In contrast, effects of the sediment variables were typically linear or close to linear.
In Summary, the species composition of the small demersal fish community around Kodiak Island changed primarily along gradients of DT and secon- danly along gradients of sediment type as well as among geographic areas. While the DT variable was the most important variable along which species com- position changed, the Same variable was not signifi- cantly related to species richness, species diversity, or total CPUE. Therefore, species composition appeared to change independently of the overall abundance and of species richness and diversity.
Acknowledgements. We thank the field Crews that helped col- lect the data: Dave Doudna, Brenda Hoiladay, Bruce Short, Waldo Wakefield, Charlene Zabriskie, and the Crew of the FV 'Big Vailey', Gary Edwards and Jane Eisemann. We thank Ron Barry, Sue Hills, Mark Johnson, Terry Quinn, Kevin Stokes- bury and 5 anonymous reviewers for thoroughly reviewing the manuscript. Funding for this research was provided by NOAA Saltonstall-Kennedy grant no. NA16F0216-01. This is contn- bution no. 2549 of the Institute of Marine Science.
LITERATURE Cr 'ED
Alevizon W, Richardson R, Pitts P, S e ~ s s G (1985) Coral zonation and patterns of community structure in Baham- ian reef fishes. BuLl Mar Sci 36(2):304-318
Auster PJ, Malatesta RJ, LaRosa SC, Cooper RA, Stewart LL (1991) Microhabitat utilization by the rnegafaunal assem- blage at a low relief outer continental shelf site-Middle Atlantic Bight, USA. J Northw At1 Fish Sci 11:59-69
Begon M, Harper JL, Townsend CR (1990) Ecology: individu- als, populations and communities, 2nd edn. Blackweli Scientific Pubiications, Cambridge, MA
Bianchi G (1991) Demersal assemblages of the continental shelf and slope edge between the Gulf of Tehuantepec (Mexico) and the Guif of Papagayo (Costa Rica). Mar Ecol Prog Ser 73:121-140
Bianchi G (1992a) Demersal assernblages of the continental shelf and upper slope of Angola. Mar Ecol Prog Ser 81: 101-120
Bianchi G (199213) Study of the demersal assemblages of the continental sheif and upper slope off Congo and Gabon, based on the trawl surveys of the RV 'Dr Fridtjof Nansen'. Mar Ecol Prog Cer 85:9-23
Blaber SJM, Brewer DT, Harns AN (1994a) Distribution, bio- mass and community structure of demersal fishes of the Gulf of Carpentaria, Australia. Aust J Mar Freshw Res 45: 375-396
Blaber SJM, Brewer DT, Salini JP (1994b) Comparisons of fish communities of tropical estuarine and inshore habitats in the Guif of Carpentaria, northern Austraiia. In: Dyer KR, Orth RJ (eds) Changes in fluxes in estuanes: implications from science to management. Olsen & Olsen, Fredens- borg, p 363-372
Blackburn JE (1979) Demersal fish and shellfish assessment in selected estuary systems of Kodiak Island. Env Assess Alaskan Cont Shelf, Final Rep of Principal Invest 6: 727-851
Brown JH, Lomolino MV (1998) Biogeography. Sinauer Asso- ciates, Inc. Publishers, Sunderland, MA
Chilton EA (1997) Environmental variables influencing the distnbution and abundance of juvenile flatfishes in an exposed coastal area of Kodiak, Alaska. MS thesis, UAF, Fairbanks, AK
Clarke KR (1993) Non-parametric multivariate analyses of changes in community structure. Aust J Ecol 18:117-143
Clarke KR h s w o r t h M (1993) A method of h k i n g multivari- ate community structure to environmental variables. Mar Ecol Prog Ser 92:205-219
Colvocoresses JA, Musick JA (1984) Species associations and community composition of Middle Atlantic Bight conti- nental shelf demersal fishes. Fish Buil82(2):295-313
Day DS, Pearcy WG (1968) Species associations of benthic fishes on the continental sheif and slope off Oregon. J Fish Res Bd Can 25(12):2665-2675
Digby PGN, Kempton RA (1987) Multivariate analysis of eco- logical cornmunities. Chapman & Haü, London
Dunn JR, Kendail AW Jr, Wolotira RJ Jr, Boreman JH Jr, Dey DB, Matarese AC, Munk JE (1981) Seasonal composition and food web relationships of marine organisms in the near- shore zone-including components of the ichthyoplankton, meroplankton, and holoplankton. Env Assess Alaskan Cont Sheif, Final Rep of Principal Invest 13: 357-776
Field JG, Clarke KR, Warwick RM (1982) A practical strategy for analyzing multispecies distribution patterns. Mar Ecol Prog Ser 8:37-52
Folk RL (1980) Petrology of sedimentary rocks. Hemphiii Pub- lishing Co, Austin, TX
Mueter & Norcross: Community structure of srnall demersal fishes 51
Fujita T, Inada T, Ishito Y (1995) Depth-gradient structure of the demersal fish community on the continental shelf and upper slope off Sendai Bay, Japan. Mar Ecol Prog Ser 118: 13-23
Gauch HG (1982) Multivariate analysis in comrnunity ecol- ogy. Cambridge University Press, Cambridge
Gunderson DR, Ellis IE (1986) Development of a plunib staff beani trawl for sampling demersal fauna. Fish Res 4:35-41
Haedrich RL, Krefft G (1978) Distribution of bottom fishes in the Denmark Strait and Irminger Sea. Deep-Sea Res 25: 705-720
Haedrich RL, Rowe GT, Polloni PT (1975) Zonation and faunal composition of epibenthic populations on the continental slope south of New England. J Mar Res 33:191-212
Haedrich RL, Rowe GT, Polloni PT (1980) The megabenthic fauna in the deep sea of New England, USA. Mar Biol 57. 165-179
Harns CK, Hartt AC (1977) Assessment of pelagic and nearshore fish in three bays on the east and south coasts of Kodiak Island, Alaska. Env Assess Alaskan Cont Shelf, Quart Rep of Pnncipal Invest 1:483-688
Hastie TJ. Tibshirani RJ (1990) Generalized additive rnodels. Chapman & Hall, London
Hermann AJ, Hinckley S, Megrey BA, Stabeno PJ (1996) Interannual variability of the early life history of walleye pollock near Shelikof Strait as inferred from a spatially explicit, individual-based model. Fish Oceanogr 539-57
Johnson RA. Wichern, DW (1992) Appiied multivanate statis- tical analysis, 3rd edn Prentice Hall, Englewood Cliffs, NJ
Kendall AW Jr. Dunn JR (1984) Ichthyoplankton of the conti- nental shelf near Kodiak Island. Alaska. US Dept of Corn- merce, NOAA, NMFS Tech Rep 20:l-89
Kendall AW Jr, Dunn JR, Matarese AC, Rogers DE, Garrison KJ (1981) Taxonomic coniposition, seasonal distribution, and abundance of ichthyoplankton in the nearshore zone of the Kodiak Archipelago, Alaska. Env Assess Alaskan Cont Shelf, Final Rep of Principal Invest Vol 13. Biological studies. US Dept of the Intenor, Minerals Management Service, Alaska, OCS Region, Anchorage, p 777-842
Krebs CJ (1989) Ecological methodology. Harper & Row, New York
Kruskal JB (1964) Multidimensional scaiing by optimizing goodness of fit to a nonmetric hypothesis. Psychometrika 29:l-27
Magurran AE (1988) Ecological diversity and its measure- ment. Princeton University Press. Princeton. NJ
Marshali S, EUiott M (1998) Environmental influences on the fish assemblage of the Hun~ber Estuary, U.K Estuar Coast Shelf Sci 46~175-184
Merrett NR (1992) Demersal ichthyofaunal distribution in the abyssal Eastern North Atlantic, with special reference to Cor~rphaeniodes (Nematonurus) Armatus (Macrouridae). J Mar Biol Assoc UK 72:5-24
Editorial responsibiiity: Otto Kinne (Editor), Oldendorf/Luhe, Germany
Moles A, Norcross BL (1995) Sediment preferences in juve- nile Pacific flatfishes. Neth J Sea Res 34:177-182
Moranta J , Stefanescu C, Massuti E, Morales-Nin B, Lloris D (1998) Fish comrnunity structure and depth-related trends on the continental slope of the Balearic islands (Algenan basin, western Mediterranean). Mar Ecol Prog Ser 171: 247-259
Moyle PB, Cech J J (1988) Fiches: an introduction to ichthyol- ogy, 2nd edn. Prentice Hall. Englewood Cliffs. NJ
Norcross BL, Mueter FJ (1999) The use of an ROV in the study of juvenile flatfish. Fish Res 39:241-251
Norcross BL, Holiaday BA, Mueter FJ (1995) Nursery area characteristics of pleuronectids in coastal Alaska, USA. Neth J Sea Res 34(1-3):161-175
Norcross BL, Mueter FJ, Holladay BA (1997) Habitat models for juvenile pleuronectids around Kodiak Island, Alaska. Fish Bull 95504-520
Rogers DE, Rogers BJ, Rosenthal RJ (1986) The nearshore fishes. In: Hood DW, Zimrnerrnan ST (eds) The Gulf of Alaska, physical environment and biological resources. ~Mineral Management Service OCS Study MMS 86-0095. Dept of the Interior, Mineral Management Service. Wash- ington, DC, p 399-416
Rowe GT, Menzies RJ (1969) Zonation of large benthic inver- tebrates in the deep-sea off the Carolinas. Deep-Sea Res 16531-537
Saila SB. McKenna JE, Formation S, Silvestre GT, McManus GW (1996) Empirical methods and models for rnultispecies stock assessment. In: Gallucci VF, Saila SB, Gustafson DJ Rothschild BJ (eds) Stock assessment: quantitative meth- ods and applications for small-scale fisheries. Lewis Pub- lishers, Boca Raton, p 403-472
Sale PF, Guy JA, Steel WJ (1994) Ecological structure of assemblages of coral reef fishes on isolated patch reefs. Oecologia 98:83-99
Swartznian G, Huang C, Kaluzny S (1992) Spatial analysis of Bering Sea groundfish survey data using generalized additive rnodels. Can J Fish Aquat Sci 49:1366-1378
Ter Braak CJF (1995) Ordination. In. Jongman RHG, Ter Braak CJF, Van Tongeren OFR (eds) Data analysis in com- rnunity and landscape ecology. Carnbridge University Press, Cambridge, p 91-173
Thiel R , Sepulveda A, Kafemann R, NeUen W (1995) Environ- mental factors as forces structuring the fish community of the Elbe estuary J Fish Biol 46:47-69
Thorman S (1986) Seasonal colonisation and effects of salinity and temperature on species richness and abundance of fish of some brackish and estuarine shallow waters in Sweden. Holarct Ecol 9:126-132
Walters GE, Smith GB, Raymore PB, Hirschberger W (1985) Studies of the distribution and abundance of juvenile groundfish in the northwest Gulf of Alaska, 1980-82, 11: biological characteristics in the extended region NOAA Tech Memo NMFS F/NWC-77
Subrnitted: June 25, 1998; Accepted: May 10, 1999 Proofs received from author(s): November 29, 1999
Copyright © 2022 FDOKUMEN