Chironomids from Southern Alpine Running Waters: Ecology, Biogeography
Upload
cavehill-uwiCategory
view
0download
0
Assemblages and biogeography of demersal
fishes of the east coast of North America
Robin Mahon, Stephen K. Brown, Kees C.T. Zwanenburg, D. Bruce Atkinson,Kenneth R. Buja, Larry Claflin, Geoffrey D. Howell, Mark E. Monaco,Robert N. O’Boyle, and Michael Sinclair
Abstract: This study describes and maps demersal fish assemblages for the east coast of North America from Cape Hatteras,
North Carolina, to Cape Chidley, Labrador, evaluates evidence for interannual shifts in assemblage distribution, and examines
the relationship of the assemblages to accepted biogeographical boundaries. Demersal trawl survey data collected from 1975
to 1994 were analyzed. Visual classification of distribution maps for the 108 most abundant demersal species revealed nine
species groups, based on both geography and depth distribution. Eighteen assemblage groups were identified using principal
components analysis (PCA) and mapped. Assemblage groups were also identified by cluster analysis. Fish assemblages
identified by both methods were spatially coherent. Assemblage distribution patterns were not consistent with accepted
biogeographical boundaries. The PCA explained only 56.3% of the variance in distribution of the species, indicating that the
assemblages should be interpreted as indeterminate, potentially adaptable entities rather than as rigid ecological constructs.
Assemblages were persistent in composition through time but appeared to shift in location. The apparent looseness of the
assemblages and their persistence through time in spite of severe impacts from fishing suggest that single-species management
approaches may not be entirely inappropriate for the major groundfish species in the study area.
Résumé: Nous avons caractérisé les assemblages de poissons benthiques de la côte est de l’Amérique du Nord, depuis le cap
Hatteras, en Caroline du Nord, jusqu’au Cap Chidley, au Labrador, pour en faire la description et produire une représentation
cartographique de leur distribution, évaluer les signes dénotant des changements de distribution survenant au cours d’une
même année et examiner la relation entre les assemblages et les limites biogéographiques qui leur sont généralement
attribuées. Nous avons analysé les données obtenues par des relevés au chalut de fond de 1975 à 1994. D’après une
classification visuelle fondée sur les cartes de distribution des 108 espèces benthiques les plus abondantes, nous avons
distingué neuf groupes d’espèces en fonction de leur distribution géographique et de leur distribution en profondeur.
L’analyse des composantes principales (ACP) a permis de définir 18 groupes d’assemblages dont nous avons établi la
cartographie. Nous avons aussi défini des groupes d’assemblage par analyse typologique. Les premiers assemblages définis
par les deux méthodes étaient spatialement cohérents. Par ailleurs, nous avons constaté que la distribution des assemblages ne
concordait pas avec les limites biogéographiques qui leur sont habituellement attribuées. Les résultats de l’ACP n’expliquaient
que 56,3 % de la variance de la distribution des espèces, ce qui pourrait signifier qu’il y a lieu de considérer les assemblages
comme des entités indéterminées et susceptibles de s’adapter, au lieu de groupes écologiques invariables. Les assemblages ont
gardé la même composition, mais leur emplacement semblait changer. Vu l’apparente mobilité et la pérennité que présentent
les assemblages malgré le lourd impact de la pêche, il se pourrait qu’un mode de gestion où les espèces sont considérées
individuellement ne soit pas entièrement injustifié pour les principales espèces de fond qu’on trouve dans la zone étudiée.
[Traduit par la Rédaction]
Introduction
There have been several previous studies of demersal fishassemblages on parts of the continental shelf off the east coastof North America (Colvocoresses and Musick 1984; Mahon
and Sandeman 1985; Overholtz and Tyler 1985; Mahon andSmith 1989a; Gabriel 1992; Gomes et al. 1992, 1995; Gomes1993; Guadalupe Villagarcia 1995), although few have exam-ined the northern Labrador Shelf. One other study examinedthe entire region using 1970–1980 trawl survey data from Cape
Can. J. Fish. Aquat. Sci. 55: 1704–1738 (1998)
Received June 17, 1997. Accepted March 11, 1998.J14066
R. Mahon. Fisheries and Environmental Consulting, 48 Sunset Crest, St. James, Barbados.S.K. Brown, K.R. Buja, L. Claflin, and M.E. Monaco. Strategic Environmental Assessments Division, Office of Ocean ResourcesConservation and Assessment, National Oceanic and Atmospheric Administration, 1305 East-West Highway, Silver Spring, MD 02910,U.S.A.K.C.T. Zwanenburg,1 R.N. O’Boyle, and M.Sinclair. Department of Fisheries and Oceans, Marine Fish Division, Bedford Institute ofOceanography, Dartmouth, NS B2Y 4A2, Canada.D.B. Atkinson. Department of Fisheries and Oceans, Northwest Atlantic Fisheries Centre, P.O. Box 5667, St. John’s, NF A1C 5X1,Canada.G.D. Howell. Environment Canada, 5th Floor, Queen Square, 45 Alderney Drive, Dartmouth, NS B2Y 2N6, Canada.
1 Author to whom all correspondence should be addressed.
1704
© 1998 NRC Canada
F98-065.CHPWed Aug 19 14:49:55 1998
Color profile: DisabledComposite Default screen

Hatteras, North Carolina, U.S.A., to Cape Chidley, Labrador,Canada, aggregated into bands about 30 nautical miles inwidth (Mahon and Sandeman 1985). To examine assemblagesat a biogeographical scale, a data set that spans a large area isneeded. In that regard, the scale of the present study is unique.
This paper describes the analysis of research demersal trawlsurvey data for the east coast of North America from CapeHatteras in the south to Cape Chidley in the north (Fig. 1). Theprimary goal is to describe and map species assemblages andto evaluate evidence for ecological regime and assemblagedistribution shifts on a decadal time scale. The questions ad-dressed in this study are as follows. (i) What are the demersalfish assemblages? (ii) What are the assemblage distributions?(iii) Are the assemblages stable over time? (iv) How does thelarge-scale view of assemblage distribution relate to previousviews of marine biogeography in the study area?
To answer these questions, three categories of analyseswere undertaken: species by species descriptions of geo-graphic distribution, multivariate analyses to define speciesassemblages, and preliminary evaluation of temporal variationin assemblage distributions. However, analyzing sample leveldata for such a large area poses a variety of problems. On onehand, constraints are imposed by the inability of most softwareavailable for assemblage analysis to accommodate such a large
data set. On the other, advances in microcomputers and map-ping software have made it practical to manipulate and visu-alize large data sets such as this one.
The data set
Data sources and selectionThe data analyzed in this study were collected by demersal
research trawl surveys from 1970 to 1994. The survey designs,stratification schemes, gears, etc., for these surveys have beendescribed in several publications (Grosslein 1969; Doubleday1981; Doubleday and Rivard 1981). Since these publications,there have been new vessels and gears used, and additionalsurveys have been carried out at other times of the year invarious areas, but the basic designs have remained the same.The main trawl survey time-series in each area, which wereestablished to provide indices of abundance for importantcommercial species, have been carried out continuously fromthe following years: 1963 in the United States, 1970 in theScotia–Fundy and southern Gulf of St. Lawrence regions,1983 in the northern Gulf of St. Lawrence, and various startingyears prior to and during the 1970s off Newfoundland andLabrador.
In addition to information on abundance, these surveys also
Fig. 1. Study area map with place names referred to in the text.
Mahon et al. 1705
© 1998 NRC Canada
F98-065.CHPWed Aug 19 14:50:31 1998
Color profile: DisabledComposite Default screen

collect data on size, sex, age, and reproductive condition. Inview of the large size-related niche shifts exhibited by mostfishes, assemblage analysis of size-structured data would bedesirable (Werner and Gilliam 1984). However, including thislevel of detail would increase the volume of data by at least anorder of magnitude and was considered to be impractical forthe present study.
The abundance data from these surveys were combined intoa single data set as described in Brown et al. (1996). The fishspecies captured by the trawl surveys were defined as demer-sal, pelagic, or mesopelagic based on information available invarious texts (e.g., Bigelow and Schroeder 1953; Scott andScott 1988). Only demersal species are included in this study.The only invertebrate considered to be sufficiently well sam-pled by the trawl gear is the shortfin squid, which was includedin the analysis.
The data, which include only valid survey tows using stand-ard survey gear, were acquired from five major sampling areas:(i) Labrador Shelf from Cape Chidley south to the GrandBanks of Newfoundland, Flemish Cap, and the west coast ofNewfoundland, (ii) the northern Gulf of St. Lawrence, (iii) thesouthern Gulf of St. Lawrence, (iv) the Scotian Shelf, Bay ofFundy, and part of Georges Bank, and (v) Georges Bank, Gulf
of Maine, and the Middle Atlantic Bight (Brown et al. 1996).The initial data set included all months in the years 1970–1994,comprising 54 978 trawl tows, with 26 286 369 individualsfrom 412 species, including some aggregate groups (Brown etal. 1996) (Table 1).
In several instances, specimens in the catch are not identi-fied to species, and several aggregate groups were formed inthe initial data processing by combining species for whichthere is a high probability of misidentification. However, theonly aggregate group used in the final analyses is redfishes,which comprise three Sebastes species.
Data transformationBecause this data set consists of data from several sources,
differences among the vessels and gears may have affected thecatch per standard tow. Since there are some areas of overlapbetween surveys, and the same vessel and gear are sometimesused in more than one area, some limited intercalibration ofvessels and gear would have been possible. However, previousstudies have indicated that, even with comparative fishing ex-periments, intercalibration of vessels and gear is seldom sta-tistically significant and that the coefficients are usuallydetermined by only a few data points (Mahon and Smith
Period Jan. Feb. Mar. Apr. May June July Aug. Sept. Oct. Nov. Dec. Total
NMFS, Northeast Fisheries Science Center
1970–1974 573 905 156 125 659 646 3 066
1975–1979 372 841 395 94 430 222 960 628 54 3 996
1980–1984 140 175 417 765 200 15 192 81 270 767 272 3 294
1985–1989 27 543 608 303 747 109 1 2 338
1990–1994 276 561 562 52 14 358 531 2 354
DFO, Scotia–Fundy region
1970–1974 65 591 29 685
1975–1979 115 624 86 66 105 35 1 031
1980–1984 31 571 72 720 13 32 704 208 2 351
1985–1989 52 703 4 11 844 17 343 1 974
1990–1994 242 492 53 935 2 1 724
DFO, southern Gulf region
1970–1974 1 314 315
1975–1979 320 16 336
1980–1984 21 358 379
1985–1989 4 879 883
1990–1994 885 885
DFO, northern Gulf region
1980–1984 395 112 8 9 499
1985–1989 790 46 850 13 1 699
1990–1994 635 760 424 1 819
DFO, Newfoundland–Labrador region
1970–1974 28 118 144 205 364 285 108 39 76 156 132 28 1 683
1975–1979 296 410 39 339 816 544 66 358 375 406 541 52 4 242
1980–1984 396 593 268 457 795 391 103 174 236 416 1127 350 5 306
1985–1989 283 896 372 818 1319 479 143 710 164 641 1299 343 7 467
1990–1994 93 704 6 722 1117 345 39 485 6 384 2135 616 6 652
Total 3056 3524 5176 6298 5162 2188 4669 4082 5369 6796 7202 1479 54 978
Note: NMFS, National Marine Fisheries Service (United States); DFO, Department of Fisheries and Oceans (Canada). The periods and months in bold type
were used in the multivariate analysis.
Table 1.Number of sets in the trawl survey data by source, 5-year period, and month.
Can. J. Fish. Aquat. Sci. Vol. 55, 19981706
© 1998 NRC Canada
F98-065.CHPWed Aug 19 14:50:37 1998
Color profile: DisabledComposite Default screen
1989b). Furthermore, since intercalibration data are not avail-able for all vessels and gear types used in the different surveysover the years, it was not deemed feasible to convert all sur-veys to a single standard.
Number caught per tow was used as the abundance measurein the analyses, based on the assumption that gear and vesselbiases are likely to be small relative to sampling variability andthe major signals. Also, other approaches, such as analyzingpresence–absence or data grouped into intervals, degrade theinformation but do not eliminate the potential biases. Becausetrawl survey data frequently have a skewed distribution, thedata were log10(x + 1) transformed. Studies on trawl surveydata suggest that the differences in results obtained usingbiomass or numbers are likely to be negligible (Bianchi andHøisæter 1992).
Methods
The analytical objectives of this project are to identify speciesassemblages and to determine spatial and temporal patterns, but nosingle method is widely accepted for identifying and mapping speciesassemblages. Because each methodological approach has strengthsand weaknesses, several methods were used in this study. The ration-ale is that if several distinct analyses show similar results, the overallrobustness of the conclusions is enhanced. Available approachesrange from qualitative analyses that depend on the familiarity of theinvestigator with distribution patterns to univariate approaches, suchas plotting distribution maps, to multivariate analyses, such as classi-fication (usually cluster analysis) and ordination (Clifford andStephenson 1975; Gauch 1982).
The assemblage analysis began with a subjective visual classifica-tion of the single-species distribution patterns. A multivariate ordina-tion procedure, principal components analysis (PCA), was then usedto identify assemblages statistically. Although there are other ordina-tion methods that were developed specifically for ecological data(e.g., Gauch 1982; Ter Braak 1986) and have been used successfullyin other studies of demersal fishes (e.g., Bianchi 1992), the availablesoftware cannot process the large number of cases found in this trawlsurvey data set.
Finally, cluster analysis was conducted for comparison with thePCA. Cluster analysis was performed on (i) sites (i.e., tows) to gener-ate mappable results comparable with maps of PCA scores and (ii) thespecies assemblages identified by PCA and cluster analysis to estab-lish the hierarchical relationships among the assemblages.
Visual classificationVisual classification of species distributions was carried out as a
background for interpreting the multivariate analyses. The purpose ofthis process was to develop an intuitive, knowledge-based classifica-tion that could be compared with the results of the more objectivemultivariate approaches. The distributions of 108 demersal specieswere mapped for all years and months combined using a log10(x + 1)abundance scale. The maps were then subjectively classified intogroups based on a subjective visual interpretation of the distributions,combined with the biological and other expert knowledge.
Multivariate analysesThe multivariate analyses were conducted using a subset of the
trawl survey data which was developed as follows (Table 1). Prelimi-nary PCA runs were tried with various subsets of months. Ultimately,the main survey series in each area was used in the multivariate analy-ses. The Newfoundland–Labrador surveys are carried out at differenttimes of the year in different areas. Therefore, all months of New-foundland–Labrador data were included in the data subset. The dataused from the rest of the surveys were primarily from the summer and
autumn. For the northern Gulf of St. Lawrence, data from July toSeptember and January were used. For the southern Gulf of St.Lawrence, data from August to October were used. For the ScotianShelf and Bay of Fundy, data from July to September were used. ForGeorges Bank south to Cape Hatteras, data from September to De-cember were used.
Data were screened in 5-year time periods for consistency in spa-tial coverage. For 1970–1974, the Labrador Shelf was considered tobe inadequately covered. Therefore, data prior to 1975 were excludedfrom the multivariate analyses.
Three species selection criteria were applied to ensure adequatesample size for each species in the multivariate analyses: (i) 500 indi-viduals must have been caught for the entire 1975–1994 period,(ii) the species had to have been caught in at least 0.05% of the trawlsets for the 1975–1994 period, and (iii) 100 individuals had to havebeen caught in each 5-year period between 1975 and 1994.
The final data subset used for the multivariate analyses contained1975–1994 data for 66 species collected in 38 695 tows (Tables 1 and2).
PCA was used as the primary multivariate analysis method. Spe-cies loadings on the principal components (PCs) were used to identifygroups of species that tend to co-occur (i.e., assemblages). Previousanalyses have shown that ubiquitous species may be a member ofmore than one assemblage, and PCA allows a species to be associatedwith more than one component. The correlation matrix of log10(x + 1)-transformed number caught per tow was used as input for the PCA.
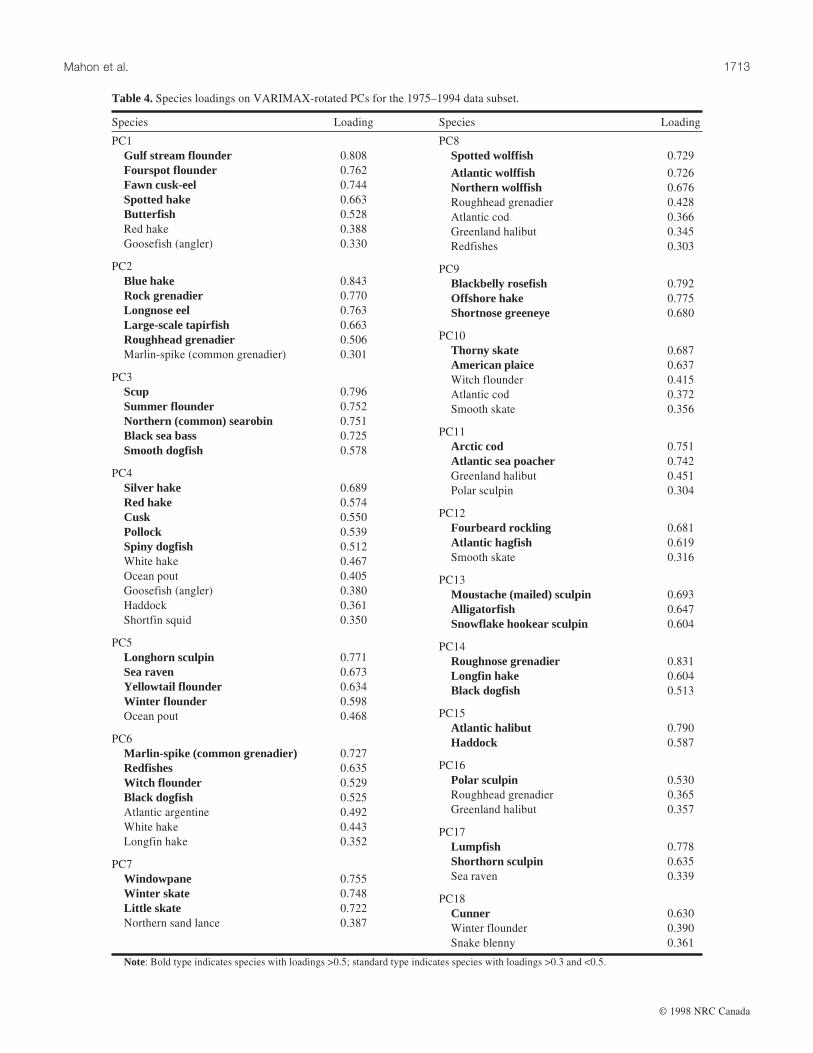
Two categories of species loadings on PCs are recognized in thisstudy. Species with loadings >0.5 on a PC are considered the majorspecies in the assemblage represented by that PC. Species with load-ings between 0.3 and 0.5 are also considered members of assem-blages, albeit with weaker associations. The usual practice, to use aloading of 0.5 (i.e., a PC contains 25% of the overall variability of aspecies) as the cutoff, is not based on statistical significance; it ismerely a convention. The large size of the data set and the largenumber of PCs, which are distributed over a huge study area, enablerecognition of the weaker class of associations (Gorsuch 1974).
The eigenvalue associated with a PC indicates the relative impor-tance of that component. PCs with eigenvalues >1 are considered torepresent statistically significant assemblages (Jolliffe 1986).
VARIMAX rotation was used for the PCs having eigenvalues >1in the unrotated PC extraction. VARIMAX rotation is typically usedwhen it is desirable to have a relatively small number of speciesstrongly associated with (i.e., highly loaded on) each PC (Jolliffe1986). VARIMAX rotation also tends to find a solution with fewnegative loadings on the PCs, thus facilitating interpretation of thePCs as assemblages.
The site scores on each VARIMAX-rotated PC are used as a mea-sure of the extent to which the assemblages defined by the PCs werepresent at each site. Every assemblage can potentially be present atevery site, as the assemblages are not mutually exclusive in space.Thus, groups of sites can be defined on the basis of PC scores. In thisstudy, the “core” sites of assemblages were determined by selectingthe sites in the top 5% of the site scores for each PC.
The large data set and software limitations precluded hierarchicalagglomerative clustering for the entire data set, necessitating a two-stage analytical process in the cluster analyses of trawl tows (sites).This analysis was performed using the same subset of the groundfishdata and transformation that was used for the PCA. The results of thesite clustering are directly comparable with the mappable groups de-rived by selecting the sites with the top 5% of PC scores.
In the first stage, a random subset of 10% of the data (about 4000tows) was clustered using squared Euclidean distance and Ward’smethod. To be consistent with the PCA, clustering for this data subsetwas stopped at 18 cluster groups (CGs). The second stage was anonhierarchical clustering method, nearest centroid sorting, that re-quires cluster “seed points” as initial estimates of the cluster means(Anderberg 1973; SAS Institute Inc. 1989). Output from the first
Mahon et al. 1707
© 1998 NRC Canada
F98-065.CHPWed Aug 19 14:50:41 1998
Color profile: DisabledComposite Default screen

Time period
Common name Scientific name 1975–1979 1980–1984 1985–1989 1990–1994
Redfishes Sebastes spp. 2 291 514 2 581 080 2 259 409 2 007 064
American plaice Hippoglossoides platessoides 585 609 632 769 864 637 480 839
Atlantic cod Gadus morhua 221 160 399 575 961 117 589 339
Butterfish Peprilus triacanthus 134 043 241 423 211 793 159 600
Silver hake Merluccius bilinearis 101 697 104 676 187 476 111 989
Greenland halibut Reinhardtius hippoglossoides 91 544 91 306 151 697 124 259
Arctic cod Boreogadus saida 249 455 40 196 86 902 47 883
Yellowtail flounder Limanda ferruginea 95 950 78 101 118 593 121 554
Haddock Melanogrammus aeglefinus 68 258 117 574 120 027 61 085
Shortfin squid Illex illecebrosus 125 184 75 618 59 490 89 368
Northern sand lance Ammodytes dubius 70 832 153 408 10 590 13 390
Spiny dogfish Squalus acanthias 47 280 52 799 70 042 64 776
Thorny skate Raja radiata 35 759 46 618 74 342 71 763
Witch flounder Glyptocephalus cynoglossus 38 102 43 771 66 544 52 929
Black dogfish Centroscyllium fabricii 6 395 14 530 52 416 68 160
White hake Urophycis tenuis 23 378 23 381 55 643 27 173
Winter flounder Pseudopleuronectes americanus 16 418 16 878 48 991 46 252
Atlantic argentine Argentina silus 20 591 13 507 57 278 19 325
Longhorn sculpin Myoxocephalus octodecemspinosus 21 224 14 053 32 001 34 306
Rock (roundnose) grenadier Coryphaenoides rupestris 34 515 22 708 31 838 5 402
Marlin-spike (common grenadier) Nezumia bairdi 13 618 12 181 16 969 32 601
Red hake Urophycis chuss 22 035 18 132 19 873 11 414
Lumpfish Cyclopterus lumpus 3 063 4 936 26 079 25 777
Scup Stenotomus chrysops 28 115 10 641 16 776 3 580
Spotted hake Urophycis regius 18 782 14 778 16 039 7 058
Roughhead grenadier Macrourus berglax 14 757 15 086 12 184 12 803
Pollock Pollachius virens 4 589 7 908 15 606 13 310
Atlantic wolffish Anarhichas lupus 13 179 10 479 8 519 5 533
Longfin hake Urophycis chesteri 1 864 7 013 12 018 11 538
Little skate Raja erinacea 10 047 7 875 7 591 5 839
Fourspot flounder Paralichthys oblongus 6 890 8 908 6 960 4 574
Moustache (mailed) sculpin Triglops murrayi 5 760 5 852 7 855 7 382
Winter skate Raja ocellata 3 949 6 808 7 266 4 725
Windowpane Scophthalmus aquosus 6 885 3 701 7 022 2 767
Gulf Stream flounder Citharichthys arctifrons 3 706 5 301 3 979 3 431
Sea raven Hemitripterus americanus 3 241 3 568 5 099 3 700
Northern (common) searobin Priondius carolinus 4 924 2 486 3 470 3 721
Northern wolffish Anarhichas denticulatus 5 305 4 953 2 318 862
Smooth skate Raja senta 3 351 3 198 3 734 2 919
Roughnose grenadier Trachyrhynchus murrayi 1 405 957 6 500 137
Blue hake Antimora rostrata 2 785 2 647 1 396 1 695
Spotted wolffish Anarhichas minor 2 182 2 787 1 674 962
Goosefish (angler) Lophius americanus 1 889 1 734 1 816 1 464
Blackbelly rosefish Helicolenus dactylopterus 2 125 1 474 1 140 1 562
Ocean pout Macrozoarces americanus 1 698 1 403 1 622 1 534
Fourbeard rockling Enchelyopus cimbrius 716 607 3 041 1 356
Atlantic sea poacher Agonus decagonus 1 495 307 1 359 2 302
Alligatorfish Aspidophoroides monopterygius 695 480 2 527 1 645
Fawn cusk-eel Lepophidium cervinum 1 176 1 518 1 622 966
Atlantic halibut Hippoglossus hippoglossus 1 186 1 204 1 229 785
Shorthorn sculpin Myoxocephalus scorpius 273 454 1 717 1 767
Longnose eel Synaphobranchus kaupi 860 530 668 1 328
Black sea bass Centropristis striata 2 061 421 418 354
Cunner Tautogolabrus adspersus 146 224 2 196 605
Atlantic hagfish Myxine glutinosa 963 573 389 1 157
Polar sculpin Cottunculus micropes 434 295 994 1 240
Snowflake hookear sculpin Artediellus uncinatus 253 158 1 337 999
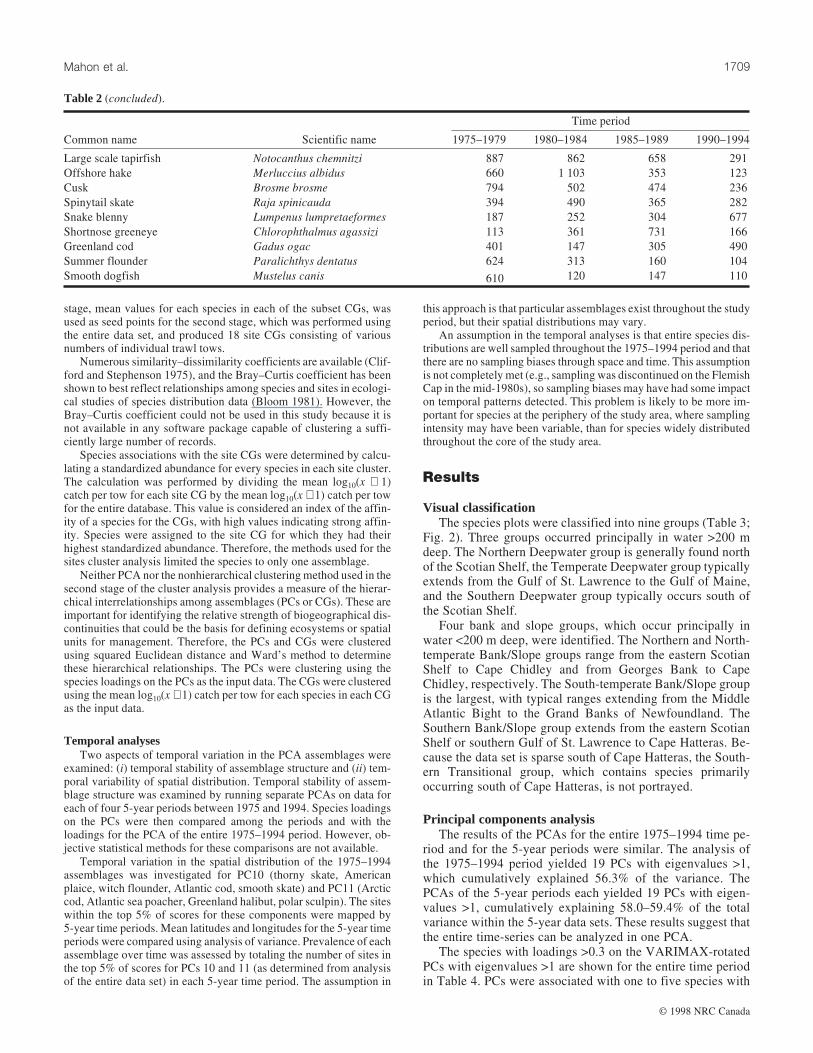
Table 2.Numbers of individuals caught per 5-year time period for species with a total catch >500 and catch >100 in each period.
Can. J. Fish. Aquat. Sci. Vol. 55, 19981708
© 1998 NRC Canada
F98-065.CHPWed Aug 19 14:50:47 1998
Color profile: DisabledComposite Default screen
stage, mean values for each species in each of the subset CGs, wasused as seed points for the second stage, which was performed usingthe entire data set, and produced 18 site CGs consisting of variousnumbers of individual trawl tows.
Numerous similarity–dissimilarity coefficients are available (Clif-ford and Stephenson 1975), and the Bray–Curtis coefficient has beenshown to best reflect relationships among species and sites in ecologi-cal studies of species distribution data (Bloom 1981). However, theBray–Curtis coefficient could not be used in this study because it isnot available in any software package capable of clustering a suffi-ciently large number of records.
Species associations with the site CGs were determined by calcu-lating a standardized abundance for every species in each site cluster.The calculation was performed by dividing the mean log10(x + 1)catch per tow for each site CG by the mean log10(x + 1) catch per towfor the entire database. This value is considered an index of the affin-ity of a species for the CGs, with high values indicating strong affin-ity. Species were assigned to the site CG for which they had theirhighest standardized abundance. Therefore, the methods used for thesites cluster analysis limited the species to only one assemblage.
Neither PCA nor the nonhierarchical clustering method used in thesecond stage of the cluster analysis provides a measure of the hierar-chical interrelationships among assemblages (PCs or CGs). These areimportant for identifying the relative strength of biogeographical dis-continuities that could be the basis for defining ecosystems or spatialunits for management. Therefore, the PCs and CGs were clusteredusing squared Euclidean distance and Ward’s method to determinethese hierarchical relationships. The PCs were clustering using thespecies loadings on the PCs as the input data. The CGs were clusteredusing the mean log10(x + 1) catch per tow for each species in each CGas the input data.
Temporal analysesTwo aspects of temporal variation in the PCA assemblages were
examined: (i) temporal stability of assemblage structure and (ii) tem-poral variability of spatial distribution. Temporal stability of assem-blage structure was examined by running separate PCAs on data foreach of four 5-year periods between 1975 and 1994. Species loadingson the PCs were then compared among the periods and with theloadings for the PCA of the entire 1975–1994 period. However, ob-jective statistical methods for these comparisons are not available.
Temporal variation in the spatial distribution of the 1975–1994assemblages was investigated for PC10 (thorny skate, Americanplaice, witch flounder, Atlantic cod, smooth skate) and PC11 (Arcticcod, Atlantic sea poacher, Greenland halibut, polar sculpin). The siteswithin the top 5% of scores for these components were mapped by5-year time periods. Mean latitudes and longitudes for the 5-year timeperiods were compared using analysis of variance. Prevalence of eachassemblage over time was assessed by totaling the number of sites inthe top 5% of scores for PCs 10 and 11 (as determined from analysisof the entire data set) in each 5-year time period. The assumption in
this approach is that particular assemblages exist throughout the studyperiod, but their spatial distributions may vary.
An assumption in the temporal analyses is that entire species dis-tributions are well sampled throughout the 1975–1994 period and thatthere are no sampling biases through space and time. This assumptionis not completely met (e.g., sampling was discontinued on the FlemishCap in the mid-1980s), so sampling biases may have had some impacton temporal patterns detected. This problem is likely to be more im-portant for species at the periphery of the study area, where samplingintensity may have been variable, than for species widely distributedthroughout the core of the study area.
Results
Visual classificationThe species plots were classified into nine groups (Table 3;
Fig. 2). Three groups occurred principally in water >200 mdeep. The Northern Deepwater group is generally found northof the Scotian Shelf, the Temperate Deepwater group typicallyextends from the Gulf of St. Lawrence to the Gulf of Maine,and the Southern Deepwater group typically occurs south ofthe Scotian Shelf.
Four bank and slope groups, which occur principally inwater <200 m deep, were identified. The Northern and North-temperate Bank/Slope groups range from the eastern ScotianShelf to Cape Chidley and from Georges Bank to CapeChidley, respectively. The South-temperate Bank/Slope groupis the largest, with typical ranges extending from the MiddleAtlantic Bight to the Grand Banks of Newfoundland. TheSouthern Bank/Slope group extends from the eastern ScotianShelf or southern Gulf of St. Lawrence to Cape Hatteras. Be-cause the data set is sparse south of Cape Hatteras, the South-ern Transitional group, which contains species primarilyoccurring south of Cape Hatteras, is not portrayed.
Principal components analysisThe results of the PCAs for the entire 1975–1994 time pe-
riod and for the 5-year periods were similar. The analysis ofthe 1975–1994 period yielded 19 PCs with eigenvalues >1,which cumulatively explained 56.3% of the variance. ThePCAs of the 5-year periods each yielded 19 PCs with eigen-values >1, cumulatively explaining 58.0–59.4% of the totalvariance within the 5-year data sets. These results suggest thatthe entire time-series can be analyzed in one PCA.
The species with loadings >0.3 on the VARIMAX-rotatedPCs with eigenvalues >1 are shown for the entire time periodin Table 4. PCs were associated with one to five species with
Time period
Common name Scientific name 1975–1979 1980–1984 1985–1989 1990–1994
Large scale tapirfish Notocanthus chemnitzi 887 862 658 291
Offshore hake Merluccius albidus 660 1 103 353 123
Cusk Brosme brosme 794 502 474 236
Spinytail skate Raja spinicauda 394 490 365 282
Snake blenny Lumpenus lumpretaeformes 187 252 304 677
Shortnose greeneye Chlorophthalmus agassizi 113 361 731 166
Greenland cod Gadus ogac 401 147 305 490
Summer flounder Paralichthys dentatus 624 313 160 104
Smooth dogfish Mustelus canis 610 120 147 110
Table 2 (concluded).
Mahon et al. 1709
© 1998 NRC Canada
F98-065.CHPWed Aug 19 14:50:51 1998
Color profile: DisabledComposite Default screen

loadings >0.5 and with zero to five species with loadings be-tween 0.5 and 0.3. Under the loadings >0.5 criterion for high-level inclusion in an assemblage, 54 of the 66 species weremembers of an assemblage, but only one species, black dog-fish, was a member of two. Under the loadings >0.3 criterionfor low-level inclusion in an assemblage, two species, rough-head grenadier and Greenland halibut, were members of threeassemblages, 15 species were members of two assemblages,and two species, spinytail skate and Greenland cod, were notmembers of any assemblage. Species with very high loadingson one PC, such as blue hake, roughnose grenadier, and GulfStream flounder, may be considered assemblage specialists(stenotopic); species with low loadings on more than one PCmay be considered assemblage generalists (eurytopic). Specieswith loadings <0.3 are not considered members of any assem-blage.
Mapping the high 5% of scores on each PC, assumed torepresent the distribution core of the assemblage associated
with that PC, indicated a high degree of spatial aggregation ofthe sites and a wide variety of distribution patterns (Fig. 3).The decision to use the high 5% of scores on each PC wasbased on mapping and examining the high 5, 10, 15, and 20%on several PCs (Brown et al. 1996). As the percentage includedin the map was increased, the spatial aggregation of the assem-blages decreased and the assemblages became progressivelyless spatially distinct.
Some assemblages are clearly associated with deep-slopeareas (e.g., PCs 2, 6, 8, 10, 16), while others occur primarilyon the tops of banks (e.g., PCs 1, 3, 4, 5, 7, 13, 17, 18). Thedistribution patterns of the assemblages show that they occurat spatial scales that can be detected with trawl surveys andthat can be perceived at the overall scale of the study. Thedegree to which these assemblages are biologically functionalunits, or merely consist of species with similar responses to en-vironmental gradients, remains unknown. For some assem-blages (e.g., PC5), it appears that the topographic and
Fig. 2. Maps of example species for the species groups determined by visual classification of species distribution maps.
Can. J. Fish. Aquat. Sci. Vol. 55, 19981710
© 1998 NRC Canada
F98-065.CHPWed Aug 19 14:51:26 1998
Color profile: DisabledComposite Default screen

hydrographic complexity of the shelves provides patches ofappropriate habitat that are scattered throughout the study area.
In contrast with the site cluster analysis, where each site isassigned to a particular assemblage group, the PCA approachallows more than one assemblage to occur at a site and alsoallows no assemblage to occur at a site (Table 5). Just underhalf of the sites (45.5%) did not fall into the top 5% of scoreson any PC. Assuming that the 5% selection criterion is a goodmeasure of assemblage integrity, this indicates that assem-blages can only be identified at 54.5% of the sites. The fishfauna at the remaining 45.5% of sites would, therefore, beconsidered unstructured. Only one assemblage was detected at31.8% of the sites, while more than one assemblage occurredat 22.7% of sites, with 10 sites having as many as eight assem-blages.
One problem with using site scores from PCA is that anassemblage may be shown at a site where one of the majorspecies of that assemblage does not occur. PC15, Atlantic
halibut/haddock, provides a simple example (Fig. 3). No had-dock were caught north of Hamilton Bank, yet the assemblageis shown as present along the slope of the Labrador Shelf be-cause Atlantic halibut is relatively abundant there. Similarly,although the map of PC17 (Fig. 3) shows the area wherelumpfish and shorthorn sculpin co-occur around St. PierreBank, it also shows this assemblage on the shelf northwest ofNewfoundland, where the latter species was seldom caught.
An additional problem with the correlation matrix basedPCA method used is that associations involving ubiquitousspecies are deemphasized because assemblages are defined byspecies that tend to co-occur at unusually high frequencies,even if they are not particularly abundant overall. For example,gulfstream and fourspot flounder are the species with the high-est loadings on PC1 (0.81 and 0.76, respectively), which ex-plains 8.8% of the total variance (Table 4). Although they arenot particularly abundant, these species both occur primarilysouth of Cape Cod. In contrast, widespread or abundant
Fig. 2 (concluded).
Mahon et al. 1711
© 1998 NRC Canada
F98-065.CHPWed Aug 19 14:52:36 1998
Color profile: DisabledComposite Default screen

species, which may co-occur with many other species overtheir ranges, are much less strongly associated with assem-blages identified by the PCA. For example, American plaiceand Atlantic cod are caught in large numbers throughout thestudy area. American plaice is fairly strongly associated withPC10, and Atlantic cod is weakly associated with PCs 8 and10. These two components explain only 2.6 and 2.4% of thetotal variance, respectively.
The pattern described above can also be seen in Table 6,which summarizes species compositions of PCs 10 and 11,using the top 5% of sites. Mean absolute catch per tow showsthat the core species may actually be less abundant than otherspecies (e.g., Atlantic sea poacher and American plaice forPC11). Relative catch per tow, calculated by dividing the meancatch per tow for the sites with the top 5% of PC scores by theoverall mean catch per tow, provides a better, although notperfect, indication of the basis for the PCA extraction of as-semblages.
The above problem occurred because the PCA approachhas the implicit assumption that assemblages are determinedby species that tend to occur primarily together, and not bywidespread species that co-occur with many other species.However, widespread species may be present in considerablenumbers where these assemblages occur, and they may playan important role in assemblage dynamics. To gain a betterunderstanding of how PCA site scores relate to species com-position, it would be useful to examine changes in speciescomposition of subsets of sites with different scores on severalPCs (e.g., top 5, 5–10, 10–15%, etc.). An alternative approachto defining the assemblages would be to use abundance of themajor species identified by the PCA at some specified level ofabundance or relative abundance (e.g., greater than the overallaverage catch per tow) as a cutoff, rather than the site scores.In this case, an assemblage could be considered present atsites where all the major species occurred in significant num-bers.
Northern Deepwater North-temperate Bank/Slope Southern Bank/SlopeLongnose eel Redfishes Fourspot flounder
Largescale tapirfish Witch flounder Butterfish
Blue hake Smooth skate Spotted hake
Rock (roundnose) grenadier Atlantic wolffish Fawn cusk-eel
Roughhead grenadier Atlantic cod Gulf Stream flounder
Spinytail skate American plaice Summer flounder
Stoutsaw palate Thorny skate Scup
Black herring Alligator fish Black sea bass
Snowflake hookear sculpin Northern (common) searobin
Temperate Deepwater Moustache (mailed) sculpin Smooth dogfish
Marlin-spike Daubed shanny Windowpane
Black dogfish Atlantic halibut Little skate
Atlantic argentine Lumpfish Bigeye scad
Roughnose grenadier Shorthorn sculpin Rough scad
Longfin hake Snake blenny Round scad
Barracudinas Cunner Plainhead filefish
Radiated shanny Smallmouth flounder
Southern DeepwaterBlackbelly rosefish South-temperate Bank/Slope Southern TransitionalOffshore hake Red hake Vermilion snapper
Shortnose greeneye Goosefish (angler) Snake fish
Shortfin squid Spiny dogfish Tomtate
Armoured searobin Silver hake Inshore lizard fish
Buckler dory White hake Bank cusk-eel
Beardfish Pollock Offshore lizard fish
Slatjaw cutthroat eel Cusk Tattler
Yellowtail flounder Bank sea bass
Northern Bank/Slope Winter flounder Atlantic croaker
Northern wolffish Ocean pout Spot
Spotted wolffish Sea raven Longspine porgy
Atlantic sea poacher Longhorn sculpin
Arctic cod Winter skate
Greenland halibut Northern sand lance
Polar scuplin Atlantic hagfish
Greenland cod Fourbeard rockling
Fourline snake blenny Haddock
Threebeard rockling Atlantic soft pout
Atlantic spiny lumpsucker Wrymouth
Atlantic hookear sculpin Threespine stickleback
Table 3.Species groups determined by visual classification of distribution plots for the entire data set.
Can. J. Fish. Aquat. Sci. Vol. 55, 19981712
© 1998 NRC Canada
F98-065.CHPWed Aug 19 14:52:39 1998
Color profile: DisabledComposite Default screen
Species Loading
PC1
Gulf stream flounder 0.808
Fourspot flounder 0.762
Fawn cusk-eel 0.744
Spotted hake 0.663
Butterfish 0.528
Red hake 0.388
Goosefish (angler) 0.330
PC2
Blue hake 0.843
Rock grenadier 0.770
Longnose eel 0.763
Large-scale tapirfish 0.663
Roughhead grenadier 0.506
Marlin-spike (common grenadier) 0.301
PC3
Scup 0.796
Summer flounder 0.752
Northern (common) searobin 0.751
Black sea bass 0.725
Smooth dogfish 0.578
PC4
Silver hake 0.689
Red hake 0.574
Cusk 0.550
Pollock 0.539
Spiny dogfish 0.512
White hake 0.467
Ocean pout 0.405
Goosefish (angler) 0.380
Haddock 0.361
Shortfin squid 0.350
PC5
Longhorn sculpin 0.771
Sea raven 0.673
Yellowtail flounder 0.634
Winter flounder 0.598
Ocean pout 0.468
PC6
Marlin-spike (common grenadier) 0.727
Redfishes 0.635
Witch flounder 0.529
Black dogfish 0.525
Atlantic argentine 0.492
White hake 0.443
Longfin hake 0.352
PC7
Windowpane 0.755
Winter skate 0.748
Little skate 0.722
Northern sand lance 0.387
Species Loading
PC8
Spotted wolffish 0.729
Atlantic wolffish 0.726
Northern wolffish 0.676
Roughhead grenadier 0.428
Atlantic cod 0.366
Greenland halibut 0.345
Redfishes 0.303
PC9
Blackbelly rosefish 0.792
Offshore hake 0.775
Shortnose greeneye 0.680
PC10
Thorny skate 0.687
American plaice 0.637
Witch flounder 0.415
Atlantic cod 0.372
Smooth skate 0.356
PC11
Arctic cod 0.751
Atlantic sea poacher 0.742
Greenland halibut 0.451
Polar sculpin 0.304
PC12
Fourbeard rockling 0.681
Atlantic hagfish 0.619
Smooth skate 0.316
PC13
Moustache (mailed) sculpin 0.693
Alligatorfish 0.647
Snowflake hookear sculpin 0.604
PC14
Roughnose grenadier 0.831
Longfin hake 0.604
Black dogfish 0.513
PC15
Atlantic halibut 0.790
Haddock 0.587
PC16
Polar sculpin 0.530
Roughhead grenadier 0.365
Greenland halibut 0.357
PC17
Lumpfish 0.778
Shorthorn sculpin 0.635
Sea raven 0.339
PC18
Cunner 0.630
Winter flounder 0.390
Snake blenny 0.361
Note: Bold type indicates species with loadings >0.5; standard type indicates species with loadings >0.3 and <0.5.
Table 4.Species loadings on VARIMAX-rotated PCs for the 1975–1994 data subset.
Mahon et al. 1713
© 1998 NRC Canada
F98-065.CHPWed Aug 19 14:52:41 1998
Color profile: DisabledComposite Default screen

Fig. 3. Maps of groundfish assemblages, based on the top 5% of scores for PCs 1–18 derived from the 1975–1994 data. The species
compositions shown are taken from Table 4.
Note: Bold type indicates species with loadings >0.5; standard type indicates species with loadings >0.3 and <0.5.
Can. J. Fish. Aquat. Sci. Vol. 55, 19981714
© 1998 NRC Canada
F98-065.CHPWed Aug 19 14:53:28 1998
Color profile: DisabledComposite Default screen
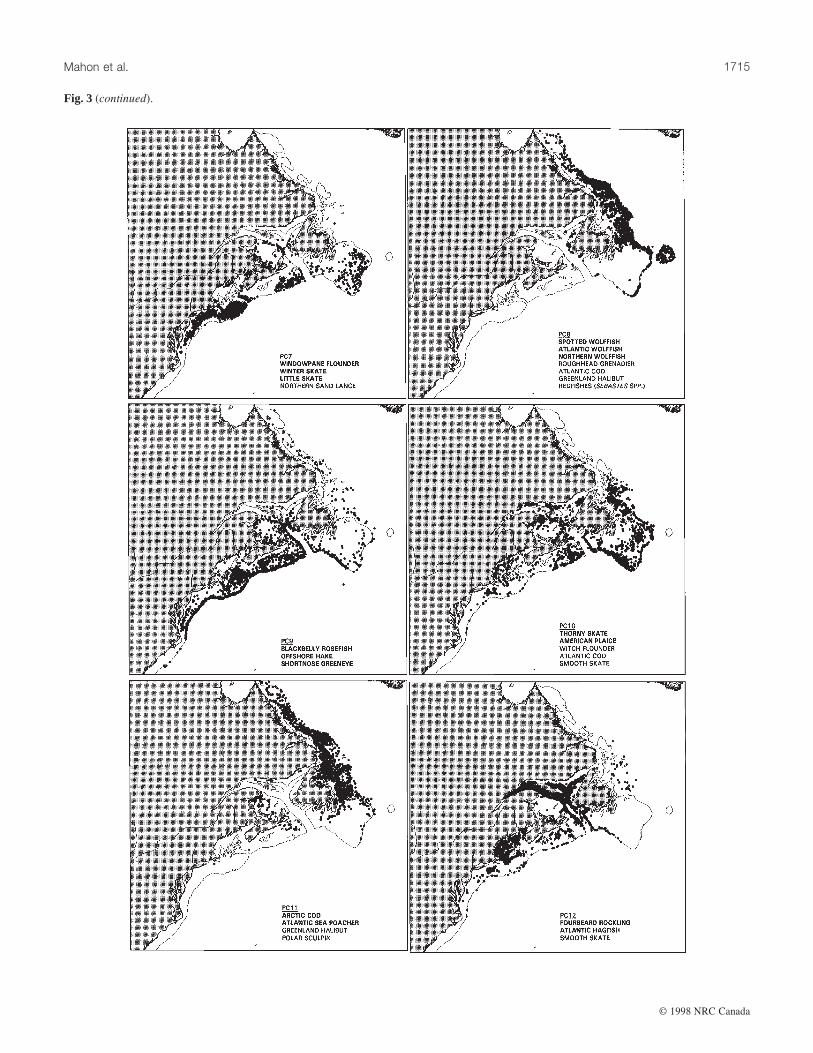
Fig. 3 (continued).
Mahon et al. 1715
© 1998 NRC Canada
F98-065.CHPWed Aug 19 14:53:50 1998
Color profile: DisabledComposite Default screen

Fig. 3 (concluded).
Can. J. Fish. Aquat. Sci. Vol. 55, 19981716
© 1998 NRC Canada
F98-065.CHPWed Aug 19 14:54:13 1998
Color profile: DisabledComposite Default screen

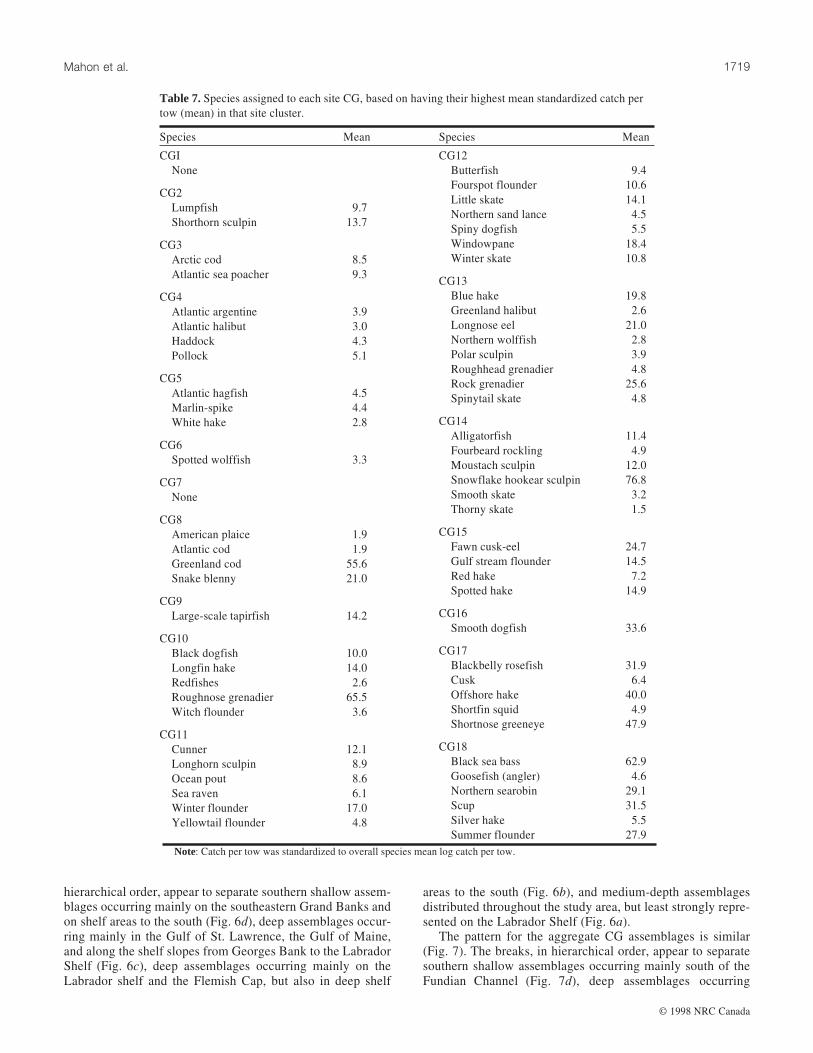
Cluster analysisSpecies compositions of the 18 site CGs are shown in Ta-
ble 7. The numeric value in the table is the relative abundanceof a species in a site CG (the average log10(x + 1)-transformednumber caught per tow of the species in that site CG dividedby its average log10(x + 1)-transformed number caught per towin the entire data set, including the trawl sets that did not con-tain the species). Each species is assigned to the CG in whichit has its highest relative abundance.
Species compositions of the 18 CGs ranged from zero toeight species (Table 7). Two CGs, 1 and 7, did not contain anyspecies with their highest relative abundance. Unlike PCA, themethods used to identify species compositions of the CGs con-strain each species to be associated with only one CG. How-ever, maximum relative abundances vary considerably. Threespecies, thorny skate, American plaice, and Atlantic cod, hadmaximum relative abundances <2. These species are looselyassociated with several CGs and occur at lower relative abun-dances in most of the remaining groups. They may be consid-ered assemblage generalists (eurytopic). Three other species,snowflake hookear sculpin, roughnose grenadier, and blacksea bass, had maximum relative abundances >60, indicatingthat they were strongly associated with their primary CG.These species tended to associate with only a few assemblages,were absent from many of the assemblages, and may be con-sidered assemblage specialists (stenotopic).
The majority of the CGs show a considerable degree ofspatial aggregation (Fig. 4). However, CG1, which contains 16475 sites (42.6% of the sites) and did not contain any specieswith its highest relative abundance, is distributed over the en-tire study area. CG7 also has no associated species, but is dis-tributed only from the Gulf of Maine south. These two CGscan be interpreted as groups of sites without any distinguishingassemblages. Accordingly, the remaining 16 CGs can be inter-preted as assemblages. The sites in CG1 probably have severalwidespread species occurring in average or below-averageabundance. CG1 contains 42.6% of the sites, which is consis-tent with the number of sites that did not fall into any PCassemblage (45.5%) under the top 5% of site scores criterion.
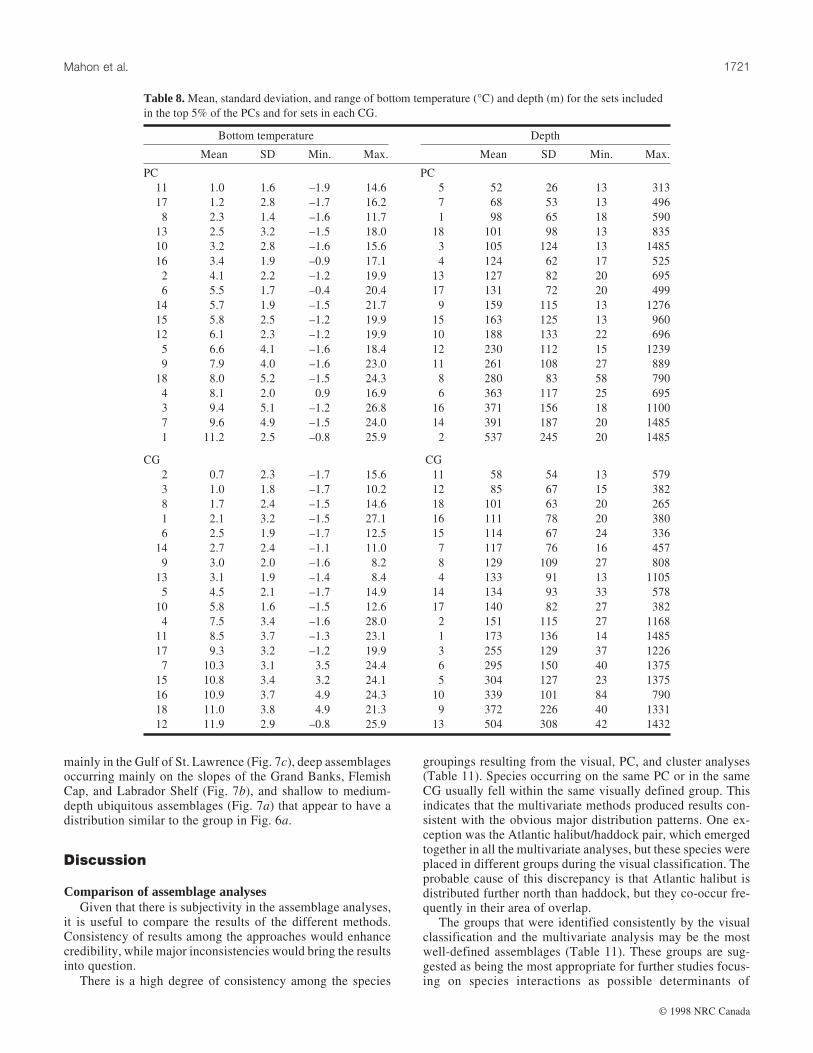
Depth and temperature characterization of PCs and CGsThe site scores on the PCs were used to characterize the
depths and temperatures at which the assemblages occur. The
average depths and temperatures were calculated for the sitesin the top 5% of scores for each PC (Table 8). Mean bottomtemperatures range from 1.0 to 11.2°C; mean depths rangefrom 52 to 537 m. Substantial variation is evident, as standarddeviations are 70 and 60% of the mean bottom temperaturesand depths, respectively. However, assemblages close to eachother in mean bottom temperature tend to be further apart inmean depth, and vice versa. For example, PCs 11 and 17 areconsecutive on the temperature list (Table 8), with mean tem-peratures of 1.0 and 1.2°C. However, in the depth list, thereare five PCs between them, and they have mean depths of 131and 261 m.
Average depth and bottom temperatures were also calcu-lated for the 18 CGs (Table 8). The patterns are similar to thoseobserved for the PCA. Mean bottom temperatures range be-tween 0.7 and 11.9°C; mean depths range between 58 and504 m. Standard deviations are 79 and 64% of the mean bot-tom temperatures and depths, respectively.
The temperature and depth preferences of the assemblagesshown in Table 8 may have some biases within them andshould not be overinterpreted. The data used for the multivari-ate analyses included data from different months and seasons,which could distort the apparent temperature and depth pref-erences of the assemblages. This is most likely to have oc-curred for shallow assemblages. At depths over 200 m,seasonal variability is minimal. Developing a more refinedanalysis of assemblage temperature and depth preferencesawaits further work.
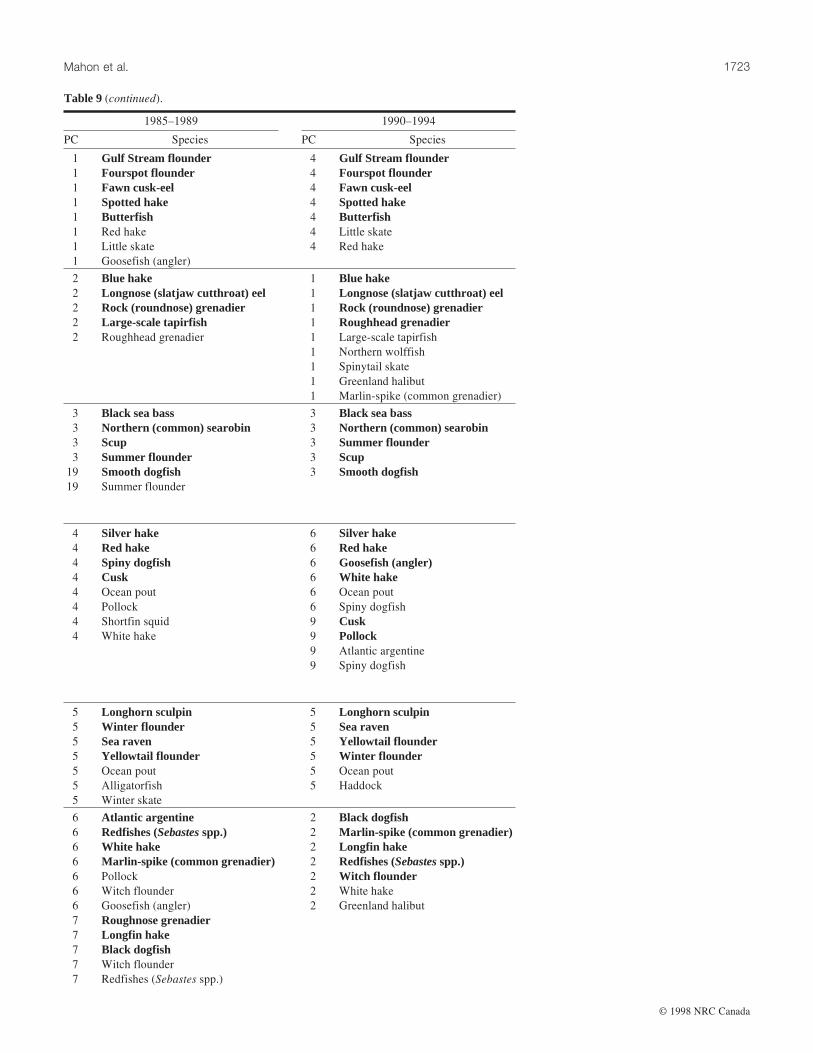
Temporal variationThe assemblages identified by PCA of the entire
1975–1994 time period are compared with those identified byPCA of the 5-year time periods (Table 9). Species loadings onthe PCs for the individual 5-year time periods are in Brown etal. (1996, appendix 4). There was considerable persistence ofthe 1975–1994 assemblages through time. Six assemblages(PCs 1, 7, 9, 10, 11, 12) contained a consistent core of high-level species (i.e., with loadings >0.5) throughout, althoughother species sometimes joined these assemblages during cer-tain 5-year periods. Five assemblages (PCs 2, 5, 8, 17, 18)always retained their high-level species, but some of the load-ings dropped below 0.5 during one or more 5-year periods.Five assemblages (PCs 3, 4, 6, 13, 14) split into two assem-blages during at least one 5-year period. Three assemblages(PCs 6, 14, 15) disappeared from one 5-year period, but gen-erally retained their high-level species during the other peri-ods.
The assemblages for the entire time period were judged tobe sufficiently consistent with those for 5-year time periodsthat the former could be used to represent the overall assem-blages (Table 9). This result suggests that assemblages arefairly stable entities, but that their development and distribu-tion may vary through time as species distributions and abun-dances fluctuate.
Examining temporal shifts in location for assemblagesPC10 and PC11 (Fig. 5; Table 10) revealed substantial distri-bution shifts over the four 5-year time periods. However, theextent to which these were shifts of entire assemblages, orwere only shifts in one of the major species, has not beendetermined.
Sites scoring in the top 5% of the scores for PC10 (thorny
No. of
assemblages
No. of
sites
% of
sites
0 17 612 45.5
1 12 292 31.8
2 5 624 14.5
3 2 023 5.2
4 762 1.9
5 266 0.7
6 98 0.3
7 43 0.1
8 10 <0.1
Table 5.Number of sites without an
assemblage, or with more than one assemblage,
based on the criterion of selecting sites with
scores in the top 5% on each PC.
Mahon et al. 1717
© 1998 NRC Canada
F98-065.CHPWed Aug 19 14:54:15 1998
Color profile: DisabledComposite Default screen

skate, American plaice, witch flounder, Atlantic cod, smoothskate) and PC11 (Arctic cod, Atlantic sea poacher, Greenlandhalibut, polar sculpin) are mapped in 5-year intervals (Fig. 5).Because of the stability of assemblages, this was deemed aneffective way to examine temporal variability in assemblagedistribution. However, the cessation of sampling on the Flem-ish Cap in the mid-1980s may have introduced an apparentwestward movement in distribution for the 1990–1994 period.
Prevalence of the PC10 assemblage, a north-central, cool-water group, increased between 1975 and 1989 and declinedafter 1990 (Table 10). During 1975–1989, mean positionmoved to the north and east, followed by a return to approxi-mately the original mean position for 1990–1994. Both latitu-dinal and longitudinal ranges decreased throughout 1975–1994. This group occupied waters northeast of Newfoundlandprior to 1990, but was absent from this area after 1990.
Prevalence of the PC11 assemblage, the most northern,coldest-water assemblage, initially declined, but increasedmarkedly after 1985. Mean position moved to the south andeast. Variation in range was erratic, driven in part by a fewatypical sites, some of which were north of the study areaboundary, in areas that have been poorly sampled. Much of therecent increase in this group occurred in deep waters betweenHamilton Bank and northern Grand Banks.
The analysis of temporal change in species assemblagecomposition and location is not comprehensive, servingmainly to illustrate the potential of the data set for such analy-sis. A variety of other methods and approaches should be ex-plored to investigate this aspect of groundfish assemblagebiogeography on the east coast of North America (Brownet al. 1996) and also to examine changes for individual spe-cies.
Biogeographical patternsThe dendrogram derived from clustering the 18 PCs ob-
tained from the 1975–1994 data shows the hierarchical rela-tionships among the species assemblages derived from thePCA, together with the aggregate distributions of sites fromthe PCs forming four major clusters (Fig. 6). These aggregategroups are intended to show the major biogeographic breaksin assemblage distributions. Similarly, the dendrogram show-ing hierarchical relationships among the site CGs, togetherwith maps for four aggregate groups, is shown in Fig. 7, whichis directly comparable with Fig. 6.
The aggregate distributions of PC and CG assemblages donot indicate clear latitudinal breaks in assemblage distributions(Figs. 6 and 7). They appear to reflect a combination of depthand latitudinal effects. For the PC assemblages, the breaks, in
PC10 PC11
Catch per tow Catch per tow
Loading Species Mean Relative Loading Species Mean Relative
0.687 Thorny skate 40.06 6.83 0.751 Arctic cod 298.15 21.24
0.637 American plaice 183.68 2.78 0.742 Atlantic sea poacher 2.51 18.71
0.415 Witch flounder 31.70 6.14 0.451 Greenland halibut 72.53 6.07
0.372 Atlantic cod 129.07 2.41 0.304 Polar sculpin 0.54 7.45
0.356 Smooth skate 2.54 7.27 0.258 Greenland cod 0.55 16.03
0.189 Goosefish (angler) 0.97 5.49 0.162 Northern wolffish 2.07 3.69
0.182 Yellowtail flounder 27.00 2.46 0.123 Alligatorfish 0.40 2.88
0.178 Snake blenny 0.48 12.99 0.079 Shorthorn sculpin 0.17 2.81
0.142 Greenland halibut 25.89 2.19 0.066 Spotted wolffish 0.64 2.60
0.128 Spinytail skate 0.17 4.00 0.063 American plaice 96.74 1.40
0.098 Moustache (mailed) sculpin 1.19 1.72 0.062 Snake blenny 0.10 2.45
0.089 Red hake 8.26 4.37 0.034 Roughhead grenadier 1.26 0.81
0.067 Spotted wolffish 0.29 1.77 0.031 Atlantic halibut 0.05 0.44
0.053 Northern sand lance 12.71 1.11 0.026 Ocean pout 0.06 0.33
0.051 Atlantic wolffish 0.88 0.92 0.019 Red hake 0.01 0.00
0.048 Fourbeard rockling 0.39 2.88 0.019 Black sea bass 0.05 0.17
0.046 Atlantic sea poacher 0.18 1.21 0.012 Northern searobin 0.49 0.71
0.042 Roughnose grenadier 0.28 0.99 0.012 Gulf Stream flounder 0.00 0.00
0.038 Lumpfish 3.90 2.10 0.009 Little skate 0.05 0.04
0.032 Ocean pout 0.70 3.76 0.008 Spinytail skate 0.06 1.23
0.031 Roughhead grenadier 1.69 1.17 0.006 Goosefish (angler) 0.00 0.00
0.029 Polar sculpin 0.12 1.96 0.006 Fourspot flounder 0.04 0.04
0.022 Shortnose greeneye 0.30 6.48 0.005 Winter flounder 2.07 0.76
0.018 Atlantic halibut 0.24 2.30 0.002 Roughnose grenadier 0.00 0.00
0.015 Silver hake 24.67 1.93 0.001 Windowpane 0.07 0.11
0.015 Gulf Stream flounder 2.00 4.40
0.010 Snowflake hookear sculpin 0.15 2.15
0.009 Greenland cod 0.03 0.91
0.007 Sea raven 0.50 1.22
0.003 White hake 5.12 1.71
Table 6.Species loadings, mean catch per tow, and relative catch per tow of the top 5% of sites for PCs 10 and 11 (1975–1994 data).
Can. J. Fish. Aquat. Sci. Vol. 55, 19981718
© 1998 NRC Canada
F98-065.CHPWed Aug 19 14:54:18 1998
Color profile: DisabledComposite Default screen
hierarchical order, appear to separate southern shallow assem-blages occurring mainly on the southeastern Grand Banks andon shelf areas to the south (Fig. 6d), deep assemblages occur-ring mainly in the Gulf of St. Lawrence, the Gulf of Maine,and along the shelf slopes from Georges Bank to the LabradorShelf (Fig. 6c), deep assemblages occurring mainly on theLabrador shelf and the Flemish Cap, but also in deep shelf
areas to the south (Fig. 6b), and medium-depth assemblagesdistributed throughout the study area, but least strongly repre-sented on the Labrador Shelf (Fig. 6a).
The pattern for the aggregate CG assemblages is similar(Fig. 7). The breaks, in hierarchical order, appear to separatesouthern shallow assemblages occurring mainly south of theFundian Channel (Fig. 7d), deep assemblages occurring
Species Mean
CGI
None
CG2
Lumpfish 9.7
Shorthorn sculpin 13.7
CG3
Arctic cod 8.5
Atlantic sea poacher 9.3
CG4
Atlantic argentine 3.9
Atlantic halibut 3.0
Haddock 4.3
Pollock 5.1
CG5
Atlantic hagfish 4.5
Marlin-spike 4.4
White hake 2.8
CG6
Spotted wolffish 3.3
CG7
None
CG8
American plaice 1.9
Atlantic cod 1.9
Greenland cod 55.6
Snake blenny 21.0
CG9
Large-scale tapirfish 14.2
CG10
Black dogfish 10.0
Longfin hake 14.0
Redfishes 2.6
Roughnose grenadier 65.5
Witch flounder 3.6
CG11
Cunner 12.1
Longhorn sculpin 8.9
Ocean pout 8.6
Sea raven 6.1
Winter flounder 17.0
Yellowtail flounder 4.8
Species Mean
CG12
Butterfish 9.4
Fourspot flounder 10.6
Little skate 14.1
Northern sand lance 4.5
Spiny dogfish 5.5
Windowpane 18.4
Winter skate 10.8
CG13
Blue hake 19.8
Greenland halibut 2.6
Longnose eel 21.0
Northern wolffish 2.8
Polar sculpin 3.9
Roughhead grenadier 4.8
Rock grenadier 25.6
Spinytail skate 4.8
CG14
Alligatorfish 11.4
Fourbeard rockling 4.9
Moustach sculpin 12.0
Snowflake hookear sculpin 76.8
Smooth skate 3.2
Thorny skate 1.5
CG15
Fawn cusk-eel 24.7
Gulf stream flounder 14.5
Red hake 7.2
Spotted hake 14.9
CG16
Smooth dogfish 33.6
CG17
Blackbelly rosefish 31.9
Cusk 6.4
Offshore hake 40.0
Shortfin squid 4.9
Shortnose greeneye 47.9
CG18
Black sea bass 62.9
Goosefish (angler) 4.6
Northern searobin 29.1
Scup 31.5
Silver hake 5.5
Summer flounder 27.9
Note: Catch per tow was standardized to overall species mean log catch per tow.
Table 7.Species assigned to each site CG, based on having their highest mean standardized catch per
tow (mean) in that site cluster.
Mahon et al. 1719
© 1998 NRC Canada
F98-065.CHPWed Aug 19 14:54:19 1998
Color profile: DisabledComposite Default screen

Fig. 4. Maps of selected groundfish assemblages (CGs) derived from cluster analysis of the 1975–1994 data. The species compositions shown
are taken from Table 7.
Can. J. Fish. Aquat. Sci. Vol. 55, 19981720
© 1998 NRC Canada
F98-065.CHPWed Aug 19 14:54:41 1998
Color profile: DisabledComposite Default screen
mainly in the Gulf of St. Lawrence (Fig. 7c), deep assemblagesoccurring mainly on the slopes of the Grand Banks, FlemishCap, and Labrador Shelf (Fig. 7b), and shallow to medium-depth ubiquitous assemblages (Fig. 7a) that appear to have adistribution similar to the group in Fig. 6a.
Discussion
Comparison of assemblage analysesGiven that there is subjectivity in the assemblage analyses,
it is useful to compare the results of the different methods.Consistency of results among the approaches would enhancecredibility, while major inconsistencies would bring the resultsinto question.
There is a high degree of consistency among the species
groupings resulting from the visual, PC, and cluster analyses(Table 11). Species occurring on the same PC or in the sameCG usually fell within the same visually defined group. Thisindicates that the multivariate methods produced results con-sistent with the obvious major distribution patterns. One ex-ception was the Atlantic halibut/haddock pair, which emergedtogether in all the multivariate analyses, but these species wereplaced in different groups during the visual classification. Theprobable cause of this discrepancy is that Atlantic halibut isdistributed further north than haddock, but they co-occur fre-quently in their area of overlap.
The groups that were identified consistently by the visualclassification and the multivariate analysis may be the mostwell-defined assemblages (Table 11). These groups are sug-gested as being the most appropriate for further studies focus-ing on species interactions as possible determinants of
Bottom temperature Depth
Mean SD Min. Max. Mean SD Min. Max.
PC PC
11 1.0 1.6 –1.9 14.6 5 52 26 13 313
17 1.2 2.8 –1.7 16.2 7 68 53 13 496
8 2.3 1.4 –1.6 11.7 1 98 65 18 590
13 2.5 3.2 –1.5 18.0 18 101 98 13 835
10 3.2 2.8 –1.6 15.6 3 105 124 13 1485
16 3.4 1.9 –0.9 17.1 4 124 62 17 525
2 4.1 2.2 –1.2 19.9 13 127 82 20 695
6 5.5 1.7 –0.4 20.4 17 131 72 20 499
14 5.7 1.9 –1.5 21.7 9 159 115 13 1276
15 5.8 2.5 –1.2 19.9 15 163 125 13 960
12 6.1 2.3 –1.2 19.9 10 188 133 22 696
5 6.6 4.1 –1.6 18.4 12 230 112 15 1239
9 7.9 4.0 –1.6 23.0 11 261 108 27 889
18 8.0 5.2 –1.5 24.3 8 280 83 58 790
4 8.1 2.0 0.9 16.9 6 363 117 25 695
3 9.4 5.1 –1.2 26.8 16 371 156 18 1100
7 9.6 4.9 –1.5 24.0 14 391 187 20 1485
1 11.2 2.5 –0.8 25.9 2 537 245 20 1485
CG CG
2 0.7 2.3 –1.7 15.6 11 58 54 13 579
3 1.0 1.8 –1.7 10.2 12 85 67 15 382
8 1.7 2.4 –1.5 14.6 18 101 63 20 265
1 2.1 3.2 –1.5 27.1 16 111 78 20 380
6 2.5 1.9 –1.7 12.5 15 114 67 24 336
14 2.7 2.4 –1.1 11.0 7 117 76 16 457
9 3.0 2.0 –1.6 8.2 8 129 109 27 808
13 3.1 1.9 –1.4 8.4 4 133 91 13 1105
5 4.5 2.1 –1.7 14.9 14 134 93 33 578
10 5.8 1.6 –1.5 12.6 17 140 82 27 382
4 7.5 3.4 –1.6 28.0 2 151 115 27 1168
11 8.5 3.7 –1.3 23.1 1 173 136 14 1485
17 9.3 3.2 –1.2 19.9 3 255 129 37 1226
7 10.3 3.1 3.5 24.4 6 295 150 40 1375
15 10.8 3.4 3.2 24.1 5 304 127 23 1375
16 10.9 3.7 4.9 24.3 10 339 101 84 790
18 11.0 3.8 4.9 21.3 9 372 226 40 1331
12 11.9 2.9 –0.8 25.9 13 504 308 42 1432
Table 8.Mean, standard deviation, and range of bottom temperature (°C) and depth (m) for the sets included
in the top 5% of the PCs and for sets in each CG.
Mahon et al. 1721
© 1998 NRC Canada
F98-065.CHPWed Aug 19 14:54:44 1998
Color profile: DisabledComposite Default screen

All years 1975–1979 1980–1984
PC Species PC Species PC Species
1 Gulf Stream flounder 6 Gulf Stream flounder 2 Fawn cusk-eel1 Fourspot flounder 6 Fawn cusk-eel 2 Spotted hake1 Fawn cusk-eel 6 Spotted hake 2 Gulf Stream flounder1 Spotted hake 6 Fourspot flounder 2 Fourspot flounder1 Butterfish 6 Butterfish 2 Butterfish1 Red hake 2 Shortfin squid
1 Goosefish (angler)
2 Blue hake 2 Blue hake 1 Blue hake2 Rock (roundnose) grenadier 2 Rock (roundnose) grenadier 1 Longnose (slatjaw cutthroat) eel2 Longnose (slatjaw cutthroat) eel 2 Longnose (slatjaw cutthroat) eel 1 Large-scale tapirfish2 Large-scale tapirfish 2 Large-scale tapirfish 1 Rock (roundnose) grenadier2 Roughhead grenadier 2 Roughnose grenadier 1 Marlin-spike (common grenadier)
2 Marlin-spike (common grenadier) 2 Black dogfish 1 Roughhead grenadier
2 Roughhead grenadier 1 Northern wolffish
3 Scup 7 Black sea bass 3 Summer flounder3 Summer flounder 7 Northern (common) searobin 3 Scup3 Northern (common) searobin 7 Scup 3 Northern (common) searobin3 Black sea bass 7 Spotted hake 3 Black sea bass3 Smooth dogfish 7 Fourspot flounder 3 Smooth dogfish
13 Smooth dogfish 3 Windowpane
13 Summer flounder13 Scup
4 Silver hake 5 Red hake 4 Red hake4 Red hake 5 Silver hake 4 Silver hake4 Cusk 5 Goosefish (angler) 4 Ocean pout4 Pollock 5 Ocean pout 4 Goosefish (angler)4 Spiny dogfish 5 White hake 4 Fourspot flounder
4 White hake 5 Fourspot flounder 4 Gulf Stream flounder
4 Ocean pout 14 Pollock 4 Longhorn sculpin
4 Goosefish (angler) 14 Cusk 4 Little skate
4 Haddock 14 Haddock 11 Cusk4 Shortfin squid 11 Pollock
11 Spiny dogfish
11 Haddock
5 Longhorn sculpin 4 Sea raven 6 Winter flounder5 Sea raven 4 Longhorn sculpin 6 Sea raven5 Yellowtail flounder 4 Yellowtail flounder 6 Longhorn sculpin5 Winter flounder 4 Winter flounder 6 Cunner5 Ocean pout 4 Ocean pout 6 Yellowtail flounder
4 Haddock 6 Ocean pout
6 Marlin-spike (common grenadier) 11 Atlantic argentine6 Redfishes (Sebastesspp.) 11 White hake6 Witch flounder 11 Redfishes (Sebastesspp.)6 Black dogfish 11 Marlin-spike (common grenadier)
6 Atlantic argentine 11 Longfin hake
6 White hake 11 Witch flounder
6 Longfin hake 11 Atlantic halibut
Table 9.Comparison of species groupings from PCA for all years and by 5-year periods.
Can. J. Fish. Aquat. Sci. Vol. 55, 19981722
© 1998 NRC Canada
F98-065.CHPWed Aug 19 14:54:46 1998
Color profile: DisabledComposite Default screen
1985–1989 1990–1994
PC Species PC Species
1 Gulf Stream flounder 4 Gulf Stream flounder1 Fourspot flounder 4 Fourspot flounder1 Fawn cusk-eel 4 Fawn cusk-eel1 Spotted hake 4 Spotted hake1 Butterfish 4 Butterfish1 Red hake 4 Little skate
1 Little skate 4 Red hake
1 Goosefish (angler)
2 Blue hake 1 Blue hake2 Longnose (slatjaw cutthroat) eel 1 Longnose (slatjaw cutthroat) eel2 Rock (roundnose) grenadier 1 Rock (roundnose) grenadier2 Large-scale tapirfish 1 Roughhead grenadier2 Roughhead grenadier 1 Large-scale tapirfish
1 Northern wolffish
1 Spinytail skate
1 Greenland halibut
1 Marlin-spike (common grenadier)
3 Black sea bass 3 Black sea bass3 Northern (common) searobin 3 Northern (common) searobin3 Scup 3 Summer flounder3 Summer flounder 3 Scup
19 Smooth dogfish 3 Smooth dogfish19 Summer flounder
4 Silver hake 6 Silver hake4 Red hake 6 Red hake4 Spiny dogfish 6 Goosefish (angler)4 Cusk 6 White hake4 Ocean pout 6 Ocean pout
4 Pollock 6 Spiny dogfish
4 Shortfin squid 9 Cusk4 White hake 9 Pollock
9 Atlantic argentine
9 Spiny dogfish
5 Longhorn sculpin 5 Longhorn sculpin5 Winter flounder 5 Sea raven5 Sea raven 5 Yellowtail flounder5 Yellowtail flounder 5 Winter flounder5 Ocean pout 5 Ocean pout
5 Alligatorfish 5 Haddock
5 Winter skate
6 Atlantic argentine 2 Black dogfish6 Redfishes (Sebastesspp.) 2 Marlin-spike (common grenadier)6 White hake 2 Longfin hake6 Marlin-spike (common grenadier) 2 Redfishes (Sebastesspp.)6 Pollock 2 Witch flounder6 Witch flounder 2 White hake
6 Goosefish (angler) 2 Greenland halibut
7 Roughnose grenadier7 Longfin hake7 Black dogfish7 Witch flounder
7 Redfishes (Sebastes spp.)
Table 9 (continued).
Mahon et al. 1723
© 1998 NRC Canada
F98-065.CHPWed Aug 19 14:54:48 1998
Color profile: DisabledComposite Default screen

All years 1975–1979 1980–1984
PC Species PC Species PC Species
7 Windowpane 1 Little skate 5 Winter skate7 Winter skate 1 Windowpane 5 Windowpane7 Little skate 1 Winter skate 5 Little skate7 Northern sand lance 1 Spiny dogfish 5 Spiny dogfish
1 Winter flounder
1 Longhorn sculpin
1 Northern sand lance
1 Red hake
1 Fourspot flounder
8 Spotted wolffish 8 Atlantic wolffish 8 Atlantic wolffish8 Atlantic wolffish 8 Spotted wolffish 8 Spotted wolffish8 Northern wolffish 8 Atlantic cod 8 Northern wolffish8 Roughhead grenadier 8 Northern wolffish 8 Atlantic cod8 Atlantic cod 8 Greenland halibut
8 Greenland halibut
8 Redfishes (Sebastes spp.)
9 Blackbelly rosefish 12 Blackbelly rosefish 9 Blackbelly rosefish9 Offshore hake 12 Offshore hake 9 Offshore hake9 Shortnose greeneye 12 Shortnose greeneye 9 Shortnose greeneye
10 Thorny skate 15 American plaice 12 Thorny skate10 American plaice 15 Thorny skate 12 Yellowtail flounder10 Witch flounder 15 Witch flounder 12 American plaice10 Atlantic cod 15 Atlantic cod 12 Northern sand lance
10 Smooth skate
11 Arctic cod 9 Arctic cod 14 Arctic cod11 Atlantic sea poacher 9 Atlantic sea poacher 14 Atlantic sea poacher11 Greenland halibut 9 Greenland cod 14 Greenland halibut
11 Polar sculpin 9 Shorthorn sculpin 14 Greenland cod
9 Greenland halibut 14 Northern wolffish
9 Northern wolffish
12 Fourbeard rockling 10 Atlantic hagfish 15 Fourbeard rockling12 Atlantic hagfish 10 Fourbeard rockling 15 Atlantic hagfish12 Smooth skate 10 Black dogfish 15 Marlin-spike (common grenadier)
10 Marlin-spike (common grenadier) 15 White hake
10 Witch flounder
10 Redfishes (Sebastes spp.)
13 Moustache (mailed) sculpin 16 Moustache (mailed) sculpin 16 Moustache (mailed) sculpin13 Alligatorfish 16 Alligatorfish 16 Alligatorfish13 Snowflake hookear sculpin 17 Smooth skate 19 Snowflake hookear sculpin
17 Snowflake hookear sculpin17 Polar sculpin
14 Roughnose grenadier 10 Roughnose grenadier14 Longfin hake 10 Black dogfish14 Black dogfish 10 Longfin hake
10 Witch flounder
15 Atlantic halibut 13 Atlantic halibut15 Haddock 13 Atlantic argentine
13 White hake
13 Redfishes (Sebastes spp.)
13 Haddock
13 Marlin-spike (common grenadier)
13 Goosefish (angler)
Table 9 (continued).
Can. J. Fish. Aquat. Sci. Vol. 55, 19981724
© 1998 NRC Canada
F98-065.CHPWed Aug 19 14:54:51 1998
Color profile: DisabledComposite Default screen

1985–1989 1990–1994
PC Species PC Species
8 Winter skate 7 Windowpane8 Little skate 7 Winter skate8 Windowpane 7 Little skate8 Northern sand lance 7 Fourspot flounder
19 Northern sand lance
10 Spotted wolffish 11 Atlantic wolffish10 Atlantic wolffish 11 Spotted wolffish10 Northern wolffish 11 Northern wolffish
10 Atlantic cod
10 Roughhead grenadier
10 Greenland halibut
11 Offshore hake 10 Shortnose greeneye11 Blackbelly rosefish 10 Offshore hake11 Shortnose greeneye 10 Blackbelly rosefish
12 Thorny skate 12 Thorny skate12 American plaice 12 American plaice12 Atlantic cod 12 Smooth skate
12 Witch flounder 12 Atlantic cod
12 Shortfin squid 12 Witch flounder
15 Arctic cod 13 Atlantic sea poacher15 Atlantic sea poacher 13 Arctic cod15 Greenland cod 13 Greenland halibut
15 Greenland halibut
9 Fourbeard rockling 14 Atlantic hagfish9 Atlantic hagfish 14 Fourbeard rockling9 Smooth skate 14 Smooth skate
9 Marlin-spike (common grenadier) 14 Snowflake hookear sculpin
9 White hake
9 Redfishes (Sebastes spp.)
13 Moustache (mailed) sculpin 8 Moustache (mailed) sculpin13 Snowflake hookear sculpin 8 Alligatorfish13 Alligatorfish 8 Greenland cod
8 Snowflake hookear sculpin8 Snake blenny
7 Roughnose grenadier 18 Roughnose grenadier7 Longfin hake 2 Black dogfish7 Black dogfish 2 Marlin-spike (common grenadier)7 Witch flounder 2 Longfin hake7 Redfishes (Sebastes spp.) 2 Redfishes (Sebastesspp.)
2 Witch flounder2 White hake
2 Greenland halibut
16 Atlantic halibut 15 Atlantic halibut16 Haddock 15 Haddock
Table 9 (continued).
Mahon et al. 1725
© 1998 NRC Canada
F98-065.CHPWed Aug 19 14:54:53 1998
Color profile: DisabledComposite Default screen

assemblage structure. There are a few instances of consistentlyoccurring groups of four to five species, e.g., smooth skate/ thornyskate/Atlantic cod/American plaice in the North-temperateBank/Slope group and summer flounder/scup/northern searobin/smooth dogfish/black sea bass in the Southern Bank/Slopegroup. There are also many smaller groups, particularly pairs,of species that appear to co-occur consistently. For example,the Southern Deepwater group of blackbelly rosefish/offshorehake/shortnose greeneye was identified in all analyses and ap-pears to have a distinctive distribution.
The correspondence between PCA site groups (top 5% ofsites on each PC) and CGs is variable (Fig. 8). In some cases,e.g., PC17 with CG2 and PC11 with CG3, the correspondenceis nearly one-to-one. In other cases, such as PCs 1, 3, and 4,the sites are distributed over several CGs. For each PC, thechi-square statistic was used to test whether the distribution ofsites in the CGs was significantly different from random, based
on the total numbers of sites within each site CG. In each casethe difference from a random distribution was significant (P <0.01). Therefore, it is evident that PC site groups tend to cor-respond to particular site CGs, as would be expected if bothmethods were perceiving similar assemblage distributions, butthat the strength of this correspondence varies.
The geographic correspondence between PCs and CGs isreflected in the distribution plots for the individual PCs andCGs (Figs. 3 and 4). The distribution of sites for PC17 andCG2, which both represent the lumpfish/shorthorn sculpin spe-cies pair, is very similar. PC2 and CGs 9 and 13 also corre-spond well, but there are many shallow sites in the CGs thatare not seen in PC2. In contrast, PC4, which represents theSouth-temperate Bank/Slope group silver hake/red hake/cusk/pollock/spiny dogfish/white hake/ocean pout, goosefish (an-gler)/haddock/shortfin squid, is distributed over several CGs.
The PCA and site cluster analysis both provided information
All years 1975–1979 1980–1984
PC Species PC Species PC Species
16 Polar sculpin 3 Roughhead grenadier 7 Witch flounder16 Roughhead grenadier 3 Spinytail skate 7 Greenland halibut16 Greenland halibut 3 Greenland halibut 7 Smooth skate
3 Northern wolffish 7 Roughhead grenadier3 Redfishes (Sebastes spp.) 7 Polar sculpin3 Polar sculpin 7 Spinytail skate3 Marlin-spike (common grenadier) 7 Redfishes (Sebastes spp.)
3 Large-scale tapirfish
17 Lumpfish 18 Atlantic halibut 17 Lumpfish17 Shorthorn sculpin 18 Lumpfish (—) 17 Shorthorn sculpin17 Sea raven 18 Shorthorn sculpin (—) 17 Sea raven
18 Cunner 19 Cunner 6 Winter flounder18 Winter flounder 19 Snake blenny 6 Sea raven18 Snake blenny 6 Longhorn sculpin
6 Cunner6 Yellowtail flounder
Note: Groups are determined by species scores on the PCs. Species in bold type have loadings >0.5; species in standard type have loadings <0.5 and >0.3.
Assemblages from the 5-year time periods are grouped with the overall time period assemblages that they most closely resemble.
Table 9 (concluded).
Latitude Longitude
PC Time period # of points Mean SD Range Mean SD Range
PC10 1975–79 414 46.2 3.1 20.1 –57.4 6.6 34.0
1980–84 476 46.9 3.2 16.0 –56.4 6.5 27.5
1985–89 598 47.0 2.6 18.0 –55.1 6.2 27.5
1990–94 446 46.2 2.3 12.8 –57.1 5.9 24.6
P < 0.0001 P < 0.05
PC11 1975–79 287 54.8 4.3 24.9 –57.2 3.5 22.6
1980–84 233 52.5 3.1 14.3 –55.1 2.6 16.9
1985–89 631 53.8 5.5 24.8 –56.0 3.3 17.2
1990–94 783 51.1 3.0 16.6 –54.1 3.6 18.4
P < 0.0001 P < 0.0001
Note: P-values are for comparing means using one-way analysis of variance.
Table 10.Comparisons of the numbers of points and mean positions (latitude and longitude) for sites scoring in the top 5% for PCs 10 and 11
by 5-year time period.
Can. J. Fish. Aquat. Sci. Vol. 55, 19981726
© 1998 NRC Canada
F98-065.CHPWed Aug 19 14:54:55 1998
Color profile: DisabledComposite Default screen

on the strength of species affinities for their assemblages.There is moderate agreement between the two approaches, inthat the maximum species loadings on the PCs (Table 4) arecorrelated with log-transformed maximum relative abun-dances (Table 7) (r = 0.48, P < 0.01).
Summary descriptions of the assemblages, based on theirgeographical, depth, and temperature distributions, indicatethat depth and temperature play important roles in determiningassemblage distributions (Table 12). This is consistent withthe findings of several previous studies (Overholtz and Tyler1985; Mahon and Smith 1989a; Gabriel 1992; Gomes et al.1995).
The PCA revealed patterns of species association broadlyconsistent with previous studies of smaller regions (Table 13).Comparing the present study with previous, more localizedstudies is subjective owing to the different methodologies andspecies used. No study has yet defined assemblages for thenorthern Labrador Shelf. The assemblages found in the presentstudy were most consistent with those reported by Gabriel(1992) for the area from Cape Hatteras north to the ScotianShelf and by Mahon (1997) for the Scotian Shelf and Bay ofFundy. The approach to assemblage definition taken by Gomeset al. (1992) and Guadalupe Villagarcia (1995) emphasized theabsolute abundance of species in an assemblage, so their re-sults are difficult to compare with those of this study. How-ever, the combination of thorny skate, American plaice, andAtlantic cod also emerged as a dominant group in their analy-ses.
The finding of a large number of sites without assemblageshas not been reported by previous studies in the area (e.g.,Overholtz and Tyler 1985; Gabriel 1992; Gomes et al. 1995;Mahon 1997). However, the similarity of the results for thePCA and site cluster analysis in this study supports this inter-pretation for our data set. For the PCA, 45.5% (17 612) of thesampled sites do not score in the top 5% of any PC. For the
cluster analysis, 42.6% (16 474) of the sites are in the firstcluster, which is interpreted as not having any characteristicassemblage. A total of 7823 (i.e., somewhat less than half) ofthese are the same sites, which suggests that these two methodsdiffered somewhat in determining which sites were not assign-able to an assemblage. This discrepancy might be reduced withother distance indices or clustering methods, or by modifyingthe top 5% criterion for inclusion of a site in a PCA-definedassemblage.
Several factors could have contributed to this apparent lackof structure. The large spatial scale of the data set could maskrelationships that exist in smaller regions or that vary spatially.Some of the lack of structure in the results could be due to thesampling gear, which integrates species occurring over a tran-sect of 1.8 nautical miles, and may, therefore, integrate assem-blages that do not occur in the same habitat. It could also bedue to the use of data obtained from different sources, whichused different trawling gear and vessels. Using data from sev-eral months may also have been a factor. Seasonal differencesin assemblage structure have been described in several studies(e.g., Colvocoresses and Musick 1984; Mahon and Smith1989a). Assemblages appear to be stable in winter and summerand, due to seasonal migrations, to be transitional in spring andfall (Musick et al. 1985; Phoel 1985).
Although analyzing the 20-year time period covered in thepresent data set might have obscured relationships that oc-curred over shorter time periods, the similarity between thePCAs for the 1975–1994 period and the 5-year periods sug-gests that the temporal span of the data set was not a majorfactor in limiting assemblage structure.
The apparent lack of structure could also be a reflection ofthe real nature of the demersal fish assemblages, which maynot be highly structured into functional groups. The mobilityof most fish species, and their relatively large ranges, togetherwith the migratory habits of many species, may preclude
1985–1989 1990–1994
PC Species PC Species
14 Polar sculpin 1 Blue hake14 Greenland halibut 1 Longnose (slatjaw cutthroat) eel14 Roughhead grenadier 1 Rock (roundnose) grenadier
1 Roughhead grenadier1 Large-scale tapirfish
1 Northern wolffish1 Spinytail skate
1 Greenland halibut
1 Marlin-spike (common grenadier)
17 Lumpfish 16 Lumpfish17 Shorthorn sculpin 16 Shorthorn sculpin17 Sea raven 16 Sea raven
18 Cunner 17 Cunner18 Winter flounder 17 Butterfish
18 Snake blenny
Table 9 (concluded).
Mahon et al. 1727
© 1998 NRC Canada
F98-065.CHPWed Aug 19 14:54:57 1998
Color profile: DisabledComposite Default screen
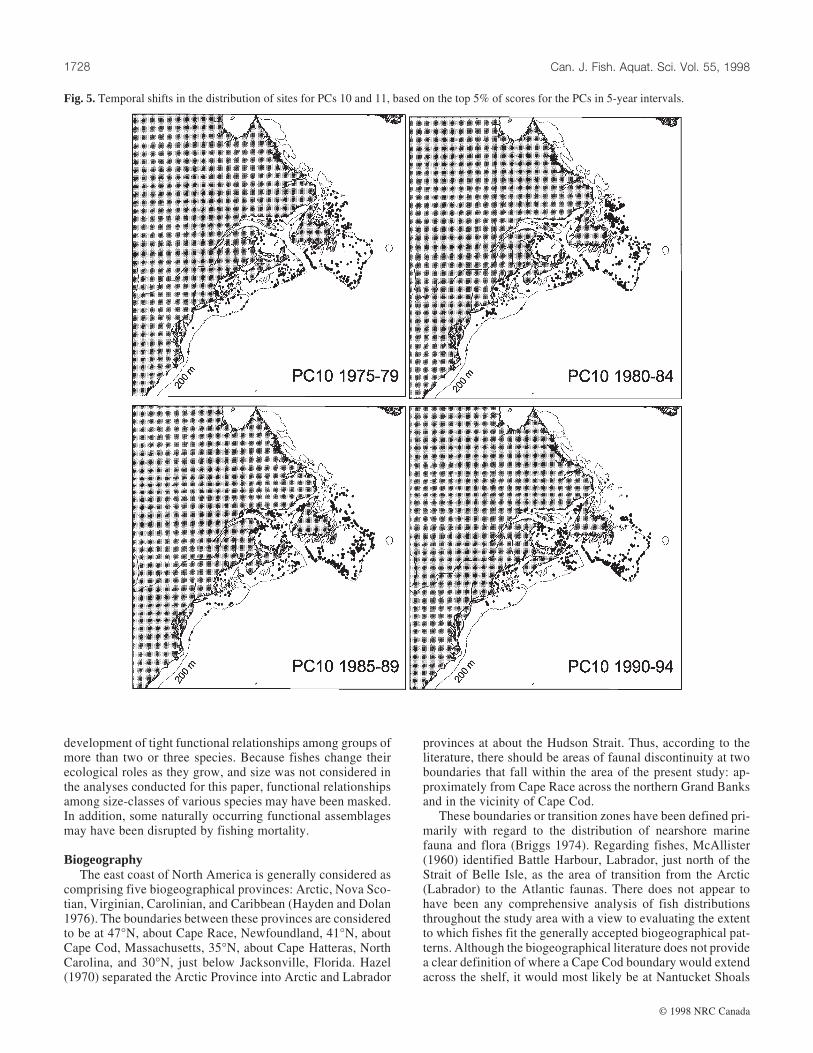
development of tight functional relationships among groups ofmore than two or three species. Because fishes change theirecological roles as they grow, and size was not considered inthe analyses conducted for this paper, functional relationshipsamong size-classes of various species may have been masked.In addition, some naturally occurring functional assemblagesmay have been disrupted by fishing mortality.
BiogeographyThe east coast of North America is generally considered as
comprising five biogeographical provinces: Arctic, Nova Sco-tian, Virginian, Carolinian, and Caribbean (Hayden and Dolan1976). The boundaries between these provinces are consideredto be at 47°N, about Cape Race, Newfoundland, 41°N, aboutCape Cod, Massachusetts, 35°N, about Cape Hatteras, NorthCarolina, and 30°N, just below Jacksonville, Florida. Hazel(1970) separated the Arctic Province into Arctic and Labrador
provinces at about the Hudson Strait. Thus, according to theliterature, there should be areas of faunal discontinuity at twoboundaries that fall within the area of the present study: ap-proximately from Cape Race across the northern Grand Banksand in the vicinity of Cape Cod.
These boundaries or transition zones have been defined pri-marily with regard to the distribution of nearshore marinefauna and flora (Briggs 1974). Regarding fishes, McAllister(1960) identified Battle Harbour, Labrador, just north of theStrait of Belle Isle, as the area of transition from the Arctic(Labrador) to the Atlantic faunas. There does not appear tohave been any comprehensive analysis of fish distributionsthroughout the study area with a view to evaluating the extentto which fishes fit the generally accepted biogeographical pat-terns. Although the biogeographical literature does not providea clear definition of where a Cape Cod boundary would extendacross the shelf, it would most likely be at Nantucket Shoals
Fig. 5. Temporal shifts in the distribution of sites for PCs 10 and 11, based on the top 5% of scores for the PCs in 5-year intervals.
Can. J. Fish. Aquat. Sci. Vol. 55, 19981728
© 1998 NRC Canada
F98-065.CHPWed Aug 19 14:55:11 1998
Color profile: DisabledComposite Default screen
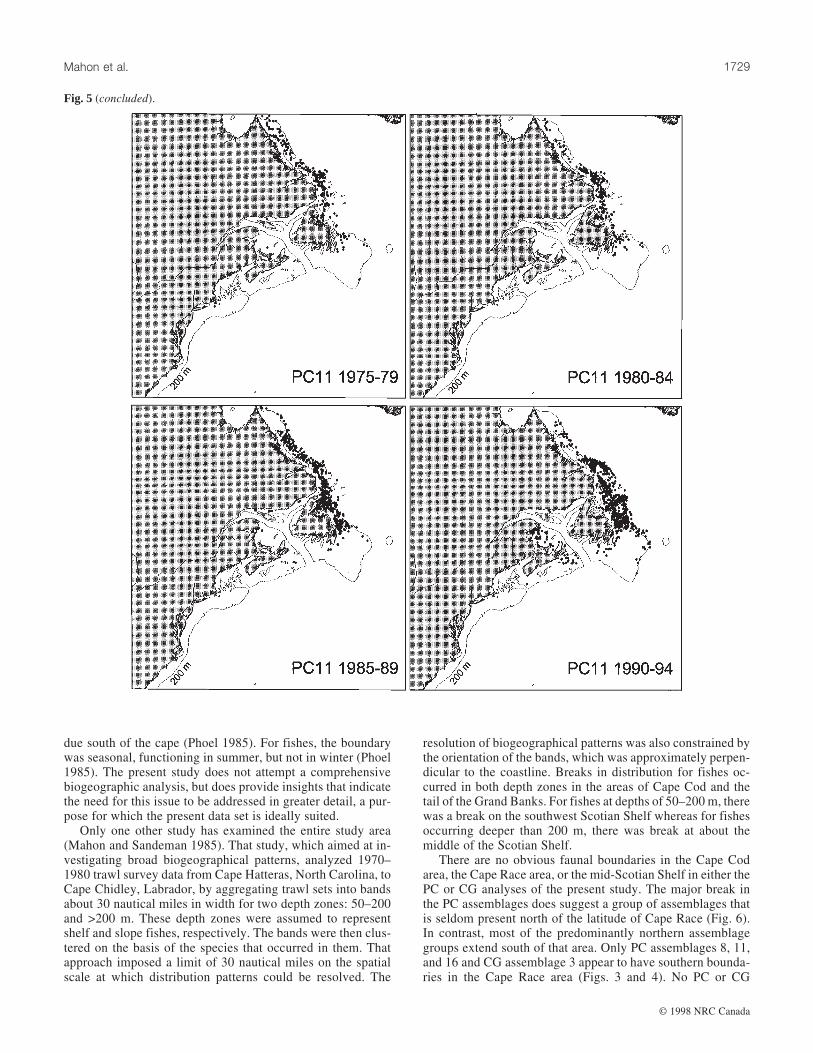
due south of the cape (Phoel 1985). For fishes, the boundarywas seasonal, functioning in summer, but not in winter (Phoel1985). The present study does not attempt a comprehensivebiogeographic analysis, but does provide insights that indicatethe need for this issue to be addressed in greater detail, a pur-pose for which the present data set is ideally suited.
Only one other study has examined the entire study area(Mahon and Sandeman 1985). That study, which aimed at in-vestigating broad biogeographical patterns, analyzed 1970–1980 trawl survey data from Cape Hatteras, North Carolina, toCape Chidley, Labrador, by aggregating trawl sets into bandsabout 30 nautical miles in width for two depth zones: 50–200and >200 m. These depth zones were assumed to representshelf and slope fishes, respectively. The bands were then clus-tered on the basis of the species that occurred in them. Thatapproach imposed a limit of 30 nautical miles on the spatialscale at which distribution patterns could be resolved. The
resolution of biogeographical patterns was also constrained bythe orientation of the bands, which was approximately perpen-dicular to the coastline. Breaks in distribution for fishes oc-curred in both depth zones in the areas of Cape Cod and thetail of the Grand Banks. For fishes at depths of 50–200 m, therewas a break on the southwest Scotian Shelf whereas for fishesoccurring deeper than 200 m, there was break at about themiddle of the Scotian Shelf.
There are no obvious faunal boundaries in the Cape Codarea, the Cape Race area, or the mid-Scotian Shelf in either thePC or CG analyses of the present study. The major break inthe PC assemblages does suggest a group of assemblages thatis seldom present north of the latitude of Cape Race (Fig. 6).In contrast, most of the predominantly northern assemblagegroups extend south of that area. Only PC assemblages 8, 11,and 16 and CG assemblage 3 appear to have southern bounda-ries in the Cape Race area (Figs. 3 and 4). No PC or CG
Fig. 5 (concluded).
Mahon et al. 1729
© 1998 NRC Canada
F98-065.CHPWed Aug 19 14:55:27 1998
Color profile: DisabledComposite Default screen
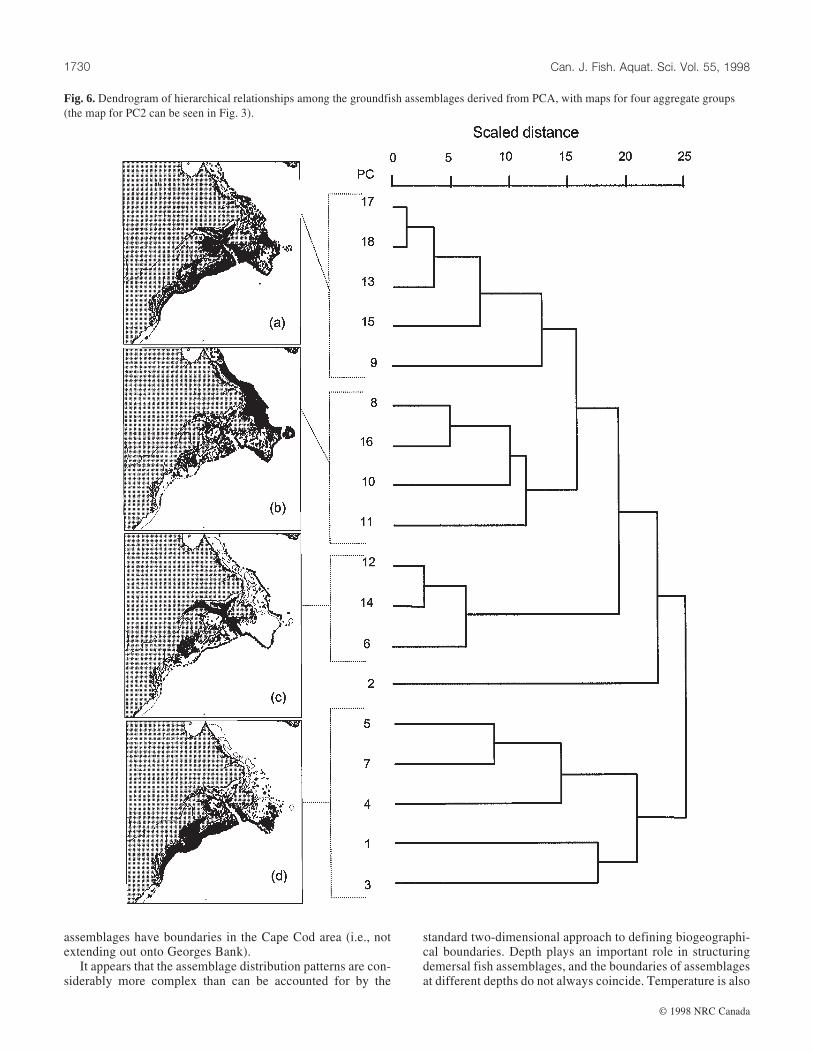
assemblages have boundaries in the Cape Cod area (i.e., notextending out onto Georges Bank).
It appears that the assemblage distribution patterns are con-siderably more complex than can be accounted for by the
standard two-dimensional approach to defining biogeographi-cal boundaries. Depth plays an important role in structuringdemersal fish assemblages, and the boundaries of assemblagesat different depths do not always coincide. Temperature is also
Fig. 6. Dendrogram of hierarchical relationships among the groundfish assemblages derived from PCA, with maps for four aggregate groups
(the map for PC2 can be seen in Fig. 3).
Can. J. Fish. Aquat. Sci. Vol. 55, 19981730
© 1998 NRC Canada
F98-065.CHPWed Aug 19 14:55:48 1998
Color profile: DisabledComposite Default screen

an important determinant of distribution and can vary throughtime on a decadal or longer scale, as well as seasonally. Inter-annual shifts in temperature have been shown to result in shiftsin the distribution of several of the species in the present studyarea (Murawski 1993).
In further examining biogeographic patterns in the study
area, it will be necessary to take account of the three invariantphysical dimensions, latitude, longitude, and depth, with con-sideration of the changes that may occur in a fourth dimension,time. This will require more detailed analysis of the codistri-bution patterns of individual species, including analysis ofspecies range end-points, in relation to environmental
Fig. 7. Dendrogram of hierarchical relationships among CGs, with maps for four aggregate groups (CGs 1 and 7 were not included in the
maps, as no assemblages were associated with these groups).
Mahon et al. 1731
© 1998 NRC Canada
F98-065.CHPWed Aug 19 14:56:10 1998
Color profile: DisabledComposite Default screen

characteristics at a finer spatial scale than that used by Mahonand Sandeman (1985).
Pinhorn and Halliday (1997) provided an example of suchan analysis for slope fishes with a focus on the tail of the GrandBanks as a possible area of faunal discontinuity. They foundevidence for discontinuity in faunal distributions there, butnoted that whereas some species were distributed mainly northof this area, and others mainly south of it, several species weredistributed widely on both sides. Their study indicated thatboth occurrence and density may also be useful as indicatorsof faunal discontinuity. Their findings support our view thatwhen the data are examined at the level of resolution of theindividual trawl sets over a wide geographical area, the emer-gent patterns are too complex to explain using the biogeo-graphical generalizations that have been offered previously.
Implications for management
The analyses described in this paper may have some impli-cations for fishery management. However, the present resultsare too preliminary to warrant an in-depth discussion.
One primary question that could be addressed through de-tailed assemblage analysis is whether functional groupings ex-ist that can be viewed as ecological entities, such as theassemblage production units of Tyler et al. (1982). If such unitsexist, management strategies could be adapted to optimize har-vest of assemblages, rather than harvest of single species. Theanalyses conducted to date indicate that the groundfish assem-blages are rather loose, in that the assemblages explain onlyabout 56% of the variance in total species distribution.
The apparent looseness of assemblage structure for the
Visual species group PC CG
Northern Deepwater
Longnose eel 2 13
Largescale tapirfish 2 9
Blue hake 2 13
Rock grenadier 2 13
Roughhead grenadier 2 13
Spinytail skate — 13
Temperate Deepwater
Atlantic argentine 6 4
Marlin-spike 6 5
Black dogfish 6 10
Longfin hake 14 10
Roughnose grenadier 14 10
Southern Deepwater
Shortfin squid 4 17
Blackbelly rosefish 9 17
Offshore hake 9 17
Shortnose greeneye 9 17
Northern Bank/Slope
Northern wolffish 8 13
Spotted wolffish 8 6
Atlantic sea poacher 11 3
Arctic cod 11 3
Greenland halibut 11 13
Polar scuplin 16 13
North-temperate Bank/slope
Redfishes 6 10
Witch flounder 6 10
Atlantic wolffish 8 14
Smooth skate 10 14
Thorny skate 10 14
Atlantic cod 10 8
American plaice 10 8
Alligator fish 13 14
Moustache sculpin 13 14
Snowflake hookear sculpin 13 14
Visual species group PC CG
Atlantic halibut 15 4
Lumpfish 17 2
Shorthorn sculpin 17 2
Snake blenny 18 8
Cunner 18 11
South-temperate Bank/Slope
Goosefish (Angler) 4 18
Silver hake 4 18
Cusk 4 17
Red hake 4 15
Spiny dogfish 4 12
White hake 4 5
Pollock 4 4
Yellowtail flounder 5 11
Winter flounder 5 11
Ocean pout 5 11
Sea raven 5 11
Longhorn sculpin 5 11
Winter skate 7 12
Northern sandlance 7 12
Atlantic hagfish 12 5
Fourbeard rockling 12 14
Haddock 15 4
Southern Bank/Slope
Fourspot flounder 1 12
Butterfish 1 12
Spotted hake 1 15
Fawn cusk-eel 1 15
Gulfstream flounder 1 15
Summer flounder 3 18
Scup 3 18
Northern searobin 3 18
Smooth dogfish 3 16
Black seabass 3 18
Windowpane 7 12
Little skate 7 12
Table 11.Comparisons among species groups determined by visual analysis with groups determined by the multivariate
analyses.
Note: The numbers in the columns show on which species group the species had its highest loading in the PCA (PCs) (Table 6) and the
grouping of species based on maximum relative abundance in the site CGs (Table 7). Lines separate species loading on different PCs.
Can. J. Fish. Aquat. Sci. Vol. 55, 19981732
© 1998 NRC Canada
F98-065.CHPWed Aug 19 14:56:12 1998
Color profile: DisabledComposite Default screen
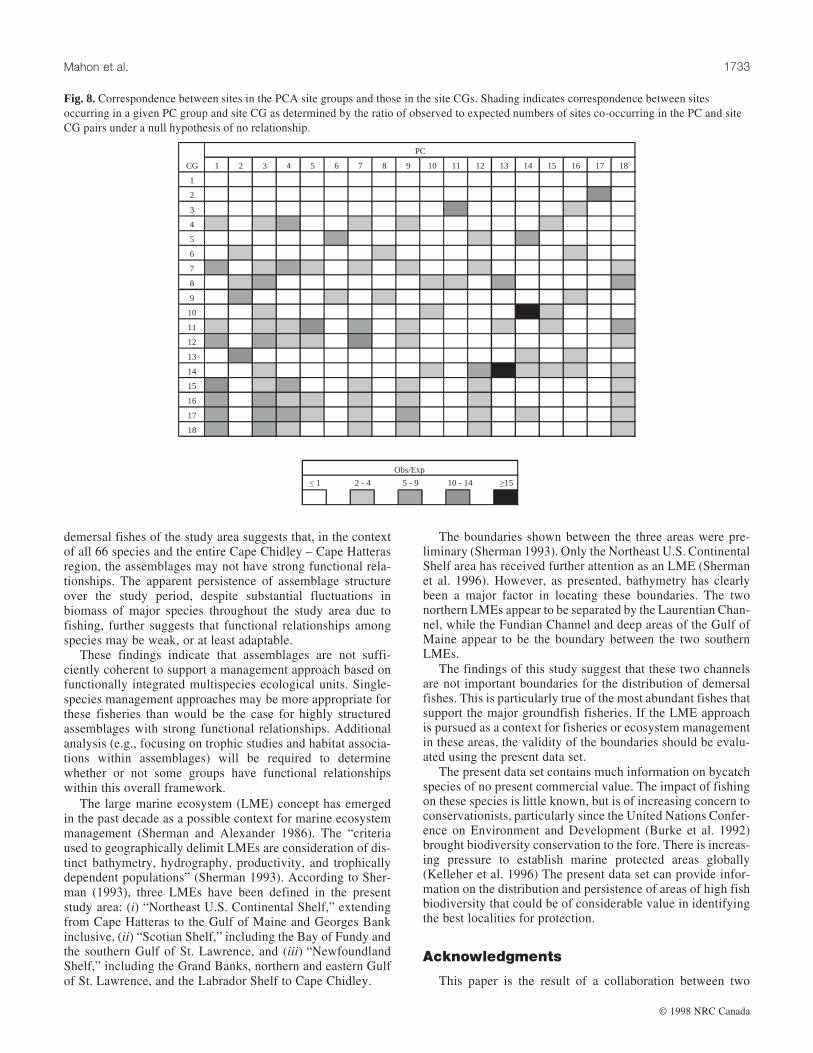
demersal fishes of the study area suggests that, in the contextof all 66 species and the entire Cape Chidley – Cape Hatterasregion, the assemblages may not have strong functional rela-tionships. The apparent persistence of assemblage structureover the study period, despite substantial fluctuations inbiomass of major species throughout the study area due tofishing, further suggests that functional relationships amongspecies may be weak, or at least adaptable.
These findings indicate that assemblages are not suffi-ciently coherent to support a management approach based onfunctionally integrated multispecies ecological units. Single-species management approaches may be more appropriate forthese fisheries than would be the case for highly structuredassemblages with strong functional relationships. Additionalanalysis (e.g., focusing on trophic studies and habitat associa-tions within assemblages) will be required to determinewhether or not some groups have functional relationshipswithin this overall framework.
The large marine ecosystem (LME) concept has emergedin the past decade as a possible context for marine ecosystemmanagement (Sherman and Alexander 1986). The “criteriaused to geographically delimit LMEs are consideration of dis-tinct bathymetry, hydrography, productivity, and trophicallydependent populations” (Sherman 1993). According to Sher-man (1993), three LMEs have been defined in the presentstudy area: (i) “Northeast U.S. Continental Shelf,” extendingfrom Cape Hatteras to the Gulf of Maine and Georges Bankinclusive, (ii) “Scotian Shelf,” including the Bay of Fundy andthe southern Gulf of St. Lawrence, and (iii) “NewfoundlandShelf,” including the Grand Banks, northern and eastern Gulfof St. Lawrence, and the Labrador Shelf to Cape Chidley.
The boundaries shown between the three areas were pre-liminary (Sherman 1993). Only the Northeast U.S. ContinentalShelf area has received further attention as an LME (Shermanet al. 1996). However, as presented, bathymetry has clearlybeen a major factor in locating these boundaries. The twonorthern LMEs appear to be separated by the Laurentian Chan-nel, while the Fundian Channel and deep areas of the Gulf ofMaine appear to be the boundary between the two southernLMEs.
The findings of this study suggest that these two channelsare not important boundaries for the distribution of demersalfishes. This is particularly true of the most abundant fishes thatsupport the major groundfish fisheries. If the LME approachis pursued as a context for fisheries or ecosystem managementin these areas, the validity of the boundaries should be evalu-ated using the present data set.
The present data set contains much information on bycatchspecies of no present commercial value. The impact of fishingon these species is little known, but is of increasing concern toconservationists, particularly since the United Nations Confer-ence on Environment and Development (Burke et al. 1992)brought biodiversity conservation to the fore. There is increas-ing pressure to establish marine protected areas globally(Kelleher et al. 1996) The present data set can provide infor-mation on the distribution and persistence of areas of high fishbiodiversity that could be of considerable value in identifyingthe best localities for protection.
Acknowledgments
This paper is the result of a collaboration between two
PC
CG 1 2 3 4 5 6 7 8 9 10 11 12 13 14 15 16 17 18
1
2
3
4
5
6
7
8
9
10
11
12
13
14
15
16
17
18
< 1 2 - 4 5 - 9 10 - 14 >15
Obs/Exp
Fig. 8. Correspondence between sites in the PCA site groups and those in the site CGs. Shading indicates correspondence between sites
occurring in a given PC group and site CG as determined by the ratio of observed to expected numbers of sites co-occurring in the PC and site
CG pairs under a null hypothesis of no relationship.
Mahon et al. 1733
© 1998 NRC Canada
F98-065.CHPWed Aug 19 14:56:14 1998
Color profile: DisabledComposite Default screen
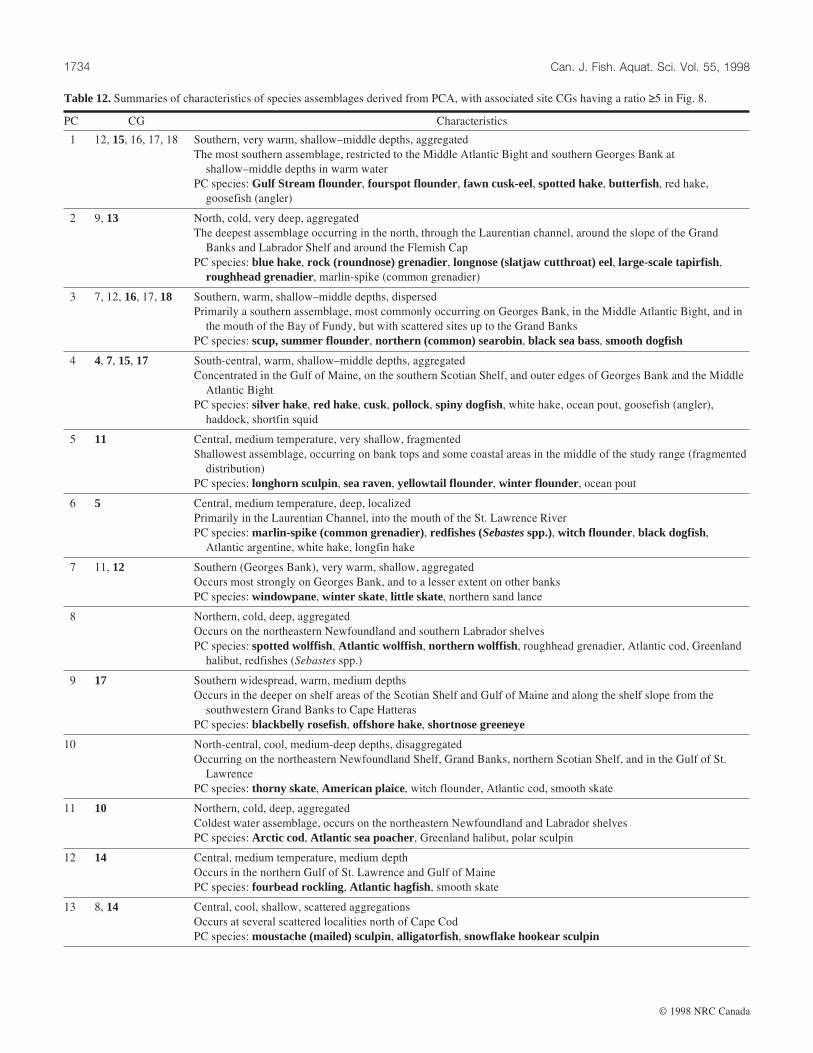
PC CG Characteristics
1 12, 15, 16, 17, 18 Southern, very warm, shallow–middle depths, aggregated
The most southern assemblage, restricted to the Middle Atlantic Bight and southern Georges Bank at
shallow–middle depths in warm water
PC species: Gulf Stream flounder, fourspot flounder, fawn cusk-eel, spotted hake, butterfish , red hake,
goosefish (angler)
2 9, 13 North, cold, very deep, aggregated
The deepest assemblage occurring in the north, through the Laurentian channel, around the slope of the Grand
Banks and Labrador Shelf and around the Flemish Cap
PC species: blue hake, rock (roundnose) grenadier, longnose (slatjaw cutthroat) eel, large-scale tapirfish,
roughhead grenadier, marlin-spike (common grenadier)
3 7, 12, 16, 17, 18 Southern, warm, shallow–middle depths, dispersed
Primarily a southern assemblage, most commonly occurring on Georges Bank, in the Middle Atlantic Bight, and in
the mouth of the Bay of Fundy, but with scattered sites up to the Grand Banks
PC species: scup, summer flounder, northern (common) searobin, black sea bass, smooth dogfish
4 4, 7, 15, 17 South-central, warm, shallow–middle depths, aggregated
Concentrated in the Gulf of Maine, on the southern Scotian Shelf, and outer edges of Georges Bank and the Middle
Atlantic Bight
PC species: silver hake, red hake, cusk, pollock, spiny dogfish, white hake, ocean pout, goosefish (angler),
haddock, shortfin squid
5 11 Central, medium temperature, very shallow, fragmented
Shallowest assemblage, occurring on bank tops and some coastal areas in the middle of the study range (fragmented
distribution)
PC species: longhorn sculpin, sea raven, yellowtail flounder , winter flounder , ocean pout
6 5 Central, medium temperature, deep, localized
Primarily in the Laurentian Channel, into the mouth of the St. Lawrence River
PC species: marlin-spike (common grenadier), redfishes (Sebastesspp.), witch flounder , black dogfish,
Atlantic argentine, white hake, longfin hake
7 11, 12 Southern (Georges Bank), very warm, shallow, aggregated
Occurs most strongly on Georges Bank, and to a lesser extent on other banks
PC species: windowpane, winter skate, little skate, northern sand lance
8 Northern, cold, deep, aggregated
Occurs on the northeastern Newfoundland and southern Labrador shelves
PC species: spotted wolffish, Atlantic wolffish , northern wolffish , roughhead grenadier, Atlantic cod, Greenland
halibut, redfishes (Sebastes spp.)
9 17 Southern widespread, warm, medium depths
Occurs in the deeper on shelf areas of the Scotian Shelf and Gulf of Maine and along the shelf slope from the
southwestern Grand Banks to Cape Hatteras
PC species: blackbelly rosefish, offshore hake, shortnose greeneye
10 North-central, cool, medium-deep depths, disaggregated
Occurring on the northeastern Newfoundland Shelf, Grand Banks, northern Scotian Shelf, and in the Gulf of St.
Lawrence
PC species: thorny skate, American plaice, witch flounder, Atlantic cod, smooth skate
11 10 Northern, cold, deep, aggregated
Coldest water assemblage, occurs on the northeastern Newfoundland and Labrador shelves
PC species: Arctic cod, Atlantic sea poacher, Greenland halibut, polar sculpin
12 14 Central, medium temperature, medium depth
Occurs in the northern Gulf of St. Lawrence and Gulf of Maine
PC species: fourbead rockling, Atlantic hagfish, smooth skate
13 8, 14 Central, cool, shallow, scattered aggregations
Occurs at several scattered localities north of Cape Cod
PC species: moustache (mailed) sculpin, alligatorfish , snowflake hookear sculpin
Table 12.Summaries of characteristics of species assemblages derived from PCA, with associated site CGs having a ratio ≥5 in Fig. 8.
Can. J. Fish. Aquat. Sci. Vol. 55, 19981734
© 1998 NRC Canada
F98-065.CHPWed Aug 19 14:56:16 1998
Color profile: DisabledComposite Default screen

PC CG Characteristics
14 5, 10 Central, medium temperature, deep, localized
Concentrated in the Laurentian Channel and in the Gulf of St. Lawrence up to the mouth of the St. Lawrence River
and also along the slope of the Labrador and Scotian shelves
PC species: roughnose grenadier, longfin hake, black dogfish
15 Central, medium temperature, medium depths
Occurs mainly on the outer banks of the Scotian Shelf and on the southwestern edge of the Grand Banks into the
northeastern Gulf of St. Lawrence
PC species: Atlantic halibut , haddock
16 Northern, cool, deep
Essentially a single-species PC concentrated on northeastern Newfoundland and Labrador slope, scattered into the
Gulf of St. Lawrence, Gulf of Maine, and Georges Bank
PC species: polar sculpin, roughhead grenadier, Greenland halibut
17 14 North-central, very cold, medium depths
Localized on the shelf south of Newfoundland, around into the northeastern Gulf of St. Lawrence
PC species: lumpfish, shorthorn sculpin, sea raven
18 8, 11 Southern, warm, shallow
Essentially a single-species PC, occurs in the southwestern Gulf of St. Lawrence, Bay of Fundy, Georges Bank, and
Middle Atlantic Bight
PC species: cunner, winter flounder, snake blenny
Note: The highest association of each site CG with a PC (in Fig. 8) is in bold type (see Table 8 for depth and temperature information). In the PC species lists,
species with loadings >0.5 are in bold type; species with loadings between 0.3 and 0.5 are in standard type.
Table 12(concluded).
Cape Hatteras to Cape
Chidley (present study)
Middle Atlantic Bight
(Colvocoresses and Musick
1984)
Middle Atlantic
Bight/Georges
Bank/Gulf of Maine
(Gabriel 1992)
Scotian Shelf
(Mahon and Smith
1989a)
Scotian Shelf
(Mahon 1997)
Gulf Stream flounder Red hake Spotted hake — —
Fourspot flounder Silver hake Fourspot flounder
Fawn cusk-eel Gulf Stream flounder Butterfish
Spotted hake Spotted hake
Butterfish Butterfish
Red hake Fourspot flounder
Goosefish (angler)
Blue hake — — — —
Rock grenadierLongnose eelLarge-scale tapirfishRoughhead grenadierMarlin-spike
Scup Scup Scup — —
Summer flounder Summer flounder Summer flounder
Northern searobin Northern searobin Northern searobin
Black sea bass Black sea bass Black sea bass
Smooth dogfish Smooth dogfish
Silver hake Red hake Red hake Red hake
Red hake Silver hake Goosefish (angler) Silver hake
Cusk Goosefish (angler) Goosefish (angler)
Pollock Cusk Spiny dogfish
Spiny dogfish Spiny dogfish Spiny dogfish
White hake Shortfin squid Shortfin squid
Ocean pout
Goosefish (angler)
Haddock
Shortfin squid
Table 13.Comparison of species groupings found in the PCA of the present study with groupings found in previous studies.
Mahon et al. 1735
© 1998 NRC Canada
F98-065.CHPWed Aug 19 14:56:18 1998
Color profile: DisabledComposite Default screen

Cape Hatteras to Cape
Chidley (present study)
Middle Atlantic Bight
(Colvocoresses and Musick
1984)
Middle Atlantic
Bight/Georges
Bank/Gulf of Maine
(Gabriel 1992)
Scotian Shelf
(Mahon and Smith
1989a)
Scotian Shelf
(Mahon 1997)
Longhorn sculpin Longhorn sculpin Sea raven Longhorn sculpin Longhorn sculpin
Sea raven Yellowtail flounder Ocean pout Sea raven Sea raven
Yellowtail flounder American plaice Winter flounder Winter flounder
Winter flounder Little skate Yellowtail flounder Yellowtail flounder
Ocean pout Windowpane Winter skate Winter skate
Spiny dogfish Ocean pout
Marlin-spike Witch flounder Redfishes Marlin-spike Marlin-spike
Redfishes White hake Witch flounder Longfin hake Redfishes
Witch flounder Goosefish (angler) White hake Witch flounder
Black dogfish White hake
Atlantic argentine
White hake
Longfin hake
Windowpane Winter skate
Winter skate Windowpane
Little skate Little skate
Northern sand lance
Spotted wolffish —
Atlantic wolffishNorthern wolffishRoughhead grenadier
Atlantic cod
Greenland halibut
Redfishes
Blackbelly rosefish Blackbelly rosefish Blackbelly rosefish —
Offshore hake Offshore hake Offshore hake
Shortnose greeneye Shortnose greeneye Longfin hake
Gulf Stream flounder
Thorny skate Thorny skate Thorny skate Thorny skate
American plaice American plaice American plaice American plaice
Witch flounder Atlantic cod
Atlantic cod
Smooth skate
Arctic cod — — — —
Atlantic sea poacherGreenland halibut
Polar sculpin
Fourbeard rockling Pollock Cusk
Atlantic hagfish Spiny dogfish Pollock
Smooth skate Atlantic argentine
Moustache sculpin — Moustache sculpin
AlligatorfishSnowflake hookear sculpin
Roughnose grenadier — Longfin hake
Longfin hakeBlack dogfish
Atlantic halibut — Atlantic halibut Atlantic halibut Atlantic halibut
Haddock Atlantic wolffish Haddock Haddock
Atlantic wolffish
Polar sculpin — — — —
Roughhead grenadier
Greenland halibut
Table 13(continued).
Can. J. Fish. Aquat. Sci. Vol. 55, 19981736
© 1998 NRC Canada
F98-065.CHPWed Aug 19 14:56:20 1998
Color profile: DisabledComposite Default screen

projects, the East Coast of North America Strategic Assess-ment Project (ECNASAP) and the Cod Mortality Project,which share a common goal: description of coastal ecosystemsand changes in their characteristics over time. ECNASAP is acollaboration between the NOAA/SEA and several Canadianagencies, including Environment Canada and the Departmentof Fisheries and Oceans. It has benefited from a synergisticdevelopment of new ideas and knowledge and from the effi-ciency of cooperative operations. We thank all those who haveplayed a role in ECNASAP. This study comprises EC-NASAP’s Offshore Case Study which began in January 1995.The Department of Fisheries and Oceans’ Cod Mortality Pro-ject started in 1995 and was planned to last 3 years. We thankDan Basta and Doug Swain for valuable discussion and adviceduring the development of the study and Jack Musick for hiscomments on the manuscript.
References
Anderberg, M.R. 1973. Cluster analysis for applications. AcademicPress, New York.
Bianchi, G. 1992. Demersal assemblages of the continental shelf andupper slope of Angola. Mar. Ecol. Prog. Ser. 81: 101–120.
Bianchi, G., and Høisæter, T. 1992. Relative merits of using numbersand biomass in fish community studies. Mar. Ecol. Prog. Ser. 85:25–33.
Bigelow, H.B., and Schroeder, W.C. 1953. Fishes of the Gulf ofMaine. Fish. Bull. U.S. 74(53).
Bloom, S.A. 1981. Similarity indices in community studies: potentialpitfalls. Mar. Ecol. Prog. Ser. 5: 125–128.
Briggs, J.C. 1974. Marine zoogeography. McGraw-Hill, New York.
Brown, S., Mahon, R., Zwanenburg, C.T.K., Atkinson, B., Buja, K.,Claflin, L., Howell, G., Monaco, M., O’Boyle, R.N., and Sinclair,M. 1996. East coast of North America demersal fishes: initialexplorations of biogeography and species assemblages. NationalOceanic and Atmospheric Administration, Silver Spring, Md., andDepartment of Fisheries and Oceans, Dartmouth, N.S.
Burke, T. (Chairman), et al. 1992. United Nations Conference onEnvironment and Development, Rio de Janeiro. Campden Publ.,Hong Kong.
Clifford, H.T., and Stephenson, W. 1975. An introduction to numeri-cal classification. Academic Press, New York.
Colvocoresses, J.A., and Musick, J.A. 1984. Species associations andcommunity composition of Middle Atlantic Bight continentalshelf demersal fishes. Fish. Bull. U.S. 82: 295–313.
Doubleday, W.G. 1981. Manual on groundfish surveys in the
northwest Atlantic. Northwest Atl. Fish. Organ. Sci. Counc. Stud.No. 2.
Doubleday, W.G., and Rivard, D. 1981. Bottom trawl surveys. Can.Spec. Publ. Fish. Aquat. Sci. No. 58.
Gabriel, W.L. 1992. Persistence of demersal fish assemblages be-tween Cape Hatteras and Nova Scotia, Northwest Atlantic. J.Northwest Atl. Fish. Sci. 14: 29–46.
Gauch, H.G. 1982. Multivariate analysis in community ecology.Cambridge University Press, Cambridge, England.
Gomes, M.C. 1993. Predictions under uncertainty. Institute of Socialand Economic Research, St. John’s, Nfld.
Gomes, M.C., Haedrich, R.L., and Rice, J.C. 1992. Biogeography ofgroundfish assemblages on the Grand Bank. J. Northwest Atl.Fish. Sci. 14: 13–27.
Gomes, M.C., Haedrich, R.L., and Guadalupe Villagarcia, M. 1995.Spatial and temporal changes in the groundfish assemblages on thenortheast Newfoundland/Labrador Shelf, Northwest Atlantic,1978–1991. Fish. Oceanogr. 4: 85–101.
Gorsuch, R.L. 1974. Factor analysis. W.B. Saunders, Philadelphia,Pa.
Grosslein, M.D. 1969. Groundfish survey program of BCF WoodsHole. Commer. Fish. Rev. 31(8–9): 22–30.
Guadalupe Villagarcia, M. 1995. Structure and distribution of demer-sal fish assemblages on the Northeast Newfoundland and Labra-dor shelf. M.Sc. thesis, Biology Department, MemorialUniversity, St. John’s, Nfld.
Hayden, B.P., and Dolan, R. 1976. Coastal marine fauna and marineclimates of the Americas. J. Biogeogr. 3: 71–81.
Hazel, J.E. 1970. Atlantic continental shelf and slope of the U.S. —ostrocode zoogeography of the southern Nova Scotia and northernVirginian faunal provinces. Prof. Pap. U.S. Geol. Surv. 529-E.
Jolliffe, I.T. 1986. Principal components analysis. Springer-Verlag,New York.
Kelleher, G., Bleakley, C., and Wells, S. (Editors). 1996. A globalrepresentative system of marine protected areas. Vol. I. Antarctic,Arctic, Mediterranean, Northwest Atlantic, Northeast Atlantic andBaltic. The Great Barrier Reef Marine Park Authority (Towns-ville, Queensland, Australia),The World Bank (Washington,D.C.), and The World Conservation Union (IUCN) (Washington,D.C.).
Mahon, R. 1997. Demersal fish assemblages from the Scotian Shelfand Bay of Fundy, based on trawl survey data (1970–1993). Can.MS Rep. Fish. Aquat. Sci. No. 2426.
Mahon, R., and Sandeman, E.J. 1985. Fish distributional patterns onthe continental shelf and slope from Cape Hatteras to the HudsonStrait — a trawl’s eye view. In Towards the inclusion of fisheryinteractions in management advice. Edited by R. Mahon. Can.Tech. Rep. Fish. Aquat. Sci. No. 1347. pp. 137–152.
Mahon, R., and Smith, R.W. 1989a. Demersal fish assemblages on
Cape Hatteras to Cape
Chidley (present study)
Middle Atlantic Bight
(Colvocoresses and Musick
1984)
Middle Atlantic
Bight/Georges
Bank/Gulf of Maine
(Gabriel 1992)
Scotian Shelf
(Mahon and Smith
1989a)
Scotian Shelf
(Mahon 1997)
Lumpfish — Lumpfish — —
Shorthorn sculpinSea raven
Cunner — Cunner — —
Winter flounder
Snake blenny
Note: Species groups in previous studies have been placed next to the PC assemblage from this study to which they appear most similar. In the
present study column, the species in bold type have loadings >0.5; the species in standard type have loadings between 0.3 and 0.5. A dash
indicates that none of the species in the present study’s group were included in the previous studies.
Table 13(concluded).
Mahon et al. 1737
© 1998 NRC Canada
F98-065.CHPWed Aug 19 14:56:22 1998
Color profile: DisabledComposite Default screen
the Scotian Shelf, northwest Atlantic: spatial distribution and per-sistence. Can. J. Fish. Aquat. Sci. 46(Suppl. 1): 134–152.
Mahon, R., and Smith, R.W. 1989b. Comparison of species composi-tion in a bottom trawl intercalibration experiment. J. NorthwestAtl. Fish. Sci. 9: 73–79.
McAllister, D.E. 1960. List of the marine fishes of Canada. Bull. Mar.Mus. Can. No. 168, Biol. Ser. No. 62.
Murawski, S.A. 1993. Climate change and marine fish distributions:forecasting from historical analogy. Trans. Am. Fish. Soc. 122:647–659.
Musick, J.A., Colvocoresses, J.A., and Foell, E.J. 1985. Seasonalityand the distribution, availability and composition of fish assem-blages in Chesapeake Bight. In Fish community ecology in estu-aries and coastal lagoons: towards an ecosystem integration.Edited by A. Yánez Arancibia. DR UNAM Press, Mexico.pp. 451–474.
Overholtz, W.J., and Tyler, A.V. 1985. Long-term responses of thedemersal fish assemblages of Georges Bank. Fish. Bull. U.S. 83:507–520.
Phoel, W.C. 1985. Community structure of demersal fishes on theinshore U.S. Atlantic Continental Shelf: Cape Ann, MA, to CapeFear, NC. Ph.D. dissertation, Virginia Institute of Marine Science,College of William and Mary, Gloucester Point, VA.
Pinhorn, A.T., and Halliday, R.G. 1997. The Tail of Grand Bank,southeast of Newfoundland, as a geographical boundary for con-tinental slope fishes. Can J. Zool. 75: 1753–1772.
SAS Institute Inc. 1989. SAS/STAT® user’s guide, version 6, edition4. Vol. 1. SAS Institute Inc., Cary, N.C.
Scott, W.B., and Scott, M.G. 1988. Atlantic fishes of Canada. Can.Bull. Fish. Aquat. Sci. No. 219.
Sherman, K. 1993. Karge marine ecosystems as global units for ma-rine resources management — an ecological perspective. In Largemarine ecosystems: stress, mitigation, and sustainability. Edited
by K. Sherman, L.M. Alexander, and B.D. Gold. American Asso-ciation for the Advancement of Science, Washington, D.C.pp. 3–14.
Sherman, K., and Alexander, L.M. (Editors). 1986. Variability andmanagement of large marine ecosystems. AAAS Selected Sympo-sium 99. Westview Press, Boulder, Co.
Sherman, K., Jaworski, N.A., and Smayda, T.J. (Editors). 1996. TheNortheast Shelf ecosystem: assessment, sustainability and man-agement. Blackwell Scientific Publications, Inc., Cambridge,Mass.
Ter Braak, C.J.F. 1986. Canonical correspondence analysis: a neweigenvector technique for multivariate direct gradient analysis.Ecology, 67: 1167–1179.
Tyler, A.V., Gabriel, W.J., and Overholtz, W.J. 1982. Adaptive man-agement based on the structure of fish assemblages on northerncontinental shelves. Can. Spec. Publ. Fish. Aquat. Sci. No. 59.pp. 149–156.
Werner, E.E., and Gilliam, J.F. 1984. The ontogenetic niche and spe-cies interactions in size-structured populations. Annu. Rev. Ecol.Syst. 15: 393–425.
Can. J. Fish. Aquat. Sci. Vol. 55, 19981738
© 1998 NRC Canada
F98-065.CHPWed Aug 19 14:56:23 1998
Color profile: DisabledComposite Default screen
Copyright © 2022 FDOKUMEN