Community structure and biogeography of shore fishes in the Gulf of Aqaba, Red Sea
33
Helgol Mar Res (2002) 55:252–284 DOI 10.1007/s10152-001-0090-y Abstract Shore fish community structure off the Jorda- nian Red Sea coast was determined on fringing coral reefs and in a seagrass-dominated bay at 6 m and 12 m depths. A total of 198 fish species belonging to 121 gen- era and 43 families was recorded. Labridae and Poma- centridae dominated the ichthyofauna in terms of species richness and Pomacentridae were most abundant. Nei- ther diversity nor species richness was correlated to depth. The abundance of fishes was higher at the deep reef slope, due to schooling planktivorous fishes. At 12 m depth abundance of fishes at the seagrass-dominat- ed site was higher than on the coral reefs. Multivariate analysis demonstrated a strong influence on the fish as- semblages by depth and benthic habitat. Fish species richness was positively correlated with hard substrate cover and habitat diversity. Abundance of corallivores was positively linked with live hard coral cover. The as- semblages of fishes were different on the shallow reef slope, deep reef slope and seagrass meadows. An analy- sis of the fish fauna showed that the Gulf of Aqaba har- bours a higher species richness than previously reported. The comparison with fish communities on other reefs around the Arabian Peninsula and Indian Ocean support- ed the recognition of an Arabian subprovince within the Indian Ocean. The affinity of the Arabian Gulf ichthyo- fauna to the Red Sea is not clear. Keywords Community structure · Coral reef · Red Sea · Seagrass meadow · Shore fishes Introduction Coral reefs are one of the most complex marine ecosys- tems in which fish communities reach their highest de- gree of diversity (Harmelin-Vivien 1989). Morphological properties and the geographical region of the coral reef determine the structure of the fish assemblages (Sale 1980; Thresher 1991; Williams 1991). The ichthyofauna of coral reefs can be linked to varying degrees with adja- cent habitats (Parrish 1989) such as seagrass meadows (Ogden 1980; Quinn and Ogden 1984; Roblee and Ziemann 1984; Kochzius 1999), algal beds (Rossier and Kulbicki 2000) and mangroves (Birkeland 1985; Thollot 1992). Although the Red Sea ichthyofauna is taxonomically quite well known compared with other parts of the tropi- cal Indo-Pacific Ocean, the community structure of shore fishes has been less well investigated. To date more than 1,280 fish species are known from the Red Sea (Baranes and Golani 1993; Goren and Dor 1994; Randall 1994; Khalaf et al. 1996). Ichthyological research in the Red Sea dates back more than 200 years to the collections and descriptions of fishes by Peter Forsskål (Klausewitz 1964; Nielsen 1993). Despite a long tradition of taxo- nomic work since then (e.g. Forsskål 1775; Klunzinger 1884), as well as biosociological and ecological studies on certain families, such as damselfish (Pomacentridae) (e.g. Fishelson et al. 1974; Fricke 1977; Ormond et al. 1996) and butterflyfish (Chaetodontidae) (e.g. Bouchon- Navaro 1980; Bouchon-Navaro and Bouchon 1989; Roberts et al. 1992), surprisingly few studies have been published on the general community structure of Red Sea shore fishes (Ben-Tuvia et al. 1983; Rilov and Benayahu 2000). Other investigation deal with fish com- munities on artificial reefs (Rilov and Benayahu 1998; Golani and Diamant 1999) or give species lists for cer- tain areas (Clark et al. 1968; Tortonese 1983). Shallow-water habitats along the Jordanian Red Sea coast are fringing coral reefs and seagrass meadows. The coral reefs of the Jordanian coast have been studied in detail by Mergner and Schuhmacher (Mergner and Communicated by H.-D. Franke M.A. Khalaf ( ✉ ) Marine Science Station, PO Box 195 Aqaba, Jordan e-mail: [email protected] Tel.: +962-3-2015144, Fax: +962-3-2013674 M. Kochzius ( ✉ ) Centre for Tropical Marine Ecology (ZMT), Fahrenheitstrasse 6, 28359 Bremen, Germany e-mail: [email protected] Tel.: +49-421-2380057, Fax: +49-421-2380030 ORIGINAL ARTICLE Maroof A. Khalaf · Marc Kochzius Community structure and biogeography of shore fishes in the Gulf of Aqaba, Red Sea Received: 2 April 2001 / Received in revised form: 2 November 2001 / Accepted: 2 November 2001 / Published online: 24 January 2002 © Springer-Verlag and AWI 2002
Transcript of Community structure and biogeography of shore fishes in the Gulf of Aqaba, Red Sea

Helgol Mar Res (2002) 55:252–284DOI 10.1007/s10152-001-0090-y
Abstract Shore fish community structure off the Jorda-nian Red Sea coast was determined on fringing coralreefs and in a seagrass-dominated bay at 6 m and 12 mdepths. A total of 198 fish species belonging to 121 gen-era and 43 families was recorded. Labridae and Poma-centridae dominated the ichthyofauna in terms of speciesrichness and Pomacentridae were most abundant. Nei-ther diversity nor species richness was correlated todepth. The abundance of fishes was higher at the deepreef slope, due to schooling planktivorous fishes. At12 m depth abundance of fishes at the seagrass-dominat-ed site was higher than on the coral reefs. Multivariateanalysis demonstrated a strong influence on the fish as-semblages by depth and benthic habitat. Fish speciesrichness was positively correlated with hard substratecover and habitat diversity. Abundance of corallivoreswas positively linked with live hard coral cover. The as-semblages of fishes were different on the shallow reefslope, deep reef slope and seagrass meadows. An analy-sis of the fish fauna showed that the Gulf of Aqaba har-bours a higher species richness than previously reported.The comparison with fish communities on other reefsaround the Arabian Peninsula and Indian Ocean support-ed the recognition of an Arabian subprovince within theIndian Ocean. The affinity of the Arabian Gulf ichthyo-fauna to the Red Sea is not clear.
Keywords Community structure · Coral reef · Red Sea ·Seagrass meadow · Shore fishes
Introduction
Coral reefs are one of the most complex marine ecosys-tems in which fish communities reach their highest de-gree of diversity (Harmelin-Vivien 1989). Morphologicalproperties and the geographical region of the coral reefdetermine the structure of the fish assemblages (Sale1980; Thresher 1991; Williams 1991). The ichthyofaunaof coral reefs can be linked to varying degrees with adja-cent habitats (Parrish 1989) such as seagrass meadows(Ogden 1980; Quinn and Ogden 1984; Roblee and Ziemann 1984; Kochzius 1999), algal beds (Rossier andKulbicki 2000) and mangroves (Birkeland 1985; Thollot1992).
Although the Red Sea ichthyofauna is taxonomicallyquite well known compared with other parts of the tropi-cal Indo-Pacific Ocean, the community structure of shorefishes has been less well investigated. To date more than1,280 fish species are known from the Red Sea (Baranesand Golani 1993; Goren and Dor 1994; Randall 1994;Khalaf et al. 1996). Ichthyological research in the RedSea dates back more than 200 years to the collectionsand descriptions of fishes by Peter Forsskål (Klausewitz1964; Nielsen 1993). Despite a long tradition of taxo-nomic work since then (e.g. Forsskål 1775; Klunzinger1884), as well as biosociological and ecological studieson certain families, such as damselfish (Pomacentridae)(e.g. Fishelson et al. 1974; Fricke 1977; Ormond et al.1996) and butterflyfish (Chaetodontidae) (e.g. Bouchon-Navaro 1980; Bouchon-Navaro and Bouchon 1989; Roberts et al. 1992), surprisingly few studies have beenpublished on the general community structure of RedSea shore fishes (Ben-Tuvia et al. 1983; Rilov and Benayahu 2000). Other investigation deal with fish com-munities on artificial reefs (Rilov and Benayahu 1998;Golani and Diamant 1999) or give species lists for cer-tain areas (Clark et al. 1968; Tortonese 1983).
Shallow-water habitats along the Jordanian Red Seacoast are fringing coral reefs and seagrass meadows. Thecoral reefs of the Jordanian coast have been studied indetail by Mergner and Schuhmacher (Mergner and
Communicated by H.-D. Franke
M.A. Khalaf (✉ )Marine Science Station, PO Box 195 Aqaba, Jordane-mail: [email protected].: +962-3-2015144, Fax: +962-3-2013674
M. Kochzius (✉ )Centre for Tropical Marine Ecology (ZMT), Fahrenheitstrasse 6,28359 Bremen, Germanye-mail: [email protected].: +49-421-2380057, Fax: +49-421-2380030
O R I G I N A L A RT I C L E
Maroof A. Khalaf · Marc Kochzius
Community structure and biogeography of shore fishes in the Gulf of Aqaba, Red Sea
Received: 2 April 2001 / Received in revised form: 2 November 2001 / Accepted: 2 November 2001 / Published online: 24 January 2002© Springer-Verlag and AWI 2002

253
Schuhmacher 1974, 1981; Mergner 1979, 2001). Severalstudies on the autecology (e.g. Harmelin-Vivien andBouchon-Navaro 1981; Wahbeh and Ajiad 1985a, b) andpopulation ecology (e.g. Bouchon-Navaro and Harmelin-Vivien 1981; Bouchon-Navaro 1986) of fishes were con-ducted along the Jordanian coastline of the Gulf of Aqaba, but no study using a synecological approach hasbeen conducted to date.
Coral reefs are under threat on a global scale (Bryantet al. 1998; Hoeg-Guldberg 1999; Souter and Lindén2000) and under high human impact in the Gulf of Aqaba, because of pollution (Walker and Ormond 1982;Abu-Hilal 1987; Abu-Hilal and Badran 1990; Abelson etal. 1999), shipping and port activities (Abu-Hilal 1985;Badran and Foster 1998), and tourism (Riegl and Velimi-rov 1991; Hawkins and Roberts 1994).
Detailed ecological information on reef organisms isneeded for conservation and for proper management ofcoral reef ecosystems. This study investigates for thefirst time the fish communities of shallow-water habitatsalong the Jordanian coast to obtain ecological informa-tion to facilitate a proper management of the Red SeaMarine Peace Park and adjacent waters of the Jordaniancoast. The main objectives of the study are: (1) to inves-tigate the community structure of fishes on coral reefsand seagrass meadows, (2) to reveal the ecological pa-rameters which influence the community structure, (3) todetect general features of fish communities on coralreefs, (4) to describe the biodiversity of the ichthyofau-na, and (5) to assign the biogeographic affinity of theshore fishes in the Gulf of Aqaba.
Methods
Study area
This study was conducted at five coral reefs (sites 1–3, 5, 6) andone seagrass meadow (site 4) along the 27 km Jordanian coast,Gulf of Aqaba, Red Sea (Fig. 1). Fringing reefs are discontinuous-ly distributed over a length of 13 km along the coast, separated bybays that are usually covered by seagrass meadows (UNEP/IUCN1988). Studies of a 25 m2 quadrat on the reef slope in the reserveat the Marine Science Station (Fig. 1) recorded 78 scleractiniancoral species (Mergner and Schuhmacher 1981). Reef morphologyand zonation is described in detail by Mergner and Schuhmacher(1974). The largest seagrass meadow along the coast is located atAl-Mamlah Bay (site 4) (UNEP/IUCN 1988). The meadows arecomposed of the seagrass species Halophilia ovalis, Halophiliastipulacea and Halodule universis, which is the dominant speciesat Al-Mamlah Bay (Wahbeh 1981).
Visual census
The fish communities in shallow-water habitats (fringing coralreef and seagrass meadow) along the Jordanian Red Sea coastwere surveyed by the visual census technique using SCUBA asdescribed by English et al. (1994). Transects of 50 m length and5 m width (250 m2) were marked at the study sites (Fig. 1). Ateach site visual censuses were conducted along three transects atthe shallow slope (6 m) and deep slope (12 m), respectively. Thedistance between the transects at each site was 10–20 m. The ob-server waited 5–10 min after laying the transect line to allow fish-
es to resume their normal behaviour. Subsequently the diver swamalong the transect and recorded all fishes encountered 2.5 m oneach site of the line and 5 m above the transect. All observed fish-es of 30 mm total length or longer were identified by the first au-thor (M.A. Khalaf) and recorded on a plastic slate. The durationfor the count of each transect was 50–60 min. At five sites (Cement Jetty, Marine Science Station, Tourist Camp, Jordan Fer-tiliser Industries and Jordan Fertiliser Industries Jetty) three cen-suses were conducted at each depth in November 1999 and March2000. At Al-Mamlah Bay 39 censuses were conducted at 6 m and43 censuses at 12 m depth in 1997 and 1998 (Table 1). The surveyof the benthic habitat at each visual census transect was conductedby the line-intercept method, recording percentage cover of livehard coral, live soft coral, dead coral and rock, sand, and seagrass(English et al. 1994).
Statistical analysis
Abundance of fishes was described by relative abundance (RA)and frequency of appearance (FA), calculated as follows: RA =(the pooled average abundance of species i from each depth andsite/the pooled average abundance of all species from each depthand site) × 100 and FA = (number of transects in which species iwas present/total number of all transects) × 100. Calculation ofRA with average values was necessary to prevent over-valuationof Al-Mamlah Bay.
Community indices such as fish abundance, species richness(number of species) and Shannon-Wiener diversity (H′; ln basis)were compared among sites and depths using one-way ANOVA.
Fig. 1 Map of the Gulf of Aqaba with study sites on the Jordaniancoast (inset): 1 Cement jetty (29°28.990′ N; 34°59.010′ E), 2 Ma-rine Science Station (29°27.250′ N; 34°58.359′ E), 3 TouristCamp (29°26.351′ N; 34°58.272′ E), 4 Al-Mamlah Bay(29°24.345′ N; 34°549′ E), 5 and 6 Jordan Fertiliser Industries andJordan Fertiliser Industries jetty (29°22.134′ N; 34°57.667′ E)

254
Homogeneity of variances was tested with the F-test and if neces-sary, data were log(1+x) transformed to obtain homogeneity ofvariances. If transformation of the data did not lead to homogene-ity of variances, no statistical test was conducted. F-tests wereperformed with a spreadsheet analysis program and one-way ANOVA was carried out using STATISTICA 5.1 (StatSoft 1997).
Regression analysis (power and linear regression) was per-formed with a spreadsheet analysis program and the significancelevel of the correlation was obtained from statistical tables aftercalculating the empirical F-value with the following formula:Femp=(r2–J)/((1–r2)/K–J–1)); where r2 = coefficient of determina-tion; J = number of regressors; K = sample size (Backhaus et al.1994).
Multivariate analysis of the data such as cluster analysis, MDS(multi-dimensional scaling), RELATE, BIO-ENV, as well as theANOSIM (analysis of similarities) significance test were per-formed using PRIMER-5 software (Primer-E 2000). Hierarchicalclustering and MDS was based on Bray-Curtis similarities ofabundance data. Highly abundant species, in contrast to specieswith very low abundance, can disturb the analysis. Therefore, ifnecessary, data were transformed and standardised as indicated inthe figures. MDS is a 3-dimensional ordination of samplesbrought down to a 2-dimensional plot. The quality of the MDSplot is indicated by the stress value. Values <0.2 give a potentiallyuseful 2-dimensional picture, stress <0.1 corresponds to a good or-dination and stress <0.05 gives an excellent representation.
The ANOSIM significance test compares similarities of spe-cies compositions between the samples and can give evidence fordifferences. A one-way layout of ANOSIM was performed withthe original data; no transformation or standardisation was con-ducted. Two terms are important in an ANOSIM significance test:P (significance level) and Global R. Global R indicates the degreeof similarity between the tested groups with values between –1and 1. If all replicates within sites are more similar to each otherthan any replicate from different sites, the value of R is 1. Valuesclose to zero indicate that the similarity between sites is very high,showing a low difference between them (Clarke and Warwick1994).
A BIO-ENV analysis was performed with PRIMER-5; thiscorrelates environmental variables to the multivariate analysis ofthe fish community based on a weighted Spearman rank correla-
tion. RELATE compares the multivariate analysis of the fish com-munity to the benthic habitat and reveals the degree of correlationbetween the two data sets (Clarke and Warwick 1994).
A biogeographic comparison was performed on the basis ofspecies lists from 21 sites in the Red Sea (Vine and Vine 1980;Krupp et al. 1993; Schraut 1995; Rilov and Benayahu 2000; W.Gladstone, unpublished report; M.A. Khalaf and F. Krupp, unpub-lished data; U. Zajonz et al., unpublished report), the Arabian Gulf(Coles and Tarr 1990; Krupp et al. 1994; Krupp and Almarri 1996;Carpenter et al. 1997), the Gulf of Aden (Kemp 1998, 2000),Oman (Randall 1995) and the Indian Ocean (Smith and Heemstra1991; Randall and Anderson 1993; Letourneur 1996; Pittman1996; Öhman et al. 1997; Winterbottom and Anderson 1997; Anderson et al. 1998; Kunzmann et al. 1999). Presence/absencedata for 712 species from the following families were consideredfor the biogeographic comparison: Acanthuridae, Balistidae, Caes-ionidae, Chaetodontidae, Haemulidae, Labridae, Lethrinidae, Lut-janidae, Nemipteridae, Pomacanthidae, Pomacentridae, Scaridae,Serranidae and Siganidae. All species names were checked forsynonyms with FishBase 99 (FishBase 1999) to prevent doublecounts of species. Multivariate statistics for the biogeographicanalysis was based on Bray-Curtis similarity and Euclidean dis-tance.
Results
Benthic habitat
Along the Jordanian Red Sea coast the highest live coralcover was 35% and the average 19%. Five of the studysites were coral reefs, whereas Al-Mamlah Bay wasdominated by seagrasses (59% cover). At all coral reefsdead coral and rock as well as sand made up most of thecover (Table 2).
Table 1 Sampling at sites along the Jordanian Red Sea coast, Gulf of Aqaba
Site n 6 m depth n 12 m depth
Cement Jetty 3 November 1999 3 November 1999Marine Science Station (MSS) 3 November 1999 3 November 1999Tourist Camp 3 November 1999 3 November 1999Al-Mamlah Bay 39 April 1997–August 1999 43 April 1997–August 1999Jordan Fertilizer Industries (JFI) 3 April 2000 3 April 2000Jordan Fertilizer Industries Jetty (JFI Jetty) 3 April 2000 3 March 2000
Table 2 Benthic habitat at sites along the Jordanian Red Sea coast, Gulf of Aqaba. Average percentage of cover at the study sites
Site Average percentage
Live stony Live soft Dead coral Seagrass Sandcoral coral and rock
Cement Jetty 17 7 26 0 50 Coral reefMarine Science Station 22 3 30 0 45 Coral reefTourist Camp 23 6 47 0 24 Coral reefAl-Mamlah Bay 3 3 8 59 27 Seagrass
meadowJordan Fertilizer Industries 22 4 21 0 53 Coral reefJordan Fertilizer Industries Jetty 13 5 25 0 57 Coral reef
255
Fish assemblages and community indices
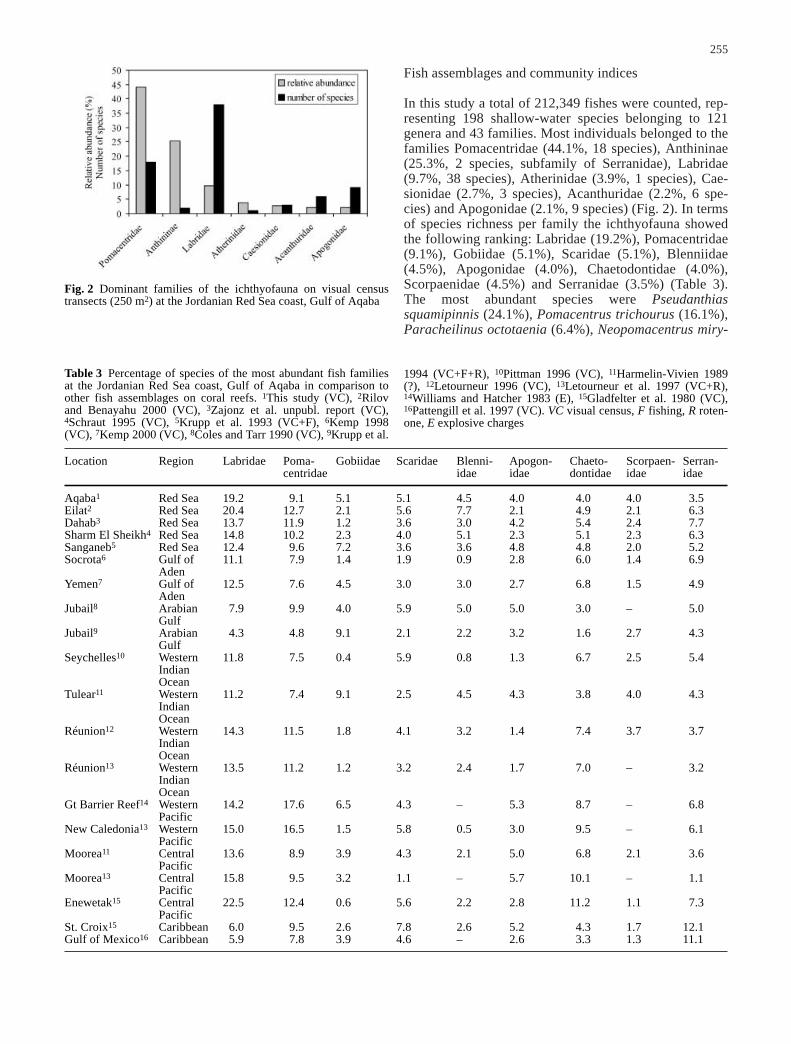
In this study a total of 212,349 fishes were counted, rep-resenting 198 shallow-water species belonging to 121genera and 43 families. Most individuals belonged to thefamilies Pomacentridae (44.1%, 18 species), Anthininae(25.3%, 2 species, subfamily of Serranidae), Labridae(9.7%, 38 species), Atherinidae (3.9%, 1 species), Cae-sionidae (2.7%, 3 species), Acanthuridae (2.2%, 6 spe-cies) and Apogonidae (2.1%, 9 species) (Fig. 2). In termsof species richness per family the ichthyofauna showedthe following ranking: Labridae (19.2%), Pomacentridae(9.1%), Gobiidae (5.1%), Scaridae (5.1%), Blenniidae(4.5%), Apogonidae (4.0%), Chaetodontidae (4.0%),Scorpaenidae (4.5%) and Serranidae (3.5%) (Table 3).The most abundant species were Pseudanthiassquamipinnis (24.1%), Pomacentrus trichourus (16.1%),Paracheilinus octotaenia (6.4%), Neopomacentrus miry-
Fig. 2 Dominant families of the ichthyofauna on visual censustransects (250 m2) at the Jordanian Red Sea coast, Gulf of Aqaba
Table 3 Percentage of species of the most abundant fish familiesat the Jordanian Red Sea coast, Gulf of Aqaba in comparison toother fish assemblages on coral reefs. 1This study (VC), 2Rilovand Benayahu 2000 (VC), 3Zajonz et al. unpubl. report (VC),4Schraut 1995 (VC), 5Krupp et al. 1993 (VC+F), 6Kemp 1998(VC), 7Kemp 2000 (VC), 8Coles and Tarr 1990 (VC), 9Krupp et al.
1994 (VC+F+R), 10Pittman 1996 (VC), 11Harmelin-Vivien 1989(?), 12Letourneur 1996 (VC), 13Letourneur et al. 1997 (VC+R),14Williams and Hatcher 1983 (E), 15Gladfelter et al. 1980 (VC),16Pattengill et al. 1997 (VC). VC visual census, F fishing, R roten-one, E explosive charges
Location Region Labridae Poma- Gobiidae Scaridae Blenni- Apogon- Chaeto- Scorpaen- Serran-centridae idae idae dontidae idae idae
Aqaba1 Red Sea 19.2 9.1 5.1 5.1 4.5 4.0 4.0 4.0 3.5Eilat2 Red Sea 20.4 12.7 2.1 5.6 7.7 2.1 4.9 2.1 6.3Dahab3 Red Sea 13.7 11.9 1.2 3.6 3.0 4.2 5.4 2.4 7.7Sharm El Sheikh4 Red Sea 14.8 10.2 2.3 4.0 5.1 2.3 5.1 2.3 6.3Sanganeb5 Red Sea 12.4 9.6 7.2 3.6 3.6 4.8 4.8 2.0 5.2Socrota6 Gulf of 11.1 7.9 1.4 1.9 0.9 2.8 6.0 1.4 6.9
AdenYemen7 Gulf of 12.5 7.6 4.5 3.0 3.0 2.7 6.8 1.5 4.9
AdenJubail8 Arabian 7.9 9.9 4.0 5.9 5.0 5.0 3.0 – 5.0
GulfJubail9 Arabian 4.3 4.8 9.1 2.1 2.2 3.2 1.6 2.7 4.3
GulfSeychelles10 Western 11.8 7.5 0.4 5.9 0.8 1.3 6.7 2.5 5.4
Indian Ocean
Tulear11 Western 11.2 7.4 9.1 2.5 4.5 4.3 3.8 4.0 4.3Indian Ocean
Réunion12 Western 14.3 11.5 1.8 4.1 3.2 1.4 7.4 3.7 3.7Indian Ocean
Réunion13 Western 13.5 11.2 1.2 3.2 2.4 1.7 7.0 – 3.2Indian Ocean
Gt Barrier Reef14 Western 14.2 17.6 6.5 4.3 – 5.3 8.7 – 6.8Pacific
New Caledonia13 Western 15.0 16.5 1.5 5.8 0.5 3.0 9.5 – 6.1Pacific
Moorea11 Central 13.6 8.9 3.9 4.3 2.1 5.0 6.8 2.1 3.6Pacific
Moorea13 Central 15.8 9.5 3.2 1.1 – 5.7 10.1 – 1.1Pacific
Enewetak15 Central 22.5 12.4 0.6 5.6 2.2 2.8 11.2 1.1 7.3Pacific
St. Croix15 Caribbean 6.0 9.5 2.6 7.8 2.6 5.2 4.3 1.7 12.1Gulf of Mexico16 Caribbean 5.9 7.8 3.9 4.6 – 2.6 3.3 1.3 11.1

256
Tab
le4
Ave
rage
fis
h ab
unda
nce
(AA
) an
d re
lati
ve a
bund
ance
(R
A)
per
tran
sect
(25
0m
2 ) a
t si
tes
alon
g th
e Jo
rdan
ian
Red
Sea
coa
st, G
ulf
of A
qaba
. Nom
encl
atur
e ac
cord
ing
to F
ish-
Bas
e 99
(F
ishB
ase
1999
)
Cem
ent J
etty
Mar
ine
Sci
ence
Sta
tion
Tour
ist C
amp
Al-
Mam
lah
Bay
Jord
an F
erti
lize
r Jo
rdan
Fer
tili
zer
Indu
stri
esIn
dust
ries
Jet
ty
Dep
th6
m12
m6
m12
m6
m12
m6
m12
m6
m12
m6
m12
mT
otal
AA
RA
AA
RA
AA
RA
AA
RA
AA
RA
AA
RA
AA
RA
AA
RA
AA
RA
AA
RA
AA
RA
AA
RA
RA
FA
Tor
pedi
nida
e<0
.01
Torp
edo
0.03
<0.
010.
02<
0.01
<0.
011.
69pa
nthe
raO
lfer
s, 1
831
Mur
aeni
dae
0.02
Gym
noth
orax
0.
330.
050.
330.
020.
09<
0.01
<0.
015.
08nu
divo
mer
(G
ünth
er, 1
867)
Side
rea
sp.
0.05
0.01
<0.
011.
69Si
dere
a gr
isea
0.13
0.01
1.84
0.05
0.33
0.07
0.02
25.4
2(L
acep
ède,
180
3)
Syno
dont
idae
0.11
Saur
ida
grac
ilis
1.
000.
160.
330.
020.
080.
011.
530.
050.
330.
070.
0229
.66
(Quo
y an
d G
aim
ard,
182
4)Sy
nodu
ssp
.0.
330.
02<
0.01
0.85
Syno
dus
0.67
0.11
0.67
0.03
1.33
0.20
3.33
0.16
1.33
0.16
4.79
0.14
0.33
0.07
0.67
0.07
0.09
56.7
8va
rieg
atus
(Lac
epèd
e, 1
803)
Ath
erin
idae
3.88
Ath
erin
omor
us
256.
429
.94
333.
334
.44
3.88
2.54
lacu
nosu
s(F
orst
er, 1
801)
Hol
ocen
trid
ae0.
76M
yrip
rist
is
1.00
0.14
1.67
0.08
3.00
0.45
2.67
0.13
0.19
0.01
2.00
0.42
4.00
0.53
0.33
0.03
0.10
13.5
6m
urdj
an(F
orss
kål,
1775
)N
eoni
phon
0.
080.
010.
950.
030.
0117
.80
sam
mar
a(F
orss
kål,
1775
)Sa
rgoc
entr
on
0.33
0.05
0.67
0.03
0.01
4.24
caud
imac
ulat
um
(Rüp
pell
, 183
8)Sa
rgoc
entr
on
2.33
0.38
2.67
0.13
1.67
0.24
2.67
0.13
2.00
0.30
1.00
0.05
0.10
0.01
71.2
62.
101.
670.
354.
330.
582.
330.
247.
001.
430.
6554
.24
diad
ema
(Lac
epèd
e, 1
802)

257
Fis
tula
riid
ae0.
07
Fis
tula
ria
0.67
0.10
0.67
0.03
2.95
0.34
2.44
0.07
3.33
0.34
0.07
16.9
5co
mm
erso
nii
Rüp
pell
, 183
8
Cen
tris
cida
e0.
01
Aeo
lisc
us
0.41
0.05
1.49
0.04
0.01
7.63
punc
tula
tus
(Bia
ncon
i, 18
55/5
9)
Syng
nath
idae
0.26
Cor
ytho
icht
hys
0.33
0.02
0.62
0.07
1.30
0.04
3.67
0.38
0.04
14.4
1fl
avof
asci
atus
(Rüp
pell
, 183
8)C
oryt
hoic
hthy
s 0.
330.
05<
0.01
0.85
nigr
ipec
tus
Her
ald,
195
3C
oryt
hoic
hthy
s 7.
001.
151.
000.
051.
330.
065.
330.
795.
000.
241.
260.
153.
490.
101.
000.
211.
670.
221.
000.
200.
1833
.90
schu
ltzi
Her
ald,
195
3Tr
achy
rham
phus
0.
330.
051.
000.
050.
970.
111.
630.
050.
670.
140.
0326
.27
bico
arct
atus
(B
leek
er, 1
857)
Scor
paen
idae
0.16
Den
droc
hiru
s 1.
380.
160.
810.
020.
0127
.97
brac
hypt
erus
(C
uvie
r, 18
29)
Inim
icus
0.
150.
020.
14<
0.01
<0.
016.
78fi
lam
ento
sus
(Cuv
ier,
1829
)P
tero
is m
iles
1.00
0.14
1.00
0.05
1.00
0.15
0.33
0.02
0.74
0.09
7.02
0.21
0.67
0.14
2.33
0.31
1.00
0.10
0.33
0.07
0.10
46.6
1(B
enne
tt, 1
828)
Pte
rois
rad
iata
0.33
0.05
0.33
0.02
0.03
<0.
010.
580.
021.
330.
180.
670.
071.
670.
340.
0319
.49
Cuv
ier,
1829
Scor
paen
idae
0.13
0.01
0.81
0.02
0.01
16.1
0
Scor
paen
opsi
s 0.
02<
0.01
<0.
010.
85ba
rbat
a(R
üppe
ll, 1
838)
Tab
le4
cont
inue
d Cem
ent J
etty
Mar
ine
Sci
ence
Sta
tion
Tour
ist C
amp
Al-
Mam
lah
Bay
Jord
an F
erti
lize
r Jo
rdan
Fer
tili
zer
Indu
stri
esIn
dust
ries
Jet
ty
Dep
th6
m12
m6
m12
m6
m12
m6
m12
m6
m12
m6
m12
mT
otal
AA
RA
AA
RA
AA
RA
AA
RA
AA
RA
AA
RA
AA
RA
AA
RA
AA
RA
AA
RA
AA
RA
AA
RA
RA
FA

258
Scor
paen
opsi
ssp
.0.
330.
02<
0.01
0.85
Syna
ncei
a 0.
02<
0.01
<0.
010.
85ve
rruc
osa
Blo
ch a
nd
Sch
neid
er, 1
801
Serr
anid
ae25
.47
Ant
hias
taen
iatu
s18
3.3
8.71
1.21
4.24
Klu
nzin
ger,
1884
Cep
halo
phol
is
0.67
0.03
0.67
0.03
0.33
0.04
0.01
5.08
hem
isti
ktos
(Rüp
pell
, 183
0)C
epha
loph
olis
0.
07<
0.01
0.33
0.07
0.33
0.07
<0.
015.
08m
inia
ta(F
orss
kål,
1775
)E
pine
phel
us
2.33
0.38
1.00
0.05
1.67
0.24
0.67
0.03
3.00
0.45
2.00
0.09
0.87
0.10
2.91
0.09
1.33
0.28
1.33
0.18
1.33
0.14
1.00
0.20
0.13
61.8
6fa
scia
tus
(For
sskå
l, 17
75)
Gra
mm
iste
s 0.
330.
050.
16<
0.01
0.33
0.04
0.01
6.78
sexl
inea
tus
(Thu
nber
g, 1
792)
Pse
udan
thia
s 12
1.6
19.9
896
6.67
46.3
911
0.0
15.8
028
3.3
13.4
732
.33
4.80
195.
09.
2215
8.97
18.5
615
66.5
46.1
121
.67
4.59
81.6
710
.89
41.6
74.
3080
.00
16.3
24.0
579
.66
squa
mip
inni
s(P
eter
s, 1
855)
Vari
ola
lout
i0.
670.
111.
000.
052.
670.
130.
670.
101.
670.
080.
14<
0.01
0.33
0.07
2.00
0.27
0.33
0.07
0.06
18.6
4(F
orss
kål,
1775
)
Pse
udoc
hrom
idae
0.41
Pse
udoc
hrom
is
0.33
0.02
0.05
<0.
010.
330.
070.
330.
040.
330.
070.
015.
93fl
aviv
erte
xR
üppe
ll, 1
835
Pse
udoc
hrom
is
0.67
0.11
3.67
0.18
8.33
0.40
16.6
72.
485.
330.
250.
210.
026.
770.
201.
000.
211.
670.
221.
670.
170.
670.
140.
3153
.39
frid
man
i K
laus
ewit
z, 1
968
Pse
udoc
hrom
is
0.33
0.05
0.33
0.02
1.00
0.05
0.05
0.01
0.74
0.02
0.02
22.8
8ol
ivac
eus
Rüp
pell
, 183
5P
seud
ochr
omis
0.
670.
110.
670.
030.
670.
101.
330.
060.
670.
102.
670.
130.
080.
013.
790.
110.
330.
040.
330.
030.
0744
.07
spri
nger
iL
ubbo
ck, 1
975
Tab
le4
cont
inue
d Cem
ent J
etty
Mar
ine
Sci
ence
Sta
tion
Tour
ist C
amp
Al-
Mam
lah
Bay
Jord
an F
erti
lize
r Jo
rdan
Fer
tili
zer
Indu
stri
esIn
dust
ries
Jet
ty
Dep
th6
m12
m6
m12
m6
m12
m6
m12
m6
m12
m6
m12
mT
otal
AA
RA
AA
RA
AA
RA
AA
RA
AA
RA
AA
RA
AA
RA
AA
RA
AA
RA
AA
RA
AA
RA
AA
RA
RA
FA
259
Pri
acan
thid
ae0.
01P
riac
anth
us
1.74
0.05
0.01
1.69
ham
rur
(For
sskå
l, 17
75)
Apo
goni
dae
2.14
Apo
gon
aure
us16
.23
0.48
0.11
19.4
9(L
acep
ède,
180
2)A
pogo
n 3.
330.
1610
.92
1.28
91.6
72.
701.
000.
130.
7034
.75
cyan
osom
aB
leek
er, 1
853
Apo
gon
0.03
<0.
011.
740.
050.
016.
78ex
osti
gma
(Jor
dan
and
Sta
rks,
190
6)A
pogo
n 0.
280.
01<
0.01
5.08
frae
natu
sV
alen
cien
nes,
183
2A
pogo
n 0.
230.
01<
0.01
5.93
nigr
ofas
ciat
usL
achn
er, 1
953
Apo
gon
sp.
0.33
0.05
0.05
0.01
<0.
011.
69C
heil
odip
teru
s 1.
000.
143.
150.
3714
3.98
4.24
0.33
0.07
0.67
0.07
0.98
31.3
6la
chne
ri
Kla
usew
itz,
195
9C
heil
odip
teru
s 1.
330.
191.
000.
058.
260.
240.
330.
070.
330.
030.
670.
140.
0828
.81
mac
rodo
n (L
acep
ède,
180
2)C
heil
odip
teru
s 0.
670.
111.
330.
200.
330.
0433
.72
0.99
2.00
0.21
0.25
36.4
4no
vem
stri
atus
(R
üppe
ll, 1
838)
Car
angi
dae
0.35
Car
ango
ides
0.
03<
0.01
<0.
010.
85fu
lvog
utta
tus
(For
sskå
l, 17
75)
Dec
apte
rus
6.41
0.75
46.5
11.
370.
353.
39m
acro
som
aB
leek
er, 1
851
Gna
than
odon
0.
02<
0.01
<0.
010.
85sp
ecio
sus
(For
sskå
l, 17
75)
Tab
le4
cont
inue
d Cem
ent J
etty
Mar
ine
Sci
ence
Sta
tion
Tour
ist C
amp
Al-
Mam
lah
Bay
Jord
an F
erti
lize
r Jo
rdan
Fer
tili
zer
Indu
stri
esIn
dust
ries
Jet
ty
Dep
th6
m12
m6
m12
m6
m12
m6
m12
m6
m12
m6
m12
mT
otal
AA
RA
AA
RA
AA
RA
AA
RA
AA
RA
AA
RA
AA
RA
AA
RA
AA
RA
AA
RA
AA
RA
AA
RA
RA
FA

260
Cae
sion
idae
2.65
Cae
sio
luna
ris
61.2
87.
1610
4.4
3.07
0.33
0.03
3.33
0.68
1.11
16.9
5C
uvie
r, 18
30C
aesi
o su
evic
us0.
670.
0353
.85
6.29
11.6
30.
3416
.67
3.53
25.0
03.
3326
.67
2.75
0.88
10.1
7K
lunz
inge
r, 18
84C
aesi
o 0.
670.
0310
.00
1.49
32.0
53.
7452
.79
1.55
3.33
0.71
0.65
14.4
1va
rili
neat
aC
arpe
nter
, 198
7
Nem
ipte
rida
e0.
04Sc
olop
sis
ghan
am0.
620.
071.
530.
051.
000.
102.
330.
480.
0428
.81
(For
sskå
l, 17
75)
Ger
reid
ae<0
.01
Ger
res
oyen
a0.
130.
01<
0.01
0.85
(For
sskå
l, 17
75)
Hae
mul
idae
<0.0
1D
iagr
amm
a 0.
12<
0.01
<0.
011.
69pi
ctum
(Thu
nber
g, 1
792)
Let
hrin
idae
0.08
Let
hrin
ussp
.0.
050.
016.
510.
190.
0413
.56
Mon
otax
is
0.08
0.01
0.30
0.01
3.33
0.71
1.00
0.10
1.33
0.27
0.04
13.5
6gr
ando
culi
s(F
orss
kål,
1775
)
Spar
idae
0.01
Dip
lodu
s no
ct0.
770.
090.
230.
010.
012.
54(V
alen
cien
nes,
18
30)
Mul
lidae
0.78
Mul
loid
icht
hys
10.0
00.
480.
670.
101.
280.
150.
083.
39fl
avol
inea
tus
(Lac
epèd
e, 1
801)
Par
upen
eus
0.33
0.05
0.33
0.05
0.33
0.02
0.67
0.02
0.01
15.2
5cy
clos
tom
us
(Lac
epèd
e, 1
801)
Tab
le4
cont
inue
d Cem
ent J
etty
Mar
ine
Sci
ence
Sta
tion
Tour
ist C
amp
Al-
Mam
lah
Bay
Jord
an F
erti
lize
r Jo
rdan
Fer
tili
zer
Indu
stri
esIn
dust
ries
Jet
ty
Dep
th6
m12
m6
m12
m6
m12
m6
m12
m6
m12
m6
m12
mT
otal
AA
RA
AA
RA
AA
RA
AA
RA
AA
RA
AA
RA
AA
RA
AA
RA
AA
RA
AA
RA
AA
RA
AA
RA
RA
FA

261
Par
upen
eus
0.67
0.11
1.00
0.05
2.00
0.10
0.33
0.05
1.00
0.05
1.82
0.21
16.7
40.
492.
330.
491.
670.
221.
000.
101.
670.
340.
2062
.71
fors
skal
i (F
ourm
anoi
r an
d G
uézé
, 197
6)P
arup
eneu
s 1.
000.
160.
670.
031.
000.
050.
330.
050.
670.
033.
000.
3559
.81
1.76
1.33
0.28
0.67
0.09
0.45
53.3
9m
acro
nem
a (L
acep
ède,
180
1)P
arup
eneu
s 5.
790.
170.
0412
.71
rube
scen
s(L
acep
ède,
180
1)
Pem
pher
idae
<0.0
1P
emph
eris
0.
080.
01<
0.01
0.85
vani
cole
nsis
Cuv
ier,
1831
Cha
etod
onti
dae
1.89
Cha
etod
on
0.33
0.05
0.67
0.03
0.05
0.01
0.28
0.01
0.33
0.07
2.00
0.27
1.33
0.14
0.03
14.4
1au
riga
For
sskå
l, 17
75C
haet
odon
4.
000.
664.
330.
213.
000.
434.
000.
196.
670.
998.
000.
380.
230.
030.
400.
016.
671.
4112
.33
1.65
7.00
0.72
3.00
0.61
0.39
39.8
3au
stri
acus
Rüp
pell
, 183
6C
haet
odon
0.
330.
050.
670.
031.
330.
191.
330.
060.
670.
100.
180.
020.
350.
010.
670.
140.
670.
092.
330.
241.
000.
200.
0622
.03
fasc
iatu
sF
orss
kål,
1775
Cha
etod
on
0.05
0.01
0.26
0.01
6.67
0.89
0.33
0.03
0.05
7.63
mel
anno
tus
Blo
ch a
nd
Sch
neid
er, 1
801
Cha
etod
on
9.33
1.53
10.0
00.
4812
.00
1.72
15.6
70.
7412
.00
1.78
21.6
71.
022.
510.
298.
090.
2411
.00
2.33
11.0
01.
475.
330.
552.
330.
480.
7972
.88
pauc
ifas
ciat
usA
hl, 1
923
Cha
etod
on
1.67
0.35
1.33
0.18
1.33
0.14
0.33
0.07
0.03
5.93
trif
asci
alis
Q
uoy
and
Gai
mar
d, 1
825
Hen
ioch
us
5.51
0.64
51.4
41.
511.
670.
220.
3912
.71
diph
reut
esJo
rdan
, 190
3H
enio
chus
2.
000.
331.
670.
082.
000.
291.
000.
150.
280.
013.
330.
717.
330.
981.
670.
173.
000.
610.
1525
.42
inte
rmed
ius
Ste
inda
chne
r, 18
93
Tab
le4
cont
inue
d Cem
ent J
etty
Mar
ine
Sci
ence
Sta
tion
Tour
ist C
amp
Al-
Mam
lah
Bay
Jord
an F
erti
lize
r Jo
rdan
Fer
tili
zer
Indu
stri
esIn
dust
ries
Jet
ty
Dep
th6
m12
m6
m12
m6
m12
m6
m12
m6
m12
m6
m12
mT
otal
AA
RA
AA
RA
AA
RA
AA
RA
AA
RA
AA
RA
AA
RA
AA
RA
AA
RA
AA
RA
AA
RA
AA
RA
RA
FA

262
Pom
acan
thid
ae0.
55A
pole
mic
hthy
s 0.
03<
0.01
0.14
<0.
010.
670.
090.
330.
070.
019.
32xa
ntho
tis
(Fra
ser-
Bru
nner
, 19
51)
Cen
trop
yge
2.33
0.38
2.67
0.13
3.33
0.48
5.67
0.27
2.67
0.40
9.00
0.43
0.38
0.04
2.21
0.07
2.67
0.56
3.67
0.49
3.33
0.34
2.67
0.54
0.27
60.1
7m
ulti
spin
is(P
layf
air,
1867
)G
enic
anth
us
1.00
0.16
10.6
70.
5110
.00
0.48
12.6
70.
600.
12<
0.01
0.67
0.09
1.00
0.20
0.24
18.6
4ca
udov
itta
tus
(Gün
ther
, 186
0)P
omac
anth
us
0.33
0.05
0.03
<0.
010.
330.
011.
000.
130.
670.
140.
0217
.80
impe
rato
r(B
loch
, 178
7)P
ygop
lite
s 0.
330.
020.
330.
050.
670.
030.
02<
0.01
1.33
0.18
0.33
0.03
0.67
0.14
0.02
11.0
2di
acan
thus
(Bod
daer
t, 17
72)
Pom
acen
trid
ae44
.11
Abu
defd
uf
2.67
0.38
0.51
0.06
0.81
0.02
0.03
3.39
vaig
iens
is
(Quo
y &
Gai
mar
d,
1825
)A
mbl
ygly
phid
o-3.
670.
606.
330.
3014
.67
2.11
13.3
30.
637.
331.
0912
.67
0.60
20.0
04.
2455
.00
7.34
8.67
0.90
2.33
0.48
0.95
26.2
7do
n fl
avil
atus
All
en a
nd R
anda
ll,
1980
Am
blyg
lyph
ido-
1.00
0.16
1.33
0.06
10.0
01.
4410
.67
1.58
3.67
0.17
0.51
0.06
8.21
0.24
34.6
77.
342.
000.
277.
670.
791.
670.
340.
5338
.98
don
leuc
ogas
ter
(Ble
eker
, 184
7)A
mph
ipri
on
19.0
03.
1218
.00
0.86
11.6
71.
6815
.67
0.74
19.0
02.
8216
.00
0.76
2.77
0.32
9.47
0.28
13.0
02.
7512
.33
1.65
9.33
0.96
8.33
1.70
1.02
79.6
6bi
cinc
tus
Rüp
pell
, 183
0C
hrom
is
32.3
35.
3136
.67
1.76
92.3
313
.26
218.
310
.38
95.0
014
.12
173.
38.
202.
410.
2813
.65
0.40
28.0
05.
9330
.33
4.05
102.
7610
.61
25.0
05.
105.
5972
.88
dim
idia
ta(K
lunz
inge
r, 18
71)
Chr
omis
1.
030.
1216
3.9
4.83
1.08
36.4
4pe
llou
raR
anda
ll a
nd
All
en, 1
982
Chr
omis
0.
130.
0139
.53
1.16
0.26
12.7
1pe
mba
eS
mit
h,
1960
Tab
le4
cont
inue
d Cem
ent J
etty
Mar
ine
Sci
ence
Sta
tion
Tour
ist C
amp
Al-
Mam
lah
Bay
Jord
an F
erti
lize
r Jo
rdan
Fer
tili
zer
Indu
stri
esIn
dust
ries
Jet
ty
Dep
th6
m12
m6
m12
m6
m12
m6
m12
m6
m12
m6
m12
mT
otal
AA
RA
AA
RA
AA
RA
AA
RA
AA
RA
AA
RA
AA
RA
AA
RA
AA
RA
AA
RA
AA
RA
AA
RA
RA
FA

263
Chr
omis
11
1.0
5.28
3.33
0.50
63.3
33.
000.
260.
0366
.28
1.95
6.67
1.36
1.65
43.2
2te
rnat
ensi
s(B
leek
er, 1
856)
Chr
omis
vir
idis
16.6
72.
3926
.67
1.27
5.00
0.74
326.
715
.45
3.37
0.10
26.6
72.
752.
6612
.71
(Cuv
ier,
1830
)C
hrom
is w
eber
i0.
03<
0.01
5.33
0.16
0.04
24.5
8F
owle
r an
d B
ean,
19
28D
ascy
llus
7.
001.
154.
000.
1971
.33
10.2
480
.00
3.80
17.0
02.
5346
.67
2.21
10.4
90.
3176
.67
16.2
411
.67
1.56
15.6
71.
624.
330.
882.
2738
.98
arua
nus
(Lin
naeu
s, 1
758)
Das
cyll
us
18.0
02.
9657
.67
2.77
46.6
76.
7096
.67
4.59
66.3
39.
8616
8.3
7.96
4.62
0.54
129.
53.
818.
001.
6940
.00
5.34
9.00
0.93
111.
022
.65
4.97
72.8
8m
argi
natu
s(R
üppe
ll, 1
829)
Das
cyll
us
2.33
0.38
8.33
1.20
4.00
0.19
0.67
0.10
3.23
0.38
31.3
30.
9210
.33
2.19
10.0
01.
331.
670.
1716
.67
3.40
0.58
61.0
2tr
imac
ulat
us(R
üppe
ll, 1
829)
Neo
glyp
hido
don
0.67
0.03
1.33
0.06
0.67
0.10
0.33
0.01
1.00
0.21
1.67
0.22
0.04
9.32
mel
as(C
uvie
r, 18
30)
Neo
pom
acen
trus
86
.67
14.2
350
0.0
24.0
03.
330.
5016
.67
0.79
2.05
0.24
30.0
00.
8823
3.3
31.1
268
.67
7.09
8.33
1.70
6.24
25.4
2m
irya
e D
or a
nd A
llen
, 19
77P
omac
entr
us
0.67
0.10
1.00
0.15
13.0
01.
340.
103.
39su
lfur
eus
Klu
nzin
ger,
1871
Pom
acen
trus
21
2.3
34.8
726
8.3
12.8
819
2.3
27.6
239
5.0
18.7
726
8.7
39.9
263
3.3
29.9
628
.74
3.36
82.3
32.
4281
.67
17.3
090
.00
12.0
196
.00
9.92
103.
321
.116
.12
87.2
9tr
icho
urus
Gün
ther
, 186
7P
omac
entr
us
0.33
0.07
<0.
010.
85tr
ilin
eatu
s C
uvie
r, 18
30
Mug
ilida
e0.
01C
reni
mug
il
0.90
0.10
0.28
0.01
0.01
3.39
cren
ilab
is(F
orss
kål,
1775
)
Lab
rida
e9.
71A
nam
pses
0.
670.
100.
670.
100.
330.
020.
080.
010.
280.
010.
018.
47ca
erul
eopu
ncta
tus
Rüp
pell
, 182
9
Tab
le4
cont
inue
d Cem
ent J
etty
Mar
ine
Sci
ence
Sta
tion
Tour
ist C
amp
Al-
Mam
lah
Bay
Jord
an F
erti
lize
r Jo
rdan
Fer
tili
zer
Indu
stri
esIn
dust
ries
Jet
ty
Dep
th6
m12
m6
m12
m6
m12
m6
m12
m6
m12
m6
m12
mT
otal
AA
RA
AA
RA
AA
RA
AA
RA
AA
RA
AA
RA
AA
RA
AA
RA
AA
RA
AA
RA
AA
RA
AA
RA
RA
FA

264
Ana
mps
es
0.38
0.04
1.70
0.05
0.01
22.0
3li
neat
usR
anda
ll,
1972
Ana
mps
es
0.33
0.02
0.33
0.05
0.67
0.03
0.44
0.05
0.12
<0.
010.
330.
071.
670.
170.
0312
.71
mel
eagr
ides
V
alen
cien
nes,
18
40A
nam
pses
4.
000.
662.
670.
130.
670.
106.
000.
294.
670.
6911
.00
0.52
0.64
0.07
1.88
0.06
5.33
1.13
2.33
0.31
3.00
0.31
1.67
0.34
0.29
59.3
2tw
isti
iBle
eker
, 18
56B
odia
nus
0.67
0.11
0.33
0.05
2.67
0.13
0.33
0.05
1.67
0.08
0.26
0.03
0.81
0.02
0.67
0.14
2.00
0.27
1.00
0.10
3.67
0.75
0.09
40.6
8an
thio
ides
(Ben
nett
, 183
2)B
odia
nus
0.33
0.05
0.33
0.02
0.02
<0.
011.
000.
211.
000.
100.
024.
24ax
illa
ris
(Ben
nett
, 183
2)B
odia
nus
0.33
0.07
<0.
012.
54di
ana
(Lac
epèd
e, 1
801)
Che
ilin
us
0.33
0.02
0.03
<0.
010.
420.
010.
330.
070.
0110
.17
lunu
latu
s(F
orss
kål,
1775
)C
heil
inus
1.
000.
163.
670.
181.
330.
195.
330.
252.
000.
304.
670.
220.
080.
011.
860.
050.
330.
072.
330.
311.
000.
100.
330.
070.
1645
.76
men
tali
sR
üppe
ll, 1
828
Che
ilin
ussp
.0.
130.
015.
120.
150.
0311
.02
Che
ilin
us
0.33
0.02
1.33
0.06
0.33
0.02
0.15
0.02
1.19
0.03
2.33
0.31
1.33
0.14
2.67
0.54
0.06
38.9
8tr
ilob
atus
Lac
epèd
e, 1
801
Che
ilio
iner
mis
0.33
0.05
0.44
0.05
1.51
0.04
0.67
0.09
0.02
30.5
1(F
orss
kål,
1775
)C
irrh
ilab
rus
2.67
0.44
1.67
0.25
1.00
0.05
2.31
0.27
93.1
42.
741.
670.
170.
6727
.97
rubr
iven
tral
is
Spr
inge
r an
d R
anda
ll, 1
974
Cor
is a
ygul
a0.
330.
050.
330.
051.
330.
060.
330.
020.
210.
020.
700.
023.
000.
640.
330.
030.
0418
.64
Lac
epèd
e, 1
801
Cor
is
4.33
0.71
2.33
0.11
0.33
0.05
4.33
0.21
3.00
0.14
18.7
42.
1927
.56
0.81
1.33
0.18
1.00
0.10
0.67
0.14
0.42
78.8
1ca
udim
acul
a(Q
uoy
and
Gai
mar
d, 1
834)
Cor
is g
aim
ard
0.67
0.03
0.33
0.05
0.01
1.69
gaim
ard
(Quo
y an
d G
aim
ard,
182
4)
Tab
le4
cont
inue
d Cem
ent J
etty
Mar
ine
Sci
ence
Sta
tion
Tour
ist C
amp
Al-
Mam
lah
Bay
Jord
an F
erti
lize
r Jo
rdan
Fer
tili
zer
Indu
stri
esIn
dust
ries
Jet
ty
Dep
th6
m12
m6
m12
m6
m12
m6
m12
m6
m12
m6
m12
mT
otal
AA
RA
AA
RA
AA
RA
AA
RA
AA
RA
AA
RA
AA
RA
AA
RA
AA
RA
AA
RA
AA
RA
AA
RA
RA
FA

265
Cor
is v
arie
gata
1.00
0.16
1.00
0.05
0.33
0.05
1.33
0.20
0.33
0.02
0.26
0.03
0.53
0.02
0.67
0.14
0.33
0.04
1.33
0.27
0.05
23.7
3(R
üppe
ll, 1
835)
Gom
phos
us
0.67
0.11
0.33
0.02
1.00
0.14
2.67
0.13
1.33
0.20
1.67
0.08
0.10
0.01
0.23
0.01
1.67
0.22
3.33
0.34
0.67
0.14
0.09
24.5
8ca
erul
eus
klun
zing
eri
Kla
usew
itz,
196
2H
alic
hoer
es
0.16
<0.
01<
0.01
1.69
mar
gina
tus
Rüp
pell
, 183
5H
alic
hoer
es
0.02
<0.
01<
0.01
0.85
scap
ular
is(B
enne
tt, 1
832)
Hem
igym
nus
0.33
0.02
0.07
<0.
010.
670.
091.
000.
100.
016.
78fa
scia
tus
(Blo
ch, 1
792)
Hol
ogym
nosu
s 1.
000.
050.
03<
0.01
0.33
0.01
0.33
0.04
0.01
11.0
2an
nula
tus
(Lac
epèd
e, 1
801)
Lab
roid
es
0.67
0.03
0.33
0.05
0.67
0.03
0.33
0.05
0.74
0.09
2.74
0.08
1.33
0.18
0.04
40.6
8di
mid
iatu
s(V
alen
cien
nes,
18
39)
Lar
abic
us
0.67
0.11
3.00
0.14
0.33
0.05
3.33
0.16
3.00
0.45
3.33
0.16
0.03
<0.
010.
810.
020.
330.
070.
330.
041.
000.
200.
1133
.05
quad
rili
neat
us(V
alen
cien
nes,
18
39)
Mac
ro-
1.33
0.06
0.33
0.02
0.09
<0.
010.
330.
030.
017.
63ph
aryn
godo
n bi
part
itus
bi
part
itus
S
mit
h, 1
957
Nov
acul
icht
hys
0.03
<0.
01<
0.01
0.85
mac
role
pido
tus
(Blo
ch, 1
791)
Oxy
chei
linu
s 0.
330.
052.
330.
110.
330.
050.
670.
030.
050.
010.
260.
010.
0312
.71
digr
amm
us(L
acep
ède,
180
1)P
arac
heil
inus
4.
000.
6612
6.7
6.08
476.
722
.66
180.
08.
510.
590.
0711
5.9
3.41
41.6
75.
5620
.00
4.08
6.35
50.8
5oc
tota
enia
F
ourm
anoi
r, 19
55P
seud
oche
ilin
us
0.67
0.03
3.33
0.16
4.00
0.19
0.05
0.01
1.95
0.06
0.33
0.04
0.07
36.4
4ev
anid
usJo
rdan
and
E
verm
ann,
190
3
Tab
le4
cont
inue
d Cem
ent J
etty
Mar
ine
Sci
ence
Sta
tion
Tour
ist C
amp
Al-
Mam
lah
Bay
Jord
an F
erti
lize
r Jo
rdan
Fer
tili
zer
Indu
stri
esIn
dust
ries
Jet
ty
Dep
th6
m12
m6
m12
m6
m12
m6
m12
m6
m12
m6
m12
mT
otal
AA
RA
AA
RA
AA
RA
AA
RA
AA
RA
AA
RA
AA
RA
AA
RA
AA
RA
AA
RA
AA
RA
AA
RA
RA
FA

266
Pse
udoc
heil
inus
1.
330.
221.
330.
196.
330.
303.
000.
452.
000.
090.
260.
033.
190.
090.
670.
141.
000.
131.
330.
141.
000.
200.
1455
.08
hexa
taen
ia
(Ble
eker
, 185
7)P
tera
gogu
s 0.
330.
020.
09<
0.01
0.33
0.07
0.33
0.04
0.67
0.14
0.01
5.93
cryp
tus
Ran
dall
, 198
1P
tera
gogu
s 2.
510.
295.
470.
160.
0532
.20
pely
cus
Ran
dall
, 198
1St
etho
juli
s 0.
330.
050.
330.
052.
670.
130.
230.
030.
910.
032.
000.
210.
330.
070.
0419
.49
albo
vitt
ata
(Bon
nate
rre,
178
8)St
etho
juli
s 0.
330.
050.
080.
010.
230.
01<
0.01
5.08
inte
rrup
ta(B
leek
er, 1
851)
Tha
lass
oma
0.67
0.03
0.33
0.05
3.00
0.14
0.33
0.02
0.31
0.04
5.70
0.17
1.00
0.20
0.07
42.3
7lu
nare
(Lin
naeu
s, 1
758)
Tha
lass
oma
6.00
0.99
5.33
0.26
14.3
32.
0621
.33
1.01
12.3
31.
8311
.00
0.52
3.33
0.39
3.19
0.09
11.6
72.
474.
000.
5318
.67
1.93
1.00
0.20
0.74
65.2
5ru
eppe
llii
(Klu
nzin
ger,
1871
)T
hala
ssot
hia
0.05
<0.
01<
0.01
1.69
cirr
hosa
(K
lunz
inge
r, 18
71)
Xyr
icht
ys p
avo
0.02
<0.
01<
0.01
0.85
Val
enci
enne
s,
1840
Scar
idae
0.56
Cal
otom
us
1.00
0.16
0.33
0.02
0.67
0.03
1.33
0.20
1.46
0.17
8.33
0.25
0.09
38.1
4vi
ride
scen
s(R
üppe
ll, 1
835)
Chl
orur
us
1.33
0.06
0.33
0.02
1.33
0.06
0.08
0.01
0.16
<0.
010.
330.
040.
0210
.17
gibb
us(R
üppe
ll, 1
829)
Chl
orur
us
5.33
0.77
5.67
0.27
2.00
0.30
9.33
0.44
0.47
0.01
3.33
0.71
0.67
0.09
6.00
0.62
0.22
16.9
5so
rdid
us(F
orss
kål,
1775
)H
ippo
scar
us
0.16
<0.
01<
0.01
3.39
hari
d(F
orss
kål,
1775
)L
epto
scar
us
4.90
0.57
17.5
10.
520.
1527
.12
vaig
iens
is
(Quo
y &
Gai
mar
d,
1824
)
Tab
le4
cont
inue
d Cem
ent J
etty
Mar
ine
Sci
ence
Sta
tion
Tour
ist C
amp
Al-
Mam
lah
Bay
Jord
an F
erti
lize
r Jo
rdan
Fer
tili
zer
Indu
stri
esIn
dust
ries
Jet
ty
Dep
th6
m12
m6
m12
m6
m12
m6
m12
m6
m12
m6
m12
mT
otal
AA
RA
AA
RA
AA
RA
AA
RA
AA
RA
AA
RA
AA
RA
AA
RA
AA
RA
AA
RA
AA
RA
AA
RA
RA
FA

267
Scar
us
1.67
0.08
1.65
0.05
0.02
3.39
ferr
ugin
eus
For
sskå
l, 17
75Sc
arus
0.
130.
012.
840.
080.
0211
.86
fusc
opur
pure
us
(Klu
nzin
ger,
1871
)Sc
arus
0.
790.
020.
330.
070.
0112
.71
ghob
ban
For
sskå
l, 17
75Sc
arus
nig
er1.
670.
080.
670.
030.
12<
0.01
1.33
0.14
0.33
0.07
0.03
7.63
For
sskå
l, 17
75Sc
arus
1.
330.
060.
490.
010.
015.
93ps
itta
cus
For
sskå
l, 17
75
Pin
guip
edid
ae0.
06P
arap
erci
s 1.
330.
222.
670.
380.
670.
031.
000.
150.
080.
010.
910.
030.
670.
071.
670.
340.
0629
.66
hexo
phta
lma
(Cuv
ier,
1829
)
Ura
nosc
opid
ae<0
.01
Ura
nosc
opus
0.
03<
0.01
<0.
010.
85su
lphu
reus
Val
enci
enne
s,
1832
Ble
nniid
ae0.
40A
spid
ontu
s 0.
080.
010.
910.
030.
0112
.71
taen
iatu
s ta
enia
tus
Quo
y an
d G
aim
ard,
183
4C
irri
pect
es
0.33
0.05
0.33
0.05
<0.
011.
69ca
stan
eus
(Val
enci
enne
s,
1836
)E
csen
ius
aron
i1.
000.
160.
670.
030.
330.
050.
015.
08S
prin
ger,
1971
Ecs
eniu
s fr
onta
lis
1.00
0.16
0.33
0.02
0.33
0.05
1.33
0.06
0.67
0.10
1.33
0.06
0.14
<0.
010.
330.
042.
330.
240.
0516
.10
(Val
enci
enne
s,
1836
)E
csen
ius
grav
ieri
0.67
0.11
1.33
0.19
1.33
0.06
0.26
0.03
1.05
0.03
0.33
0.04
0.67
0.07
0.04
22.8
8(P
elle
grin
, 190
6)
Tab
le4
cont
inue
d Cem
ent J
etty
Mar
ine
Sci
ence
Sta
tion
Tour
ist C
amp
Al-
Mam
lah
Bay
Jord
an F
erti
lize
r Jo
rdan
Fer
tili
zer
Indu
stri
esIn
dust
ries
Jet
ty
Dep
th6
m12
m6
m12
m6
m12
m6
m12
m6
m12
m6
m12
mT
otal
AA
RA
AA
RA
AA
RA
AA
RA
AA
RA
AA
RA
AA
RA
AA
RA
AA
RA
AA
RA
AA
RA
AA
RA
RA
FA

268
Exa
llia
s br
evis
0.67
0.07
<0.
010.
85(K
ner,
1868
)M
eiac
anth
us
7.67
1.26
2.67
0.13
3.67
0.53
3.00
0.14
4.33
0.64
5.33
0.25
6.10
0.71
5.67
0.17
0.67
0.14
0.67
0.09
0.67
0.07
2.00
0.41
0.28
55.0
8ni
grol
inea
tus
Sm
ith-
Van
iz,
1969
Pla
giot
rem
us
0.03
<0.
010.
14<
0.01
<0.
014.
24ta
pein
osom
a(B
leek
er, 1
857)
Pla
giot
rem
us
0.33
0.02
<0.
010.
85to
wns
endi
(Reg
an, 1
905)
Gob
iidae
0.95
Am
blye
leot
ris
3.00
0.43
1.67
0.08
0.67
0.10
3.33
0.16
0.07
<0.
010.
330.
031.
000.
200.
078.
47st
eini
tzi
(Kla
usew
itz,
197
4)A
mbl
yele
otri
s 0.
670.
030.
330.
020.
050.
010.
05<
0.01
0.01
3.39
sung
ami
(Kla
usew
itz,
196
9)A
mbl
ygob
ius
0.56
0.07
2.60
0.08
0.02
17.8
0al
bim
acul
atus
(R
üppe
ll, 1
830)
Bry
anin
ops
6.67
0.99
86.6
74.
100.
613.
39na
tans
Lar
son,
19
85F
usig
obiu
s 0.
05<
0.01
<0.
011.
69lo
ngis
pinu
sG
oren
, 197
8G
nath
olep
is
5.00
0.82
1.00
0.05
1.62
0.19
4.40
0.13
0.67
0.14
0.08
22.0
3an
jere
nsis
(Ble
eker
, 185
1)G
obio
don
1.33
0.19
1.00
0.21
1.00
0.13
12.6
72.
590.
116.
78ci
trin
us(R
üppe
ll, 1
838)
Isti
gobi
us
2.33
0.38
0.33
0.02
1.00
0.15
1.33
0.28
1.33
0.14
0.67
0.14
0.05
9.32
deco
ratu
s(H
erre
, 192
7)L
otil
ia g
raci
lios
a0.
07<
0.01
<0.
012.
54K
laus
ewit
z, 1
960
Vale
ncie
nnea
0.
330.
020.
03<
0.01
0.05
<0.
01<
0.01
2.54
puel
lari
s(T
omiy
ama,
195
6)
Tab
le4
cont
inue
d Cem
ent J
etty
Mar
ine
Sci
ence
Sta
tion
Tour
ist C
amp
Al-
Mam
lah
Bay
Jord
an F
erti
lize
r Jo
rdan
Fer
tili
zer
Indu
stri
esIn
dust
ries
Jet
ty
Dep
th6
m12
m6
m12
m6
m12
m6
m12
m6
m12
m6
m12
mT
otal
AA
RA
AA
RA
AA
RA
AA
RA
AA
RA
AA
RA
AA
RA
AA
RA
AA
RA
AA
RA
AA
RA
AA
RA
RA
FA

269
Aca
nthu
rida
e2.
19A
cant
huru
s 12
.33
2.03
8.33
0.40
28.3
34.
0735
.33
1.68
14.0
02.
0822
.67
1.07
1.44
0.17
2.74
0.08
46.6
79.
896.
670.
8962
.67
6.47
10.0
02.
041.
6557
.63
nigr
ofus
cus
(For
sskå
l, 17
75)
Aca
nthu
rus
0.16
<0.
01<
0.01
2.54
soha
l(F
orss
kål,
1775
)C
teno
chae
tus
2.00
0.33
2.67
0.13
5.33
0.77
3.67
0.17
3.67
0.54
5.00
0.24
0.31
0.04
1.58
0.05
11.3
32.
406.
330.
8415
.67
1.62
1.67
0.34
0.39
39.8
3st
riat
us(Q
uoy
and
Gai
mar
d, 1
825)
Nas
o un
icor
nis
0.26
0.03
0.84
0.02
0.01
7.63
(For
sskå
l, 17
75)
Zeb
raso
ma
0.33
0.02
0.33
0.02
0.08
0.01
0.33
0.01
0.33
0.07
0.67
0.09
3.67
0.38
1.00
0.20
0.04
11.8
6ve
life
rum
(Blo
ch, 1
795)
Zeb
raso
ma
0.33
0.05
0.67
0.03
1.67
0.24
0.67
0.03
1.00
0.15
1.67
0.08
0.10
0.01
0.72
0.02
5.33
1.13
1.67
0.17
0.33
0.07
0.09
31.3
6xa
nthu
rum
(Bly
th, 1
852)
Siga
nida
e1.
76Si
ganu
s 0.
310.
041.
070.
030.
017.
63ar
gent
eus
(Quo
y an
d G
aim
ard,
182
5)Si
ganu
s lu
ridu
s0.
670.
036.
000.
8667
.38
7.87
27.3
00.
802.
000.
421.
330.
140.
6931
.36
(Rüp
pell
, 182
9)Si
ganu
s ri
vula
tus
69.1
08.
0765
.88
1.94
7.33
1.55
6.33
0.65
13.3
32.
721.
0632
.20
For
sskå
l, 17
75
Scom
brid
ae<0
.01
Eut
hynn
us
0.58
0.02
<0.
010.
85af
fini
s(C
anto
r, 18
49)
Bot
hida
e<0
.01
Bot
hus
0.21
0.02
0.09
<0.
01<
0.01
5.93
pant
heri
nus
(Rüp
pell
, 183
0)
Sam
arid
ae<0
.01
Sam
aris
0.
03<
0.01
<0.
010.
85cr
ista
tus
Gra
y, 1
831
Tab
le4
cont
inue
d Cem
ent J
etty
Mar
ine
Sci
ence
Sta
tion
Tour
ist C
amp
Al-
Mam
lah
Bay
Jord
an F
erti
lize
r Jo
rdan
Fer
tili
zer
Indu
stri
esIn
dust
ries
Jet
ty
Dep
th6
m12
m6
m12
m6
m12
m6
m12
m6
m12
m6
m12
mT
otal
AA
RA
AA
RA
AA
RA
AA
RA
AA
RA
AA
RA
AA
RA
AA
RA
AA
RA
AA
RA
AA
RA
AA
RA
RA
FA
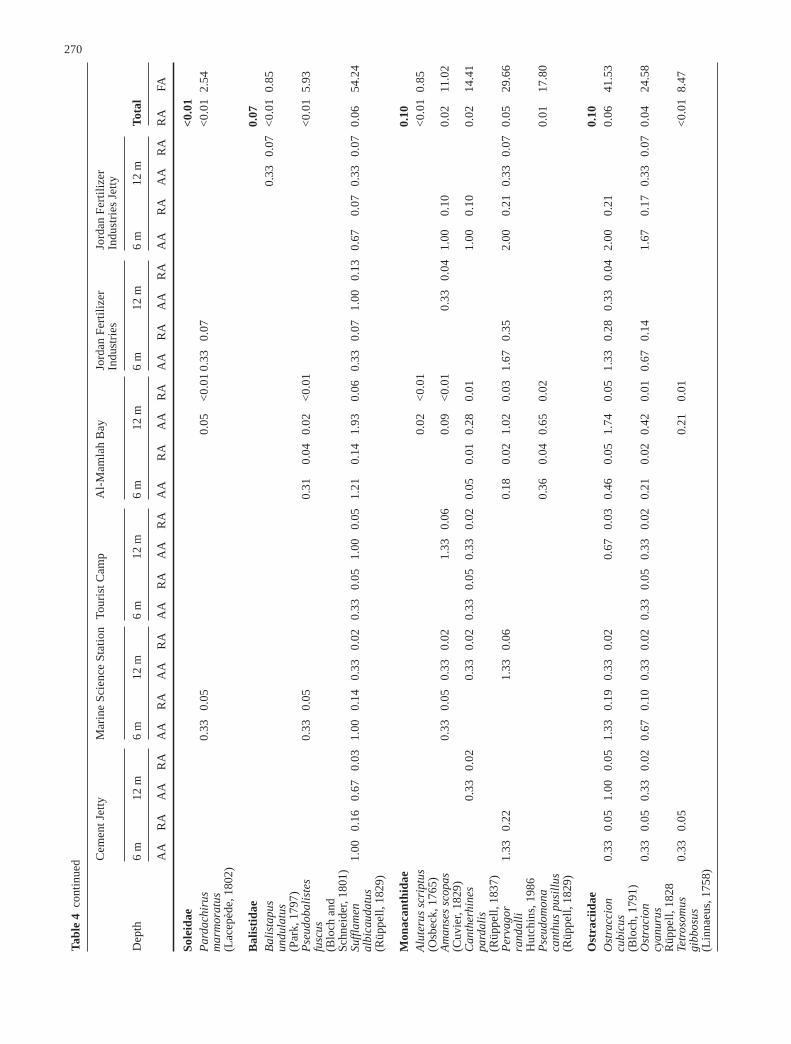
270
Sole
idae
<0.0
1P
arda
chir
us
0.33
0.05
0.05
<0.
010.
330.
07<
0.01
2.54
mar
mor
atus
(L
acep
ède,
180
2)
Bal
isti
dae
0.07
Bal
ista
pus
0.33
0.07
<0.
010.
85un
dula
tus
(Par
k, 1
797)
Pse
udob
alis
tes
0.33
0.05
0.31
0.04
0.02
<0.
01<
0.01
5.93
fusc
us
(Blo
ch a
nd
Sch
neid
er, 1
801)
Suff
lam
en
1.00
0.16
0.67
0.03
1.00
0.14
0.33
0.02
0.33
0.05
1.00
0.05
1.21
0.14
1.93
0.06
0.33
0.07
1.00
0.13
0.67
0.07
0.33
0.07
0.06
54.2
4al
bica
udat
us(R
üppe
ll, 1
829)
Mon
acan
thid
ae0.
10A
lute
rus
scri
ptus
0.02
<0.
01<
0.01
0.85
(Osb
eck,
176
5)A
man
ses
scop
as0.
330.
050.
330.
021.
330.
060.
09<
0.01
0.33
0.04
1.00
0.10
0.02
11.0
2(C
uvie
r, 18
29)
Can
ther
hine
s 0.
330.
020.
330.
020.
330.
050.
330.
020.
050.
010.
280.
011.
000.
100.
0214
.41
pard
alis
(Rüp
pell
, 183
7)P
erva
gor
1.33
0.22
1.33
0.06
0.18
0.02
1.02
0.03
1.67
0.35
2.00
0.21
0.33
0.07
0.05
29.6
6ra
ndal
liH
utch
ins,
198
6P
seud
omon
a0.
360.
040.
650.
020.
0117
.80
cant
hus
pusi
llus
(R
üppe
ll, 1
829)
Ost
raci
idae
0.10
Ost
racc
ion
0.33
0.05
1.00
0.05
1.33
0.19
0.33
0.02
0.67
0.03
0.46
0.05
1.74
0.05
1.33
0.28
0.33
0.04
2.00
0.21
0.06
41.5
3cu
bicu
s(B
loch
, 179
1)O
stra
cion
0.
330.
050.
330.
020.
670.
100.
330.
020.
330.
050.
330.
020.
210.
020.
420.
010.
670.
141.
670.
170.
330.
070.
0424
.58
cyan
urus
Rüp
pell
, 182
8Te
tros
omus
0.
330.
050.
210.
01<
0.01
8.47
gibb
osus
(Lin
naeu
s, 1
758)
Tab
le4
cont
inue
d Cem
ent J
etty
Mar
ine
Sci
ence
Sta
tion
Tour
ist C
amp
Al-
Mam
lah
Bay
Jord
an F
erti
lize
r Jo
rdan
Fer
tili
zer
Indu
stri
esIn
dust
ries
Jet
ty
Dep
th6
m12
m6
m12
m6
m12
m6
m12
m6
m12
m6
m12
mT
otal
AA
RA
AA
RA
AA
RA
AA
RA
AA
RA
AA
RA
AA
RA
AA
RA
AA
RA
AA
RA
AA
RA
AA
RA
RA
FA

271
Tet
raod
onti
dae
0.32
Aro
thro
n 0.
330.
020.
03<
0.01
0.33
0.03
<0.
013.
39di
adem
atus
(Rüp
pell
, 182
9)A
roth
ron
0.33
0.05
0.23
0.03
0.44
0.01
0.01
19.4
9hi
spid
us(L
inna
eus,
175
8)A
roth
ron
stel
latu
s 0.
330.
050.
330.
020.
03<
0.01
0.05
<0.
01<
0.01
4.24
(Blo
ch a
nd
Sch
neid
er, 1
801)
Can
thig
aste
r 1.
000.
050.
330.
050.
330.
021.
000.
152.
330.
111.
130.
133.
000.
091.
670.
350.
330.
040.
670.
071.
000.
200.
0868
.64
coro
nata
(V
aill
ant &
S
auva
ge, 1
875)
Can
thig
aste
r 1.
330.
220.
330.
020.
330.
053.
050.
365.
650.
171.
670.
350.
670.
099.
330.
960.
670.
140.
1565
.25
mar
gari
tata
(Rüp
pell
, 182
9)C
anth
igas
ter
0.02
<0.
01<
0.01
0.85
pygm
aea
All
en a
nd R
anda
ll,
1977
Torq
uige
ner
2.85
0.33
7.26
0.21
0.07
25.4
2fl
avim
acul
osus
Har
dy a
nd R
anda
ll,
1983
Dio
dont
idae
0.02
Cyc
lich
thys
0.
670.
110.
330.
020.
330.
020.
100.
010.
790.
021.
000.
210.
330.
040.
0222
.88
spil
osty
lus
(Lei
s an
d R
anda
ll,
1982
)
Tab
le4
cont
inue
d Cem
ent J
etty
Mar
ine
Sci
ence
Sta
tion
Tour
ist C
amp
Al-
Mam
lah
Bay
Jord
an F
erti
lize
r Jo
rdan
Fer
tili
zer
Indu
stri
esIn
dust
ries
Jet
ty
Dep
th6
m12
m6
m12
m6
m12
m6
m12
m6
m12
m6
m12
mT
otal
AA
RA
AA
RA
AA
RA
AA
RA
AA
RA
AA
RA
AA
RA
AA
RA
AA
RA
AA
RA
AA
RA
AA
RA
RA
FA

272
ae (6.2%), Chromis dimidiata (5.6%) Dascyllus margi-natus (5.0%) and Atherinomorus lacunosus (3.9%).These seven species accounted for two-thirds of all indi-viduals. In terms of frequency of appearance, the mostcommon species were Pomacentrus trichourus (87.3%),Amphiprion bicinctus (79.7%), Pseudanthias squami-pinnis (79.7%) and Coris caudimacula (78.8%), as wellas Chaetodon paucifasciatus, Chromis dimidiata andDascyllus marginatus (all 72.9%) (Table 4).
Average Shannon-Wiener diversity (ln basis) rangedfrom 1.3 at Al-Mamlah Bay at 6 m depth to 2.8 at JordanFertiliser Industries at 12 m depth (Fig. 3), but no signif-icant difference was detected (Table 5).
Average species richness ranged from 17.9 species atAl-Mamlah Bay at 6 m depth to 58.5 species at Al-Mamlah Bay at 12 m depth. The seagrass-dominatedsite, Al-Mamlah Bay, showed more species at 12 m thanat 6 m depth. At 6 m depth species richness was higheron coral reefs than on the seagrass meadow. The picture
Fig. 3 I Diversity (Shannon-Wiener Index; ln basis), II speciesrichness, and III abundance for 6 m and 12 m depths (average ±SD) of fish assemblages at sites along the Jordanian Red Seacoast, Gulf of Aqaba
for 12 m depth was the reverse, with a higher speciesrichness at the seagrass-dominated site. All differenceswere evidenced with a significance level of p<0.001. Nosignificant difference in species richness was detectedbetween other sites (Table 5).
Average abundance ranged from 472 fishes per tran-sect at Jordan Fertiliser Industries at 6 m depth to 3,397fishes per transect at Al-Mamlah Bay at 12 m depth(Fig. 3). Higher fish abundance was observed at 12 mthan at 6 m depth covering all sites (p<0.001), at the sea-grass-dominated site Al-Mamlah Bay (p<0.001) as wellas on coral reefs (p=0.015). There were more fishes at12 m depth at Al-Mamlah Bay compared with 12 mdepth at the coral-dominated sites (p<0.001). Due to in-homogeneous variances, no significant differences inabundance were detected at 6 m depth between coral reefand seagrass meadow (Table 5).
Multivariate analysis of the shore fish communitiesalong the Jordanian Red Sea coast
Cluster analysis and MDS plot based on percentage ofbenthic cover revealed two main groups (Fig. 4): (A) theseagrass-dominated Al-Mamlah Bay and (B) the coralreefs with two subgroups (B.1) 6 m and (B.2) 12 mdepth. Two samples (3a and 6b) did not match the clus-ters in the dendrogram, but 6b did fit into the groups ofthe MDS plot. Coral reef sites at 6 m and 12 m depthwere grouped together with a 1.5 times higher similaritythan coral reefs to the seagrass meadow. This groupingwas correlated with cluster analysis as well as MDS plotbased on average fish species abundance (Fig. 4). Themismatch of sample 1a in the dendrogram and MDS plotdid not disturb the general division into three groups.The RELATE test for similarities between the multivari-ate pattern revealed a significant correlation (Global ρ =0.638, p=0.006).
An ANOSIM significance test confirmed the differ-ence in the benthic habitat between 6 m and 12 m depthsof coral reefs (p=0.021) as well as between reefs and theseagrass meadow (p<0.001) (Table 6). There were nosignificant differences between 6 m and 12 m depth re-garding all sites (coral and seagrass) and the seagrass-dominated site. All identified groups of the fish assem-blages were evidenced by an ANOSIM significance testwith p<0.001 (Table 6).
Species analysis by dendrogram and MDS plot re-vealed four main groups (Fig. 5): (A) fishes of coralreefs, with the subgroups (A.1) Apogonidae, (A.2) high-er relative abundance at the shallow reef slope (6 m) and(A.3) higher relative abundance at the deep reef slope(12 m); (B) fishes of seagrass meadows and sand flats;(C) Siganidae; and (D) Caesionidae. Five species werenot assigned to any of the groups identified above. In ad-dition, four species showed a mismatch in the correlationto the main groups. These minor mismatches are due touneven distribution of these species and did not disturbthe overall picture. Species analysis by dendrogram and

273
Table 5 Significance tests fordiversity, species richness andabundance of fish assemblagesat sites along the Jordanian RedSea coast, Gulf of Aqaba(*0.05≥p≥0.01,**0.01>p≥0.001, ***p<0.001,log(1+x) represents log(1+x)transformed data, i.v. inhomog-enous variances, n.s. not signif-icant, coral coral reef, seagrassseagrass meadow)
6 m vs 12 m 6 m vs 12 m 6 m vs 12 m 6 m (seagrass) 12 m (seagrass) (seagrass) (coral) vs 6 m (coral) vs 12 m (coral)
DiversityF-test i.v. i.v. i.v.F-test PV 1.831 1.085F-test CV P 99% 3.910 3.420ANOVA i.v. i.v. i.v.F 3.643 2.521P 0.067 0.118Significance level n.s. n.s.
Species richnessF-test i.v.F-test PV 1.863 1.639 2.123 1.438F-test CV P 99% 2.120 3.910 3.450 2.600ANOVA i.v.F 285.488 0.445 52.113 19.706P <0.001 0.510 <0.001 <0.001Significance level *** n.s. *** ***
AbundanceF-test log(1+x) i.v.F-test PV 1.843 1.149 2.865 1.920F-test CV P 99% 1.910 2.150 3.910 3.420ANOVA i.v.F 97.409 21.211 6.719 20.839P <0.001 <0.001 0.015 <0.001Significance level *** *** * ***
Fig. 4 Dendrogram (I) andMDS plot (II) of relationshipsbetween benthic habitats (Bray-Curtis similarity, group aver-age; stress = 0), and dendro-gram (III) and MDS plot (IV)of relationships between fishassemblages (Bray-Curtis simi-larity, log(1+x) transformationof data, standardisation, groupaverage, stress = 0.05) at sitesalong the Jordanian Red Seacoast, Gulf of Aqaba. RELATEtest for similarities between themultivariate pattern: Globalρ=0.638, p=0.006. For site la-bels see Fig. 1 (a 6 m depth, b12 m depth). A seagrass-domi-nated site, B coral-dominatedsites (B.1 6 m depth, B.2 12 mdepth). + indicates mismatch
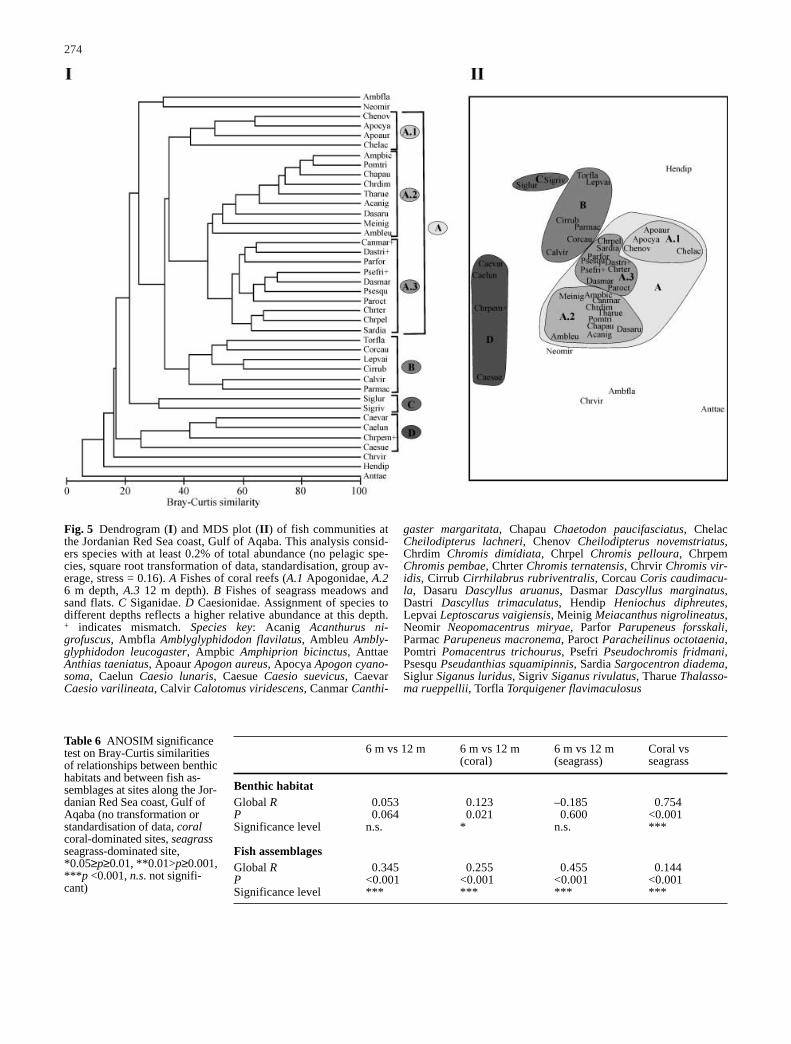
274
Fig. 5 Dendrogram (I) and MDS plot (II) of fish communities atthe Jordanian Red Sea coast, Gulf of Aqaba. This analysis consid-ers species with at least 0.2% of total abundance (no pelagic spe-cies, square root transformation of data, standardisation, group av-erage, stress = 0.16). A Fishes of coral reefs (A.1 Apogonidae, A.26 m depth, A.3 12 m depth). B Fishes of seagrass meadows andsand flats. C Siganidae. D Caesionidae. Assignment of species todifferent depths reflects a higher relative abundance at this depth.+ indicates mismatch. Species key: Acanig Acanthurus ni-grofuscus, Ambfla Amblyglyphidodon flavilatus, Ambleu Ambly-glyphidodon leucogaster, Ampbic Amphiprion bicinctus, AnttaeAnthias taeniatus, Apoaur Apogon aureus, Apocya Apogon cyano-soma, Caelun Caesio lunaris, Caesue Caesio suevicus, CaevarCaesio varilineata, Calvir Calotomus viridescens, Canmar Canthi-
gaster margaritata, Chapau Chaetodon paucifasciatus, ChelacCheilodipterus lachneri, Chenov Cheilodipterus novemstriatus,Chrdim Chromis dimidiata, Chrpel Chromis pelloura, ChrpemChromis pembae, Chrter Chromis ternatensis, Chrvir Chromis vir-idis, Cirrub Cirrhilabrus rubriventralis, Corcau Coris caudimacu-la, Dasaru Dascyllus aruanus, Dasmar Dascyllus marginatus,Dastri Dascyllus trimaculatus, Hendip Heniochus diphreutes, Lepvai Leptoscarus vaigiensis, Meinig Meiacanthus nigrolineatus,Neomir Neopomacentrus miryae, Parfor Parupeneus forsskali,Parmac Parupeneus macronema, Paroct Paracheilinus octotaenia,Pomtri Pomacentrus trichourus, Psefri Pseudochromis fridmani,Psesqu Pseudanthias squamipinnis, Sardia Sargocentron diadema,Siglur Siganus luridus, Sigriv Siganus rivulatus, Tharue Thalasso-ma rueppellii, Torfla Torquigener flavimaculosus
Table 6 ANOSIM significancetest on Bray-Curtis similaritiesof relationships between benthichabitats and between fish as-semblages at sites along the Jor-danian Red Sea coast, Gulf ofAqaba (no transformation orstandardisation of data, coralcoral-dominated sites, seagrassseagrass-dominated site,*0.05≥p≥0.01, **0.01>p≥0.001,***p <0.001, n.s. not signifi-cant)
6 m vs 12 m 6 m vs 12 m 6 m vs 12 m Coral vs (coral) (seagrass) seagrass
Benthic habitatGlobal R 0.053 0.123 –0.185 0.754P 0.064 0.021 0.600 <0.001Significance level n.s. * n.s. ***
Fish assemblagesGlobal R 0.345 0.255 0.455 0.144P <0.001 <0.001 <0.001 <0.001Significance level *** *** *** ***

275
MDS is an exploratory tool for the identification of typi-cal fish communities of a certain habitat. Due to the highnumber of species and abundance it was difficult to dis-tinguish these groups a priori. Therefore, an ANOSIMsignificance test was not conducted, because it only ap-plies to groups of samples specified prior to seeing orcollecting the data.
Correlation of fish community pattern to the benthic habitat
The BIO-ENV procedure of the PRIMER-5 software wasused to correlate the fish community pattern to the ben-thic habitat (Table 7). The maximum correlation(r=0.703, weighted Spearman rank correlation) was ob-tained with the seagrass cover, followed by the combina-tion of seagrass cover and depth (r=0.677), and the com-bination of seagrass, depth and live coral cover (r=0.579).
Fish species richness was positively linked to hardsubstrate cover by a power regression (r=0.6742,p<0.005) (Fig. 6). The coefficient of determination (r2)indicates that 45.5% of variation can be attributed tohard substrate cover. The relationship of fish speciesrichness to habitat diversity showed a positive correla-tion in a power regression (r=0.7064, p<0.005) as well(Fig. 6). The analysis revealed that r2 can assign 49.9%of variation to habitat diversity. A linear regression ofabundance of corallivores in relation to live coral coverresulted in a positive correlation (r=0.6956, p<0.005). Inthis case the r2 indicates that 48.4% of variation can beattributed to live hard coral cover.
Biogeography
Cluster analysis and MDS plot revealed four maingroups (Fig. 7): (1) Arabian Gulf, (2) Indian Ocean, (3)Red Sea, and (4) Southern Arabia. Differences in thegrouping of the Southern Arabian cluster can be ob-served between the multivariate methods used in thisanalysis. On the one hand, the Southern Arabia clustershows the lowest similarity to all other sites in the analy-sis based on Bray-Curtis similarity. On the other hand,the Euclidian distance revealed a high similarity to theRed Sea cluster. However, both MDS plots show a verysimilar pattern, where the Red Sea and Southern Arabiansites are situated between the Arabian Gulf and IndianOcean sites.
Fig. 6 Relationship of I fish species richness to benthic hard sub-strate cover and II to habitat diversity, as well as III abundance ofcorallivores to live hard coral cover at the Jordanian Red Seacoast, Gulf of Aqaba
Table 7 Correlation of fishcommunity pattern to the ben-thic habitat (BIO-ENV, weight-ed Spearman rank correlation);LC live hard coral, SC live softcoral, DC dead coral and rock,SG seagrass, S sand, D depth, knumber of variables combined
k Best variable combinations and weighted Spearman rank correlation
1 SG LC DC D S SC0.703 0.280 0.241 0.224 0.035 -0.094
2 SG+D SG+LC SG+S SG+DC SG+SC LC+D0.677 0.506 0.488 0.459 0.385 0.286
3 SG+D+LC SG+D+DC SG+D+S SG+T+SC SG+LC+S SG+LC+DC0.579 0.528 0.507 0.491 0.458 0.439
The dendrogram suggested subgroups within the RedSea, but neither MDS plot nor ANOSIM significancetest confirmed this pattern, although ANOSIM gave evi-dence for the main groups (Table 8). However, ANOSIM

276
based on Bray-Curtis similarity showed a significant dif-ference between the Arabian Gulf and all other sites,whereas analysis based on Euclidian distance was notsignificant. On the one hand, the Arabian Gulf shares55.3% of its species with the Indian Ocean, whereas only
45.6% of its species occur in the Red Sea. On the otherhand, 75.4% of the Red Sea species have an IndianOcean distribution, but the Red Sea shares only 22.7% ofits species with the Arabian Gulf.
Fig. 7 Map I, dendrogram andMDS plot based on Bray-Curtissimilarity (stress = 0.09) II andEuclidean distance (stress =0.06) III of biogeographic rela-tionships between coastal fishassemblages of the Red Sea,Gulf of Aden, Indian Oceanand Arabian Gulf (Bray-Curtissimilarity and Euclidean dis-tance based on presence/ab-sence of 712 species); proposedbiogeographic borders afterKlausewitz (1978, 1989) and(Kemp 1998): a border be-tween Indian Ocean and Gulfof Aden/Southern Arabia, bborder between Arabian Gulfand southern Arabia, c borderbetween Gulf of Aden and RedSea (see discussion about loca-tion), d barrier in the southernRed Sea at 20°N, e Gulf of Aqaba (also see Fig. 1)

277
Discussion
All our conclusions are restricted to day-active and non-cryptic species. As discussed by Brock (1982), dwarf,cryptic and nocturnal species are underestimated by thevisual census technique. The visual census technique iswidely applied and accepted for fish ecological studieson coral reefs (English et al. 1994), although differencesin skill and technique of observers can be a source of im-precision and/or bias (Thompson and Mapstone 1997).Therefore the first author (M.A. Khalaf) conducted allcensuses himself to avoid this problem. In the Jordanianwaters of the Gulf of Aqaba, 348 species of fish havebeen recorded to date, with around 294 species occurringin shallow-water habitats such as coral reefs, seagrassmeadows and sand flats (Khalaf and Disi 1997). In thisstudy, approximately two-thirds (198 species) of the ich-thyofauna at the Jordanian coast are considered for theanalysis of shallow-water fish communities. In manyother studies the investigations are restricted to certainfamilies or subsets of the fish community, and the per-centage of species considered for the analysis is notknown.
Shore fish communities at the Jordanian Red Sea coast
Dominant taxa and fish community parameters
Pseudanthias squamipinnis is the most abundant specieson Jordanian coral reefs as well as in the “Japanese gar-dens”, off Eilat (Rilov and Benayahu 2000), at Nuweiba(Ben-Tuvia et al. 1983) and at Sanganeb atoll (Krupp etal. 1993). Other species making up more than 1% of totalabundance in Jordan as well as at Sanganeb atoll areChromis dimidiata and Chromis ternatensis. The follow-ing species belong to the ten most abundant species atboth sides of the northern end of the Gulf of Aqaba(“Japanese gardens” and sites in Jordan): Pomacentrustrichourus, Paracheilinus octotaenia, Chromis dimidia-ta, Dascyllus marginatus and Neopomacentrus miryae(Table 4). As expected, the fish assemblages along theJordanian and Israeli coasts are very similar.
On Indo-Pacific coral reefs, labrid and pomacentridspecies are the dominant fishes (Table 3). Labridae(wrasse) contribute the highest percentage of species,followed by Pomacentridae (damselfish). The fish faunaon coral reefs in the Arabian Gulf shows a different com-position, probably due to unfavourable environmentalconditions for many tropical fish species. Two studies inthe Caribbean revealed two main differences from theIndo-Pacific: a lower percentage of Labridae and a veryhigh percentage of Serranidae (Table 3). However, com-parisons have to be treated with caution, especially forrather cryptic families such as Gobiidae, Blenniidae andScorpaenidae.
In terms of relative abundance of families, the ich-thyofauna of the Jordanian coast is dominated by Poma-centridae, followed by Anthininae (subfamily of Serran-idae) and Labridae. Visual censuses of fish assemblageson coral reefs in New Caledonia (Rossier and Kulbicki2000) and on the Great Barrier Reef (Ackerman andBellwood 2000) revealed the dominance of Pomacen-tridae as well. In New Caledonia the second most abun-dant family was Lutjanidae, followed by Chaetodont-idae, Labridae and Apogonidae (Rossier and Kulbicki2000). On the Great Barrier Reef the ranking after thedominant pomacentrids was Gobiidae, Caesionidae,Apogonidae, Labridae and Chaetodontidae (Ackermanand Bellwood 2000). Several families, such as Lutjan-idae (three species), Haemulidae (four species) and Ephippidae (one species) are very rare along the Jordani-an Red Sea coast (Khalaf and Disi 1997), but can be fre-quently observed in the Red Sea proper and other partsof the Indo-Pacific.
Shannon-Wiener diversity (H′) did not differ signifi-cantly between depths or between coral- and seagrass-dominated sites (Fig. 3). Comparisons with other studiesdo not give a clear picture of an influence of depth on di-versity (H′). On the one hand, Friedlander and Parrish(1998) pointed out a weak positive correlation betweendiversity (H′) and depth, which explained around 20% ofthe variation. On the other hand, Öhman and Rajasuriya(1998) did not find a significant correlation between di-versity (H′) and depth.
Table 8 ANOSIM significance test on Bray-Curtis similarities (BCS) and Euclidean distance (ED) for biogeographic relationships.*0.05≥p≥0.01, **0.01>p≥0.001, ***p<0.001, n.s. not significant
Red Sea vs Red Sea vs Red Sea vs Gulf of Aqaba vs Arabian Gulf vs Red Sea, Southern Arabia Indian Ocean Arabian Gulf Red Sea proper Southern Arabia and Indian Ocean
BCSGlobal R 0.992 0.993 1.000 0.323 0.787P 0.006 0.001 0.006 0.125 0.001Significance level ** ** ** n.s. **
EDGlobal R 0.914 0.616 0.987 0.169 –0.037P 0.006 0.001 0.006 0.161 0.548Significance level ** ** ** n.s. n.s.

On the one hand, species richness was rather similarat the two depths of the coral reefs. This picture is incontrast to the general trend of species richness increas-ing with depth, shown for the Red Sea (Edwards andRosewell 1981; Roberts and Ormond 1987), in Sri Lan-ka (Öhman and Rajasuriya 1998), and in Hawaii (Fried-lander and Parrish 1998). However, this trend is mostpronounced between 1 m and 6 m depths, with a smalleror no difference between 6 m and 12 m depths (Robertsand Ormond 1987). One or another of our study sitesmight show this difference as well (e.g. Tourist Camp),but the overall pattern does not support a significant dif-ference between 6 m and 12 m depth. On the other hand,the seagrass-dominated site showed a significantly high-er species richness at 12 m depth. This pattern might begenerated by a higher percentage of hard substrate at12 m depth, which provides more three-dimensionalstructures with holes for shelter. In a study of Robertsand Ormond (1987), the number of holes in a coral reefaccounted for 77% of the variance in fish abundance,and Friedlander and Parrish (1998) attributed 73% ofthe variance in fish biomass to the mean hole volume.Due to the lack of shelter at 6 m depth at Al-MamlahBay, the species richness is reduced relative to coralreefs at the same depth. Comparison of seagrass mead-ow and coral reefs at 12 m depth revealed the oppositepicture, with a higher number of species and higherabundance in the seagrass.
The higher species richness and abundance in 12 mdepth can be explained by the high productivity of theseagrass meadows and by feeding migrations of fishesfrom the coral reef to the seagrass beds (Ogden 1980;Robblee and Ziemann 1984; Quinn and Ogden 1984;Kochzius 1999). Invertebrate feeders are significantlymore abundant at the seagrass-dominated site (M.A.Khalaf and M. Kochzius, unpublished data), where theycan utilise the rich crustacean fauna. Nocturnal feedingmigrations of invertebrate feeders from coral reefs intoseagrasses are documented for the Atlantic as well as theIndo-Pacific (Weinstein and Heck 1979; Bell and Pollard1989; Kochzius 1999). Studies in the Caribbean haveshown that the biomass of fishes in coral reefs adjacentto seagrass meadows is higher than in reefs without sea-grass beds (Birkeland 1985). Comparison of fisheriesfrom different coral reef regions suggests that coral reefsbounded by extended shallow-water habitats, such asseagrass meadows or mangroves, yield the highest catch.Reefs with a ratio of shallow-water habitat to coral reefof 1:1 or more are very productive (Marshall 1985). De-spite the lack of biomass data in this study, the highabundance of fishes in Al-Mamlah Bay supports thesefindings. Before the recent closing of this area, it was afavourite fishing ground for local fishermen, indicating ahigh standing stock and high productivity of fish. Theseresults support the importance of Al-Mamlah Bay as ahigh productive area along the Jordanian Red Sea coast.A comparison of six seagrass meadows along the Jorda-nian coast revealed the highest seagrass biomass (g/m3)at Al-Mamlah Bay (Wahbeh 1981).
The overall picture shows a significantly lower abun-dance of fishes at 6 m depth than at 12 m depth (Fig. 3,Table 5). At the seagrass-dominated Al-Mamlah Bay thispattern can be explained by the lack of shelter at 6 mdepth. At the coral-dominated sites, this difference is dueto the high abundance of Pseudanthias squamipinnis andother planktivores at 12 m depth at all sites (Table 4).Pseudanthias squamipinnis accounts for 24.1% of the to-tal abundance and feeds in large schools on zooplanktonat sites exposed to the current. On the Jordanian coastplanktivorous fishes are significantly more abundant at12 m depth than at 6 m depth (M.A. Khalaf and M.Kochzius, unpublished data). The 12 m transects aremore exposed to currents bringing zooplankton from off-shore waters into the reef. A positive correlation ofabundance as well as biomass of planktivores and depthwas reported by Friedlander and Parrish (1998), but totalfish abundance did not reveal a connection to depth aswell. Investigations on herbivorous fishes, such asAcanthuridae (surgeonfish), Scaridae (parrotfish) andSiganidae (rabbitfish), on a coral reef in Aqaba suggestsa higher abundance of these families at 10 m depth thanat 5 m depth (Bouchon-Navaro and Harmelin-Vivien1981).
The analysis of the dominant taxa and fish communi-ty parameters revealed the following pattern: (1) Labri-dae and Pomacentridae dominated the ichthyofauna interms of species richness in the Gulf of Aqaba as well ason other Indo-Pacific coral reefs, (2) Pomacentridae wasthe dominant family in terms of relative abundance, (3)in the observed range of 6 m and 12 m depth, fish diver-sity and species richness on coral reefs in Aqaba werenot correlated to depth, (4) abundance of fishes was sig-nificantly higher at 12 m depth than at 6 m depth alongthe Jordanian Red Sea coast, and (5) the seagrass-domi-nated sites showed a significantly higher species richnessand abundance at 12 m depth than the coral-dominatedsites, probably due to the high productivity of the sea-grass meadows.
Multivariate analysis of the fish community
Cluster analysis, MDS plot and ANOSIM indicate sig-nificant differences between the fish communities of thetwo different depths as well as the two different habitats(Fig. 4, Table 6). This pattern of the fish communities iscorrelated with the composition of the benthic habitat(Global ρ=0.638, p=0.006), suggesting that habitat com-position as well as depth are the main factors that influ-ence the composition of the fish assemblages. The multi-variate BIO-ENV procedure reveals the best correlationof the fish community pattern to habitat parameters inseagrass cover (r=0.70) and combinations of the parame-ters seagrass cover and depth (r=0.68) as well as seagrass cover, depth and live hard coral (r=0.58). ANOSIM indicates that the overall benthic habitat com-position does not show a significant difference between6 m and 12 m depth, whereas fish communities are sig-
278
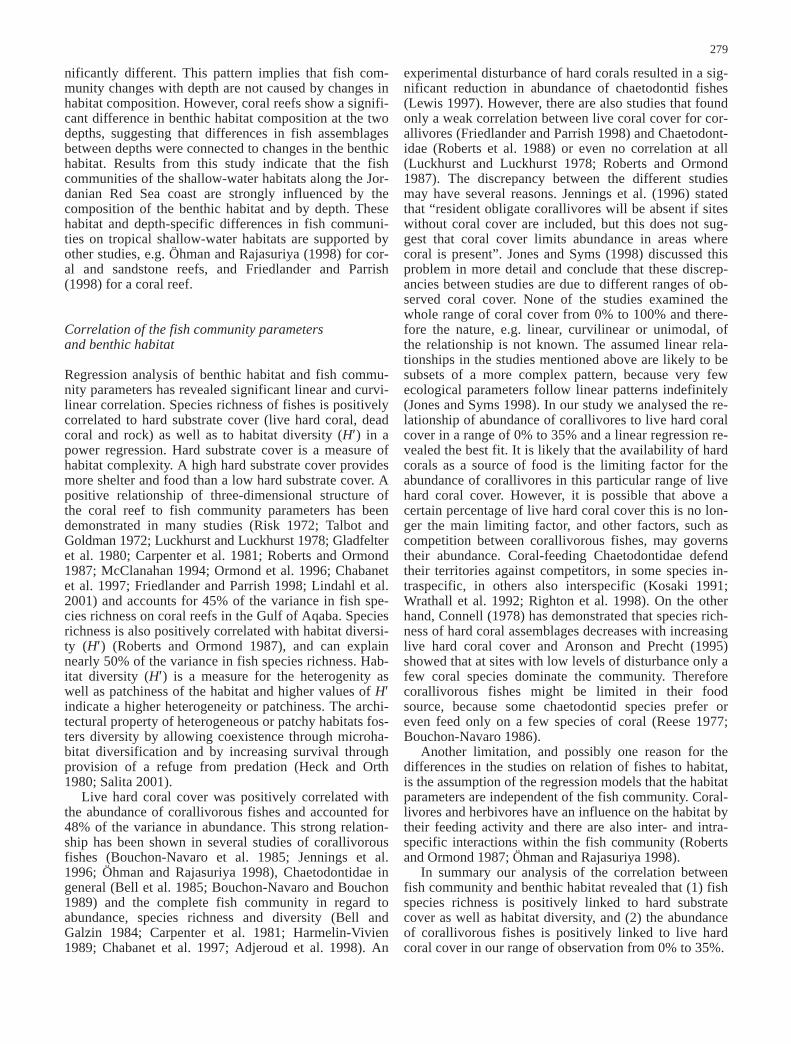
nificantly different. This pattern implies that fish com-munity changes with depth are not caused by changes inhabitat composition. However, coral reefs show a signifi-cant difference in benthic habitat composition at the twodepths, suggesting that differences in fish assemblagesbetween depths were connected to changes in the benthichabitat. Results from this study indicate that the fishcommunities of the shallow-water habitats along the Jor-danian Red Sea coast are strongly influenced by thecomposition of the benthic habitat and by depth. Thesehabitat and depth-specific differences in fish communi-ties on tropical shallow-water habitats are supported byother studies, e.g. Öhman and Rajasuriya (1998) for cor-al and sandstone reefs, and Friedlander and Parrish(1998) for a coral reef.
Correlation of the fish community parameters and benthic habitat
Regression analysis of benthic habitat and fish commu-nity parameters has revealed significant linear and curvi-linear correlation. Species richness of fishes is positivelycorrelated to hard substrate cover (live hard coral, deadcoral and rock) as well as to habitat diversity (H′) in apower regression. Hard substrate cover is a measure ofhabitat complexity. A high hard substrate cover providesmore shelter and food than a low hard substrate cover. Apositive relationship of three-dimensional structure ofthe coral reef to fish community parameters has beendemonstrated in many studies (Risk 1972; Talbot andGoldman 1972; Luckhurst and Luckhurst 1978; Gladfelteret al. 1980; Carpenter et al. 1981; Roberts and Ormond1987; McClanahan 1994; Ormond et al. 1996; Chabanetet al. 1997; Friedlander and Parrish 1998; Lindahl et al.2001) and accounts for 45% of the variance in fish spe-cies richness on coral reefs in the Gulf of Aqaba. Speciesrichness is also positively correlated with habitat diversi-ty (H′) (Roberts and Ormond 1987), and can explainnearly 50% of the variance in fish species richness. Hab-itat diversity (H′) is a measure for the heterogenity aswell as patchiness of the habitat and higher values of H′indicate a higher heterogeneity or patchiness. The archi-tectural property of heterogeneous or patchy habitats fos-ters diversity by allowing coexistence through microha-bitat diversification and by increasing survival throughprovision of a refuge from predation (Heck and Orth1980; Salita 2001).
Live hard coral cover was positively correlated withthe abundance of corallivorous fishes and accounted for48% of the variance in abundance. This strong relation-ship has been shown in several studies of corallivorousfishes (Bouchon-Navaro et al. 1985; Jennings et al.1996; Öhman and Rajasuriya 1998), Chaetodontidae ingeneral (Bell et al. 1985; Bouchon-Navaro and Bouchon1989) and the complete fish community in regard toabundance, species richness and diversity (Bell and Galzin 1984; Carpenter et al. 1981; Harmelin-Vivien1989; Chabanet et al. 1997; Adjeroud et al. 1998). An
experimental disturbance of hard corals resulted in a sig-nificant reduction in abundance of chaetodontid fishes(Lewis 1997). However, there are also studies that foundonly a weak correlation between live coral cover for cor-allivores (Friedlander and Parrish 1998) and Chaetodont-idae (Roberts et al. 1988) or even no correlation at all(Luckhurst and Luckhurst 1978; Roberts and Ormond1987). The discrepancy between the different studiesmay have several reasons. Jennings et al. (1996) statedthat “resident obligate corallivores will be absent if siteswithout coral cover are included, but this does not sug-gest that coral cover limits abundance in areas wherecoral is present”. Jones and Syms (1998) discussed thisproblem in more detail and conclude that these discrep-ancies between studies are due to different ranges of ob-served coral cover. None of the studies examined thewhole range of coral cover from 0% to 100% and there-fore the nature, e.g. linear, curvilinear or unimodal, ofthe relationship is not known. The assumed linear rela-tionships in the studies mentioned above are likely to besubsets of a more complex pattern, because very fewecological parameters follow linear patterns indefinitely(Jones and Syms 1998). In our study we analysed the re-lationship of abundance of corallivores to live hard coralcover in a range of 0% to 35% and a linear regression re-vealed the best fit. It is likely that the availability of hardcorals as a source of food is the limiting factor for theabundance of corallivores in this particular range of livehard coral cover. However, it is possible that above acertain percentage of live hard coral cover this is no lon-ger the main limiting factor, and other factors, such ascompetition between corallivorous fishes, may governstheir abundance. Coral-feeding Chaetodontidae defendtheir territories against competitors, in some species in-traspecific, in others also interspecific (Kosaki 1991;Wrathall et al. 1992; Righton et al. 1998). On the otherhand, Connell (1978) has demonstrated that species rich-ness of hard coral assemblages decreases with increasinglive hard coral cover and Aronson and Precht (1995)showed that at sites with low levels of disturbance only afew coral species dominate the community. Thereforecorallivorous fishes might be limited in their foodsource, because some chaetodontid species prefer oreven feed only on a few species of coral (Reese 1977;Bouchon-Navaro 1986).
Another limitation, and possibly one reason for thedifferences in the studies on relation of fishes to habitat,is the assumption of the regression models that the habitatparameters are independent of the fish community. Coral-livores and herbivores have an influence on the habitat bytheir feeding activity and there are also inter- and intra-specific interactions within the fish community (Robertsand Ormond 1987; Öhman and Rajasuriya 1998).
In summary our analysis of the correlation betweenfish community and benthic habitat revealed that (1) fishspecies richness is positively linked to hard substratecover as well as habitat diversity, and (2) the abundanceof corallivorous fishes is positively linked to live hardcoral cover in our range of observation from 0% to 35%.
279

Fish associations of shallow-water habitats
The multivariate analysis of the fish community revealedseveral associations of fishes in different habitats. Withinthe large group of mainly coral-reef-associated fishes wecan distinguish (1) a group of species that occur mainlyat 6 m depth at the shallow reef slope, (2) a group thathas a higher relative abundance at 12 m depth at the deepreef slope and (3) the Apogonidae (cardinalfish). Withinthe first group it is interesting to note that Chaetodonpaucifasciatus is assigned to the upper reef slope, where-as in the Red Sea proper this species occurs in deeperwater. Also several other species commonly occur inshallow water in the Gulf of Aqaba, e.g. Apolemichthysxanthotis (angelfish), Genicanthus caudovittatus (angel-fish), Chromis pembae (damselfish), Pseudochromisfridmani (dottybacks), and Canthigaster coronata (to-bies). It is suggested that this pattern could be due tolower surface temperatures in the Gulf of Aqaba (Edwards and Rosewell 1981; Ormond and Edwards1987; Sheppard et al. 1992). However, this hypothesisremains conjectural and other explanations such as nicheexpansion in the absence of certain competitor speciesare also possible (Sheppard et al. 1992).
Other studies have revealed a similar pattern of a dif-ferent species composition at the shallow and deep slope(McGehee 1994; Friedlander and Parrish 1998). McGehee (1994) assigned the difference to greater watermovement in the shallow reef slope, but that study com-pared 2–4 m depth to a maximum of 10 m depth and it istherefore difficult to compare this with our results. At theJordanian coast it seems more likely that the onshoretransport of zooplankton is a factor that triggers the dif-ferences in occupation between the shallow and deepreef slope. The species group at the shallow reef slopecontains only two planktivorous species, the non-school-ing pomacentrids Chromis dimidiata and Amblygly-phidodon leucogaster. In contrast, the fish group at thedeep reef slope comprises four planktivores, the solitaryChromis ternatensis (Pomacentridae) as well as theschooling species Pseudanthias squamipinnis (Serran-idae), Paracheilinus octotaenia (Labridae) and Chromispelloura (Pomacentridae). As discussed earlier, Pseud-anthias squamipinnis showed a higher abundance at thecurrent exposed deeper reef slope. In general, the abun-dance of planktivorous fish was significantly higher at12 m depth than at 6 m depth (M.A. Khalaf and M.Kochzius, unpublished data). It has to be mentioned thatChromis pelloura was recorded only at the seagrass-dominated site and therefore is an exception in the fishgroup regarded as typical for deep reef slope sites. How-ever, this species showed the highest abundance at 12 mdepth and is therefore assigned to this group of deep reefslope species.
The third group of coral-reef-associated fishes areapogonid species. Members of the family Apogonidaeare nocturnally active species that hide in the daytimee.g. in crevices or between spines of sea urchins. A studyin the Philippines has shown that apogonid species, such
as Apogon aureus and Apogon cyanosoma, seek shelterin the coral reef during the day and migrate at night intoadjacent seagrass meadows to forage (Kochzius 1999).Members of this family utilise the same habitat for shel-ter and are therefore grouped together.
Another association of fishes are species of seagrassmeadows and sandflats, such as the scarid Leptoscarus vaigiensis which is known as a resident species in seagrassmeadows (Randall 1983; Kochzius 1999). The scarid Calotomus viridescens is most commonly seen in seagrassmeadows, but also occurs on coral reefs or rocky substrate(Randall 1983). Calotomus viridescens is endemic to theRed Sea and in the Indo-West Pacific the niche of this spe-cies seems to be occupied by Calotomus spinidens(Kochzius 1999). The labrids Cirrhilabrus rubriventralisand Coris caudimacula are inhabitants of seagrass mead-ows as well as areas of mixed sand, rubble, rocks and cor-als (Randall 1983; Khalaf and Disi 1997). The mullid Parupeneus macronema is a feeder on benthic inverte-brates of sandy areas and juveniles are associated with sea-grass meadows (Khalaf and Disi 1997). Torquigener flavi-maculosus (Tetraodontidae) is a typical species of shallowsand flat and rubble habitats (Khalaf and Disi 1997).
Two smaller groups of fish associations are the twosiganid species, both feeding on benthic algae, and thethree planktivorous species of the family Caesionidae,which usually school in mid-water (Khalaf and Disi1997).
The fish communities of shallow-water habitats alongthe Jordanian Red Sea coast showed different assemblag-es of fishes (1) on the deep reef slope, (2) on the shallowreef slope and (3) on seagrass meadows and sand flats.In addition the analysis revealed ecological groups suchas schooling herbivores, schooling planktivores and reef-associated apogonids.
Biogeography
The number of shore fish species in the Gulf of Aqaba ishigher than previously reported. Sheppard et al. (1992)examined the species richness of the families Chae-todontidae (butterflyfish), Pomacentridae (damselfish),Labridae (wrasse), Acanthuridae (surgeonfish), Serran-idae (groupers) and Scaridae (parrotfish) in different ar-eas of the northern Red Sea, Gulf of Suez and Gulf ofAqaba. Their study showed a decrease in species rich-ness from 100 species at the southern coast of Egypt inthe Red Sea proper to 75 species in the northern Gulf ofAqaba. The results of our study and additional specieslists from literature (Khalaf and Disi 1997; Rilov andBenayahu 2000) demonstrate that the species richness ofthese families in the northern Gulf of Aqaba is muchhigher and reaches 104 species. A list compiled from dif-ferent sources indicates a total of 362 species of shorefishes for the Gulf of Aqaba (Ben-Tuvia et al. 1983;Khalaf and Disi 1997; Rilov and Benayahu 2000; M.Kochzius, personal observation: U. Zajonz et al., unpub-lished report; this study).
280

In terms of shore fish species composition, there aresignificant differences between the Red Sea, Gulf ofAden, Arabian Gulf and Indian Ocean. The relationshipsof the ichthyofaunal composition based on presence/ab-sence data from these localities showed a pattern of de-creasing similarity of fish communities in the dendro-gram from the northern Gulf of Aqaba through the RedSea proper into the Indian Ocean (Fig. 7). This patterncould indicate a generalised track between the northernRed Sea and the southern Red Sea plus Indian Ocean(Winterbottom 1985).
Differences in the structure of fish communities onnorthern and southern Red Sea coral reefs are shown forseveral families, such as Chaetodontidae (butterflyfish),Pomacanthidae (angelfish), Pomacentridae (damselfish),Acanthuridae (surgeonfish), Scaridae (parrotfish), La-bridae (wrasse), Lethrinidae (emperors), and Lutjanidae(snappers). Scleractinian corals as well show distinctchanges in species richness from north to south, with ahigher number of species in the central Red Sea (Robertset al. 1992), and north–south differences in the commu-nity structure (Sheppard and Sheppard 1991). These dif-ferences in the community structure of fishes and coralswithin the Red Sea might be due to north–south differ-ences in habitat as well as an abrupt increase in turbiditysouth of 20°N (Sheppard et al. 1992; Roberts et al.1992).
Differences between Red Sea fish communities andfish assemblages of the Indian Ocean are caused by twobarriers: On the one hand there is a barrier at the connec-tion of the Red Sea to the Indian Ocean. Some authorsregard the shallow sill of the Bab El Mandab strait as thebarrier (Klausewitz 1989; Roberts et al. 1992), others lo-cate it in the southern Red Sea (Blum 1989; Righton etal. 1996) or in the western Gulf of Aden (Kemp 1998).On the other hand there is the reef-free section betweenSomalia and India, separating the Red Sea from the Indi-an Ocean (Klausewitz 1978; Roberts et al. 1992). Thislack of coral reefs is connected to a 'pseudo-high latitudeeffect', which results from seasonal cold water upwellingalong the southern coast of the Arabian peninsula andthe Indian Ocean coast of Somalia (Klausewitz 1989;Sheppard and Sheppard 1991; Kemp 1998).
Klausewitz (1978, 1989) regarded the ichthyofauna ofthe Arabian seas as a biogeographical sub-province, in-cluding the Red Sea, Gulf of Aden and Arabian Gulf.Further studies of chaetodontid species assemblages bycluster analysis support this view, grouping assemblagesfrom Oman, Socrota and Arabian Gulf together in onecluster, more closely related to the Red Sea than to theIndian Ocean (Kemp 1998). An analysis of the IndianOcean coral fauna based on presence/absence of speciesrevealed a biogeographic Arabian sub-province as well(Sheppard and Sheppard 1991). However, our biogeo-graphic analysis revealed a clear pattern of the faunal re-lationships between the Red Sea, Southern Arabia andthe Indian Ocean, but the biogeographic affinity of theArabian Gulf is not clear. The two dendrograms based ondifferent coefficients revealed conflicting results and one
dendrogram does not support the close affinity of theArabian Gulf to the Red Sea.
There is no doubt that not all of the species lists usedin this analysis are comprehensive and taxonomic errorcannot be excluded. Nevertheless, multivariate statisticsare very robust in regard to completeness of the data setsand clusters are stable up to an error of 10–20% (Sheppard 1998). Re-examination of the chaetodontiddistribution data presented by Kemp (1998) using Bray-Curtis analysis revealed the same pattern as our morecomprehensive analysis based on Bray-Curtis similarity:the Arabian Gulf shows the lowest similarity to all othersites. Therefore the oppositional results are due to meth-odological problems of the cluster analysis, rather thanto incomplete species lists or taxonomic error. There aregradual changes between the different areas, but clusteranalysis forces gradual into stepwise changes. MDSplots are able to represent gradual differences and there-fore the MDS plots based on Bray-Curtis similarity andEuclidean distance are very similar (Fig. 7). However,there are other arguments that support the view of a lowsimilarity of the Arabian Gulf to the Red Sea. The Arabi-an Gulf shares more fish species from our data set withthe Indian Ocean than with the Red Sea. Cluster analysisand MDS plot of absence/presence data of hermatypiccorals revealed a closer relationship of the Red Sea to is-lands from the Central Indian Ocean than to the ArabianGulf and Southern Arabia (Sheppard 1998). Studies onthe zoogeographic relationships of grapsid and ocypodidcrabs have revealed that most of the Arabian Gulf spe-cies are of an “eastern” Indian Ocean origin. In addition,species of an “western” Indian Ocean origin (East Africaand Red Sea) are absent from the northern and westernGulf (Kuwait and Saudi Arabia) (Apel and Türkay1999). Reasons for these differences might be ecologicalrather than historical, because the Arabian Gulf and RedSea have been recolonised from the same area aftertransgression of sea level about 17,000 years ago. Theunfavourable oceanographic conditions for tropical spe-cies in the Arabian Gulf explain the relatively low spe-cies richness (Coles and Tarr 1990; Krupp and Almarri1996).
Summarising the arguments mentioned above, thebiogeographic analysis revealed the following pattern:(1) the species richness of fishes on coral reefs in theGulf of Aqaba is much higher than previously reported,and (2) the Red Sea and southern Arabia are significant-ly different from other sites of the Indian Ocean, but theaffiliation of the Arabian Gulf is not clear.
Our study has demonstrated that the shore fishes inthe Gulf of Aqaba show a relatively high biodiversity.Due to urbanisation, industrialisation, shipping activityand tourism in the Gulf of Aqaba, the environment is un-der growing pressure. Management for the protection ofthe marine resources is therefore needed. Scientific pro-grammes such as the Red Sea Program on Marine Sci-ences (RSP) and the Red Sea Marine Peace Park Projectprovide important baseline data for multinational re-search and conservation of the Gulf of Aqaba. Our re-
281
282
sults on the ecological parameters which structure theshore fish communities give valuable information for theestablishment of marine reserves at the Jordanian RedSea coast. Beside the highly important coral reefs, adja-cent habitats such as seagrass meadows should also beconsidered in the establishment of marine reserves.
Acknowledgements We would like to express our thanks to thefoundations, institutions and to the individuals that have madeour work possible: Director and staff of the Marine Science Sta-tion, Aqaba, Jordan, in particular O. Al-Momani; Aqaba SpecialEconomic Zone Authority; Office of Ocean and Coastal ResourceManagement (OCRM/NOS, NOAA) and USAID; M. Crospy(NOOA); Red Sea Program on Marine Sciences (RSP), funded bythe German Federal Ministry of Education and Research (BMBF,grant no. 03F0151A); Centre for Tropical Marine Ecology(ZMT), Bremen, Germany, in particular G. Hempel, C. Richter, P.Westhaus-Ekau and M. Birkicht; U. Zajonz (Senckenberg Re-search Institute, Germany), F. Krupp (PERSGA, Saudi Arabia),A.H. Abuzinada (NCWCD, Saudi Arabia) and J. Kemp (Univer-sity of York, UK) for providing us with species lists. G. Hempel,F. Krupp and reviewers gave valuable comments on the manu-script.
References
Abelson A, Shteinman B, Fine M, Kaganovsky S (1999) Masstransport from pollution sources to remote coral reefs in Eilat(Gulf of Aqaba, Red Sea). Mar Pollut Bull 38:25–29
Abu-Hilal AH (1985) Phosphate pollution in the Jordan Gulf ofAqaba. Mar Pollut Bull 16:281–285
Abu-Hilal AH (1987) Distribution of trace elements in nearshoresurface sediments from the Jordan Gulf of Aqaba (Red Sea).Mar Pollut Bull 18:190–193
Abu-Hilal AH, Badran MM (1990) Effect of pollution source onmetal concentration in sediment cores from the Gulf of Aqaba.Mar Pollut Bull 21:190–197
Ackerman JL, Bellwood DR (2000) Reef fish assemblages: a re-evaluation using enclosed rotenone stations. Mar Ecol ProgSer 206:227–237
Adjeroud M, Letourneur Y, Porcher M, Salvat B (1998) Factorsinfluencing spatial distribution of fish communities on a fring-ing reef at Mauritius, S.W. Indian Ocean. Environ Biol Fishes53:169–182
Anderson RC, Randall JE, Kuiter RH (1998) New records of fish-es from the Maldive Islands, with notes on other species. Ich-thyol Bull JLB Smith Inst Ichthyol 67(2):20–32
Apel M, Türkay M (1999) Taxonomic composition, distributionand zoogeographic relationships of the grapsid and ocypodidfauna of intertidal soft bottoms in the Arabian Gulf. EstuarCoast Shelf Sci 49 [Suppl A]:131–142
Aronson RB, Precht WF (1995) Landscape patterns of reef coraldiversity: a test of the intermediate disturbance hypothesis. JExp Mar Biol Ecol 192:1–14
Backhaus K, Erichson B, Plinke W, Weiber R (1994) MultivariateAnalysemethoden. Springer, Berlin Heidelberg New York
Badran MI, Foster P (1998) Environmental quality of the Jordani-an coastal waters of the Gulf of Aqaba, Red Sea. Aquat Eco-syst Health Manage 1:75–89
Baranes A, Golani D (1993) An annotated list on deep-sea fishescollected in the northern Red Sea, Gulf of Aqaba. Isr J Zool39:299–336
Bell JD, Galzin R (1984) Influence of live coral cover on coral-reef fish communities. Mar Ecol Prog Ser 15:265–274
Bell JD, Pollard DA (1989) Ecology of fish assemblages and fish-eries associated with seagrasses. In: Larkum AWD, McCombAJ, Shepherd SA (eds) Biology of seagrasses: a treatise on thebiology of seagrasses with special reference to the Australianregion. Elsevier, Amsterdam, pp 565–609
Bell JD, Harmelin-Vivien M, Galzin R (1985) Large scale spatialvariation in abundance of butterflyfishes (Chaetodontidae) onPolynesian reefs. Proc 5th Int Coral Reef Congr 5:421–426
Ben-Tuvia A, Diamant A, Baranes A, Golani D (1983) Analysis ofa coral reef fish community in shallow-waters of Nuweiba,Gulf of Aqaba, Red Sea. Bull Inst Oceanogr Fish 9:193–206
Birkeland C (1985) Ecological interactions between mangroves,seagrass beds, and coral reefs. In: Ecological interactions be-tween tropical coastal ecosystems. (UNEP regional seas re-ports and studies 73) UNEP. Earthprint, Stevenage, UK, pp1–65
Blum SD (1989) Biogeography of the Chaetodontidae: an analysisof allopatry among closely related species. Environ Biol Fish25:9–31
Bouchon-Navaro Y (1980) Quantitative distribution of the Chae-todontidae on a fringing reef of the Jordanian coast (Gulf ofAqaba, Red Sea). Tethys 9:247–251
Bouchon-Navaro Y (1986) Partitioning of food and space resourc-es by chaetodontid fishes on coral reefs. J Exp Mar Biol Ecol103:21–40
Bouchon-Navaro Y, Bouchon C (1989) Correlations betweenchaetodontid fishes and coral communities of the Gulf of Aqaba (Red Sea). Environ Biol Fish 25:47–60
Bouchon-Navaro Y, Harmelin-Vivien ML (1981) Quantitative dis-tribution of herbivorous reef fishes in the Gulf of Aqaba (RedSea). Mar Biol 63:79–86
Bouchon-Navaro Y, Bouchon C, Harmelin-Vivien ML (1985) Im-pact of coral degradation on a chaetodontid fish assemblage(Moorea, French Polynesia). Proc 5th Int Coral Reef Congr5:427–432
Brock RE (1982) A critique of the visual census method for as-sessing coral reef fish populations. Bull Mar Sci 32:269–276
Bryant D, Burke L, McManus J, Spalding M (1998) Reefs at risk:a map-based indicator of threats to the world's coral reefs.World Resource Institute, Washington
Carpenter KE, Miclat RI, Albaladeho, VD, Corpuz, VT (1981)The influence of substrate structure on the local abundanceand diversity of Philippine reef fishes. Proc 4th Int Coral ReefSymp Manila 2:497–502
Carpenter KE, Krupp F, Jones DA, Zajonz U (1997) Living ma-rine resources of Kuwait, Eastern Saudi Arabia, Bahrain, Qa-tar, and the United Arab Emirates: FAO species identificationfield guide for fishery purposes. Rome, FAO
Chabanet P, Ralambondrainy H, Amanieu M, Faure G, Galzin R(1997) Relationships between coral reef substrata and fish.Coral Reefs 16:93–102
Clark E, Ben-Tuvia A, Steinitz H (1968) Observations on a coastalfish community, Dahlak Archipelago, Red Sea. Sea Fish ResStn Haifa Bull 49:15–31
Clarke KR, Warwick RM (1994) Changes in marine communities:an approach to statistical analysis and interpretation. NaturalEnvironment Research Council, Swindon, UK
Coles SL, Tarr AB (1990) Reef fish assemblages in the westernArabian Gulf: a geographically isolated population in an ex-treme environment. Bull Mar Sci 47:696–720
Connell JH (1978) Diversity in tropical rain forests and coralreefs. Science 199:1302–1309
Edwards A, Rosewell J (1981) Vertical zonation of coral reef fish-es in the Sudanese Red Sea. Hydrobiologia 79:21–31
English C, Wilkinson C, Baker V (1994) Survey manual for tropi-cal marine resources. Australian Institute of Marine Science,Townsville, Queensland
FishBase (1999) FishBase 99: a global information system onfishes. CD-ROM, ICLARM, Manila
Fishelson L, Popper D, Avidor A (1974) Biosociology and ecolo-gy of pomacentrid fishes around the Sinai Peninsula (northernRed Sea) J Fish Biol 6:119–133
Forsskål P (1775) Descriptiones animalium, avium, amphibiorum,piscium, insectorum, vermium; quae in itinere orientali ob-servavit. Hauniae
Fricke HW (1977) Community structure, social organization andecological requirements of coral reef fishes (Pomacentridae).Helgol Wiss Meeresunters 30:412–426

Friedlander AM, Parrish JD (1998) Habitat characteristics affect-ing fish assemblages on a Hawaiian coral reef. J Exp Mar BiolEcol 224:1–30
Gladfelter WB, Ogden JC, Gladfelter EH (1980) Similarity and di-versity among coral reef fish communities: a comparison be-tween tropical western Atlantic (Virgin Islands) and tropicalcentral Pacific (Marshall Islands) patch reefs. Ecology61:1156–1168
Golani D, Diamant A (1999) Fish colonization of an artificial reefin the Gulf of Eilat, northern Red Sea. Environ Biol Fish54:275–282
Goren M, Dor M (1994) An updated checklist of the fishes of theRed Sea. CLOFRES II. The Israel Academy of Sciences andHumanities, Jerusalem
Harmelin-Vivien ML (1989) Reef fish community structure: anIndo-Pacific comparison. In: Harmelin-Vivien ML, BourlièreF (eds) Vertebrates in complex tropical systems. Springer, Ber-lin Heidelberg New York, pp 21–60
Harmelin-Vivien ML, Bouchon-Navaro Y (1981) Trophic rela-tionships among chaetodontid fishes in the Gulf of Aqaba(Red Sea). Proc 4th Int Coral Reef Symp 2:537–544
Hawkins JP, Roberts CN (1994) The growth of coastal tourism inthe Red Sea: present and future effects on coral reefs. Ambio23:503–508
Heck KL, Orth RJ (1980) Seagrass habitats: the roles of habitatcomplexity, competition and predation in structuring associat-ed fish and motile macroinvertebrate assemblages. In: Kennedy VS (ed) Estuarine perspectives. Academic Press,New York, pp 449–464
Hoeg-Guldberg O (1999) Climate change, coral bleaching and thefuture of the world's coral reefs. Mar Freshw Res 50:839–866
Jennings S, Boullé DP, Polunin NVC (1996) Habitat correlates ofthe distribution and biomass of Seychelles' reef fishes. Envi-ron Biol Fish 46:15–25
Jones GP, Syms C (1998) Disturbance, habitat structure and theecology of fishes on coral reefs. Aust J Ecol 23:287–297
Kemp J (1998) Zoogeography of the coral reef fishes of the Socrota Archipelago. J Biogeogr 25:919–933
Kemp J (2000) Zoogeography of the coral reef fishes of the north-eastern Gulf of Aden, with eight new records of coral reeffishes from Arabia. Fauna Arabia 18:293–321
Khalaf MA, Disi AM (1997) Fishes of the Gulf of Aqaba. MarineScience Station, Aqaba
Khalaf MA, Disi AM, Krupp F (1996) Four new records of fishesfrom the Red Sea. Fauna Saudi Arabia 15:402–406
Klausewitz W (1964) Die Erforschung der Ichthyofauna des RotenMeeres. In: Klunzinger CB (1870, reprint) Synopsis der Fische des Rothen Meeres. Cramer, Weinheim, pp v–xxxvi
Klausewitz W (1978) Zoogeography of the littoral fishes of the In-dian Ocean, based on the distribution of the Chaetodontidaeand Pomacanthidae. Senckenb Biol 59:25–39
Klausewitz W (1989) Evolutionary history and zoogeography ofthe Red Sea ichthyofauna. Fauna Saudi Arabia 10:310–337
Klunzinger CB (1884) Die Fische des Rothen Meeres. 1. Theil,Stuttgart
Kochzius M (1999) Interrelation of ichthyofana from a seagrassmeadow and coral reef in the Philippines. In: Séret B, Sire J-Y(eds) Proceedings of the 5th Indo-Pacific Fish Conference(Nouméa, 3–8 November 1997). Société Française d'Ichthyol-ogie and Institut de Recherche pou le Développement, Paris,pp 517–535
Kosaki RK (1991) Patterns of resource use and aggressive interac-tions among three species of coral-feeding butterflyfish(Chaetodontidae). Pac Sci 45(1):94
Krupp F, Almarri MA (1996) Fishes and fish assemblages of theJubail marine wildlife sanctuary. In: Krupp F, Abuzinada AH,Nader IA (eds) A marine wildlife sanctuary for the ArabianGulf. Environmental research and conservation following the1991 Gulf war oil spill. NCWCD, Riyadh/Senckenberg Re-search Institute, Frankfurt, pp 339–350
Krupp F, Paulus T, Nasr D (1993) Coral reef fish survey. In:Krupp F, Türkay M, El Hag AGD, Nasr D (eds) Comparative
ecological analysis of biota and habitats in littoral and shallowsublittoral waters of the Sudanese Red Sea. Project report.Forschungsinstitut Senckenberg, Frankfurt/Faculty of MarineScience and Fisheries, Port Sudan, pp 63–82
Krupp F, Müller T, Al-Sana'a M, Al-Marri M (1994) Survey offishes and fish assemblages in Dawhat ad-Dafi, Dawhat al-Musallamiya and the Gulf Coral Islands. In: Feltkamp E,Krupp F (eds) Establishment of a marine habitat and wildlifesanctuary for the Gulf region. Final report for phase II. For-schungsinstitut Senckenberg, Frankfurt, pp 537–558
Kunzmann A, Randall JE, Suprihanto I (1999) Checklist of theshore fishes of the Mentawai Islands, Nias Islands and thePadang region of West Sumatra. Naga 22(1): 4–10
Letourneur Y (1996) Dynamics of fish communities on Reunionfringing reefs, Indian Ocean. I. Patterns of spatial distribution.J Exp Mar Biol Ecol 195:1–30
Letourneur Y, Kulbicki M, Galzin R, Harmelin-Vivien M (1997)Comparaison des peuplements de poissons marins des récifsfrangeants de trois îles océaniques de l'Indo-Pacifique (LaRéunion, Moorea et la Nouvelle-Calédonie). Cybium 21 (1)[Suppl]:129–145
Lewis AR (1997) Effects of experimental coral disturbance on thestructure of fish communities on large patch reefs. Mar EcolProg Ser 161:37–50
Lindahl U, Öhman M, Schelten CK (2001) The 1997/1998 massmortality of corals: effects on fish communities on a Tanza-nian coral reef. Mar Pollut Bull 42:127–131
Luckhurst BE, Luckhurst K (1978) Analysis of the influence ofsubstrate variables on coral reef fish communities. Mar Biol49:317–323
Marshall N (1985) Ecological sustainable yield (fisheries poten-tial) of coral reef areas, as related to physiographic features ofcoral reef environments. Proc 5th Int Coral Reef Congr5:525–530
McClanahan TR (1994) Kenyan coral reef lagoon fish: effects offishing, substrate complexity, and sea urchins. Coral Reefs13:231–241
McGehee MA (1994) Correspondence between assemblages ofcoral reef fishes and gradients of water motion, depth and substrate size off Puerto Rico. Mar Ecol Prog Ser 105:243–255
Mergner H (1979) Quantitative ökologische Analyse eines Riffla-gunenareals bei Aqaba (Golf von Aqaba, Rotes Meer). HelgolWiss Meeresunters 32:476–507
Mergner H (2001) Riff-Forschung am Roten Meer. NaturwissRundschau 54(1):4–16
Mergner H, Schuhmacher H (1974) Morphologie, Ökologie undZonierung von Korallenriffen bei Aqaba, (Golf von Aqaba,Rotes Meer). Helgol Wiss Meeresunters 26:238–358
Mergner H, Schuhmacher H (1981) Quantitative Analyse der Ko-rallenbesiedlung eines Vorriffareals bei Aqaba (Rotes Meer).Helgol Meeresunters 34:337–354
Nielsen JG (1993) Peter Forsskål – a pioneer in Red Sea ichthyol-ogy. Isr J Zool 39:283–286
Ogden JC (1980) Faunal relationships in Caribbean seagrass beds.In: Phillips RC, McRoy CP (ed) Handbook to seagrass biolo-gy. Garland, New York, pp 173–198
Öhman MC, Rajasuriya A (1998) Relationships between structureand fish communities on coral and sandstone reefs. EnvironBiol Fish 53:19–31
Öhman MC, Rajasuriya A, Ólafsson E (1997) Reef fish assem-blages in north-western Sri Lanka: distribution patterns and in-fluence of fishing practises. Environ Biol Fish 49:45–61
Ormond R, Edwards A (1987) Red Sea fishes. In: Edwards AJ,Head SM (eds) Key environments – Red Sea. Pergamon Press,Oxford
Ormond RFG, Roberts JM, Jan R-Q (1996) Behavioural differ-ences in microhabitat use by damselfishes (Pomacentridae):implications for reef fish biodiversity. J Exp Mar Biol Ecol202:85–95
Parrish JD (1989) Fish communities of interacting shallow-waterhabitats in tropical oceanic regions. Mar Ecol Prog Ser58:143–160
283

Sheppard CRC, Sheppard ALS (1991) Corals and coral communi-ties of Arabia. Fauna Saudi Arabia 12:3–170
Sheppard C, Price A, Roberts C (1992) Marine ecology of theArabian Region. Academic Press, London
Smith MM, Heemstra PC (1991) Smith's sea fishes. SouthernBook Publishers, Johannesburg, South Africa
Souter DW, Lindén O (2000) The health and future of coral reefsystems. Ocean Coast Manage 43:657–688
StatSoft (1997) Statistica for Windows 5.1. StatSoft, Tulsa, Okla.Talbot FH, Goldman B (1972) A preliminary report on the diversi-
ty and feeding relationships of the reef fishes of One Tree Is-land, Great Barrier Reef System. In: Proceedings of a sympo-sium on corals and coral reefs, 1969. Marine Biological Asso-ciation of India, Kerala, India, pp 425–443
Thollot P (1992) Importance of mangroves for Pacific reef fishspecies, myth or reality? Proc 7th Int Coral Reef Symp2:934–941
Thompson AA, Mapstone BD (1997) Observer effects and train-ing in underwater visual surveys of reef fishes. Mar Ecol ProgSer 154:53–63
Thresher RE (1991) Geographic variability in the ecology of coralreef fishes: evidence, evolution, and possible implications. In:Sale PF (ed) The ecology of fishes on coral reefs. AcademicPress, San Diego, pp 401–436
Tortonese E (1983) List of fishes observed near Jeddah (SaudiArabia). J Fac Mar Sci Jeddah 3:105–110
UNEP/IUCN (1988) Coral reefs of the world. UNEP RegionalSeas Directories and Bibliographies. IUCN, Gland, Switzer-land and Cambridge, UK/UNEP, Nairobi, Kenya
Vine PJ, Vine MP (1980) Ecology of Sudanese coral reefs withparticular reference to reef morphology and distribution offishes. In: Proceedings of a symposium on the coastal and ma-rine environment of the Red Sea, Gulf of Aden, and TropicalWestern Indian Ocean, vol 1. Khartoum, Sudan, pp 88–140
Wahbeh MI (1981) Distribution, biomass, biometry and some as-sociated fauna of the seagrass community in the Jordan Gulfof Aqaba. Proc 4th Int Coral Reef Symp 2:453–459
Wahbeh MI, Ajiad A (1985a) Reproductive biology and growth ofthe goatfish, Parupeneus barberinus (Lacepede), from Aqaba,Jordan. J Fish Biol 26:583–590
Wahbeh MI, Ajiad A (1985b) The food and feeding habits of thegoatfish, Parupeneus barberinus (Lacepede), from Aqaba,Jordan. J Fish Biol 27:147–154
Walker DI, Ormond RFG (1982) Coral death from sewage andphosphate pollution at Aqaba, Red Sea. Mar Pollut Bull13:21–25
Weinstein MP, Heck, KL (1979) Ichthyofauna of seagrass mead-ows along the Caribbean coast of Panama and in the Gulf ofMexico: composition, structure and community ecology. MarBiol 50:97–107
Williams DMcB (1991) Patterns and processes in the distributionof coral reef fishes. In: Sale PF (ed) The ecology of fishes oncoral reefs. Academic Press, San Diego, pp 437–474
Williams DMcB, Hatcher AI (1983) Structure of fish communitieson outer slopes of inshore, mid-shelf and outer shelf reefs ofthe Great Barrier Reef. Mar Ecol Prog Ser 10:239–250
Winterbottom R (1985) Revision of the congrogadid Haliophis(Pisces:Perciformes), with the description of a new speciesfrom Indonesia, and comments on the endemic fish fauna ofthe northern Red Sea. Can J Zool 63:209–217
Winterbottom R, Anderson RC (1997) A revised checklist of theepipelagic and shore fishes of the Chagos Archipelago, Cen-tral Indian Ocean. Ichthyol Bull JLB Smith Inst Ichthyol66:1–28
Wrathall TJ, Roberts CM, Ormond RFG (1992) Territoriality inthe butterflyfish Chaetodon austriacus. Environ Biol Fish34:305–308
284
Pattengill CV, Semmens BX, Gittings SR (1997) Reef fish struc-ture at the Flower Gardens and Stetson Bank, NW Gulf ofMexico. Proc 8th Int Coral Reef Symp 1:1023–1028
Pittman SJ (1996) Coral reef fish assemblages of Baie Ternay Na-tional Marine Park and Baie Beau Vallon, Mahé, Seychelles.Draft report of the Seychelles Marine Parks Expedition 1995
Primer-E (2000) PRIMER 5 (Plymouth Routines in MultivariateEcological Research). PRIMER-E, Plymouth Marine Labora-tory, UK
Quinn TP, Ogden JC (1984) Field evidence of compass orientationin migrating juvenile grunts (Haemulidae). J Exp Mar BiolEcol 81:181–192
Randall JE (1983) Red Sea reef fishes. Immel, LondonRandall JE (1994) Twenty-two new records of fishes from the Red
Sea. Fauna Saudi Arabia 14:259–275Randall JE (1995) Coastal fishes of Oman. University of Hawaii
Press, HonoluluRandall JE, Anderson RC (1993) Annotated checklist of the epipe-
lagic and shore fishes of the Maldive Islands. Ichthyol BullJLB Smith Inst Ichthyol 59:1–47
Reese ES (1977) Coevolution of corals and coral feeding fishes ofthe family Chaetodontidae. Proc 3rd Int Coral Reef Symp1:267–274
Riegl B, Velimirov B (1991) How many damaged corals in theRed Sea reef systems? A quantitative survey. Hydrobiologia216/217:249–256
Righton D, Kemp J, Ormond R (1996) Biogeography, communitystructure and diversity of Red Sea and western Indian Oceanbutterflyfishes. J Mar Biol Assoc UK 76:223–228
Righton D, Miller M, Ormond R (1998) Correlates of territorysize in the butterflyfish Chaetodon austriacus (Rüppel). J ExpMar Biol Ecol 226:183–193
Rilov G, Benayahu Y (1998) Vertical artificial structures as an al-ternative habitat for coral reef fishes in disturbed areas. MarEnviron Res 45:431–451
Rilov G Benayahu Y (2000) Fish assemblages on natural versusvertical artificial reefs: the rehabilitation perspective. Mar Biol136:931–942
Risk MJ (1972) Fish diversity on a coral reef in the Virgin Islands.Atoll Res Bull 153:1–6
Roberts CM, Ormond RFG (1987) Habitat complexity and coralreef fish diversity and abundance on Red Sea fringing reefs.Mar Ecol Prog Ser 41:1–8
Roberts CM, Ormond RFG, Shepherd ARD (1988) The usefulnessof butterflyfishes as environmental indicators on coral reefs.Proc 6th Int Coral Reef Symp 2:331–336
Roberts CM, Shepherd ARD, Ormond RFG (1992) Large-scalevariation in assemblage structure of Red Sea butterflyfishesand angelfishes. J Biogeogr 19:239–250
Roblee MB, Ziemann JC (1984) Diel variation in the fish fauna ofa tropical seagrass feeding ground. Bull Mar Sci 34:335–345
Rossier O, Kulbicki M (2000) A comparison of fish assemblagesfrom two types of algal beds and coral reefs in the south-westlagoon of New Caledonia. Cybium 24(1):3–26
Sale PF (1980) The ecology of fishes on coral reefs. OceanogrMar Biol Annu Rev 18:367–421
Salita JT (2001) The influence of spatial arrangement of seagrass-es on fish abundance in Bolinao, northern Philippines. ZMTContributions 10, Centre for Tropical Marine Ecology, Bre-men
Schraut G (1995) Dokumentation, Zonierung und ökologische Un-tersuchungen der Ichthyofauna eines Riffabschnittes im nörd-lichen Roten Meer bei Sharm El Sheikh (südl. Sinai, Ägyp-ten). Diploma thesis, University of Marburg, Germany
Sheppard CRC (1998) Biodiversity patterns in Indian Ocean cor-als, and effect of taxonomic error in data. Biodivers Conserv7:847–868