Complex systems in simple environments: A demersal fish ...
12
Marine Biology 50, 17-28 (1978) MARINE BIOLOGY by Spfinger-Verlag 1978 Complex Systems in Simple Environments:A Demersal Rsh Community R.H. Bradbury Daparmmnt of Zoology, Univerdty of Queen=land; St. Lucia, Oueer~nd, Australia About 50 species of small, demersal fish live together on a shallow mud bottom in Moreton Bay, Queensland, Australia. The patterns of coexistence of these fish in this topographically uniform, but hydrologically unpredictable, habitat were stud- ied using partitioned information statistics. The patterns were considered simul- taneously over several environmental scales and biological levels. It was found that the community patterns were insensitive to the scale of the environment, but seemed to be coupled over supraspecific biological levels. It is suggested that supraspecific coupling allowed this complex community to exist in a simple environ- ment. A theory of community organization, which involves the concept of connected- ness, is proposed. This theory explains the above phenomena and also reconciles, in a general context, the predictability and unpredictability theories of communi- ty organization. I nlzoductlon Moreton Bay, on the southern coast of Queensland (153OE, 27os), has a diverse fish fauna. J.M. Thomson (personal com- munication) has recorded 345 species from this shallow protected area of 1380 km 2. Part of the Bay's faunal di- versity is the result of the presence of several well-defined habitats as evi- are similar. Choat (1969) has shown the way in which mixed-species schools of scarid fishes feed together on the same food. These studies were in the physical- ly heterogeneous environment of coral reefs, and it may well be that such en- vironments are amenable to subtle parti- tioning by many species (Smith, 1977). However, Russell et al. (1974), in a con- tinuing study of One Tree reef on the denced, for example, by their benthic as- southern extremity of the Great Barrier sociations (Stephenson et al., 1970). But Reef at 23os, gave some evidence for the an important part of the fish diversity unimportance of this factor in determin- is the result of the large numbers of co- ing the establishment of community struc- occurring species within any habitat. In ture. the present study, for example, 50 spe- The studies mentioned indicate that cies of demersal fish were recorded from species coexistence is a common phenom- the one small, rather uniform area of enon on coral reefs. Work on diverse about 20 km2. An attempt is made in this fish communities from non-reef environ- study to describe the patterns of distri- ments provides some evidence that the bution and abundance of these species in phenomenon is widespread (Lowe-McConnell, space and time in order to explain the 1969). species' coexistence. The fish communities on coral reefs The continued coexistence of many spe- are the most diverse of those considered cies exploiting the same habitat is not here (e.g. Russell, personal communica- an easily explained phenomenon, even if, tion, has recorded 900 species from One in fish communities at least, it is a Tree reef), and their environments are common one. Sale (1974) has described a among the most physically heterogeneous guild of 8 species of territorial coral and predictable (Grassle, 1973). Pre- reef fishes whose intra- and interspecif- dictability is used in the exact sense ic differences in exploiting their con- of Grassle (1973, p. 248): "Environmen- tested resource (space for a territory) tal changes that reduce predictability 0025-3162/78/0050/0017/S02.40
-
Upload
khangminh22 -
Category
Documents
-
view
1 -
download
0
Transcript of Complex systems in simple environments: A demersal fish ...
Marine Biology 50, 17-28 (1978) MARINE BIOLOGY �9 by Spfinger-Verlag 1978
Complex Systems in Simple Environments: A Demersal Rsh Community
R.H. Bradbury
Daparmmnt of Zoology, Univerdty of Queen=land; St. Lucia, Oueer~nd, Australia
About 50 species of small, demersal fish live together on a shallow mud bottom in Moreton Bay, Queensland, Australia. The patterns of coexistence of these fish in this topographically uniform, but hydrologically unpredictable, habitat were stud- ied using partitioned information statistics. The patterns were considered simul- taneously over several environmental scales and biological levels. It was found that the community patterns were insensitive to the scale of the environment, but seemed to be coupled over supraspecific biological levels. It is suggested that supraspecific coupling allowed this complex community to exist in a simple environ- ment. A theory of community organization, which involves the concept of connected- ness, is proposed. This theory explains the above phenomena and also reconciles, in a general context, the predictability and unpredictability theories of communi- ty organization.
I nlzoductlon
Moreton Bay, on the southern coast of Queensland (153OE, 27os), has a diverse fish fauna. J.M. Thomson (personal com- munication) has recorded 345 species from this shallow protected area of 1380 km 2. Part of the Bay's faunal di- versity is the result of the presence of several well-defined habitats as evi-
are similar. Choat (1969) has shown the way in which mixed-species schools of scarid fishes feed together on the same food. These studies were in the physical- ly heterogeneous environment of coral reefs, and it may well be that such en- vironments are amenable to subtle parti- tioning by many species (Smith, 1977). However, Russell et al. (1974), in a con- tinuing study of One Tree reef on the
denced, for example, by their benthic as- southern extremity of the Great Barrier sociations (Stephenson et al., 1970). But Reef at 23os, gave some evidence for the an important part of the fish diversity unimportance of this factor in determin- is the result of the large numbers of co- ing the establishment of community struc- occurring species within any habitat. In ture. the present study, for example, 50 spe- The studies mentioned indicate that cies of demersal fish were recorded from species coexistence is a common phenom- the one small, rather uniform area of enon on coral reefs. Work on diverse about 20 km2. An attempt is made in this fish communities from non-reef environ- study to describe the patterns of distri- ments provides some evidence that the bution and abundance of these species in phenomenon is widespread (Lowe-McConnell, space and time in order to explain the 1969). species' coexistence. The fish communities on coral reefs
The continued coexistence of many spe- are the most diverse of those considered cies exploiting the same habitat is not here (e.g. Russell, personal communica- an easily explained phenomenon, even if, tion, has recorded 900 species from One in fish communities at least, it is a Tree reef), and their environments are common one. Sale (1974) has described a among the most physically heterogeneous guild of 8 species of territorial coral and predictable (Grassle, 1973). Pre- reef fishes whose intra- and interspecif- dictability is used in the exact sense ic differences in exploiting their con- of Grassle (1973, p. 248): "Environmen- tested resource (space for a territory) tal changes that reduce predictability
0025-3162/78/0050/0017/S02.40
18 R.H. Bradbury: Complex Systems in Simple Environments
occur sporadically and without autocor- relation once to many times within the life span of an average adult individual of a species. The changes must differ sufficiently from the mean to result in differential mortality or viability." Predictable environments, such as coral
This area is the eastern part of the northwestern slopes and the adjoining basin in the terminology of Stephenson et al. (1970). Here, the sea bed slopes gently eastwards from 10 to 20 m (Newell, 1971) and the predominant sediment is mud (Maxwell, 1970), indicative of a hy-
reefs, would seem to offer rich possibil- drologically low energy regime. ities for partitioning among a diverse fish fauna. It is not surprising then that hypotheses about species coexis- tence in this environment should concen- trate on the nexus between the community and its environment. Grassle (1973) has emphasized the relative predictability of the environment that allows a high degree of specialization in the communi- ty. Russell et al. (1974), Goldman and Talbot (1976), and Sale (1977), on the other hand, have emphasized that even in the heterogeneous reef environment there can be unpredictability permitting simi- lar species to coexist.
It is hoped to gain some further in- sight into the relationship between the community and the environment in the present study by selecting an environ- ment that is unpredictable and of re- duced structural complexity, while still retaining a reasonably diverse fauna. Moreton Bay is hydrologically unpredict, able: Newell (1971, p. 34) concluded that "it is unlikely that the Bay ever exhibits the same hydrological structure twice". The study area chosen in the Bay was a soft mud bottom: a demersal en- vironment of reduced structural complex- ity. Fifty species of demersal fish co- existed in this habitat. The possibility exists here for discovering ecological mechanisms that permit a high degree of coexistence and that are not entrained
by the structural complexity or predict- ability of the environment
The results of the study bear on the important problem of the nexus between the community and its environment, and
Seven sites were selected within this area for repeated sampling during the study. They consisted of a centre site, and two concentric rings of satellite sites at a radial distance of 850 m and 2550 m from the centre site. This dispo- sition of sites was necessary for an ex- perimental design, the analysis of which will be presented in another report.
These sites were of the same general characteristics, the main differences being in depth and the coarseness of the mud substrate. The depths of the 7 sites were as follows: (i) Site 0 (centre site) 14 to 15 m; (ii) Site A (northern inner site) 16 m; (iii) Site B (12OO inner site) 15 to 16 m; (iv) Site C (240 ~ in- ner site) 13 to 14 m; (v) Site I (north- ern outer site) 18 m; (vi) Site 2 (120 ~ outer site) 16 m; (vii) Site 3 (240 ~ out- er site ) 12 m. Sites O, A, B and C had a fine muddy substrate; Sites I and 2, a sandy mud substrate; Site 3, a shell grit and mud substrate. The trend over the sampling area was a sloping into deeper water north and east from mud in- to muddy sand, with shell fragments in the mud in the shallower water to the southwest.
The sites were sampled with a small beam trawl using fast tows in order to obtain samples which would reflect the small-scale patterns of distribution in the demersal fish assemblage. The mouth of the beam trawl measured 180 x 60 cm and the net was constructed from webbing of 27 mm stretched mesh. The trawl was towed at 1.5 m sec -I for 5 min for a sam- ple. The catch was preserved for later
so on theories of community organization, analysis. It will be shown that the patterns of co- The sampling ground was visited, as existence in this assemblage cannot be explained satisfactorily by these theo- ries. A fundamental property of ecosys- tems, connectedness, will be proposed as the basis of a more general theory of community organization. This theory, it will be suggested, can accommodate both the present results and results obtained from other communities.
Collection of Samples
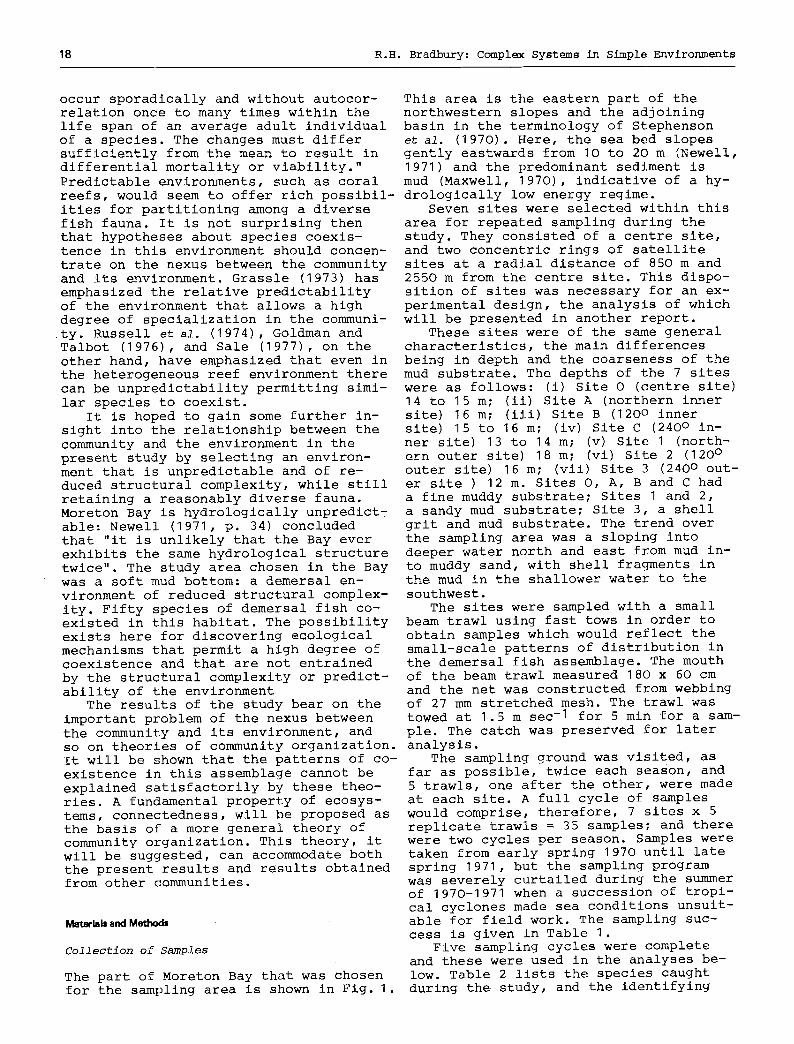
The part of Moreton Bay that was chosen for the sampling area is shown in Fig. 1.
far as possible, twice each season, and 5 trawls, one after the other, were made at each site. A full cycle of samples would comprise, therefore, 7 sites x 5 replicate trawls = 35 samples; and there were two cycles per season. Samples were taken from early spring 1970 until late spring 1971, but the sampling program was severely curtailed during the summer of 1970-1971 when a succession of tropi- cal cyclones made sea conditions unsuit- able for field work. The sampling suc- cess is given in Table 1.
Five sampling cycles were complete and these were used in the analyses be- low. Table 2 lists the species caught during the study, and the identifying
R.H. Bradbury: Complex Systems in Simple Environments 19
South Pacific Ocean , Bnb' J , / 27~ sl " 'sl~d . _
~ ~ " ~ ore i Study Area in Detail 153
/ / \ Mot.ton Bay / / "Site1 \ k N
/ \ ,~ [.,.-.J S tu~L.Are I / T .SiteA \ \ l I 850m I
/ ~ ( . . :o.) \ I l .SiteO j / SiteC. / k .SiteS /
\x~ / / Brisbane ~ / ~ , '~ River z-" ~. ~3 ~North \ ' ' - - . ._ i j / /
Stradbroke Island --
25' E
Fig. I. Location of sampling area
Table 1. Sampling success. + denotes site muc- cessfully sampled
Sampling cycles Sites
0 A B C 1 2 3
Early Ipring 1970 + + + + + + + Late spring 1970 + + + Early summer 1970-1971 + + Late summer 1970-1971
Early autumn 1971 + + + + + Late autumn 1971 + + + + + + + Early winter 1971 + + + Late winter 1971 + + + + + + + Early spring 1971 + + + + + + + Late spring 1971 + + + + + + +
numbers assigned to them for analysis purposes. Table 3 lists the numbers of individuals of these species caught in the fully sampled cycles.
Analytical Methods
Information-theoretic partitions were chosen because they are mathematically precise (Orloci, 1968), extensive, and reasonably well knownin their behaviour. They suffer biological disadvantages under some circumstances, but these are not significant in the present context as shown below. Consider the usual two- way array of species x sites. The Shan- non and Brillouin information statistics seem to have no qualitative/quantitative partition and, in a two-way array, seem able to be partitioned only into:
(total)=(species, ignoring sites) + (sites within species) (I)
Table 2. Species collected during sampling programme
Identifying Species
no.
1 Lovamia fasciata (shaw)
2 Apogonichthgs ellioti (Day) 3 Paramonacanthus oblongus otisensis Whitley 4 Paramonacanthus oblongus (T~nck and Schlegel) 5 ~onacanthus chinensis (Osbeck) 6 Suggrundus Jugosus (McCulloch) 7 Suggrundus harrlsii (McCulloch)
8 Platycephalus indicus (Linnaeus) 9 Callion~us sublaevis McCulloch
i0 Callion~us belcheri Richardson Ii Pseudorhombus spp. Juveniles 12 Pseudorhombus jenynsii (sleeker) 13 Pseudorhombus aislus (Hamilton-Buchanan)
14 ~lossus bilineatus (Lac~p~de) 15 Parapercis sp. 16 Euristhmus leptuIus (GO~nther) 17 centropogon mazmoratus (G~nther) 18 Minous versicolor 0gilby 19 Pelates quadrillneatus (Bloch) 20 U~eneus tragula Richardmon 21 Saurida undosquamls (R/chardson) 22 Saurida tumbil (Sloth) 23 Dasson variabilis (Cantor)
24 Spheroides k~m~Ttoni (Gray and Richardson) 25 Leiognathus m~retoniensis ogilby 26 Parachaeturichthys sp. 27 Lovam/a cook/ (Macleay) 28 Cepola australls Ogilby 29 Ctenotrgpauchan microcephalus (Bleak&r) 30 Gobiid ( J uve/lil e ) 31 G~notborax sp. 32 Hippocau~pus whitei Sleeker
33 Apogon atripes (Ogilby) 34 Adenapogon roseigaster (Ramsay and Ogilby) 35 Priacaulthus macracaunthus Cuvier
36 Polydactglus multiradiatus (G&nther) 37 Plotosus lineatu$ (ThOnberg) 38 Paraplagusia guttata (Macleay)
39 Parachaetodon ocellatus (Cuvier and Valenciennes) 40 Parapercls nebulosus (Quoy eu%d Gaimard) 41 Urolophus testaceus (Muller and Henle) 42 Lethr inid (Juvenile) 43 Speroides pleurosticus (G~nther) 44 Spa/id (Juvenile) 45 Gobiid (Juvenile) 46 Muraenesox sp. 47 Scorpaenid (Juvenile) 48 cy~bacephalus ne~atophthalmus (G~nther) 49 Trag~lichthys Jaculiferus (Cuvier) 50 Cnidoglandis macrocephalus (Cuvier and Valenciennes)
90 R.H. Bradbury: Complex Systems in Simple Environments
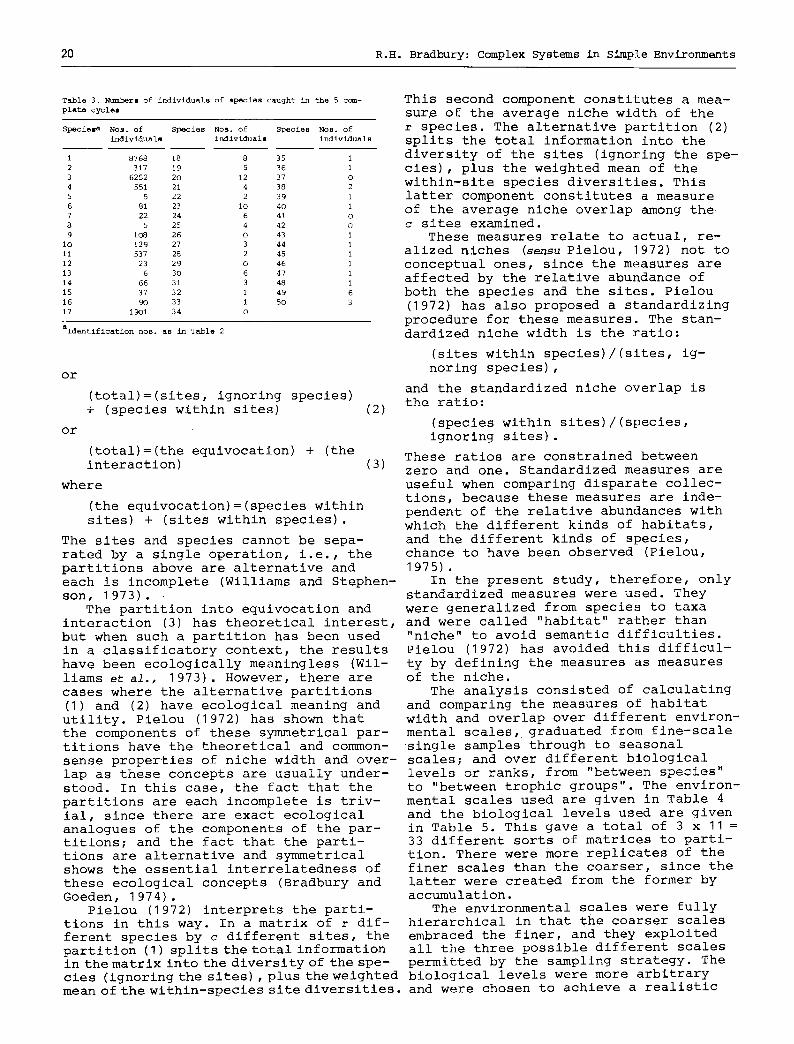
Table 3. Numherm of individuals of species caught in the 5 com-
plata cycles
SpeciaB a NOS. of Species NOS. of Species Nos. of individuals indlvidualB individuals
1 8768 18 8 35 1 2 317 19 5 36 1 3 6252 20 12 37 O 4 551 21 4 38 2 5 5 22 2 39 1 6 81 23 I0 40 1 7 22 24 6 41 0 8 5 25 4 42 O 9 i08 26 O 43 1
iO 129 27 3 44 i ii 537 28 2 45 1
12 23 29 0 46 1 13 6 30 6 47 1 14 66 31 3 48 1
15 37 32 1 49 6 16 9O 33 1 5O 3 17 1901 34 O
aIdantification nos. as in Table 2
or
or
(total)=(sites, ignoring species) + (species within sites) (2)
(total)=(the equivocation) + (the interaction) (3)
where
(the equivocation)=(species within sites) + (sites within species).
The sites and species cannot be sepa- rated by a single operation, i.e., the partitions above are alternative and each is incomplete (Williams and Stephen- son, 1973).
The partition into equivocation and
This second component constitutes a mea- sur~ of the average niche width of the r species. The alternative partition (2) splits the total information into the diversity of the sites (ignoring the spe- cies), plus the weighted mean of the within-site species diversities. This latter component constitutes a measure of the average niche overlap among the c sites examined.
These measures relate to actual, re- alized niches (sensu Pielou, 1972) not to conceptual ones, since the measures are affected by the relative abundance of both the species and the sites. Pielou (1972) has also proposed a standardizing procedure for these measures. The stan- dardized niche width is the ratio:
(sites within species)/(sites, ig- noring species),
and the standardized niche overlap is the ratio:
(species within sites)/(species, ignoring sites).
These ratios are constrained between zero and one. Standardized measureS are useful when comparing disparate collec- tions, because these measures are inde- pendent of the relative abundances with which the different kinds of habitats, and the different kinds of species, chance to have been observed (Pielou, 1975).
In the present study, therefore, only standardized measures were used. They were generalized from species to taxa
interaction (3) has theoretical interest, and were called "habitat" rather than but when such a partition has been used in a classificatory context, the results have been ecologically meaningless (Wil- liams et al., 1973). However, there are cases where the alternative partitions (I) and (2) have ecological meaning and utility. Pielou (1972) has shown that the components of these symmetrical par- titions have the theoretical and common-
"niche" to avoid semantic difficulties. Pielou (1972) has avoided this difficul- ty by defining the measures as measures of the niche.
The analysis consisted of calculating and comparing the measures of habitat width and overlap over different environ- mental scales, graduated from fine-scale single samples through to seasonal
sense properties of niche width and over- scales; and over different biological lap as these concepts are usually under- levels or ranks, from "between species" stood. In this case, the fact that the partitions are each incomplete is triv- ial, since there are exact ecological analogues of the components of the par- titions; and the fact that the parti- tions are alternative and symmetrical shows the essential interrelatedness of these ecological concepts (Bradbury and Goeden, 1974).
Pielou (1972) interprets the parti- tions in this way. In a matrix of r dif- ferent species by c different sites, the partition (I) splits the total information in the matrix into the diversity of the spe-
to "between trophic groups". The environ- mental scales used are given in Table 4 and the biological levels used are given in Table 5. This gave a total of 3 x 11 = 33 different sorts of matrices to parti- tion. There were more replicates of the finer scales than the coarser, since the latter were created from the former by accumulation.
The environmental scales were fully hierarchical in that the coarser scales embraced the finer, and they exploited all the three possible different scales permitted by the sampling strategy. The
cies (ignoring the sites), plus the weighted biological levels were more arbitrary mean of the within-species site diversities, and were chosen to achieve a realistic
R.H. Bradbury: Complex Systems in Simple Environments 21
Table 4. E n v i r o n m e n t a l scales used al columlns of matrices
SCale Description No. of Maxi~/m no. of
columns at replicates at this scale thls scale
(I) Fine/~i~m A~y 5 conaec~tlve trawl 5 samplem taken at on~ site during a sampling cycle
(2) Medium/coarse The 7 samples of a sammpling 7 cyole produced by accumulating thm 5 consecutive samples at each of the 7 sites
(3) Coarse/annual The samples of a sa~ipling cycle 5 accu~/lated and the 5 full cy- cles compared
x 7 per cycle x 5 cycles - 35
x I per cycle x 5 cycles - 5
x i - i
Table 5. Biological levels used as rows of matrices
Level DBscription NU~ of rows
at th~s level
(i) Between s~ies All species found on (Spp) study area 50
(2) Within "genera" Species found within multlspeclfic genera
Apogonids (Ap) Sp~ciee 1,2,27,33,34 5 Monacanthlds (Mort) Sl0ecime 3,4,5 3 Flatheads (Fb~) Species 6,7,8 3 Flatfishes (Ffh) Sl~ecles 11,12,13,14 4 Saurlds Species 21,22 2 Callionymids (Cal) S~ies 9, iO 2
(3) Between "gBnera" (Gen) All genera found on study area,
i.e., species of th~ above multi- species genera accumulated to the genus level 37
(4) within trophlc Species found within the following grips trophlc groups: Trophic group (Ti) Eat mainly fish; Species 2,6,7,8,
11,12,13 7 Trophlc group (Tii) Eat polychaetes and some ~lluacs;
Species 3,4,5,16,17,25,33 7 Trophic group (Till) Eat molluscs and some polychaetes;
Species 1,9,10,14 4
(5) Between trophlc Species accn/mulated within their groups (Tro) trophlc groups and th~n thele trophlc
groups compared 3
partition of the species on reasonable biological grounds.
At the "genus" level, several sets of closely related species were created. They were not all true genera in the taxonomic sense but, within a "genus", all were closely related taxonomically and morphologically. Only 5 "genera" were of interest, thesaurids being rare. The species not included in these "gen- era" could be regarded as monospecific genera and their within-genus informa- tion statistics would be zero. The 5 multispeciflc "genera" made up a large proportion (89%) of the individuals col- lected, so that is is reasonable to re- gard their behaviour as important within the aims of the study.
The trophic groups were established after a search through the literature. Quantitative studies on the feeding hab-
quantitative methods few. Some sort of quantitative estimates were obtained for 18 species, including 16 of the first 20 most abundant species, from De Groot (1971) for world flatfishes; Johnson (1972) for local callionymids; Lewis (1971) for local flatheads; and Brown (1968) for local apogonids, Euristhmus lepturus, monacanthids, scorpaenids and Leiognathus moretoniensis. The quantitative feeding data from these studies had to be edited carefully in order to compare them. The food categories were condensed to 4 types -- fish, molluscs, polychaetes and crustaceans -- with detritus, which was recorded inconsistently, omitted. The consumption of these food types was chopped into a 4-state variable. The spe- cies were then classified on feeding at- tributes by the agglomerative informa- tion theoretic program MULTBET (Lance and
its of the species were sought, but semi- Williams, 1967). The resulting dendro- quantitative estimates at the genus or gram is given in Fig. 2. It can be seen higher levels were eventually accepted, that the primary split generates a since the literature is meagre for trop- group of fish-eaters (Ti) and a group ical and subtropical species and good which rarely eat fish (Tii and Till).
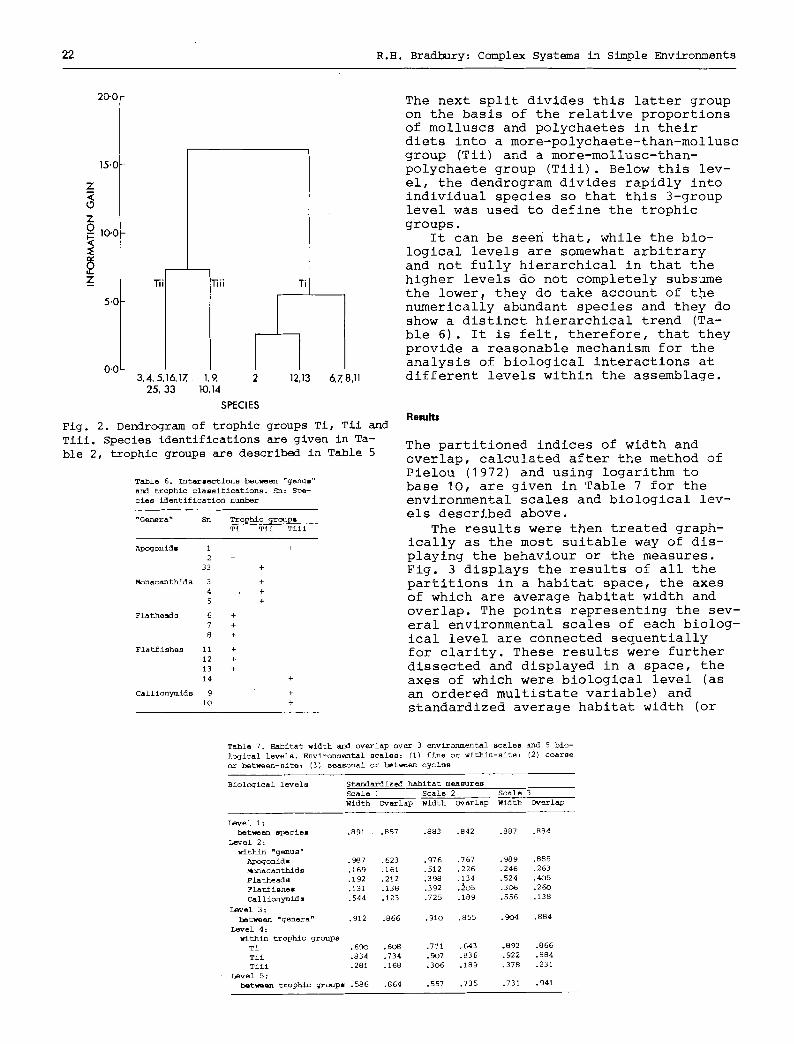
22 R.H. Bradbttry: Complex Systems in Simple Environments
20-0
15"0
Z < 0 Z 0 IO-G
z
5"C
O'C
Tii
14, 5,16,1Z, 25, 33
"5ii
I 9 2
10,14
SPs
12.13 &7. 8.11
Fig. 2. Dendrogram of trophic groups Ti, Tii and Till. Species identifications are given in Ta- ble 2, trophic groups are described in Table 5
Table 6. Intarsections batten "g~nus"
and trophic classifications. Sn: S~ cies identificatio~l nu~
"Genera" Sn Tro~hic ~rou~s Ti Tii Tiii
Apogonids 1 +
2 + 33 +
Monacanthld s 3 +
4 +
5 +
Flathe~ds 6 +
7 +
8 +
Flatfishes 11 + 12 +
13 +
14 +
Cal lionymlds 9 +
[O +
The next split divides this latter group on the basis of the relative proportions of molluscs and polychaetes in their diets into a more-polychaete-than-mollusc group (Tii) and a more-mollusc-than- polychaete group (Tiii). Below this lev- el, the dendrogram divides rapidly into individual species so that this 3-group level was used to define the trophic groups.
It can be seen that, while the bio- logical levels are somewhat arbitrary and not fully hierarchical in that the higher levels do not completely subsume the lower~ they do take account of the numerically abundant species and they do show a distinct hierarchical trend (Ta- ble 6). It is felt, therefore, that they provide a reasonable mechanism for the analysis of biological interactions at different levels within the assemblage.
R~uff,
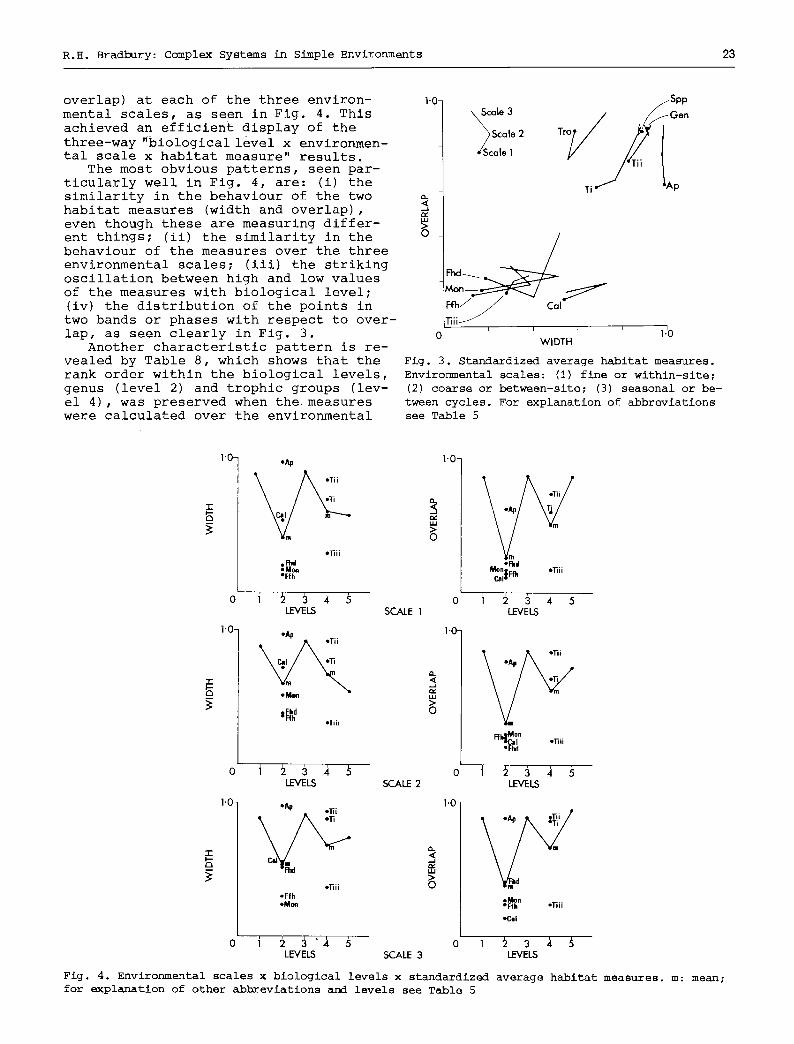
The partitioned indices of width and overlap, calculated after the method of Pielou (1972) and using logarithm to base 10, are given in Table 7 for the environmental scales and biological lev- els described above.
The results were then treated graph- ically as the most suitable way of dis- playing the behaviour or the measures. Fig. 3 displays the results of all the partitions in a habitat space, the axes of which are average habitat width and overlap. The points representing the sev- eral environmental scales of each biolog- ical level are connected sequentially for clarity. These results were further dissected and displayed in a space, the axes of which were biological level (as an ordered multistate variable) and standardized average habitat width (or
Table 7. Habitat width a~d overlap ovem 3 environmental scales and 5 bio-
logical levels. Environmental scales: (i) fine or within-site; (2) coarse or between-site; (3) seasonal or between cyclss
Biological levels Standardized habitat measures Scale i Scale 2 Scala 3 Width Overlap Width Overlap Width Overlap
Level i: h~t~en species .B91 .857
L~vel 2: wlth~ "g~nus"
A~o~idl Monacanthids Flatheads Flatfishes Cal lionymids
Lavel 3: b~tw~en "genera" .912 .866
Level 4: within trophlc groups
Ti .690 .~ Tii .834 .734 Tlli .281 .168
Level 5: bQtwQen trophlc gro~pm .586 .864
.883 .842 .887 .884
.910 .855 .904 .884
.771 .643 .892 .866
.907 .836 .922 .884
.306 .189 .378 .231
.557 .735 .731 .941
.g~7 .623 .976 .767 .989 .888
.169 .161 .512 .226 .246 .263
.192 .212 .398 .134 .524 .405
.131 .138 .392 .~O5 .306 .260
.544 .123 .725 .189 .586 .138
R.B. Bradbury: Camplex Systems in Simple Environments 23
overlap) at each of the three environ- mental scales, as seen in Fig. 4. This achieved an efficient display of the
three-way "biological level x environmen- tal scale x habitat measure" results.
The most obvious patterns, seen par- ticularly well in Fig. 4, are: (i) the similarity in the behaviour of the two habitat measures (width and overlap), even though these are measuring differ- ent things; (ii) the similarity in the behaviour of the measures over the three environmental scales; (iii) the striking oscillation between high and low values of the measures with biological level; (iv) the distribution of the points in two bands or phases with respect to over- lap, as seen clearly in Fig. 3.
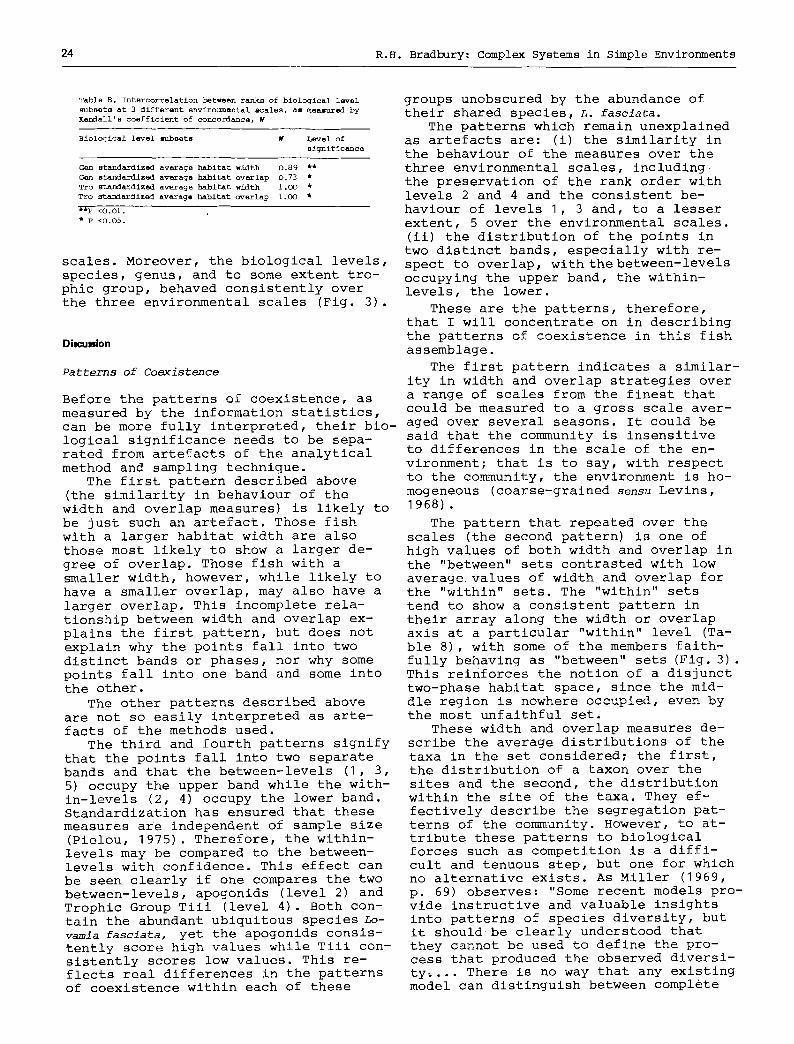
Another characteristic pattern is re- vealed by Table 8, which shows that the rank order within the biological levels, genus (level 2) and trophic groups (lev- el 4), was preserved when themeasures were calculated over the environmental
,.v.
1'0- ~le3
ale 2
ale I
Spp
~ / ~ G e n Tro ~ "
Ti ~ 'hAP
TiiiJ . , I .'0 0
WIDTH
Fig. 3. Standardized average habitat measures. Environmental scales: (i) fine or within-site; (2) coarse or between-site; (3) seasonal or be- tween cycles. For explanation of abbreviations see Table 5
"1-
"1-
1"0-
0 1"0-
~
~
,R~d oM~ "Hh
i :~ :) J, ..,) LEVELS
~
omen ,1iii
0
1.0-
I :~ :) ,V
~ ~
SCALE I
~IF 2
1.0-
1.6)-
~ n ~ C~I~FI ~ ,1iii
i ~ :) ,~ LEVELS
F f ~ an ,~ .1"iii
i :~ :) ,k .') L_FVE~
"~ ~
~L~ n ,nil
o i "~ :~ ' ,~ .~ o l "~ 3 ,~ .~ LEVELS SCALE 3 LEVELS
Fig. 4. Environmental scales x biological levels x standardized average habitat measures, m: mean; for explanation of other abbreviations and levels see Table 5
24 R.H. Bradbury: Complex Systems in Simple Environments
Table 8. Intercorrelatlon between ranks of biological lev~l subsets at 3 different enviro~mantal scales, as mea*m/xed by Kendall's coefficient of concordance, W
Biological level mlbsets W Level of
significance
Gen standardized average habitat width 0.89 ** Gen standardized average habitat overlap 0.73 *
Tro standardized average habitat width i .OO * Tro standardized average habitat overlap i .OO *
�9 *P <0.01. �9 P <0.05.
scales. Moreover, the biological levels, species, genus, and to some extent tro- phic group, behaved consistently over the three environmental scales (Fig. 3).
Patterns of Coexistence
groups unobscured by the abundance of their shared species, L. fasciata.
The patterns which remain unexplained as artefacts are: (i) the similarity in the behaviour of the measures over the three environmental scales, including the preservation of the rank order with levels 2 and 4 and the consistent be- haviour of levels I, 3 and, to a lesser extent, 5 over the environmental scales. (ii) the distribution of the points in two distinct bands, especially with re- spect to overlap, with the between-levels occupying the upper band, the within- levels, the lower.
These are the patterns, therefore, that I will concentrate on in describing the patterns of coexistence in this fish assemblage.
The first pattern indicates a similar- ity in width and overlap strategies over
Before the patterns of coexistence, as a range of scales from the finest that measured by the information statistics, could be measured to a gross scale aver- can be more fully interpreted, their bio- aged over several seasons. It could be logical significance needs to be sepa- said that the community is insensitive
rated from artefacts of the analytical method and sampling technique.
The first pattern described above (the similarity in behaviour of the width and overlap measures) is likely to be just such an artefact. Those fish with a larger habitat width are also those most likely to show a larger de- gree of overlap. Those fish with a smaller width, however, while likely to have a smaller overlap, may also have a larger overlap. This incomplete rela- tionship between width and overlap ex- plains the first pattern, but does not explain why the points fall into two distinct bands or phases, nor why some points fall into one band and some into the other.
The other patterns described above are not so easily interpreted as arte- facts of the methods used.
The third and fourth patterns signify that the points fall into two separate bands and that the between-levels (1, 3, 5) occupy the upper band while the with- in-levels (2, 4) occupy the lower band. Standardization has ensured that these measures are independent of sample size (Pielou, 1975). Therefore, the within- levels may be compared to the between- levels with confidence. This effect can be seen clearly if one compares the two between-levels, apogonids (level 2) and Trophic Group Tiii (level 4). Both con- tain the abundant ubiquitous species Lo- vamia fasciata, yet the apogonids consis- tently score high values while Tiii con- sistently scores low values. This re- flects real differences in the patterns of coexistence within each of these
to differences in the scale of the en- vironment; that is to say, with respect to the community, the environment is ho- mogeneous (coarse-grained sensu Levins, 1968).
The pattern that repeated over the scales (the second pattern) is one of high values of both width and overlap in the "between" sets contrasted with low averagevalues of width and overlap for the "within" sets. The "within" sets tend to show a consistent pattern in their array along the width or overlap axis at a particular "within" level (Ta- ble 8), with some of the members faith- fully behaving as "between" sets (Fig. 3). This reinforces the notion of a disjunct two-phase habitat space, since the mid- dle region is nowhere occupied, even by the most unfaithful set.
These width and overlap measures de- scribe the average distributions of the taxa in the set considered; the first, the distribution of a taxon over the sites and the second, the distribution within the site of the taxa. They ef- fectively describe the segregation pat- terns of the community. However, to at- tribute these patterns to biological forces such as competition is a diffi- cult and tenuous step, but one for which no alternative exists. As Miller (1969, p. 69) observes: "Some recent models pro- vide instructive and valuable insights into patterns of species diversity, but it should be clearly understood that they cannot be used to define the pro- cess that produced the observed diversi- ty~... There is no way that any existing model can distinguish between complete
R.H. Bradbury: Complex Systems in Simple Environments 25
niche differentiation and competitive exclusion .... "
Use of external evidence can avert this dilemma. The environment is struc- turally simple, and the feeding studies referred to above indicate that the spe- cies are occupying the same broad habi- tat. This is also supported by the re- sults above concerning the lack of ef- fect of environmental scale on the as- semblage. Under these circumstances,
that community's structure, but the lev- els concerned have usually been the spe- cies level and levels below it. Grassle (1972), for example, has discussed the genetic variability within marine popula- tions and its relationship with species diversity in a community. Grassle and Grassle (1974) have considered in great detail the role of local populations of opportunistic species in community struc- ture. Other studies have located supra-
the opportunities for "niche differentia- specific functional groupings which are tion" are limited and competitive exclu- sion is the more likely alternative when segregated distributions are found.
Larger width and overlap in this con- text can be regarded as evidence for a high competition regime where competi- tion for space is high and continuous, whereas low width and overlap can be re- garded as a situation where competition is low and exclusion may have been oper- ating. This high width and overlap re- gime in a homogeneous environment is the classic "paradox of the plankton" of Hutchinson (1961); while the low width and overlap regime is the frequently postulated, finely divided habitat of highly diverse ecosystems (Macarthur and
important in community structure, but the interactions between these groupings are not clear. Sale (1974) has described a guild of coral reef fishes coexisting in the same habitat, and Bradbury and Loya (1978) have located supraspecif- ic levels in an analysis of the spatial pattern of a coral community. The pres- ent study not only locates supraspecific levels of organization in a community, but also shows some of their properties.
Connectedness and a Theory of Community Organiza- tion
The structure of this community presents Levins, 1967). In this instance, however, some problems for a theory of community the same animals are exhibiting both these very different sorts of partition- ing strategies at different biological levels.
At this point, the above interpreta- tion may be consolidated in an idealiza- tion of the community. The community may be regarded as a complex system, resi- dent in a homogeneous environment, which maintains its complexity and high diver- sity by differential biological inter- actions alone - that is, without refer- ence in a system sense to the structure of the environment. The intolerable com- petitive situation of the "paradox" at the species level is ameliorated in the organisms' interactions within a smaller set by a switch to a low competition, high exclusion regime in these sets. This is offset by a highly competitive "paradox" situation between members of different genera, but is ameliorated at another level within which smaller sub- sets can organize exclusive distribu- tions.
There are two aspects of this ideal- ization which deserve further comment. Firstly, the system is maintaining it- self with partitioning strategies which involve more than one of its levels. Secondly, while one level is the species level, the other levels are supraspecif- ic levels of system organization.
Some studies have shown the contribu-
organization. Theories which relate com- munity structure to the predictability of the environment (Slobodkin and Sand- ers, 1969; Grassle, 1973) cannot explain the high diversity exhibited by the as- semblage in a structurally simple and un- predictable environment. On the other hand, theories which relate community structure to stochastic processes in the environment (Levin and Paine, 1974; Sale, 1974) would be hard-pressed to explain the manifest supraspecific structure in the assemblage. Furthermore, the pat- terns of coexistence suggest that any concept of competition as a structuring force in the community could not be sim- ple. At best such a concept would be relativistic, and imply a viewpoint; at worst it would be inappropriate and lack explanatory power.
It seems that a new theory of communi- ty organization is needed which can bet- ter explain the relationship between the community and its environment. An at- tempt at such a theory will now be made.
A fundamental property of ecosystems, connectedness, is proposed as the first step in building this theory. Connected- ness is a measure of a system's relation- al complexity, and the system's integri- ty is dependent on it. The property has been suggested in some other studies of systems. Conrad (1972) has shown that the various hierarchical levels of an
tio~ of responses from more than one lev- abstract system are connected directly el of a community to the maintenance of and more or less independently to their
28 R.H. Bradbury: Complex Systems in Simple Environments
environment. De Angelis (1975) has estab- rare, and may be highly connected for lished that increased connectedness amongst components of a food-web system increased the probability of stability of the system.
The theory asserts that it is a basic feature of ecosystems that they may be connected both with their environments and within themselves. That is to say, the above studies are generalized to the extent that connectedness with the en- vironment is equated as a conceptual property of systems with connectance within a system.
Complex and highly organized systems show a higher degree of connectedness than less complex, less organized sys- tems. Indices of community organization
particular historical reasons. For ex- ample, this community may have origi- nated from tropical stock.
Some ecosystems may show both modes of connectedness significantly. Theories which depend on only one mode will ex- plain the organization of their communi- ties only partially. Very complex com- munities such as coral reefs and rain forests may be like this.
Coral reefs, for example, may be viewed in such a way that one or other of the modes seems more apparent, and so one or other sort of theory suggests it- self (Bradbury, 1977). When considered on a large scale, say over several reef zones, the environmental predictability
such as species diversity or spatial pat- of the reef can be seen to be directly tern (Bradbury and Loya, 1978) will related to the species diversity (Loya, usually be close correlates of connected- 1972), even though the spatial heteroge- ness, and so reflect this trend.
Ecosystems may be classified on the primary mode of their connectedness. Some ecosystems will be connected pri- marily with their environments and not be connected so strongly within them- selves. Their communities will be expli- cable by hypotheses of the environmental predictability type (Slobodkin and Sand-
neity remains high (Bradbury and Loya, 1978). When considered at a finer scale, this spatial heterogeneity be- comes more important and the unpredict- ability of the environment is perceived as a more powerful correlate of communi- ty organization (Sale, 1974).
The different viewpoints themselves reflect the fact that this complex sys-
ers, 1969). A higher degree of connected- tem is operating at several levels. The ness will be possible with more predict- able environments, so these communities will lie along a spectrum from complex, highly connected systems permitted by predictable environments to simple, less connected systems in unpredictable en- vironments. Some temperate estuaries will show these communities in a graded series.
Some ecosystems may be connected pri- marily within themselves and show little connectedness with their environments. Their communities would lie outside the environmental predictability universe and would not be explicable by that fam- ily of theories. When highly connected, these communities would exhibit complex supraspecific phenomena, such as cou-
system's overall behaviour, it is sug- gested, can be more comprehensively ex- plained by reference to its modes of con- nectedness. If these coral reef communi- ties are highly connected internally, then supraspecific phenomena such as the formation of guilds (Sale, 1974) or crit- ical units (Bradbury and Loya, 1978) would be efficient mechanisms for them to exploit fine-scale unpredictability. If the same communities are also highly connected with their environments, then they could be expected to enhance inde- pendently their complexity in regions of greater overall predictability. When reef communities have been viewed simul- taneously at several biological levels (corals, Bradbury and Loya, 1978) or
pling across hierarchical levels (as in over several environmental scales (fish, the present study) or formation of supra- Bradbury and Goeden, 1974) then both specific units such as guilds; when less modes of connectedness have been appa- connected, they would be simple, undi- verse communities without supraspecific phenomena. It is suggested that the demersal fish community under study is one of these primarily internally con- nected systems, and its degree of con- nectedness is high.
The importance of the demersal fish community is this. By being a highly and primarily internally connected system in a simplified and unpredictable environ- ment, it demonstrates the essential in- dependence between the modes of connect- edness. These communities are probably
rent (although they were not couched in these terms). This suggests that connect- edness provides a unifying interpreta- tion for these communities at the same time as it relates them to communities showing only one mode of connectedness.
In summary, the theory suggests that communities become complex, and there- fore diverse, primarily through their connectedness; and that this connected- ness has two basic modes: internal and system-environment. Ecosystems may be classified by their modes and this clas- sification helps explain the differences
R.H. Bradbury: Complex Systems in Simple Environments 27
between present theories of community
organization. Communities primarily con- nected with their environments are ex- plicable by environmental predictability type theories, while those rare communi- ties primarily internally connected are not explained by theories of this family. Complex communities strongly connected both internally and with their environ- ments are explicable partially by both predictability and unpredictability the- ories when a restricted viewpoint is used. The concept of connectedness al- lows these systems to be explained more fully while still retaining a wide per- spective of their structure and function.
Bradlm/ry, R.H. : Independent lies and holistic truths: towards a theory of coral reef com- munities as complex systems. Proc. 3rd int. Syrup. coral Reefs 1, I-7 (1977). (Ed. by D.L. Taylor. Miami: School of Marine and Atmospher- ic Sciences, University of Miami)
- and G.D. Goeden: The partitioning of the reef slope environment by resident fishes. Proc. 2nd int. Syrup. coral Reefs I, 167-178 (1974). (Ed. by A.M. Cameron et al. Brisbane: Great Barrier Reef Committee)
- and Y. Loya: A heuristic analysis of spatial patterns of hermatypic corals at Eilat, Red Sea. Am. Nat. 112, 493-507 (1978)
Brown, I.W. : The food and feedin9 habits of five species of Moreton Bay fish, 185 pp. M.Sc. thesis, University of Queensland 1968
Choat, J.H. : Studies on the biology of labroid fishes (Labridae and Scaridae) at Heron Is- land, Great Barrier Reef, Vol. i, 294 pp; Vol. 2, 140 pp. Ph.D. thesis, University of Queensland 1969
Conrad, M. : Statistical and hierarchical aspects of biological organization. In: Towards a the- oretical biology. Vol. 4. Essays, pp 189-221. Ed. by C.H. Waddington. Edinburgh: Edinburgh University Press 1972
De Angelis, D.L. : Stability and connectance in food web models. Ecology 56, 238-243 (1975)
De Groot, S.J. : On the relationships between morphology of the alimentary tract, food and feeding behaviour in flatfishes (Pisces: Pleuronectiformes). Neth. J. Sea Res. 5, 121- 196 (1971)
Goldman, B. and F.H. Talbot: Aspects of the ecol- ogy of coral reef fishes. In: Biology and geology of coral reefs. Vol. III. Biology 2, pp 125-154. Ed. by O.A. Jones and R. Endean. New York: Academic Press 1976
Grassle, J.F.: Species diversity, genetic vari- ability and environmental uncertainty. In: Fifth Eh/ropean Marine Biological Symposium, pp 19-26. Ed. by B. Battaglia. Padua: Piccin Editore 1972
- Variety in coral reef communities. In: Biolo- gy of coral reefs, %7ol. II. Biology 1, pp 247-
270. Ed. by O.A. Jones and R. Endean. New York: Academic Press 1973
- and J.P. Grassle: Opportunistic life histo- ries and genetic systems in marine benthic polychaetes. J. mar. Res. 32, 253-284 (1974)
Hutchinson, G.E. : The paradox of the plankton. Am. Nat. 95, 137-145 (1961)
Johnson, C.R.: Biology and ecology of Calliony- mus belcheri (Pisces: Callionymidae). Copela 1972, 461-470 (1972)
Lance, G.N. and W.T. Williams: Mixed data classi- ficatory programs. I. Agglomerative systems. Aust. Comput. J. 1, 15-20 (1967)
Levin, S.A. and R.T. Paine: Disturbance, patch formation and community structure. Proc. natn. Acad. Sci. U.S.A. 71, 2744-2747 (1974)
Levins, R. : Evolution in changing environments, 120 pp. Princeton: Princeton University Press 1968
Lewis, A.D.: A comparative study of the biology of five South Queensland flatheads (Platyce- phalidae), 186 pp. B.Sc. (Hons.) thesis, Uni- versity of Queensland 1971
Lowe-McConnell, R.H.: Speciation in tropical freshwater fishes. Biol. J. Linn. Soc. I, 51- 75 (1969)
Loya, Y. : Community structure and species diver- sity of hermatypic corals at Eilat, Red Sea. Mar. Biol. 13, 100-123 (1972)
Macarthur, R.H. and R. Levins: The limiting simi- larity of coexisting species. Am. Nat. 1OO, 603-609 (1967)
Maxwell, W.G.H. : The sedimentary framework of Moreton Bay. Aust. J. mar. Freshwat. Res. 21, 71-88 (1970)
Miller, R.S. : Competition and species diversity. Brookhaven Syrup. Biol. 22, 63-70 (1969)
Newell, B.S. : The hydrological environment of Moreton Bay, Queensland, 1967-68. Tech. Pap. Div. Fish. Oceanogr. C.S.I.R.O. Aust. 30, 1- 35 (1971)
Orloci, L. : Information analysis in phytosociol- ogy; partition, classification and prediction. J. theor. Biol. 20, 271-284 (1968)
Pielou, E.C.: Niche width and niche overlap: a method for measuring them. Ecology 53 , 687- 692 (1972)
- Ecological diversity, 165 pp. New York: Wiley- Interscience 1975
Russell, B.C., F.H. Talbot and S. Dome: Patterns of colonization of artificial reefs by coral reef fishes. Proc. 2nd int. Symp. coral Reefs I, 207-215 (1974). (Ed. by A.M. Cameron et al. Brisbane: Great Barrier Reef Committee)
Sale, P.F.: Mechanisms of co-existence in a guild of territorial fishes at Heron Island. Proc. 2nd int. Symp. coral Reefs i, 193-206 (1974). (Ed. by A.M. Cameron et al. Brisbane: Great Barrier Reef Committee)
- Maintenance of high diversity in coral reef fish communities. Am. Nat. 111, 337-359 (1977)
Slobodkln, L.B. and H.L. sanders: On the contri- bution of environmental predictability to spe- cies diversity. Brook_haven Symp. Biol. 22, 82- 95 (1969)
28 R.H. Bradbury: Complex Systems in Simple Environments
Smith, C.L.: Coral reef fish communities -- order and chaos. Proc. 3rd int. Symp. coral Reefs 1, 21-22 (1977). (Ed. by D.L. Taylor. Miami: School of Marine and Atxnospheric Sciences, University of Miami)
Stephenson, W., W.T. Williams and G.N. Lance: The macrobenthos of Moreton Bay. Ecol. Monogr. 40, 459-494 (1970)
Williams, W.T., G.N. Lance, L.J. Webb and J.G. Tracey: Studies in the numerical analysis of complex rain-forest communities. VI. Models for the classification of quantitative data. J. Ecol. 61, 47-70 (1973)
and W. Stephenson: The analysis of three- dimensional data (sites x species x times) in marine ecology. J. exp. mar. Biol. Ecol. 11, 207-227 (1973)
Dr. R.H. Bradbury Office of National Assessments Canberra, A.C.T. 2600 Australia
Date of final manuscript acceptance: June 16, 1978. Communicated by G.F. Humphrey, Sydney