Response of demersal fish communities to the presence of fish farms
10
MARINE ECOLOGY PROGRESS SERIES Mar Ecol Prog Ser Vol. 288: 241–250, 2005 Published March 10 INTRODUCTION The expansion of fish farming in the coastal zone of the Mediterranean over the last 20 yr has raised the issue of the interaction between fish farming and fish- eries, with various implications for the management of marine resources. This interaction may be addressed at various spatial scales and it is not obvious that the answer will be scale-independent. A considerable research effort has been invested over the last decades to investigate the environmental impacts of aquacul- ture (Gowen & Bradburry 1987, Wu 1995, Fernandes et al. 2001). These effects are expressed at various spatial and temporal scales (Karakassis 1998), depending on the nature of the waste released, the physical, hydro- graphic and ecological characteristics of the site, and the efficiency of the management of the farms. The effects on small spatial scales (beneath or in close vicinity to cages) have been widely investigated, including effects on sediment chemistry (Holby & Hall 1991, Hall et al. 1992, Holmer & Kristensen 1992, Karakassis et al. 1998, Holmer et al. 2002), on benthic communities (Brown et al. 1987, Weston 1990, Mazzola et al. 1999, 2000, Karakassis et al. 2000, La Rosa et al. 2001, Mirto et al. 2002), on sea grass (Delgado et al. 1999, Pergent et al. 1999, Ruiz et al. 2001, Holmer et al. 2003), and on nutrients and plankton within the area of the farm (Pitta et al. 1999, Karakassis et al. 2001). Most of the aforementioned studies have indicated that the effects of aquaculture on the benthic environ- © Inter-Research 2005 · www.int-res.com *Email: [email protected] Response of demersal fish communities to the presence of fish farms A. Machias 1, *, I. Karakassis 2 , M. Giannoulaki 1 , K. N. Papadopoulou 1 , C. J. Smith 1 , S. Somarakis 3 1 Hellenic Centre of Marine Research, PO Box 2214, 71003 Iraklion, Crete, Greece 2 Department of Biology, University of Crete, PO Box 2208, 41409 Iraklion, Crete, Greece 3 Department of Biology, University of Patras, 26500 Patras, Greece ABSTRACT: The hypothesis that the presence of fish farms affects the communities of wild fish at large spatial scales was investigated through experimental trawl surveys. Three regions of the Aegean Sea with aquaculture zones were sampled in May and September (reproductive and recruit- ment periods, respectively for most species in the Aegean Sea). In each region, 2 sub-areas were sampled: 1 located nearby the fish farming zones (within 2 to 3 n mile) and a similar site (‘reference site’) far away from these zones (> 20 n mile). Three replicate hauls were made in each sub-area for each of the 3 investigated regions. Significant differences were observed in community structure between farming and reference sites, which were mainly due to quantitative rather than qualitative aspects. The overall abundance and/or biomass of wild demersal fish was significantly higher near the fish farms in every region studied during May without any significant change in diversity or bio- diversity. During the recruitment period in September, total abundance and biomass were fairly similar. These findings support the hypothesis that the presence of fish farms affects the wild fish populations in the oligotrophic eastern Mediterranean at a spatial scale larger than the immediate vicinity of fish cages. It seems that during the recruitment period all sites were stocked with fish close to the carrying capacity of the respective areas, and by late spring the areas close to fish farming zones had suffered little losses during winter, whereas populations at the reference sites had decreased substantially. KEY WORDS: Fish communities · Fisheries · Aquaculture · Mediterranean Resale or republication not permitted without written consent of the publisher
-
Upload
shearerlyn -
Category
Documents
-
view
1 -
download
0
Transcript of Response of demersal fish communities to the presence of fish farms
MARINE ECOLOGY PROGRESS SERIESMar Ecol Prog Ser
Vol. 288: 241–250, 2005 Published March 10
INTRODUCTION
The expansion of fish farming in the coastal zone ofthe Mediterranean over the last 20 yr has raised theissue of the interaction between fish farming and fish-eries, with various implications for the management ofmarine resources. This interaction may be addressedat various spatial scales and it is not obvious that theanswer will be scale-independent. A considerableresearch effort has been invested over the last decadesto investigate the environmental impacts of aquacul-ture (Gowen & Bradburry 1987, Wu 1995, Fernandes etal. 2001). These effects are expressed at various spatialand temporal scales (Karakassis 1998), depending onthe nature of the waste released, the physical, hydro-
graphic and ecological characteristics of the site, andthe efficiency of the management of the farms. Theeffects on small spatial scales (beneath or in closevicinity to cages) have been widely investigated,including effects on sediment chemistry (Holby & Hall1991, Hall et al. 1992, Holmer & Kristensen 1992,Karakassis et al. 1998, Holmer et al. 2002), on benthiccommunities (Brown et al. 1987, Weston 1990, Mazzolaet al. 1999, 2000, Karakassis et al. 2000, La Rosa et al.2001, Mirto et al. 2002), on sea grass (Delgado et al.1999, Pergent et al. 1999, Ruiz et al. 2001, Holmer et al.2003), and on nutrients and plankton within the area ofthe farm (Pitta et al. 1999, Karakassis et al. 2001).
Most of the aforementioned studies have indicatedthat the effects of aquaculture on the benthic environ-
© Inter-Research 2005 · www.int-res.com*Email: [email protected]
Response of demersal fish communitiesto the presence of fish farms
A. Machias1,*, I. Karakassis2, M. Giannoulaki1, K. N. Papadopoulou1, C. J. Smith1,S. Somarakis3
1Hellenic Centre of Marine Research, PO Box 2214, 71003 Iraklion, Crete, Greece2Department of Biology, University of Crete, PO Box 2208, 41409 Iraklion, Crete, Greece
3Department of Biology, University of Patras, 26500 Patras, Greece
ABSTRACT: The hypothesis that the presence of fish farms affects the communities of wild fish atlarge spatial scales was investigated through experimental trawl surveys. Three regions of theAegean Sea with aquaculture zones were sampled in May and September (reproductive and recruit-ment periods, respectively for most species in the Aegean Sea). In each region, 2 sub-areas weresampled: 1 located nearby the fish farming zones (within 2 to 3 n mile) and a similar site (‘referencesite’) far away from these zones (>20 n mile). Three replicate hauls were made in each sub-area foreach of the 3 investigated regions. Significant differences were observed in community structurebetween farming and reference sites, which were mainly due to quantitative rather than qualitativeaspects. The overall abundance and/or biomass of wild demersal fish was significantly higher nearthe fish farms in every region studied during May without any significant change in diversity or bio-diversity. During the recruitment period in September, total abundance and biomass were fairlysimilar. These findings support the hypothesis that the presence of fish farms affects the wild fishpopulations in the oligotrophic eastern Mediterranean at a spatial scale larger than the immediatevicinity of fish cages. It seems that during the recruitment period all sites were stocked with fish closeto the carrying capacity of the respective areas, and by late spring the areas close to fish farmingzones had suffered little losses during winter, whereas populations at the reference sites haddecreased substantially.
KEY WORDS: Fish communities · Fisheries · Aquaculture · Mediterranean
Resale or republication not permitted without written consent of the publisher
Mar Ecol Prog Ser 288: 241–250, 2005
ment are found within a short distance, normally notexceeding 25 to 30 m from the edge of fish cages; how-ever, it is well known that fish farming releases a sub-stantial amount of nutrients into the marine environ-ment (Holby & Hall 1991, Hall et al. 1992) and it would,therefore, be reasonable to expect effects at largerspatial scales, particularly when a zone of farms isestablished in a coastal bay. Such large scale effectshave been reported by Pohle et al. (2001) from theCanadian coast, showing signs of stress for benthicmacrofauna at distances >200 m from any fish farm inthat area. Effects on wild fish have been investigatedat very short spatial scales (Carss 1990, 1994, Dempsteret al. 2002), indicating a considerable increase in wildfish abundance and biomass in the immediate vicinityof fish cages. However, it is not known whether suchchanges also affect fish communities in the broaderarea surrounding aquaculture development zones andparticularly in oligotrophic environments where nutri-ent scarcity limits productivity including fisheries pro-duction. This type of information would be importantin order to estimate the potential negative or positiveeffects of aquaculture on coastal fisheries and, there-fore, to conclude whether there is an objective basis forconflict between these 2 important uses of the coastalzone.
In the present study, we investigated the effect of thepresence of fish farms on marine biota of wild fish in 3areas in the Aegean Sea. The objective of this studywas to test the hypothesis that the presence of fishfarms, and the associated change in the fluxes of nutri-ents and organic material, could cause a large-scaleeffect on fish communities in the area of an aquacul-ture zone.
MATERIALS AND METHODS
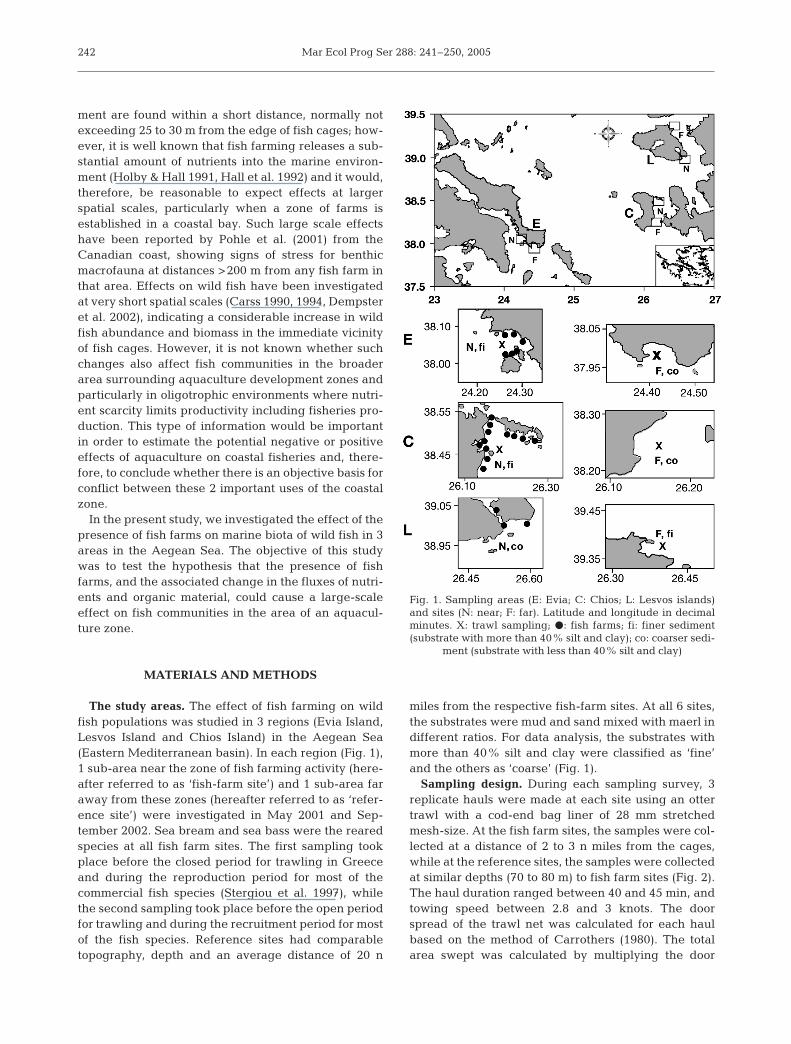
The study areas. The effect of fish farming on wildfish populations was studied in 3 regions (Evia Island,Lesvos Island and Chios Island) in the Aegean Sea(Eastern Mediterranean basin). In each region (Fig. 1),1 sub-area near the zone of fish farming activity (here-after referred to as ‘fish-farm site’) and 1 sub-area faraway from these zones (hereafter referred to as ‘refer-ence site’) were investigated in May 2001 and Sep-tember 2002. Sea bream and sea bass were the rearedspecies at all fish farm sites. The first sampling tookplace before the closed period for trawling in Greeceand during the reproduction period for most of thecommercial fish species (Stergiou et al. 1997), whilethe second sampling took place before the open periodfor trawling and during the recruitment period for mostof the fish species. Reference sites had comparabletopography, depth and an average distance of 20 n
miles from the respective fish-farm sites. At all 6 sites,the substrates were mud and sand mixed with maerl indifferent ratios. For data analysis, the substrates withmore than 40% silt and clay were classified as ‘fine’and the others as ‘coarse’ (Fig. 1).
Sampling design. During each sampling survey, 3replicate hauls were made at each site using an ottertrawl with a cod-end bag liner of 28 mm stretchedmesh-size. At the fish farm sites, the samples were col-lected at a distance of 2 to 3 n miles from the cages,while at the reference sites, the samples were collectedat similar depths (70 to 80 m) to fish farm sites (Fig. 2).The haul duration ranged between 40 and 45 min, andtowing speed between 2.8 and 3 knots. The doorspread of the trawl net was calculated for each haulbased on the method of Carrothers (1980). The totalarea swept was calculated by multiplying the door
242
Fig. 1. Sampling areas (E: Evia; C: Chios; L: Lesvos islands)and sites (N: near; F: far). Latitude and longitude in decimalminutes. X: trawl sampling; d: fish farms; fi: finer sediment(substrate with more than 40% silt and clay); co: coarser sedi-
ment (substrate with less than 40% silt and clay)
Machias et al.: Effects of fish farms on wild fish
spread by the vessel speed and the fishing time. Fishspecies abundance and biomass were expressed asnumber of fish or biomass (g) per km2.
Data analysis. To test the effects of aquaculture onthe fish communities, the following measures werecalculated: number of species per haul (S). Since thenumber of species is sensitive to the total abundance,we also used the Shannon-Wiener diversity (H') andthe J evenness indices, which standardise the samplesize with respect to abundance and species number.Furthermore, we calculated the Simpson (1 – λ) index(i.e. dominance), which is known to be one of the leastaffected by sample size (Karakassis et al. 1996). Inaddition, the new biodiversity indices (∆*, ∆+, s∆+,λ+), based on taxonomic distinctness (Warwick &Clarke 1995, Clarke & Warwick 1998), were calcu-lated. Taxonomic distinctness (∆*) is the average pathlength between 2 randomly chosen individuals fromthe sample, conditional on them being of differentspecies. This is a measure of the average degree towhich individuals in an assemblage are related toeach other (Warwick & Clarke 1995). Average taxo-nomic distinctness (∆+) is the mean path lengththrough the taxonomic tree connecting every pair of
species in the tree (Clarke & Warwick 1998). It is cal-culated by summing the path lengths through a taxo-nomic tree between every pair of species in the list,and dividing by the number of paths. Total taxonomicdistinctness (s∆+) is the sum (over all species) of theaverage distance of each species to all other species.It provides an estimate of the total taxonomic distinct-ness of the tree of the species present in the commu-nity. Finally, variation in taxonomic distinctness (λ+) isthe variance of the pairwise path lengths betweenevery pair of species in the list, reflecting the uneven-ness of the taxonomic tree. Multivariate analysis offish community data (double square-root transforma-tion) involved the use of the Bray-Curtis similarityindex, and cluster and MDS analyses. The contribu-tion of each species to the average Bray-Curtis dissim-ilarity between groups of combinations as well as tothe average Bray-Curtis similarity within a group ofcombinations, was identified using SIMPER analysis(Clarke & Warwick 1994). All these analyses werecarried out by means of the PRIMER-5 software(Clarke & Warwick 1994).
The log-transformed abundance and biomass data aswell as the diversity and biodiversity indices werecompared by means of analysis of variance (ANOVA)after checking for homogeneity of variance (Zar 1984).The comparisons included region, fish farm presenceand substrate per season.
RESULTS
Abundance and biomass
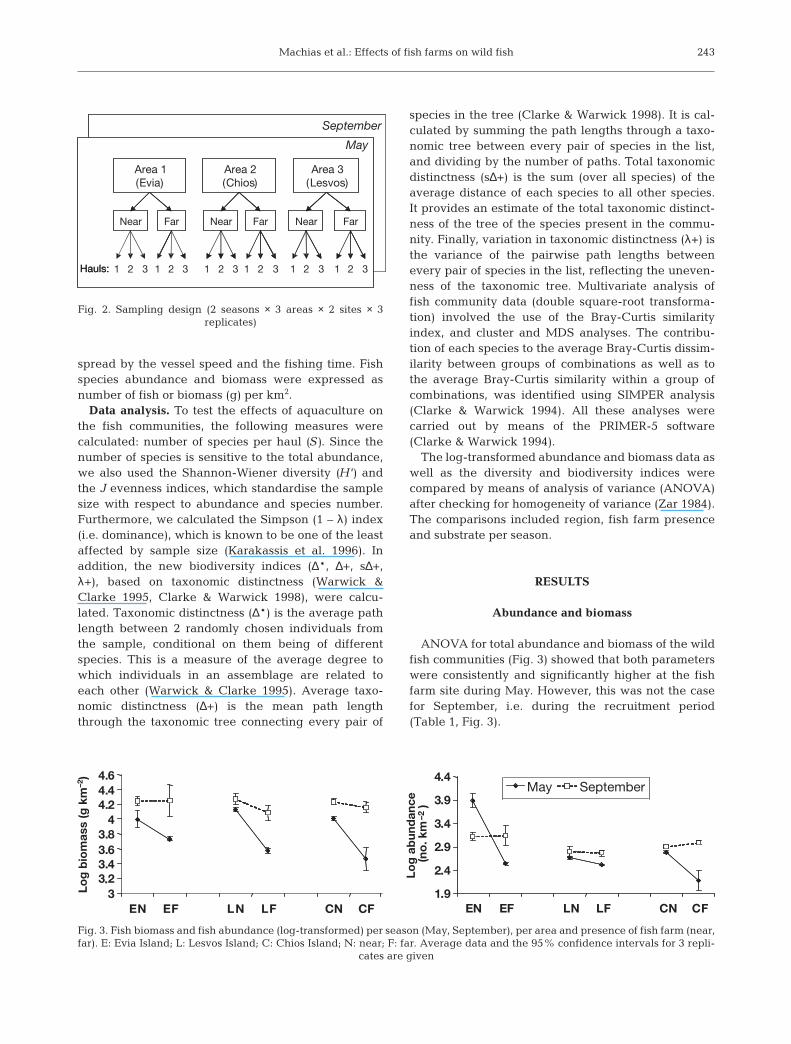
ANOVA for total abundance and biomass of the wildfish communities (Fig. 3) showed that both parameterswere consistently and significantly higher at the fishfarm site during May. However, this was not the casefor September, i.e. during the recruitment period(Table 1, Fig. 3).
243
Area 1 (Evia)
Area 2 (Chios)
Area 3 (Lesvos)
Near Far Near Far Near Far
1 2 3Hauls: 1 2 3 1 2 3 1 2 3 1 2 3 1 2 3
May
September
Hauls:
Fig. 2. Sampling design (2 seasons × 3 areas × 2 sites × 3 replicates)
33 23.43.63.8
44.24.44.6
EN EF LN LF CN CF1.9
2.4
2.9
3.4
3.9
4.4
EN EF LN LF CN CF
Log
ab
und
ance
(no
. km
)
Log
bio
mas
s (g
km
–2)
May September
–2
.
Fig. 3. Fish biomass and fish abundance (log-transformed) per season (May, September), per area and presence of fish farm (near,far). E: Evia Island; L: Lesvos Island; C: Chios Island; N: near; F: far. Average data and the 95% confidence intervals for 3 repli-
cates are given

Mar Ecol Prog Ser 288: 241–250, 2005
Diversity
The number of fish species showed significant dif-ferences with region, substrate and presence of fishfarming during May (Table 1). In all cases, the num-ber of fish species at the fish farm site was higherthan at the respective reference stations (Fig. 4). Thenumber of fish species was not significantly differentbetween fish farm and reference sites during Sep-tember.
H' and J indices (Table 1), which standardise thesample size with respect to abundance and speciesnumber, showed no significant difference in diversitywith respect to the presence of fish farms.
Among the biodiversity indices, ∆* and the total pathlength between any 2 randomly-chosen fish species(s∆+) showed a significant increase at the fish farmsites during May, but again no significant differencesduring September.
Multivariate analysis
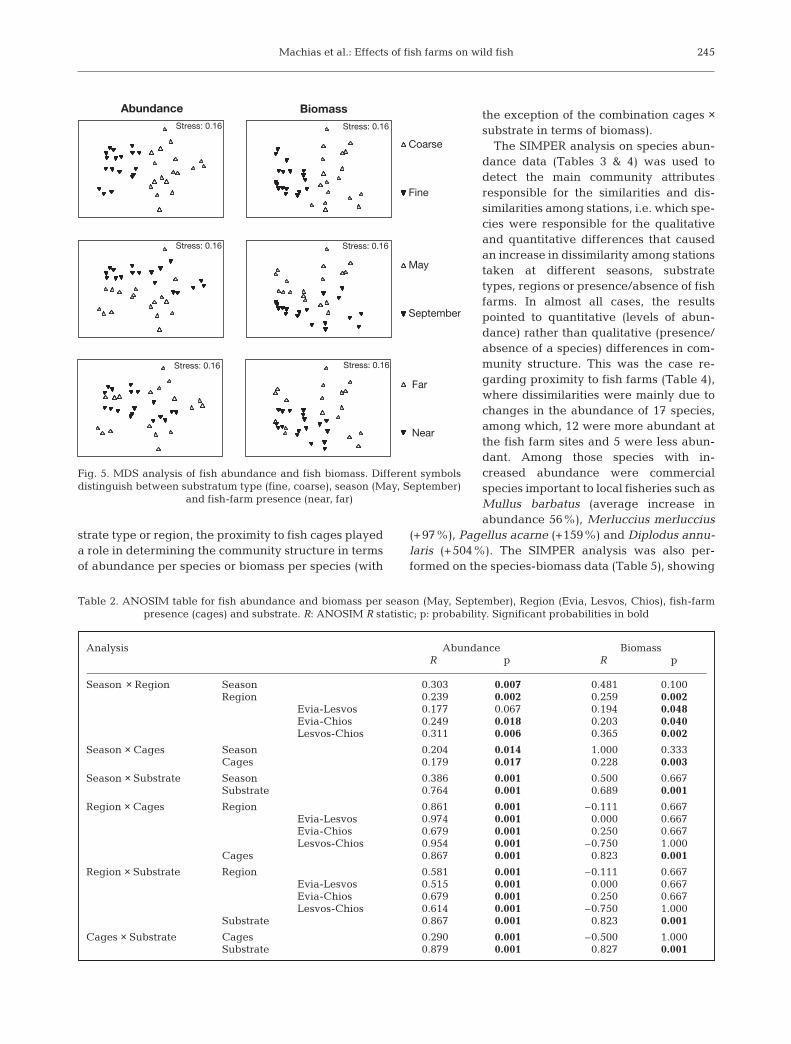
Cluster analysis on both the abundance and biomassdata matrices (dendrogram not shown here) defined 2major groups of hauls related to sediment type. Withinthese 2 major clusters, there were several sub-groupsreflecting other sources of variability such as season,area and presence of fish farms. The results of MDS(Fig. 5) also showed similar groupings with respect tosediment type, season and presence of fish farms. The2-way ANOSIM (Table 2) performed for all differentcombinations of the parameters examined (i.e. season,substrate and presence of fish farms) showed thatproximity to aquaculture zones was 1 of the factorsaffecting the similarities among sampling stations. Inother words, within groups of the same season, or sub-
244
15
20
25
30
35
40
45
EN EF L N L F CN CF
May September
S
Fig. 4. The number of species per haul (S) per season (May,September), per area and fish farm presence (near, far).E: Evia Island; L: Lesvos Island; C: Chios Island; N: near;F: far. Average data and the 95% confidence intervals for
3 replicates are given
May SeptemberRegion Cages Substrate Region Cages Substrate
Biomass F 1.55 49.36 1.15 0.93 0.98 1.51p 0.248 0.00 0.303 0.420 0.341 0.241
Abundance F 1.48 5.6 2.31 6.87 0.02 0.26p 0.264 0.034 0.153 0.009 0.896 0.616
S F 10.3 15.44 58.44 4.02 0.55 14.48p 0.002 0.002 0.000 0.044 0.470 0.022
J F 8.57 1.21 1.84 6.1 0.03 0.88p 0.004 0.291 0.198 0.014 0.864 0.365
H' F 13.47 0 0.28 16.21 0.42 16.86p 0.001 0.978 0.604 0.000 0.530 0.001
1 – λ F 8.32 0.06 0.93 5.44 0 7.4p 0.005 0.812 0.352 0.019 0.954 0.018
∆* F 0.29 5.82 17.41 1.07 0.14 8.06p 0.755 0.031 0.001 0.371 0.711 0.014
∆+ F 1.67 0.39 0.57 8.68 0.45 2.3p 0.226 0.545 0.462 0.004 0.513 0.153
s∆+ F 6 7.88 37.97 5.54 0.92 16.12p 0.014 0.015 0.000 0.018 0.356 0.002
λ+ F 7.23 0.59 0.13 6.09 0.05 2.62p 0.077 0.458 0.722 0.014 0.821 0.130
Table 1. ANOVA table for fish biomass and fish abundance, including S (number of species per haul), J (evenness index),H' (Shannon-Wiener diversity index), 1 – λ (Simpson index), ∆* (taxonomic distinctness), ∆+ (average taxonomic distinctness), s∆+(total taxonomic distinctness) and λ+ (variation in taxonomic distinctness), for each season separately (May, September). Region,
fish-farm presence (cages) and substrate type were the factors considered. p: probability. Significant probabilities in bold
Machias et al.: Effects of fish farms on wild fish
strate type or region, the proximity to fish cages playeda role in determining the community structure in termsof abundance per species or biomass per species (with
the exception of the combination cages ×substrate in terms of biomass).
The SIMPER analysis on species abun-dance data (Tables 3 & 4) was used todetect the main community attributesresponsible for the similarities and dis-similarities among stations, i.e. which spe-cies were responsible for the qualitativeand quantitative differences that causedan increase in dissimilarity among stationstaken at different seasons, substratetypes, regions or presence/absence of fishfarms. In almost all cases, the resultspointed to quantitative (levels of abun-dance) rather than qualitative (presence/absence of a species) differences in com-munity structure. This was the case re-garding proximity to fish farms (Table 4),where dissimilarities were mainly due tochanges in the abundance of 17 species,among which, 12 were more abundant atthe fish farm sites and 5 were less abun-dant. Among those species with in-creased abundance were commercialspecies important to local fisheries such asMullus barbatus (average increase inabundance 56%), Merluccius merluccius
(+97%), Pagellus acarne (+159%) and Diplodus annu-laris (+504%). The SIMPER analysis was also per-formed on the species-biomass data (Table 5), showing
245
Abundance Biomass
Coarse
Fine
May
September
Far
Near
Stress: 0.16 Stress: 0.16
Stress: 0.16Stress: 0.16
Stress: 0.16 Stress: 0.16
Fig. 5. MDS analysis of fish abundance and fish biomass. Different symbolsdistinguish between substratum type (fine, coarse), season (May, September)
and fish-farm presence (near, far)
Analysis Abundance BiomassR p R p
Season × Region Season 0.303 0.007 0.481 0.100Region 0.239 0.002 0.259 0.002
Evia-Lesvos 0.177 0.067 0.194 0.048Evia-Chios 0.249 0.018 0.203 0.040Lesvos-Chios 0.311 0.006 0.365 0.002
Season × Cages Season 0.204 0.014 1.000 0.333Cages 0.179 0.017 0.228 0.003
Season × Substrate Season 0.386 0.001 0.500 0.667Substrate 0.764 0.001 0.689 0.001
Region × Cages Region 0.861 0.001 –0.111 0.667Evia-Lesvos 0.974 0.001 0.000 0.667Evia-Chios 0.679 0.001 0.250 0.667Lesvos-Chios 0.954 0.001 –0.750 1.000
Cages 0.867 0.001 0.823 0.001
Region × Substrate Region 0.581 0.001 –0.111 0.667Evia-Lesvos 0.515 0.001 0.000 0.667Evia-Chios 0.679 0.001 0.250 0.667Lesvos-Chios 0.614 0.001 –0.750 1.000
Substrate 0.867 0.001 0.823 0.001
Cages × Substrate Cages 0.290 0.001 –0.500 1.000Substrate 0.879 0.001 0.827 0.001
Table 2. ANOSIM table for fish abundance and biomass per season (May, September), Region (Evia, Lesvos, Chios), fish-farm presence (cages) and substrate. R: ANOSIM R statistic; p: probability. Significant probabilities in bold
Mar Ecol Prog Ser 288: 241–250, 2005
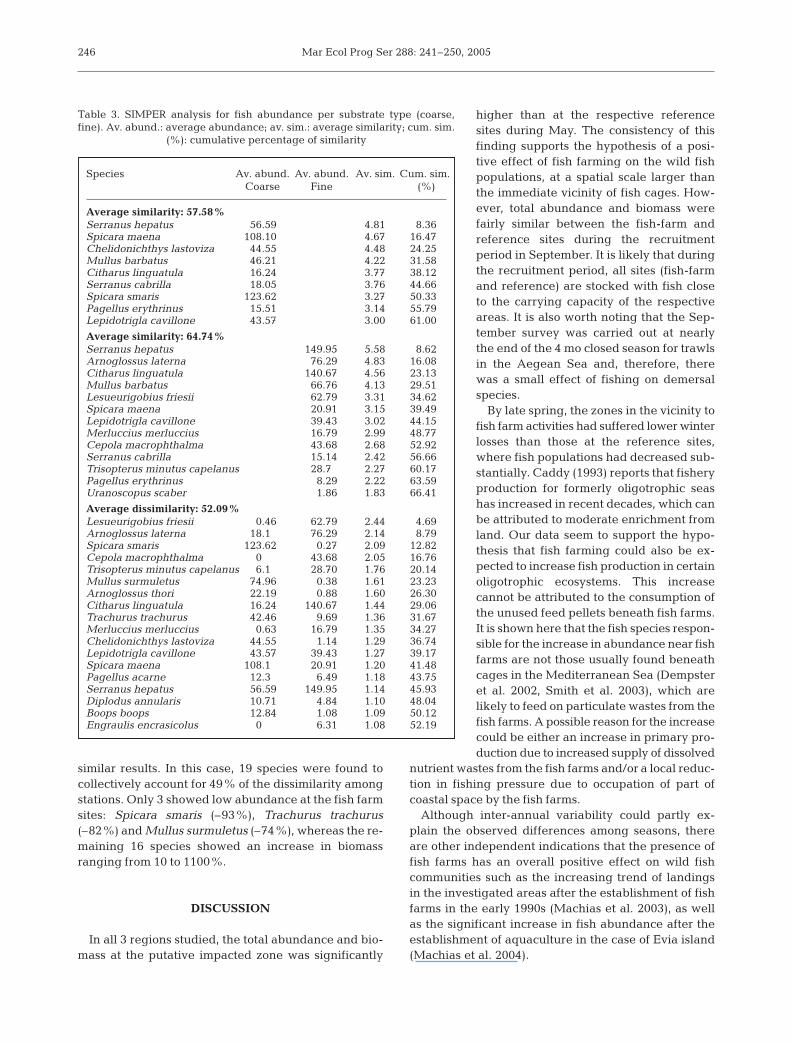
similar results. In this case, 19 species were found tocollectively account for 49% of the dissimilarity amongstations. Only 3 showed low abundance at the fish farmsites: Spicara smaris (–93%), Trachurus trachurus(–82%) and Mullus surmuletus (–74%), whereas the re-maining 16 species showed an increase in biomassranging from 10 to 1100%.
DISCUSSION
In all 3 regions studied, the total abundance and bio-mass at the putative impacted zone was significantly
higher than at the respective referencesites during May. The consistency of thisfinding supports the hypothesis of a posi-tive effect of fish farming on the wild fishpopulations, at a spatial scale larger thanthe immediate vicinity of fish cages. How-ever, total abundance and biomass werefairly similar between the fish-farm andreference sites during the recruitmentperiod in September. It is likely that duringthe recruitment period, all sites (fish-farmand reference) are stocked with fish closeto the carrying capacity of the respectiveareas. It is also worth noting that the Sep-tember survey was carried out at nearlythe end of the 4 mo closed season for trawlsin the Aegean Sea and, therefore, therewas a small effect of fishing on demersalspecies.
By late spring, the zones in the vicinity tofish farm activities had suffered lower winterlosses than those at the reference sites,where fish populations had decreased sub-stantially. Caddy (1993) reports that fisheryproduction for formerly oligotrophic seashas increased in recent decades, which canbe attributed to moderate enrichment fromland. Our data seem to support the hypo-thesis that fish farming could also be ex-pected to increase fish production in certainoligotrophic ecosystems. This increasecannot be attributed to the consumption ofthe unused feed pellets beneath fish farms.It is shown here that the fish species respon-sible for the increase in abundance near fishfarms are not those usually found beneathcages in the Mediterranean Sea (Dempsteret al. 2002, Smith et al. 2003), which arelikely to feed on particulate wastes from thefish farms. A possible reason for the increasecould be either an increase in primary pro-duction due to increased supply of dissolved
nutrient wastes from the fish farms and/or a local reduc-tion in fishing pressure due to occupation of part ofcoastal space by the fish farms.
Although inter-annual variability could partly ex-plain the observed differences among seasons, thereare other independent indications that the presence offish farms has an overall positive effect on wild fishcommunities such as the increasing trend of landingsin the investigated areas after the establishment of fishfarms in the early 1990s (Machias et al. 2003), as wellas the significant increase in fish abundance after theestablishment of aquaculture in the case of Evia island(Machias et al. 2004).
246
Species Av. abund. Av. abund. Av. sim. Cum. sim.Coarse Fine (%)
Average similarity: 57.58%Serranus hepatus 56.59 4.81 8.36Spicara maena 108.10 4.67 16.47Chelidonichthys lastoviza 44.55 4.48 24.25Mullus barbatus 46.21 4.22 31.58Citharus linguatula 16.24 3.77 38.12Serranus cabrilla 18.05 3.76 44.66Spicara smaris 123.62 3.27 50.33Pagellus erythrinus 15.51 3.14 55.79Lepidotrigla cavillone 43.57 3.00 61.00
Average similarity: 64.74%Serranus hepatus 149.95 5.58 8.62Arnoglossus laterna 76.29 4.83 16.08Citharus linguatula 140.67 4.56 23.13Mullus barbatus 66.76 4.13 29.51Lesueurigobius friesii 62.79 3.31 34.62Spicara maena 20.91 3.15 39.49Lepidotrigla cavillone 39.43 3.02 44.15Merluccius merluccius 16.79 2.99 48.77Cepola macrophthalma 43.68 2.68 52.92Serranus cabrilla 15.14 2.42 56.66Trisopterus minutus capelanus 28.7 2.27 60.17Pagellus erythrinus 8.29 2.22 63.59Uranoscopus scaber 1.86 1.83 66.41
Average dissimilarity: 52.09%Lesueurigobius friesii 0.46 62.79 2.44 4.69Arnoglossus laterna 18.1 76.29 2.14 8.79Spicara smaris 123.62 0.27 2.09 12.82Cepola macrophthalma 0 43.68 2.05 16.76Trisopterus minutus capelanus 6.1 28.70 1.76 20.14Mullus surmuletus 74.96 0.38 1.61 23.23Arnoglossus thori 22.19 0.88 1.60 26.30Citharus linguatula 16.24 140.67 1.44 29.06Trachurus trachurus 42.46 9.69 1.36 31.67Merluccius merluccius 0.63 16.79 1.35 34.27Chelidonichthys lastoviza 44.55 1.14 1.29 36.74Lepidotrigla cavillone 43.57 39.43 1.27 39.17Spicara maena 108.1 20.91 1.20 41.48Pagellus acarne 12.3 6.49 1.18 43.75Serranus hepatus 56.59 149.95 1.14 45.93Diplodus annularis 10.71 4.84 1.10 48.04Boops boops 12.84 1.08 1.09 50.12Engraulis encrasicolus 0 6.31 1.08 52.19
Table 3. SIMPER analysis for fish abundance per substrate type (coarse,fine). Av. abund.: average abundance; av. sim.: average similarity; cum. sim.
(%): cumulative percentage of similarity

Machias et al.: Effects of fish farms on wild fish
Two hypotheses could explain the ob-served differences between the 2 samplingseasons. The first could be that the fishpopulations inhabiting the wider area areattracted by the floating structures (cages),or by the odour of the food used in fishfarms and, therefore, reach higher densi-ties at the fish farm sites. Subsequently, asfish populations decline from September toMay, because of natural and/or fishingmortality, the sites near the fish farms areconstantly replenished with additional fishbiomass from the surrounding area,thereby remaining close to carrying capac-ity. This hypothesis, however, hardlyexplains the increase seen in landingsafter the onset of aquaculture (Machias etal. 2003).
Alternatively, the differences betweenthe fish farm and the reference sites werepresent in September (recruitment periodfor most of the species, Stergiou et al. 1997)as well, but they were not detectableunder the applied sampling scheme. It iswell known that the recruitment for mostof the species in the surveyed areas, takesplace in shallow water near the coastline(depth <60 m). Although there is alwaysan overlap of juveniles and adults, themajority of juveniles stay in shallowwaters, while adults remain in deep watersafter their first maturation, usually inspring (Tsimenides et al. 1992, Machias etal. 1998, Labropoulou et al. 1999, Machias& Labropoulou 2002, Somarakis & Machias2002). The presence of fish farms couldresult in a higher degree of habitat separa-tion between juvenile and adults, as wellas in an increase in the residence time ofjuveniles near the coast. As, in the framework of thepresent study, we investigated the adult habitat(depths >70 m), the density of juveniles could havebeen underestimated. At the reference sites, the lowerresources and higher competition, could have imposeda higher dispersion of juveniles, and a higher overlapof juvenile and adult habitats. The difference in den-sity and/or abundance between fish-farm and refer-ence sites was more obvious during spring (reproduc-tive period for most of the species, Stergiou et al. 1997),when the fish move to deeper waters. The effect of fishcages presence on local recruitment needs further andmore targeted research.
The study of diversity, as expressed by differentindices, showed no significant effect in response to theincidence of fish farming. In other words, the observed
increase in abundance was not accompanied by a sim-plification of the community: both the number of spe-cies and the distinctness-based biodiversity indices(∆*) and (s∆+) showed an increase at the fish farm sitesin comparison to the reference sites. The same trendhas been observed when comparing the period beforeand after the aquaculture establishment in the regionof Evia island (Machias et al. 2004), with these 2 bio-diversity indices being higher after the establishmentof fish farms in comparison to the ‘before’ period. Asopposed to ‘standard’ diversity indices, which look intowhether individuals belong to the same species, lackexplicit links to functional diversity (Clarke &Warwick1998) and are largely effort-dependent (Clarke & War-wick 1999), biodiversity indices measure the degree towhich species are taxonomically related to each other
247
Species Av. abund. Av. abund. Av. sim. Cum. sim.Reference Fish-farm (%)
Average similarity: 51.53%Serranus hepatus 63.87 5.88 11.41Mullus barbatus 44.11 4.08 19.34Citharus linguatula 22.77 3.95 27.01Spicara maena 65.67 3.73 34.26Chelidonichthys lastoviza 36.81 3.32 40.69Serranus cabrilla 12.36 2.95 46.42Pagellus erythrinus 15.45 2.68 51.62
Average similarity: 60.70%Serranus hepatus 142.67 4.54 7.48Mullus barbatus 68.85 4.26 14.5Lepidotrigla cavillone 61.94 4.25 21.5Citharus linguatula 134.14 4.20 28.41Spicara maena 63.34 3.90 34.83Serranus cabrilla 20.82 3.18 40.08Pagellus erythrinus 8.35 2.68 44.49Merluccius merluccius 11.56 2.36 48.37Arnoglossus laterna 57.86 2.25 52.08Chelidonichthys lastoviza 8.88 2.11 55.55Pagellus acarne 13.55 2.00 58.84Blennius ocellaris 2.50 1.85 61.88
Average dissimilarity: 47.33%Spicara smaris 118.07 5.83 1.79 3.79Lesueurigobius friesii 7.56 55.69 1.74 7.47Arnoglossus laterna 36.53 57.86 1.60 10.85Cepola macrophthalma 1.31 42.37 1.45 13.91Trisopterus minutus capelanus 21.91 12.89 1.45 16.97Lepidotrigla cavillone 21.05 61.94 1.44 20.01Pagellus acarne 5.24 13.55 1.42 23.02Mullus surmuletus 67.77 7.58 1.34 25.85Citharus linguatula 22.77 134.14 1.34 28.68Arnoglossus thori 8.30 14.77 1.29 31.39Trachurus trachurus 46.54 5.61 1.26 34.06Spicara maena 65.67 63.34 1.19 36.57Diplodus annularis 2.21 13.34 1.15 39.00Serranus hepatus 63.87 142.67 1.13 41.37Merluccius merluccius 5.86 11.56 1.07 43.64Mullus barbatus 44.11 68.85 1.04 45.84Callionymus maculatus 3.42 4.02 1.00 47.95
Table 4. SIMPER analysis for fish abundance per fish-farm presence (fish-farm site, reference site). Av. abund.: average abundance; av. sim.: average
similarity; cum. sim. (%): cumulative percentage of similarity

Mar Ecol Prog Ser 288: 241–250, 2005
(Warwick & Clarke 2001). Taxonomic distinctnessindices describe features of this taxonomic spread andare now beginning to find application in environmen-tal impact assessment, with growing evidence that,for a given number of species, perturbed communitiesusually comprise a more limited taxonomic spread(Brown et al. 2002, Warwick et al. 2002). Although thenumber of species is dependent on the sample size (i.e.on the number of individuals counted in the samplesobtained), the taxonomic distinctness-based indiceshave been shown to be remarkably independent ofsample size (Clarke & Warwick 1998). Taking the over-all picture into account, it seems that at sites close tofish farming zones, the overall structure of the demer-
sal fish community does not changetowards a phylogenetically simplified setof species, but rather towards an equallyor more diverse community which alsopresents higher abundance.
The Simpson index showed no differ-ence in dominance between fish-farm andreference sites. In other words, there is noquantitative change similar to that ob-tained when r-selection species prolifer-ate in the community in response to asevere disturbance.
The multivariate analyses showed thatthere was an effect of fish farming on theoverall community structure; however,this was mainly attributed to quantitativerather than qualitative aspects, that is,there was a change in levels of abun-dance and/or biomass rather than re-placement of species. The species foundin the areas investigated during this studyare those typically found in the AegeanSea (Machias et al. 2001). Furthermore, inmost cases, as shown by SIMPER analysis,this change was positive resulting inhigher abundance and biomass close tothe fish farming zones.
This type of effect on wild fish assem-blages is likely to occur in any marinearea affected by fish farming wastes andin fact we are not aware of any publishedstudy having proven the opposite. How-ever, there are particular characteristicsof the Mediterranean marine ecosystemswhich allow these effects to be more read-ily detectable than elsewhere: (1) the pro-nounced oligotrophy of the EasternMediterranean, the low nutrient levels(Friligos & Gotsis-Skretas 1987) and lowprimary production (Sournia 1973); (2) thephosphorus-limitation of primary produc-
tion (Krom et al. 1991), at least for part of the year; and(3) the high water transparency (Ignatiades 1998),allowing the exploitation of nutrient resources deeperin the water column. The microtidal regime character-ising this area is also important, since it imposes gener-ally slower water renewal rates than in macrotidalareas, thereby allowing a longer residence time ofnutrient-enriched water masses in coastal bays. Fur-thermore, in a multispecies fishery context such as theone of the eastern Mediterranean (Stergiou et al.1997), the effects of fish farm presence are more likelyto be important since the increased production affectsthe entire community, not only certain target species.Of course, these effects are also likely to be related to
248
Species Av. biom. Av. biom. Av. sim. Cum. sim.Reference Fish-farm (%)
Average similarity: 51.16%Serranus hepatus 562.35 4.96 9.70Mullus barbatus 1199.08 4.65 18.79Spicara maena 1302.81 4.11 26.83Chelidonichthys lastoviza 627.35 3.36 33.40Serranus cabrilla 376.20 3.23 39.73Pagellus erythrinus 317.09 3.08 45.74Citharus linguatula 268.15 2.90 51.40
Average similarity: 61.95%Mullus barbatus 2056.73 4.76 7.68Citharus linguatula 1649.42 3.96 14.07Spicara maena 1530.97 3.90 20.35Serranus cabrilla 958.82 3.70 26.32Merluccius merluccius 731.69 3.67 32.24Serranus hepatus 1391.33 3.62 38.09Lepidotrigla cavillone 759.15 3.61 43.91Pagellus erythrinus 437.59 3.23 49.12Chelidonichthys lastoviza 275.66 2.42 53.02Pagellus acarne 565.48 2.05 56.33Uranoscopus scaber 115.57 1.93 59.45Echelus myrus 54.41 1.92 62.56
Average dissimilarity: 47.28%Spicara smaris 1966.17 143.37 1.69 3.57Pagellus acarne 133.21 565.48 1.60 6.95Merluccius merluccius 443.04 731.69 1.47 10.06Mullus surmuletus 1174.02 302.97 1.35 12.91Citharus linguatula 268.15 1649.42 1.34 15.74Trisopterus minutus capelanus 184.34 322.37 1.32 18.54Lophius budegassa 161.87 505.76 1.30 21.28Cepola macrophthalma 39.88 489.75 1.28 24.00Lepidotrigla cavillone 228.63 759.15 1.27 26.69Diplodus annularis 80.90 423.10 1.26 29.35Trachurus trachurus 565.85 103.74 1.14 31.77Spicara maena 1302.81 1530.97 1.14 34.18Boops boops 223.57 247.02 1.06 36.41Serranus cabrilla 376.20 958.82 1.03 38.59Mullus barbatus 1199.08 2056.73 1.02 40.75Echelus myrus 31.14 54.41 1.02 42.91Arnoglossus laterna 108.81 181.50 0.99 45.00Zeus faber 55.40 110.30 0.97 47.05Uranoscopus scaber 29.26 115.57 0.96 49.07
Table 5. SIMPER analysis for fish biomass per fish-farm presence (fish-farmsite, reference site). Av. biom: average biomass; av. sim: average similarity;
cum. sim. (%): cumulative percentage of similarity

Machias et al.: Effects of fish farms on wild fish
the level of production of the fish farms and the areatopography: very low levels of production (e.g. of asmall-sized farm in a highly exposed area) could gounnoticed, whereas extremely high levels in veryenclosed areas are likely to result in significant effects.
In several parts of the world (Beveridge et al. 1996),and particularly in the Mediterranean (Pitta et al. 1999,Belias et al. 2003), it has been shown that the effects offish farming on nutrients and chlorophyll concentra-tion in the water column are hardly measurable andonly over a short time-scale (Karakassis et al. 2001).This is probably related to the dispersive nature of thesites, which allows rapid advection and diffusion, but itis also likely that there is a rapid consumption andtransfer towards higher trophic levels. In this case, thefish communities are probably a good indicator of theincreased material flux since they are long-livedorganisms integrating processes over longer timeperiods, and their predators are unlikely to respondpromptly to an increase in their biomass.
The overall conclusion is that the presence of fishfarming is likely to have positive effects (at least interms of socio-economic aspects) on wild fish assem-blages at the spatial scales investigated. These couldinvolve an increase in wild fish biomass by an averagefactor of 2.8, as well as in a significant increase (by afactor of 2) in local fisheries landings (Machias et al.2003) after the establishment of fish farming zones.
Acknowledgements. The authors would like to acknowledgesupport by the European Commission (Project AQCESS, Con-tract Q5RS-2000-31151) as well as the captain and the crew ofRV ‘Philia’ for their assistance during the sampling surveys.Three anonymous reviewers provided comments that helpedimprove the manuscript.
LITERATURE CITED
Belias CV, Bikas VG, Dassenakis MJ, Scoullos MJ (2003)Environmental impacts of coastal aquaculture in EasternMediterranean Bays: the case of Astakos Gulf, Greece.Environ Sci Pollut Res 10:287–295
Beveridge MCM (1996) Cage aquaculture. Fishing NewsBooks. Blackwell, Oxford
Brown BE, Clarke KR, Warwick RM (2002). Serial patterns ofbiodiversity change in corals across shallow reef flats in KoPhuket, Thailand, due to the effects of local (sedimenta-tion) and regional (climatic) perturbations. Mar Biol 141:21–29
Brown JR, Gowen RJ, McLusky DS (1987) The effects ofsalmon farming on the benthos of a Scottish sea loch.J Exp Mar Biol Ecol 109:39–51
Caddy JF (1993) Towards a comparative evaluation of humanimpacts on fishery ecosystems of enclosed and semi-enclosed seas. Rev Fish Sci 1:57–95
Carrothers PJG (1980) Estimation of trawl door spread fromwing spread. J Northw Atl Fish Sci 1:81–89
Carss DN (1990) Concetrations of wild and escaped fishesimmediately adjacent to fish farm cages. Aquaculture90(1):29–40
Carss DN (1994) Killing of piscivorous birds at Scottish fishfarms, 1984-87. Biol Conserv 68 (2): 181-188
Clarke KR, Warwick RM (1994) Change in marine communi-ties: an approach to statistical analysis and interpretation.Natural Environment Research Council, UK
Clarke KR, Warwick RM (1998) A taxonomic distinctnessindex and its statistical properties. J Appl Ecol 35:523–531
Clarke KR, Warwick RM (1999) The taxonomic distinctnessmeasure of biodiversity: weighting of step lengthsbetween hierarchical levels. Mar Ecol Prog Ser 184:21–29
Delgado O, Ruiz J, Perez M, Romero J, Ballestreros E (1999)Effects of fish farming on seagrass (Posidonia oceanica) ina Mediterranean bay: seagrass decline after loading ces-sation. Oceanol Acta 22:109–117
Dempster T, Sanchez-Jerez P, Bayle-Sempere JT, Giménez-Casalduero F, Valle C (2002) Attraction of wild fish to sea-cage fish farms in the south-western Mediterranean Sea:spatial and short-term temporal variability. Mar Ecol ProgSer 242:237–252
Fernandes TF, Eleftheriou A, Ackefors H, Eleftheriou M and 7others (2001) The scientific principles underlying themonitoring of the environmental impacts of aquaculture.J Appl Ichthyol 17:181–193
Friligos N, Gotsis-Skretas O (1987) Relationships of phyto-plankton with certain environmental factors in the SouthEvoikos Gulf (Greece). PSZN I: Mar Ecol 8:59–73
Gowen RJ, Bradbury NB (1987) The ecological impact ofsalmonid farming in coastal waters: a review. OceanogrMar Biol Annu Rev 25:563–575
Hall POJ, Holby O, Kollberg S, Samuelsson MO (1992) Chem-ical fluxes and mass balances in a marine fish cage farm.IV. Nitrogen. Mar Ecol Prog Ser 89:81–91
Holby O, Hall POJ (1991) Chemical fluxes and mass balancesin a marine fish cage farm. II. Phosphorus. Mar Ecol ProgSer 70:263–272
Holmer M, Kristensen E (1992) Impact of fish cage farming onmetabolism and sulfate reduction of underlying sedi-ments. Mar Ecol Prog Ser 80:191–201
Holmer M, Marba N, Terrados J, Duarte CM, Fortes MD(2002) Impacts of milkfish (Chanos chanos) aquaculture oncarbon and nutrient fluxes in the Bolinao area, Philip-pines. Mar Pollut Bull 44:685–696
Holmer M, Pérez M, Duarte CM (2003) Benthic primary pro-ducers — a neglected environmental problem in Mediter-ranean maricultures? Mar Pollut Bull 46:1372–1374
Ignatiades L (1998) The productive and optical status of theoligotrophic waters of the Southern Aegean Sea (CretanSea), Eastern Mediterranean. J Plankton Res 20:985–995
Karakassis I (1998) Aquaculture and coastal marine biodiver-sity. Oceanis 24:271–286
Karakassis I, Smith CJ, Eleftheriou A (1996) Performance ofneutral model analysis in a spatio-temporal series ofmacrobenthic replicates. Mar Ecol Prog Ser 137:173–179
Karakassis I, Tsapakis M, Hatziyanni E (1998) Seasonal vari-ability in sediment profiles beneath fish farm cages in theMediterranean. Mar Ecol Prog Ser 162:243–252
Karakassis I, Tsapakis M, Hatziyanni E, Papadopoulou KN,Plaiti W (2000) Impact of cage farming of fish on theseabed in three Mediterranean coastal areas. ICES J MarSci 57:1462–1471
Karakassis I, Tsapakis M, Hatziyanni E, Pitta P (2001) Dielvariation of nutrients and chlorophyll in sea bream andsea bass cages in the Mediterranean. Fresenius EnvironBull 10:278–283
Krom MD, Kress N, Brenner S, Gordon LI (1991) Phosphoruslimitation of primary productivity in the eastern Mediter-ranean Sea. Limnol Oceanogr 36:424–432
249

Mar Ecol Prog Ser 288: 241–250, 2005
La Rosa T, Mirto S, Mazzola A, Danovaro R (2001) Differentialresponses of benthic microbes and meiofauna to fish-farmdisturbance in coastal sediments. Environ Pollut 112:427–434
Labropoulou M, Machias A, Tsimenides N (1999) Habitatselection and diet of the juvenile red porgy, Pagrus pagrus(Linnaeus, 1758) from the Cretan shelf. Fish Bull 97:495–507
Machias A, Labropoulou M (2002) Intra-specific variation inresource use for the red mullet, Mullus barbatus. EstuarCoast Shelf Sci 55(4):565–578
Machias A, Somarakis S, Tsimenides N (1998) Bathymetricdistribution and movements of red mullet Mullus surmule-tus. Mar Ecol Prog Ser 166:247–257
Machias A, Vassilopoulou V, Vatsos D, Bekas P, Kallianiotis A,Papaconstantinou C, Tsimenides N (2001) Bottom trawldiscards in the N. E. Mediterranean Sea. Fish Res 53:181–195
Machias A, Somarakis S, Karakassis I, Neofytou C and 5others (2003) Fish landing changes since the onset ofaquaculture: two case studies. Proceedings of the 7thHellenic Symposium on Oceanography and Fisheries,Hersonissos, 6–9 May, 2003, book of abstracts, p 203
Machias A, Karakassis I, Labropoulou M, Somarakis S,Papadopoulou KN, Papaconstantinou C (2004) Changes inwild fish assemblages after the establishment of a fishfarming zone in oligotrophic marine ecosystems. EstuarCoast Shelf Sci 60: 771–779
Mazzola A, Mirto S, Danovaro R (1999) Initial fish-farmimpact on meiofaunal assemblages in coastal sediments ofthe Western Mediterranean. Mar Pollut Bull 38:1126–1133
Mazzola A, Mirto S, Danovaro R (2000) Fish-farming effects onbenthic community structure in coastal sediments: analysisof meiofaunal resilience. ICES J Mar Sci 57:1454–1461
Mirto S, La Rosa T, Gambi C, Danovaro R, Mazzola A (2002)Nematode community response to fish-farm impact in thewestern Mediterranean. Environ Pollut 116:203–214
Pergent G, Mendez S, Pergent-Martini C, Pasqualini V (1999)Preliminary data on the impact of fish farming facilities onPosidonia oceanica meadows in the Mediterranean.Oceanol Acta 22:95–107
Pitta P, Karakassis I, Tsapakis M, Zivanovic S (1999) Naturalversus mariculture induced variability in nutrients andplankton in the Eastern Mediterranean. Hydrobiologia391:181–194
Pohle G, Frost B, Findlay R (2001) Assessment of regionalbenthic impact of salmon mariculture within the LetangInlet, Bay of Fundy. ICES J Mar Sci 58:417–426
Ruiz JM, Perez M, Romero J (2001) Effects of fish farm load-ings on seagrass (Posidonia oceanica) distribution, growthand photosynthesis. Mar Pollut Bull 42:749–760
Smith C, Machias A, Giannoulaki M, Somarakis S, Papa-dopoulou KN, Karakassis I (2003) Diversity study of wildfish fauna aggregating around fish farm cages by meansof remotely operated vehicle (ROV). Proceedings of the7th Hellenic Symposium on Oceanography and Fisheries,Hersonissos, 6–9 May, 2003, book of abstracts, p 227
Somarakis S, Machias A (2002) Age, growth and bathymetricdistribution of red Pandora (Pagellus erithrinus) on theCretan shelf. J Mar Biol Assoc UK 82(1):149–160
Sournia A (1973) La production primaire planktonique enMéditerranée. Bull Étude Commun Méditerranée5:1–128
Stergiou KI, Christou ED, Georgopoulos D, Zenetos A, Sou-vermezoglou C (1997) The Hellenic seas: physics, chem-istry, biology and fisheries. Oceanogr Mar Biol Annu Rev35:415–538
Tsimenides N, Machias A, Kallianiotis A (1992). Distributionpatterns of triglids, (Pisces: Triglidae), on the Cretan shelf(Greece) and their interspecific associations. Fish Res 15:83–103
Warwick RM, Clarke KR (1995) New ‘biodiversity’ measuresreveal a decrease in taxonomic distinctness with increas-ing stress. Mar Ecol Prog Ser 129:301–305
Warwick RM, Clarke KR (2001) Practical measures of marinebiodiversity based on relatedness of species. OceanogrMar Biol Annu Rev 39:207–231
Warwick RM, Asham CM, Brown AR, Clarke KR and 6 others(2002) Inter-annual changes in the biodiversity and com-munity structure of the macrobenthos in Tees Bay andTees estuary, UK, associated with local and regional envi-ronmental effects. Mar Ecol Prog Ser 234:1–13
Weston DP (1990) Quantitative examination of macrobenthiccommunity changes along an organic enrichment gradi-ent. Mar Ecol Prog Ser 61:233-244
Wu RSS (1995) The environmental impact of marine fish cul-ture: towards a sustainable future. Mar Pollut Bull 31:159–166
Zar JH (1984) Biostatistical analysis. Prentice-Hall, Engle-wood-Cliffs, NJ
250
Editorial responsibility: Otto Kinne (Editor-in-Chief),Oldendorf/Luhe, Germany
Submitted: June 2, 2004; Accepted: September 28, 2004Proofs received from author(s): February 17, 2005