23. farms—general statistics - Census.gov
44
23. FARMS—GENERAL STATISTICS [Data in this section relate to continental ITnited States except for table 668] No. 630.—POPULATION, FARMS, AND FARK PROPERTY—SUMMARY: 1 8 5 0 T O 1940 NOTE.—Figures for 1850 relate to June 1, for 1910 to Apr. 15, for 1920, 1925, and 1935 to Jan. 1, and for 1930 and 1940 to Apr. 1, except that the classification of land according to use refers to the preceding year. Leaders indicate that data are not available. ITEM Total population Urban. Rural« Percent of total- Farm population 3 Percent of total .... _ Percent of rural 23,191,876 Number of farms... Approximate land area of United States (1,000 acres). Percent in farms All land in farms (1,000 acres) Cropland harvested Crop failure Cropland idle or fallow... Plowable pasture Woodland All other land Land used for crops (har- vested and failure) Land available for crops Average acreage per farm Value of farm property (thou- sands of dollars) 7 Land and buildings Land s Buildings 8... Implements and machin- ery Livestock.. Percent of value of farm property repriesented by ^— Land and buildings Land Buildings Implements and ma- chinery Livestock... Average value of farm prop- erty per farm (dollars) 7 .... Land and buildings. Land Buildings Implements and ma- chinery Livestock Average value of farm prop- erty per acre (dollars) ^ Land and buildings Land Buildings .... Implements and ma- chinery Livestock 1850 1,449, 073 1,884, 376 15.6 293, 561 0 113,033 202.6 3,967,844 3, 271, 575 151, 588 544,181 82.5 3.8 13.7 2, 738 2, 258 105 376 18. 51 1L14 .52 L86 1910 91, 972, 266 42,166,120 49,806,146 54.2 6,86r, 5C2 1, 903,290 46.2 878,798 105, 710,620 54, 304, 603 51,406,017 48.6 31,614,269 29.9 6L5 6,448,343 1,903, 215 50.2 955, 884 6 478,452 138.1 40, 837, 696 34,801,126 28,475, 674 6, 325,452 1, 265,150 94, 771,420 85.2 69.7 15.5 3.1 1L7 6,420 5,471 4,476 994 199 750 46. 47 39. 60 32. 40 7.20 L44 5. 43 1920 «503,073 148.2 77,923,652 66,316,003 54,829, 563 11,486, 440 3, 594, 773 8,012,876 85.1 70.4 14.7 4.6 10.3 12,084 10, 284 8. 503 1,781 557 1,243 81.52 69. 38 57.36 12. 02 3. 76 1925 1114,035,000 161,451,000 152, 584,000 46.1 (*) 0) 6,371,640 1,903, 217 48.6 924,319 344, 549 13,018 33,893 113, 567 143, 771 275, 521 357, 567 505,027 145.1 57,017,740 49,467, 647 37, 721,018 11, 746,629 2,691, 704 9 4,858, 389 86.8 66.2 20 6 4.7 8.5 8,949 7, 764 5, 920 1,844 422 763 6L 69 53. 52 40. 81 12. 71 2.91 5. 26 1930 122,775,046 68,954,823 53,820, 223 43.8 30,445,350 24.8 56. 6,288, 648 1,903,217 5L8 986, 771 359,242 12,707 41,287 109,160 149, 946 314, 429 371,949 522,396 156.9 56, 975, 607 47,879,838 34, 929,845 12,949, 994 3,301,654 '5,794,114 84.0 61.3 22.7 5.8 10.2 7,614 5, 554 2,059 525 921 57. 74 48. 52 35.40 13.12 1127,152,000 172, 320,000 " 54,832,000 43.1 31,800,907 25.0 58.0 6, 812, 350 1,903, 217 55.4 1,054, 515 295,624 63, 682 66, 029 98, 579 185, 475 355,126 3. 35 5.87 1935 513,914 154.8 32,858,844 « 3,418,510 4,823 502 31.16 3.24 1940 131,669,275 74,423,702 57,245,573 43.5 30,546,911 23.2 53.4 6,096, 799 1,905,362 55.7 1,060, 852 321, 242 20, 580 56,929 131, 380 137,178 393, 544 341,822 530,131 174.0 41, 254,979 33,641, 739 23, 236, 303 10,405,436 3,060,187 "4, 553,053 8L5 56.3 25.2 7.4 n.o 6, 767 5, 518 3,811 1,707 502 747 38. 89 3L 71 2L 90 9.81 2.88 4.29 1 Estimates. ^ For definition of urban and rural, see headnote, table 10, p. 11. 5 The 1930,1935, and 1940 farm population comprises all persons living on farms without regard to occu- pation; the 1920 fibres include also those farm laborers (and their families) who, while not living on farms, lived outside the limits of any incorporated place. A further difference is due to the fact that the 1920 and 1935 censuses were taken in January, while the 1930 and 1940 censuses were taken in April, when the number of persons on farms is appreciably larger. For farm population by States see table 12, p. 13. < Data collected for 1925 are not strictly comparable with figures for other years. «Includes cropland harvested, crop failure, cropland lying idle or fallow, and plowable pasture. ® "Improved land"; figures nominally include land available for crops and land occupied by buildings, yards, and barnyards. ^ Value is of specified farm property, not all farm property. 8 Figures for land and for buildings are less satisfactory than figure for total real estate value; in other words, value of buildings should not be subtracted from total farm value and difference assumed to represent accurately .market value of land alone. Figures for land include the value of fences, tile drains, and other Incidental improvements on the land, excluding only the value of buildings. 9 Figures for 1910 exclude value of young animals when enumerated separately. For description of items for other years, see note 1 on "livestock," table 636, p. 580. Source: Department of Commerce, Bureau of the Census; Sixteenth Census Reports, Agriculture, Vol. III. 572
-
Upload
khangminh22 -
Category
Documents
-
view
2 -
download
0
Transcript of 23. farms—general statistics - Census.gov

23. FARMS—GENERAL STATISTICS [Data in this section relate to continental ITnited States except for table 668]
N o . 6 3 0 . — P O P U L A T I O N , F A R M S , AND F A R K P R O P E R T Y — S U M M A R Y : 1 8 5 0 TO 1 9 4 0
NOTE.—Figures for 1850 relate to June 1, for 1910 to Apr. 15, for 1920, 1925, and 1935 to Jan. 1, and for 1930 and 1940 to Apr. 1, except that the classification of land according to use refers to the preceding year. Leaders indicate that data are not available.
I T E M
Total population Urban. Rural«
Percent of total-Farm population 3
Percent of total. . . ._ Percent of rural
23,191,876
Number of farms.. . Approximate land area of
United States (1,000 acres). Percent in farms
All land in farms (1,000 acres) Cropland harvested Crop failure Cropland idle or fallow... Plowable pasture Woodland All other land Land used for crops (har-
vested and failure) Land available for crops
Average acreage per farm Value of farm property (thou-
sands of dollars) 7 Land and buildings
Land s Buildings 8 . . .
Implements and machin-ery
Livestock.. Percent of value of farm
property repriesented by —̂ Land and buildings
Land Buildings
Implements and ma-chinery
Livestock... Average value of farm prop-
erty per farm (dollars) 7 . . . . Land and buildings.
Land Buildings
Implements and ma-chinery
Livestock Average value of farm prop-
erty per acre (dollars) ^ Land and buildings
Land Buildings....
Implements and ma-chinery
Livestock
1850
1,449, 073
1,884, 376 15.6
293, 561
0 113,033 202.6
3,967,844 3, 271, 575
151, 588 544,181
82.5
3 . 8 1 3 . 7
2, 738 2, 258
105 376
18. 51 1L14
.52 L86
1910
91, 972, 266 42,166,120 49,806,146
54.2
6,86r, 5C2 1, 903,290
46.2 878,798
105, 710,620 54, 304, 603 51,406,017
48.6 31,614,269
29.9 6L5
6,448,343
1,903, 215 50.2
955, 884
6 478,452 138.1
40, 837, 696 34,801,126 28,475, 674 6, 325,452
1, 265,150 94, 771,420
85.2 69.7 15.5
3.1 1L7
6,420 5,471 4,476
994
199 750
46. 47 39. 60 32. 40 7.20
L44 5. 43
1920
«503,073 148.2
77,923,652 66,316,003 54,829, 563 11,486, 440
3, 594, 773 8,012,876
85.1 70.4 14.7
4.6 10.3
12,084 10, 284 8. 503 1,781
557 1,243
81.52 69. 38 57.36 12. 02
3. 76
1925
1114,035,000 161,451,000 152, 584,000
46.1 (*) 0)
6,371,640
1,903, 217 48.6
924,319 344, 549 13,018 33,893
113, 567 143, 771 275, 521
357, 567 505,027
145.1
57,017,740 49,467, 647 37, 721,018 11, 746,629
2,691, 704 9 4,858, 389
86.8 66.2 20 6
4.7 8.5
8,949 7, 764 5, 920 1,844
422 763
6L 69 53. 52 40. 81 12. 71
2.91 5. 26
1930
122,775,046 68,954,823 53,820, 223
43.8 30,445,350
24.8 56.
6,288, 648
1,903,217 5L8
986, 771 359,242 12,707 41,287
109,160 149, 946 314, 429
371,949 522,396
156.9
56, 975, 607 47,879,838 34, 929,845 12,949, 994
3,301,654 '5,794,114
84.0 61.3 2 2 . 7
5.8 10.2
7,614 5, 554 2,059
525 921
57. 74 48. 52 35.40 13.12
1127,152,000 172, 320,000 " 54,832,000
43.1 31,800,907
25.0 58.0
6, 812, 350
1,903, 217 55.4
1,054, 515 295,624 63, 682 66, 029 98, 579
185, 475 355,126
3. 35 5.87
1935
513,914 154.8
32,858,844
« 3,418,510
4,823
502
31.16
3.24
1940
131,669,275 74,423,702 57,245,573
43.5 30,546,911
23.2 53.4
6,096, 799
1,905,362 55.7
1,060, 852 321, 242 20, 580 56,929
131, 380 137,178 393, 544
341,822 530,131
174.0
41, 254,979 33,641, 739 23, 236, 303 10,405,436
3,060,187 "4, 553,053
8L5 56.3 25.2
7.4 n.o
6, 767 5, 518 3,811 1,707
502 747
38. 89 3L 71 2L 90 9.81
2.88 4.29
1 Estimates. ^ For definition of urban and rural, see headnote, table 10, p. 11. 5 The 1930,1935, and 1940 farm population comprises all persons living on farms without regard to occu-
pation; the 1920 fibres include also those farm laborers (and their families) who, while not living on farms, lived outside the limits of any incorporated place. A further difference is due to the fact that the 1920 and 1935 censuses were taken in January, while the 1930 and 1940 censuses were taken in April, when the number of persons on farms is appreciably larger. For farm population by States see table 12, p. 13.
< Data collected for 1925 are not strictly comparable with figures for other years. «Includes cropland harvested, crop failure, cropland lying idle or fallow, and plowable pasture. ® "Improved land"; figures nominally include land available for crops and land occupied by buildings,
yards, and barnyards. ^ Value is of specified farm property, not all farm property. 8 Figures for land and for buildings are less satisfactory than figure for total real estate value; in other
words, value of buildings should not be subtracted from total farm value and difference assumed to represent accurately .market value of land alone. Figures for land include the value of fences, tile drains, and other Incidental improvements on the land, excluding only the value of buildings.
9 Figures for 1910 exclude value of young animals when enumerated separately. For description of items for other years, see note 1 on "livestock," table 636, p. 580.
Source: Department of Commerce, Bureau of the Census; Sixteenth Census Reports, Agriculture, Vol. III.
572

SIZE OF FARMS 573 N o . 6 3 1 . — F A R M S — N U M B E R A N D A C R E A G E , 1 9 2 0 TO 1 9 4 0 , AND V A L U E OF S P E C I -
F I E D C L A S S E S O F F A R M P R O P E R T Y , 1 9 4 0 , BY S I Z E OF F A R M
S I Z E O F F A R M
Total
Under 3 acres 3 to 9 acres 10 to 19 acres 20 to 49 acres 50 to 99 acres 100 to 499 acres
100 to 174 acres, _ 175 to 259 acres.. 260 to 499 acres. _
500 to 999 acres 1,000 acres and over. .
Total
Under 3 acres 3 to 9 acres 10 to 19 acres 20 to 49 acres 50 to 99 acres 100 to 499 acres
100 to 174 acres. 175 to 259 acres... 260 to 499 acres. __
500 to 999 acres 1,000 acres and over
6,448,343
20,350 268, 422 507, 763
1, 503, 732 1, 474, 745 2, 456,107 1, 449, 630
530,800 475, 677 149, 819 67,405
1920 1935 1930 1935 1940
Number of farms
6,371,640
15,151 363, 384 588,049
1, 450,643 1, 421,078 2, 326,155 1, 383, 777
503,417 438,961 143, 852 63, 328
6,288, 648 6, 812, 350
43,007 315,497 559, 617
1,440, 388 1,374,965 2, 314, 858 1, 342, 927
520, 593 451, 338 159, 696 80, 620
35, 573 535, 258 683, 452
1, 440,143 1,444,007 2, 417, 803 1,404, 297
540, 267 473, 239 167, 452 88, 662
096, 799 100.0
35,977 470, 425 559, 254
1,221,006 1,291,048 2,254, 864 1, 278, 617
517,460 458, 787 163, 694 100,531
All land in farms (thousands of acres)
955,884 924, 319 986, 771 1,054,615 1,060,852 100.0 100.0 100.0 100.0 100.0
34 23 61 51 51 (0 (0 (0 « 3 (0 1,567 2,074 1,847 3,006 2,617 .2 .2 .2 « 3 .2 7,087 8,060
46, 405 7, 789 9, 369 7,607 .7 .9 .8 .9 .7
48,466 8,060
46, 405 46, 252 46, 594 39, 892 5.1 5.0 4.7 4.4 3.8 105, 631 101, 906 98, 685 104,016
467, 535 93,317 11.1 ILO 10.0 9.9 8.8
471, 488 443, 912 447, 000 104,016 467, 535 441, 366 49.3 48.0 45.3 44.3 4L6
194, 681 185, 708 180, 214 110, 265
188, 859 172, 020 20.4 20.1 18.3 17.9 16.2 112, 563 106, 473
180, 214 110, 265 114,408 109, 777 U.8 11.5 11.2 10.8 10.3
164, 244 151, 731 156, 522 164, 268 159, 569 17.2 16.4 15.9 15.6 15.0 100,976 97, 468 108, 924 114, 244 111, 935 10.6 10.5 11.0 10.8 10.6 220, 636 224, 472 276, 213 309, 701 364, 069 23.1 24.3 28.0 29.4 34.3
1920 1925 1930 1935 1940
Percent distribution of number of farms
.3 4.2 7.9
23.3 22.9 38.1 22.5 8.2 7.4 2.3 LO
100.0
.2 5.7 9.2
22.8 22.3 36.5 21.7 7.9 6.9 2.3 LO
100.0
.7 5.0 8.9
22.9 21.9 36.8 2L4 8.3 7.2 2.5 L3
100.0 100.0
.5 7.9
10.0 2L1 2L2 35.5 20.6 7.9 6.9 2.5 L3
7.7 9.2 20.0 2L2 37.0 2L0 8.5 7.5 2.7 1.6
Percent distribution of land in farms
1940
S I Z E O F F A R M B
1 O ^
.9 i a
> 2 ^ o
M a 2 o
a .s
1 Co
1 >
§ 1 P i i
O PI
If
Percent distribution
S I Z E O F F A R M B
1 O ^
.9 i a
> 2 ^ o
M a 2 o
a .s
1 Co
1 >
§ 1 P i i
O PI
If
0 1 §
a
.9 a
t a
X
£ o
1 as
nd cfl § g
CP 1=1 >
^ p a s
¡1 >
Total 6,096, 799 1, 060, 852 321, 242 33,641,739 3, 060,187 100.0 100.0 100.0 100.0 100.0 Under 3 acres 35, 977 51 21 119, 529 9, 788 .6 (0 (1) .4 .3 3 to 9 acres. 470, 425 2,617 1, 315 996, 636 58, 792 7.7 .2 .4 3.0 L9 10 to 29 acres 1,012, 971 18, 111 10,946 2,073, 695 128,805 16.6 L7 3.4 6.2 4.2 30 to 49 acres 767, 289 29, 388 14,591 1,824, 626 137, 887 12.6 2.8 4.5 5.4 4.5 50 to 99 acres 1, 291, 048 93,317 40, 731 4, 6n, 932 428, 481 21.2 8.8 12.7 13.7 14.0
50 to 69 acres 510, 305 29, 467 13,121 1, 543, 502 129, 339 8.4 2.8 4.1 4.6 4.2 70 to 99 acres. 780,743 63,850 27, 610 3, 068, 431 299,143 12.8 6.0 8.6 9.1 9.8
100 to 179 acres 1,309, 741 177, 509 77,192 7,867,857 805, 594 21.5 16.7 24.0 23.4 26.3 100 to 139 acres 688,163 79, 416 33,145 3, 545,184 365,051 11.3 7.5 10.3 10.5 1L9 140 to 179 acres 621, 578 98, 092 44, 047 4, 322, 673 440, 543 10.2 9.2 13.7 12.8 14.4
180 to 259 acres 486, 336 104, 289 45, 251 4, 538, 733 454, 216 8.0 9.8 14.1 13.5 14.8 180 to 219 acres 279, 577 55,149 23,095 2, 359, 066 239,144. 4.6 5.2 7.2 7.0 7.8 220 to 259 acres 206, 759 49,140 22,156 2,179, 666 215, 072 3.4 4.6 6.9 6.5 7.0
260 to 499 acres 458, 787 159, 569 65, 225 5, 588, 238 549, 597 7.5 15.0 20.3 16.6 18.0 260 to 379 acres 324,084 100, 751 42, 321 3, 755,874 369, 261 5.3 9.5 13.2 n . 2 12.1 380 to 499 acres 134, 703 58, 818 22, 903 1, 832, 364 180,335 2.2 5.5 7.1 5.4 5.9
500 to 999 acres 163, 694 111,935 34, 450 2, 590, 399 255, 412 2.7 10.6 10.7 7.7 8.3 500 to 699 acres 100, 702 59, 702 19, 529 1, 503, 595 148, 751 L7 5.6 6.1 4.5 4.9 700 to 999 acres 62, 992 52, 233 14, 921 1,086, 804 106, 661 LO 4.9 4.6 3.2 3.5
1,000 acres and over. . 100, 531 364, 069 31, 520 3, 430, 094 231, 615 L6 34.3 9.8 10.2 7.6
1 Less than one-tenth of 1 percent. Source: Department of Commerce, Bureau of the Census; Sixteenth Census Reports, Agriculture,
Vol. III.

5 7 4 FARMS^—GENERAL STATISTICS
N o . 6 3 2 . — F A R M S — N U M B E R , BY S I Z E , BY S T A T E S : 1 9 4 0
DIVISION AND STATE Total
number of farms
Under 30
acres 30 to 49 acres
50 to 99 acres
100 to 179 acres
180 to 259
acres
260 to 499
acres
500 to 999 acres
1,000 acres and over
United States.. 6,096, 799 1,519,373 767,289 1,291,048 1,309, 741 486, 336 458, 787 163, 694 100,531
New England Maine New Hampshire Vermont Massachusetts Rhode Island Connecticut
Middle Atlantic New York New Jersey Pennsylvania
East North Central Ohio Indiana— Illinois. Michigan.. Wisconsin..
West North Central-Minnesota Iowa. Missouri North Dakota-South Dakota., Nebraska Kansas
South Atlantic Delaware Maryland Dist. of Columbia.. Virginia West Virginia. . . . North Carolina.. South Carolina.. Georgia Florida
East South CentraL... Kentucky Tennessee Alabama Mississippi
West South CentraL._ Arkansas Louisiana Oklahoma Texas.
Mountain.... Montana. Idaho Wyoming. Colorado-New Mexico-. Arizona Utah Nevada
Pacific.. Washington. Oregon California
135,190 38,980 16, 554 23,582 31,897 3,014
21,163
348,100 153, 238 25, 835
169,027
1,006, 095 233,783 184,549 213, 439 187, 589 186,735
1,090, 574 197, 351 213, 318 256,100 73,962 72,454
121,062 156,327
1,019,451 8,994
42,110 65
174,885 99, 282
278, 276 137, 558 216, 033 62, 248
1,023, 349 252,894 247, 617 231, 746 291,092
964, 370 216, 674 150,007 179, 687 418, 002
233,497 41,823 43,663 15,018 «1,436 34,105 18,468 25, 411 3, 573
276,173 81, 686 61,829
132,658
41, 674 7, 303 4, 303 3,799
16, 433 1, 214 8,622
84,573 31, 262 11, 549 41,762
164, 996 52, 374 36, 540 29,909 31, 626 14, 547
100, 331 15, 215 20.376 37, 432
1, 495 2,489 8,183
15,141
319, 359 2,093
12, 569 51
60,185 30, 955 98, 444 50, 282 38,206 26, 574
379,072 81, 315 87, 638 65, 699
144, 420
250, 663 70, 242 75, 497 22,445 82,479
47,152 3,010 8, 324 1,055 8,734
11.377 5,751 8,165
736
131,553 39, 915 22, 266 69,372
14, 662 4,031 1,931 1,386 4,065
392 2,857
34, 650 13,127 2 ,—
18, 625
104,780 24, 248 19,880 14,933 28,833 16,886
62, 800 14,806 8,249
29,369 718
1,184 2, 537 5,937
175, 986 1,158 4,502
4 23, 254 13, 578 53, 285 25,665 42, 208 12,332
181, 360 33,800 38,786 57, 735 51, 039
138,939 43,926 33,478 17,448 44,087
18, 756 1, 432 5,707
475 2,718 ^613 1, 546 3, 859
406
35, 356 10,855 7, "
16,641
29,442 11,028 3,867 3, 769 5, 505
4,5
91, 677 36, 874 4,990
49,813
268, 033 67,951 48, 307 38, 291 57,977 55, 507
155,998 35,580 32,146 57, 453 1, 447 2,670 9, 308
17, 394
253, 090 2,404
38, 039 25, 314 71, 733 32, 047 63, 567 11,072
232,461
61, 310 57,773 47,680
196,166 48,091 21,914 36, 587 89, 574
28, 833 2,844 9, 385 1,314 5.682 2.683 1, 557 4,842
526
35, 348 10,182 9, 966
15,200
10,706 3,621 6,865 3, 661
486 3,359
92,440 44, 293 4, 664
43, 483
295, 624 62,820 50,115 67,566 48,374 66,749
323, 965 68,483 83,821 70, 858 10, 415 15, 416 36, 576 38, 396
164, 778 2,117 9, 577
2 30, 337 17, 961 37, 637 17,846 42, 479 6,822
148, 731 48,392 39,403 31,687 29, 249
194,101 34,351 10,845 54, 763 94,142
34, 440 5, 345 8,462 2,402 9,053 3,485 1,675 3, 493
525
26,964 7,604
10,669
10,976 3,380 1, 421 3, 890 1,187
132
28,138 16, 759
10, 290
106, 289 17,281 18,005 35,614 13,627 21,762
156, 666 32,019 40, 024 31, 370 4,491 7,990
19, 282 21, 490
53, 270 693
3,705
11,238 5,949 9,681 5,399
14,335 2, 270
42,755 13,697 11, 412 9,069 8,577
64, 961 10, 225 3,217
15,919 35,600
12, 738 2,146 3, 092
939 3,100 1,183
752 1,
10, 543 2,792
4,462
7, 836 2,051 1,068 3,230
808 79
600
14,424 9, 557
512 4,355
58, 601 8,006
10, 210 24,021 6,220
10,144
195, 183 27, 078 26,119 23,989 29, 620 24,170 27, 909 36, 298
37, 384 431
2, 360 1
8,569 4,098 5,675 4,235
10, 242 1,773
8,018 7,131 6, 594 6,645
71, 448 7,081 2,876
22, 755
30, 633 7,817 4, 509 2,113
3,816 1, 541 1,609
14,890 4,177 4,215
1,574 393 282 567 177 22
133
1,846 1,196
78 572
1, 332
995
67, 887 3,743 2,382
19, 371 11, 380 10, 570 15, 635
11,367 73
395 1
2, 575 1,100 1,447 1, 438 3, 585
753
7, 752 1,594 1, 590 2,148 2,420
28, 618 2,034 1,322 6,979
18, 283
27, 557 8,614 2,542 2,334 6,913 3,871 1 , " ' 1,019
325
10,198 3,125 2,522 4, 551
61 76 61 9
33
352 170 55
127
877 137 160 266 169 145
27, 744 427 201 823
6, 405 7,155 6,697 6,036
4,217 25 94
327 374 646
1, 411 652
2, 830 380 347
1,041 1,062
19, 474 724 858
2,791 15,101
33,388 10,615 1, 642 4,386 6,388 5,077 3,707 1,096
477
11,321 3,036 3,020 5,265
Source: Department of Commerce, Bureau of the Census; Sixteenth Census Reports, Agriculture, Vol. III.
V A L U E O F F A R M P R O P E R T Y 575
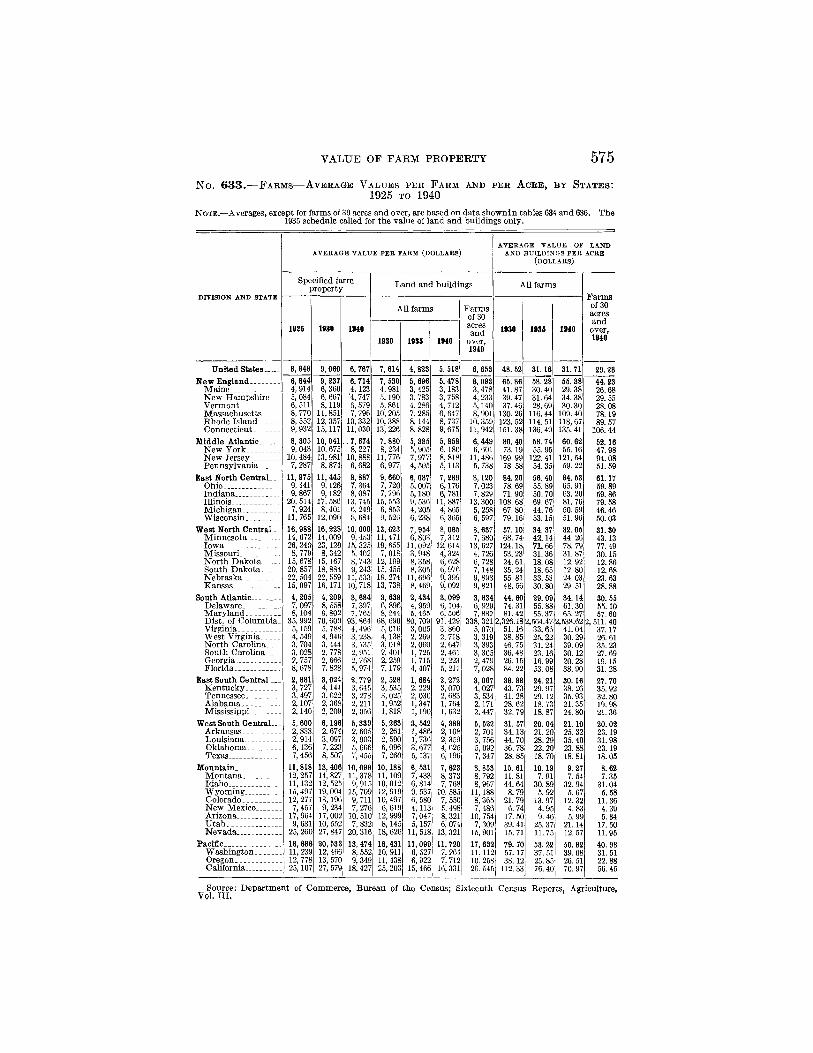
N o . 6 3 3 . — F A R M S — A V E R A G E V A L U E S P E R F A R M AND P E R A C R E , BY S T A T E S : 1 9 2 5 TO 1 9 4 0
NOTE.—Averages, except for farms of 30 acres and over, are based on data shown!n tables 634 and 636. The 1935 schedule called for the value of land and buildings only.
DIVISION AND STATE
AVERAGE VALUE PER FARM (DOLLARS) AVERAGE VALUE OF LAND
AND BUILDINGS PER ACRE (DOLLARS)
DIVISION AND STATE
Specified farm property Land and buildings All farms
Farms of 30 acres and
over, 1940
DIVISION AND STATE
1925 1930 1940
All farms Farms of 30 acres and
over, 1940
1930 1935 1940
Farms of 30 acres and
over, 1940
DIVISION AND STATE
1925 1930 1940 1930 1935 1940
Farms of 30 acres and
over, 1940
1930 1935 1940
Farms of 30 acres and
over, 1940
United States 8, 949 9,060 6, 767 7,614 4, 823 5,518 6, 653 48. 52 3L 16 31.71 29.28 New England 6, 844 9, 237 6,714 7, 530 5,696 5, 478 6,093 65. 86 58. 28 55. 38 44. 23
Maine 4, 914 6, 360 4,123 4, 981 3,425 3,183 3,478 41.87 30. 40 29. 38 26.68 New Hampshire. 5,084 6, 667 '4, 747 5,190 3, 783 3, 758 4, 233 39. 47 31.64 34. 38 29. 55 Vermont 6, 511 8,119 6, 579 5, 861 4, 286 4, 712 5,140 37.46 28.69 30. 30 28. 08 Massachusetts 8, 770 11, 851 7,796 10, 205 7, 285 6, 647 8,901 130. 26 116. 44 109. 40 78.19 Rhode Island 8, 552 12, 357 10, 332 10, 388 8,144 8, 737 10,359 123. 52 114.51 118, 67 89. 57 Connecticut-_ . - 9,932 15,117 11, 030 13, 226 8, 828 9, 675 11,942 151. 38 136. 49 135. 41 106.44
Middle Atlantic 8, 305 10,041 .. 7, 674 7, 880 5, 385 5, 858 6, 449 80.40 58. 74 60. 62 52.16 New York 9, 043 10,675 8, 227 8, 234 5,905 6,180 6,601 73.19 55.95 55.16 47. 98 New Jersey 10,484 13,981 10,888 11, 776 7,977 8, 818 11,486 169. 99 122.41 121. 54 94.08 Pennsylvania 7,287 8,874 6,682 6,977 4,505 5,113 5, 738 78. 58 54.35 59. 22 5L59
East North CentraL.. 11, 975 11,445 8, 887 9, 660 6,087 7, 289 8,120 84. 20 56.40 64. 53 6L 17 Ohio 9,141 9,126 7,364 7,720 5,007 6,176 7,023 78. 69 55.89 65. 91 59. 89 Indiana 9, 867 9,182 8, 087 7, 796 5,180 6, 781 7, 829 7L90 50. 70 63.20 59.86 Illinois 20, 514 17,586 13, 745 15, 553 9, 536 11, 887 13, 300 108. 68 69. 67 81.76 79. 58 Michigan 7,924 8,401 6, 249 6, 853 4, 205 4, 865 5, 258 67. 80 44. 76 50. 59 46.46 Wisconsin 11, 765 12,090 8, 684 9, 52fi 6, 238 6, 365 6, 597 79.16 53.15 5L96 50.03
West North Central - 16,988 16, 228 10, 000 13,623 7, 954 8, 065 8, 637 57.10 34. 37 32. 05 31.30 Minnesota 14, 672 14,009 9, 453 11, 471 6,803 7,312 7,680 68.74 42.14 44.26 43.13 Iowa. 26, 240 23,120 15, 325 19, 655 11,092 12, 614 13, 627 124.18 7L 66 78. 79 77. 49 Missouri 8, 779 8, 342 5,402 7, 018 3, 948 4, 324 4, 726 53. 23 31.36 3L87 30.15 North Dakota- 15,678 15,167 8, 743 12,199 8,358 6, 628 6, 728 24. 61 18. 08 12. 92 12.86 South Dakota 20, 857 18, 884 9, 243 15, 455 8,305 6, 976 7,148 35. 24 18. 65 12. 80 12. 68 Nebraska _ 22, 504 22, 559 11, 533 19, 274 11,696 9, 399 9, 893 55. 81 33. 53 24.03 23. 63 Kansas 15, 097 16,171 10, 718 13, 738 8,469 9,092 9, 821 48.56 30.80 29. 51 28.88
South Atlantic - 4, 205 4,209 3, 684 3, 639 2, 434 3,099 3, 834 44. 60 29. 09 34.14 30. 55 Delaware- - - . __ 7, 097 8, 558 7, 397 6, 896 4, 959 6,104 6,929 74. 31 55.88 6L30 55.10 Maryland 8,104 9,802 7, 765 8, 244 5, 465 6, 506 7, 882 81.42 55. 37 65. 27 57.60 Dist. of Columbia. 35, 992 70, 600 93, 864 68, 690 80, 709 91, 429 338, 321 2,326.18 2,564.47 2,538.62 2, 511. 40 Virginia 5,159 5, 788 4,496 5,016 3, 005 3,860 5, 070 51.16 33.66 41.04 37.17 West Virginia 4, 549 4, 946 3, 238 4,138 2, 269 2, 718 3, 319 38. 85 25.22 30.29 26. 61 North Carolina 3,704 3,444 3,135 3, 018 2, 069 2,647 3, 393 46. 75 31.24 39.09 35. 23 South Carolina 3, 028 2, 778 2, 951 2, 401 1, 725 2,461 3,305 36. 48 23.16 30.12 27. 69 Georgia . . _ Florida
2, 757 2, 666 2, 768 2, 259 1, 715 2, 223 2, 479 26.15 16.99 20. 28 19.15 Georgia . . _ Florida 8,678 7. 828 5, 974 7,179 4, 407 5,211 7,028 84.22 53. 08 38. 90 3L28
East South Central ___ 2,881 3,024 2,779 2, 528 1,684 2, 272 3,067 36. 88 24.21 30.16 27. 70 Kentucky 3, 727 4,144 3, 645 3, 535 2, 229 3,070 4, 027 43. 73 29. 97 38. 26 35. 92 Tennessee.- 3, 497 3, 622 3, 278 3, 025 2,030 2, 683 3, 534 41.28 29. 12 35.93 32. 80 Alabama 2,107 2, 368 2, 211 1,952 1,347 1,764 2,171 28. 62 18. 73 2L35 19. 98 Mississippi 2,140 2, 209 2, 056 1, 818 1,190 1, 632 2, 447 32. 79 18. 87 24. 80 2L36
West South C e n t r a l - 5,600 6,196 5,339 5,263 3,542 4,388 5,522 3L 57 20. 04 2L 10 20. 02 Arkansas-- _ - -- 2,833 2, 674 2,605 2,261 1,486 2,108 2, 701 34.13 21.20 25. 32 23.19 Louisiana 2,914 3,097 3, 003 2, 590 1, 736 2, 359 3, 756 44. 70 28. 29 35.40 31.98 Oklahoma 6,136 7, 223 5,666 6,096 3,677 4, 625 5, 092 36. 78 22. 20 23.88 23.19 Texas 7,456 8, 507 7, 455 7,260 5,137 6,196 7, 347 28. 85 18.70 18. 81 18.05
Mountain - - 11,818 13, 406 10,099 10,188 6, 531 7, 623 8, 853 15. 61 10.19 9. 27 8.62 Montana 12, 257 14, 827 11, 378 11,109 7, 433 8, 373 8, 792 11.81 7. 91 7. 54 7.35 Idaho. 11,132 12, 525 9,915 10, 012 6, 814 7, 768 8, 967 44.64 30. 89 32. 94 3L04 Wyoming 15, 497 19, 004 15, 709 12, 919 9, 537 10, 585 11,188 8. 79 5. 92 5. 67 5.58 Colorado 12, 277 13,196 9, 711 10, 497 6, 580 7, 550 8, 365 21.79 13.97 12. 32 n . 36 New Mexico 7,457 9, 234 7, 276 6,619 4,113 5,498 7, 486 6. 74 4. 95 4. 83 4. 39 Arizona 17,964 17, 002 10, 51C 12,999 7,047 8, 321 10, 754 17.50 9.46 5. 99 5. 34 Utah 9,631 10, 552 7, 832 8,145 5,157 6, 074 7, 309 39.41 25. 37 21.14 17. 50 Nevada 25,260 27, 847 20, 316 18, 626 11, 518 13,321 15,901 15. 71 n .75 12. 57 11.95
Pacific 18, 686 20,533 13, 474 18,431 11,099 11, 720 17, 632 79.70 53. 22 50. 82 40. 98 Washington 11, 239 12, 466 8,552 10, 911 6,527 7, 264 11,112 57.17 37. 51 39. 08 3L 51 Oregon 12, 778 13, 570 9, 349 11,438 6, 922 7, 712 10. 258 38.12 25.85 26. 51 22.88 California 25,107 27, 579 18,427 25,203 15,466 16, 331 26, 545 112. 33 76.40 > 70.97 56. 45
^ Source: Department of Commerce, Bureau of the Census; Sixteenth Census Reports, Agriculture,

576 FARMS^—GENERAL STATISTICS
N o . 6 3 4 . — F A R M S — N U M B E R AND A C R E A G E ,
N U M B E R O F F A R M S
D I V I S I O N A N D S T A T E
im 1925 1930 1935 1940
A L L L A N D I N F A R M S ( T H O U S A N D S O F A C R E S )
1920 1935 1930
United States.
New England Maine New Hampshire . Vermont Massachusetts. _. Rhode Island Connecticut
6,448,843 6,371,640 6,288,648 6,812,860 6,096,799 955, 884 924,819 986,771
Middle Atlantic-New York New Jersey- . . Pennsylvania _
East North Central.. Ohio Indiana Illinois Michigan Wisconsin
West North Central. Minnesota Iowa Missouri North Dakota . . . . South Dako ta . . . . Nebraska Kansas
South Atlantic Delaware Maryland District of Columbia-Virginia West Virginia North Carolina-- . South Carolina--.. Georgia Florida
156, 564 48, 227 20, 523 29,075 32,001 4,083
22,655
425,147 193,195 29, 702
202,250
1,084, 744 256,695 205,126 237,181 196,447 189,295
1,096,951 178,478 213, 439 263,004 77, 690 74, 637
124,417 165,286
1, 158,976 10,140 47,908
204 186,242 87,289
269, 763
310, 732 54,005
1, 051,600 270, 626 252, 774 256,099 272,101
996,088 232,604 135,463 191,988
Texas 436,033
East South Central-. Kentucky Tennessee Alabama Mississippi
West South Central. Arkansas Louisiana Oklahoma.
Mountain . . . M o n t a n a . Idaho Wyoming
Colorado. Col( New Mexico. Arizona. U t a h . . . . N e v a d a .
Paciflc Washington. Oregon Cal i fornia . . .
244,109 57, 677 42,106 15,748 59,934 29,844 9,975
25,662 3,163
284,164 66, 288 50,206
117,670
169.489 50,033 21,065 27, 786 33,454 3,911
23, 240
418,888 188,754 29,671
200,443
1,061, 672 244,703 195, 786 225, 601 192,327 193,155
1,111, 814 188,231 213.490 260,473 75,970 79, 537
127, 734 165, 879
1,108,061 10,257 49, 001
139 193, 723 90,380
283,482 172, 767 249,095 59, 217
1, 006,062 258, 524 252,669 237,631 257, 228
1,017,806 221,991 132,450 197,218 465, 646
288,892 46,904 40, 592 15, 512 58,020 31,687 10,802 25,992 3,883
266, 687 73,267 55,911
136,409
124,926 39, 006 14, 906 24, 898 25, 598 3,322
17,195
857,603 159, 806 25, 378
172,419
966, 602 219, 296 181, 570 214, 497 169, 372 181, 767
1,112,766 185,255 214, 928 255, 940 77, 975 83,157
129, 458 166,042
1, 068,468 9,707
43,203 104
170,610 82, 641
279, 708 157, 931 255, 598 58, 966
1,062,214 246,499 245, 657 257,395 312,663
1,103,184 242, 334 161, 445 203, 866 495, 489
241,314 47,495 41, 674 16, on 59, 956 31,404 14,173 27,159 3,442
261,788 70, 904 55,153
135,676
168,241 41,907 17,695 27,061 35,094 4,327
32,157
397,684 177,025 29, 375
191,284
1,083,687 255,146 200,835 231, 312 196, 517 199,877
1, 179, 856 203,302 221,986 278.454 84,606 83,303
133,616 174, 589
1,147,188 10,381 44,412
89 197, 632 104,747 300,967 165, 504 250,544 72,857
1,187,219 278,298 273, 783 273.455 311,683
1,187,571 253,013 170,216 213,325 501,017
271,892 50,564 45,113 37,487 63,644 41,369 18,824 30,695 3,696
399,567 84,381 64,826
150,360
185,190 38,980 16, 554 23, 582 31,897 3,014
21,163
348,100 153,238 25,835
169,027
1, 006, 096 233. 783 184,549 213,439 187, 589 186, 735
1,090, 574 197,351 213, 318 256,100 73,962 72,454
121,062 156, 327
1, 019,451 8,994
42,110 65
174,885 99,282
278, 276 137, 558 216,033 62,248
1,028, 349 252,894 247,617 231,746 291,092
964, 870 216,674 150,007 179,687 418,002
233,497 41,823
15,018 51, 436 34,105 18,468 25,411 3,573
276,178 81,686 61,829
132,658
16, 991 5,426 2,604 4,236 2,494
332 I,899
40,673 20,633 2,283
17, 658
117,786 23, 516 21,063 31, 975 19,033 22,148
266, 978 30,222 33,475 34, 775 36,215 34,636 42, 225 45,425
97,775 945
4,758 6
18,561 9, 570
20,022 12,427 25,441 6,047
78,897 21,613 19, 511 19, 577 18,197
178,449 17,457 10,020 31, 952
114,021
117,887 35,071 8, 376
II,809 24, 462 24,410 5,802 5,050 2,357
66,163 13,245 13, 542 29, 366
16, 868 5,161 2, 262 3,926 2,368
309 1,832
37,491 19,270 1,925
16,296
112, 762 22, 219 19, 915 30, 732 18, 036 21, 851
248, 081 30,059 33, 281 32, 642 34, 327 32,018 42, 025 43, 729
900 4, 433
4 17, 210 8, 980
18, 594 10, 639 21,945 5, 865
70,607 19,913 17,901 16, 739 16,053
165, 018 15, 632 8, 838
30, 869 109, 674
181, 689 32, 736
8,116 18, 663 24,167 27, 850 11,065 5,001 4,091
64,268 12, 610 14,131 27,517
14,288 4,640 1,960 3,896 2,005
279 1,502
85,047 17,980 1,758
15, 309
110, 891 21, 514 19, 689 30.695 17,119 21,874
265, 488 30,913 34,019 33, 743 38,658 36,470 44, 709 46,976
901 4,374
3 16, 729 8,802
18,055 10, 393 22,079 5,027
72, 817 19,927 18,003 17, 555 17, 332
183, 906 16,053 9, 355
33, 791 124,707
167,460 44,659 9,347
23, 525 28,876 30,822 10, 527 6,613 4,081
60, 525 13,534 16,549 30,443

NUMBER AND ACREAGE OF FARMS
BY S T A T E S : 1 9 2 0 TO 1 9 4 0
577
ALL LAND IN FARMS (THOU-
SANDS OF ACRES)—
continued
1935 1940
AVERAGE ACREAGE PER FARM
1925 1980 1935 1940
PERCENT OF TOTAL LAND AREA REPRESENTED BY ALL LAND IN FARMS
1920 1926 1930 1936 1940
DIVISION AND STATE
1,054,515 1,080,852 148.2 145.1 156. € 154.8 174.0 50.2 48 .6 61.8 55.4 55.7
15,463 4 ,722 2,116 4 ,043 2 ,196
308 2,080
36,465 18,686
1,914 15,866
116,957 22,868 20,519 31,661 18,460 23,469
273,077 32,818 34,359 35,055 39,118 37 ,102 46,616 48,010
96,987 921
4 ,384 3
17, 646 9,424
19,936 12,330 26,297
6 ,048
79,101 20,699 19,086 19,661 19,656
201,118 17,742 10,444 35,336 137,597
173, 881 47,512
9 ,952 28,162 29,978 34,397 14,019
6 ,239 3 ,622
62,476 14,680 17,358 30,438
13,371 4, 223 1,809 3,667 1, 938
222 1, 512
33,639 17,170
1,874 14,594
113, 655 21,908 19,801 31,033 18,038 22,876
274,423 32,607 34,149 34, 740 37,936 39,474 47, 344 48,174
92. 555 896
4 ,198 2
16,445 8 ,909
18, 845 11, 239 23,684 8, 338
77,086 20, 294 18,493 19,143 19,156
200, 527 18,045
9 ,996 34,803
137, 683
191,901 46, 452 10, 298 28,026 31, 527 38, 860 25, 651
7, 302 3, 785
63, 694 15,182 17, 988 30. 524
108.5 112.6 126.9 146.7
77 .9 81.2 8 3 . 8
96 .4 106.8
76 .8 8 7 . 3
108.6 91 .6
102.7 134.8 96 .9
117.0
234.8 169.3 156.8 132.2 466.1 464 .1 339.4 274.8
84 .4 9 3 . 1 9 9 . 3 27 .8 99 .7
109.6 74.2 64 .5 81 .9
112.0
76 .0 79 .9 77 .2 76.4 66 .9
174.1 75 .0 74 .0
166.4 261.6
480 .7 608.1 198.9 749.9 408 .1 817.9 581.7 196.8 745.2
199.8 269.7 249.6
99 .4 103.2 107.4 141.3
70 .8 79 .0 78 .8
89.6 102.1 64 .9 8 1 . 3
107.2 9 0 . 8
101.7 136.2 9 3 . 8
113.1
223.2 159.7 155.9 125.3 451.9 402.6 329.0 263.6
79 .9 87 .7 90 .5 27 .4 88.8 99 .4 65 .6 61.6 88.1 99 .0
70 .2 77 .0 70 .8 70 .4 62 .4
162.2 70.4 66 .7
156.6 235.6
564.2 697.9 199.9
1, 203. 2 416.5 878.9
1 .024 .4 192.4
1 .053 .5
204 .3 172.1 252. 7 201.7
114.3 119.0 131.5 156.5
78 .3 8 4 . 1 87 .4
98 .0 112.6 69 .3 88.8
114.7 9 8 . 1
108.4 143.1 101.1 120.3
238.6 166.9 158.3 131. 8 495.8 438.6 345.4 282.9
81.6 9 2 . 8
101.3 29.6 9 8 . 1
106.6 64.5 65 .8 86 .4 86.2
68.6 80.8 73 .3 68.2 66 .4
166.7 66.2 57 .9
165.8 251.7
652.6 940 .3 224.3
, 469 .3 481.6 981.6 742.7 206.7
, 185. 6
231.2 190.9 300.1 224.4
97 .7 112.7 119.6 149.4 62.6 7 1 . 1 64 .7
91 .7 105.6
65 .2 82 .9
107.9 8 9 . 6
102.2 136.9 93 .9
117.4
231.4 161.4 154.8 125. 9 462.4 445.4 348.9 275.0
83.7 8 8 . 7 98 .7 31 .6 8 9 . 3 90 .0 66.2 74 .5
101.0 8 3 . 0
74 .4 69 .7 71 .9 6 3 . 1
176.8 70 .1 61 .4
165.6 274 .6
640 .7 939 .6 220.6
1,610.4 471.0 831 .5 744.7 203.3 979 .9
208.6 174.0 267.8 202.4
108.3 109.3 155.5 60.8 73 .6 71 .5
96 .6 112.1 72 .6 8 6 . 3
113.0 93 .7
107.3 145.4 9 6 . 2
122.6
251.6 165.2 160.1 135.6 512.9 544.8 391.1 308.2
90 .8 9 9 . 6 99 .7 36 .0 94 .0 89 .7 67 .7 81 .7
109.6 133.9
75 .3 80.2 74 .7 82.6 65 .8
207.9 8 3 . 3 66.6
193.7 329.4
821.9 1,110. 7
235.8 1, 866. 2
612. 9 1,139. 4 1, 388.9
287.4 1,059. 4
230.6 185.9 290.9 230.1
42 .8 28 .4 46 .0 72.6 48 .6 48 .6 61.6
63.4 67 .7 47 .6 61.6
74.9 9 0 . 2 91 .3 8 9 . 1 51 .7 62.6
78.6 58 .4 94 .1 79 .1 80.6 70.4 85 .9 86.8
56.8 76 .1 74 .8 14.8 72.0 62.2 64.2 63 .7 67 .7 17.2
68 .7 84 .0 7 3 . 1 59 .7 61 .3
63 .1 51 .9 34 .5 71 .9 67 .9
21 .3 37 .6 15.7 18.9 36 .9 31 .1 8.0 9 . 6
27 .6 31.0 22.1 29.6
40 .0 27 .0 39 .1 67 .2 46 .0 45 .3 69 .4
58.6 63 .2 40 .0 56 .8
71 .7 85 .2 86 .3 85 .7 49 .0 61.8
76.9 68.1 93 .6 74 .2 76.4 65 .1 85 .5
51.4 71.6 69 .7
9 . 6 66.8 58.4 59 .6 54 .5 58.4 16.7
61.6 77.4 6 7 . 1 51 .0 5 4 . 1
60.0 46 .5 30 .4 69 .5 65 .3
24 .0 35 .0 16.2 29.9 36 .4 36 .5 15.2
9 .6 6.8
26 .7 29 .6 2 3 . 1 27 .6
36 .0 24 .3 33 .9 66 .7 39 .0 4 0 . 9 4 8 . 7
54.8 69 .0 36 .6 63 .4
70 .6 82.6 8 5 . 3 85 .6 46 .6 61 .9
81.2 69 .7 95 .6 76 .7 86.1 74 .1 9 1 . 0 8 9 . 8
50.8 71 .6 68.8
7 . 7 64 .9 67 .3 57 .9 63 .3 68 .7 14 .3
63 .4 77.6 67 .6 63 .6 68 .4
66 .9 47 .8 32 .2 7 6 . 1 74 .3
28.6 47 .8 17.6 37 .7 43 .6 39 .3 14.6 10 .7 6.8
29 .7 31 .6 27 .0 30 .6
39 .0 24 .7 3 6 . 6 69 .2 4 2 . 7 4 5 . 1 67 .4
57 .0 6 1 . 3 3 9 . 8 55 .3
74 .4 87 .7 8 8 . 9 8 8 . 3 50 .2 66 .3
83 .6 63 .4 9 6 . 6 79 .7 8 7 . 1 75 .4 9 4 . 8 91 .7
55 .7 73 .3 68 .9
7 . 1 68.6 6 1 . 3 63 .9 63 .2 6 7 . 3 17 .2
80 .5 71 .5 59 .9 66.2
73.1 52 .8 35 .9 79 .6 8 1 . 9
31.6 50 .8 18 .7 4 5 . 1 4 5 . 2 43 .9 19.2 11 .9
5 . 2
30.7 34 .3 28 .4 3 0 . 6
3 3 . 1 21 .3 3 1 . 3 61.8 3 8 . 3 32 .8 4 8 . 2
52.3 56 .0 38 .9 50 .6
72 .5 83 .2 8 5 . 5 86 .7 49 .4 6 5 . 3
84 .0 63 .7 95 .3 78 .4 84 .6 80.6 96 .5 91 .7
63.9 70 .7 6 6 . 3 6.0
64.4 57 .8 59 .9 57 .4 63 .2 24 .0
66 .7 79 .1 68 .9 58 .6 6 3 . 1
72 .7 53 .5 34 .6 78 .5 81.6 35 .0 49 .6 19.4 44 .9 47 .4 50 .0 35 .3 13.9 5 . 4
3 1 . 1 35 .4 29 .2 30 .4
U.S.
N.^E. Me. N. H. Vt. Mass. R. I. Conn.
M. A. N. y . N. J. Pa.
E. N. C. Ohio. Ind. 111. Mich. Wis.
W. N. C. Minn. Iowa. Mo. N. Dak S. Dak. Nebr. Eanst
S. A. Del. Md. D. 0 . Va. W. Va. N. C. S. C. Ga. Fla.
E. S. C.
Tenn. Ala. Miss»
w. s. c. Ark. La. Okla. Tex.
Mt. Mont. Idaho. Wyo. Colo. N. Mex. Ariz. Utah. Nev.
Pac. Wash. Oreg. Calif.
Source: Department of Commerce, Bureau of the Census; Sixteenth Census Reports, Agriculture, Vol. III.

578 FARMS—GENERAL STATISTICS
N o . 6 3 5 . — F A R M L A N D , B Y U S E ,
NOTE.—All figures in thousands of acres. For
DIVISION AND STATE
CROPLAND HAR-VESTED CROP FAILURE CROPLAND IDLE
OR FALLOW PLOWABLE
PASTURE DIVISION AND STATE
1929 1934 1939 1929 1934 1939 1929 1934 1939 1929 1934
United States 359, 242 295, 624 8321,242 12,707 63, 682 20,580 41,287 56,029 58, 929 109,160 98, 579
New England 3, 659 4, 044 3,408 41 28 63 315 231 339 965 737 Maine 1, 304 1, 386 1,147 6 7 15 91 59 108 259 180 New Hampshire 380 446 372 4 2 7 38 15 38 106 79 Vermont 1,074 1,114 1,023 6 5 8 48 14 46 274 222 Massachusetts 474 548 456 10 7 22 80 68 80 162 133 Rhode Island 55 66 49 2 1 3 11 11 10 35 25 Connecticut 372 484 363 12 6 8 47 64 55 128 98
Middle Atlantic — 14, 324 14, 886 13, 457 336 258 278 2, 296 2,015 1,882 4,353 3, 786 New York 6,959 7, 388 6, 581 169 116 133 1,026 735 743 2, 376 2. 066 New Jersey 777 865 779 20 3 29 191 187 150 198 175 Pennsvlvania 6, 588 6, 633 6,097 147 138 116 1, 079 1, 093 988 1, 779 1, 545
East North Central 56, 644 56,178 55,431 1,595 3, 087 718 5,193 5, 494 5,120 14, 628 15,182 Ohio 10,116 10, 384 9, 772 227 231 152 927 916 896 3, 763 3.914 Indiana 10, 214 10,103 9, 711 348 394 168 1,161 1,341 1,069 2. 810 2,951 Illinois 18, 958 17, 567 18, 270 701 1, 735 209 1, 480 1,848 1,718 4, 092 4,034 Michigan -- - 7, 738 8, 353 7, 863 197 251 115 1,159 977 1, 045 2, 064 2, 237 Wisconsin 9, 618 9, 772 9, 816 122 477 73 466 413 391 1,900 2,046
West North Central 138,716 90,919 114,239 4,058 40,230 11,311 7,511 17, 603 19,649 34,406 30, 363 Minnesota - -- 18, 445 17,161 18, 807 255 2, 475 251 790 880 1,075 2,249 2, 274 Iowa 22, 276 18, 926 20, 077 232 1, 111 282 231 1,178 828 4,982 5, 770 Missouri 13,176 11, 762 12, 400 806 1, 302 238 1, 665 1, 548 1,128 7, 018 7,909 North Dakota 21,255 9,348 15, 537 854 9, 889 1,131 2. 419 5,166 6, 810 3,183 2, 733 South Dakota 17,856 4,864 12, 297 583 9, 782 2,155 563 2, 771 2. 471 5, 707 4, 355 Nebraska 21,399 12,195 17, 305 360 8, 235 1,884 584 2, 279 2, 491 4,160 2, 653 Kansas 24,308 16, 663 17,816 968 7, 436 5, 370 1, 259 3, 781 4, 846 7,107 4, 670
South Atlantic 27, 520 27, 988 28, 323 568 482 414 5,979 6, 630 4, 840 7, 786 7, 872 Delaware 408 389 378 9 6 10 88 110 97 83 76 Maryland 1.742 1,677 1,609 18 20 30 370 385 345 539 551 District of Columbia 2 1 (5) («) (') («) (®) Virginia 3, 975 3,842 3, 840 80 65 63 1, 003 1,151 867 2, 925 2, 993 West Virginia 1,655 1,710 1,565 25 29 25 227 188 238 1, 718 1, 643 North Carolina 5,810 5,966 6,125 129 84 69 1,074 1, 248 998 888 946 South Carolina 4,137 4,178 4, 322 97 87 35 803 1,021 569 351 357 Georgia---Florida
8, 337 8, 646 8,803 164 138 110 1, 946 2,038 1,264 980 959 Georgia---Florida 1,454 1,579 1,680 46 53 72 469 489 462 301 348
East South Central 25,148 25, 722 25,495 600 385 1,063 4, 499 4, 482 3,787 10, 845 11,969 Kentucky 5, 331 5, 418 5, 272 150 104 133 1, 446 1,351 1,104 5, 395 5, 687 Tennessee 6,106 6, 330 6,159 145 97 203 1,414 1. 286 1, 250 2, 751 3, 015 Alabama 7,114 7,239 7,112 157 76 309 928 1,041 803 1,204 1, 363 Mississippi _ - 6,597 6, 735 6, 953 147 108 4i7 711 803 630 1,495 1,903
West South Central 56, 838 48,187 49,472 2, 864 9, 890 3, 538 5,046 7, 145 8, 084 16, 491 12, 960 Arkansas 6, 582 6,438 6, 610 232 368 137 1,093 1,100 902 1,170 1,492 Louisiana 4, 068 3,977 4, 052 130 149 60 543 630 483 916 1,120 Oklahoma 15, 553 12, 342 12, 766 698 2,885 1,254 1,082 1,824 1,811 3, 249 2, 562 Texas 30, 634 25, 429 26, 044 1,804 6, 488 2, 087 2,328 3,591 4,887 11,156 7, 787
Mountain. 23,279 14, 654 18,488 2, 063 8, 486 2, 725 5, 309 7, 280 7, 703 15,217 11,445 Montana 7,841 4,592 5, 748 789 2, 567 497 2, 769 3, 438 3,889 4, 695 3, 639 Idaho 3,150 2, 669 2, 935 87 319 62 836 944 932 379 353 Wyoming 2,008 1,220 1,535 96 552 210 189 368 309 2, 322 1,301 Colorado 6, 750 3, 852 4, 770 858 3, 389 1, 559 840 1,599 1,685 4, 215 2,807 New Mexico. 1,494 744 1, 573 98 1, 223 261 207 421 365 3,198 2, 931 Arizona 478 489 526 35 50 44 135 150 161 102 160 Utah 1,160 815 966 48 358 77 288 332 325 228 201 Nevada 398 272 436 52 27 16 45 28 36 78 53
Pacific - 13,115 13,046 12,929 583 837 470 5,139 5,148 5, 525 4,470 4, 264 Washington 3, 659 3, 636 3, 570 178 97 61 2, 438 2, 438 i 2,599 578 573 Oregon 2,906 2, 832 2, 824 111 280 112 1,155 1,085 > 1,105 817 724 California 6, 550 6, 579 6, 535 293 460 296 1,546 1, 625 i 1,821 3,075 2,968
I Cropland harvested and crop failure. 8 Cropland harvested, crop failure, cropland idle or fallow, and plowable pasture. » Of this total, 15,230,000 acres represent irrigated cropland harvested.

ACREAGE OF FARMS 579 BY S T A T E S : 1 9 2 9 , 1 9 3 4 , AND 1 9 3 9
total land in farms, see table 634.
PLOW-ABLE PAS-
TURE— con.
ALL OTHER LAND LAND USED FOR CROPS 1
LAND AVAILABLE FOR CROPS 2
1939 I M 1934 1939 1939 1934 1939 1939 1934 1939 1939 1934 1939
4 131,380 149,946 185,475 137,178 314,429 355,126 393, 544 371,949 359, 306 341,822 522,396 513,914 530,131
1,371 320 173 401 230 32
216
5,017 2,780
199 2,039
19,108 4, ' 3, 702 4,936 2,876 2, 757
38, 209 2,841 6,361 9, 241 3,623 6, 247 3, 736 6,161
9,901 84
601
1,192 2,033 1,230
604 1,513
643
15,127 6, 703 3, 54" 2,17' 2,702
21,058 2,54r 1,443 3,83C
13,243
15,18! 4,65i
77i 1,45i 4,88i 2,37'
26; 39i 374
6,407 951
1,214 4,243
6,400 2,241 1,072 1,504
863 122
7,276 3, 634
279 3,
17, 075 2,774 2, 619 2, 742 3,235 5,705
17, 759 4, 746 2, 214 7,700
558 491 941
1,110
33,735 204
1, 213 G) 6,6 3,129 8, 326 3,903 8,373 1,892
4, 797 5, 413 6,486 6,224
27, 851 5,443 2, 659 4,059
15, 689
7,430 1,820
860 516
1, 541 1, 81g
6ir 19: 6€
9,498 1,87^ 3, m 4,50S
7,' 2, 428 1, 274 1, 671 1,028
149 990
8,044 4,022
356 3,
19, 674 3,159 3,064 3.123 3,816 6, 512
19, 977 5, 383 2, 312 8,903
575 636 934
1,2
42,812 235
I, 264 (®) 7,670 3, 570
10,095 5, 691
11, 675 2,611
27,437 5,421 6,206 8, 247 7, 563
39, 937 6, 527 3,427 4, 847
25,136
8, 645 1,774
951 596
1, 759 2,132 1.124
220 89
II,411 2, 354 3, 350 5,707
5,147 1, 783
860 1,174
717 91
521
6, 382 3,022
424 2,
13,498 2,413 2, 340 1,913 2, 710 4,121
13,172 2,932 1, 300 6, 952
386 340 550 711
37,905 225
1,142 0) 6,762 2,994 9,093 4,863
10,175 2,650
4, 592 5, 219 7,009
171 2,950 3,065
14,074
6, 046 1,137
692 387
1,097 1,482 1,147
79 25
5, 880 1, 461 2,082 2,337
2,904 738 360 990 417
54 344
6,462 3,815
294 2,353
16, 766 3,708 2, 537 2, 722 2,726 4,063
63,038 4,427 4,086 3,379
10,389 11,270 17, 263 12, 224
10, 776 110 493
2,050 2,049 1,829 1,103 2,279
8, 806 2,809 2,173 1,666 2,158
74,817 1, 532 1,040 9,150
63,09r
104,152 26, 746 4,03'
18,39; 14, 67 24,006 9,15c 3, 69r 3, 44:
27, 718 4, 8,437
14, 475
2,884 662 300
1,017 412 56
437
7,467 4, 357
328 2,781
17, 342 4,254 2, 3, 355 2, 826 4, 240
73, 986 4, 644 5,063 3, 630
11, 407 14, 695 20, 320 14, 227
10,203 106 487
1 1,925 2,283 1,
1,841
9,106 2, 717 2,151 1, • 2, 543
1, 816 1,141
10, 875
123,372 31, 501 4, 716
24,124 16, 572 26,947 12,046 4, 313 3,153
27, 769 5,582 9,087
13,101
3,044 851 359
1,015 433 38
349
3,911 294
2,418
19, 780 3,836 2,811 3, 3,429 5, 718
77, 843 6,701 5, 4, 780
10, 449 15, 964 21, 37f 13, 269
11,172 101 471
1 1, 721 2,053 1,330
846 1,819 2,831
8, 726 2, 489 2,115 1, 737 2,385
92,116 1, 1,008
12,077 77,348
141,756 30,525
24,126 17, 532 32, 806 23, 511 5, 461 2,898
32,484 6, 541
10, 651 15, 292
3,700 1,310
384 1,
57
14,660 7,128
797 6,735
68, 239 10,342 10, 562 19, 659 7,935 9,741
142,773 18,700 22, 508 13,981 22,109 18,439 21, 759 25,276
28,087 416
1,760 2
4,056 1,681 5,938 4,234 8,501 1,500
25, 748 5, 481 6, 252 7, 271 6,744
59, 701 6,814 4,198
16, 251
4,072 1,393
448 1,119
555 67
490
15,144 7, 505
868 6, 771
59, 265 10, 615 10, 497 19, 301
25, 342
3, 237 2,104 7, 1, 592
514 1,207
450
13, 698 3,837 3,018
10,248
131,149 19,636 20,036 13,064 19,237 14, 646 20, 430 24,099
28,470 394
1,697 2
3,906 1, 740 6,050 4, 265 8,784 1, 632
26,107 5, 522 6, 427 7, 315 6,843
58, 077 6,806 4,126
15, 227 31,918
23,139 7,160 2, 1, 772 7, 242 1,
539 1,173
13, 883 3, 733 3,112 7,
3,471 1,162
379 1,031
478 51
371
13,735 6,714
808 6,213
56,149 9,924 9,879
18,479 7,978
125, 550 19,058 20, 359 12, 638 16, 668 14,452 19,189 23,187
28,737 389
1,639 1
3,903 1, 590 6,194 4, 357 8, 913 1, 751
26, 558 5,405 6, 362 7, 421 7,370
53, 010 6, 747 4,112
14,020 28,131
21,213 6,24: 2,997 1, 745 6, 329 1,833
570 1,043
452
13,398 3,631 2, 937 6,831
4,979 1,661
529 1.402
726 103 558
21,308 10,530 I,185 9,593
78,060 15,032 14, 532 25,232 11,158 12,106
184,691 21, 740 27, 720 22, 664 27, 711 24, 710 26, 504 33, 642
41,852 587
2,668
7, 3, 625 7, 900 5, 388
11, 427 2, 271
41,091 12, 322 10, 41" 9.403 8,950
81, 238 9,077 5, 656
20, 582 45,923
45, 868 16,093 4, 453 4, 614
12, 663 4,
751 1,724
572
23, 308 6,853 4,
II,465
5,041 I,632
541 1,355
756 104 653
20,945 10,306 1,230 9,409
79,941 15,445 14, 25,183 11,817 12,707
179,115 22, 790 26,984 22, 521 27,136 21, 772 25,362 32, 550
42,972 580
2, 633 2
8,050 3, 571 8,244 5, 643
II, 781
42, 558 12, 560 10, 728 9, 720 9, 550
78,183 9, 398 5,876
19, 613 43, 296
41, 864 14,237 4,285 3,442
11, 648 5, 319
849 1, 706
6,744 4,921
11, 631
5,181 1, 589
590 I,478
788 93
642
20, 634 10,237 1,157 9,240
80, 378 15, 658 14, 650 25,133 11, 13,038
183,408 22,974 27, 548 23,007 27,101 23,169 25,415 34,193
43,478 570
2, 585 1
7,962 3," 8, 422 5,
II, 690 2,857
46, 472 13, 213 11,159 10, 397 10, 703
82,152 10,190 6,038
19, 661 46,262
44,099 14, 789 4,708 3, 513
12,899 4, 573
993 1, 762
862
25, 331 7,180 5, 255
12,89r
< Of this total, 2,753,000 acres represent irrigated pasture, although small acreages of irrigated pasture may be a part of the area shown for "woodland" or "all other land."
8 Less than 500 acres. Source: Department of Commerce, Bureau of the Census; Sixteenth Census Reports, Agriculture, Vol. I l l

580 FARMS^—GENERAL STATISTICS
N O . 6 3 6 . — F A R M P R O P E R T Y — V A L T J E O P
NOTE.—The schedule for 1936 did not call for the value of land and buildings separately or for the
[All amounts in
D I V I S I O N A N D S T A T E
TOTAL VALUE OF SPECIFIED FARM PROPERTY
1925 1930 1940
VALUE OF LAND AND BUILDINGS
1925 1930 1935 1940
United States
New England-Mame New Hampshire Vermont Massachusetts Rhode Island Connecticut---
Middle Atlantic-New York New Jersey Pennsylvania
East North Central-Ohio Indiana. Illinois Michigan Wisconstn...
West North Central Minnesota Iowa Missouri North Dakota South Dakota Nebraska Kansas
South Atlantic -Delaware i --Maryland Dist. of Columbia Virgmia West Virginia. North Carolina South Carolina Georgia Florida
East South Central Kentucky Tennessee Alabama Mississippi
West South Central Arkansas Louisiana Oklahoma Texas.- -
Mountain Montana Idaho Wyoming Colorado New Mexico Arizona Utah. . Nevada
Pacific Washington Oregon. California
57,017,740 56,975,607 41,254,979 49,467,647 47, 879, 838 32, 858, 844 33,641,739
1,091,546 246, 869 107, 084 180,912 293, 405 33, 446
230, 829
8,478,716 1,706,930
311,084 1,460, 702
12, 692,988 2, 236,902 1,931, 742 4, 627, 966 1, 623, 977 2,272,402
18,879,178 2,761,684 6, 602, 078 2, 286, 639 1,191, 037 1, 668, 921 2, 874, 478 2,504,340
4,659,177 72, 798
397,093 6,003
999, 466 411,169
1,050, 016 623, 084 686, 673 613,884
1, 163, 929
963, 669 883, 646 500, 740 560, 671
6,696,760 628,846 385,911
1,210,135 3,471,867
2,758,216 674,897 451,886 240, 396 712,285 236, 301 194, 049 250, 318
4,962,634 823, 438 714, 410
8,424, 786
99, 374 202,150 303, 366 41,049
259, 939
8, 590,717 1, 706,862
' 364,816 1, 630, 060
11,061,314 2, 001, 396 1,667, 241 3, 772, 092 1, 422, 971 2,197,614
18,057,877 2, 695,159 4,969,096 2,136,127 1,182, 664 1, 670,376 2,920, 413 2, 686, 044
4,466, 268 83, 075
423, 467 7, 342
987, 528 408, 751 963,248 438, 807 681, 472 461, 588
3,211,773 1,021, 563
889, 821 609,602
6,836, 506 647,990 600,064
1,472, 670 4,214,882
3,236,062 704,226 621, 979 304, 271 791,206 289, 976 240, 972 286, 584 95,860
8,374,160 883,884 748, 405
3, 741,871
907,691 160.719 78, 583
165,156 248, 665 31,140
233,428
2,671,353 1,260,676
281, 289 1,129, 388
8,941,602 1, 721, 692 1,492, 406 2, 933, 651 1,172,173 1, 621, 680
10,906,141 1,865, 499 3,269,153 1, 383, 391
646, 686 669.720
1, 396, 223 1, 675, 469
3,766,436 66, 527
327,000 6,101
786, 226 321,470 872, 390 405,878 697,987 371,858
2,844,373 921, 755 811, 613 512, 427 698, 578
5,149,192 564, 451 450, 430
1,018,166 3,116,145
2,358,070 476,862 432, 938 235, 913 499, 498 248,140 194,108 199, 026 72,588
3, 721,120 698, 546 578, 049
2, 444, 526
905,627 197, 270 86, 633
137, 271 264, 603 27,920
201, 931
2,799,834 1,367,125
262, 637 1,170,172
11,023,659 1,946, 631 1,696, 741 4,199, 459 1, 284, 062 1,898,766
16, 630,891 2, 393, 742 4.954.446 2, 003, 286 1, 020,103 1, 437, 288 2, 624,074 2,197,952
4,098,944 59, 676
341, 361 4,795
886,814 356,154 926, 026 457, 622 587, 564 478,942
2, 480, 830 847, 426 769, 426 414,859 459,118
4, 969, 433 540, 727 324, 678
1, 048, 757 3,045, 271
2,172,982 456, 395 373, 326 172, 676 592, 455 174,917 144, 014 192, 201 67,997
4.495.447 726,890 616, 069
3,152, 488
940,713 194, 280 77, 356
146, 935 261, 222 34, 508
227,413
2,817,767 1,315,906
298,846 1, 203, 018
9, 336, 791 1, 693, 031 1,415, 542 3, 336, 049 1,160, 662 1,731, 617
16,158, 630 2,125, 093 4,224, 506 1, 796, 247
951, 225 1,285,154 2,495, 203 2,281,102
3,862,079 66, 942
356,170 7,144
855, 850 341,976 844,122 379.191 577, 338 423, 346
2, 685, 364 871, 449 743, 222 502, 371 568, 322
5, 806,151 647, 828 418.192
1, 242, 724 3, 597, 407
2, 458,483 527, 610 417, 250 206, 852 629, 347 207, 859 184, 231 221, 223 64, 111
4, 823, 961 773, 663 630,828
3,419, 471
901,271 143, 639 66,937
116,996 255, 677 35, 238
283,884
2,141,412 1,045, 392
234, 313 861, 707
6, 696, 844 1, 277, 656 1,040,238 2, 206,900
826, 261 1,246,889
9, 386,141 1, 383, 072 2, 462, 313 1,099, 281
707,139 691,863
1, 662,813 1,478, 669
2,791,939 51, 476
242, 714 7,183
593, 855 237, 644 622,719 285, 516 429, 765 321,078
1,915,218 620, 409 655, 751 368, 220 370,839
4,029, 702 376,088 295, 615 784, 394
2, 673, 705
1, 772, 439 375, 841 307, 395 166, 774 418, 758 170,150 132, 650 168, 303 42, 569
3, 324, 878 550, 720 448, 712
2, 325, 446
740, 508 124, 083
62, 206 111,109 212, 014 26, 334
204, 761
2,039,079 947,074 227,806 864, 200
7, 333,631 1,443,917 1,251,492 2, 637,117
912, 545 1,188, 559
8, 795,913 1, 443, 021 2, 690, 744 1,107, 303
490,197 505, 452
1,137,808 1, 421, 387
3,159, 550 54, 899
273, 980 5,943
674, 976 269,827 736, 708 338, 495 480, 345 324, 378
2, 324, 737 . 776, 494
664, 474 408, 78.'-474,986
4, 231, 841 456,848 353,874 831,141
2, 589, 979
1, 779, 843 350,178 339,194 158, 971 388, 344 187, 526 153, 677 154, 358 47, 694
3,236, 636 693, 366 476,817
2,166, 453
1 Figures for 1926 include value of classes of livestock not enumerated, estimated at $29,162,000; figures for 1930 exclude value of poultry other than chickens; figures for 1930 and 1940 exclude value of young ani-mals when enumerated separately; figures for 1935 exclude value of poultry other than chickens and tur-keys over 3 months old and bees; figures for 1936 and 1940 exclude value of asses and burros; figures for 1940 mclude value of fur animals (silver fox and mink females) kept in captivity.
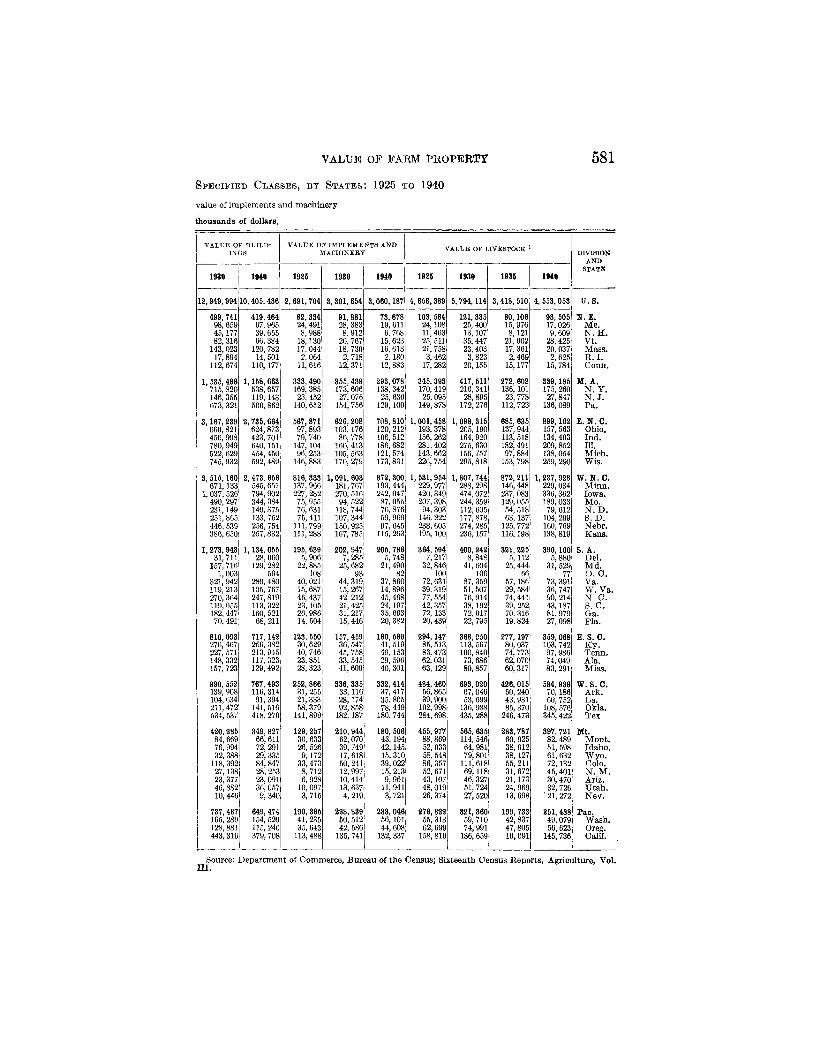
VALtJE OF FAHM PROPERTY 581 S P E C M E D C L A S S E S , BY S T A T E S : 1 9 2 5 TO 1 9 4 0
value of implements and machinery
thousands of dollars]
VALUE OF BUILD-INGS
VALUE OF IMPLEMENTS AND MACHINERY VALUE OF LIVESTOCK ̂ i DIVISION
AND
1930 1940 1925 1930 1940 1925 1930 1935 1940 STATE
12,949,994 10,405,436 2, 691, 704 3, 301, 654 3,060,187 4, 858,389 5, 794,114 3,418,510 4, 553,053 u. s.
499,741 98,659 45,177 82, 316
143,023 17,894
112, 674
419,464 67, 965 39, 655 66, 384
120,782 14, 501
110,177
82,334 24, 491 8,988
18,130 17, 044 2,064
11, 616
91,881 28, 383 8, 912
20, 767 18, 730 2,718
12, 371
73, 678 19, 611 6, 768
15, 623 16,613 2,180
12, 883
103, 584 24,108 11,463 25, 511 21, 758 3, 462
17, 282
121, 335 25, 400 13,107 35,447 23, 403 3,823
20,155
80,106 15,976 8,121
21,002 17, 361 2, 469
15,177
93, 505 17,026 9,609
28,425 20, 037 2, 625
15, 784
N.E. Me. N. H. Vt. Mass. R. L Conn.
1, 535,496 715, 820 146, 355 673, 321
1,158, 663 538, 657 119,143 500, 862
333, 490 169, 385 23, 452
140, 652
355, 439 173,606 27, 076
154, 756
293,078 138, 342 25, 636
129,100
345, 393 170, 419 25,095
149,878
417,511 216, 341 28,895
172, 276
272, 602 136,101 23, 778
112, 723
339,195 175, 260 27, 847
136,089
M. A. N. Y. N . J . Pa.
3,167,239 660,821 456, 908 780, 949 522,629 745,932
2,735,664 624,873 423, 701 640,151 454, 450 592,489
567,871 97,893 79, 740
147,104 96, 253
146, 883
626,208 103,176 86, 778
160, 413 105, 563 170, 279
708,810 120, 212 106, 512 186, 682 121, 574 173,831
1,001, 458 193, 378 156, 262 281, 402 143,662 226, 754
1,098,315 205,190 164,920 275, 630 156, 757 295,818
685, 635 137,944 113,518 182, 491 97,884
153, 798
899,162 157, 563 134,403 209,852 138,054 259, 290
E. N. C. Ohio. Ind. 111. Mich. Wis.
3, 515,160 671,133
1,037, 526 490, 297 231,149 251,865 446, 539 386, 650
2, 473, 656 545,657 794, 902 344, 384 140, 375 133, 752 256, 754 257,832
816, 333 137, 966 227, 282 75, 955 76, 631 75,411
111, 799 111, 288
1,091, 603 181,767 270,516 94, 522
118, 744 107, 344 150,925 167, 785
872,300 193, 444 242,047 87,055 76,876 59, 969 97, 645
115, 263
1, 531,954 229,977 420, 349 207, 398 94, 303
146. 222 238,605 195,100
1, 807, 744 288, 298 474,072 244, 359 112, 695 177,878 274, 285 236,157
872,211 146, 448 237, 083 129, 055 54, 518 63,137
125, 772 116,198
1, 237, 928 229,034 336, 362 189,033 79, 612
104, 299 160,769 138, 819
W. N. C. Minn. Iowa. Mo. N. D. S. D. Nebr. Kans.
1,273, 943 31, 711
157, 716 1,003
321, 942 119, 213 270, 364 119,055 182, 447 70,491
1,134, 055 28,060
129, 282 594
280, 480 105, 767 247,819 113, 322 160, 521 68, 211
195, 639 5,906
22,885 108
40, 021 15, 687 46, 437 23,105 26, 986 14, 504
202, 947 7, 285
25, 682 93
44, 319 15, 267 42, 212 21, 425 31, 217 15,446
205, 786 5, 748
21, 490 82
37,860 14, 896 45, 468 24,197 35, 663 20, 382
364, 594 7, 217
32,846 100
72, 631 39, 319 77, 554 42, 357 72,133 20,439
400,242 8,848
41, 604 106
87, 359 51, 507 76,914 38,192 72, 917 22,795
321,225 5,112
25, 444 66
57,186 29,584 74, 441 39, 252 70, 316 19,824
390,100 5,880
31,529 77
73, 391 36,747 90, 214 43,187 81,979 27,098
S. A. Del. Md. D. C. Va. W. Va. N. C. S. C. Ga. Fla.
810,093 276, 467 227, 571 148, 332 157, 723
717,142 256, 382 213, 945 117, 323 129,492
123, 550 30,629 40, 746 23,851 28, 323
157, 459 36, 547 45, 758 33, 545 41, 609
160, 569 41,519 49,153 29, 596 40, 301
294,147 85, 513 83, 473 62,031 63,129
368, 950 113, 567 100,840 73, 686 80,857
277,197 80,037 74, 773 62,070 60, 317
359, 068 103, 742 97,986 74,049 83,291
E. S. C. Ky. Tenn. Ala. Miss.
990, 552 139,908 104,634 211, 472 534, 537
767,493 116, 314 91, 394
141, 516 418, 270
252, 866 31, 255 21, 333 58, 379
141,899
336, 335 33,116 28,174 92,858
182,187
332, 414 37, 417 35. 805 78,449
180, 744
484,460 56,865 39,900
102, 998 284,698
693, 020 67,046 53,699
136, 988 435, 288
426,015 50, 240 43,931 85, 370
246,473
584,936 70,186 60, 752
108, 576 345,422
w. s. c. Ark. La. Okla. Tex
420,285 84, 669 76,994 32, 388
118, 392 27,138 23, 377 46,882 10,446
349,827 66,611 72, 291 29, 335 84, 847 28. 253 23,091 36,057 9, 340
129,257 30, 633 26, 526 9,172
33, 473 8,712 6, 928
10,097 3, 715
210, 944 62,070 39, 749 17, 618 50, 241 12,997 10,414 13, 637 4, 219
180, 506 43,194 42,145 15, 310 39,022 15, 213 9, 961
11, 941 3, 721
455, 977 88,869 52,033 58, 548 86, 357 52, 671 43,107 48,019 26, 374
565, 635 114, 546 64,981 79,801
111, 618 69,118 46, 327 51,724 27, 520
283,787 60, 025 38, 912 38,127 55, 211 31, 672 21,173 24,969 13, 698
397, 721 82, 489 51, 598 61, 632 72,132 45, 401 30, 470 32, 726
• 21, 272
Mt. Mont. Idaho. Wyo. Colo. N. M. Ariz. Utah. Nev.
737,487 165, 289 128,881 443, 316
649, 474 154, 520 115, 246 379, 708
190, 365 41, 235 35, 643
113, 488
228,839 50, 512 42, 586
135, 741
233, 046 56,101 44,608
132, 337
276, 822 55, 313 62,699
158,810
321, 360 59, 710 74,991
186, 659
199,733 42,837 47,805 10,091
251, 438 49,079 56, 623
145, 736
Pac. Wash. Oreg. Calif.
^^Source: Department of Commerce, Bureau of the Census; Sixteenth Census Reports, Agriculture, VoL
582 FARMS^—GENERAL STATISTICS
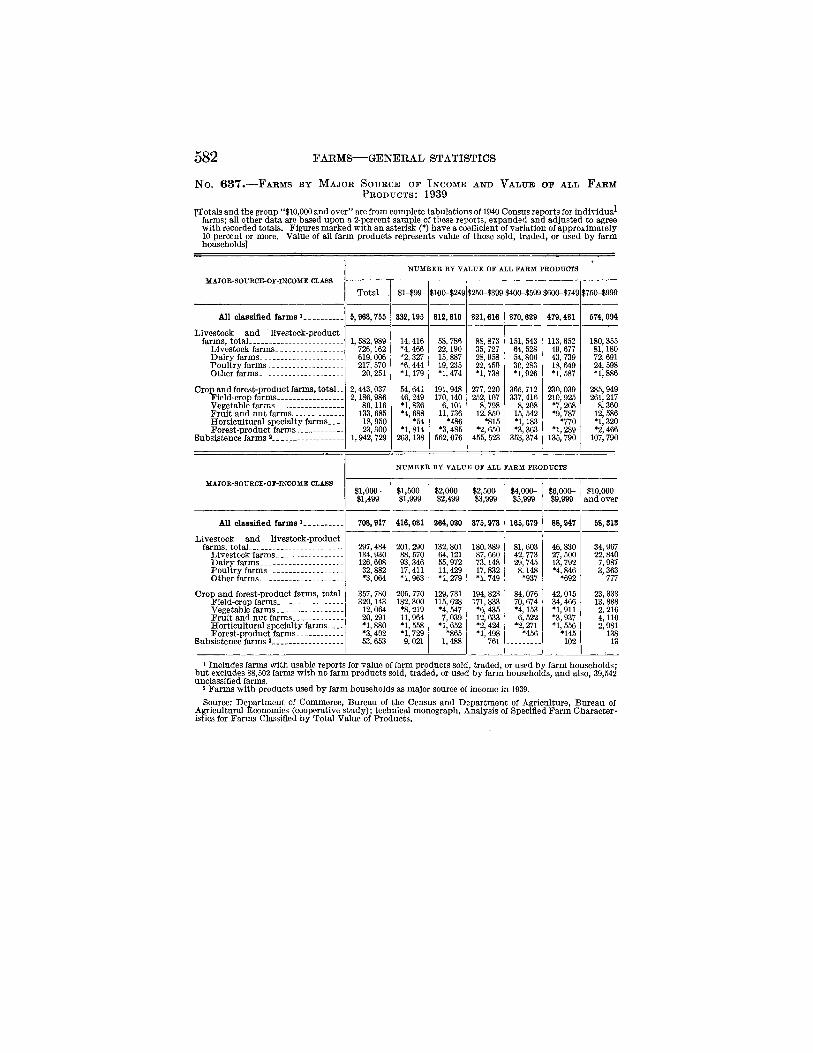
N o . 6 3 7 . — F A R M S B Y M A J O R S O U R C E O F I N C O M E AND V A L U E O P A L L F A R M P R O D U C T S : 1 9 3 9
[Totals and the group "$10,000 and over" are from complete tabulations of 1940 Census reports for individual farms; all other data are based upon a 2-percent sample of these reports, expanded and adjusted to agree with recorded totals. Figures marked with an asterisk (*) have a coefficient of variation of approximately 10 percent or more. Value of all farm products represents value of those sold, traded, or used by farm households]
MAJOR-SOURCE-OF-INCOME CLASS
NUMBER BY VALUE OF ALL FARM PRODUCTS
MAJOR-SOURCE-OF-INCOME CLASS
Total . $l-$99 $100-$249 $250-$399 $400-$599 $600-$749 $750-$999
All classified farms i
Livestock and livestock-product farms, total
Livestock farms Dairy farms. Poultry farms -Other farms
Crop and forest-product farms, total-_ Field-crop farms Vegetable farms ___ _ Fruit and nut farms Horticultural specialty farms Forest-product farms
Subsistence farms 2
5,968,755 332,195 812,810 821,616 870,629 479,481 574,094 All classified farms i
Livestock and livestock-product farms, total
Livestock farms Dairy farms. Poultry farms -Other farms
Crop and forest-product farms, total-_ Field-crop farms Vegetable farms ___ _ Fruit and nut farms Horticultural specialty farms Forest-product farms
Subsistence farms 2
1, 582,989 726,162 619, 006 217, 570 20, 251
2, 443, 037 2,186,986
80,116 133, 685 18,950 23,300
1,942, 729
14, 416 *4,466 *2, 327 *6.444 *1,179
54, 641 46, 249 *l, 836 *4, 688
*54 *1, 814
263,138
58, 786 22,190 15, 887 19, 235 n , 474
191,948 170,140
6,101 11, 736
*486 *3,485
562,076
88, 873 35, 727 28,958 22, 450 n , 738
277,220 252,107
8,798 12, 850
*815 *2,650
455, 523
151, 543 64, 528 54,806 30, 283 n , 926
365,712 337, 416
8,208 15, 542 n , 183 *3,363
353, 374
113, 652 49,677 43, 739 18, 649 n , 587
230,039 210,925 *7, 268 *9, 787
*770 n , 289
135, 790
180, 355 81,180 72, 691 24, 598 *1,886
285,949 261, 217
8,360 12, 586 n , 320 *2,466
107,790
MAJOR-SOURCE-OF-INCOME CLASS
NUMBER BY VALUE OF ALL FARM PRODUCTS
MAJOR-SOURCE-OF-INCOME CLASS $1,000-$1,499
$1,500-$1,999
$2,000-$2,499
$2,500-$3,999
$4,000-$5,999
$6,000-$9,999
$10,000 and over
All classified farms i
Livestock and livestock-product farms, total
Livestock farms Dairy farms Poultry farms Other farms- -
Crop and forest-product farms, total. Field-crop farms Vegetable farms Fruit and nut farms Horticultural specialty farms Forest-product farms
Subsistence farms 2
708,917 416,081 264,020 375,973 165,679 88,947 58,313 All classified farms i
Livestock and livestock-product farms, total
Livestock farms Dairy farms Poultry farms Other farms- -
Crop and forest-product farms, total. Field-crop farms Vegetable farms Fruit and nut farms Horticultural specialty farms Forest-product farms
Subsistence farms 2
297,484 134, 930 126, 608 32, 882 »3,064
357, 780 320,143 12,064 20,291
880 •3, 402 53, 653
201, 290 88, 570 93, 346 17,411 n , 963
205, 770 182, 300 *8, 219 11,964 *1, 558 *1, 729 9,021
132, 801 64,121 55,972 11,429 n , 279
129, 731 115, 628 *4, 547 7,039
*1, 652 *865
1,488
180, 389 87, 660 73,148 17,832
749
194, 823 171, 833 *6, 435 12,633 *2, 424 *1, 498
761
81, 603 42, 773 29, 745 8,148 *937
84,076 70,674 *4,153 6, 522
*2,271 *456
46, 830 27, 500 13, 792 *4,846
*692
42, 015 34,466 *1, 911 *3,937 n , 556
*U5 102
34,967 22,840 7,987 3, 363
777
23, 333 13, 888 2,216 4,110 2,981
138 13
297,484 134, 930 126, 608 32, 882 »3,064
357, 780 320,143 12,064 20,291
880 •3, 402 53, 653
201, 290 88, 570 93, 346 17,411 n , 963
205, 770 182, 300 *8, 219 11,964 *1, 558 *1, 729 9,021
132, 801 64,121 55,972 11,429 n , 279
129, 731 115, 628 *4, 547 7,039
*1, 652 *865
1,488
180, 389 87, 660 73,148 17,832
749
194, 823 171, 833 *6, 435 12,633 *2, 424 *1, 498
761
46, 830 27, 500 13, 792 *4,846
*692
42, 015 34,466 *1, 911 *3,937 n , 556
*U5 102
34,967 22,840 7,987 3, 363
777
23, 333 13, 888 2,216 4,110 2,981
138 13
1 Includes farms with usable reports for value of farm products sold, traded, or used by farm households; but excludes 88,502 farms with no farm products sold, traded, or used by farm households, and also, 39,542 unclassified farms.
3 Farms with products used by farm households as major source of income in 1939. Source: Department of Commerce, Bureau of the Census and Department of Agriculture, Bureau of
Agricultural Economics (cooperative study); technical monograph, Analysis of Specified Farm Character-istics for Farms Classified by Total Value of Products.

FARM TENURE 583 N o . 6 3 8 . — F A R M S — N U M B E R A N D A C R E A G E , B Y C O L O R A N D T E N U R E O P
O P E R A T O R : 1 9 1 0 T O 1 9 4 0
NOTE,—"White" includes Mexicans. "Nonwhite" includes Negroes, Indians, Chinese, Japanese, and all other nonwhite races. Leaders indicate that data are not available.
COLOR AND TENURE OF OPERATOR 1910 1930 1935 1930 1935 1940
Number of farms
All farm operators.
Owners Full owners Part owners
Managers Tenants
Cashi Other 1
White operators Owners
Full owners Part owners
Managers Tenants
Cash Other
Nonwhite operators.. Owners
Full owners Part owners
Managers Tenants
Cash Other
PERCENT DISTRIBUTION
All farm operators Owners
Full owners Part owners
Managers Tenants White operators
Owners Full owners Part owners..
Managers Tenants—
Nonwhite operators-... Owners
Full owners Part owners
Managers Tenants
All farm operators
Owners Full owners Part owners
Managers Tenants White operators Nonwhite operators
PERCENT DISTRIBUTION
All farm operators Owners
Full owners Part owners
Managers Tenants
6,361, 502 6,448,343 6,371,640
3,948, 722 3,354,897
593, 825 58,104
2,354, 676 712,294
1,642, 382 5,440,619 3, 707, 501 3,159, 088
548, 413 56, 560
1,676, 558 447, 851
1,228, 707 920,883 241, 221 195,809 45, 412 1,544
678,118 264, 443 413,675
100.0 62 .1 52.7 9.3 .9
37.0 100.0
68 .1 58.1 10.1 LO
30.8 100.0
26 .2 2L3 4.9
. 2 73.6
3, 925, 090 3,366, 510
558, 580 68, 449
2, 454,804 480, 009
1,974,795 5, 498,454 3, 691,868 3,174,109
517, 759 66,223
1,740,363 373,835
1, 366, 528 949, 889 233, 222 192, 401 40,821
2, 226 714, 441 106,174 608, 267
100.0 60.9 52.2 8.7 L I
38.1 100.0 67.1 57.7 9.4 1.2
3L7 100.0 24.6 20 3 4.3
. 2 75.2
3,313,490 554, 842 40, 700
2,462, 608 393,452
2, 069,156
100.0 60.7 52.0 8.7 .6
38.6
3, 568, 394 2,911, 644
656,750 55, 889
2, 664,365 489,210
2,175,155 5,372, 578 3, 365, 674 2, 752,787
612, 887 52, 767
1,954,137 387,834
1,566, 303 916, 070 202, 720 158,857 43,863 3,122
710, 228 101, 376 608,852
100.0 56.7 46.3 10.4
.9 42.4 100.0 62.6 51.2 11.4 1.0
36.4 100.0 22 .1 17.3 4.8 .3
77.5
6,812, 350
3,899,091 3,210, 224
688, 867 48,104
2,865,155
5,956, 795 3,687,697 3, 036, 910
650,787 46, 914
2,222,184
855, 555 211, 394 173, 314
1,190 642, 971
100.0 57.2 47.1 10.1
.7 42.1 100.0 6L9 5L0 10.9
. 8 37.3
100.0 24.7 20.3 4.5 . 1
75.2
All land in farms (thousands of acres)
878,798
598, 555 464,923 133,631 53, 731
226, 513 832,166 46, 632
100,0 68 .1 52.9 15.2 6.1
25.8
955,884 924,319
636, 775 461, 250 175, 525 54,129
• 264, 980 910, 939 44,945
100.0 66 .6 48.3 18.4 5.7
27.7
616,336 419, 446 196,890 43, 097
264,887
100.0 66.7 45.4 2L3 4.7
28.7
1 , 7 7 1 1,054,515
618, 376 372,450 245, 926 61,986
306, 409 945, 683 41,088
100.0 62.7 37.7 24.9 6.3
31.1
657, 049 390, 978 266, 071 60,664
336,802 1, 015, 710
38,805
100.0 62.3 37.1 25.2 5.8
3L9
6,096, 799
3,699,177 3,084,138
615,039 36, 351
2,361, 271 514, 438
1,846,833 5,377, 728 3,498, 079 2,916, 562
581, 517 35,634
1,844,015 444,205
1,399,810 719,071 201,098 167, 576 33, 522
717 517, 256 70, 233
447, 023
100.0 60.7 50.6 10.1
. 6 38.7
100.0 65.0 54.2 10.8
.7 34.3
100.0 28 .0 23.3 4.7
. 1 7L9
1,060, 852
682, 424 382,098 300, 325 66, 530
311,899 1,015,112
45,740
100.0 64.3 36.0 28.3 6.3
29.4
1 Standing renters (renters paying a fixed quantity of products) included with "Cash tenants" in 1910; with "Cash tenants" for the Northern and Western States, and with "Other tenants" for the Southern States in 1920; and with "Other tenants" for all States in 1925, 1930, and 1940.
Source: Department of Commerce, Bureau of the Census; Sixteenth Census Reports, Agriculture, Vol. I l l ,

592 FARMS^—GENERAL STATISTICS
N o . 6 3 9 . — F A R M S — N U M B E R , A C R E A G E , AND V A L U E OF S P E C I F I E D C L A S S E S O F F A R M P R O P E R T Y , BY C O L O R , T E N U R E , AND R A C E OF O P E R A T O R : 1 9 4 0
COLOR, TENURE, AND RACE OF OPERATOR
Number of farms
All land in farms
Cropland harvested
Land available for crops
Value of land and buildings
Value of imple-ments
and ma-chinery
COLOR, TENURE, AND RACE OF OPERATOR
Number of farms
Thousands of acres Thousands of dollars
White operators, total 6,377,728 1,015,112 305,637 609,204 32, 657,036 3,007,022
Owners 3,498,079 657,943 182,365 316,199 21,085,091 2, 031, 738 Full owners 2,916, 562 360,731 112,382
69,983 189, 520 15,041,143 1,410,138
Part owners-- 581,517 297, 212 112,382 69,983 126, 680 6, 043, 949 621, 600
Managers-- 35, 634 66, 263 6,328 11, 821 1, 427, 863 80, 913 All tenants 1,844, 015 290,907 116, 944 181,183 10,144, 082 894, 371
Cash 444, 205 71,364 17,186 29, 219 2,113,182 186,284 Share-cash - 271, 597 66,940 34,147 49, 785 2, 695,883 240, 633 Share i - 722, 726 117,816 52,925 82, 750 4, 224, 428 393, 494 Croppers (South only) 242,173 14,271 6,714 9, 094 462,067 25,855 Other — 163, 314 20, 616 6,972 10,336 648,532 48,106
Nonwhite operators, total 719,071 45, 740 15, 606 20,927 984,702 63,166
Owners. — 201, 098 24, 481 4,030 6, 551 324, 594 22,263 Full owners 167, 576 21, 368 3,036 5,004 256,132 17,107 Part owners 33, 522 3,113 994 1, 647 68, 462 5,156
Managers- 717 268 77 123 14, 794 1, 018 All tenants 617, 256 20,992 11,498 14, 252 645, 315 29,884
Cash 70, 233 3, 525 1, 624 2,171 114, 426 7,731 Share-cash 7,008 361 216 266 16,468 1,014 Share 1 - 93,073 5,140 2,433 3,271 145, 396 7,323 Croppers (South only) 299,118 9,043 6,045 6,863 313,878 11, 306 O t h e r - - - - 47,824 2,924 1,180 1, 680 56,145 2, 610
Negro operators 681, 790 30, 786 14,803 19,467 836, 068 40,194 Indian operators - 29,742 14, 671 625 1,138 60, 351 4, 570 Chinese operators - 327 27 20 24 5, 955 382 Japanese operators 6,978 349 253 294 81, 256 7,909 Other nonwhite operators a 234 8 1,073 110
1 Includes croppers for Northern and Western States. 3 Comprises 210 Filipinos, 19 Koreans, 3 Hawaiians, 1 Oriental Indian, and 1 Siamese. Source: Department of Commerce, Bureau of the Census; Sixteenth Census Reports, Agriculture,
Vol. III.

FARM TENURE 585 N o . 6 4 0 . — F A R M S — N U M B E R , B Y T E N U R E O F O P E R A T O R , B Y S T A T E S : 1 9 3 5
A N D 1940 N O T E . — F o r t o t a l n u m b e r of f a r m s (all t e n u r e s c o m b i n e d ) see t a b l e 634.
DIVISION AND STATE
U n i t e d S t a t e s . . . .
N e w E n g l a n d M a i n e N e w H a m p s h i r e . . V e r m o n t M a s s a c h u s e t t s R h o d e I s l a n d C o n n e c t i c u t
M i d d l e A t l a n t i c N e w Y o r k N e w J e r s e y P e n n s y l v a n i a
E a s t N o r t h C e n t r a l -O h i o I n d i a n a I l l i n o i s M i c h i g a n W i s c o n s i n .
W e s t N o r t h C e n t r a l . . M i n n e s o t a I o w a M i s s o u r i N o r t h D a k o t a S o u t h D a k o t a N e b r a s k a K a n s a s
S o u t h A t l a n t i c D e l a w a r e M a r y l a n d . D i s t . of C o l u m b i a . V i r g i n i a W e s t V i r g i n i a N o r t h C a r o l i n a S o u t h C a r o l i n a G e o r g i a F l o r i d a
E a s t S o u t h C e n t r a l -K e n t u c k y T e n n e s s e e A l a b a m a M i s s i s s i p p i
W e s t S o u t h C e n t r a l - _ A r k a n s a s L o u i s i a n a O k l a h o m a T e x a s
M o u n t a i n M o n t a n a I d a h o . . . . W y o m i n g C o l o r a d o N e w M e x i c o A r i z o n a U t a h N e v a d a
P a c i f i c W a s h i n g t o n O r e g o n C a l i f o r n i a
A l l o w n e r s
1935 1940
3 ,899 ,091
143, 666 38,712 16,200 23, 677 32,116
3, 635 29,326
328,118 149, 349 23, 582
155,187
757,994 180,005 135, 982 126, 560 158,131 157, 316
670,926 134,012 110,252 169,152
51,149 42, 452 67 ,013
6, 615 31,475
51 138,139
77,133 158, 111 61,942 85,197 49 ,419
511,273 174, 661 146, 696
96, 692 93,224
455,311 100, 662
61, 320 81,889
211,440
196,339 36, 247 31,858 13,034 38,323 33,118 14,922 25,889
2, " '
227, 382
50,046 110,847
3 ,699,177
123, 520 36,250 15, 342 20,952 29,072
2, 634 19, 270
293, 639 132,100
21, 370 140,169
719, 905 171,156 131, 263 119, 830 154,928 142, 728
623,512 132,903 110, 616 163, 763 40, 391 33, 803 56, 561 85,475
583, 661 5, 956
30,458 30
126,674 76,325
154,235 59,867 85.181 44,935
508,420 168, 604 147,443
95,107 97, 266
452,216 100, • •
60,312 81,086 10.182
173, 772 29, 32, 225 11,125 31,827
15, 835 21, 906
2 ,940
220, 532 66, 561 50,137
103,834
F u l l o w n e r s
1935 1940
3 ,210,224
132, 887 35,823 14,435 21, 501 30,158
3 ,239 27, 731
301, 745 133, 746
22,007 145, 992
616, 503 153, 310 106,047
86, 862 132, 786 137, 498
470, 826 101, 307
86,951 132,129
25, 795 21,425 42, 861 60, 358
527,412 6,164
29,398 50
121,490 68, 981
128,394 51, 327 75,857 45,751
440, 243 148, 985 125,040 81, 624 84, 594
372, 291 85,895 54,891 58,796
172,709
147, 657 21, 509 26,016
8 ,202 27, 718 27,377 13,102 21,087
2,646
200, 660 58, 564 42, 653 99,443
3 ,084,138
116,459 34,887 14, 648 19,342 27,446
2 ,358 17,778
269, 199 117, 972
19,448 131,779
605,092 150,124 107,818
87,004 133,545 126, 601
447, 208 103,866
88, 206 133,927
18. 651 15; 053 35,064 52,441
519,108 5,401
28, 737 29
113, 510 71, 542
132,451 50, " 76,103 40, 692
447, 286 149, 128, 591
80, 303
361, 296 • 85,842
52, 936 55,859
166, 659
128, 268 17,028 26,050
6,814 22,385 22,164 13,889 17, 310
2, 628
190, 222 58,083 42,296 89,843
P a r t o w n e r s
1935 1940
688, 867
10, 779 2,889 1,765 2,176 1,958
396 1,595
26, 373 15,603
1, 575 9 ,195
141,491 26, 69F 29, 935 39,698 25, 345 19, 818
200,100 32, 705 23,301 37,023 25, 354 21,027 24,152 36,538
80,670 451
2,077 1
16, 649 8,152
29, 717 10,615
9,340 3, 668
71, 030 25, 676 21, 656 15, 068
8, 630
83, 020 14,767
6,429 23,093 38, 731
14,738 5,842 4 ,832
10, 605 5, 741 1,820 4,802
302
26, 722 7, 925 7 ,393
11,404
615,039
7 ,061 1,363
694 ' 1,610
1, r - -276
1,492
24,440 14,128
1,922 8, 390
114,813 21,032 23, 445 32, 826 21, 383 16,127
176,304 29, 037 22,410 29,836 21, 740 18,750 21.497 33,034
64, 553 555
1, 721 1
13,164 4, 783
21, 784 9, 224 9, 078 4 ,243
61,134 18,909 18, 852 14, 804
8, 569
90, 920 14, 794
7, 376 25, 227 43, 523
45, 504 12,856
6 ,175 4 ,311 9 ,442 5,: 1,946 4, R "
312
30, 310 8 ,478 7,841
13,991
MANAGERS
1935 1940
48,104
2 ,365 312 211 441 814
95 492
5, 295 2, 574
551 2 ,170
1, 371 1,344
1,052 1,276
6.166 878
1 ,583 1,279
335 374 795 922
8,109 156 847
17 1,107
593 698 636
1,016 3,039
2 ,313 422 480 516 895
5, 592 519 775
3,474
2,S 332 394 370 481 394 558 224 215
8, 589 1,057
715 6 ,817
36, 351 2, 865,155
1.661 211 158 286 560
71 375
3, 786 1,594
430 1,762
5, 848 1 ,205 1,076 1,627
861 1,079
4, 662 631
1, 218 1,182
194 253 554
5, 991 109 658
23 1,104
378 565 507
1,002 1,645
2, 327 466 439 415
1,007
6,262 596 528 780
3, 358
2 ,311 297 285 255 471 264 493 129 117
4, 503 663 415
3 ,425
1935 1940
2, 361,271
12,210 2,883 1,284 2 ,943 2 ,164
597 2 ,339
64,271 25,102
5,242 33,927
318, 754 73, 770 63, 509
102, 856 37,334 41,285
602, 764 68, 412
110,151 108,023
33,122 40,477 65,808 76, 771
530, 942 3, 610
12,090 21
58, 386 27,021
142,158 102, 926 164, 331
20,399
623,633 103, 215 126, 607 176,247 217, 564
676, 900 151, 759 108,377 130, 661 286,103
72, 085 13,985 12,861 4 ,083
24,840 7,857 3,344 4, —
63, 596 16, 835 14,065 32,696
10,009 2,519 1,054 2,344 2, 265
309 1,518
50,675 19, 544 4 ,035
27,096
280,342 61, 422 52,210 91,982 31,800 42,928
462,400 63,817
101,484 91,155 33,377 38,398 63,947 70,222
429, 799 2 ,929
10,994 12
47,107 22, 579
123,476 77,184
129,850 15, 668
512, 602 83, 824 99, 735
136, 224 192,819
506, 892 115,442
89,167 97, 821
204,462
57, 414 11, 642 11,153
3 ,638 19,138
5 ,811 2 ,140 3,376
516
51,138 14,462 11,277 25, 399
Source : D e p a r t m e n t of C o m m e r c e , B u r e a u o f t h e Census ; S i x t e e n t h C e n s u s R e p o r t s , Agricult,ure, V o l , I I I ,
, 5 7 8 0 7 6 ° — 4 4 - - 8 8

586 FARMS—GENERAL STATISTICS
N o . 6 4 1 . — F A R M A C R E A G E , B T T E N U R E OF O P E R A T O R , BY S T A T E S : 1 9 3 5 AND 1 9 4 0
NOTE.—For total farm acreage (all tenures combined) see table 634. [In thousands of acres]
ALL LAND IN FARMS OPERATED BY-
Owners
DIVISION AND STATE All owners
1935
United States.—
New England Maine New Hampshire--Vermont Massachusetts Rhode Island-_ Connecticut
857,049 682,424
Middle Atlantic-. New York New Jersey— Pennsylvania.
East North Central.._ Ohio Indiana Illinois Michigan Wisconsin
West North Central.. Minnesota Iowa Missouri North Dakota South Dakota Nebraska Kansas
13,638 4,392 1,873 3,462 1,907
231 1,773
28,717 15,144 1,307
12, 266
75, 517 14,991 12,783 15, 632 14, 381 17, 729
161,035 20, 220 16,148 21,717 26,105 22,108 26,311 28,426
South Atlantic 55,674 Delaware Maryland Dist. of Columbia. Virginia West Virginia North Carolina South Carolina Georgia Florida
East South Centra l - . Kentucky Tennessee Alabama Mississippi
West South Central.. Arkansas Louisiana Oklahoma Texas
Mountain Montana Idaho. . . , , Wyoming Colorado.. New Mexico.. _ Arizona Utah Nevada
Pacific Washington Oregon California
481 2,687
1 12,699 7, 312
12,041 5,866
10,939 3,648
48, 363 14,912 12,168 10,185 11,098
106, 012 9,808 5,413
17,260 73, 531
125, 987 36,712 7,452
21,089 20, 224 23, 774 9,989 4,877 1,871
42,105 9,857
13, 528 18, 720
1940
390, 978
11, 864 3,914 1,616 3,182 1,656
184 I,311
27,255 14,330 I,419
11,507
74,287 14, 730 12, 782 15,701 14, 314 16, 760
162,029 20,807 16, 740 22, 228 23,099 23, 554 27,379 28,222 56, 815
516 2,641 (0
II, 926 6,981
11,544 6,281
11, 566 5,359
48, 765 14, 543 12,374 10,618 11,230
113, 302 10,848 5, 614
18,898 77,941
141,230 35, 559
8,101 20,065 22,094 28, 929 18,404 6,054 2,024
46, 877 II, 406 14, 863 20, 607
Full owners Part owners
1935
382,098
12,153 3,998 1,580 3,037 1,740
200 1,599
25,255 12,875 1,177
11,203
55,052 11,642 8, 687 8,962
11,025 14, 736 77, 507 12,953 11, 333 15,444
5, 824 11, 210 12,076 48, 200
438 2,490
1 11,199 6,435
10,007 4, 933 9, 602 3,095
42,037 12, 956 10,424 8, 628
10,029 68, 878 8, 219 4, 674 8, 558
47,427 40,120 9, 391 4,156 4,356 8,318 7,787 1,523 3, 357 1,231
21, 777 4, 552 6, 645
10, 580
1940
266, 071
10,716 3,671 1,484 2,807 1,489
156 I,109
23,641 12,008 1,213
10,419
55,004 11,670 8,949 9,136
11,170 14,079 73,045 13,496 11,607 16,083 6, 530 4,012
10, 282 II,035 48, 237
438 2,412 (0
10,411 6, 371 9,804 5,170 9,942 3,688
41, 687 12, 793 10,473 8, 506 9,915
63,442 8, 662 4,498 7,841
42,442 46,260
7, 527 4,128 3,784 6,619 9, 772 9,748 3,266 1,417
20,066 4, 687 6, 370 9,009
1935
300, 325
1,485 394 294 425 167 32
174
2,269 131
1,062
20,465 3, 349 4,096 6,671 3,356 2,993
83, 528 7,267 4,814 6, 272
17,439 16, 284 15,101 16,350
7,474 43
198
1,500 877
2, 034 933
1, 337 553
6,326 1,956 1,744 1,558 1,068
37,134 1,589
739 8,702
26,104 85, 867 27, 322 3,296
16, 733 11,905 15,987 8,466 1,520
639 20, 328
5,305 6,884 8,139
1940
1,148 244 132 375 167 28
203
3, 615 2,322
205 I,087
19, 282 3,060 3,833 6, 565 3.144 2,681
83,984 7,311 5,133 6.145
16, 569 19,-542 17,098 17,187 8, 578
78 229
(1) 1,515
610 1,740 1,111 1,624 I,670 7,078 1,750 1,900 2,112 1,316
49,860 2,186 1,116
II,057 35, 500 94, 970 28,033 3, 974
16, 281 15,475 19,158 8, 656 2,788
607 26,811
6, 719 8,493
II, 599
Managers
60, 664
646 71 93
124 166 29
163
1,276 646 160 470
1,905 362 355 470 369 349
5,323 298 411 500 314
1,109 1,947
744 3, 690
32 230
2 543 231 353 568 793 938
1,378 178 193 345 663
20,153 420 754
1,169 17,809 19, 872 2, 773
457 4,539 1,271 6,054 2,567
759 1,452 6,421
650 855
4,915
1940
66, 530 336, 802
514 76 72 97
164 13 92
992 450 113 429
1,752 332 318 457 318 326
4,310 229
241 642
1,585 761
4, 691 25
207 2
664 157 316 657
1,027 1, 636 1,734
203 232 376 922
21, 849 474 749
1,136 19,490 25, 045 3,032
412 5,417 2,112 5,746 6,093
704 1,529 5,643
733 686
4,224
Tenants
1935
1,179 259 149 456 123 48
144
2,896 447
3,120
39,535 7, 505 7, 380
15, 558 3, 710 5,381
106, 719 12, 300 17,800 12, 838 12,699 13, 885 18,357 18, 841 36, 624
408 1,466 (1)
4,403 1,881 7,543 5, 896
13, 565 1.462
29,359 5,609 6,725 9,130 7, 895
74, 953 7, 514 4, 277
16, 906 46, 257 28, 022 8,027 2,043 2, 535 8.484 4,569 1.463
603 299
13,949 4,172 2,974 6,803
1940
311, 899
233 121 388 118 24
109
5, 392 2,391
342 2, 659
37, 616 6,845 6,700
14,875 3,406 5,790
108, 083 11, 572 17,045 12,022 14, 596 15, 278 18,380 19,190 31,049
355 1,349 (0 3,855 1,770 6,986 4,301
11,090 1,343
26, 588 5,549 5,887 8,149 7,003
65,376 6,722 3, 633
14, 769 40, 252 25,626
7,860 1,784 2,544 7,321 4,186 1,154
544 232
11,175 3,042 2,439 5,694
1 Less than 500 acres. Source; Department of Commerce, Bureau of the Census; Sixteenth Census Reports, Agriculture, Vol, HI,

F A R M T E N U R E 587
N o . 6 4 2 . — C R O P L A N D H A R V E S T E D , B Y T E N U R E O P O P E R A T O R , B Y S T A T E S : 1 9 3 4 A N D 1 9 3 9
NOTE.—In thousands of acres. For totals fall tenures combined) see table 635.
CROPLAND HARVESTED ON FARMS OPERATED BY—
DIVISION AND STATE
Owners Managers Tenants DIVISION AND
STATE All owners Full owners Part owners
1934 1939 1934 1939
DIVISION AND STATE
1934 1939 1934 1939 934 939 1934 1939 1934 1939
United States 165,179 186, 395 109,329 115,418 55, 850 70, 976 6,012 6,405 124,433 128,442
New England 3, 585 3, 044 3,144 2, 704 441 340 145 104 315 261 Maine. 1,287 1, 066 1,155 988 132 77 23 16 76 65 New Hampshire. _ 403 337 335 307 67 31 13 10 30 24 Vermont . . . . _ 941 880 825 779 115 101 35 25 138 117 Massachusetts 479 402 423 347 57 56 39 28 29 26 Rhode Island 51 40 40 31 11 10 5 .3 10 6 Connecticut . 424 319 365 253 58 65 30 21 31 23
Middle Atlantic 11,617 10, 735 10,034 9,084 1,583 1,652 471 387 2, 797 2, 335 New York 5, 978 5, 481 4,951 4, 459 1,027 1,022 207 146 1,203 955 New Jersey 608 578 528 457 80 121 51 45 207 156 Pennsylvania 5,031 4, 677 4, 555 4,167 476 510 214 196 1, 388 1, 224
East Worth Central.. 34,424 34,078 23, 550 23, 686 10, 875 10, 392 849 808 20, 904 20, 546 Ohio 6, 482 6, 253 4, 684 4,600 1, 798 L653 160 149 3, 742 3, 370 Indiana 5, 992 5, 928 3, 690 3, 788 2, 302 2,140 162 159 3, 949 3, 624 Illinois 8,114 8, 605 4, 266 4, 658 3, 848 3, 947 254 254 9,199 9,411 Michigan 6,501 6,190 4, 807 4, 670 1,694 1,520 134 117 1, 717 1, 556 Wisconsin ___ __ 7, 335 7,102 6,103 5, 969 1,232 1,133 139 128 2, 298 2, 586
West North Central-. 49, 735 62,225 26, 833 30, 720 22, 902 31, 505 1,027 995 40,157 51,019 Minnesota. . 10, 262 11, 503 6, 424 7, 237 3, 838 4, 265 158 114 6,742 7,191 Iowa 8, 386 9, 462 5, 771 6, 447 2, 614 3,015 199 187 10, 341 10, 427 Missouri 6, 755 7, 353 4, 355 4, 845 2, 400 2, 509 138 157 4, 869 4, 889 North Dakota 5, 965 9, 285 2, 359 2,978 3, 606 6, 307 91 85 3,292 6,166 South Dakota 2, 574 6, 038 1,042 1,613 1,532 4, 424 36 88 2, 254 6,172 Nebraska 6, 463 8, 689 3, 031 3, 752 3, 432 4, 937 239 231 5, 493 8, 385 Kansas . 9, 331 9, 896 3, 851 3,849 5, 480 6,047 165 132 7,167 7, 788
South Atlantic 14,202 15, 528 11,807 12, 892 2, 395 2, 635 860 937 12,926 11,859 Delaware _ 204 211 180 175 24 37 17 13 169 154 Maryland 1,021 996 931 892 91 104 87 82 569 531 Dist. of Columbia. (0 0) (0 0) (0 G) 1 1 (0 G) Virginia 2, 692 2,740 2, 259 2, 290 433 450 125 152 1, 025 949 West Virginia 1, 338 1, 257 1,157 1, 133 181 124 49 40 323 268 North Carolina. _. 3,106 3, 325 2, 400 2, 685 707 640 86 77 2, 773 2, 723 South Carolina 1, 750 2,180 1, 395 1, 725 355 455 88 101 2, 340 2,041 Georgia 3,144 3,742 2, 674 3,126 470 616 220 282 5, 282 4, 779 Florida 946 1, 077 812 867 135 210 188 189 445 414
East South Cen t r a l - 12,146 13,463 10, 029 11, 144 2, 117 2,318 367 582 13, 209 11,450 Kentucky _ _ _ 3, 538 3, 652 2,-873 3,085 666 567 43 55 1, 836 1,565 Tennessee. . 3, 438 3, 734 2, 774 3,030 664 704 55 64 2, 837 2, 361 Alabama 2, 816 3,187 2, 295 2, 513 520 674 81 97 4,342 3, 827 Mississippi . 2,354 2,889 2, 087 2,515 267 374 188 366 4,194 3, 697
West South Central-. 21,164 25,217 14,127 14, 814 7, 037 10, 403 878 1,166 26,145 23, 089 Arkansas 2, 815 3, 314 2, 218 2, 508 597 806 155 201 3, 468 3,095 Louisiana 1, 576 1, 803 1,289 1, 396 287 407 155 213 2,246 2, 036 Oklahoma . 5, 570 6, 666 2, 951 2, 954 2,619 3, 713 111 139 6, 661 5, 961 Texas 11, 204 13, 433 7, 669 7, 956 3, 535 5, 478 456 613 13, 769 11, 997
Mountain 10, 040 12, 951 4, 989 5,861 5, 051 7, 090 493 666 4,120 4, 872 Montana 3,415 4, 267 1, 216 1, 347 2,198 2, 920 107 144 1,070 1, 338 Idaho 1,850 2, 138 1,124 1, 246 726 891 64 54 754 744 Wyoming 877 1, 091 376 475 502 616 84 119 259 324 Colorado 2, 228 2, 835 1,136 1, 217 1, 092 1, 618 79 131 1, 546 1,803 New Mexico 503 1,126 320 586 183 539 18 35 223 411 Arizona 303 364 194 186 109 178 57 68 128 94 Utah 677 825 475 554 202 271 32 18 106 123 Nevada 187 305 148 248 39 57 51 97 34 34
Pacific 8, 266 9,155 4,816 4, 514 3,450 4,640 921 761 3, 859 3,013 Washington „ 2,353 2, 585 1,150 1,128 1,202 1, 457 85 86 1,198 899 Oregon 2,032 2,165 1,199 1,159 833 1,005 91 108 709 551 California 3,882 4,405 2, 467 2, 226 1, 415 2,178 745 567 1, 952 1, 563
J Less than 500 acres. Source: Department of Commerce, Bureau of the Census; Sixteenth Census Reports, Agriculture, Vol.
III.
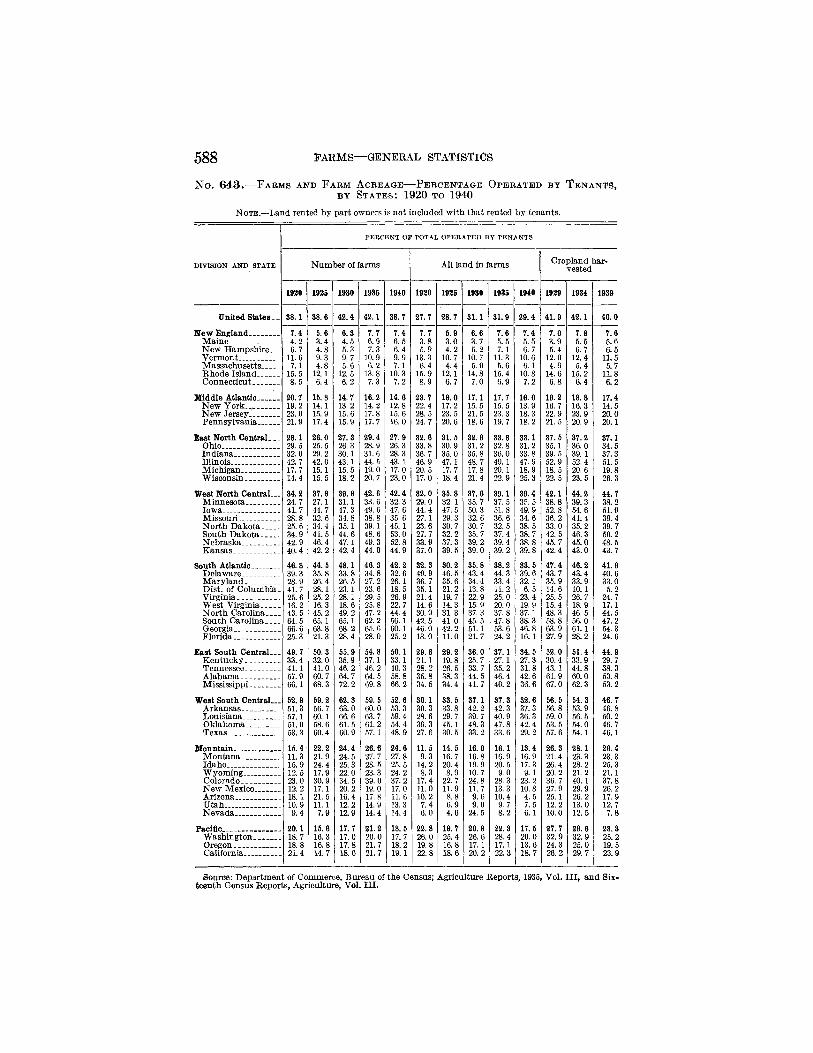
588 FARMS—GENERAL STATISTICS
N o . 6 4 3 . — F A R M S A N D F A R M A C R E A G E — P E R C E N T A G E O P E R A T E D B Y T E N A N T S , B Y S T A T E S : 1 9 2 0 T O 1 9 4 0
NOTE.—Land rented by part owners is not included with that rented by tenants.
DIVISION AND STATE
PERCENT OF TOTAL OPERATED BY TENANTS
Number of farms
1920 1925 1930 1935 1940 1920 1925 1930 1935 1940 1929 1934 1939
United States __ 88.1 88.6 42.4 42.1 38.7 27.7 28.7 31.1 31.9 29.4 4L 9 42.1 40.0
l iew England 7.4 5.6 6.8 7.7 7.4 7.7 6.9 6.6 7.6 7.4 7.0 7.8 7.6 Maine 4.2 3.4 4.5 6.9 6.5 3.8 3.0 3.7 5.5 5.5 3.9 5.5 5.6 New Hampshire.-- 6.7 4.8 5.3 7.3 6.4 5.9 4.2 5.2 7.1 6.7 5.4 6.7 6.5 Vermont n . 6 9.3 9.7 10.9 9.9 13. 3 10 7 10 7 11.3 10.6 12.0 12.4 1L5 Massachusetts 7.1 4.8 5.6 6.2 7.1 6.4 4.4 5.0 5.6 6.1 4.9 5.4 5.7 Rhode Island 15.5 12.1 12.5 13.8 10.3 15.9 12.1 14.8 15.4 10.8 14.6 15.2 n . 8 Connecticut 8.5 6.4 6.2 7.3 7.2 8.9 6.7 7.0 6.9 7.2 6.8 6.4 6.2
Middle Atlantic 20.7 15.8 14.7 16.2 14.6 23.7 19.0 17.1 17.7 16.0 19.2 18.8 17.4 New York..^ 19.2 14.1 13.2 14.2 12.8 22.4 17.2 15.5 15.5 13.9 16.7 16.3 14.5 New Jersey. 23.0 15.9 15.6 17.8 15.6 28.5 23.5 21.5 23.3 18.3 22.9 23.9 20.0 Pennsylvania 21.9 17.4 15.9 17.7 16.0 24.7 20.6 18.6 19.7 18.2 2L5 20 9 20.1
East North Central- 28.1 26.0 27.3 29.4 27.9 32.6 8L5 32.9 33.8 33.1 37.5 37.2 87.1 Ohio 29.5 25.5 26.3 28.9 26.3 33.8 30 9 31. 2 32.8 31. 2 35.1 36.0 34.5 Indiana 32.0 29.2 30. 1 31.6 28.3 36.7 35.0 35.8 36.0 33.8 39.5 39. 1 37.3 Illinois 42.7 42.0 43.1 44.5 43.1 46.9 47.1 48.7 49. 1 47.9 52.9 52.4 5L5 Michigan 17.7 15.1 15.5 19.0 17.0 20 5 17.7 17.8 20.1 18.9 18.5 20.6 19.8 Wisconsin 14.4 15.5 18.2 20.7 23.0 17.0 18.4 21.4 22.9 25.3 22.5 23.5 26.3
West North Central... 84.2 87.8 39.9 42.6 42.4 32.0 36.8 37.6 39.1 39.4 42.1 44.2 44.7 Minnesota 24.7 27.1 31.1 33.6 32.3 29.0 32.1 35.7 37.5 35.5 38.8 39.3 38.2 Iowa 41.7 44. 7 47.3 49.6 47.6 44.4 47.5 50 3 51.8 49.9 52.8 54.6 5L9 Missouri... 28.8 32.6 34.8 38.8 35.6 27.1 29.3 32.6 36.6 34.6 36.2 4L 4 39.4 North Dakota 25.6 34.4 35.1 39. 1 45. 1 23.6 30 7 30 7 32.5 38.5 33.0 35.2 39.7 South Dakota 34.9 41.5 44.6 48.6 53.0 27.7 32.2 35.7 37.4 38.7 42.5 46.3 50.2 Nebraska 42.9 46.4 47.1 49.3 52.8 33.9 37.3 39.2 39.4 38.8 45.7 45.0 48.5 Kansas 40.4 42.2 42.4 44.0 44.9 37.0 39.5 39.0 39.2 39.8 42.4 43.0 43.7
South Atlantic 46.8 44.5 48. 1 46.3 42.2 32.3 30.2 35.8 38.2 33.5 47.4 46.2 4L 9 Delaware 39.3 35.8 33.8 34.8 32.6 49.9 46.5 43.4 44.3 39.6 43. 7 43.4 40.6 Maryland 28.9 26.4 26.5 27.2 26.1 36.7 35.6 34.4 33.4 32.1 35.9 33.9 33.0 Dist. of Columbia. 41.7 28.1 23.1 23.6 18.5 35.1 21.2 13.8 11. 2 6.5 14.6 10. 1 5.2 Virginia 25.6 25.2 28.1 29.5 26.9 21.4 19.7 22.9 25.0 23.4 25. 5 26.7 24.7 West Virginia 16.2 16.3 18.6 25.8 22.7 14.6 14.3 15.9 20 0 19.9 15.4 18.9 17.1 North Carolina 43.5 45.2 49. 2 47. 2 44.4 30.9 3L3 37.3 37.8 37.1 48.3 46. 5 44.5 South Carolina 64.5 65.1 65.1 62.2 56.1 42.5 41.0 45.5 . 47.8 38.3 58.8 56.0 47.2 Georgia 66.6 63.8 68.2 65.6 60.1 46.0 42.2 5L1 53.6 46.8 63.9 6L1 54.3 Florida 25.3 21.3 28.4 28.0 25.2 13.0 11.0 21.7 24.2 16.1 27.9 28.2 24.6
East South C e n t r a l - 49.7 50.3 55.9 54.8 50. 1 29.6 29.2 36.0 37. 1 34.5 52.0 5L4 44.9 Kentucky 33.4 32.0 35.9 37.1 33.1 21. 1 19.8 25.7 27.1 27.3 30.4 33.9 29.7 Tennessee 41.1 41.0 46.2 46.2 40 3 28.2 26.5 33.7 35.2 31.8 43. 1 44.8 38.3 Alabama 57.9 60.7 64.7 64.5 58.8 35.8 38.3 44.5 46.4 42.6 6L9 60 0 53.8 Mississippi 66.1 68.3 72.2 69.8 66.2 34.5 34.4 41.7 40.2 36.6 67.0 62.3 53.2
West South Central 52.9 69.2 62.3 59.5 52.6 30.1 33.5 37.1 37.3 32.6 56.5 54.3 46.7 Arkansas 51.3 56.7 63.0 60.0 53.3 30 3 33.8 42.2 42.3 37.3 56.8 53.9 46.8 Louisiana 57. 1 60. 1 66.6 63. 7 59.4 28.6 29.7 39. 7 40 9 36.3 59.0 56.5 50.2 Oklahoma. 51.0 58.6 61.5 61.2 54.4 39.3 45.1 48.3 47.8 42.4 53.5 54.0 46.7 Texas 53.3 60.4 60.9 57.1 48.9 27.6 30.5 33.2 33.6 29.2 57.6 54.1 46.1
Mountain 15.4 22.2 24.4 26.6 24.6 11.5 14.5 16.0 16.1 13.4 26.8 28.1 26.4 Montana 11.3 21.9 24.5 27.7 27.8 9.3 16.7 16.8 16.9 16.9 2L4 23.3 23.3 Idaho 15.9 24.4 25.3 28.5 25.5 14.2 20 4 19.9 20 5 17.3 26.4 28.2 25.3 Wyoming.. . 12.5 17.9 22.0 23.3 24.2 8.3 8.9 10 7 9.0 9. 1 20 2 21.2 2L1 Colorado.. 23.0 30.9 34.5 39.0 37.2 17.4 22.7 24.8 28.3 23. 2 36. 7 40.1 37.8 New Mexico. 12.2 17. 1 20.2 19.0 17.0 11.0 11.9 11.7 13.3 10 8 27.9 29.9 26.2 Arizona. 18.1 21.5 16.4 17.8 11.6 10 2 8.8 9.6 10.4 4.5 25.1 26.2 17.9 Utah 10.9 11.1 12.2 14.9 13.3 7.4 6.9 9.0 9.7 7.5 12.2 13.0 12.7 Nevada. 9.4 7.9 12.9 14.4 14.4 6.0 4.6 24.5 8.2 6.1 10.0 12.5 7.8
Pacific.. 20.1 16.6 17.7 21.2 18.5 22.8 19.7 20.8 22.3 17.5 27.7 29.6 23.8 Washington 18.7 16.3 17.0 20.0 17.7 26.0 25.4 26.6 28.4 20 0 32.9 32.9 25.2 Oregon 18.8 16.8 17.8 21.7 18.2 19.8 16.8 17.1 17.1 13.6 24.3 25.0 19.5 California... 21.4 14.7 18.0 21.7 19.1 22.8 18.6 20.2 22.3 18.7 26.2 29.7 23.9
All land in farms Cropland har-vested
Source: Department of Commerce, Bureau of the Census; Agriculture Reports, 1935, Vol. I l l , and Six-teenth Census Reports, Agriculture, Vol. III.

FARM TENURE 589 N o . 6 4 4 . — V A L U E O F F A R M S ( L A N D A N D B U I L D I N G S ) , B Y T E N U R E O F O P E R A T O R ,
B Y S T A T E S : 1 9 3 5 A N D 1 9 4 0
NOTE.—Value of land and buildings in millions and tenths of millions of dollars (that is, 14,824.6= $14,824,600,000); average value per farm in dollars. For total value of land and buildings and average value of land and buildings per farm for all tenures combined see tables 636 and 633, respectively.
VALUE OF LAND AND BUILDINGS
DIVISION AND STATE Full owners Part owners Managers Tenants 2
§ P PH
¿SCO 1 DIVISION AND
STATE
1935 1940 1935 1940 1935 1940 1935 1940
2 §
P PH
¿SCO 1
United States. _ 14,824.6 15,297.3 5, 515.1 6,112.4 1,566.3 1,442.7 10, 952. 7 10, 789. 4 4, 960 9, 938 39, 687 4, 569
New England 696.9 557.6 69.8 62.6 76.1 7L1 58.5 49.2 4, 788 8, 880 42, 828 4,916 Maine 122.1 107.2 10.4 6.9 3.9 3.6 7.2 6.4 3,072 5,061 16,917 2, 559 N. Hampshire- 50.9 51.0 7.7 4.0 4.3 3.5 4.0 3.7 3,480 5, 818 22,094 3, 513 Vermont 86.7 85.3 11.4 10.3 5.5 4.6 12.4 10.8 4,409 6,426 16,245 4, 623 Massachusetts _ 192.9 159.1 16.5 15.2 33.1 26.2 13.2 11.6 5, 796 9,351 46, 705 5,109 Rhode Island-- 21.4 16.9 4.1 3.4 5.8 3.7 4.0 2.3 7,166 12,413 51, 890 7, 529 Connecticut 222.9 138.2 19.7 22.6 23.5 29.6 17.7 14.3 7, 774 15,180 78,913 9,431
Middle Atlantic __ 1,427. 3 1, 397. 2 181.0 207.6 191.1 139.7 342.0 294.6 5,190 8, 493 36, 901 5,814 New York 684.1 649.9 116.2 125.7 104.9 55.5 140.2 116.0 5, 509 8,898 34,827 5, 933 New Jersey 156.1 152.0 16.0 23.2 20.7 19.9 41.5 32.7 7,816 12, 069 46, 256 8,109 Pennsylvania.. 587.1 595.3 48.8 58.7 65.5 64.3 160.3 146.0 4,517 6,991 36,494 5,387
E. N. Central 3,071.6 3,413.0 1,056. 6 1,187.0 151.2 168.8 2,317.4 2, 564. 8 5, 641 10,339 28, 856 9,149 Ohio 666.0 776.0 178.4 196.7 38.1 37.0 395.0 434.1 5,169 9, 355 30, 745 7,068 Indiana 443.6 565.5 201.8 236.8 22.4 25.3 372.4 423.9 5, 245 10,098 23, 532 8,120 Illinois 637.4 734.5 401.8 487.1 45.9 57.4 1,120.8 1,258. 2 8,442 14, 840 35, 251 13,678 Michigan 508.3 579.8 135.1 142.5 22.7 25.5 160.2 164.7 4,342 6, 665 29, 629 5,179 W i s c o n s i n . . 816.3 757.2 139.6 123.9 22.1 23.5 268.9 283.9 5,981 7, 682 21, 797 6, 614
W. N. Central..__ 3,215.2 3, 044.2 2,142.2 1, 967.7 127.9 114.1 3, 899. 9 3, 669. 9 6, 807 11,161 24,478 7, 937 Minnesota.. __ 608.6 655.7 260.5 270.6 15.8 13.8 498.0 502.9 6, 313 9, 321 21,850 7,880 Iowa 878.6 981.3 332.7 384.6 31.2 31.4 1,219.8 1, 293.4 11,125 17,162 25,813 12,745 Missouri 498.6 506.4 188.7 189.7 24.0 27.0 387.9 384.2 3, 781 6, 357 22, 846 4, 215 N. Dakota 190.8 119.9 282.0 19L9 6.0 3.8 228.3 174.6 6, 430 8, 826 19, 735 5, 230 S. Dakota 149.1 93.9 234.1 171.4 9.0 5.0 299.6 235.1 6, 240 9,140 19,854 6,124 Nebraska 461.2 303.5 389.1 297.8 21.6 15.0 690.9 521.5 8, 656 13, 852 27,071 8,156 Kansas 428.1 383.5 455.1 461.7 20.1 18.0 575.4 558.1 7, 314 13,978 28, 625 7, 947
South Atlantic 1, 630. 2 1, 802. 6 206.7 255.1 193.9 20L1 86L1 900.8 3, 473 3, 951 33, 669 2, 096 Delaware 25.9 32.5 2.2 3.4 5.8 2.6 17.5 16.5 6,016 6,097 23, 549 5,618 Maryland 146.4 173.0 10.9 13.2 21.5 19.1 63.9 68.6 6, 021 7, 668 29,069 6, 241 Dist. of Col 1.7 0.5 0) 0) 5.0 5.2 0.5 0.2 18,738 30,000 224,152 17, 833 Virginia W. Virginia
396.0 450.8 49.3 62.7 30.2 39.5 118.4 122.0 3, 971 4, 762 35. 802 2, 589 Virginia W. Virginia 166.2 199.7 20.2 17.8 9.0 8.0 42.3 44.3 2, 791 3, 720 21, 274 1,963 N. Carolina 303.6 376.8 62.5 64.8 13.4 13.7 243.1 281.3 2, 845 2, 977 24, 323 2, 278 S. Carolina 121.4 163.4 23.0 32.9 13.0 14.3 128.1 127.9 3,227 3,563 28,258 1,657 Georgia 176.4 214.3 23.7 32.5 18.0 23.5 212.7 210.0 2, 816 3,585 23, 445 1,617 Florida 193.7 191.5 14.8 27.7 78.0 75.1 34.6 30.0 4, 707 6, 531 45, 672 1,915
E.S. Central 1,021.3 1,264. 2 149.0 202.4 52.9 78.3 692.0 779.9 2,826 3,311 33, 649 1,521 Kentucky 390.9 487.2 53.8 62.0 12.8 20.8 162.9 206.5 3, 255 3, 277 44, 589 2,464 Tennessee 311.0 385.0 47.8 65.1 11.4 13.3 185.5 201.0 2, 994 3,451 30,409 2,016 Alabama. 157.8 180. 9 30.3 44.6 9.2 9.5 171.0 173.8 2, 253 3, 010 22, 925 1,276 Mississippi 161.6 211.0 17.1 30.8 19.5 34.7 172.7 198.5 2, 379 3,594 34,419 1,029
W. S. Central 1,446.4 1,515.7 628.7 893.3 262.9 272.9 1,691.7 1,549.8 4,195 9,826 51,871 3,057 Arkansas 155.8 195.2 32. 5 51.9 14.7 19.2 173.1 190. 6 2, 274 3, 508 32,173 1,651 Louisiana 127.4 150.5 22.3 40.6 20.5 27.5 125. 2 135.3 2, 843 5, 510 51, 999 1,517 Oklahoma 230.2 236.5 170.1 237.6 17.1 21.1 367.0 336.0 4, 234 9, 419 26, 992 3, 434 Texas 933.0 933.5 403.7 563.2 210.6 205.3 1,026.4 888.0 5, 602 12,940 61,127 4,343
Mountain 704.4 692.5 553,3 590.8 102.7 115.1 412.1 381.4 5,399 12,983 49,822 6,648 Montana 113.5 98.3 174.1 162.2 14.5 18.2 73.8 71.5 5, 775 12, 615 61,143 6,142 Idaho 147.9 162.9 67.2 85.2 9.2 6.8 83.1 84.3 6, 253 13,801 23, 853 7, 557 Wyoming 45.4 45.3 79.2 70.7 17.8 17.5 24.3 25.5 6, 645 16, 399 68, 690 7, 005 Colorado 151.9 135.9 105.5 105.6 12.8 17.5 148.6 129.4 6,072 11.180 37,149 6, 760 N. Mexico 68.9 70.6 54.2 72.2 14.1 14.9 32.9 29.9 3,183 12, 310 56, 346 5,143 Arizona 54.0 59.3 34.4 48.7 19.4 26.5 24.8 19.2 4, 267 25,039 53, 693 8,979 Utah 100.3 92.8 33.0 40.1 5.0 4.3 20.0 17.2 5, 360 8, 728 33,095 5,095 Nevada 22.4 27.5 5.6 6.1 9.9 9.6 4.7 4.5 10,464 19,414 81, 643 8,691
Pacific i , 7 n . 3 1,610.2 527. 9 746.0 407.6 281.4 678.1 599.0 8,465 24, 612 62,603 11,714 Washington 285.3 296.2 114.1 158. 9 23.1 18.1 128.2 120.2 5,100 18,741 27,286 8,309 Oregon 234.9 251.0 106. 5 130.8 19.7 15.1 87.7 80.0 5, 934 16, 675 36, 303 7,095 California 1,191.2 1, 063.0 307.3 456.3 364.8 248.3 462.2 398.8 11,832 32, 617 72,494 15, 703
AVERAGE VALUE PER FARM, 1940
1 Less than $50,000. Source: Department of Commerce, Bureau of the Census; Sixteenth Census Reports, Agriculture,
Vol. III.
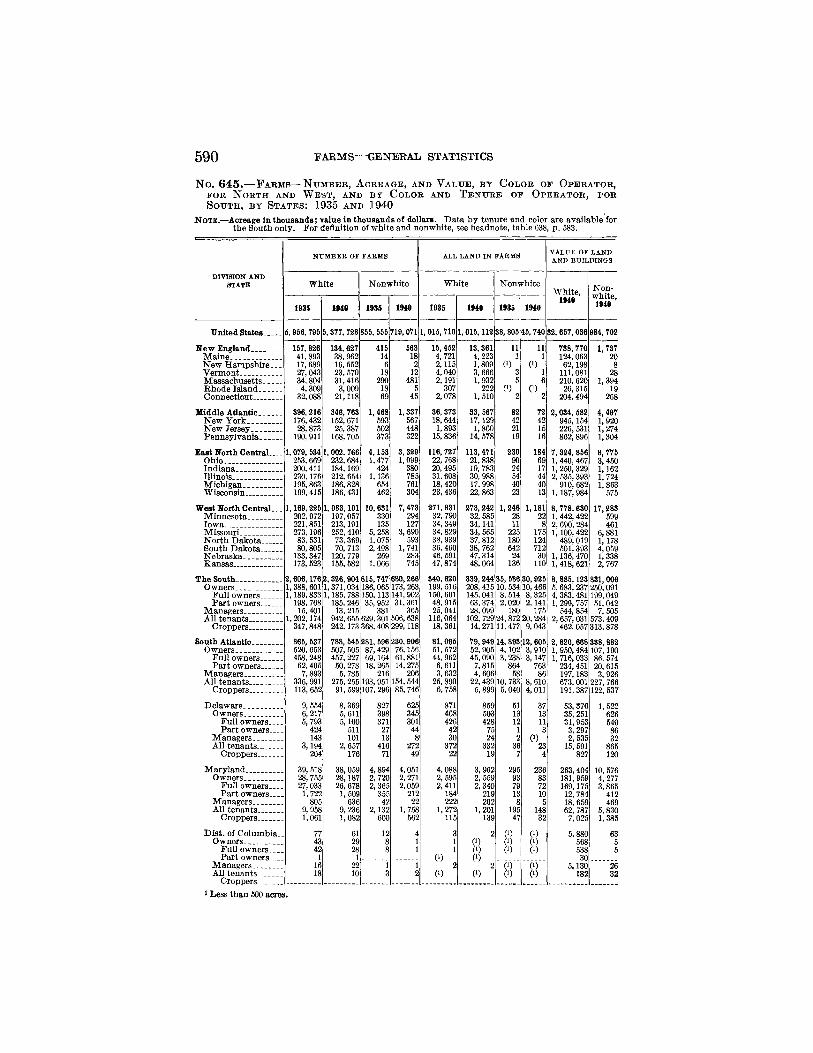
590 FARMS—GENERAL STATISTICS
N o . 6 4 5 . — F A R M S — N U M B E R , A C R E A G E , AND V A L U E , BY C O L O R OF O P E R A T O R , F O R N O R T H AND W E S T , AND BY C O L O R AND T E N U R E O F O P E R A T O R , F O R S O U T H , BY S T A T E S : 1 9 3 5 AND 1 9 4 0
NOTE.—Acreage in thousands; value in thousands of dollars. Data by tenure and color are available for the South only. For definition of white and nonwhite, see headnote, table 638, p. 683.
NUMBER OF FARMS ALL LAND IN FARMS
DIVISION AND STATE White Nonwhite White Nonwhite
1935 1910 1935 1940 1935 1940 1935 1940
United States 5, 966, 796 5, 377, 728 855, 566 719,071 1, 015, 710 1,015,112 38, 805 46, 740
New England 167, 826 134,627 416 563 15,452 13, 361 11 11 Maine 41,893 38,962 14 18 4, 721 4, 223 1 1 New Hampshire 17, 689 16, 552 6 2 2,115 1,809 (0 0) Vermont 27,043 23, 570 18 12 4,040 3, 666 3 1 Massachusetts 34,804 31, 416 290 481 2,191 1,932 5 6 Rhode Island 4,309 3,009 18 5 307 222 0) 0) Connecticut 32,088 21,118 69 45 2,078 1,510 2 2
Middle Atlantic 396, 216 846, 763 1,468 1,337 36, 373 33, 567 82 72 New York 176,432 152,671 593 567 18,644 17,129 42 42 New Jersey 28,873 25, 387 502 448 1,893 1,860 21 15 Pennsylvania 190, 911 168, 705 373 322 15,836 14, 578 19 16
East North CentraL.- 1,079, 534 1, 002. 766 4,153 3, 329 116,727 113,471 230 184 Ohio 253, 669 232, 684 1,477 1,099 22, 768 21,838 90 69 Indiana 200, 411 184,169 424 380 20,495 19, 783 24 17 Illinois 230,176 212, 654 1,136 785 31, 608 30, 988 54 44 Michigan _ 196,863 186,828 654 761 18,420 17, 998 40 40 Wisconsin 199,416 186,431 462 304 23, 436 22, 863 23 13
West North Central.. . 1,169,225 1, 083,101 10, 631 7, 473 271, 831 273, 242 1,246 1,181 Minnesota 202, 972 197,057 330 294 32, 790 32, 585 28 22 Iowa . . __ 221,851 213,191 135 127 34,349 34,141 11 8 Missouri __ 273,196 252, 410 5, 258 3, 690 34, 829 34, 565 225 175 North Dakota 83, 531 73,369 1,075 593 38,939 37,812 180 124 South Dakota 80,805 70, 713 2,498 1, 741 36, 460 38, 762 642 712 Nebraska 133,347 120, 779 269 283 46, 591 47, 314 24 30 Kansas. 173, 623 155, 682 1,066 745 47,874 48,064 136 110
The South 2,606,176 2,326,904 815,747 680,266 340,620 339,244 35, 586 30,925 Owners 1,388, 601 1,371,034 186,065 173, 263 199,516 208, 415 10, 534 10,466
Full owners 1,189,833 1,185, 788 150,113 141, 902 150, 601 145,041 8, 514 8, 325 Part owners 198, 768 185, 246 35,952 31,361 48,915 63,374 2,020 2,141
Managers 15,401 13, 215 381 365 25,041 28,099 180 175 All tenants _. 1, 202,174 942, 655 629, 301 506, 638 116,064 102, 729 24, 872 20,284
Croppers. 347,848 242.173 368,408 299,118 18,361 14, 271 11,477 9,043
South Atlantic 865, 537 788, 645 281, 596 230, 906 81, 095 79, 949 14, 893 12,605 Owners. - 520, 653 507, 505 87,429 76,156 51, 572 52, 905 4,102 3,910
Full owners 458,248 457, 227 69,164 61,881 44,962 45,090 3, 238 3,147 Part owners 62, 405 50, 278 18, 265 14, 275 6, 611 7,815 864 763
Managers 7,893 5, 785 216 206 3, 632 4, 606 58 86 All tenants 336, 991 275, 255 193, 951 154, 544 25,890 22,439 10, 733 8, 610
Croppers 113,652 91, 599 107, 296 85, 746 6, 758 5,899 5,040 4, Oil
Delaware 9, 554 8, 369 827 625 871 859 51 37 Owners 6,217 5, 611 398 345 468 503 13 13
Full owners 6,793 5,100 371 301 426 428 12 11 Part owners 424 511 27 44 42 75 1 3
Managers 143 101 13 8 30 24 2 0) All tenants 3,194 2,657 416 272 372 332 36 23
Croppers 204 176 71 49 22 19 7 4
Maryland 39, 518 38,059 4,894 4,061 4,088 3, 962 295 236 Owners 28,755 28,187 2, 720 2, 271 2, 595 2, 559 93 83
Full owners 27,033 26, 678 2, 365 2, 059 2, 411 2, 340 79 72 Part owners 1,722 1,509 355 212 184 219 13 10
Managers 805 636 42 22 222 202 8 5 All tenants 9, 958 9,236 2,132 1,758 1,272 1,201 195 148
Croppers 1,061 1,082 600 562 115 139 47 32
Dist. of Columbia.. 77 61 12 4 3 2 0) 0) Owners 43 29 8 1 1 0) 0) (0
Full owners 42 28 8 1 1 0) (0 0) Part owners 1 1 0) G)
Managers 16 22 1 1 2 2 0) G) All tenants 18 10 3 2 0) 0) 0) 0)
Croppers 0)
VALUE OF LAND AND BUILDINGS
White, 1940
Non-white,
1940
32, 657,036 984, 702
738,770 124,063 62,198
111,081 210, 620 26, 315
204, 494
2, 034, 582 945,154 226, 631 862,896
7, 324, 866 1, 440, 467 1, 250,329 2, 535, 393
910, 682 1,187, 984
8, 778, 630 1,442, 422 2, 690, 284 1,100, 422
489, 019 501,393
1,136,470 1,418,621
8, 885,123 5,683, 237 4, 383,481 1, 299, 757
544, 854 2, 657,031
462,057
1, 950,484 1, 716,033
234,451 197,183 673,001 191, 387
53, 376 36, 251 31,953 3,297 2, 635
15, 691 827
263,404 181, 959 169,175 12,784 18, 659 62, 787 7, 025
5, 568 538 30
6,130 182
1, 737 20
1,394 19
268
4,497 1,920 1,274 1, 304
8, 775 3,450 1,162 1,724 1,863
575
17,283 699 461
6,881 1,178 4,059 1,338 2,767
831,006 260,091 199,049 51,042 7,505
573, 409 313,878
338, 882 107,190 86, 574 20, 615 3, 926
227, 766 122, 637
1, 622 626 540 86 32
866 120
10, 676 4, 277 3,865
412 469
6,830 1,385
26 32
I Less than 500 acres.

T E N U R E A N D C O L O R O F F A R M O P E R A T O R S 591 N o . 6 4 5 . — F A R M S — N U M B E R , A C R E A G E , A N D V A L U E , B Y C O L O R O F O P E R A T O R ,
F O R N O R T H A N D W E S T , A N D B Y C O L O R A N D T E N U R E O F O P E R A T O R , F O R SOUTH, BY STATES: 1935 AND 1 9 4 0 — C o n t i n u e d
[Acreage in thousands; value in thousands of dollars]
DIVISION AND STATE
NUMBER OF FARMS
White
1935 1940
Nonwhite
1935 1940
ALL LAND IN FARMS
White
1935 1940
Nonwhite
1935 1940
VALUE OF LAND AND BUILDINGS
White, 1940
Non-white,
1940
South Atlantic—Con Virginia
Owners Full owners. _ Part owners.-
IVIanagers All tenants
Croppers
West Virginia Owners
Full owners.. Part owners.-
Managers All tenants
Croppers North Carolina...
Owners Full owners.. Part owners..
Managers All tenants
Croppers South Carolina....
Owners Full owners.. Part owners. _
Managers All tenants
Croppers
Georgia Owners
Full owners.-Part owners__
Managers All tenants
Croppers Florida
Owners Full owners __ Part owners..
Managers All tenants
Croppers
East South CentraL. Owners
Full owners Part owners
Managers All tenants
Croppers
Kentucky Owners
Full owners. _ Part owners—
Managers All tenants
Croppers Tennessee
Owners Full owners--Part owners..
Managers All tenants
Croppers
154,421 110, 477 98,173 12,304
1, 070 42,874 12,137
104,054 76, 622 68, 525
8 ,097 586
26, 846 3 ,032
231, 594 137, 738 114,051
23,687 683
93,173 36,392
88, 967 43, 548 37, 652
5 , R " 617
44, 802 16,001
177,259 74,626 66, 952
7,674 984
101,649 41,672
60,093 42, 627 40,027
2,600
14,477 3 ,153
834, 292 462, 381 400, 798
61, ^ • 2,245
369, 666 131,113
270,048 170, 609 145,828
24, 781 411
99, 028 30, 258
239, 387 138,853 118, 889
19,964 472
100, 062 35, 381
139,795 104, 424 94, 580
9, 844 1,
34, 303 10, 341
98, 611 75, 898 71,146
4, 752 373
22,340 1,114
218, 008 135, 990 118, 514
17, 476 536
81,482 33,497
76, 251 42, 783 37,
5, 285 478
32,990 11, 413
156,901 75,163 67,499
7, 664 966
80, 772 31, 631
52,490 39, 420 36,184
3, 236 1,605
11,465 2, 345
756,923 459,251 406, 790
52,461 2, 246
295,426 95, 055
247, 347 165,440 146,993
18, 447 460
81, 447 22, 026
219, 642 140, 557 123,198
17, 359 429
78, 656 27,620
43, 211 27, 662 23, 317
4, 345 37
15, 512 6,102
511 456
55 7
175 11
69,373 20,373 14, 343
6, 030 15
48, 985 30, 001
76, 537 18,394 13,675
4,719 19
58,124 30,237
73, 285 10,571 8, 905 1,666
32 62, 682 38,753
12, 764 6, 792 5, 724 1,068
50 5,922 1,521
302,927 48, 892 39,445
9, 447 68
253,967 158, 265
8, 250 4, 052 3,157
895 11
4,187 2, 756
34,396 7, 843 6 ,151 1,692
8 26, 545 16, 096
35,090 22, 250 18,930 3, 320
36 12, 804
5,897
671 427 396
31 5
239
18,245 13,937
4 ,308 29
41, 994 26, 803
61, 307 17,084 13,145 3,939
29 44,194 22, 061
59,132 10,018
8, 604 1,414
36 49,078 29, 303
9, 758 5, 515 4, 508 1,007
40 4, 203 1,062
266, 426 49,169 40,496
8, 673 81
217,176 136, 821
5,547 3,164 2, 702
462 6
2,377 1,507
27,975 6, 5, 393 1,493
10 21, 079 13,870
15, 607 11, 570 10, 263
1,307 530
3, 507 726
7, 6 ,418
875 229
1,874 223
16, 767 11,093 9 ,340 1, 753
348 5, 326 1,530
8 ,841 5 ,071 4 ,314
757 557
3 ,213 839
19,963 10,100
8,912 1,
782 9 ,081 3,087
5, 560 3 ,382 2, 876
506 933
1,245 216
68, 067 45,168 39,
5, 780 1, 350
21, 549 5,014
20, 395 14,744 12, 823
1,921 171
5,480 1,009
17, 804 11, 787 10,129
- 1,658 192
5, 1,
14,662 10, 910 9, 573 1, 337
653 3,099
721
6 ,965 6,356
609 157
1, 764 149
15,987 10,661
9,130 1,531
303 5 ,022 1,638
8 ,457 5,482 4, 546
936 641
2,334 589
19, 252 10, 721
9 ,232 1,489 1,010 7, 520 2,463
7 ,883 5 ,103 3 ,485 1,618 1,613 1,167
181
66, 828 45,420 38,932
2, 038 1,129
936 193
13 895 290
28 19 17 2 2 7 1
1,783 1,016
838 178
12 755 292
24 17 15 2 1
1, 19, 711 4 ,412
20, 053 14,400 12, 673
1, 727 201
5,452 1,107
17,423 12,Oil 10, 202
1, 229
5,183 1,254
3 ,169 2 ,858 948 882 667 673 281 209
5 12 2,217 1,964 1,104 1,051
3 ,489 2, 782 795 799 619 624 176 175
11 15 2, 683 1,967 1,148 822
5,333 4 ,431 839 845 689 710 149 135
11 17 4 ,483 3, 570 2 ,378 1,758
489 454 266 255 218 203
48 52 5 23
217 176 66 51
11,034 10, 259 3,196 3 ,345 2,649 2, 755
546 590 28 37
7, 810 6, 877 3,837 3,174
303 241 168 143 133 120 35 23
6 1 129 97 60 46
1,282 1, 070 381 363 296 271
86 92 1 3
899 704 417 337
624,892 483, 025 425, 380
57,645 38, 792
103, 075 25, 064
268,921 216,919 199,175
17, 744 7,957
44, 045 3, 794
623, 586 411, 260 353, 511
57, 750 12, 754
199, 572 77,465
261,435 175, 764 147, 698
28, 066 13,951 71, 720 19,551
405,385 232, 556 202,134
30, 423 23,158
149,671 53, 627
313,787 213,181 186,469
26,712 74, 249 26,357
4, 034
2, 060,711 1 ,400,188 1, 210,134
190, 055 76, 784
583, 739 144,148
766, 667 544,029 482, 827
61, 202 20, 642
201, 997 44,401
627,939 439, 213 376, 903
62, 310 13,157
175, 569 49,146
50,083 30,446 25,403
5,044 734
18,903 7,774
906 549 500
49 85
273 25
113,122 30,421 23, 326
7, 096 989
81, 712 49,671
77,059 20, 541 15, 738 4 ,803
376 56,143 27,651
74,959 14,267 12,141 2,126
335 60, 358 34,912
10, 590 6, 058 5, 058
999 882
3 ,651 1,000
264, 026 66,389 54,052 12,336
1, 518 196,119 119,448
9,827 5,145 4, 381
764 137
4 ,545 2,405
36, 535 10, 883 8,128 2,755
193 25,459 13,177
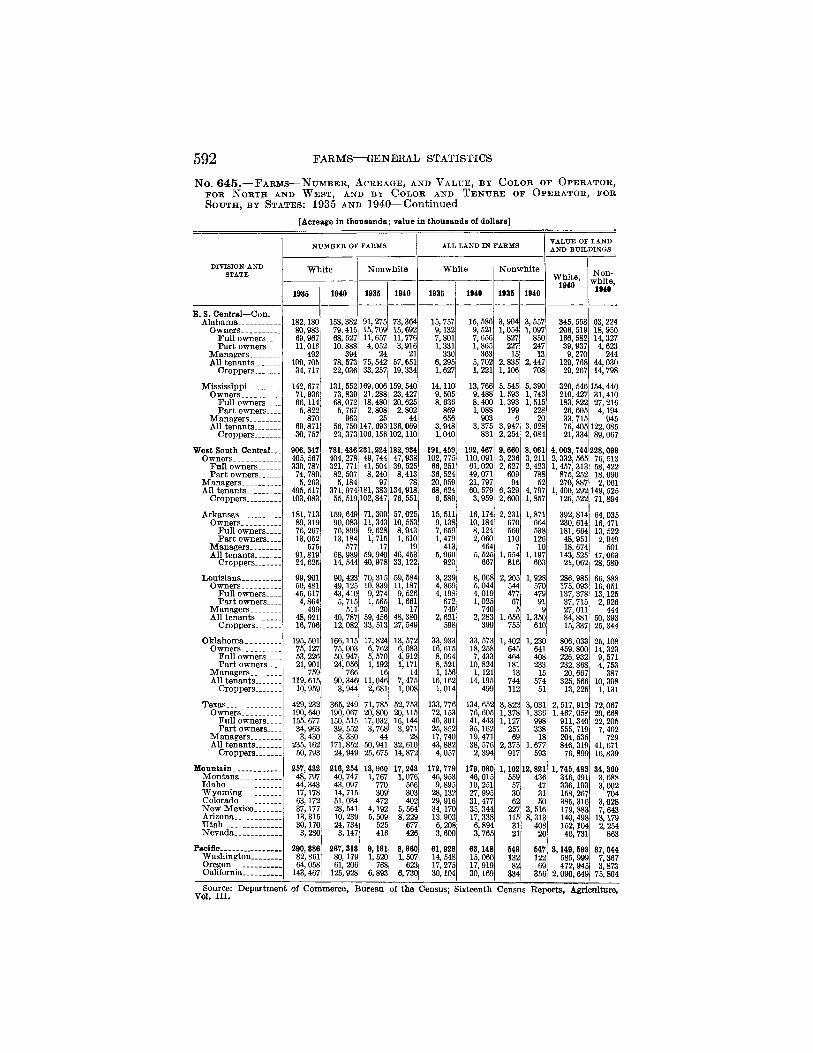
592 FARMS—GENERAL STATISTICS
N o . 6 4 5 . — F A R M S — N U M B E R , A C R E A G E , A N D V A L U E , B Y C O L O R O F O P E R A T O R , F O R N O R T H A N D W E S T , A N D B Y C O L O R A N D T E N U R E O F O P E R A T O R , F O R SOUTH, BY STATES: 1 9 3 5 AND 1 9 4 0 — C o n t i n u e d
[Acreage in thousands; value In thousands of dollars]
DIVISION AND STATE
NUMBER OF FARMS ALL LAND IN FARMS VALUE OF LAND AND BUILDINGS
DIVISION AND STATE White Nonwhite White Nonwhite
White, 1940
Non-white,
1940
DIVISION AND STATE
1935 1940 1935 1940 1935 1940 1935 1940
White, 1940
Non-white,
1940
E. S. Central—Con. Alabama 182,180 158,382 91,275 73,364 15,757 15, 586 3,904 3,557 345, 558 63,224
Owners 80,983 69, 967
79,415 15,709 15,692 9,132 9,521 1,054 1,097 206, 519 18,950 Full owners
80,983 69, 967 68, 527 11,657 11, 776 7,801 7, 656 827 850 166, 582 14, 327
Part owners 11,016 10, 888 4,052 3,916 1,331 330
1,865 227 247 39, 937 4,623 Managers 492 394 24 21
1,331 330 363 15 13 9, 270 244
All tenants 100, 705 78, 573 75, 542 57, 651 6,295 5,702 2,835 2,447 129, 768 44,030 Croppers 34, 717 22,036 33,257 19,334 1, 627 1, 221 1,106 708 29, 267 14, 798
Mississippi 142, 677 131, 552 169,006 159, 540 14,110 13, 766 5,545 5,390 320, 546 154, 440 Owners 71, 936 73, 839 21,288 23, 427 9,505 9, 488
8,400 1, 593 1,743 210, 427 31, 410
Full owners 66,114 68,072 18,480 20, 625 8, 636 9, 488 8,400 1, 393 1, 515 183, 822 27, 216
Part owners 5,822 5, 767 2,808 2,802 869 1,088 199 228 26, 605 4,194 Managers 870 963 25 44 656 903 6 20 33, 715 945 All tenants __ 69, 871 56, 750 147, 693 136,069 3,948
1,040 3, 375 3, 947 3, 628
2,084 76,405 122,085
Croppers 30, 757 23, 373 106,156 102,110 3,948 1,040 831 2, 254
3, 628 2,084 21,334 89,067
West South C e n t r a l - 906,347 781, 436 231,224 182, 934 191,459 192,467 9, 660 8,061 4,003, 744 228,098 Owners 405, 567 404, 278 49,744 47, 938 102, 775 110,091 3,236 3, 211 2, 332, 565 76, 513
Full owners 330, 787 321, 771 41,504 39, 525 66, 251 61,020 2, 627 609
2, 423 1, 457, 313 58,422 Part owners 74, 780 82, 507 8,240 8, 413 36, 524 49,071
2, 627 609 788 875, 252 18,090
Managers 5,263 5,184 97 78 20,059 68, 624
21,797 94 52 270, 887 2,061 All tenants 495, 517 371,974 181,383 134,918
20,059 68, 624 60, 579 6, 329 4,797 1,400, 292 149,525
Croppers 103,083 55, 519 102,847 76, 551 6,589 3,959 2, 600 1,857 126, 522 71,894
Arkansas 181,713 159,649 71,300 57,025 15, 511 16,174 2,231 1,871 392,814 64,035 Owners 89, 319 90,083 11,343 10, 553 9,138 10,184 670 664 230, 614 16,471
Full owners 76, 267 76,899 9,628 8,943 7, 659 8,124 560 538 181, 664 13, 522 Part owners 13,052 13,184 1, 715 1,610 1,479 2,060 110 126 48,951 2, 949
Managers 575 577 17 19 413 464 7 10 18, 674 501 All tenants 91,819 68,989 59,940 46, 453 5,960 5, 525 1, 554 1,197 143, 525 47,063
Croppers 24,625 14, 544 40,978 33,122 920 667 816 603 21,062 28, 580
Louisiana 99,901 90,423 70,315 59, 584 8,239 8,068 2,205 1, 928 286, 985 66, 888 Owners 50,481 49,125 10,839 11,187 4, 869 5,044 544 570 175, 093 16,051
Full owners 45,617 43,410 9, 274 9, 526 4,198 4, 019 477 479 137, 378 13,125 Part owners 4,864 5, 715 1,565 1, 661 672 1,025 67 91 37, 715 2, 926
Managers. _ 499 511 20 17 749 740 5 9 27, on 444 All tenants 48,921 40, 787 59,456 48, 380 2,621 2,283 1, 656 1,350 84, 881 50, 393
Croppers 16,706 12,082 33, 513 27, 549 598 399 755 610 15,337 25, 344
Oklahoma 195, 501 166,115 17,824 13, 572 33,933 33, 573 1,402 1,230 806,033 25,108 Owners 75,127 75,003 6, 762 6,083 16, 615 18, 258 645 641 459, 800 14, 323
Full owners 53, 226 50, 947 5, 570 4,912 8, 094 7,433 464 408 226, 932 9, 571 Part owners 21,901 24,056 1,192 1,171 8, 521 10,824 181 233 232,868 4, 753
387 Managers 759 766 16 14 1,156 1,121 13 15 20, 667 4, 753
387 All tenants.. 119, 615 90, 346 11,046 7,475 16,162 14,195 744 574 325, 566 10, 398
Croppers 10,959 3,944 2,681 1,008 1,014 499 112 51 13, 225 1,131
Texas 429, 232 365, 249 71,785 52, 753 133, 776 134, 652 3,822 3, 031 2, 517, 912 72,067 Owners 190, 640 190,067 20,800 20,115 72,153 76, 605 1, 378 1, 336
998 1, 467,058 29, 668
Full owners 155, 677 150, 515 17,032 16,144 46, 301 41, 443 1,127 1, 336
998 911, 340 22, 205 Part owners 34, 963 39, 552 3,768 3,971 25,852 35,162 251 338 555, 719 7, 462
Managers 3, 430 3, 330 44 28 17, 740 19, 471 69 18 204, 535 729 All tenants 235,162 171,852 50,941 32,610 43,882 38, 576 2,375 1,677 846,319
76,899 41, 671
Croppers 50, 793 24, 949 25, 675 14,872 4,057 2, 394 917 593 846,319 76,899 16,839
Mountain 257, 432 216, 254 13, 960 17,243 172, 779 179, 080 1,102 12, 821 436
1, 745, 483 34, 360 Montana.— 48, 797 40,747 1,767 1,076 46,953 46,015 559
12, 821 436 346, 491 3,688
Idaho . . 44, 343 43,097 770 566 9, 895 10, 251 57 47 336,193 3,002 Wyoming 17,178 14, 715 309 303 28,132 27, 995 30 31 158, 267 704 Colorado 63,172 51,034 472 402 29, 916 31, 477 62 50 385, 316 3,028 New Mexico 37,177 28, 541 4,192 5, 564 34,170 35,344 227 3,516 179, 883 7,643 Arizona 13, 315 10, 239 5,509 8, 229 13,903 17,338
6,894 115 8,313 140, 498 13,179
Utah 30,170 24, 734 525 677 6, 208 17,338 6,894 31 408 152,104 2, 254
863 Nevada 3,280 3,147 416 426 3, 600 3,765 21 20 46, 731 2, 254
863 Pacific 290,386 267,313 9,181 8,860 61,928 63,148 548 547 3,149,593
585,999 87,044
Washington 82, 861 80,179 1, 520 1,507 14, 548 15,060 132 122 3,149,593
585,999 7,367 Oregon 64,058 61, 206 768 623 17, 275 17,919 82 69 472,945 3,873 California 143, 467 125, 928 6,893 6,730 30,104 30,169 334 356 2,090,649 75,804 Source: Department of Commerce, Bureau of the Census; Sixteenth Census Reports, Agriculture,
Vol. III.
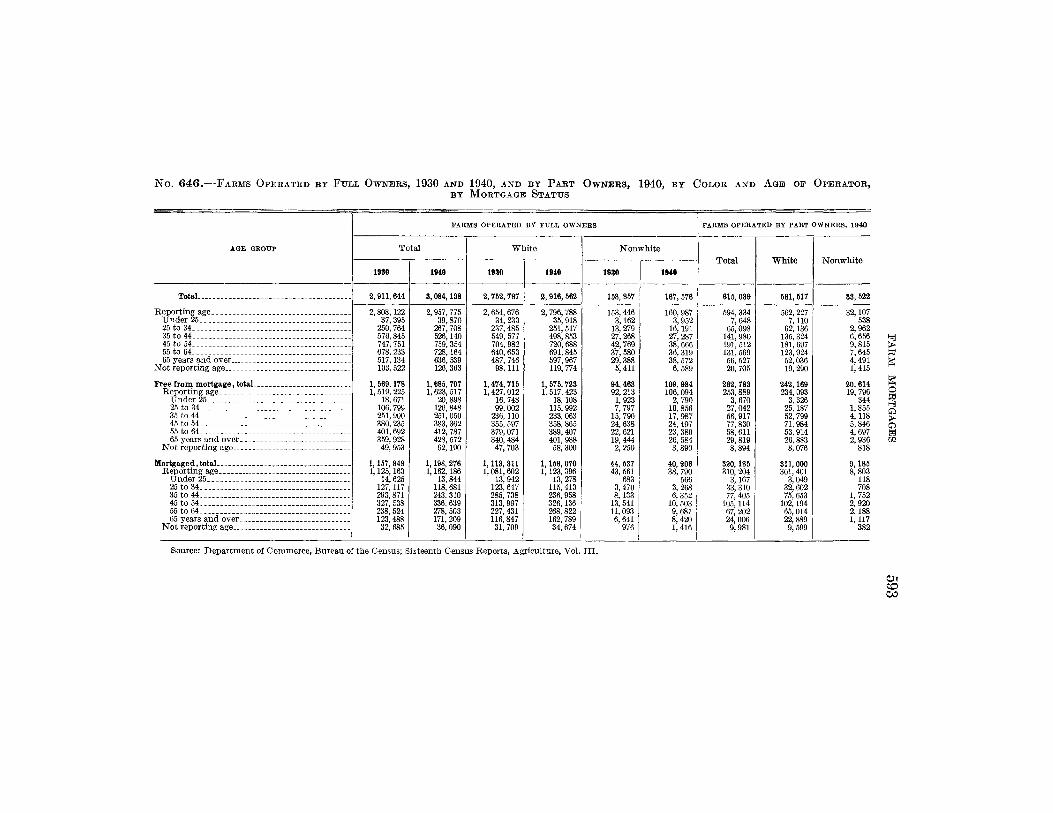
N o . 6 4 : 6 . — F A R M S O P E R A T E D B Y FULL O W N E R S , 1 9 3 0 A N D 1 9 4 0 , AND B Y P A R T O W N E R S , 1 9 4 0 , B Y C O L O R A N D A G E O F O P E R A T O R , B Y M O R T G A G E S T A T U S
A G E G R O U P
Total
Keporting age Under 25 25 to 34 35 to 44 45 to 54 55 to 64 65 years and over
Not reporting age
Free from mortgage, total Reporting age
Under 25 25 to 34 35 to 44 45 to 54 55 to 64 65 years and over
Not reporting age
Mortgaged, total Reporting age
Under 25 25 to 34 35 to 44 45 to 54 55 to 64 65 years and over
Not reporting age
FARMS OPERATED BY FULL OWNERS
Total
1930
2,911,644
2,808,122 37,395
250, 764 576,845 747,751 678, 233 517,134 103, 522
1, 569,178 1,519, 225
18, 671 106, 799 251, 900 380,235 401,692 359, 928 49, 953
1,157, 848 1,125,163
14, 625 127,117 293,871 327, £38 238, 524 123,488 32, 685
1940
3,084,138
2,957,775 39,870
267,708 526,140 759,354 728,164 636, 539 126, 363
1,685, 707 1,623, 517
20,898 126, 848 251, 050 383, 362 412, 787 428, 572 62,190
1,198, 276 1,162,186
13,844 118, 681 243, 310 336, 639 278, 503 171, 209 36,090
White
1930
2, 752, 787
2,654, 676 34, 233
237, 485 549, 577 704,982 640, 653 487, 746 98, 111
1, 474, 715 1,427,012
16, 748 99,002
236,110 355, 597 379, 071 340, 484 47, 703
1,113,311 1,081, 602
13, 942 123, 647 285, 738 313, 997 227, 431 116,847 31, 709
1940
2, 916, 562
2, 796, 788 35, 918
251,517 498, 853 720,688 691,845 597,967 119,774
1, 575, 723 1, 517, 423
18,108 115,992 233,063 358, 865 389,407 401, 988 58, 300
1,158, 070 1,123, 396
13, 278 115, 413 236, 958 326,136 268,822 162, 789 34,674
Nonwhite
158,857
153,446 3,162
13, 279 27, 268 42, 769 3'7, 580 29, 388 5,411
94, 463 92,213 1,923 7,797
15,790 24, 638 22, 621 19, 444 2,250
44, 537 43, 561
683 3, 470 8,133
13, 541 11, 093 6, 641
976
1940
167, 576
160, 987 3,952
16,191 27, 287 38, 666 36, 319 38, 572
109, 984 106,094
2, 790 10,856 17, 987 24, 497 23, 380 26, 584 3,890
40, 206 38, 790
566 3,268 6, 352
10, 503 9,681 8, 420 1, 416
FARMS OPERATED BY PART OWNERS, 1940
Total
615,039
594, 334 7,648
65,098 141,980 191, 512 131, 569 56, 527 20, 705
262, 783 253,889
3,670 27,042 56, 917 77,830 58,611 29,819 8,894
320,185 310, 204
3,167 33, 310 77, 405
105,114 67, 202 24,006 9,981
White
581,517
562, 227 7,110
62,136 135, 324 181, 697 123,924 52,036 19,290
242,169 234,093
3, 326 25,187 52,799 71,984 53,914
i, 076
311,000 301, 401
3,049 32,602 75, 653
102,194 65, 014 22, 889
Nonwhite
33, 522
32,107 538
2,962 6, 656 9, 815 7,645 4, 491 1,415
20,614 19, 796
344 1,855 4,118 5, 846 4,697 2,936
818
9,185 8, 803
118 708
1, 752 2, 920 2,188 1,117
382
ta G
g 0 §
1 § »2
Source: Department of Commerce, Bureau of the Census; Sixteenth Census Reports, Agriculture, Vol. III.
O l CO 00

594 FARMS—GENERAL STATISTICS
N o . 6 4 7 . — F A R M S O P E R A T E D B Y F U L L O W N E R S , 1 9 3 0 A N D 1 9 4 0 , A N D B Y P A R T O W N E R S , 1 9 4 0 , B Y C O L O R O F O P E R A T O R A N D B Y M O R T G A G E S T A T U S
lAcres in thousands and values in thousands af dollars]
COLOR, TENURE, MORTGAGE STATUS, AND CENSUS YEAR
REGARDLESS OF ADDITIONAL LAND OWNED NO ADDITIONAL LAND OWNED 1
COLOR, TENURE, MORTGAGE STATUS, AND CENSUS YEAR
Number of farms
Land in farms
Value of land and buildings
Number of farms
Land in farms
Value of land and buildings
All full owner s - - 1930._ 2,911,644 372,450 21,123,468 2,398,662 291,495 16,816,153 1940- 3,084,138 382,098 15, 297, 274 2,157,911 254, 567 10, 219,871
Free from mortgage.. 1930-. 1,569,178 178,138 9,617, 604 1,268,080 136, 893 7,414,149 Free from mortgage.. 1940-- 1,685, 707 189,302 6,992, 216 1,194,166 126, 827 4, 577, 763
Mortgaged . 1930__ 1,157,848 170,716 10,402,311 978, 587 136,154 8, 524, 230 1940- 1,198, 276 169,070 7, 463, 866 890,181 119, 364 5, 348,173
Nonwhite full owners.. . „ -1930- 158,857 10,643 317, 566 129, 383 7, 954 238,822 1940- 167, 576 21,368 256,132 116, 557 17, 296 163, 650
Free from mortgage 1930- 94, 463 5,890 172, 612 78,693 4,495 132, 722 Free from mortgage 1940-- 109,984 17, 256 146,787 82, 754 15, 056 101, 501
Mortgaged- 1930- 44, 537 3, 537 111,583 34, 517 2, 551 81,004 1940- 40,206 3,024 83, 526 27,167 1,854 52, 793
1940 1,854 52, 793
All part owners-- . 615,039 300, 325 6,112,411 471, 561 219,152 4,489, 934 Owned portion 615,039 144, 639 3, 564, 202 471, 561 104, 446 2,609, 914 Free from mortgage 262, 783 48, 727 1,161, 906 201,865 34,041 821, 619 Mortgaged 320,185 90, 322 2, 279,071 254, 244 68,205 1,733,937
Nonwhite part owners, total 33, 522 3,113 68,462 24,406 2,025 47,446 Owned portion 33, 522 1,462 39, 558 24,406 952 26,871 Free from mortgage 20, 614 763 19,880 16,025 520 14, 207 Mortgaged 9,185 573 16,182 6, 725 385 11, 266
1 Differences between these totals and totals for farms regardless of additional land owned do not repre-sent data for operating owners who owned additional land. Some operators did not make a report as to this item. For 1930, operators who did not report as to this item are included with those operators who reported that they owned no additional land.
N O . 6 4 8 . — M O R T G A G E D F A R M S O P E R A T E D B Y F U L L O W N E R S , 1 9 3 0 A N D 1 9 4 0 , A N D B Y P A R T O W N E R S , 1 9 4 0 , B Y C O L O R O F O P E R A T O R , B Y A M O U N T O F M O R T -G A G E D E B T
NOTE.—Data are for mortgaged farms reporting amount of debt.
LAND IN FARMS
VALUE OF LAND AND BUILDINGS MORTGAGE DEBT Aver- Ratio
of debt
to value (per-cent)
Num-ber of farms
age Ratio
of debt
to value (per-cent)
COLOR, TENURE, AND CENSUS YEAR
Num-ber of farms Thou-
sands of acres
Aver-age Thou-
sands of dollars
Average Thou-sands of dollars
Average eq-uity per
Ratio of
debt to
value (per-cent)
Thou-sands
of acres per
farm (acres)
Thou-sands of dollars Per
farm Per acre
Thou-sands of dollars Per
farm Per acre
farm
Ratio of
debt to
value (per-cent)
REGARDLESS OF ADDI-TIONAL LAND OWNED
Full owners 1930-1940-
Nonwhite full own-ers 1930-
1940.-
1,145,737 1,181,025
43, 823 39, 216
168,761 166,797
3, 488 2,953
147.3 141.2
79.6 75.3
10,307,732 7, 371,108
110,028 81,677
$8,997 6, 241
2, 511 2,083
$61.08 44.19
3L54 27.66
4,080,176 3,138, Oil
40,852 32,383
$3, 561 2,657
932 826
$24.18 18.81
11.71 10. 97
$5,436 3,584
1, 579 1, 257
39.6 42.6
37.1 39.6
Part owners (owned portion only). 1940..
Nonwhite part own-ers 1940..
317,378
9,007
89,416
564
2 8 L 7
62.6
2, 260, 514
15,902
7,122
1,765
25.28
28. 21
1,060,407
6,286
3, 341
698
1L86
IL 15
3,781
1,068
46.9
39.5 NO ADDITIONAL LAND
OWNED 1 Full owners 1930__
1940-Nonwhite full own-
ers 1930--1940-
969, 763 879, 288
34,048 26, 566
134,765 118,067
2, 522 1,815
139.0 134.3
74.1 68.3
8, 458,607 5, 293, 207
80,120 51,774
8, 722 6,020
2, 353 1,949
62. 77 44.83
3L77 28.53
3, 379,866 2, 290,163
28,926 20,897
3,485 2,605
850 787
25.08 19.40
11.47 11.51
5,237 3,415
1,503 1,162
40.0 43.3
36.1 40.4
Part owners (owned portion only) -1940. _
Nonwhite part own-ers 1940..
252, 249
6,602
67,625
379
268.1
57.4
1,720,734
11,060
6,822
1,675
25.45
29.20
822,100
4,281
3,259
648
12.16
1L30
3, 562
1,027
47.8
38.7
» See note 1, table 647. Source of tables 647 and 648: Department of Commerce, Bureau of the Census; Sixteenth Census Reports»
Agriculture. VoL i n .

N o . 6 4 9 . — M O R T G A G E D F A R M S O P E R A T E D B Y F U L L O W N E R S , 1 9 2 0 A N D 1 9 4 0 , A N D B Y P A R T O W N E R S , 1 9 4 0 , B Y R A T E O F I N T E R E S T O N M O R T G A G E D E B T
NOTE.—For 1920, interest rate is average rate for entire mortgage debt; for 1940, it is that on first mortgage
CONTRACT RATE OF iNTEREST
FARMS OPERATED BY ALL FULL OWNERS REPORTING AMOUNT OF DEBT AND INTEREST RATE
FARMS OPERATED BY ALL PART OWNERS REPORTING AMOUNT OF DEBT AND INTEREST RATE, 1940
CONTRACT RATE OF iNTEREST N umber
Land in farms (thousands of acres),
1940
Value of land and buildings (thousands of dollars),
1940
Mortgage debt (thousands of dollars)
Number
Owned portion CONTRACT RATE OF iNTEREST
1930 1940
Land in farms (thousands of acres),
1940
Value of land and buildings (thousands of dollars),
1940
Mortgage debt (thousands of dollars)
Number Land in farms (thousands
of acres)
Value of land andbuildings
Mortgage debt
CONTRACT RATE OF iNTEREST
1930 1940
Land in farms (thousands of acres),
1940
Value of land and buildings (thousands of dollars),
1940 1920 1940
Number Land in farms (thousands
of acres)
Value of land andbuildings
Mortgage debt
CONTRACT RATE OF iNTEREST
1930 1940
Land in farms (thousands of acres),
1940
Value of land and buildings (thousands of dollars),
1940 1920 1940
Number Land in farms (thousands
of acres) Thousands of dollars
Reporting rate, total 1,169, 932 1,157,107 164, 438 7, 261, 904 3, 941,226 3, 091, 413 313,595 88, 650 2, 239, 763 1, 050, 881
Under 4 percent. 4, 285 94, 685 18, 419 809, 056 13, 246 362, 469 28, 039 9, 501 255, 676 120, 733 Under 3 0) 6, 872 793 29, 587 0) 14, 276 1, 585 321 7, 581 3,930
21, 975 3 to 3M 0) 21, 579 3, 923 140, 542 75, 977 5, 981 2,003 43, 550 3,930
21, 975 3M to 37^ 2 0) 66, 234 13, 703 638, 928 G) 272, 216 20, 473 7,176 204,544 94, 828
4 to m 29, 798 248, 071 43, 410 2, 060, 495 119,049 918, 821 78, 464 25, 302 698, 621 334, 429 4 to 4 ^ . . . . . . . . . , . 0) 134, 990 22, 204 1, 034,147 G) 462,186 40, 097 11, 653 330, 897 158, 300
to i ^ . . . . . 0) 113, 081 21, 206 1, 026, 348 G) 456, 635 38, 367 13, 650 367, 724 176,129 5 to 5% 175, 615 288, 808 45, 258 1, 954, 918 787,061 870, 639 86, 507 26, 662 644, 337 316,127 6M to 5J4 89,061 55,039 9, 317 400, 822 521,440 174, 250 17, 710 6, 441 142, 331 69, 773 Qto&Vs 505, 039 356, 783 35, 801 1, 663, 052 1, 557, 498 637, 559 73, 486 14,918 392, 338 167, 046 63/2 to 6K 22, 773 4, 229 699 28, 655 118, 269 11, 925 1,330 637 9,288
53, 637 4, 947
7 to 117, 885 41,140 4,079 181, 624 399,112 63, 799 10, 895 2, 321 9,288
53, 637 21, 377 8 to 9 ^ 175, 032 58, 395 6, 500 146, 324 364, 390 47, 214 14, 044 2, 518 38, 606 14, 775 10 and over 50, 444 9, 957 954 16,957 61,162 4, 736 3,120 350 4,929 1,675
Average of the interest rates ^ (1) 5. 3 5. 2 Weighted average interest rate TVFP/IINN intiPTPsf. mt.p
6.1 6.0
4.9 5.0
4.9 5.0
Weighted average interest rate TVFP/IINN intiPTPsf. mt.p
6.1 6.0
4.9 5.0
4.9 5.0
6.1 6.0
4.9 5.0
4.9 5.0
fd
G
o ZP
1 Not available. 2 Some of the reports of 3H percent may represent a temporary rather than the contract rate. « An arithmetic average of interest rates reported. ^ Calculated by weighting each rate by their total debt for farms reporting that rate. Source: Department of Commerce, Bureau of the Census; Sixteenth Census Reports, Agriculturei Vol. III .
Cn CO Oi

596 FARMS^—GENERAL STATISTICS
N o . 6 6 0 . — F A R M S O P E R A T E D B Y A L L O W N E R S , B Y M O R T G A G E S T A T U S , A N D M O R T G A G E D F A R M S O P E R A T E D B Y F U L L O W N E R S , B Y A M O U N T O F M O R T G A G E D E B T , B Y S T A T E S : 1 9 4 0
NUMBER OF FARMS OPERATED BY ALL OWNERS
D I V I S I O N A N D S T A T E
Total Free from mortgage
Mort-gaged Number
Land in farms (thou-sand acres)
Value of land and buildings
Mortgage debt
Ratio of debt to value (per-cent)
D I V I S I O N A N D S T A T E
Total Free from mortgage
Mort-gaged Number
Land in farms (thou-sand acres) Thousands of dollars
Ratio of debt to value (per-cent)
United States 3, 699,177 1,948,490 1, 518,461 1,181,025 166,797 7,371,108 3,138,011 42.6
New England. 123, 520 62,019 56,055 51,244 4,913 273, 860 111,252 40.6 Maine 36, 250 21, 946 12, 506 11,636 1, 374 46, 797 20,567 43.9 New Hampshire 15, 342 8, 253 6,099 5,643 567 21,063 8,420 40.0 Vermont 20, 952 9,128 11,321 10, 259 1,646 49,032 21,047 42.9 Massachusetts 29,072 12, 519 15,125 13,878 737 81, 377 33, 870 4L 6 Rhode Island 2, 634 1, 426 1,082 923 53 6,897 2, 652 38.4 Connecticut 19, 270 8,747 9, 922 8, 905 536 68, 694 24, 696 36.0
Middle Atlantic 293, 639 160, 767 120,031 106,202 9, 986 612, 740 256, 795 4L 9 New York 132,100 65, 377 61, 506 53,144 5, 791 315, 318 131,179 4L 6 New Jersey 21, 370 9,535 10, 860 9, 646 548 76, 801 31, 796 4L 4 Pennsylvania 140,169 85,855 47, 665 43,412 3,646 220, 622 93, 820 42.5
East North Central 719, 905 348,285 333,989 268, 754 26,087 1, 686, 715 755, 250 44.8 Ohio 171,156 93, 504 66,565 55, 281 4,324 316,193 131,966 4L 7 Indiana 131, 263 61,409 64, 508 49,816 4,438 290,133
350, 886 110, 532 38.1
Illinois 119, 830 62,661 47,958 32,117 3,937 290,133 350, 886 149, 567 42.6
Michigan 154, 928 76,020 71, 792 58, 991 5,030 268,135 110, 297 4L1 Wisconsin 142, 728 54, 691 83,166 72,549 8,359 461, 368 252, 887 54.8
West North Central 623,512 249,238 339,292 223,423 39,850 1, 753,263 899,317 51.3 Minnesota 132, 903 54, 520 72, 640 53, 758 7, 664 381, 872 195, 623 6L2 Iowa 110, 616 38, 781 65,313 50, 392 7, 303 624, 687 327, 979 52.5 Missouri 163, 763 77, 290 76,007 58,100 7,235 235,157 113,128 48.1 North Dakota 40, 391 12,281 26,170 10, 774 3, 982 75, 340 40, 907 54.3 South Dakota 33,803 11,986 19,672 7,383 2,016 54, 350 30,977 57.0 Nebraska 56, 561 20,353 33, 820 18,990 6,087 184,085 103, 674 56.3 Kansas 85, 475 34,027 45, 670 24,026 5, 564 197, 772 87,030 44.0
South Atlantic 583,661 373,335 162, 898 139,381 15, 724 615,243 219,190 85.6 Delaware 5, 956 2, 973 2, 269 1,996 163 10, 539 4, 373 4L 5 Maryland 30,458 16, 716 11,749 10, 664 1,011 68,544 28,964 42.3 Dist. of Columbia 30 14 14 13 (0 287 99 34.6 Virginia 126,674 89, 385 30, 747 26,416 3,000 143, 013 48,187 33.7 West Virginia 76, 325 58,037 14,086 12, 823 1,385 48, 592 16, 369 33.7 North Carolina, 154, 235 96, 690 41, 585 34,080 2, 792 118, 747 42, 575 35.9 South Carolina 59, 867 35,317 19,420 16,052 1,942 64, 589 22, 525 34.9 Georgia 85,181 46, 632 30, 547 26, 609 4, 097 93, 535 36, 885 39.4 Florida 44,935 27, 571 12, 481 10, 728 1,333 67,397 19, 211 28.5
East South Central 508, 420 310, 684 161, 773 137, 040 14, 864 482,639 184,239 38.2 Kentucky 168,604 115,683 43, 537 37, 201 3, 755 169,446 62, 607 36.9 Tennessee 147,443 97, 592 40,082 32,970 3,172 129, 561 47, 305 36.5 Alabama 95,107 48, 598 38, 883 31,923 3,700 83,557 33, 524 40.1 Mississippi _ 97, 266 48, 811 39, 271 34,946 4, 237 100,075 40, 803 40.8
West South Central 452,216 254, 956 157, 756 114, 541 28, 604 693, 837 254, 709 36.7 Arkansas 100, 636 60, 651 30,138 24,434 2, 902 78,346 29, 235 37.3 Louisiana 60, 312 35, 893 19, 242 16, 370 1, 703 61, 556 23, 525 38.2 Oklahoma 81,086 36, 491 35,956 21, 623 3, 843 120,142 47, 243 39.3 Texas 210,182 121,921 72, 420 52,114 20,156 433, 793 154, 705 35.7
Mountain 173,772 86,260 77, 916 50,919 16, 373 385,164 149,477 38.8 Montana — __ 29,884 13, 681 14,784 7, 444 3, 657 53, 741 20, 771 38.7 Idaho 32,225 12, 424 17,982 13,811 2,346 102,649 40,621 39.6 Wyoming 11,125 4, 209 6, 431 3, 500 2,172 28,008 10, 355 37.0 Colorado... 31,827 13, 387 16,601 10, 591 3, 385 76,959 32, 494 42.2 New Mexico 28,030 20,110 6,272 3,700 2,086 27,312 8, 299
8, 987 30.4
Arizona 15, 835 11,030 3,648 2, 621 515 26,-906 8, 299 8, 987 33.4
Utah 21,906 9, 790 11,140 8,356 1,564 55,123 22, 324 40.5 Nevada 2,940 1, 629 1,058 896 648 14,466 5, 625 38.9
Pacific 220, 532 102,946 108,751 89, 521 26, 686
10, 395 867,647 307, 782 35.5 Washington 66, 561 33,135 31,952
89, 521 26, 686 2, 502 159,765 58,412 36.6
Oregon 50,137 23, 246 24, 527 19, 532 3, 592 138,176 48, 465 35.1 California 103,834 46,565 52,272 43,303 4, 301 569, 706 200,905 35.3
FARMS OPERATED BY ALL FULL OWNERS RE-PORTING AMOUNT OF MORTGAGE DEBT
1 Less than 500 acres. Source: Department of Commerce, Bureau of the Census; Sixteenth Census Reports, Agriculture,
Vol. III.

FARM MORTGAGES 597 N o . 6 5 1 . — M O R T G A G E D F A R M S — N U M B E R A N D A M O U N T O F M O R T G A G E D E B T ,
B Y T E N U R E O F O P E R A T O R , B Y S T A T E S : 1 9 3 0 A N D 1 9 4 0
[Data in tables 651-653 are based on census returns and cooperative surveys by Bureau of Census and Bureau of Agricultural Economics. As the data include estimates they are not comparable with data in tables 646-650]
DIVISION AND STATE
NUMBER OF MORTGAGED FARMS FARM MORTGAGE DEBT (THOUSANDS OF DOLLARS)
1940 Percent of total farms 1940
1930, total Man-
agers and ten-ants
1930, total Manag-
Total Owners 1
Man-agers and ten-ants
1930 1940 Total Owners ̂ ers and tenants
2, 523,223 2, 363, 739 1,614, 728 749, Oil 40.1 38.8 9,630, 768 6, 586, 399 4,459,040 2,127,859
56,483 62, 880 58, 622 4, 258 45.2 46.5 171, 708 150,499 131,070 19,429 13, 388 13,862 13, 204 658 34.3 35.6 27, 613 24, 757 23, 329 1,428 5, 746 7, 048 6, 522 526 38.6 42.6 11,756 11, 220 9, 957 1,263
13,192 12, 587 11, 596 991 53.0 53.4 35, 365 27, 814 24, 073 3,741 13,873 17,152 15, 922 1,230 54.2 53.8 48, 984 45,845 40, 077 5,768
689 .1, 258 1,199 1,137 62 37.9 39.8 4, 632 4,121 3, 432 5,768
689 9, 026 11, 032 10, 241 791 52.5 52.1 43, 358 36, 742 30, 202 6, 540
144, 576 139, 627 125,423 14, 201 6, 559
40.4 40. 1 456,463 372,155 312, 853 59,302 72, 472 70, 580 64, 021
14, 201 6, 559 45.4 46.1 233, 791 191, 786 163, 475 28, 311
12, 890 12, 834 11, 375 1,459 50.8 49.7 54,180 48, 791 40, 085 8, 706 59, 214 56, 213 50, 030 6,183 34.3 33.3 168, 492 131,578 109,293 22, 285
438,141 430, 732 351, 577 79,155 45.3 42.8 1, 883, 614 1,425, 539 1,003, 075 422,464 78,121 86, 586 71,134 15, 452 35.6 37.0 272, 738 239, 059
236, 266 173, 060 65, 999
82, 542 86, 600 67, 211 19, 389 45.5 46.9 269, 913 239, 059 236, 266 153, 549 82, 717
87, 322 74, 390 51, 898 22, 492 40.7 34.9 614, 059 418, 970 234, 752 184, 218 82, 911 85, 321 75, 228 10, 093 49.0 45.5 221, 432 174, 308 143, 930 30, 378
107, 245 97,835 86,106 11, 729 59.0 52.4 505, 472 356, 936 297, 784 59,152 563, 061 494,418 358,794 135, 624 50.6 45.3 3, 570, 279 2,173, 966 1,417, 556 756,410 93, 936 95, 594 75, 899 19, 695 50.7 48.4 476, 210 375, 990 275, 617 100, 373
112, 600 102,793 69, 309 33, 484 52.4 48.2 1,196,197 705, 589 440, 504 265, 085 114, 911 108, 703 81,117 27, 586 44.9 42.4 442, 820 229, 377 160, 918
98, 494 68, 459
49,124 33, 635 27,447 6,188 63.0 45.5 239, 772 141, 230 160, 918 98, 494 42, 736
46, 041 29, 700 20, 911 8, 789 55.4 41.0 293, 080 127, 706 77, 018 50, 688 67, 953 54, 246 35, 267 18, 979 52.5 44.8 510, 453 309, 826 185, 566 124, 260 78, 496 69, 747 48, 844 20, 903 47.3 44.6 411, 747 284, 248 179, 439 104,809
298,212 297, 795 177, 907 119, 888 28.2 29.2 519, 348 405, 057 273, 641 131,416 3, 732 3, 272 2, 597 675 38.4 36.4 9, 581 7,957 6,123 1,834
16, 404 15, 781 12, 584 3,197 37.9 37.4 50, 377 46, 675 35, 013 11, 662 39, 039 43, 415
19,192 32, 412 11, 003 22.9 24.8 91, 000 72, 299 58, 373
19, 001 13, 926 2, 968 15,182
43, 415 19,192 14, 907 4,285 18.4 19.3 26,177 21, 969
58, 373 19, 001
13, 926 2, 968
78, 070 80, 910 46, 623 34, 287 27.9 29.1 111, 880 90, 071 55, 660 34, 411 50, 791 40, 792 21,196
33, 688 19, 596 32.2 29.7 64, 433 45, 948 29, 004 16, 944
79, 663 74, 033 21,196 33, 688 40, 345 31.2 34.3 113, 060 82, 037 45, 420 36, 617
15, 331 20, 400 13, 900 6,500 26.0 32.8 52,840 38,101 25, 047 13, 054 317, 958 374, 352 174, 604 199,748 29.9 36.6 432, 732 384, 094 229, 531 154,563 59, 064 67, 387 46,104 21,283 24.0 26.6 116, 250 109, 253 74, 797 34, 456 59, 866 89,890
74, 618 42,921 31, 697 24.4 30.1 115, 280 92, 614 58, 903 33, 711 59, 866 89,890 97, 204 42, 217 54. 987 34.9 41.9 97, 890 81, 859 43, 566 38, 293
109,138 135,143 43, 362 91, 781 34.9 46.4 103, 312 100, 368 52, 265 48,103 451,492 331,172 172, 503 158,669 40.9 34.3 1,109, 328 713, 036 404, 070 808, 966 93, 518 72, 916 33, 392 39, 524 38.6 33.7 99, 085 72, 513 39, 881 32, 632 55, 030 51,843 21,137 30, 706 34.1 34.6 63, 838 55, 098 32, 045 23, 053
103,863 69, 523 39,869 29, 654 51.0 38.7 274, 971 153, 679 89, 854 63,825 199, 081 136,890 78,105 58, 785 40.2 32.7 671, 434 431, 746 242, 290 189, 456 117,850 100, 091 82,059 18,032 48.8 42.9 575,012 357,190 255, 277 101, 913 25, 263 18,143 15, 450 2, 693 53.2 43.4 129, 744 66,118 47, 298 18,820 23, 523 23, 647 19, 045 4, 602 56.4 54.2 115, 547 78, 763 59, 342 19,421 8, 683 7,973 6,700 1, 273 54.2 53.1 43, 337 34, 009 24, 351 9, 658
30, 657 22,818 17, 598 5, 220 51.1 44.4 138, 248 75, 005 53, 894 21, 111 7,876 8,934
4,551 6, 667 2,267 25.1 26.2 38, 954 27, 499 16, 967 10, 532
5, 710 8,934 4,551 3,826 725 40.3 24.6 41, 690 28,933 15, 354 13, 579
14, 618 12, 675 11, 656 1,019 53.8 49.9 51, 875 36, 650 31, 226 5, 424 1,520 1,350 1,117 233 44.2 37.8 15, 617 10, 213 6,845 3, 368
135,450 132,672 113,236 19,436 51.8 48.0 912, 284 604, 863 431, 967 172, 896 35,830 37, 650 32, 658 4, 992 50.5 46.1 161, 557 106, 857 84, 981 21, 876 28, 404 29, 716 25, 716 4, 000 51.5 48.1 135, 917 90, 421 73,128 17, 293 71, 216 65, 306 54,862 10, 444 52.5 49.2 614,810 407, 585 273,858 133,727
United States..
New England Maine N. Hampshi re -Vermont Massachusetts.. Rhode Island. . . Connecticut
Middle Atlantic. New York New Jersey Pennsylvania...
E. N. Central Ohio Indiana Illinois Michigan Wisconsin
W. N. Central Minnesota Iowa Missouri North Dakota... South Dakota... Nebraska Kansas
South Atlantic Delaware Maryland 2 Virginia West Virginia-__ N. Carolina S. Carolina Georgia Florida
E. S. Central Kentucky Tennessee Alabama Mississippi
W. S. Central Arkansas Louisiana Oklahoma Texas
Mountain Montana Idaho Wyoming Colorado New Mexico Arizona Utah Nevada
Pacific Washington. Oregon California...
1 The number of owned farms mortgaged includes farms operated by full owners and part owners. For mortgage debt, the debt on the rented portion of part-owner farms is included with tenants.
2 District of Columbia figures included with Maryland. Source: Dept. of Commerce, Bur. of the Census and Dept. of Agriculture, Bur. of Agricultural Econom-
ics (cooperative survey); Farm-Mortgage Indebtedness in the United States.
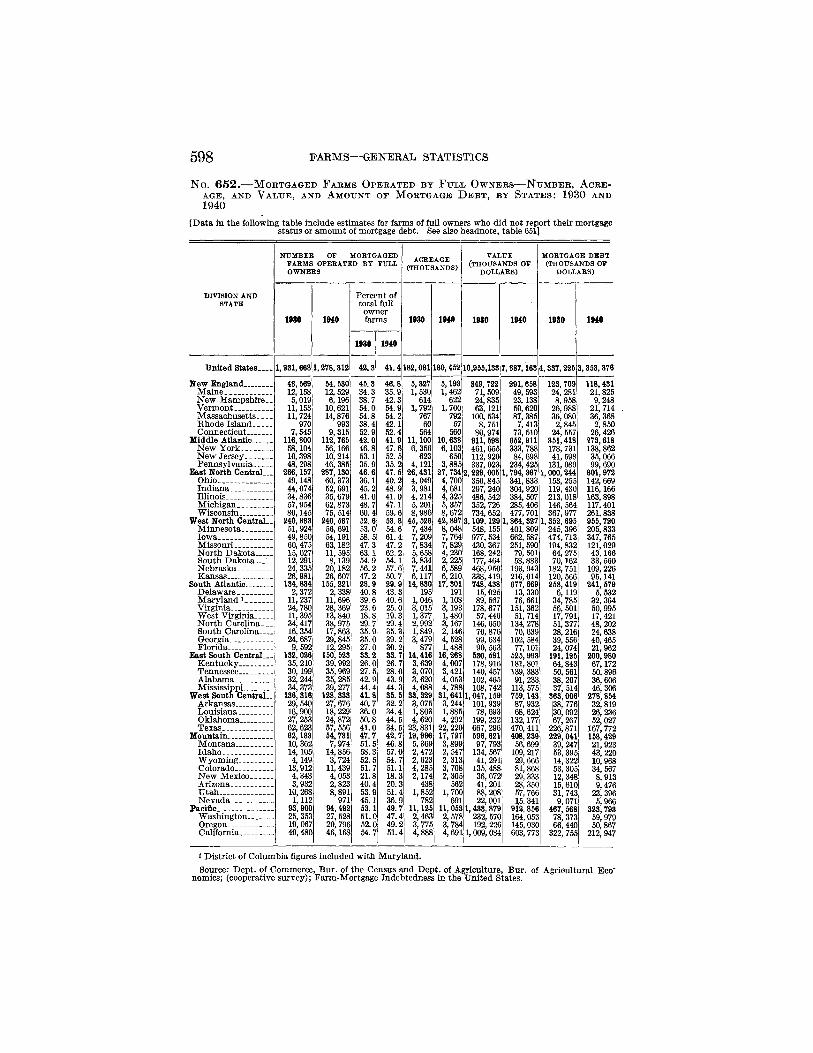
598 FARMS—GENERAL STATISTICS
N o . 6 5 2 . — M O R T G A G E D F A R M S O P E R A T E D BY F U L L O W N E R S — N U M B E R , A C R E -AGE, AND V A L U E , AND A M O U N T O F M O R T G A G E D E B T , BY S T A T E S : 1 9 3 0 AND 1 9 4 0
[Data in the following table include estimates for farms of full owners who did not report their mortgage status or amount of mortgage debt. See also headnote, table 651]
DIVISION AND STATE
NUMBER OF MORTGAGED FARMS OPERATED BY FULL OWNERS
ACREAGE (THOUSANDS)
VALUE (THOUSANDS OF
DOLLARS)
DIVISION AND STATE
1930 1940
Percent of total full
owner farms 1930 1940 1930 1940
DIVISION AND STATE
1930 1940
1930 1940
1930 1940 1930 1940
United States 1,231,668 1,278,312 42.3 4L 4 182.081 180,452 10,965,133 7,887,163
New England. 48, 569 54, 530 45.3 46.8 5,327 5,193 349,722 291,658 Maine 12,158 12, 529 34.3 35.9 1,630 1,462 71,509 49, 593 New Hampshire __ 5,019 6,196 38.7 42.3 614 622 24,835 23,138 Vermont 11,153 10,621 54.0 64.9 1,792 1,700 63,121 50,620 Massachusetts 11, 724 14,876 54.8 54.2 767 792 100, 534 87,385 Rhode Island 970 993 38 .4 42.1 60 67 8,751 7,413 Connecticut 7,645 9,315 52.9 52.4 564 560 80,974 73, 510
Middle Atlantic 116,800 112,765 42.0 4L 9 11,100 10,638 911, 598 652,911 New York 68,104 56,166 46 .8 47.6 6, 356
623 6 ,103 461,655 333,788
New Jersey. 10,398 10, 214 63 .1 52.5 6, 356
623 650 112, 920 84,698 Pennsylvania 48, 298 46, 385 35.9 35.2 4,121 3,885 337, 023 234, 425
East North Central... 266,157 287,130 46.6 47.5 26,431 27,734 2,228,005 1,794,367 Ohio 49,148 60, 373 36 .1 40.2 4,049
3,981 4 ,700 356,845 341, 833
Indiana 44, 074 52,691 45.2 4 8 . 9 4,049 3,981 4,681 297, 240 304, 920
Illinois 34,836 36,679 4L0 4L0 4, 214 4,325 486, 542 384, 507 Michigan 57, 954 62,873 48 .7 47.1 5,201 5,357 352, 726 285, 406 Wisconsin . . . 80,145 75, 514 60.4 59.6 8,986 8,672 734, 652 477, 701
West North Central.. 240, 883 240, 587 52.6 53.8 45, 526 42, 897 3,109,129 1,864,327 Minnesota 51,924 56, 691 53.0 54 .6 7, 434 8 ,048 548,155 401, 809 Iowa 49,850 64,191 58.5 6 L 4 7,209 7, 764 977, 534 662, 587 Missouri 60, 475 63,182 47.3 4 7 . 2 7,834 7,829 430, 367 251, 590 North Dakota 15,027 11, 595 6 3 . 1 6 2 . 2 5, 658 4 ,230 168, 242 79, 501 South Dakota™.- 12, 291 8,139 54.9 54.1 3,834 2,225 177, 464 58,883 Nebraska 24, 335 20,182 56.2 57.6 7,441 6,589 468,950 193, 943 Kansas _ 26,981 26, 607 47.2 50.7 6,117 6 ,210 338,419 216,014
South Atlantic 134, 834 155,221 28.9 29.9 14, 830 17,301 748,438 677,669 Delaware 2, 372 2, 338 4 0 . 8 4 3 . 3 195 191 15,025 13, 330 Maryland 1 11, 237 11, 696 39 .6 40 .6 1, 046 1,108 89, 567 76, 661 Virginia 24,780 28, 369 23.6 25 .0 3, 015 3,193 178, 677 151, 362 West Virginia 11, 395 13,840 18.8 19.3 1, 377 1,480 57,446 51,714 North Carolina 34, 417 38,975 29 .7 29.4 2,992 3,167 146, 650 134, 278 South Carolina.. . . 16, 354 17,863 35.9 35 .3 1,849 2,146 70,876 70, 639 Georgia 24, 687 29,845 35.0 39 .2 3, 479 4, 528 99, 634 102, 584 Florida 9,592 12,295 27.0 30 .2 877 1 ,488 90, 563 77,101
East South CentraL— 132,026 150, 523 33.2 33.7 14,416 16,268 530,581 525,993 Kentucky 35, 210 39, 992 26.0 26.7 3, 639 4,007 178, 916 181, 801 Tennessee 30,199 35,969 27.5 28 .0 3,070 3,421 140, 457 139, 383 Alabama 32, 244 35, 285 42.9 43.9 3,620 4,053 102, 465 91, 233 Mississippi
West South Centra l -34,373 39,277 44.4 44.3 4,088 4,788 108, 742 113, 575 Mississippi
West South Centra l - 136, 316 128,333 4L 8 35.5 33,329 31,641 1,047,159 759, 143 Arkansas 29, 540 27,676 40.7 32.2 3,076
1,803 3,244 101, 939 87, 932
Louisiana 16,900 18,229 36.0 34 .4 3,076 1,803 1,885 78, 693 68,624
Oklahoma 27, 253 24, 872 50.8 44.5 4,620 4,292 199, 232 132,177 Texas 62, 623 67, 556 4L0 34.6 23,831 22, 220 667, 296 470,411
Mountain... 62,183 54,731 47.7 42.7 19,996 17,727 596,621 408,239 Montana 10, 362 7,974 6L6 46.8 6,369 3,899 97,793 56, 699 Idaho 14,105 14,856 58.3 57.0 2,472 2,547 134, 567 109,217 Wyoming 4,149 3,724 52.5 64.7 2,623 2, 313 41, 291 29, 666 Colorado 13, 912 11,439 6L7 6 L 1 4,285 3, 708 135, 488 81,868 New Mexico 4, 343 4,053 2L8 18.3 2,174 2, 305 36, 072 29, 333 Arizona 3,932 2,823 40.4 20.3 438 562 41, 201 28, 350 Utah 10,268 8,891 53.9 5L4 1,852 1, 700 88, 208 57, 766 Nevada 1,112 971 45.1 36.9 782 691 22, 001 15,341
Pacific 93,900 94,492 53.1 49.7 11,12S 11,053 1,433, 879 912, 856 Washington 25, 353 27, 528 6 L 0 47.4 2,463 2, 578 232, 57C 164, 053 Oregon 19,067 20, 796 52.0 49.2 3, 775 3,784 192, 226 145, 030 California. 49,480 46,168 64.7 6 L 4 4,888 4,691 1,009,0S4 603,773
MORTGAGE DEBT (THOUSANDS OP
DOLLARS)
1930 1940
4 ,337 ,225 3 ,353 ,376
123, 709 24, 281 8, 958
2,845 24, 557
351.418 178, 731 41, 598
131, 089 ,000,244 153, 255 119, 430 213, 018 146, 564 367, 977
,352, 695 245, 396 474, 713 194,832 64, 275 70,162
182, 751 120, 566 258.419
6,119 34,785 56, 501 17,791 51, 377 28, 216 39, 556 24, 074
191,125 64,843 50, 561 38, 207 37, 514
363,006 (38, 776 ¡30,092 67,267
226,871 229,041 39, 247 53, 395 14, 322 53, 305 12, 348 15, 610 31, 743 9,071
467,568 78, 373 66, 440
322, 755
118,431 21,825 9,248
21, 714 36, 368 2,850
26, 426 273,618 138,862 35,066 99, 690
801,972 142,669 116,166 163,898 117,401 261, 838 955,720 205,833 347,765 121,029 43,166 33, 560
109, 226 95,141
241, 679 5,632
32, 364 60,995 17,421 48, 202 24, 638 40, 465 21,962
200,980 67,172 60,896 36,606 46, 306
278,854 32,819 26, 236 62,027
167,772 158,429 21,923 43,220 10,968 34, 567 8,913 9, 476
23, 396 5,966
323,793 59,979 60,867
212,947
1 District of Columbia figures included with Maryland. Source: Dept. of Commerce, Bur. of the Census and Dept. of Agriculture, Bur. of Agricultural Eco'
nomics; (cooperative survey); Farm-Mortgage Indebtedness in the United States.
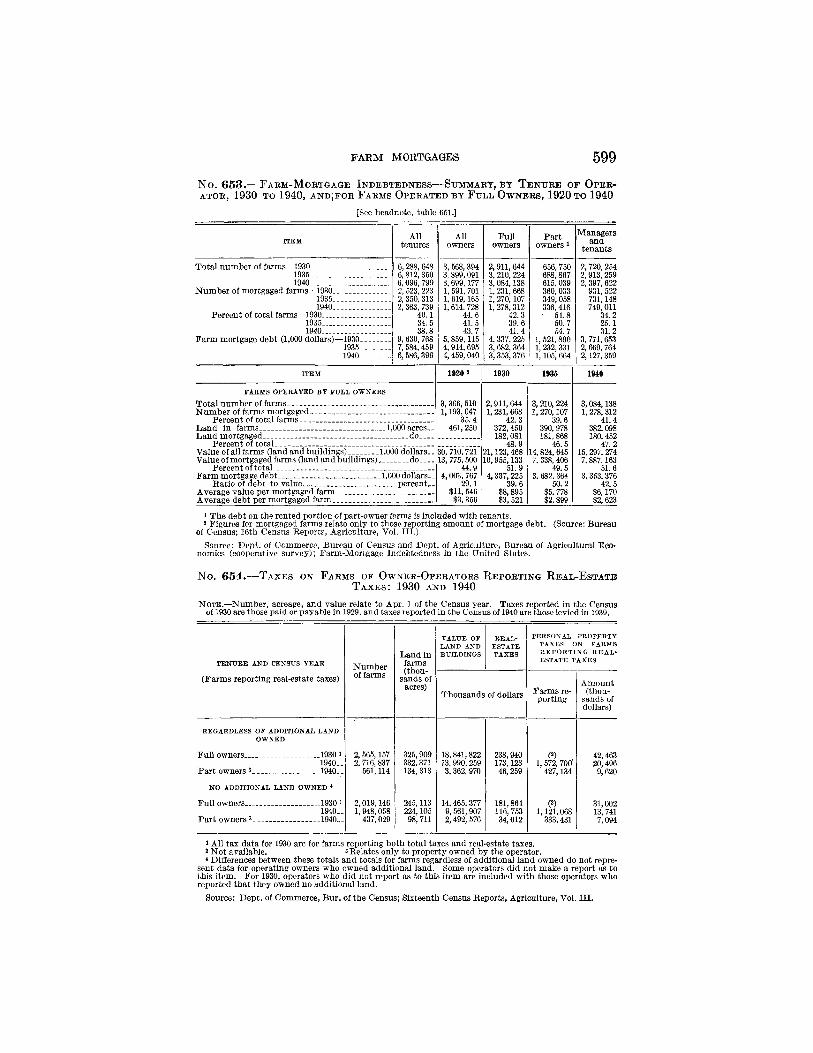
FARM MORTGAGES 599 N o . 6 5 3 . - F A R M - M O R T G A G E I N D E B T E D N E S S - — S U M M A R Y , B Y T E N U R E O F O P E R -A T O R , 1 9 3 0 T O 1 9 4 0 , A N D ^ F O R F A R M S O P E R A T E D B Y F U L L O W N E R S , 1 9 2 0 T O 1 9 4 0
[See headnote, table 651.]
ITEM All tenures
All owners
Full owners
Part owners i
Managers and
tenants
Total number of farms—1930 1935 1940
Number of mortgaged farms—1930 1935 1940
Percent of total farms—1930 1935 1940
Farm mortgage debt (1,000 dollars)—1930 1935 1940
6, 288, 648 6,812, 350 6,096, 799 2, 523, 223 2, 350, 313 2, 363, 739
40.1 34.5 38 8
9, 630, 768 7, 584, 459 6,586, 399
3, 568, 394 3,899,091 3, 699,177 1, 591, 701 1,619,165 1, 614, 728
44.6 4L 5 43.7
5, 859,115 4, 914,695 4, 459,040
2,911,644 3,210,224 3, 084,138 1, 231, 668 1, 270,107 1, 278, 312
42.3 39.6 41.4
4, 337, 225 3, 682, 364 3, 353, 376
656,750 688,867 615, 039 360, 033 349,058 336, 416 • 54.8
50.7 54.7
1, 521, 890 1, 232, 331 1,105, 664
2,720, 254 2, 913, 259 2, 397, 622
931, 522 731,148 749,Oil
34.2 25.1 3L2
3,771, 653 2, 669, 764 2,127, 359
ITEM 1920 2 1930 1935 1940
FARMS OPERATED BY FULL OWNERS
Total number of farms _ 3, 366, 510 1,193,047
35.4 461, 250
2,911, 644 1,231, 668
42.3 372,450 182,081
48.9 21,123, 468 10,955,133
51.9 4,337,225
39.6 $8,895 $3, 521
3, 210, 224 1,270,107
39.6 390,978 181,868
46.5 14,824, 645 7, 338, 406
49.5 3, 682, 364
50.2 $5, 778 $2,899
3,084,138 1,278, 312
4L4 382, 098 180, 452
47.2 15, 297, 274 7,887,163
51.6 3, 353, 376
42.5 $6,170 $2, 623
Number of farms mortgaged Percent of total farms
Land in farms 1.000 acres__ Land mortgaged do
3, 366, 510 1,193,047
35.4 461, 250
2,911, 644 1,231, 668
42.3 372,450 182,081
48.9 21,123, 468 10,955,133
51.9 4,337,225
39.6 $8,895 $3, 521
3, 210, 224 1,270,107
39.6 390,978 181,868
46.5 14,824, 645 7, 338, 406
49.5 3, 682, 364
50.2 $5, 778 $2,899
3,084,138 1,278, 312
4L4 382, 098 180, 452
47.2 15, 297, 274 7,887,163
51.6 3, 353, 376
42.5 $6,170 $2, 623
Percent of total _ _ _
2,911, 644 1,231, 668
42.3 372,450 182,081
48.9 21,123, 468 10,955,133
51.9 4,337,225
39.6 $8,895 $3, 521
3, 210, 224 1,270,107
39.6 390,978 181,868
46.5 14,824, 645 7, 338, 406
49.5 3, 682, 364
50.2 $5, 778 $2,899
3,084,138 1,278, 312
4L4 382, 098 180, 452
47.2 15, 297, 274 7,887,163
51.6 3, 353, 376
42.5 $6,170 $2, 623
Value of all farms (land and buildings) 1,000 dollars-Value of mortgaged farms (land and buildings) do
Percent of total.
30, 710, 721 13,775, 500
44.9 4,003,767
29.1 $11, 546 $3, 356
2,911, 644 1,231, 668
42.3 372,450 182,081
48.9 21,123, 468 10,955,133
51.9 4,337,225
39.6 $8,895 $3, 521
3, 210, 224 1,270,107
39.6 390,978 181,868
46.5 14,824, 645 7, 338, 406
49.5 3, 682, 364
50.2 $5, 778 $2,899
3,084,138 1,278, 312
4L4 382, 098 180, 452
47.2 15, 297, 274 7,887,163
51.6 3, 353, 376
42.5 $6,170 $2, 623
Farm mortgage debt 1,000 dollars . Ratio of debt to value percent..
Average value per mortgaged farm Average debt per mortgaged farm
30, 710, 721 13,775, 500
44.9 4,003,767
29.1 $11, 546 $3, 356
2,911, 644 1,231, 668
42.3 372,450 182,081
48.9 21,123, 468 10,955,133
51.9 4,337,225
39.6 $8,895 $3, 521
3, 210, 224 1,270,107
39.6 390,978 181,868
46.5 14,824, 645 7, 338, 406
49.5 3, 682, 364
50.2 $5, 778 $2,899
3,084,138 1,278, 312
4L4 382, 098 180, 452
47.2 15, 297, 274 7,887,163
51.6 3, 353, 376
42.5 $6,170 $2, 623
1 The debt on the rented portion of part-owner farms is included with tenants. 2 Figures for mortgaged farms relate only to those reporting amount of mortgage debt. (Source: Bureau
of Census; 16th Census Reports, Agriculture, Vol. III.) Source: Dept. of Commerce, Bureau of Census and Dept. of Agriculture, Bureau of Agricultural Eco-
nomics (cooperative survey); Farm-Mortgage Indebtedness in the United States.
N O . 6 5 4 . — T A X E S O N F A R M S O F O W N E R - O P E R A T O R S R E P O R T I N G R E A L - E S T A T E T A X E S : 1 9 3 0 A N D 1 9 4 0
NOTE.—Number, acreage, and value relate to Apr. 1 of the Census year. Taxes reported in the Census of 1930 are those paid or payable in 1929, and taxes reported in the Census of 1940 are those levied in 1939.
TENURE AND CENSUS YEAR
(Farms reporting real-estate taxes) Number of farms
Land in farms (thou-
sands of acres)
VALUE OF LAND AND BUILDINGS
REAL-ESTATE TAXES
PERSONAL PROPERTY TAXES ON FARMS REPORTING REAL-ESTATE TAXES TENURE AND CENSUS YEAR
(Farms reporting real-estate taxes) Number of farms
Land in farms (thou-
sands of acres)
Thousands of dollars Farms re-porting
Amount (thou-
sands of dollars)
REGARDLESS OF ADDITIONAL LAND OWNED
Full owners ..1930 i 1940..
Part owners s 1940..
NO ADDITIONAL LAND OWNED *
Full owners 1930 i 1940..
Part owners 3 .1940__
2, 565,157 2, 716,837
561,114
2,019,146 1,948,058
437,029
325,909 332,371 134, 313
245,113 224,105 98, 711
18,841,822 13, 990,259 3, 362,970
14,465,377 9, 561, 907 2,492, 576
238,940 173,123 46,259
181,864 116, 753 34,012
(2) , 1,572, 700
427,134
(2) 1,121,068
333,431
42,463 20, 496 9,620
31,002 13,741 7,094
1 All tax data for 1930 are for farms reporting both total taxes and real-estate taxes. 2 Not available. s Relates only to property owned by the operator. 4 Differences between these totals and totals for farms regardless of additional land owned do not repre-
sent data for operating owners who owned additional land. Some operators did not make a report as to this item. For 1930, operators who did not report as to this item are included with those operators who reported that they owned no additional land.
Source: Dept. of Commerce, Bur. ofthe Census; Sixteenth Census Reports, Agriculture, Vol. III.

600 FARMS—GENERAL STATISTICS
N o . 6 5 5 . — T A X E S ON F A R M S O P E R A T E D BY F U L L O W N E R S , BY S T A T E S : 1 0 4 0
NOTE.—Acreage in thousands; all money figures, except average tax per acre, in thousands of dollars. Number, acreage, and value relate to Apr. 1 of the Census year. Taxes reported are those levied in 1939.
FARMS OPERATED BY FULL OWNERS REPORTING REAL-ESTATE TAXES
All farms
DIVISION AND STATE opera Leu by full owners, number Number
of farms Acre-age
Value of land and buildings
Real-estate taxes, 1939
Aver-age tax per acre
Ratio of tax
to value (per-cent)
Number of farms
Per-sonal-prop-erty taxes, 1939
United States 3, 084,138 2,716, 837 332, 571 13,990,259 173,123 $0. 62 L24 1, 616, 795 21, 069 New England 116,459 108, 725 10,055 514,216 11,336 L 13 2. 20 74, 813 1,663
Maine. 34, 887 32, 873 3, 482 101,397 2, 928 .84 2. 89 26, 012 473 New Hampshire 14, 648 13, 273 1,342 45, 840 1,206 .90 2.63 7, 523 146 Vermont 19, 342 18, 330 2, 670 80, 519 1, 439 .54 1.79 13, 334 332 Massachusetts 27, 446 25, 457 1,379 147, 304 3,739 2. 71 2.54 15, 325 375 Rhode Island 2, 358 2,173 143 14,819 212 L48 L43 1,307 34 Connecticut 17, 778 16, 619 1,040 124, 337 1,813 L74 L46 11,312 194
Middle Atlantic 269,199 252, 528 22,181 1, 296, 660 23, 918 LOS L8é 25, 009 611 New York. 117,972 111, 582 11,446 604,092 12,080 LOO 2.00 (2) (2) New Jersey 19,448 17, 906 1,006 134, 579 2, 603 2.59 L93 10, 261 286 Pennsylvania 131, 779 123, 040 9, 730 556, 980 9,236 .96 L66 14, 748 226
East North Central ... . 605, 092 564, 883 51, 894 3, 213, 877 38, 696 .76 L20 367, 797 6,110 Ohio 150,124 139, 562 10, 974 727, 430 7,745 .71 1.06 83,192 661 Indiana 107, 818 99, 495 8, 315 526, 376 6, 621 .80 1.26 94, 972 1,591 Illinois. . 87; 004 79, 341 8,477 682, 334 8, 379 .99 1.23 74, 659 1, 289 Michigan. 133,545 124, 567 10, 507 544,116 4, 914 .47 .90 4,111 56 Wisconsin 126, 601 121,918 13, 621 733, 621 11,036 .81 1.50 110,863 1, 615
West North Central 447, 208 409, 810 67, 773 2, 848, 617 37, 532 .66 1.32 358,355 8,117 Minnesota . 103, 866 98, 361 12, 899 629, 283 8, 801 .68 1.40 73, 934 1,111 Iowa 88, 206 77, 693 10, 576 897, 814 11, 447 1.08 1.27 67, 320 1,079 Missouri 133, 927 122, 720 14, 898 472,173 4, 886 .33 1.03 113, 299 828 North Dakota 18, 651 17,191 6,157 114, 710 1,920 .31 1.67 16, 843 262 South Dakota 15,053 12, 575 3, 431 86, 928 1,434 .42 1.67 12, 500 261 Nebraska 35, 064 33,070 9, 734 291,420 3, 907 .40 1.34 32, 643 738 Kansas . 52, 441 48, 200 10, 078 357, 289 6,138 .51 1.44 41,816 848
South Atlantic 519,108 425, 600 40, 074 1, 547, 610 12, 738 .32 .82 320,604 2, 609 Delaware 5,401 4, 773 389 26, 956 125 .32 .46 514 6 Maryland 28, 737 24,933 2,092 147, 650 1,803 .86 1.22 14,303 193 Dist. of Columbia 29 24 (3) 429 5 16.16 L 18 11 Virginia 113, 510 107, 244 9, 937 427,808 2, 728 .27 .64 99, 366 732 West Virginia 71, 542 64, 917 5, 853 184, 878 1,035 .18 .56 46,916 232 North Carolina 132, 451 117, 979 8, 809 338, 292 3, 303 .37 .98 78, 272 676 South Carolina 50, 643 45, 578 4, 694 149, 939 1, 515 .32 1.01 38, 705 346 Georgia 76.103 34, 599 5, 730 128, 582 1, 080 .19 .84 32, 523 307 Florida 40, 692 25, 553 2, 571 143, 077 1,144 .44 .80 9, 995 120
East South Central 447, 286 400, 377 37, 684 1,146,157 11,937 .32 L04 102,446 824 Kentucky 149, 695 137, 771 11. 904 449, 383 3, 877 .33 .86 59,127 438 Tennessee 128, 591 118.167 9,764 357,983 3, 991 .41 L l l 2, 927 70 Alabama 80, 303 70, 768 7, 646 161, 261 1,427 .19 .89 28, 983 168 Mississippi 88,697 73,671 8, 370 177, 530 2,641 .32 L 49 11, 408 148
West South Central 361,296 280,436 54,779 1,304,087 11, 179 .20 .86 210, 914 2,104 Arkansas __ 85, 842 76,484 7, 849 173, 746 1,727 .22 .99 71, 292 667 Louisiana 52, 936 14, 357 2, 256 78, 401 968 .43 1.23 1,700 26 Oklahoma 55, 859 41,114 6, 446 201, 616 ' 1, 830 .28 .91 31, 329 312 Texas 166, 659 148,481 38, 227 860, 327 6, 654 .17 .78 106, 693 1,208
Mountain 128,268 98, 606 29, 591 606, 642 8, 451 .29 L39 70, 679 1,817 Montana 17,028 14, 835 6,646 89, 078 1,281 .19 L44 12, 908 331 Idaho 26,050 22,960 3, 727 148,099 2,132 .57 L44 14,480 297 Wyoming 6,814 5, 344 3,313 39,117 366 .11 .94 5,019 144 Colorado. 22, 385 20, 381 5, 939 125, 925 2,012 .34 L60 13, 381 412 New Mexico 22,164 12, 786 5,074 53,445 503 .10 .94 7,236 126 Arizona.. 13, 889 4, 773 1,092 40,963 605 .56 L48 3,353 120 Utah 17, 310 15, 559 2, 583 86,093 1,266 .49 L47 12, 544 274 Nevada 2,628 1,968 1,216 23,822 287 .24 L20 1,758 112
Pacific 190,222 175,872 18, 641 1, 513, 602 17, 338 .94 L15 86,179 1,613 Washington 58,083 55,137 4, 450 285,222 2, 336 .52 .82 16, 426 197 Oregon :__ 42,296 38,934 6,026 237, 626 3,096 .51 L30 25, 927 382 California 89, 843 81,801 8,066 990, 756 11,906 1.48 L20 43. 826 934
FARMS OPERATED BY FULL OWNERS REPORTING PER-SONAL-PROPERTY
TAXES 1
1 Figures shown in this table are for all farms operated by full owners reporting personal property taxes, while those in the preceding table are for farms reporting both real-estate and personal property taxes.
2 Personal property is not liable to taxation for State or local purposes. » Less than 500.
V I^III^ Department of Commerce, Bureau of the Census; Sixteenth Census Reports, Agriculture,
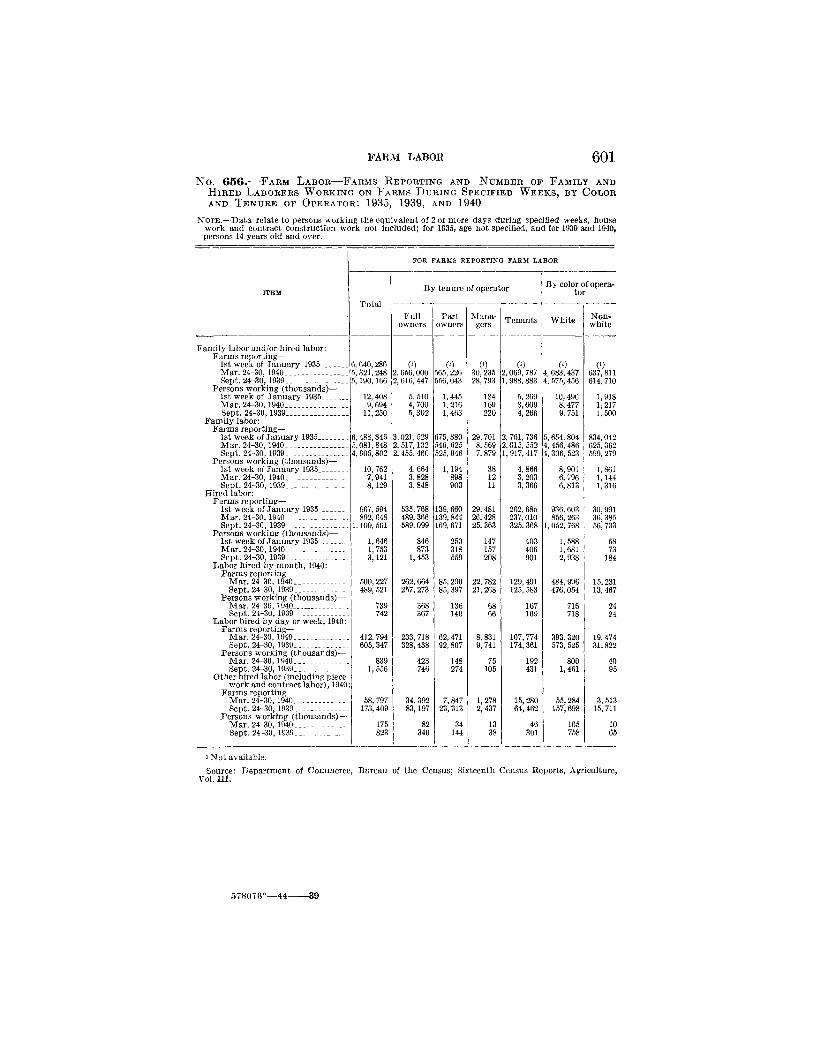
FARM LABOR 601 N o . 6 5 6 . — F A E M L A B O R — F A R M S R E P O R T I N G A N D N U M B E R O F F A M I L Y A N D
H I R E D L A B O R E R S W O R K I N G O N F A R M S D U R I N G S P E C I F I E D W E E K S , B Y C O L O R A N D T E N U R E O F O P E R A T O R : 1 9 3 5 , 1 9 3 9 , A N D 1 9 4 0
NOTE.—Data relate to persons working the equivalent of 2 or more days during specified weeks, house work and contract construction work not included; for 1935, age not specified, and for 1939 and 1940, persons 14 years old and over.
FOR FARMS REPORTING FARM LABOR
Total
By tenure of operator
Full owners
Part owners
Mana-gers Tenants
By color of opera-tor
White Non-white
Family labor and/or hired labor: Farms reporting—
1st week of January 1935 Mar. 24-30, 1940 Sept. 24-30, 1939
Persons working (thousands)— 1st week of January 1935 Mar. 24-30,1940 Sept. 24-30,1939
Family labor: Farms reporting—
1st week of January 1935 Mar. 24-30,1940 Sept. 24-30, 1939
Persons working (thousands)— 1st week of January 1935 Mar. 24-30, 1940 Sept. 24-30,1939
Hired labor: Farms reporting—
1st week of January 1935 Mar. 24-30,1940 Sept. 24-30, 1939
Persons working (thousands)— 1st week of January 1935 Mar. 24-30,1940 Sept. 24-30, 1939
Labor hired by month, 1940: Farms reporting—
Mar. 24-30, 1940 Sept. 24-30, 1939
Persons working (thousands)— Mar. 24-30, 1940 Sept. 24-30, 1939
Labor hired by day or week, 1940: Farms reporting—
Mar. 24-30, 1940 Sept. 24-30, 1939
Persons working (thousands)— Mar. 24-30, 1940 Sept. 24-30, 1939
Other hired labor (including piece work and contract labor), 1940:
Farms reporting— Mar. 24-30, 1940 Sept. 24-30, 1939
Persons working (thousands)— Mar. 24-30, 1940 Sept. 24-30, 1939
6, 640, 286 5, 321, 248 5,190,166
12,408 9,694
11,250
6, 488,846 5,081,848 4, 905,802
10,762 7,941 8,129
967, 594 892,648
1,109, 501
1,646 1,753 3,121
500,227 489, 521
739 742
412, 794 605, 347
1,556
58,797 173, 409
175
2,656,000 2, 616, 447
5,510 4,700 5, 302
3,021,529 2, 517,102 2, 455,460
4, 664 3,828 3,848
535,768 489, 366 589,099
846 873
1,453
262,664 257,273
368 367
233, 718 328,438
423 746
34,392 83,197
82 340
(0 565, 226 556,043
1,445 1,216 1,463
675,880 540,625 525, 046
1,194 898 903
139,660 139,844 169, 671
250 318 559
85,290 85, 397
136 140
62, 471 92,807
148 274
7,847 23,313
34 144
0) 30,235 28, 793
184 160 220
29,701 8, 569 7,879
29,481 26,428 25, 363
147 157
22,782 21,268
831 ), 741
75 105
1,278 2,437
(0 2,069, 787
5,269 3,609 4,266
2, 761, 736 2,015, 552 1,917, 417
4, 866 3,203 3, 366
262,685 237,010 325, 368
403 406 901
129,491 125, 583
167 169
107,774 174,361
192 431
15, 280 64,462
46 301
(0 4, 683, 437 4, 575,456
10, 490 8, 477 9, 751
5,654,804 4,456,486 4, 306, 523
8,901 6, 796 6,813
936,603 856, 263
1,052, 768
1,588 1,681 2, 938
484,996 476,054
716 718
393,320 573,525
800 1,461
55,284 157,698
165 758
(0 637,811 614, 710
1,918 1,217 1,500
834,042 625, 362 599,279
1,861 1,144 1,316
30,991 36, 385 56,733
58 73
184
15,231 13,467
24 24
19,474 31,822
40 95
3, 513 15, 711
10 65
1 Not available. Source: Department of Commerce, Bureau of the Census; Sixteenth Census Reports, Agriculture,
Vol. III.
578076°—44- - 8 9
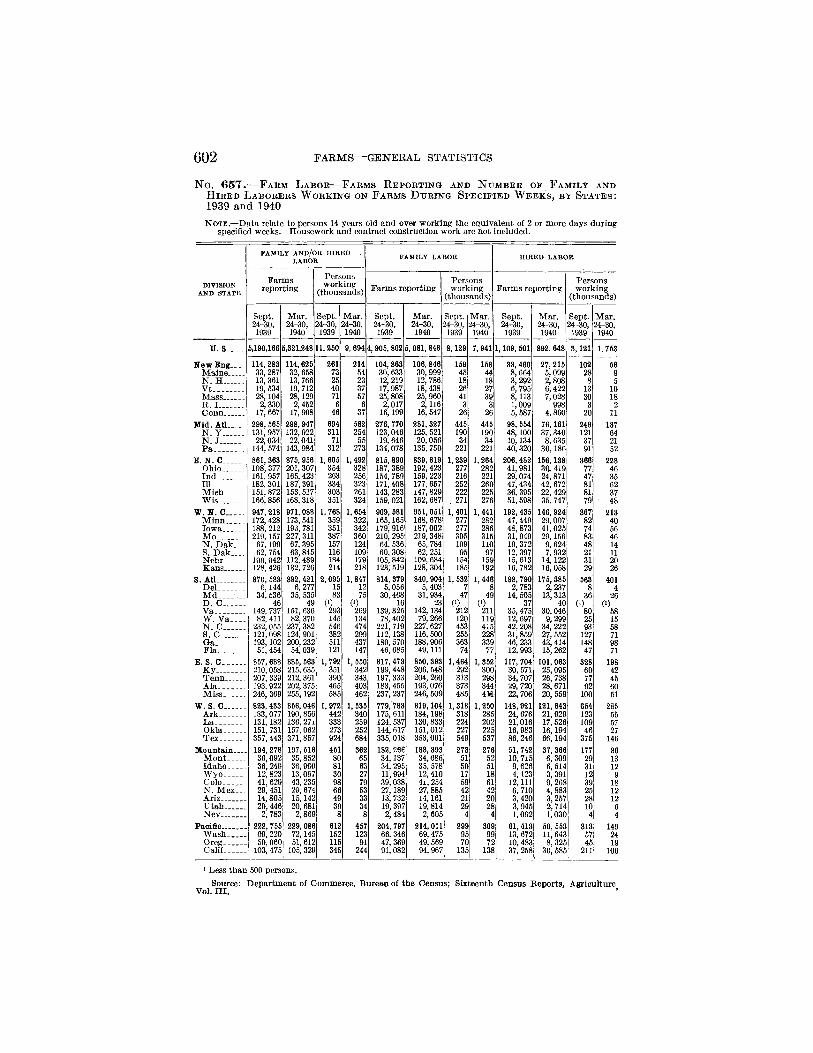
602 FARMS—GENERAL STATISTICS
N o . 6 5 7 . — F A R M L A B O R — F A R M S R E P O R T I N G A N D N U M B E R O F F A M I L Y A N D H I R E D L A B O R E R S W O R K I N G ON F A R M S D U R I N G S P E C I F I E D W E E K S , B Y S T A T E S : 1939 and 1940 NOTE.—Data relate to persons 14 years old and over working the equivalent of 2 or more days during
specified weeks. Housework and contract construction work are not included.
DIVISION AND STATE
FAMILY AND/OR HIRED LABOR
Farms reporting
Persons working
(thousands)
FAMILY LABOR
Farms reporting
Sept. Mar. Sept. Mar. Sept. Mar. Sept. Mar. Sept. Mar. Sept. Mar. 24-30, 24-30, 24-30, 24-30, 24-30, 24-30, 24-30, 24-30, 24-30, 24-30, 24-30, 24-30, 1939 1940 1939 1940 1939 1940 1939 1940 1939 1940 1939 1940
XJ.S 5,190,166 5,321,248 11,250 9, 694 4,905, 802 5,081, 848 8,129 7, 941 1,109, 501 892, 648 3,121 1,753
New Eng 114,283 114, 625 261 214 104, 863 106, 846 159 158 33, 460 27,215 102 56 Maine 33, 287 32,658 73 54 30, 633 30,999 45 44 8, 664
3, 292 5,099 28 9
N. H 13, 361 13, 766 25 23 12, 219 12, 786 18 18 8, 664 3, 292 2,808 8 5
Vt 19, 534 19,712 40 37 17,987 18,438 26 27 6,795 6,422 13 10 Mass 28,104 28,129 71 57 25,808 25, 960 41 39 8,113 7,028
998 30 18
R. I 2, 330 2, 452 6 6 2,017 2,116 3 3 1,009 7,028
998 3 2 Conn 17, 667 17,908 46 37 16,199 16, 547 26 26 5,587 4,860 20 11
Mid. Atl 298,565 298,947 694 582 276, 770 281,327 445 445 98, 554 76,161 249 137 N. y 131, 957 132,922 311 254 123,046 125,521 190 190 48,100 37, 340 121 64 N. J 22,034 22,041 71 55 19, 646 20,056 34 34 10,134 8, 635 37 21 Pa 144,574 143,984 312 273 134,078 135, 750 221 221 40, 320 30,186 91 52
E. N. C 861, 363 875, 956 1,605 1,492 815, 890 839,819 1,239 1,264 206, 482 156, 138 366 228 Ohio 198,377 201, 307 354 328 187, 389 192, 423 277 282 41,981 30, 419 77 46 Ind 161, 957 165, 423 263 256 154, 789 159, 223 216 221 29,074 24, 871 47 35 111 182, 301 187,391 334 323 171, 408 177,667 252 260 47,434 42, 672 81 62 Mieh 151,872 153,517 303 261 143, 283 i47,829 222 225 36, 395 22,429 81 37 Wis 166,856 168, 318 351 324 159,021 162,687 271 276 51,598 35,747 79 48
W. N. C 947, 218 971,088 1,768 1,654 909, 581 951,051 1,401 1,441 192, 435 146,924 367 213 Minn 172,428 173, 541 359 322 165,165 168,678 277 282 47, 449 29,007 82 40 Iowa 188, 212 193, 781 351 342 179, 916 187,002 277 286 48, 873 41, 025 74 56 Mo 219,157 227, 311 387 360 210, 295 219, 348 305 315 31,949 29,156 83 46 N. Dak.._ 67,199 67, 395 157 124 64, 536 65, 784 109 110 19, 372 9, 624 48 14 S. Dak . . . . 62, 754 63, 845 116 109 60, 308 62, 251 95 97 12, 397 7, 932 21 11 Nebr 109,042 112,489 184 179 105, 842 109, 684 154 159 15, 613 14,122 31 20 Kans. . . . 128, 426 132, 726 214 218 123, 519 128, 304 185 192 16, 782 16, 058 29 26
S. Atl 870,583 892,421 2,095 1,847 814, 379 840, 904 1,532 1,446 8
198, 790 175, 385 563 401 Del 6,144 6, 277 15 12 5,056 5,403 7
1,446 8 2,783 2,237 8 4
M d . . . . . . . 34, 536 35,535 83 75 30,468 31,934 47 49 14, 505 13,313 36 26 D. C 46 49 0) (0 16 23 0) (0 37 40 0) (0 Va 149, 737 151, 636 293 269 139, 325 142,134 212 211 35, 475 30,046 80 58 W. V a . . . . 82, 411 82, 370 145 134 78, 402 79, 266 120 119 12, 697 9, 299 25 15 N. C 232,055 237,382 546 474 221, 719 227, 627 453 4x5 42,208 34, 222 93 58 s. c 121,098 124,901 382 299 112,138 116, 500 255 228 31,859 27, 552 127 71 Q a . . . . . . . . 193,102 200, 232 511 437 180, 570 188,906 363 339 46, 233 43,414 148 98 Fla 51, 454 54,039 121 147 46, 685 49, 111 74 77 12,993 15, 262 47 71
E. S. C 857, 688 885, 563 1,792 1, 550 817, 473 850, 393 1,464 1,352 117, 704 101,063 328 198 Ky 210,058 215,635 351 342 199,448 206,548 292 300 30, 571 25,095 60 42 Tenn 207, 339 212, 361 390 343 197, 333 204, 260 313 298 34,707 26, 738 77 45 Ala 193, 922 202, 375 465 403 183, 455 193,076 373 344 29, 720 28,671 92 60 Miss 246, 369 255,192 585 462 237,237 246, 509 485 4M 22,706 20, 559 100 51
W. S. C 823,433 856,046 1,972 1,535 779,783 819,104 1,318 1,250 148,921 121, 843 654 285 Ark 183,077 190,856 442 340 175, 611 184,198 318 285 24, 676 21, 929 123 55 La 131,182 136.27i 333 259 124, 537 130,833 224 202 21,016 17, 526 109 57 Okla 151,731 157, 062 273 252 144, 617 151,012 227 225 16,983 16,194 46 27 Tex 357,443 371, 857 924 684 335,018 353,061 549 537 86, 246 66,194 375 146
Mountain 194, 278 197,516 451 362 182,266 188,393 273 276 51, 742 37, 366 177 86 Mont 36,092 35, 852 80 65 34,137 34,686 51 52 10,715
9, 626 6,309 29 13
Idaho 36, 249 36,966 81 63 34, 295 35, 578 50 51 10,715 9, 626 6, 514 31 12
Wyo 12,823 13, 097 30 27 11,994 12,410 17 18 4,123 3,391 12 9 Colo 41,629 43, 235 98 79 39,038 4i, 254 59 61 12, 111 9,268 39 18 N. M e x . . . 29, 451 29, 674 66 53 27,189 27,885 42 42 6, 710 4,883 25 12 Ariz. 14, 805 15,142 49 33 13, 732 14,161 21 20 3,420 3,257 28 12 Utah 20, 446 20,681 39 34 19, 397 19,814 29 28 3,945 2, 714 10 6 Nev 2,783 2,869 8 8 2, 484 2, 605 4 4 1,092 1,030 4 4
Pacific 222, 755 229,088 72,145
612 457 204, 797 214,011 299 309 61,413 50, 553 313 149 Wash 69, 220
229,088 72,145 152 123 66. 346 69, 475 95 99 13, 672 11, 643 57 24
Oreg 50,06C 51, 612 115 91 47, 369 49, 569 ' 70 72 10, 483 8, 325 45 19 Calif 103, 475 105, 329 345 244 91,082 94, 967 135 138 37, 258 30, 585 211 106
Persons working
(thousands)
HIRED LABOR
Farms reporting working (thousands)
1 Less than 500 persons. Source: Department of Commerce, Bureau of the Census; Sixteenth Census Reports, Agriculture,
Vol. III.

P A R T - T I M E F A R M E R S 603
N o . 6 5 8 . — I * A R T - T I M E W O R K O F F F A R M S — O P E R A T O R S R E P O R T I N G , BY N U M B E R OF D A Y S W O R K E D , 1 9 2 9 , 1 9 3 4 , AND 1 9 3 9 , AND BY T E N U R E , 1 9 3 4 AND 1 9 3 9
NOTE.—Leaders indicate data are not available.
TENURE AND DAYS WORKED OFF FARM 1939 1931 1939
All farm operators 12 Reporting work off farm
Percent of all operators-Days worked
Average days worked. __ Operators reporting:
Under 50 days 50 to 99 days 100 days and over..
Work on other farms: Number reporting Days worked
Work at nonfarm jobs: Number reporting Days worked
All full owners 1 Reporting work off farm. .
Days worked Average days worked.
Operators reporting: Under 50 days 50 to 99 days 100 days and over..
All part owners 1 Reporting work off farm..
Days worked Average days worked.
Operators reporting: ) days Under 50 days.
50 to 99 days 100 days and over..
All tenants 1 Reporting work off farm. .
Days worked Average days worked.
Operators reporting: Under 50 days 50 to 99 days 100 days and over
6, 288, 648 1, 902, 898
30.3 189, 868, 388
100
844,170 335, 459 723, 269
6, 812, 350 2,077, 474
30.5 202, 228, 247
97
956,100 360, 602 760, 772
3, 210, 224 956, 324
119, 211, 765 125
336, 359 156, 835 463,130
228, 366 16, 597,076
73
130, 214 40, 209 57, 943
2, 860,155 887,150
65, 490,195 74
488, 200 162, 772 236,178
6,096, 799 1, 747,193
28.7 239, 604, 692
137
543, 714 259, 898 943, 581
501,229 30, 401, 434
1, 317, 766 209, 203, 258
3,084,138 933, 228
154, 837,451 166
199, 794 118, 722 614, 712
615,039 170,058
16, 546, 936 97
78, 819 28, 916 62, 323
2, 361, 271 640,891
67, 698, 295 106
264,477 111, 843 264, 571
1 Figures are for Apr. 1, 1930, Jan. 1, 1935, and Apr. 1, 1940, respectively. 2 Includes data for managers, not shown separately. Source: Department of Commerce, Bureau of the Census; Sixteenth Census Reports, Agriculture,
Vol. III .

604 FARMS—GENERAL STATISTICS «
N o . 6 5 9 . — P A R T - T I M E W O R K O F F F A R M S — O P E R A T O R S R E P O R T I N G , B Y N U M B E R O F D A Y S W O R K E D , B Y S T A T E S : 1 9 3 4 A N D 1 9 3 9
ALL FARM OPERATORS
NUMBER REPORTING DAYS WORKED OFF FARM FOR PAY OR INCOME
DIVISION AND STATE
1935 (Jan. 1)
1940 Total Under 50 days 50 to 9{ ) days 100 days and
over DIVISION AND STATE
1935 (Jan. 1) (Apr. 1)
1934 1939 1934 1939 1934 1939 1934 1939
United States 8,812,350 6,096,799 2,077,474 1,747,193 956,100 543,714 360, 602 259, 898 760, 772 943, 581
New England- 158,241 135,190 65,462 56, 865 15, 826 9, 690 10, 327 6, 488 39, 309 40, 687 Maine 41,907 38,980 19, 602 18,038 6, 392 3,988 3,704 2,469 9,506 11, 581 New Hampshire 17, 695 16, 554 8,970 7,756 2,507 1,267 1,662 905 4,801 5, 584 Vermont 27,061 23, 582 11,226 9, 505 3,843 2, 449 1,676 1,276 5,707 5,780 Massachusetts 35,094 31,897 12,088 12,778 1,599 1,098 1,845 1,071 8,644 10, 609 Rhode Island 4,327 3,014 1,508 1,004 198 89 177 109 1,133 806 Connecticut 32,157 21,163 12,068 7,784 1,287 799 1,263 658 9, 518 6, 327
Middle Atlantic 397, 684 348,100 127,413 117,224 42,183 26,425 21,054 14,226 64,176 76, 573 New York 177,025 153, 238 49, 950 46,934 13,775 11,502 7,855 5,663 28, 320 29,769 New Jersey 29, 375 25,835 6,018 6,422 1,488 992 1,049 677 3,481 4, 753 Pennsylvania 191,284 169,027 71,445 63,868 26,920 13,931 12,150 7,886 32, 375 42,051
East North Central 1, 083, 687 1, 006,095 310,932 293, 507 132,287 84, 733 50, 863 36,440 127, 782 172, 334 Ohio 255,146 233, 783 75,388 75,106 24,217 17,009 12,452 8,193 38, 719 49, 904 Indiana 200,835 184, 549 61, 734 57, 524 22,441 14,185 10,185 7,114 29,108 36,225 Illinois 231,312 213,439 54,041 55,181 26,069 20,829 8, 975 7, 238 18, 997 27,114 Michigan 196,517 187, 589 56, 782 60,468 20,403 12, 815 10, 810 7, 861 25, 569 39, 792 Wisconsin 199,877 186,735 62,987 45,228 39,157 19,895 8,441 6,034 15,389 19,299
West North Central 1,179,858 1,090, 574 372,258 268,455 228, 347 130,585 60, 375 36,106 83, 536 101, 764 Minnesota 203, 302 197, 351 64,709 47,459 45,015 21,820 7,828 6,070 11,866 19, 669 Iowa-_ 221, 986 213,318 40, 707 38,118 21,908 19, 668 6,068 4,930 12,731 13, 520 Missouri 278,454 256,100 81,812 71,274 43,698 23,094 12,872 10,592 25,242 37, 588 North Dakota 84,606 73,962 36, 514 16,142 28,158 10,286 4,309 2,016 4,047 3,840 South Dakota 83, 303 72,454 50,106 15,401 26,322 9,464 16,083 1,914 7,701 4,023 Nebraska 133, 616 121,062 36,392 31,888 26,445 20,445 3,910 4,084 6,037 7,359 Kansas 174,589 156,327 62,018 48,173 36, 801 25,808 9, 306 6,500 15, 912 15,865
South Atlantic— 1,147,133 1,019,451 345, 704 291, 572 117,643 65,751 67, 887 44,319 160,174 181,602 Delaware 10,381 8,994 2,159 1,940 563 456 412 275 1,184 1,209 Maryland 44, 412 42,110 12,071 12,291 2, 722 2,132 2,006 1,486 7,343 8,673 Dist. of Columbia 89 65 20 8 1 1 2 1 17 6 Virginia 197,632 174,885 72,485 61,955 22,080 10,878 12,398 7, 726 38,007 43,351 West Virginia 104, 747 99,282 48,519 45,686 15,116 6,087 10,845 6,247 22, 558 33, 352 North Carolina 300, 967 278,276 74,247 69,068 23, 591 17,251 15, 714 11,401 34,942 40,416 South Carolina 165, 504 137, 558 55,965 32,065 25,863 8,077 10, 326 5,821 19, 776 18,167 Georgia 250,544 216,033 53,381 48,040 21,361 17,414 10,073 8, 532 21,947 22,094 Florida 72,857 62,248 26,857 20, 519 6,346 3,455 6,111 2,830 14,400 14,234
East South Central 1,137,219 1,023,349 291,719 276,283 141,984 92,335 52,134 48,991 97, 601 134,957 Kentucky 278,298 252,894 81, 798 79,405 38, 395 19, 650 14, 533 13, 965 28, 870 45,790 Tennessee 273,783 247,617 74,204 76,932 30,350 21,436 14,119 12,439 29, 735 43,057 Alabama 273,455 231,746 68,348 56,388 32,041 23,318 13, 309 9,531 22, 998 23, 539 Mississippi 311,683 291,092 67,369 63, 558 41,198 27, 931 10,173 13,056 15,998 22, 571
West South Central 1,137, 571 964,370 337,999 257,742 198,042 90, 331 52, 551 46, 048 87, 406 121, 363 Arkansas 253,013 216, 674 70,222 60,941 40,499 22,320 12,986 11,622 16,737 26,999 Louisiana 170,2ie 150,007 36, 612 34,890 17,876 13, 71C 7,095 6,893 11,641 14, 287 Oklahoma. 213,32£ 179,687 94,934 52,94C 70,84S 20. 546 9,627 9, 718 14,658 22, 676 Texas 501,017 418,002 136,231 108,971 68,818 33,755 22,943 17,81f 44,47C 1 57,401
Mountain 271,392 1 233,497 116,99i 1 77,53S 52,761 , 23,362 25,46S 13, 857 ' 38,76£ 1 40,314 Montana 50,564 I 41,823 18,06i 1 13,042 8,29£ ; 4,35i 3,77i 2,447 ' 5,98i ) 6,236 Idaho 45,113 t 43,663 17, 76£ i 15,594 8,217 ' 5,58C 3,651 2, 596 i 5,897 ' 7,418 Wyoming 17,487 ̂ 15,01? 7,238 ; 4,68i 8,007 ̂ 1,627 1,61£ 808 ! 2,6ie
i 6,897 ) 2,151
Colorado 63, 644 I 51,43C 25,09€ ; 15,54C 12,98f ) 5,371 5,213 2, 71£ ! 2,6ie i 6,897 ' 7,454
New Mexico 41,36C 1 34, lOi 20,607 ' 10,83( 9,024 t 2,171 4,80i 2,12C 1 6,774 t 6,530 Arizona 18,82^ t 18,468 9,42S ! 6,64; 2,371 905 2,69i 978 i 4,357 ̂ 3,767 Utah 30,69i ) 25,411 17,38C ) 11,157 8,30i ) 3,08? 3,40C 1,96f 5 5,671 ) 6,102 Nevada 3, 69f ) 3,572 [ 1,431 1,137 55i ) 262 307 218 ; 568 i 656
Pacific 299, 66Ì r 276,172 I 108,98i $ 108,015 5 27,027 ' 20,605 19,945 13,42i 1 62,01f ) 74,087 Washington 84, 381 [ 81,68f ) 35,95C ) 37,25i ) 11,077 ' 6,82i 7,132 4,334 t 17,74C ) 26,100
I 16,989 Oregon California
64,82( ) 61,82i ) 26,715 5 27,80i Ì 8,367 ' 7,061 6,361 3, 755 i 12,98^ ) 26,100 I 16,989 Oregon
California 150,36( 132,658 ; 46,32e 5 42,951 I 7,58? I 6,61( 7,448 5, 337 ' 31,29i ) 30,998
Source: Department of Commerce, Bureau of the Census; Sixteenth Census Reports, Agriculture, Vol. III.

FARM EXPENDITURES 605 N o . 6 6 0 . " — F A R M E X P E N D I T U R E S F O R S P E C I F I E D P U R P O S E S , B Y C O L O R A N D BY
T E N U R E O F O P E R A T O R : 1 9 2 9 A N D 1 9 3 9
I T E M
FOR FARMS REPORTING SPECIFIED EXPENDITURES—
Total
By tenure
Owners Managers Tenants White operators
By color
Non-white opera-
tors
Expenditures for labor: i Farms reporting 1929__
1939.. Amount ($1,000) 1929
1939._
Expenditures for feed; Farms reporting 1929. _
1939._ Amount ($1,000) 1929. _
1939..
Expenditures for implements and machin-ery: 3
Farms reporting 1929.. 1939._
Amount ($1,000) 1929.. 1939._
Expenditures for commercial fertilizer: ^ Farms reporting 1929_
1939._ Quantity purchased (1,000 tons) 1929__
1939.. Amount ($1,000) 1939..
Expenditures for liming material: ^ Farms reporting 1939. _ Quantity purchased (1,000 tons) 1939. _ Amount ($1,000) 1939..
Expenditures for gasoline, distillate, kero-sene, and oil:
Farm reporting 1939.. Amount ($1,000) 1939..
Expenditures for building materials: ® Farms reporting 193 Amount ($1,000) 1939..
2,631, 601 2, 260, 237
955, 420 781, 792
3, 283, 400 3, 342, 715
919,190 732,117
1, 750, 588 1. 686, 609
692, 548 549,320
2, 239, 546 2, 337, 031
7, 535 7,004
195, 928
471, 807 8, 516
21,674
2, 886, 614 323, 239
1, 980,108 305, 650
1,717, 713 1, 504, 805
eil, 960 529, 560
2, 209, 385 2, 286, 568
665, 597 543, 395
1,121, 720 1, 061, 769
473,115 368, 206
1, 304,177 1, 434, 679
4, 209 4,299
120, 414
376, 019 6, 215
16,082
1, 837, 205 211, 933
1, 585, 677 248, 374
38, 617 27, 521
115, 257 94, 318
31,388 20, 285 45, 908 32, 971
19, 524 14,103 17, 311 13, 747
20, 655 16, 299
328 351
10, 266
6, 250 322
22, 713 10, 572
17, 214 14, 362
875,271 727, 911 228, 204 157,924
1, 042, 627 1, 035, 862
207, 684 155, 751
609, 344 610, 737 202,122 167, 367
914, 714 886, 053
2,998 2, 354
65, 248
89, 538 1, 980 4,597
1, 026, 696 100, 734
377, 217 42, 914
(2) 2,142,903
(2) 764, 017
(2) 3,161, 960
(2) 724, 532
(2) 1, 573, 896
(2) 542, 484
(2) 1, 938,186
(2) 6,119
171, 008
455,903 8,444
21, 263
2, 709, 260 318, 843
1, 922, 594 301, 779
(2) 117, 334
(2) 17, 774
(2) 180,755
(«) 7, 585
0) 112, 713
(2) 6,835
0) 398, 845
(2) 885
24,920
15, 904 72
411
177, 354 4, 396
57, 514 3,872
1 Exclusive of housework. Inquiry for 1939 specifically excluded contract construction work. No mention was made of wages for this kind of work for 1929.
2 Not available. 3 Inquiry specified expenditures for automobiles, tractors, and motortrucks for 1929 and 1939, and trailers
for 1939. * Includes quantities for which the farm operator reported no expenditure or expenditure for freight only. 6 Includes expenditures for lumber, roofing materials, hardware, cement, paint, fencing materials, etc. Source: Department of Commerce, Bureau of the Census; Sixteenth Census Reports, Agriculture,
Vol. III.

606 FARMS GENERAL STATISTICS
N o . 6 6 1 . — F A R M E X P E N D I T U R E S F O R
[Amounts in thou
DIVISION AND STATE
Farms reporting
A m o u n t e x p e n d e d
IMPLEMENTS AND MACHRNERY 1
Farms reporting
Amount expended
GASOLINE, OIL, KEROSENE, ETC.
Farms reporting
Amount expended
BUILDING MATERIALS,
FENCING, CEMENT,
PAINT, ETC.
Farms re-porting
United States..
New England Maine NewHampshire., Vermont Massachusetts... Rhode I s land— Connecticut
Middle Atlantic.. New York New Jersey Pennsylvania-
East North Central-Ohio Indiana Illinois Michigan Wisconsin
West North Central.. Minnesota Iowa Missouri North Dakota-.. . South Dakota Nebraska Kansas
South Atlantic Delaware Maryland District of Columbia-Virginia West Virginia North Carolina South Carolina Georgia Florida
East South Central.. Kentucky Tennessee Alabama Mississippi
West South Central. Arkansas Louisiana Oklahoma Texas.
Mountain Montana Idaho Wyoming Colorado New Mexico-Arizona Utah Nevada
Pacific. Washington. Oregon California
3,342,715 732,117 1, 686, 609 849, 320 2, 886, 614 323,239
98, 294 27, 266 12, 326 19,134 21, 781
2,407 15, 380
119, 657 19, 480
127, 556
682, 783 158, 588 123, 882 146, 088 107, 045 147,180
735, 714 133, 498 162, 648 172, 671 30. 849 40, 826 83, 982
111, 240
403, 225 6,174
28, 228 34
96,099 57,119
108, 898 23, 226 55, 874 27, 573
361, 040 116, 264 107, 020 69, 872 67, 884
489, 519 100, 940 60, 212
109,121 219, 246
126,258 19, 256 24, 726
9, 308 30, 780 17, 063 9,103
13, 859 2,163
179,189 59, 509 43, 210 76,470
60,276 9,198 7, 619 8, 900
19, 438 2, 430
12, 692
123, 210 59, 906 18, 968 44, 336
115, 583 26,149 21, 522 27, 836 14,109 25, 967
153, 694 19,304 48, 942 25, 426
3, 590 7,843
26, 461 22,138
59, 667 6,420 9,335
91 14,173
5,083 7,782 2, 250 6, 368 8,167
26, 564 8, 724 7, 695 5, 237 4,909
67,124 8, 527 5, 572
13, 954 39,071
36,736 4,036 6,136 3, 677
10, 232 3,904 2,619 5,113 1,019
17,712 13,177 58, 373
32, 878 8, 717 3, 599 7, 049 7, 368
977 6,168
113,812 51, 777
9, 416 52, 619
340, 760 62,024 50, 040 82, 767 64, 015 81,914
93, 805 103, 896 60, 531 36, 591 33, 254 46, 421 53, 744
238, 212 2, 250
10, 452 18
29, 297 9, 558
55, 444 39, 079 77, 839 14,275
178,441 32.190 40, 724 64, 862 40, 665
210, 516 39,891 30, 209 47, 685 92, 731
76, 856 16, 740 16,763 6, 464
18,174 7, 054 2, 961 7,509 1,191
19,452 17, 276 30,164
12, 592 3,233 1,176 2,262 3,140
431 2, 349
44, 619 19, 630
6, 026 19, 962
126,123 22, 326 19, 821 38, 047 21, 684 24, 244
158, 821 34, 258 45,103 17,199 14,171 12, 403 15, 955 19, 733
38,106 877
3, 706 16
6, 488 2, 267 8, 098 4, 738 7, 597 4,319
26,990 6, 480 7,155 5, 804 6, 552
63,119 7, 314 5, 986
16, 061 33, 758
38, 737 9, 300 8,107 3, 370 8, 440 3, 598 2,208 2,968
745
41,216 9, 588 8, 670
22, 956
60,948 16, 996
6, 301 12, 351 12, 879
1,787 10, 634
188,110 87, 847 15, 507 84, 766
591, 691 116,625
91, 852 143, 674
95, 483 143, 967
787, 347 158,471 164, 265 129, 631
61, 360 56, 709
102, 570 114, 341
319,717 3, 024
16, 668 29
61, 730 25, 379 82, 330 36,022 72,609 21, 926
268, 727 75, 820 74, 205 62, 968 55, 734
394, 828 51,494 56,079 87, 931
199, 324
129, 000 30, 837 22, 307 10, 657 30,144 14, 009 9,198 9,590 2,368
146,346 39,075 31, 033 76, 238
7,243 I , 647
592 969
2,133 335
1,567
20, 931 10,154
3,124 7,653
64,932 11,055
9, 934 22, 790
7,743 13,410
106, 079 22, 321 21, 995
7, 802 I I , 928 8, 879
14, 244 17, 909
18, 832 395
1,919 4
3,053 994
3, 779 1, 968 3, 456 3, 265
11, 322 2, 923 2, 902 2,278 3, 219
39, 695 3,271 3, 980 9,028
23, 417
28,104 6, 570 3,653 1,896 5, 472 2,042 1,872 1,143
466
32,102 6,268 4, 868
20,965
1, 980,108
57, 803 14, 237
6,910 11, 690 13,182
1, 568 9, 916
178, 319 84,309 12, 418 81, 592
453, 889 89,377 71, 205 96, 328 88, 444
108, 536
468, 302 100, 495 111, 241 92,090 35, 293 29.148 44,963 65,072
233,009 2, 528
14,081 19
51, 468 30, 949 65.149 21, 749 41,499 15, 567
192,886 67,096 62, 619 32, 450 30, 421
201, 802 36,338 22, 792 49,626 92, 746
88,931 18, 286 19,677
7, 683 19,897
8, 460 4,440 8,847 1, 641
106,067 31,454 27, 417 47,196
1 Including automobiles, motortrucks, and tractors, i Less than $500.

FARM EXPENDITURES 607 S P E C I F I E D P U R P O S E S , BY S T A T E S : 1 9 3 9
sands of dollars]
BUILDING MATERI-
ALS, FENC-ING, COMMERCLA.L FERTILIZER LIMING MATERLÄ.LS CASH WAGES
CEMENT, PAINT, DIVISION
ETC.—con. AND STATE
Amount Farms Tons Amount Farms Tons Amount Farms Amount e x p e n d e d r e p o r t i n g b o u g h t e x p e n d e d r e p o r t i n g b o u g h t e x p e n d e d r e p o r t i n g e x p e n d e d
305,650 2,337,031 7,003, 826 195,928 471, 807 8, 516,107 21,674 2,260,237 781, 792 U.S.
12, 813 62,932 290,612 9,991 24,911 155, 003 704 52, 804 37, 832 New Eng. 1,829 21, 589 147, 410 5,187 7,474 37, 511 201 15, 765 5, 959 Me. 1,241 6, 557 9, 929 295 2,939 12,998 41 5, 665 3,298 N. H. 1, 830 11,031 25,889 549 3, 575 27, 954 74 11, 999 4, 800 Vt. 3, 587 13, 377 51, 587 1, 863 5, 478 32, 681 173 10, 555 13,056 Mass.
516 1, 546 7, 963 283 641 4, 474 27 1, 222 1, 640 R . I . 3, 810 8, 832 47, 834 1,815 4,804 39, 385 188 i 7,598 9,079 Conn.
31, 207 202, 095 854, 968 22,674 111,300 1, 301, 868 5,789 150,351 78,407 Mid. Atl. 14, 276 78, 666 333,107 8, 841 39, 992 467, 416 1,851 73, 243 37, 959 N. Y. 4,197 15,061 170, 540 4, 856 9, 378 90, 513 709 12, 351 14,919 N. J.
12, 734 108, 368 351, 321 8, 977 61, 930 743,939 3,230 64, 757 25, 529 Pa.
. 72,111 364,377 842,974 23,460 133,005 3, 721,974 6, 800 391,805 109,563 E. N. C. 13, 354 145,079 357, 354 9, 787 36,001 489,919 1,387 82, 646 23, 278 Ohio. 11, 750 89, 822 210,080 5, 946 16, 977 439,394 785 58,673 14, 897 Ind. 19, 249 19, 071 74, 766 1, 713 39, 358 1, 876, 961 3, 389
520 93, 837 30, 885 111.
13, 426 76, 906 152, 480 4, 438 14,145 369, 883 3, 389
520 71,076 19, 204 Mich. 14, 331 33, 499 48, 294 1, 575 26, 524 545, 817 719 85, 573 21, 299 Wis. .
66,808 58, 906 100, 058 2,982 33,168 1, 022,145 1,565 459, 088 107,256 W.N.C. 15, 402 7,177 13, 418 492 2,081 33,972 59 95,174 21,951 Minn. 24,115 6, 388 12,079 351 16, 894 574,153 861 109,132 29, 500 Iowa. 10,105 34, 549 57, 936 1, 569 12, 340 375, 543 589 76, 720 16,699 Mo. 3,147 654 1,446 63 25 528 1 38, 950 9, 604 N. Dak. 3,141 253 272 13 46 54 (2) 30, 861 5,948 S. Dak. 4, 937 1,082 1, 636 74 62 684 2 46, 887 11, 414 Nebr. 5,962 6, 803 13, 271 420 1, 720 37,211 53 61,364 12,140 Kans.
31, 932 797,827 3,245, 545 88, 359 98,140 1,039,611 4,181 364,431 98,164 S. Atl. 662 5,953 30, 989 792 2, 363 17, 390 158 4, 462 2,087 Del.
3,203 29, 577 151, 328 3,905 11, 780 113, 782 824 20, 846 10, 683 Md. 5 41 148 3 16 256 2 38 183 D. C.
6, 552 115, 685 356, 479 8, 964 31, 444 449, 904 1,423 59, 763 17, 327 Va. 2, 789 44, 956 51, 937 1,301 14, 351 186, 358 483 26, 089 4,013 W. Va. 7,285 239, 378 947, 923 26, 529 28, 684 171,711 804 95, 346 14,836 N. C. 3,092 126, 508 587, 341 15,145 3,836 39, 286 141 51, 288 11, 552 s. c. 5, 434 193, 643 700,044 18, 648 2, 667 23, 894 99 78, 703 16, 505 Ga. 2, 911 42, 086 419, 356 13, 072 2, 999 37,030 247 27,896 20, 978 Fla.
22, 243 590,460 1, 083, 946 28, 702 54,287 1, 073, 868 1,873 235,821 39, 283 E. S. C. 8, 053 103,830 115,072 3,007 26, 276 655, 726 1,038
688 66,100 11, 944 Ky.
6, 682 111,909 136, 971 3, 406 21, 919 383, 322 1,038
688 69,065 9, 770 Tenn. 3, 462 196, 515 525,977 13, 405 5,187 28, 676 114 58, 688 8, 422 Ala. 4,046 178, 206 305,926 8,884 905 6,144 34 41,968 9,148 Miss.
29, 885 196,103 282, 933 8, 690 2,866 38, 346 91 345,454 96,009 w. s. c 4,187 55,165 68, 829 2,099 1, 676 22,020 43 50, 878 12, 739 Ark. 3, 646 78,808 129, 212 3,957 489 4, 226
8, 988 22 38, 924 14, 547 La.
5, 831 6,134 4, 814 141 348 4, 226 8, 988 14 65, 634 12,138 Okla
16, 222 55,996 80,078 2, 494 353 3,112 12 190,018 56, 586 Tex.
15, 040 18,344 28, 783 1,290 2,163 14, 677 53 111,789 64,787 Mountain. 2, 719 2, 509 3, 974 184 182 411 3 22, 682 11, 677 Mont. 2, 847 6,117 6, 841 329 1, 585 2, 685 30 25, 483 11, 487 Idaho. 1, 532 1,182 1,978 93 79 5,619 4 7,606 6, 715 Wyo. 3,060 2,606 3, 660 165 119 3,051 4 25, 556 13, 526 Colo. 1, 765 1,249 2, 674 112 63 840 2 10, 079 5, 521 N. Mex 1, 309 687 6,951 275 73 1, 401 7 5, 891 9, 071 Ariz. 1,277 3,888 2, 583 124 57 568 1 12, 653 4, 388 Utah.
532 106 122 6 5 102 1 1,839 2,403 Nev.
23, 611 47, 987 274, 007 9, 779 11,967 148, 615 618 148, 694 150, 490 Pacific. 4,972 10,940 22, 843 827 2,609 17, 044 79 35, 244 20, 405 Wash. 4, 414 8, 750 18, 623 682 5, 773 20, 848 164 30, 562 15, 962 Oreg.
14, 225 28, 297 232, 541 8, 270 3, 585 110, 723 375 82, 888 114,123 Calif.
^^Source: Department of Commerce, Bureau of the Census; Sixteenth Census Reports, Agriculture, Vol.

608 FARMS^—GENERAL STATISTICS
N o . 6 6 2 . — F A R M F A C I L I T I E S AND M A C H I N E R Y , A N D
N U M B E R O F F A R M S R E P O R T I N G —
D I V I S I O N A N D S T A T E Electric distribu-tion line within H
mile
Dwelling lighted by elec-tricity
Tele-phone
Kind of road adjoining farm D I V I S I O N A N D S T A T E Electric distribu-tion line within H
mile
Dwelling lighted by elec-tricity
Tele-phone Hard-
surfaced Gravel, shell,
shale, etc. Improved
dirt Unim-proved
dirt
United States 2, 780,207 2,082, 816 1, 526,954 1,146,936 1,781,477 1, 628, 697 1,442,678
New England 100,618 91, 834 68,819 66, 234 19,063 21,286 24,178 Maine.-- . . - 24,160 21,124 17,105 15, 615 5, 930 5, 478 10,490 New Hampshire 12, 374 11,184 8, 528 8, 226 1,990 3, 372 2,363 Vermont 14,855 12, 873 11, 052 4, 394 6,884 6, 055 5,680 Massachusetts 28, 043 26, 648 17, 066 21,123 3,095 3, 833
398 2, 676
Ehode Island 2, 644 2, 511 1, 502 1, 948 165 3, 833
398 413 Connecticut 18, 542 17, 494 13, 066 14, 928 999 2,150 2,556
Middle Atlantic 260,217 227,486 123,857 173, 812 40,335 64,986 68,458 New York 115, 879 106, 804 59, 526 83, 289 22, 614 23, 007 20, 009 New Jersey 23, 056 21, 695 9, 359 15,160 2, 964 4, Oil 2,853 Pennsylvania. 121, 282 98, 937 54, 472 75,363 14, 757 27,967 45, 596
East North Central 687, 976 554, 875 402, 707 265, 340 628,037 117, 076 67,909 Ohio 170, 897 143, 436 88, 888
83, 675 99,153 99, 627 15, 503 10, 483
Indiana 123, 662 95, 575 88, 888 83, 675 48, 910 114, 259 8, 814 7,921
Illinois 114,088 87, 611 105, 683 34, 466 111, 950 32, 828 27, 397 Michigan 153, 042 133,095 52,025 39, 089 99,436 30, 406 11, 486 Wisconsin 126, 287 95,158 72, 436 43, 722 97, 765 29, 525 10, 622
West North Central 363,404 292,705 507,292 87, 493 444,531 289,453 228,986 Minnesota 80, 220 59, 838 87, 939 19,009 111, 723 40, 280 20, 243 Iowa _ _ 107, 359 86, 786 142,091 19, 259 102, 604 40,156 44, 694 Missouri 74, 035 45, 355 99, 799 22, 826 90, 343 54, 386 77, 780 North Dakota 7, 310 11,446 20, 627 2, 036 20, 932 26, 275 21, 881 South Dakota 8, 444 12, 845 24, 821 3, 534 26, 676 24,894 14,445 Nebraska 40, 969 34, 886 52, 349 6, 527 38, 600 51,165 21, 799 Kansas 45,067 41, 549 79,666 14, 302 53, 653 52, 297 28,144
South Atlantic 488, 307 253,577 90,190 190, 238 66,009 369, 273 844, 210 Delaware... 6,096 3, 699 2,216 3, 844 909 3,183 478 Maryland __ __ 23, 700 18, 351 12, 982
49 18,142 3,949 8,116 9,784
District of Columbia 60 54 12, 982
49 53 3 2 2 Virginia 77, 255 44, 348 26, 228 49, 621 20,022 53, 865 44, 252 West Virginia 36,958 26, 735 20, 308 20, 947 11, 235 17, 372 46, 333 North Carolina 124, 017 71,196 12,111 38, 964 19, 230 120,458 82,662 South Carolina 56, 731 28, 764 4, 267 22, 802 2, 808 53, 252 52, 484 Georgia... 88. 427 43, 958 8,473 18, 574 6,060 92, 299 89, 782 Florida 25, 063 16, 472 3, 556 17, 291 1, 793 20, 726 18, 433
East South Central... 817, 242 146, 202 88, 788 110,814 322,341 220,188 321,536 Kentucky Tennessee
79, 740 42, 288 39, 851 46, 460 63,126 31, 203 102,492 Kentucky Tennessee 74, 276 40, 519 32,468 33,160 108, 817 43, 985 51, 761 Alabama 77, 579 35, 725 8, 254 17, 747 37, 851 79, 610 84, 413 Mississippi 85, 647 27, 670 8, 215 13, 447 112, 547 65, 390 82, 870
West South Central 295, 903 162,479 108,501 98,338 181,678 845,922 293,113 Arkansas.- _ 58, 732 23,435 11,375 11,993 46, 414 60, 705
39, 299 86, 442
Louisiana 46, 694 17,187 4, 991 14, 686 51, 301 60, 705 39, 299 38, 767
Oklahoma _ 43,128 28, 280 32, 571 13,000 18, 929 70, 924 67,005 Texas 147, 349 93, 577 54, 564 58, 654 64, 934 174, 994 100, 899
Mountain... 98, 747 95,102 51,068 87,625 54, 548 65, 902 66, 883 Montana 10, 614 11, 688 6, 966
12, 523 4,762 8, 457 13, 794 13, 551
Idaho. . . 28, 931 26, 384 6, 966
12, 523 7, 897 17, 938 9, 019 7,306 Wyoming 4, 655 5,184 3, 628 2, 515 1, 506 5,032 5,122 Colorado . . _ 20,046 19, 735 16, 795 6, 221 14, 385 16, 916 11, 836 New Mexico- __. 7,644 6, 554 2, 287 3,978 2, 886 10, 350 15, 696 Arizona 6, 577 6, 031 2, 670 3, 235 1,258 4, 529 8, 821 Utah 18, 510 17,714 4, 998 8, 205 7, 828 5, 061 3, 393 Nevada 1,770 1,812 1,201 8.12 285 1, 201 1,158
Pacific 217,793 208,106 91,732 117,047 80, 040 44,512 27,405 Washington 62, 843 60, 082 26,161 20,987 39, 707 11, 601 7,891 Oregon 41, 245 38, 010 20, 950 15, 861 30, 040 6, 905 7,041 California 113, 705 110, 014 44, 621 80,199 10, 293 26,006 12, 473
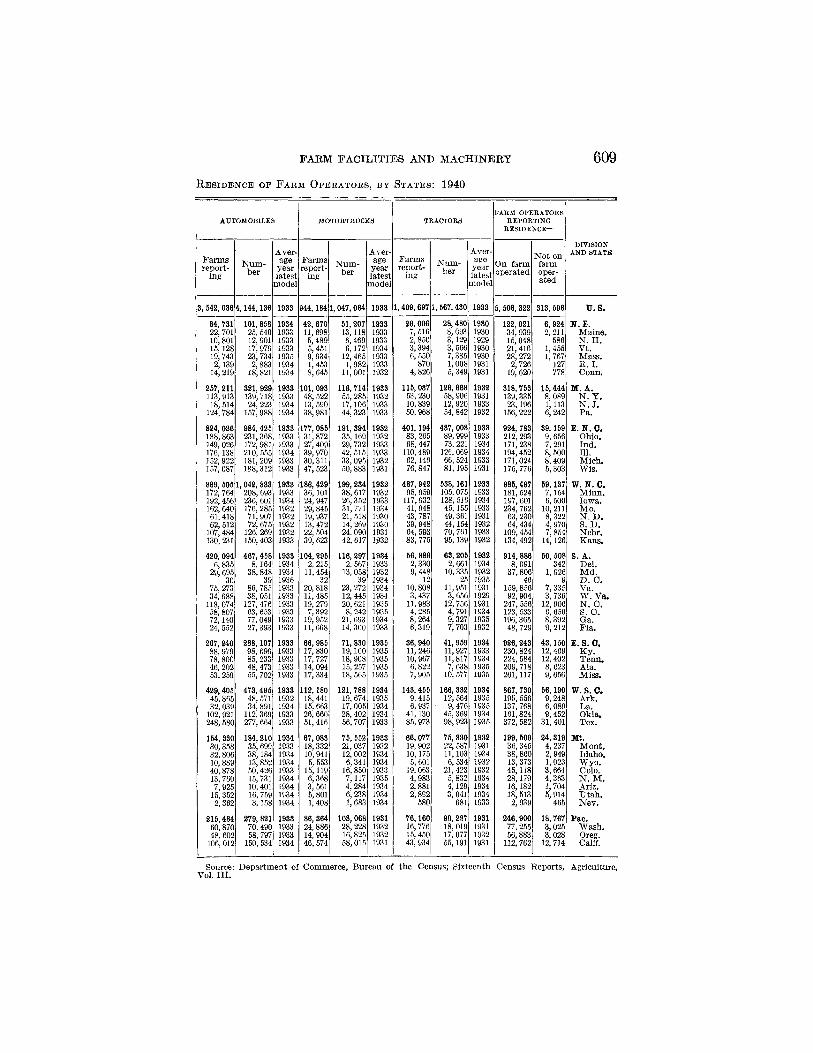
F A R M F A C I L I T I E S A N D M A C H I N E R Y
R E S I D E N C E O F F A R M O P E R A T O R S , BY S T A T E S : 1 9 4 0
609
AUTOMOBILES MOTOETRUCKS TRACTORS FARM OPERATORS
REPORTING RESIDENCE—
Farms report-
ing Num-
ber
Aver-age
year latest
model
Farms report-
ing Num-
ber
Aver-age
year latest
model
Farms report-
ing Num-
ber
Aver-age
year latest
model
On farm operated
Not on farm oper-ated
DIVISION AND STATE
3, 642, 036 4,144,136 1933 944,184 1,047,084 1933 1,409,697 1, 567,430 1933 5, 506,322 313,598 u . s .
84, 731 22, 701 10,801 15,128 19, 743 2,139
14, 219
101, 858 25, 540 12,901 17,979 23, 734 2,883
18,821
1934 1933 1933 1933 1935 1934 1934
42, 670 11, 698 5,489 5,451 9,934 1,453 8,645
51,207 13,118 6, 469 6,172
12,465 1,982
11,001
1933 1933 1933 1934 1933 1933 1932
26,006 7, 516 2, 850 3,394 6, 550
870 4,826
28,480 8,093 3,129 3, 566 7,335 1,008 5,349
1930 1930 1929 1930 1930 1931 1931
122,021 34,939 15,048 21,416 28,272
2,726 19, 620
6,924 2, 211
586 1,455 1, 767
127 778
N.E. Maine. N. H. Vt. Mass. R . I . Conn.
257,211 113,913 18, 514
124, 784
321, 929 139, 718 24, 223
157, 988
1933 1933 1934 1934
101, 093 48,522 13, 590 38,981
116, 714 55, 285 17,106 44,323
1933 1932 1933 1933
115, 037 53, 230 10,839 50,968
126, 668 58,906 12,920 54,842
1932 1931 1933 1932
318, 753 139,335 23,196
156, 222
15,444 8, 089 1,113 6,242
M. A. N. Y. N. J . Pa.
824, 036 188,863 149, 026 176,138 152, 922 157, 087
984, 425 231,368 172, 981 210,555 181, 209 188, 312
1933 1933 1933 1934 1933 1933
177, 085 31,872 27,409 39, 970 30,311 47, 523
191, 394 35,169 29, 732 42, 515 33,095 50,883
1932 1932 1933 1933 1932 1931
401,194 83,265 68, 447
110,489 62,146 76,847
437, 008 89, 999 73, 221
126,069 66, 524 81,195
1933 1933 1934 1934 1933 1931
924, 783 212,293 171, 238 194,452 171,024 175,776
39,159 9, 656 7, 291 8, 500 8,409 5,303
E. N. C. Ohio. Ind. 111. Mich. Wis.
889, 506 172, 764 192,456 162, 640 61,418 62, 512
107,484 130, 231
1, 042, 833 208,693 236, 601 176, 285 71, 907 72, 675
126, 269 150,403
1933 1933 1934 1932 1932 1932 1932 1933
186,429 36,101 24, 947 29,845 19, 937 13,472 22, 504 39, 623
199, 234 38, 617 26,352 31,771 21, 518 14, 269 24, 090 42, 617
1932 1932 1933 1934 1930 1930 1931 1932
487, 942 95, 959
117,932 41,948 43, 787 39, 948 64, 593 83, 775
538,161 105,075 128,516 45,155 49,361 44,154 70,761 95,139
1933 1933 1934 1933 1931 1932 1933 1932
986,497 181, 524 197, 601 234,762 63, 230 64, 434
109, 454 134, 492
69,137 7,154 6, 500
10, 211 8, 322 4,970 7,854
14,126
W. N. C. Minn. Iowa. Mo. N. D. S. D. Nebr. Kans.
420, 094 6,835
29, 695 30
75, 273 34, 688
118,074 68,807 72,140 24,552
467,458 8,164
38,848 39
86, 785 38, 051
127, 476 63, 653 77, 049 27, 393
1933 1934 1934 1936 1933 1933 1933 1933 1933 1933
104, 295 2, 215
11, 454 32
20,818 11, 485 19, 279 7,392
19,952 11,668
116,297 2, 567
13, 058 39
23,272 12, 445 20, 621
8, 242 21, 693 14,360
1934 1933 1932 1934 1934 1934 1935 1935 1934 1933
56, 886 2,330 9,448
12 10,808 3,437
11,983 4, 285 8, 264 6,319
63, 205 2, 661
10, 335 25
11,951 3, 656
12,756 4,791 9,327 7, 703
1932 1934 1932 1935 1931 1929 1931 1934 1935 1932
914, 886 8,091
37,806 46
159,856 92,904
247, 556 123, 533 196,365 48,729
50, 508 342
1, 926 9
7,335 3, 736
12, 906 6, 660 8,392 9,212
S.A. Del. Md. D. 0 . Va. W . V a . N. C. s . c . Ga. Fla.
267, 240 88, 979 78,800 46, 202 53, 259
288,107 98, 699 85, 233 48, 473 55, 702
1933 1933 1933 1933 1933
66, 985 17, 830 17, 727 14, 094 17, 334
71, 830 19,100 18,908 15, 257 18, 565
1935 1935 1935 1935 1935
36, 940 11, 246 10,967 6,822 7,905
41, 959 11, 927 11,817 7, 638
10,577
1934 1933 1934 1935 1935
926,243 230,824 224, 584 209,718 261,117
43,150 12, 469 12, 402 8, 623 9, 656
E. S. C.
Tenn. Ala. Miss.
429,405 45,865 32,039
102,921 248, 580
473,495 48,571 34,891
112,369 277, 664
1983 1932 1934 1933 1933
112,180 18,441 15, 663 26, 660 51,416
121, 788 19, 674 17, 005 28, 402 56, 707
1934 1935 1934 1934 1933
143,455 9, 415 6,937
41,130 85,973
166, 332 12, 564 9, 476
45, 369 98,923
1934 1935 1935 1934 1935
867, 730 195, 556 137, 768 161,824 372,582
56,190 9, 248 6, 089 9, 452
31,401
w. s. c . Ark. La. Okla. Tex.
154,330 30,358 32,806 10,889 40,878 13, 760 7, 925
15, 352 2,362
184,210 35, 699 38,184 13, 852 50,426 15, 731 10, 401 16, 759 3,158
1934 1933 1934 1934 1933 1934 1934 1S34 1934
67,083 18,332 10,941 5, 553
15,119 6,368 3, 561 5,801 1,408
75, 552 21, 037 12, 002 6,341
16,850 7,117 4,284 6, 238 1,683
1933 1932 1934 1934 1933 1935 1934 1934 1934
66,077 19, 902 10,175 5, 601
19,063 4,983 2,881 2,892
580
75, 330 22, 587 11,103 6, 534
21, 423 5, 832 4,129 3, 041
681
1932 1931 1934 1932 1932 1934 1934 1934 1933
199,509 36, 345 38,860 13,373 45,118 28,179 16,182 18,513 2,939
24,319 4,237 2,949 1,023 3,664 4,363 1,704 6,914
465
Mt. Mont. Idaho. Wyo. Colo. N. M. Ariz. Utah. Nev.
215,484 60,870 48, 602
106,012
279, 821 70, 490 58,797
150,534
1933 1933 1933 1934
86, 364 24,886 14, 904 46, 574
103, 068 28, 228 16,825 58, 015
1931 1932 1932 1931
76,160 16, 776 15, 450 43,934
90, 287 18, 019 17, 077 55,191
1931 1931 1932 1931
246.900 77,255 56,883
112, 762
18,767 3,025 3, 028
12, 714
Pac. Wash. Oreg. Calif.
Source: Department of Commerce, Bureau of the Census; Sixteenth Census Reports, Agriculture, Vol. III.
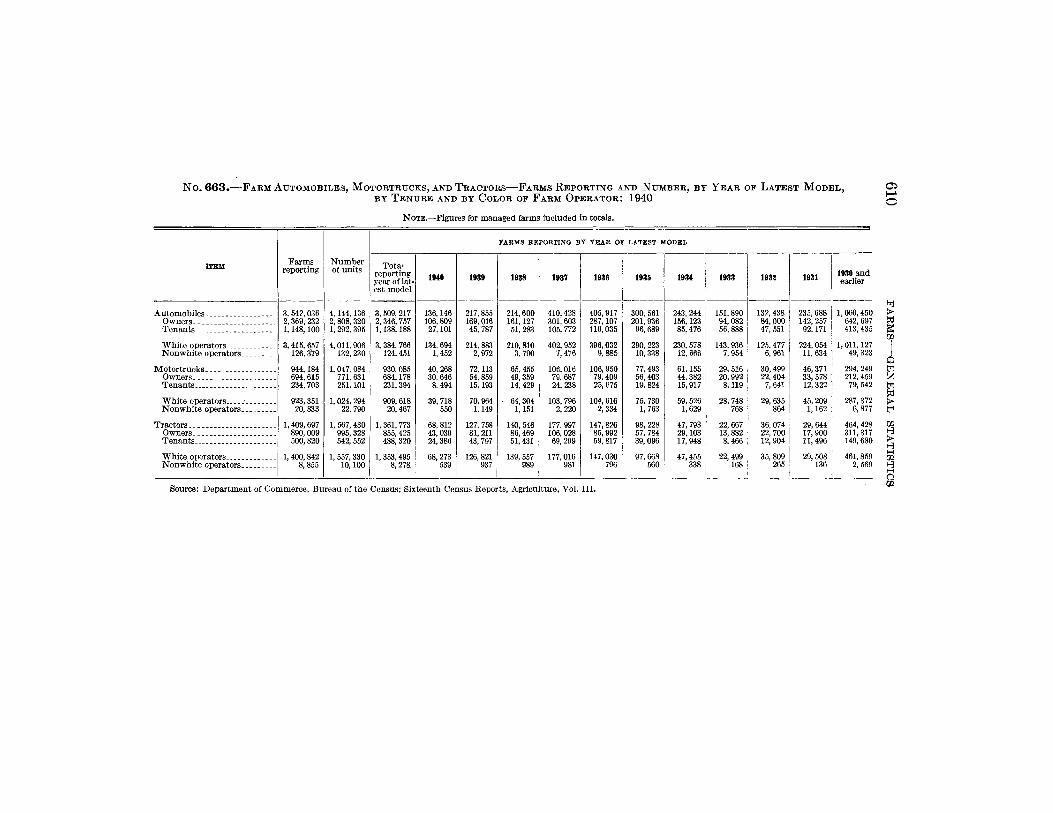
N o . 6 6 3 . — F A R M A U T O M O B I L E S , M O T O R T R U C K S , A N D T R A C T O R S — F A R M S R E P O R T I N G A N D N U M B E R , B Y Y E A R O F L A T E S T M O D E L , B Y T E N U R E A N D BY C O L O R O F F A R M O P E R A T O R : 1 9 4 0
NOTE.—Figures for m a n a g e d f a r m s inc luded in to ta l s .
H-^ o
F a r m s r e p o r t i n g
N u m b e r of u n i t s
FARMS REPORTING BY YEAR OF LATEST MODEL
T o t a l r epo r t ing year of lat-est m o d e l
1940 1939 1938 1937 1936 1935 1934 1933 1932 1931 1930 a n d earlier
ui
0 K !z:
>
1 I o QQ
A u t o m o b i l e s O w n e r s T e n a n t s
W h i t e ope ra to r s N o n w h i t e ope ra to r s
M o t o r t r u c k s O w n e r s T e n a n t s
W h i t e ope ra to r s N o n w h i t e opera to r s
T r a c t o r s . Owner s T e n a n t s
W h i t e opera to rs N o n w h i t e opera to rs
3, 54?, 036 2,369,232 1,148,100
3,415, 657 126,379
944,184 694,615 234,703
923,351 20, 833
1,409,697 890, 009 500,820
1,400,842 8, 855
4,144,136 2,808, 320 1, 292, 395
4,011,906 132,230
1,047, 084 771, 631 251,101
1, 024, 294 22, 790
1, 567,430 995, 328 542, 552
1, 557,330 10,100
3, 509, 217 2, 346,757 1,138,188
3, 384, 766 124,451
930,085 684,178 231,394
909,618 20,467
1,361, 773 855,425 488,320
1, 353,495 8,278
136,146 106,809 27,101
134,694 1, 452
40, 268 30,646
8,494
39, 718 550
68, 812 43,039 24, 386
68,273 539
217,855 169,016 45, 787
214, 883 2,972
72,113 54,859 15,193
70,964 1,149
127, 758 81, 211 43, 797
126,821
214,600 161,127
51, 283
210, 810 3,790
65, 455 49, 359 14, 429
64,304 1,151
140, 546 86,469 51, 431
139, 557
410,428 301,603 105, 772
402, 952 7, 476
106,016 79, 687 24,238
103, 796 2, 220
177,997 106,028 69,299
177,016
405, 917 287,107 116,035
396,032
106, 950 79, 409 25, 675
104,616 2,334
147,826 85,992 59, 817
147,030 796
300, 561 201,936
290,223 10,338
77, 493 56,403 19,824
75, 730 1, 763
98, 228 57, 784 39, 096
97, 668 560
243, 244 156,123 85,476
230, 578 12, 666
61,155 44, 382 15,917
59, 526 1,629
47, 793 29,103 17,948
47,455 338
151,890 94,082 56, 888
143, 936 7,954
29, 516 20,992
8,119
28, 748
22, 667 13,882 8, 466
22, 499
132, 438 84,000 47, 551
125. 477 6,961
30,499 22.404
7, 641
29, 635 864
36, 074 22, 700 12, 904
35, 809 265
235,688 142, 257
92,171
224, 054 11, 634
46,371 33, 578 12, 322
45,209 1,162
29, 644 17,900 11, 496
29, 508 136
1,060,450 642,697 413, 435
1, Oil, 127 49, 323
294, 249 212,459
79, 542
287,372 6,877
464, 428 311,317 149, 680
461,859 2,569
Source: D e p a r t m e n t of C o m m e r c e , B u r e a u of t h e Census ; S ix teen th Census Repor t s , Agr i cu l t u r e , Vol . I I I .

FARM WAGE RATES 611 N o . 6 6 4 . — F A B M W A G E R A T E S AND I N D E X N U M B E R S , FOR T H E U N I T E D S T A T E S ,
1 9 1 2 TO 1 9 4 3 , AND BY G E O G R A P H I C D I V I S I O N S , J U L Y 1 9 4 1 TO O C T . 1 9 4 3
NOTE.—Estimates from 1912 to 1922 based on annual reports from crop correspondents regarding average wage rates in their locality as of Apr. 1; thereafter, based on weighted averages of quarterly reports as of the first day of January, April, July, and October
YEAR
FARM WAGE RATES (AVERAGE)
Index numbers
of farm wage rates (1910-14=-
100)
YEAR
FARM WAGE RATES (AVERAGE)
Index numbers
of farm YEAR Per month— Per day—
Index numbers
of farm wage rates (1910-14=-
100)
YEAR Per month— Per day—
Index numbers
of farm YEAR
With board
With-out
board With board
With-out
board
Index numbers
of farm wage rates (1910-14=-
100)
YEAR
With board
With-out
board With board
With-out
board
wage rates (1910-14=
100)
1912 $22. 23 $29.34 $L18 $L 43 101 1928 $40.11 $50.72 $L98 $2. 27 179 1913 22.89 30.21 L20 L46 103 1929 40. 61 51.22 L 96 2. 25 180 1914 22. 62 29. 74 L 17 L 43 101 1930 37. 59 48.10 L 76 2.08 167 1915 22. 97 30. 06 L 18 1.44 103 1931 28. 77 38. 38 L 32 L 62 130 1916 25.17 32.84 L31 L58 113 1932 20.85 28. 88 .94 1.20 96 1917 31.11 40.52 L 65 1.98 141 1933 18.07 25. 67 .85 1.11 85 1918 37. 96 48. 80 2.15 2. 54 177 1934 20.24 28.19 .98 1.26 95 1919 43. 29 56. 63 2. 54 3.03 207 1935 22. 42 30.24 L07 1.33 103 1920 51.73 65. 40 2.98 3. 46 242 1936 24. 53 32. 28 L 15 1. 42 111 1921 33. 62 44. 67 L 77 2.12 155 1937 28.00 36. 32 L 33 L 61 126 1922 32. 75 43. 33 L 73 2.07 151 1938 27. 73 36.18 L 31 L58 125 1923 37. 24 48. 25 L 89 2. 25 169 1939 27. 39 35. 82 L 30 1. 56 123 1924 37. 92 49. 32 L 94 2. 29 173 1940 28.05 36. 68 L 36 L 59 126 1925 38. 77 49.90 L97 2. 29 176 1941 34. 85 43. 64 L69 1.93 154 1926 39. 87 50. 83 L98 2. 31 179 1942 46. 64 56.07 2.19 2. 49 201 1927 40.11 50. 85 1.98 2. 28 179 1943 61. 91 72. 85 2.87 3. 27 264
BASIS OF RATE AND DIVISION
1941 1942 1943
BASIS OF RATE AND DIVISION July
1 Oct.
1 Jan.
1 Apr. July Oct.
1 Jan.
1 Apr. July
1 Oct.
1
Per month with b o a r d -United States $36. 45 $37.45 $37.08 $41.47 $47. 29 $50. 83 $50. 89 $56. 84 $64. 62 $65.22
New England 42. 94 46. 31 47.70 52.08 54. 05 59.40 61.43 66. 50 69.47 72.80 Middle Atlantic 39. 24 39.68 40.17 44. 56 48. 00 50.15 51.53 57. 25 61.19 62. 00 East North Central 39.03 39. 67 38. 71 44. 52 46.12 49.99 50. 60 56.14 59. 29 60.50 West North Central 36. 37 38. 25 33.72 45.16 49. 29 56.01 49. 81 61.93 68.02 73. 40 South Atlantic 20. 57 21.75 22. 34 23.96 24. 49 26.21 28.68 29. 63 32. 75 32.80 East South Central 18. 99 19. 87 2L 69 22.48 23. 41 25.89 28.09 29.14 30.85 3L30 West South Central 23.58 25.48 28. 20 29.12 30. 31 34.97 38.29 38.60 43. 01 44. 30 Mountain 45.04 47. 33 45.13 5L 60 60. 32 67. 99 65. 51 72.38 82.69 85.80 Pacific 55. 50 59.65 62. 33 66.58 78. 29 90. 93 93.21 104.99 114. 54 118.00
Per month without b o a r d -United States ^ 44. 95 45. 47 47. 77 50. 54 56. 97 '59. 25 62. 43 67.21 76. 00 75. 44
New England 71.57 72.12 75.37 82. 30 85. 69 89.70 93. 63 98. 00 102.07 108.40 Aliddle Atlantic 57.76 57. 75 59.53 67.27 72. 39 73.78 75.26 83. 21 93.11 94. 00 East North Central 52. 04 53. 75 53.16 59.84 62.81 67.17 68. 34 76.18 80.70 82.10 West North Central 47. 67 50. 23 46. 93 58.24 63. 26 72.15 67. 37 81.18 87. 35 93.10 South Atlantic 29. 73 30.84 32.90 34.07 36. 02 36. 92 42. 36 42. 62 46.54 45. 60 East South Central 26. 31 27.83 30.10 31.25 32.86 35. 30 39. 02 40.01 42.13 43.20 West South Central 32. 32 35. 24 38. 50 39.13 4L96 47. 34 52.39 54.80 58.13 61.10 Mountain 62.84 64. 01 62.46 73. 07 79. 77 89. 62 89. 30 98. 21 109.15 115. 40 Pacific 78. 47 85.19 87.89 94.88 105. 77 123.52 125. 70 139. 50 150.38 153.30
Per day with b o a r d -United States L 80 L8B L 77 L 83 2.16 2. 54 2.39 2.47 2. 93 3.17
New England 2. 27 2. 45 2. 57 2. 67 2.89 3.10 3.18 3. 22 3. 54 3.86 Middle Atlantic _ 2. 30 2. 42 2. 31 2.42 2. 73 3. 06 2. 90 3.04 3. 37 3.56 East North Central _ 2. 23 2.29 2.16 2. 32 2.58 2. 96 2. 80 2. 96 3.32 3.47 West North Central 2.10 2. 30 L 94 2.14 2. 60 3. 59 2. 83 2. 99 3. 55 4.44 South Atlantic L09 L 17 1.19 L22 1.28 L 42 1.53 1.59 L74 L 87 East South Central .90 1.02 1.05 L 06 1.13 L37 1.39 1.42 L54 L 71 West South Central L 25 1.36 1.43 L42 L58 L 86 2.03 L 98 2. 24 2.43 Mountain 2.18 2. 38 2.16 2. 39 2.88 3.61 3. 20 3. 27 3.82 4. 42 Pacific 2. 63 2. 97 2.86 3.01 3.53 4.43 4.45 4. 63 5.24 5.60
Per day without board— United States L98 2. 08 2.12 2.10 2.45 2. 76 2. 83 2. 88 3. 34 3. 51
New England 3. 22 3.39 3. 43 3.60 3. 76 4.06 4.19 4. 33 4.48 4.88 Middle Atlantic 2.93 3. 09 3.02 3.19 3.48 3. 88 3. 75 3. 89 4. 33 4.49 East North Central 2.79 2. 89 2. 73 2. 91 3.20 3. 67 3. 53 3.69 4.07 4. 34 West North CentraL. 2.69 2. 90 2.53 2.81 3.29 4.33 3. 65 3. 76 4.44 5. 54 South Atlantic 1.40 L 54 1.56 1.56 L 64 L82 2.01 2.06 2.19 2.28 East South Central L16 1.33 1.36 L37 L42 1.75 L79 I 80 1.96 2.20 West South Central L 55 1.72 L78 L 72 L92 2. 30 2.43 2.40 2.70 2.95 Mountain. 2.82 2. 96 2.79 3.04 3.53 4. 34 3.13 4.13 4.85 5.34 Pacific 3. 33 3.73 3.64 3. 88 4.56 5.60 5.65 5. 92 6. 50 7.08
Source: Department of Agriculture, Bureau of Agricultural Economics; annual report. Agricultural Statistics. Figures are published quarterly in Crops and Markets.
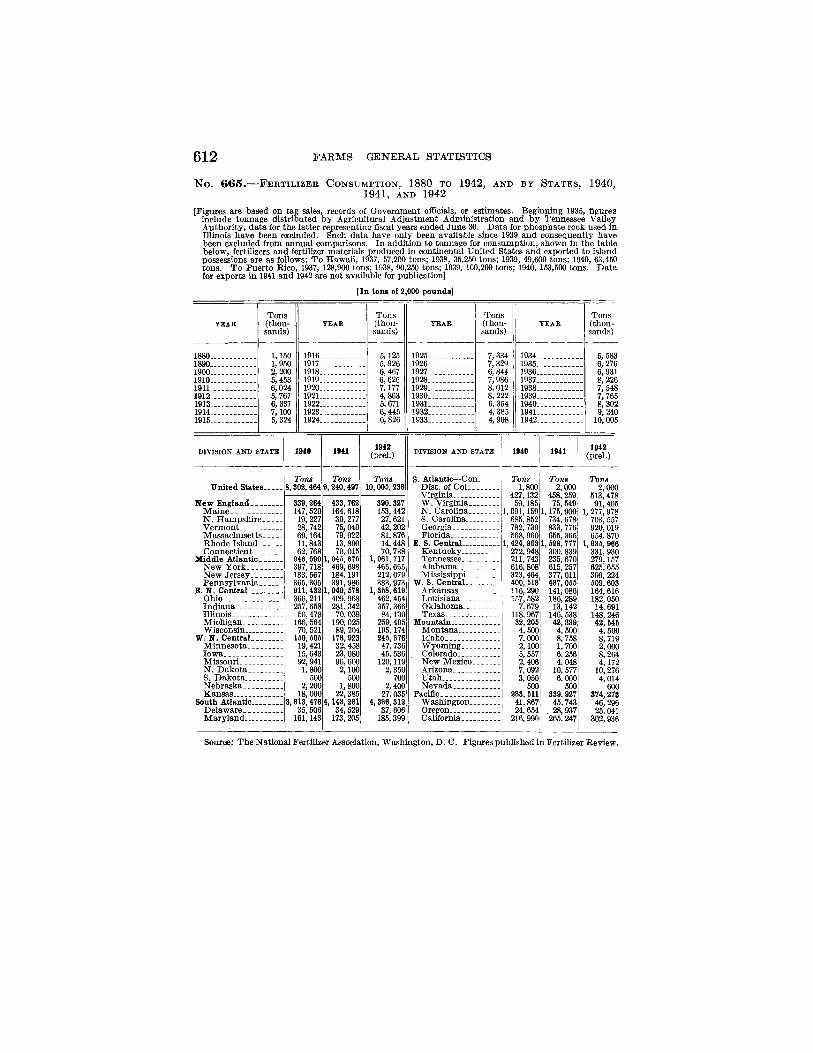
612 FARMS^—GENERAL STATISTICS
N o . 6 6 5 . — F E R T I L I Z E R C O N S U M P T I O N , 1 8 8 0 TO 1 9 4 2 , AND BY S T A T E S , 1 9 4 0 , 1 9 4 1 , AND 1 9 4 2
[Figures are based on tag sales, records of Government officials, or estimates. Beginning 1935, figures include tonnage distributed by Agricultural Adjustment Administration and by Tennessee Valley Authority, data for the latter representing fiscal years ended June 30. Data for phosphate rock used in Illinois have been excluded. Such data have only been available since 1939 and consequently have been excluded from annual comparisons. In addition to tonnage for consumption, shown in the table below, fertilizers and fertilizer materials produced in continental United States and exported to island possessions are as follows: To Hawaii, 1937, 57,200 tons; 1938, 35,250 tons; 1939, 49,600 tons; 1940, 63,450 tons. To Puerto Rico, 1937, 128,900 tons; 1938, 90,250 tons; 1939, 100,200 tons; 1940, 153,500 tons. Data for exports in 1941 and 1942 are not available for publication]
[In tons of 2,000 pounds]
Tons (thou-sands)
1,150 1916 1,950 1917 2,200 1918 5,453 1919 6,024 1920 5,767 1921. 6,337 1922 7,100 1923 5,324 1924
Tons (thou-sands)
5,125 1925 5,926 1926 6,467 1927 6,626 1928 7,177 1929 4,863 1930 6,671 1931 6,445 1932 6,826 1933
Tons (thou-sands)
7,334 1934 7, 329 1935 6,844 1936 7,986 1937 8, 012 1938 8, 222 1939 6. 354 1940 4,385 1941 4, 908 1942
Tons (thou-sands)
1880. 1890. 1900. 1910. 1911. 1912 1913 1914 1915
5, 583 6,276 6,931 8,226 7,548 7,765 8,302 9,240
10,005
DIVISION AND STATE 1940 1941 1942 (prel.) DIVISION AND STATE 1940 1941 1942
(prel.)
United States
New England Maine N. Hampshire--Vermont Massachusetts - _ Rhode Is land-- . Connecticut
Middle Atlantic New York New Jersey Pennsylvania . . .
E. N. Central Ohio Indiana Illinois Michigan Wisconsin
W. N. Central Minnesota Iowa Missouri N. Dakota S. Dakota Nebraska Kansas
South Atlantic Delaware Maryland
Tons 8,302,464
Tons 9,240,497
Tons 10,005,238
339,264 147, 520 19, 227 28,742 69,164 11, 843 62,768
846, 590 397,718 183,567 365,305 911, 432 366,211 257,658 50,478
166, 564 70, 521
150, 505 19,421 15,643 92,941 1,800
500 2,200
18,000 3,813,476
35, 506 161,143
433, 762 164,618 30,277 75,040 79,922 13.890 70,015
1,045, 875 469,698 184.191 391,986
1,040, 578 409,968 281, 342 70,039
190,025 89,204
178,923 32,458 23,080 96,600 2,100
500 1, 800
22,385 4, 143, 261
34, 529 173, 205
390,327 153, 442 27,621 42, 202 81,876 14, 448 70,738
1,061,717 465,665 212, 079 383,973
1,358,619 462,454 357,366 84,130
259, 495 195,174 245, 876 47, 736 45, 536
120,119 2, 350
700 2,400
27, 035 4,386,312
37, 606 185,399
S. Atlantic—Con. Dist. of Col Virginia W. Virginia N. Carolina S. Carolina Georgia Florida
E. S. CentraL — Kentucky Tennessee Alabama Mississippi
W. S. Central Arkansas Louisiana ^ Oklahoma Texas
Mountain Montana. . Idaho Wyoming Colorado New Mexico Arizona Utah. Nevada
Pacific Washington Oregon California
Tons 1,800
427,132 59,185
, 091,159 685,852 782, 739 568,960
272,948 211, 743 616,808 323,464 400,518 116, 290 157,582
7,679 118,967 32,205 4,500 7,000 2,100 5,557 2,406 7,092 3,050
500 283, 511 41,867 24, 654
216,990
Tons 2,000
458, 259 75, 549
1,175,900 734,678 833, 776 655,365
1, 528, 777 300, 839 235, 670 615, 257 377, Oil 487, 055 141,086 186, 289 13,142
146, 538 42, 339 4,500 8, 758 1,700 6, 256 4,048
10,577 6,000
500 339,927 45,743
. 28,937 265,247
Tons 2,000
513,478 91,405
1,277,978 703,557 920, 019 654,870
1,635, 966 331,930 279,157 625, 655 399, 224 509,603 164, 616 182,050 14, 691
148, 246 42, 545 4, 500 8, 719 2,000 8,264 4,172
10,276 4,014
600 374, 273 46,296 25,041
Source: The National Fertilizer Association, Washington, D. C. Figures published in Fertilizer Review.

C O O P E R A T I V E B U S I N E S S 613 N o . 6 6 6 . — F A R M E R B U S I N E S S T H R O U G H C O O P E R A T I V E S , BY S T A T E S : 1 9 2 9 AND
1 9 3 9
NOTE.—For total number of all farms (base for percentages) see table 634.
F A R M S R E P O R T I N G BUSINESS W I T H OR T H R O U G H COOPERATIVES
A n y business, 1939 Selling Buying Service,
1939 1
N u m b e r Per-cent of all farms
1929 1939 Per-cent of all farms, 1939
1929 1939 Per-cent of all farms, 1939
N u m -ber
Per-cent of all farms
N u m b e r Per-cent of all farms N u m -
ber N u m -
ber
Per-cent of all farms, 1939
N u m -ber
N u m -ber
Per-cent of all farms, 1939
N u m -ber
Per-cent of all farms
United States 1,864,402 22.4 691,895 827,285 13.6 410,914 743,688 12.2 712,651 11.7
N e w England 27, 828 20.6 9,170 14, 920 11.0 10, 897 15,250 11.3 9,688 7.1 Maine 4,827 12.4 756 1,796 4.6 1,674 2,083 5.3 2,196 5.6 N e w Hampshire 3,209 19.4 461 1,448 8.7 1,647 1, 683 10.2 1,121 6.8 Vermont 8,714 37.0 4, 304 5, 580 23.7 2, 632 4, 308 18.3 3,467 14.7 Massachuset ts 5, 610 17.6 1, 448 2, 902 9.1 2, 891 3,838 12.0 1,602 6.0 Rhode Island 360 n . 6 140 169 5.6 148 184 6.1 117 3.9 Connecticut 5,113 24.2 2,062 3,026 14.3 1, 905 3,154 14.9 1,135 5.4
Middle Atlantic 105,256 30.2 41, 068 60, 304 17.8 30,856 56, 575 16.8 45, 512 18.1 N e w York 61,088 39.9 28,015 37, 368 24.4 19, 933 34,284 22.4 26,052 17.0 N e w Jersey 8,491 32.9 1, 750 5, 913 22.9 1,899 4, 277 16.6 2, 486 9.6 Pennsylvania 35, 677 21.1 11, 303 17,023 10.1 9,024 18,014 10.7 16, 974 10.0
East North Central 851,589 34.9 170,992 210, 016 20.9 115, 368 198, 685 19.7 209, 670 20.8 Ohio 71, 599 30.6 31,067 42, 577 18.2 26, 736 41, 571 17.8 41, 449 17.7 Ind iana 68,184 31.6 20, 461 29, 945 16.2 18, 742 31, 339 17.0 37, 039 20.1 Illinois. 70, 296 32.9 41, 857 41,024 19.2 16, 861 36, 266 17.0 50, 641 23.7 Michigan 61,199 32.6 31. 331 33, 766 18.0 28. 721 35, 496 18.9 36, 291 19.3 Wisconsin 90, 261 , 48.3 46, 276 62, 706 33.6 24, 308 53, 913 28.9 44, 260 23.7
West North Central 428, 648 ' 89.8 290,189 295, 748 27.1 159, 988 279, 288 25.6 217, 614 19.9 Minnesota 130, 261 66.0 95, 639 100, 758 51.1 39. 561 89, 772 45.6 62, 079 31.6 Iowa 96, 639 45.3 68, 970 63, 288 29.7 33,183 60, 320 28.3 56, 363 26.4 Missouri 58,170 22.7 47, 442 36, 654 14.3 31, 982 34, 720 13.6 34, 217 13.4 Nor th Dakota 29, 412 39.8 20, 382 20, 541 27.8 11,085 19,109 25.8 13, 463 18.2 South Dakota 24, 624 34.0 18,141 16, 643 23.0 11,176 17, 018 23.5 9, 337 12.9 Nebraska 44, 938 37.1 23, 397 28, 578 23.6 15,098 28, 692 23.7 20, 493 16.9 Kansas 44, 604 28.5 26, 228 29, 286 18.7 17, 903 29, 667 19.0 21, 562 13.8
South Atlantic 96,437 9.5 28, 662 40,144 8.9 15, 866 39,139 8.8 55, 960 6.6 De laware . 1,241 13.8 64 448 6.0 186 562 6.2 620 6.9 M a r y l a n d 8, 699 20.4 4, 533 5,836 13.9 3, 383 5, 561 13.2 3,367 8.0 Dis t . of C o l u m b i a . . . 1 L 6 1 L 6 Virginia 29,725 17.0 4, 394 13,442 7.7 " '3 , '94r "i6,~77r ' i 5 , ' 63 r " " 8 . ' 9 West Virginia 8,749 8.8 1, 662 4, 391 4.4 2,268 4,120 4.1 3, 858 3.9 N o r t h Carolina 17, 862 6.4 4,606 5,606 2.0 2,158 5,847 2.1 11, 633 4.2 South Carolina 5, 381 3.9 2, 469 2,171 1.6 556 1,162 .8 3, 333 2.4 Georgia 18, 201 8.4 5,142 3, 663 1.7 1, 724 2, 668 L 2 15,019 7.0 Florida 6, 678 10.7 5, 802 4, 686 7.4 1, 645 3,442 5.6 2,583 4.1
East South Central . 89, 766 8.8 19, 670 42, 140 4.1 15, 948 25, 757 2.5 49, 890 4.8 Ken tucky 28,076 11.1 4,793 15, 344 6.1 1, 260 6, 331 2.5 14,053 6.6 Tennessee . . . 22,084 8.9 3, 552 7,276 2.9 2, 872 5,006 2.0 14, 669 5.9 Alabama 16, 222 7.0 7, 270 6, 687 2.9 7, 682 6,174 2.7 8,709 3.8 Mississippi 23, 384 8.0 4,055 12, 833 4.4 4,134 8,246 2.8 11, 969 4.1
West South Central 102,155 10.6 42, 292 48, 785 5.1 18,421 36, 878 8.8 61,412 6.4 Arkansas 11, 470 5.3 4, 651 5,064 2.3 2, 519 3,709 L 7 7,038 3.2 Louisiana 14, 303 9.6 7, 467 7,175 4.8 6, 929 6, 566 4.4 5, 713 3.8 Oklahoma- 28, 541 15.9 21, 715 17, 791 9.9 5, 273 13, 516 7.6 14, 936 8.3 Texas 47, 841 11.4 8,459 18,705 4.5 3,700 13,088 3.1 33, 725 8.1
Mountain 61, 128 26.2 28, 347 40, 417 17.8 12, 298 83, 590 14.4 24, 944 10.7 M o n t a n a . . _ 14,063 33.6 < 5, 574 9,035 21.6 3,034 9, 361 22.4 5, 613 13.4 Idaho 18, 901 43.3 7,031 13, 806 31.6 2,174 10, 239 23.5 7, 388 16.9 Wyoming 3, 724 24.8 2, 145 2, 221 14.8 581 1, 617 10,8 1, 760 11.7 Colorado 11, 623 22.6 6, 783 7,042 13.7 3, 339 6,044 11.8 6, 794 n . 3 N e w Mexico 2, 357 6.9 1, 443 1, 240 3.6 669 1,081 3.2 1,136 3.3 Arizona 2,780 15.1 639 1,238 6.7 182 1,474 8.0 841 4.6 U t a h . . 6, 940 27.3 4,193 5, 318 20.9 2,284 3, 669 14.0 2,020 7.9 N e v a d a 735 20.6 539 617 14.6 135 215 6.0 392 11.0
Pacific 101,655 86.8 61,495 74, 861 27.1 81,272 58, 576 2L2 88, 621 14.0 Washington 31, 402 38.4 16, 737 22,076 27.0 11, 886 21, 683 26.5 12, 495 15.3 Oregon 22, 402 36.2 8, 638 15, 237 24.6 4, 502 13, 627 2L9 8, 236 13.3 California 47, 851 36.1 36,120 37, 548 28.3 14, 886 23, 366 17.6 17, 890 13.5
1 Includes mutua l fire insurance companies, mutua l telephone companies, cooperative truck routes, spray rings, rural electrification associations, etc.
Source: Department of Commerce, Bureau of the Census; Sixteenth Census Reports, Agriculture, Vol. III.
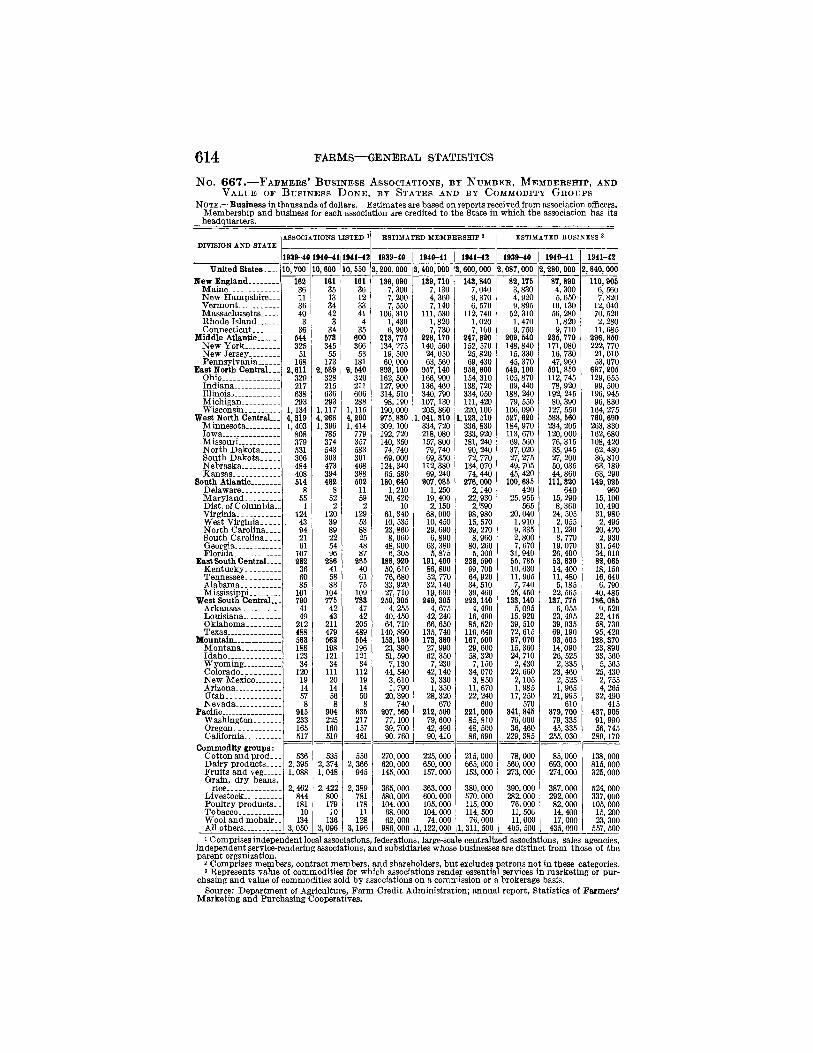
614 F A R M S — G E N E R A L S T A T I S T I C S
N o . 6 6 7 . — F A B M E R S ' BUSINESS ASSOCIATIONS, BY NUMBER, MEMBERSHII», AND VALUE OF BUSINESS DONE, BY STATES AND BY COMMODITY GROUPS
NOTE.—Business in thousands of dollars. Estimates are based on reports received from association officers. Membership and business for each association are credited to the State in which the association has its headquarters.
ASSOCIATIONS LISTED 1 ESTIMATED M E M B E R S H I P 2 ESTIMATED B U S I N E S S 3 DIVISION AND STATE
1939-40 1940-41 1941-43 1939-40 1940-41 1941-42 1939-40 1940-41 1941-42 United States 10,700 10,600 10, 550 3,200, 000 3,400, 000 3, 600,000 2, 087,000 2,280,000 2, 840, 000
New England 162 161 161 136,690 139,710 143,840 82,175 87,890 110,905 Mame 36 35 36 7, 300 7,130 7, 040 3, 830 4,300 6,560 New Hampshire.-- 11 13 12 7,200 4, 360 9, 370 4,920 5,650 7, 820 Vermont __ 36 34 33 7, 650 7,140 6, 570 9,895 10,130 12, 040 Massachusetts 40 42 41 106,310 111, 530 112,740 52, 310 56,280 70, 520 Rhode Island 3 3 4 1,430 1,820 1,020 1,470 1,820 2,280 Connecticut 36 34 35 6,900 7, 730 7,100 9, 750 9, 710 11,685
Middle Atlantic Ö44 673 600 213, 775 228,170 247, 820 209, 540 235, 770 296, 850 New York 326 345 366 134, 275 140, 560 152, 570 148,840 171, 080 222,770 New Jersey- 61 55 53 19, 500 24, 050 25,820 15, 330 16, 730 21, 010 Pennsylvania 168 173 181 60,000 63, 560 69, 430 45, 370 47, 960 53,070
East North Central 2,611 2, 589 2, 540 893,100 957,140 958,600 549.190 591, 850 687, 205 Ohio 329 328 320 162, 500 166,900 154, 310 105, 870 112, 745 129, 655 Indiana 217 215 211 127, 900 136, 460 138, 720 69, 440 78, 920 99, 500 Illinois-. 638 636 606 314, 510 340, 790 334, 050 188, 240 192, 245 196, 945 Michigan 293 293 288 98,190 107,130 111,420 79, 550 80, 390 96,830 Wisconsin 1,134 L117 1,115 190,000 205, 860 220,100 106, 090 127, 550 164, 275
West North Central.. _ 4,319 4; 268 4,290 975, 830 1,041,310 1,123, 510 527,620 588, 560 760,690 Miimesota 1,403 1, 396 1,414 309, 100 334, 720 336, 830 184, 970 234, 205 263, 830 Iowa 808 785 779 192, 720 218, 080 233, 920 113, 670 120,000 162, 680 Missouri 379 374 357 140, 350 157,800 181, 240 69, 560 76,315 108, 420 North Dakota 531 543 583 74, 740 79, 740 90, 240 37,020 35, 945 62, 480 South Dakota 306 303 301 69,000 69, 350 72, 770 27, 275 27, 200 36,810 Nebraska 484 473 468 124, 340 112, 380 134,070 49, 705 50,035 63,180 Kansas 408 394 388 65, 580 69, 240 74, 440 45, 420 44,860 63, 290
South Atlantic 514 482 502 180,640 207,085 276,000 100,635 111, 320 149,925 Delaware 8 8 11 1,210 1,250 2,140 420 640 960 Maryland 55 62 59 20, 420 19, 400 22,930 25,955 15, 290 16,100 Dist. of Columbia- 1 2 2 10 2,150 2,'590 566 8, 360 10,490 Virginia 124 120 129 61, 340 68,000 98,980 20,040 24, 505 31,980 West Virginia 43 39 53 10, 535 10, 450 15, 570 1,910 2,055 2, 495 North Carolina 94 89 88 23,860 29, 690 39, 270 9,335 11, 230 20,420 South Carolina 21 22 25 8, 060 6,890 8, 960 2,800 3, 770 2, 930 Georgia 61 54 48 48,900 63, 380 80, 260 7, 670 19,070 31, 540 Florida 107 96 87 6, 305 5, 875 5, 300 31, 940 26, 400 34, 010
East South Central 282 286 285 188, 920 191, 400 238, 590 55, 785 53, 630 82, 065 Kentucky 36 41 40 50, 610 86, 800 99, 700 10, 630 14, 400 18,150 Tennessee 60 58 61 76, 680 52, 770 64,920 11, 965 11, 480 16,640 Alabama 85 83 75 33, 920 32,140 34, 510 7, 740 5,185 6,790 Mississippi 101 104 109 27, 710 19, 690 39, 460 25, 450 22, 565 40,485
West South Central... 790 775 783 250, 305 249, 305 223,140 133,140 137, 775 186,085 Arkansas- 41 42 47 4, 255 4, 675 4, 490 5,095 6, 055 9, 520 Louisiana 49 43 42 40, 450 42, 240 16, 490 15, 920 23, 495 22,415 Oklahoma 212 211 205 64, 710 66,650 85, 520 39, 510 39,035 58, 730 Texas 488 479 489 140, 890 135, 740 116, 640 72,615 69,190 95, 420
Mountain 563 562 554 153,180 173, 380 167, 500 87,070 93, 505 128,370 Montana 188 198 196 23, 390 27,990 29, 600 15, 360 14,090 23,890 Idaho 123 121 121 51, 590 62, 350 58, 320 24, 710 26, 525 33, 560 Wyoming 34 34 34 7,130 7,230 7,150 2,430 2,335 5,565 Colorado 120 111 112 44, 540 42,140 34,070 22, 660 23, 460 25, 430 New Mexico 19 20 19 3,610 3, 330 3,850 2,105 2, 525 2, 755 Arizona 14 14 14 L790 1,350 11, 670 1,985 1,965 4,265 Utah 67 56 50 20,390 28,320 22, 240 17, 250 21,995 32, 490 Nevada 8 8 8 740 670 600 570 610 415
Pacific- 915 904 835 207, 560 212,500 221,000 341, 845 379, 700 437,905 Washington 233 225 217 77,100 79,600 85,810 76,000 79, 335 91, 990 Oregon.-. 165 160 157 39, 700 42, 490 48, 500 36, 460 45, 335 56, 745 California. 517 519 461 90, 760 90, 410 86, 690 229, 385 255, 030 289,170
Commodity groups: Cotton and prod-. _ 536 535 556 270, 000 225,000 215,000 78,000 85,000 138,000 Dairy products 2,395 2, 374 2, 366 620, 000 650,000 665, 000 560, 000 693, 000 815, 000 Fruits and veg 1,088 1,048 945 145, 000 157,000 153,000 273,000 274,000 325,000 Grain, dry beans.
1,088 274,000 325,000
rice 2,462 2,422 2, 389 365,000 363,000 380,000 390,000 387,000 524,000 Livestock 844 800 781 580,000 600,000 570, 000 282, 000 292, 000 337,000 Poultry products. . 181 179 178 104,000 105,000 115,000 76,000 82, 000 105,000 Tobacco 10 10 11 68,000 104, 000 114, 500 11, 500 14, 400 15, 200 Wool and mohair.- 134 136 128 62,000 74,000 76,000 11,000 17,000 23, 300 All others 3,050 3,096 3,196 986, 000 1,122,000 1, 311, 500 405, 500 435, 600 557, 500 1 Comprises independent local associations, federations, large-scale centralized associations, sales agencies,
independent service-rendering associations, and subsidiaries whose businesses are distuict from those of the parent organization.
2 Comprises members, contract members, and shareholders, but excludes patrons not in these categories. 3 Represents value of commodities for which associations render essential services in marketing or pur-
chasing and value of commodities sold by associations on a commission or a brokerage basis. Source: Department of Agriculture, Farm Credit Administration; annual report. Statistics of Farmers'
Marketing and Purchasing Cooperatives.
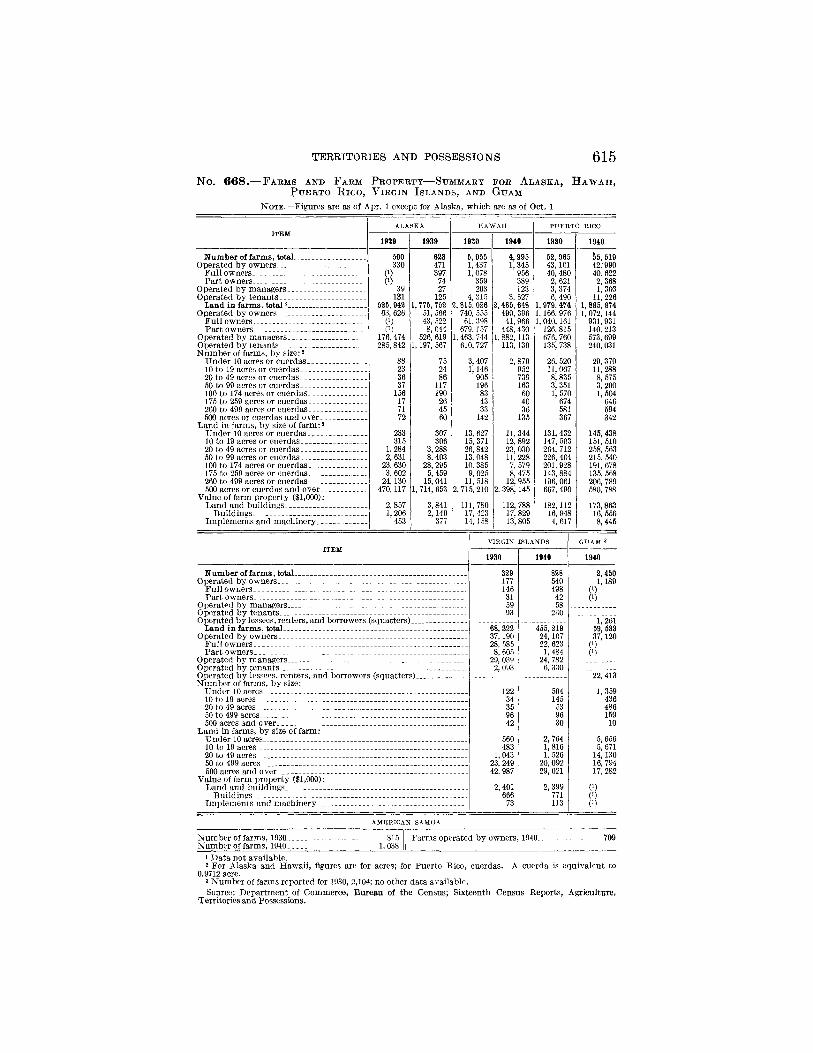
T E R R I T O R I E S A N D P O S S E S S I O N S 615 N o . 6 6 8 , — F A R M S AND F A R M P R O P E R T Y — S U M M A R Y FOR AL AS KA, H A W A I I ,
P U E R T O R I C O , V I R G I N ISLANDS, AND G U A M
NOTE.—-Figures are as of Apr. 1 except for Alaska, which are as of Oct. 1
1929 1939 1930 1910
PUERTO RICO
1930 1910
N u m b e r of fa rms, total Operated b y owners__-
Fu l l owners. Par t owners___
Operated b y managers Operated by tenants
Land in farms, total 2 Operated by owners. __
Fu l l owners P a r t owners
Operated by managers . Operated by t e n a n t s . . N u m b e r of farms, by size: 2
Under 10 acres or cuerdas 10 to 19 acres or cuerdas 20 to 49 acres or cuerdas 50 to 99 acres or cuerdas 100 to 174 acres or cuerdas 175 to 259 acres or cuerdas 260 to 499 acres or cue rdas . . 500 acres or cuerdas and ove r . . .
Land in farms, by size of farm: 2 Under 10 acres or cuerdas 10 to 19 acres or cuerdas 20 to 49 acres or cuerdas 50 to 99 acres or cuerdas 100 to 174 acres or cuerdas 175 to 259 acres or cuerdas. 260 to 499 acres or c u e r d a s . . . . . 500 acres or cuerdas and over . . .
Value of farm property ($1,000): Land and bui ldings .
B u i l d i n g s . . . Implements and m a c h ú i e r y . . -
500 330
0)
(')
39 131
525, 942 63, 626 Q)
(0 176, 474 285, 842
23 36 37
156 17 71 72
233 315
1,284 2, 631
23, 630 3, 602
24,130 470,117
2,857 1 , 2 0 6
453
623 471 397
74 27
125 1, 775, 752
51, 566 43, 522 8, 044
526, 619 1,197, 567
75 24 86
117 190 26 45 60
307 306
3, 288 8, 403
28, 295 5, 459
15, 041 1, 714, 653
3, 841 2,140
377
5 , 9 5 5 1,437 I,078
359 203
4,315 2,815, 026
740, 555 61, 398
679, 157 1, 463, 744
610, 727
3, 407 1,146
905 196 83 43 33
142
13, 627 15, 371 26, 842 13, 048 10, 385 9,025
II, 518 2, 715, 210
111,780 17, 423 14,168
4 , 9 9 5 1,345
956 389 123
3, 527 2, 485, 648
490, 396 41, 966
448, 430 1, 882,113
113,139
2, 870 952 739 163 60 40 36
135
11, 344 12, 892 23, 030 11, 228 7, 579 8, 475
12, 955 , 398,145
112, 788 17, 829 13, 805
52, 965 43,101 40, 480
2, 621 3, 374 6, 490
1, 979, 4 7 4 1,166, 976 1, 040,161
126, 815 676, 760 135, 738
26, 520 11, 067 8, 835 3, 351 1, 570
674 581 367
131, 432 147, 503 264, 712 226, 464 201, 928 143, 884 196, 061 667, 490
182,112 16, 948 4, 617
hb, 519 42,990 40. 622 2, 368 1,303
11, 226 1, 885, 874 1,072,144
931, 931 140, 213 573, 699 240, 031
29, 370 11, 288 8, 575 3,200 1, 504
646 594 342
145, 438 151, 510 258, 563 215, 540 191, 678 135, 568 206, 789 580, 788
1 7 3 , 8 6 3 16, 556
8 , 4 4 5
VIRGIN ISLANDS
1930 1940 1940
Number of fa rms , total Operated by owners
Fu l l owners Par t owners
Operated by managers Operated by tenants Operated b y lessees, renters, and borrowers (squatters) . . .
Land in farms, total Operated by owners
Fu l l owners Pa r t owners
Operated by managers Operated by tenants Operated by lessees, renters, and borrowers (squatters). N u m b e r of farms, by size:
Under 10 acres 10 to 19 acres 20 to 49 acres 50 to 499 acres 500 acres and over
Land in farms, by size of farm: Under 10 acres 10 to 19 acres 20 to 49 acres 50 to 499 acres 500 acres and over
Value of farm property ($1,000): Land and buildings
Buildings. „_ Implements and machinery
329 177 146 31 59 93
540 498 42 58
230
2 , 4 5 0 1 , 1 8 9
8
68, 322 37,190 28, 585 8, -605
29, 039 2, 093
4 5 5 , 2 1 9 24,107 22, 623
1, 484 24, 782
6, 330
122 34 35 96 42
560 483
1,043 23,249 42, 987
2, 401 666
73
504 145
53 96 30
2, 764 1,816 1,526
20, 092 29, 021
2, 399 771 113
1,261 59, 533 37,120
(1) (0
22, 413
1,359 436 486 159
10
5, 656 5, 671
14,130 16, 794 17, 282
(0 (0 (0
AMERICAN SAMOA
N u m b e r of farms. 1930 815 Farms operated by owners, 1940.. 709 Number of farms. 1940 1,038
Farms operated by owners, 1940..
1 Data not available. 2 For Alaska and Hawaii , figures are for acres; for Puer to Rico, cuerdas. A cuerda is equivalent to
0.9712 acre. 3 Number of farms reported for 1930, 2,104; no other data available. Source: Department of Commerce, Bureau of the Census; Sixteenth Census Reports, Agriculture!
Territories and Possessions.