Ligand Nano-cluster Arrays in a Supported Lipid Bilayer
12
HAL Id: hal-01577346 https://hal-amu.archives-ouvertes.fr/hal-01577346 Submitted on 27 Apr 2018 HAL is a multi-disciplinary open access archive for the deposit and dissemination of sci- entific research documents, whether they are pub- lished or not. The documents may come from teaching and research institutions in France or abroad, or from public or private research centers. L’archive ouverte pluridisciplinaire HAL, est destinée au dépôt et à la diffusion de documents scientifiques de niveau recherche, publiés ou non, émanant des établissements d’enseignement et de recherche français ou étrangers, des laboratoires publics ou privés. Ligand Nano-cluster Arrays in a Supported Lipid Bilayer Emmanuelle Benard, Fuwei Pi, Igor Ozerov, Anne Charrier, Kheya Sengupta To cite this version: Emmanuelle Benard, Fuwei Pi, Igor Ozerov, Anne Charrier, Kheya Sengupta. Ligand Nano-cluster Arrays in a Supported Lipid Bilayer. Journal of visualized experiments : JoVE, JoVE, 2017, 122 (122), pp.e55060. 10.3791/55060. hal-01577346
-
Upload
khangminh22 -
Category
Documents
-
view
1 -
download
0
Transcript of Ligand Nano-cluster Arrays in a Supported Lipid Bilayer

HAL Id: hal-01577346https://hal-amu.archives-ouvertes.fr/hal-01577346
Submitted on 27 Apr 2018
HAL is a multi-disciplinary open accessarchive for the deposit and dissemination of sci-entific research documents, whether they are pub-lished or not. The documents may come fromteaching and research institutions in France orabroad, or from public or private research centers.
L’archive ouverte pluridisciplinaire HAL, estdestinée au dépôt et à la diffusion de documentsscientifiques de niveau recherche, publiés ou non,émanant des établissements d’enseignement et derecherche français ou étrangers, des laboratoirespublics ou privés.
Ligand Nano-cluster Arrays in a Supported Lipid BilayerEmmanuelle Benard, Fuwei Pi, Igor Ozerov, Anne Charrier, Kheya Sengupta
To cite this version:Emmanuelle Benard, Fuwei Pi, Igor Ozerov, Anne Charrier, Kheya Sengupta. Ligand Nano-clusterArrays in a Supported Lipid Bilayer. Journal of visualized experiments : JoVE, JoVE, 2017, 122(122), pp.e55060. 10.3791/55060. hal-01577346
Ligand Nano-cluster Arrays in a Supported Lipid Bilayer
Emmanuelle Benard1, Fuwei Pi1,2, Igor Ozerov1, Anne Charrier1, Kheya Sengupta1
1 Aix-Marseille Univ, CNRS, CINaM, Marseille, France
2 State Key Laboratory of Food Science and Technology, School of Food Science of Jiangnan University
Correspondence to: Kheya Sengupta at [email protected]
DOI: 10.3791/55060
Video Link
The video component of this article can be found at https://www.jove.com/video/55060/
Keywords: Bioengineering, Issue 122, protein nano-dots, nanobiopatterning, nano-clusters, supported
lipids bilayer, nanobiofunctionalization, cell adhesion
Date Published: 4/23/2017
Citation: Benard, E., Pi, F., Ozerov, I., Charrier, A., Sengupta, K. Ligand Nano-cluster Arrays in a
Supported Lipid Bilayer. J. Vis. Exp. (122), e55060, doi:10.3791/55060 (2017).
Abstract
Currently there is considerable interest in creating ordered arrays of adhesive protein islands in a sea of
passivated surface for cell biological studies. In the past years, it has become increasingly clear that living
cells respond, not only to the biochemical nature of the molecules presented to them but also to the way
these molecules are presented. Creating protein micro-patterns is therefore now standard in many biology
laboratories; nano-patterns are also more accessible. However, in the context of cell-cell interactions, there
is a need to pattern not only proteins but also lipid bilayers. Such dual proteo-lipidic patterning has so far
not been easily accessible. We offer a facile technique to create protein nano-dots supported on glass and
propose a method to backfill the inter-dot space with a supported lipid bilayer (SLB). From photo-bleaching
of tracer fluorescent lipids included in the SLB, we demonstrate that the bilayer exhibits considerable in-
plane fluidity. Functionalizing the protein dots with fluorescent groups allows us to image them and to show
that they are ordered in a regular hexagonal lattice. The typical dot size is about 800 nm and the spacing
demonstrated here is 2 microns. These substrates are expected to serve as useful platforms for cell
adhesion, migration and mechano-sensing studies.
Introduction
Cell adhesion takes place through specialized cell adhesion molecules (CAMs), proteins present on the
cell membrane that are capable of binding to their counterpart on the extra cellular matrix or on another
cell. On adhered cells, most adhesion molecules including the ubiquitous integrin and cadherin, are found
in the form of clusters 1. The interaction of T lymphocytes (T cells) with antigen presenting cells (APCs)
provides a particularly striking illustration of the importance of receptor clusters formed at the interface
between the two cells — often called an immunological synapse. Upon forming the first contact with the
APC, T cell receptors (TCRs) on the surface of the T cell form micron scale clusters that serve as
signaling platforms 2,3,4, and are eventually centralized to form a larger central supramolecular cluster
(cSMAC) 5,6,7. Recently, it was shown that on the APC side, the ligands of the TCR are also clustered 8.
In the context of T cell-APC interaction, the deployment of hybrid systems, where the APC is mimicked by
an artificial surface functionalized with relevant proteins, has greatly advanced our understanding of the
synaptic interface 2,3,4,5,6,7. In this context, it is highly relevant to design APC mimetic surfaces that capture
one or more aspects of the target cell. For example, if ligands are grafted on supported lipid bilayers, they
can diffuse in the plane of the bilayer, mimic the situation on the APC surface and at the same time allow
the formation of the cSMAC 6,7. Similarly, the clusters on the APC have been mimicked by creating islands
of ligands in a sea of polymers 9,10,11,12,13,14. However, these two features have so far not been combined.
Here we describe a novel technique to create nano-dots of anti-CD3 (an antibody that targets the TCR
complex) surrounded by a lipid bilayer with diffusing lipids. The bilayer is deposited using Langmuir-
Blodgett/Langmuir-Schaefer technique 7,15,16 and if desired, could be functionalized with a specific protein
— for example, the ligand of the T cell integrin (called ICAM1). In addition, the anti-CD3 protein dots could
be replaced with another antibody or CAM. While we have chosen the proteins for future use as platform
for T cell adhesion studies, the strategy detailed here can be adapted for any protein and even DNA.
Protocol
1. Cleaning Glass Cover-slides and Observation Chambers
1. Arrange the glass cover-slides on a multi-slide tray made of an inert material like
Polytetrafluoroethylene (PTFE).
2. Immerse the tray with slides and the observation chamber in a surfactant solution (any product
recommended for cleaning quartz cuvettes is suitable).
3. Using an ultrasonic bath, ultra-sonicate in the surfactant solution for 30 min at room temperature
(between 20 and 30 °C).
4. Rinse 5 times with ultrapure water (18.2 MΩ.cm, 0.059 µS/cm).
5. Ultra-sonicate in surfactant solution for 30 min at room temperature (between 20 and 30 °C).
6. Rinse 10 times with ultrapure water.
7. Repeat steps 1.5 and 1.6 twice.
8. Store in water at room temperature (between 20 and 30 °C) for up to one week.
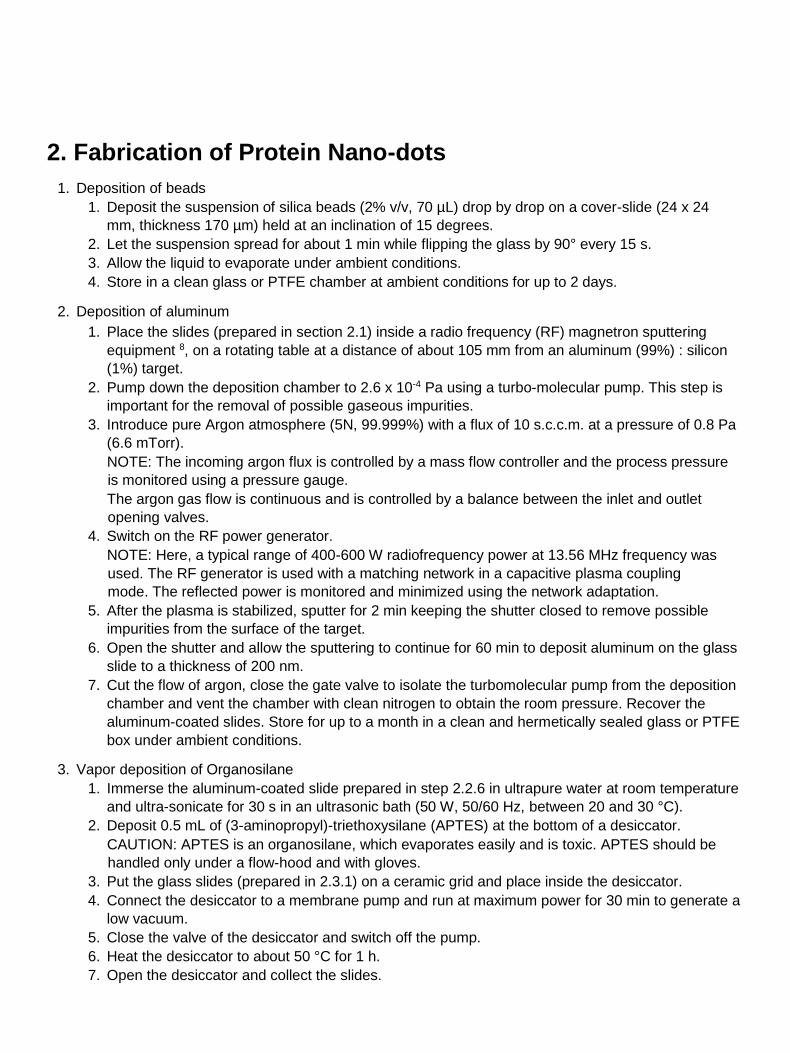
2. Fabrication of Protein Nano-dots
1. Deposition of beads
1. Deposit the suspension of silica beads (2% v/v, 70 µL) drop by drop on a cover-slide (24 x 24
mm, thickness 170 µm) held at an inclination of 15 degrees.
2. Let the suspension spread for about 1 min while flipping the glass by 90° every 15 s.
3. Allow the liquid to evaporate under ambient conditions.
4. Store in a clean glass or PTFE chamber at ambient conditions for up to 2 days.
2. Deposition of aluminum
1. Place the slides (prepared in section 2.1) inside a radio frequency (RF) magnetron sputtering
equipment 8, on a rotating table at a distance of about 105 mm from an aluminum (99%) : silicon
(1%) target.
2. Pump down the deposition chamber to 2.6 x 10⁻⁴ Pa using a turbo-molecular pump. This step is
important for the removal of possible gaseous impurities.
3. Introduce pure Argon atmosphere (5N, 99.999%) with a flux of 10 s.c.c.m. at a pressure of 0.8 Pa
(6.6 mTorr).
NOTE: The incoming argon flux is controlled by a mass flow controller and the process pressure
is monitored using a pressure gauge.
The argon gas flow is continuous and is controlled by a balance between the inlet and outlet
opening valves.
4. Switch on the RF power generator.
NOTE: Here, a typical range of 400-600 W radiofrequency power at 13.56 MHz frequency was
used. The RF generator is used with a matching network in a capacitive plasma coupling
mode. The reflected power is monitored and minimized using the network adaptation.
5. After the plasma is stabilized, sputter for 2 min keeping the shutter closed to remove possible
impurities from the surface of the target.
6. Open the shutter and allow the sputtering to continue for 60 min to deposit aluminum on the glass
slide to a thickness of 200 nm.
7. Cut the flow of argon, close the gate valve to isolate the turbomolecular pump from the deposition
chamber and vent the chamber with clean nitrogen to obtain the room pressure. Recover the
aluminum-coated slides. Store for up to a month in a clean and hermetically sealed glass or PTFE
box under ambient conditions.
3. Vapor deposition of Organosilane
1. Immerse the aluminum-coated slide prepared in step 2.2.6 in ultrapure water at room temperature
and ultra-sonicate for 30 s in an ultrasonic bath (50 W, 50/60 Hz, between 20 and 30 °C).
2. Deposit 0.5 mL of (3-aminopropyl)-triethoxysilane (APTES) at the bottom of a desiccator.
CAUTION: APTES is an organosilane, which evaporates easily and is toxic. APTES should be
handled only under a flow-hood and with gloves.
3. Put the glass slides (prepared in 2.3.1) on a ceramic grid and place inside the desiccator.
4. Connect the desiccator to a membrane pump and run at maximum power for 30 min to generate a
low vacuum.
5. Close the valve of the desiccator and switch off the pump.
6. Heat the desiccator to about 50 °C for 1 h.
7. Open the desiccator and collect the slides.
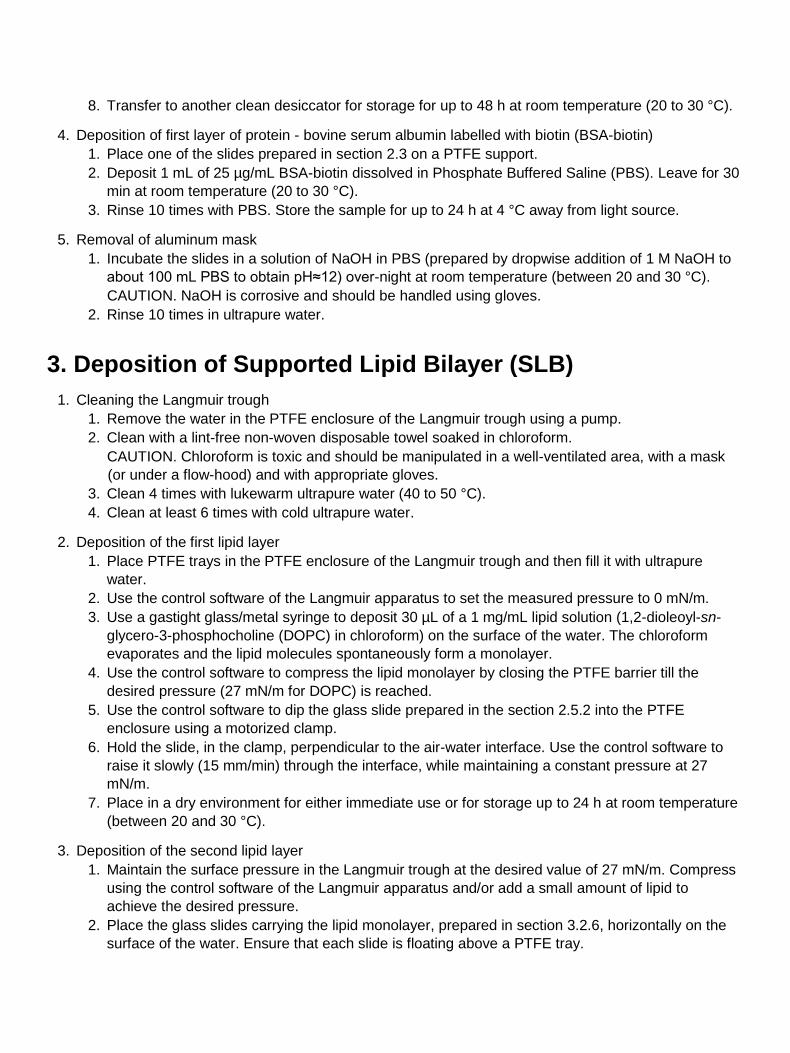
8. Transfer to another clean desiccator for storage for up to 48 h at room temperature (20 to 30 °C).
4. Deposition of first layer of protein - bovine serum albumin labelled with biotin (BSA-biotin)
1. Place one of the slides prepared in section 2.3 on a PTFE support.
2. Deposit 1 mL of 25 µg/mL BSA-biotin dissolved in Phosphate Buffered Saline (PBS). Leave for 30
min at room temperature (20 to 30 °C).
3. Rinse 10 times with PBS. Store the sample for up to 24 h at 4 °C away from light source.
5. Removal of aluminum mask
1. Incubate the slides in a solution of NaOH in PBS (prepared by dropwise addition of 1 M NaOH to
about 100 mL PBS to obtain pH≈12) over-night at room temperature (between 20 and 30 °C).
CAUTION. NaOH is corrosive and should be handled using gloves.
2. Rinse 10 times in ultrapure water.
3. Deposition of Supported Lipid Bilayer (SLB)
1. Cleaning the Langmuir trough
1. Remove the water in the PTFE enclosure of the Langmuir trough using a pump.
2. Clean with a lint-free non-woven disposable towel soaked in chloroform.
CAUTION. Chloroform is toxic and should be manipulated in a well-ventilated area, with a mask
(or under a flow-hood) and with appropriate gloves.
3. Clean 4 times with lukewarm ultrapure water (40 to 50 °C).
4. Clean at least 6 times with cold ultrapure water.
2. Deposition of the first lipid layer
1. Place PTFE trays in the PTFE enclosure of the Langmuir trough and then fill it with ultrapure
water.
2. Use the control software of the Langmuir apparatus to set the measured pressure to 0 mN/m.
3. Use a gastight glass/metal syringe to deposit 30 µL of a 1 mg/mL lipid solution (1,2-dioleoyl-sn-
glycero-3-phosphocholine (DOPC) in chloroform) on the surface of the water. The chloroform
evaporates and the lipid molecules spontaneously form a monolayer.
4. Use the control software to compress the lipid monolayer by closing the PTFE barrier till the
desired pressure (27 mN/m for DOPC) is reached.
5. Use the control software to dip the glass slide prepared in the section 2.5.2 into the PTFE
enclosure using a motorized clamp.
6. Hold the slide, in the clamp, perpendicular to the air-water interface. Use the control software to
raise it slowly (15 mm/min) through the interface, while maintaining a constant pressure at 27
mN/m.
7. Place in a dry environment for either immediate use or for storage up to 24 h at room temperature
(between 20 and 30 °C).
3. Deposition of the second lipid layer
1. Maintain the surface pressure in the Langmuir trough at the desired value of 27 mN/m. Compress
using the control software of the Langmuir apparatus and/or add a small amount of lipid to
achieve the desired pressure.
2. Place the glass slides carrying the lipid monolayer, prepared in section 3.2.6, horizontally on the
surface of the water. Ensure that each slide is floating above a PTFE tray.
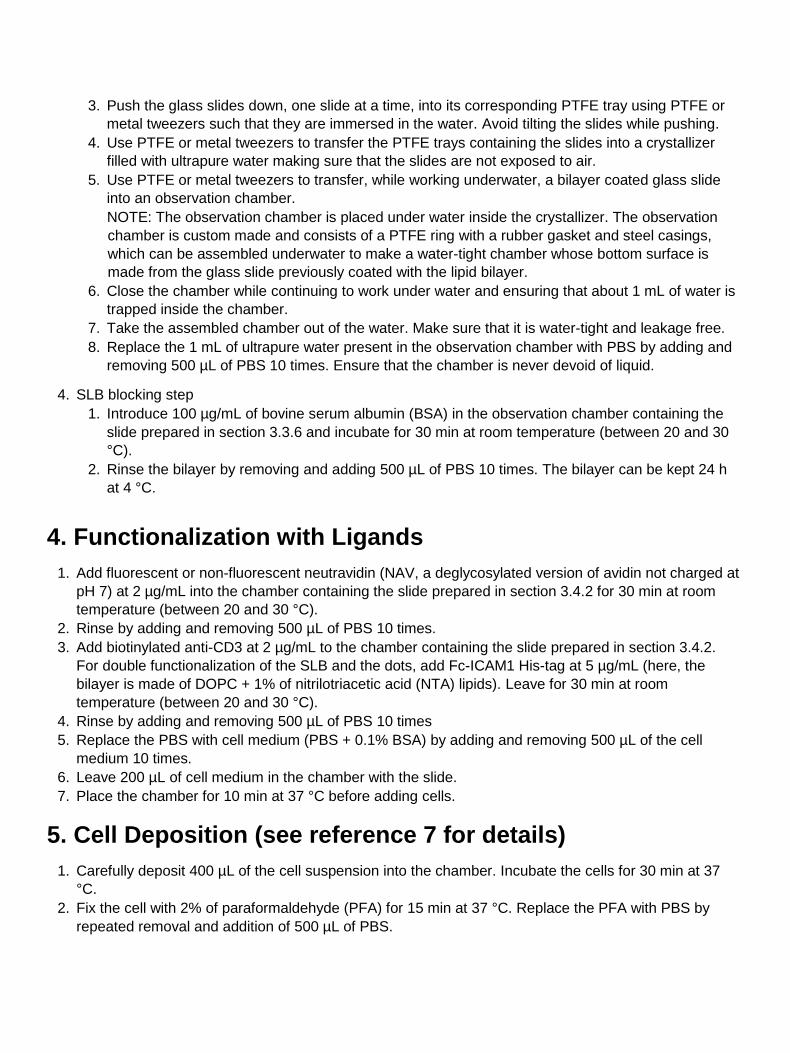
3. Push the glass slides down, one slide at a time, into its corresponding PTFE tray using PTFE or
metal tweezers such that they are immersed in the water. Avoid tilting the slides while pushing.
4. Use PTFE or metal tweezers to transfer the PTFE trays containing the slides into a crystallizer
filled with ultrapure water making sure that the slides are not exposed to air.
5. Use PTFE or metal tweezers to transfer, while working underwater, a bilayer coated glass slide
into an observation chamber.
NOTE: The observation chamber is placed under water inside the crystallizer. The observation
chamber is custom made and consists of a PTFE ring with a rubber gasket and steel casings,
which can be assembled underwater to make a water-tight chamber whose bottom surface is
made from the glass slide previously coated with the lipid bilayer.
6. Close the chamber while continuing to work under water and ensuring that about 1 mL of water is
trapped inside the chamber.
7. Take the assembled chamber out of the water. Make sure that it is water-tight and leakage free.
8. Replace the 1 mL of ultrapure water present in the observation chamber with PBS by adding and
removing 500 µL of PBS 10 times. Ensure that the chamber is never devoid of liquid.
4. SLB blocking step
1. Introduce 100 µg/mL of bovine serum albumin (BSA) in the observation chamber containing the
slide prepared in section 3.3.6 and incubate for 30 min at room temperature (between 20 and 30
°C).
2. Rinse the bilayer by removing and adding 500 µL of PBS 10 times. The bilayer can be kept 24 h
at 4 °C.
4. Functionalization with Ligands
1. Add fluorescent or non-fluorescent neutravidin (NAV, a deglycosylated version of avidin not charged at
pH 7) at 2 µg/mL into the chamber containing the slide prepared in section 3.4.2 for 30 min at room
temperature (between 20 and 30 °C).
2. Rinse by adding and removing 500 µL of PBS 10 times.
3. Add biotinylated anti-CD3 at 2 µg/mL to the chamber containing the slide prepared in section 3.4.2.
For double functionalization of the SLB and the dots, add Fc-ICAM1 His-tag at 5 µg/mL (here, the
bilayer is made of DOPC + 1% of nitrilotriacetic acid (NTA) lipids). Leave for 30 min at room
temperature (between 20 and 30 °C).
4. Rinse by adding and removing 500 µL of PBS 10 times
5. Replace the PBS with cell medium (PBS + 0.1% BSA) by adding and removing 500 µL of the cell
medium 10 times.
6. Leave 200 µL of cell medium in the chamber with the slide.
7. Place the chamber for 10 min at 37 °C before adding cells.
5. Cell Deposition (see reference 7 for details)
1. Carefully deposit 400 µL of the cell suspension into the chamber. Incubate the cells for 30 min at 37
°C.
2. Fix the cell with 2% of paraformaldehyde (PFA) for 15 min at 37 °C. Replace the PFA with PBS by
repeated removal and addition of 500 µL of PBS.
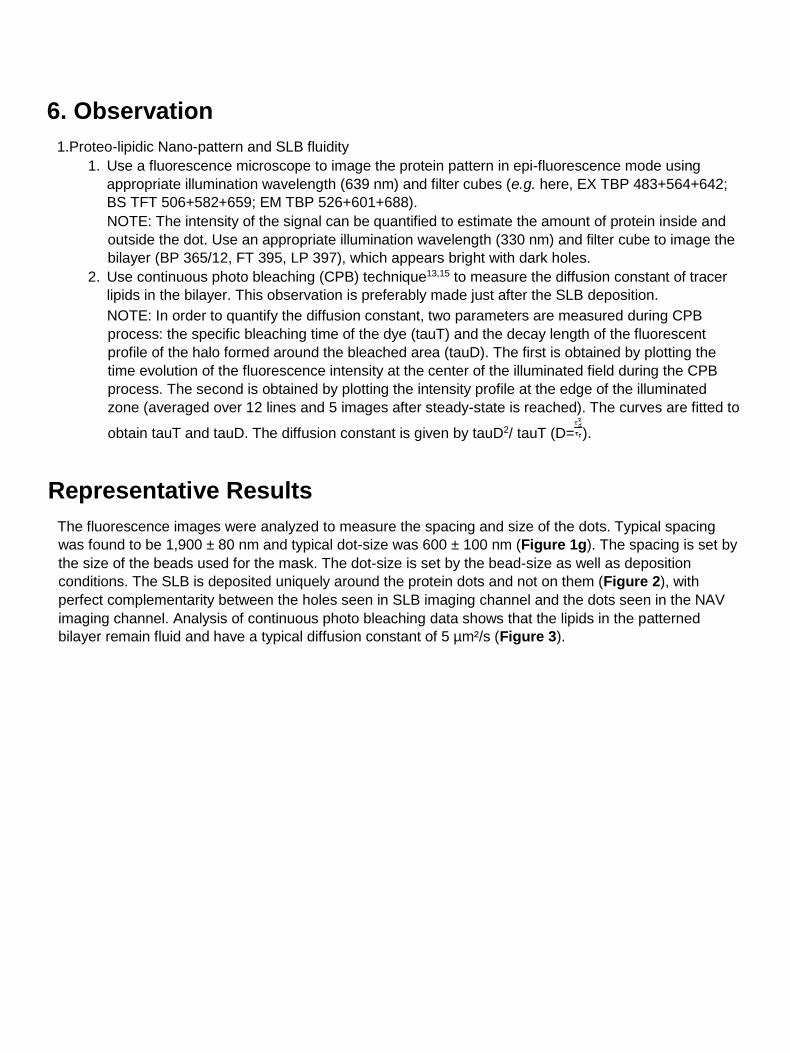
6. Observation
1.Proteo-lipidic Nano-pattern and SLB fluidity
1. Use a fluorescence microscope to image the protein pattern in epi-fluorescence mode using
appropriate illumination wavelength (639 nm) and filter cubes (e.g. here, EX TBP 483+564+642;
BS TFT 506+582+659; EM TBP 526+601+688).
NOTE: The intensity of the signal can be quantified to estimate the amount of protein inside and
outside the dot. Use an appropriate illumination wavelength (330 nm) and filter cube to image the
bilayer (BP 365/12, FT 395, LP 397), which appears bright with dark holes.
2. Use continuous photo bleaching (CPB) technique13,15 to measure the diffusion constant of tracer
lipids in the bilayer. This observation is preferably made just after the SLB deposition.
NOTE: In order to quantify the diffusion constant, two parameters are measured during CPB
process: the specific bleaching time of the dye (tauT) and the decay length of the fluorescent
profile of the halo formed around the bleached area (tauD). The first is obtained by plotting the
time evolution of the fluorescence intensity at the center of the illuminated field during the CPB
process. The second is obtained by plotting the intensity profile at the edge of the illuminated
zone (averaged over 12 lines and 5 images after steady-state is reached). The curves are fitted to
obtain tauT and tauD. The diffusion constant is given by tauD2/ tauT (D= ).
Representative Results
The fluorescence images were analyzed to measure the spacing and size of the dots. Typical spacing
was found to be 1,900 ± 80 nm and typical dot-size was 600 ± 100 nm (Figure 1g). The spacing is set by
the size of the beads used for the mask. The dot-size is set by the bead-size as well as deposition
conditions. The SLB is deposited uniquely around the protein dots and not on them (Figure 2), with
perfect complementarity between the holes seen in SLB imaging channel and the dots seen in the NAV
imaging channel. Analysis of continuous photo bleaching data shows that the lipids in the patterned
bilayer remain fluid and have a typical diffusion constant of 5 µm²/s (Figure 3).
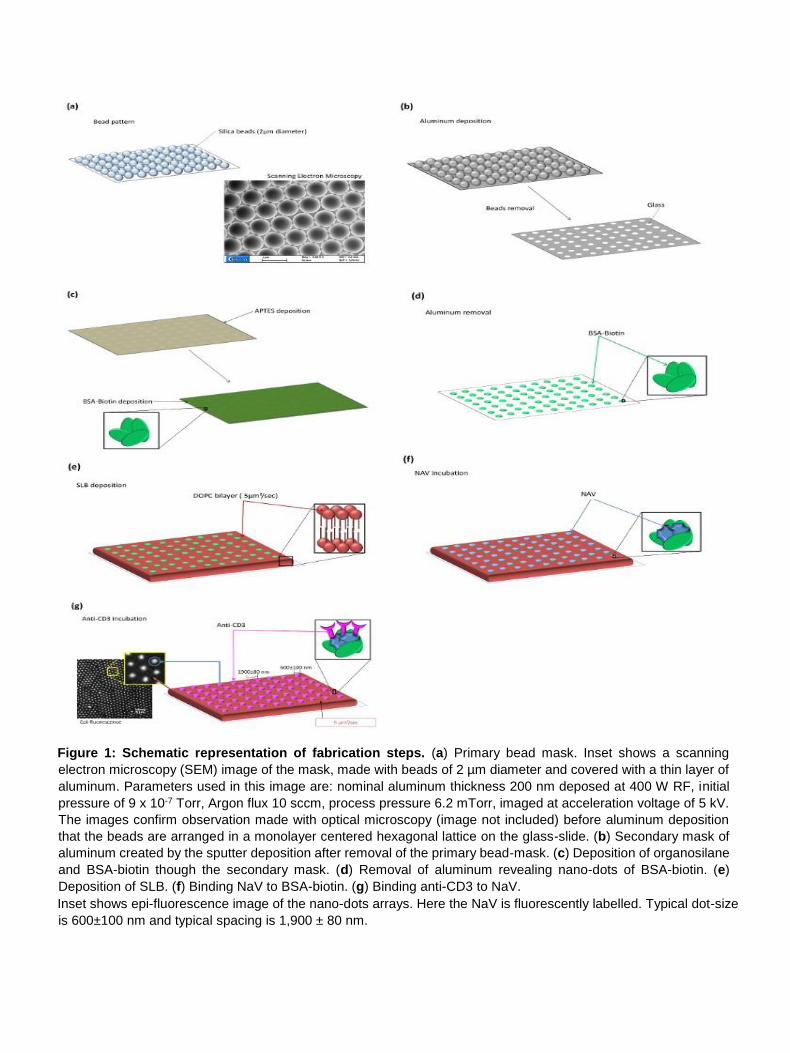
Figure 1: Schematic representation of fabrication steps. (a) Primary bead mask. Inset shows a scanning
electron microscopy (SEM) image of the mask, made with beads of 2 µm diameter and covered with a thin layer of
aluminum. Parameters used in this image are: nominal aluminum thickness 200 nm deposed at 400 W RF, initial
pressure of 9 x 10⁻⁷ Torr, Argon flux 10 sccm, process pressure 6.2 mTorr, imaged at acceleration voltage of 5 kV.
The images confirm observation made with optical microscopy (image not included) before aluminum deposition
that the beads are arranged in a monolayer centered hexagonal lattice on the glass-slide. (b) Secondary mask of
aluminum created by the sputter deposition after removal of the primary bead-mask. (c) Deposition of organosilane
and BSA-biotin though the secondary mask. (d) Removal of aluminum revealing nano-dots of BSA-biotin. (e)
Deposition of SLB. (f) Binding NaV to BSA-biotin. (g) Binding anti-CD3 to NaV.
Inset shows epi-fluorescence image of the nano-dots arrays. Here the NaV is fluorescently labelled. Typical dot-size
is 600±100 nm and typical spacing is 1,900 ± 80 nm.
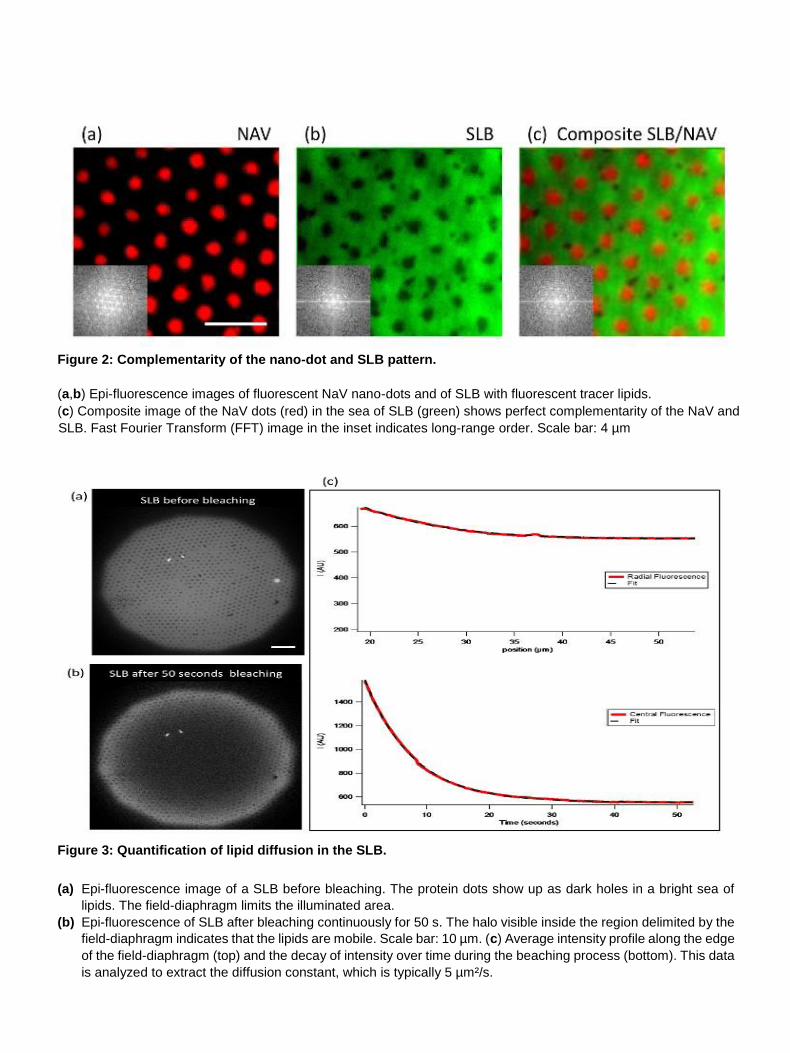
Figure 2: Complementarity of the nano-dot and SLB pattern.
(a,b) Epi-fluorescence images of fluorescent NaV nano-dots and of SLB with fluorescent tracer lipids.
(c) Composite image of the NaV dots (red) in the sea of SLB (green) shows perfect complementarity of the NaV and
SLB. Fast Fourier Transform (FFT) image in the inset indicates long-range order. Scale bar: 4 µm
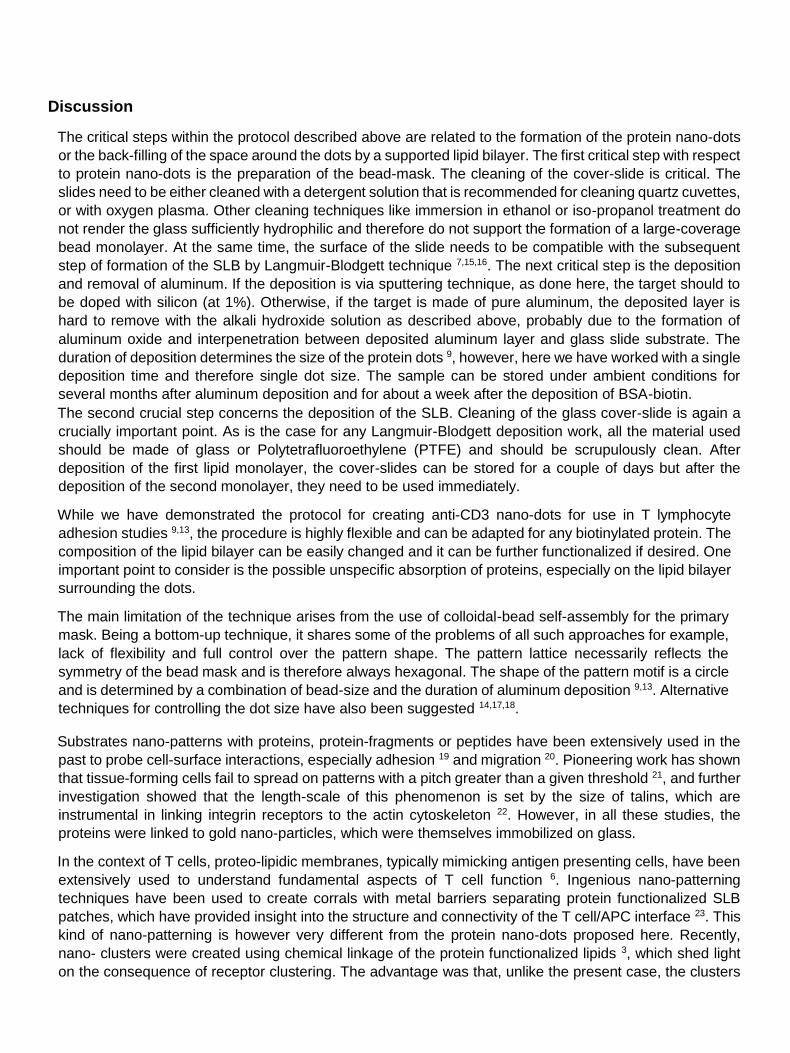
Figure 3: Quantification of lipid diffusion in the SLB.
(a) Epi-fluorescence image of a SLB before bleaching. The protein dots show up as dark holes in a bright sea of
lipids. The field-diaphragm limits the illuminated area.
(b) Epi-fluorescence of SLB after bleaching continuously for 50 s. The halo visible inside the region delimited by the
field-diaphragm indicates that the lipids are mobile. Scale bar: 10 µm. (c) Average intensity profile along the edge
of the field-diaphragm (top) and the decay of intensity over time during the beaching process (bottom). This data
is analyzed to extract the diffusion constant, which is typically 5 µm²/s.
Discussion
The critical steps within the protocol described above are related to the formation of the protein nano-dots
or the back-filling of the space around the dots by a supported lipid bilayer. The first critical step with respect
to protein nano-dots is the preparation of the bead-mask. The cleaning of the cover-slide is critical. The
slides need to be either cleaned with a detergent solution that is recommended for cleaning quartz cuvettes,
or with oxygen plasma. Other cleaning techniques like immersion in ethanol or iso-propanol treatment do
not render the glass sufficiently hydrophilic and therefore do not support the formation of a large-coverage
bead monolayer. At the same time, the surface of the slide needs to be compatible with the subsequent
step of formation of the SLB by Langmuir-Blodgett technique 7,15,16. The next critical step is the deposition
and removal of aluminum. If the deposition is via sputtering technique, as done here, the target should to
be doped with silicon (at 1%). Otherwise, if the target is made of pure aluminum, the deposited layer is
hard to remove with the alkali hydroxide solution as described above, probably due to the formation of
aluminum oxide and interpenetration between deposited aluminum layer and glass slide substrate. The
duration of deposition determines the size of the protein dots 9, however, here we have worked with a single
deposition time and therefore single dot size. The sample can be stored under ambient conditions for
several months after aluminum deposition and for about a week after the deposition of BSA-biotin.
The second crucial step concerns the deposition of the SLB. Cleaning of the glass cover-slide is again a
crucially important point. As is the case for any Langmuir-Blodgett deposition work, all the material used
should be made of glass or Polytetrafluoroethylene (PTFE) and should be scrupulously clean. After
deposition of the first lipid monolayer, the cover-slides can be stored for a couple of days but after the
deposition of the second monolayer, they need to be used immediately.
While we have demonstrated the protocol for creating anti-CD3 nano-dots for use in T lymphocyte
adhesion studies 9,13, the procedure is highly flexible and can be adapted for any biotinylated protein. The
composition of the lipid bilayer can be easily changed and it can be further functionalized if desired. One
important point to consider is the possible unspecific absorption of proteins, especially on the lipid bilayer
surrounding the dots.
The main limitation of the technique arises from the use of colloidal-bead self-assembly for the primary
mask. Being a bottom-up technique, it shares some of the problems of all such approaches for example,
lack of flexibility and full control over the pattern shape. The pattern lattice necessarily reflects the
symmetry of the bead mask and is therefore always hexagonal. The shape of the pattern motif is a circle
and is determined by a combination of bead-size and the duration of aluminum deposition 9,13. Alternative
techniques for controlling the dot size have also been suggested 14,17,18.
Substrates nano-patterns with proteins, protein-fragments or peptides have been extensively used in the
past to probe cell-surface interactions, especially adhesion 19 and migration 20. Pioneering work has shown
that tissue-forming cells fail to spread on patterns with a pitch greater than a given threshold 21, and further
investigation showed that the length-scale of this phenomenon is set by the size of talins, which are
instrumental in linking integrin receptors to the actin cytoskeleton 22. However, in all these studies, the
proteins were linked to gold nano-particles, which were themselves immobilized on glass.
In the context of T cells, proteo-lipidic membranes, typically mimicking antigen presenting cells, have been
extensively used to understand fundamental aspects of T cell function 6. Ingenious nano-patterning
techniques have been used to create corrals with metal barriers separating protein functionalized SLB
patches, which have provided insight into the structure and connectivity of the T cell/APC interface 23. This
kind of nano-patterning is however very different from the protein nano-dots proposed here. Recently,
nano- clusters were created using chemical linkage of the protein functionalized lipids 3, which shed light
on the consequence of receptor clustering. The advantage was that, unlike the present case, the clusters

could in principle be themselves mobile. However, such spontaneously formed clusters are necessarily
less well controlled in terms of size and density than pre-formed protein nano-dots described here.
We envisage that the protein nano-dot decorated SLBs presented here can be used to investigate different
aspects of cell-cell adhesion. One obvious question that arises is whether, as described above for tissue
forming cells 19, lymphocytes too have an intrinsic length-scale associated with adhesion. Preliminary
results seem to indicate that at least when the adhesion is mediated by the TCR complex, the density of
ligands rather than spacing is the defining parameter for spreading and activation 10,11,12,13. Whether
inclusion of mobile ligands in the surrounding SLB impacts this observation and how the mobile and
immobile fractions work together is a possible question, which was partly addressed using selfassembled
SLB bound clusters 24. Another interesting application will be in the context of mechano-sensing where cell
adhesion/activation on mobile and immobilized ligands were shown to be different not only for T cells 7,25
but also for cells that habitually adhere to the extra cellular matrix 26.
The two main advantages of these proteo-lipidic patterns are the compatibility of the substrates with
advanced optical microscopy and the ease of preparation which makes them compatible with use-and-
throw applications. Subsequent to aluminum deposition, all the preparation steps can be carried out on a
standard wet-lab bench. In the future, it can be envisaged that the aluminum-coated and glass-supported
bead-masks produced in a specialized facility are transferred and stored in biology laboratories for use as
and when required. With this in view, we believe that these substrates have the potential to become the
platform of choice for studying the interaction of cells with controlled nano-patterned proteo-lipidic
membranes.
Acknowledgements
We thank Laurent Limozin, Pierre Dillard and Astrid Wahl for continuing fruitful discussions about cellular
applications. We also thank Frederic Bedu from PLANETE cleanroom facility for his help with SEM
observations. This work was partially funded by the European Research Council via grant No. 307104
FP/2007-2013/ERC.
References
1. Alberts, B., Johnson, A., Lewis, J., et al. Molecular Biology of the Cell. 4th edition. New York: Garland Science. (2002).
2. Varma, R., Campi, G., Yokosuka, T., Saito, T., Dustin, M.L. T Cell Receptor-Proximal Signals Are Sustained in Peripheral
Microclusters and Terminated in the Central Supramolecular Activation Cluster. Immunity. 25(1), 117-27, (2006).
3. Kaizuka, Y. et al, Mechanisms for segregating T cell receptor and adhesion molecules during immunological synapse
formation in Jurkat T cells. Proc Natl Acad Sci USA. 104(51), 20296-301 (2007).
4. Dustin, M.L., Groves, J.T. Receptor signaling clusters in the immune synapse. Annu Rev Biophys. 41, 543-56 (2012).
5. Huppa, J.B. and Davis, M.M. T-cell-antigen recognition and the immunological synapse. Nat Rev Immunol. 3(12), 973-83,
(2003).
6. Grakoui, A., et al. The Immunological Synapse: A Molecular Machine Controlling T Cell Activation . Science . 285, 221-228
(1999).
7. Dillard, P., Varma, R., Sengupta, K., Limozin, L. Ligand-mediated friction determines morphodynamics of spreading T cells.
Biophys J., 107(11), 2629-38 (2014).
8. Lu, X., et al. Endogenous viral antigen processing generates peptide-specific MHC class I cell-surface clusters. Proc Natl
Acad Sci U S A. 109(38), 15407-12 (2012).
9. Pi, F., Dillard, P., et al. Size-Tunable Organic Nanodot Arrays: A Versatile Platform for Manipulating and Imaging Cells. Nano
Lett. 15 (8), 5178-5184 (2015).
10. Deeg, J. et al. T cell activation is determined by the number of presented antigens. Nano Lett. 13(11), 5619-26 (2013).
11. Delcassian, D., et al. Nanoscale ligand spacing influences receptor triggering in T cells and NK cells. Nano Lett. 13(11),
5608-14 (2013).
12. Matic, J., Deeg, J., Scheffold, A., Goldstein, I., Spatz, J.P. Fine tuning and efficient T cell activation with stimulatory aCD3
nanoarrays. Nano Lett. 13(11), 5090-7 (2013).
13. Dillard, P., Pi, F., Lellouch, A.C., Limozin, L., Sengupta, K. Nano-clustering of ligands on surrogate antigen presenting cells
modulates T cell membrane adhesion and organization. Integr Biol. 8(3), 287-301 (2016).
14. Pi, F., Dillard, P., Limozin, L., Charrier, A., Sengupta, K. Nanometric protein-patch arrays on glass and polydimethylsiloxane
for cell adhesion studies. Nano lett., 13(7), 3372-8 (2013).
15. Fenz, S. F., Merkel, R., and Sengupta, K. Diffusion and intermembrane distance: case study of avidin and E-cadherin
mediated adhesion. Langmuir. 25 (2), 1074-1085 (2009).
16. Sengupta, K., et al. Mimicking tissue surfaces by supported membrane coupled ultra-thin layer of hyaluronic acid. Langmuir.
19 (5), 1775-1781, (2003).
17. Taylor, Z.R., Keay, J.C., Sanchez, E.S., Johnson, M.B., Schmidtke, D.W. Independently controlling protein dot size and
spacing in particle lithography. Langmuir. 28(25), 9656-63 (2012).
18. Massou, S. et al. Large scale ordered topographical and chemical nano-features from anodic alumina templates. Appl. Surf
Sci. 256(2), 395-398 (2009).
19. Selhuber-Unkel, C., Lopez-Garcia, M., Kessler, H., Spatz, J.P. Cooperativity in adhesion cluster formation during initial cell
adhesion. Biophys J. 95(11), 5424-31 (2008).
20. Arnold, M., et al. Induction of cell polarization and migration by a gradient of nanoscale variations in adhesive ligand spacing.
Nano Lett. 8(7), 2063-9 (2008).
21. Cavalcanti-Adam, E.A., et al. Cell spreading and focal adhesion dynamics are regulated by spacing of integrin ligands.
Biophys J. 92(8), 2964-74 (2007).
22. Schvartzman, M., et al. Nanolithographic Control of the Spatial Organization of Cellular Adhesion Receptors at the Single-
Molecule Level. Nano Lett., 11 (3), 1306-1312 (2011).
23. Mossman, K., Groves, J. Micropatterned supported membranes as tools for quantitative studies of the immunological
synapse. Chem.Soc.Rev. 36(1), 46-54 (2007).
24. Furlan, G. et al., Phosphatase CD45 both positively and negatively regulates T cell receptor phosphorylation in reconstituted
membrane protein clusters. J Biol Chem. 289(41), 28514-25 (2014).
25. Hsu, C.J., et al. Ligand mobility modulates immunological synapse formation and T cell activation. PloS One. 7(2), e32398
(2012).
26. Yu, C. et al. Early integrin binding to Arg-Gly-Asp peptide activates actin polymerization and contractile movement that
stimulates outward translocation. Proc Natl Acad Sci U S A. 108(51), 20585-90 (2011).