
Lipid bilayer pre-transition as the beginning of the melting process
10
Lipid bilayer pre-transition as the beginning of the melting process Karin A. Riske 1 , ⁎, Rafael P. Barroso, Cíntia C. Vequi-Suplicy, Renato Germano, Vera B. Henriques, M. Teresa Lamy Instituto de Física, Universidade de São Paulo, CP 66318, CEP 05315-970 São Paulo-SP, Brazil abstract article info Article history: Received 5 August 2008 Received in revised form 3 December 2008 Accepted 19 January 2009 Available online 27 January 2009 Keywords: Ripple phase DSC ESR Laurdan fluorescence Statistical model Monte Carlo simulations We investigate the bilayer pre-transition exhibited by some lipids at temperatures below their main phase transition, and which is generally associated to the formation of periodic ripples in the membrane. Experimentally we focus on the anionic lipid dipalmytoylphosphatidylglycerol (DPPG) at different ionic strengths, and on the neutral lipid dipalmytoylphosphatidylcholine (DPPC). From the analysis of differential scanning calorimetry traces of the two lipids we find that both pre- and main transitions are part of the same melting process. Electron spin resonance of spin labels and excitation generalized polarization of Laurdan reveal the coexistence of gel and fluid domains at temperatures between the pre- and main transitions of both lipids, reinforcing the first finding. Also, the melting process of DPPG at low ionic strength is found to be less cooperative than that of DPPC. From the theoretical side, we introduce a statistical model in which a next-nearest-neighbor competing interaction is added to the usual two-state model. For the first time, modulated phases (ordered and disordered lipids periodically aligned) emerge between the gel and fluid phases as a natural consequence of the competition between lipid–lipid interactions. © 2009 Elsevier B.V. All rights reserved. 1. Introduction The spontaneous self-assembly of lipids into bilayers renders biological membranes their basic lamellar structure. Thus, physico- chemical properties of pure lipid systems have been thoroughly investigated, in order to better understand the structure and features of natural membranes. Special attention has been given to lipid phase transitions, the most well-studied being the gel–fluid transition. This main transition is associated with gauche isomerizations of the acyl chains, which brings the bilayer from an ordered gel to a disordered fluid state. Lipids in biological membranes are mainly in a fluid state, which facilitates lateral mobility and conformational changes of membrane proteins. However, the existence of more ordered domains, such as the so-called rafts, has called the attention to the different membrane packings that might exist in specific regions and could have a biological role [1,2]. Furthermore, some organisms adjust their lipid membrane composition according to the ambient temperature such that their membrane is right above the end of the melting process [3]. Thus, characterization of lipid phases other than the fluid is also biologically relevant. Some lipids undergo another phase transition below the main one, the so-called pre-transition, in which a flat membrane in the gel phase transforms into a periodically undulated bilayer [4,5]. Although this phase, named ripple phase or P β' , has been system- atically studied, a complete understating of its origin and molecular details is still lacking. Most studies have been performed on phosphatidylcholines (PCs), a major constituent of mammalian cells, which readily form multilamellae with definite interlayer distance when dispersed in water (for a review see [6]). PCs have a fairly bulky headgroup, creating a size mismatch with its acyl chains, especially below the main phase transition. This is believed to be the reason why the acyl chains are tilted in the gel phase of PCs [6,7]. It has been proposed that the driving force for the ripple formation is also coupled to this size mismatch, with headgroup hydration playing an import role [8,9]. It is not yet established whether the chains remain tilted in the ripple phase [10]. Electron density profiles obtained from small angle X-rays scattering (SAXS) of PCs in the ripple phase show an asymmetric undulation pattern resembling a saw-tooth with wavelength of 120–160 Å, depending on chain length [5,10–12]. Studies of the ripple phase are normally done on multi- lamellar systems. Some works propose the existence of surface ripples even in unilamellar vesicles [13,14], although the pre- transition is less cooperative in that case [15]. For multilamellar systems, the rippling of the membrane surface is thought to be coupled to interlamellar distance, thus coherently constructing a lattice that can easily be detected with diffraction techniques. On the other hand, the undulations of single bilayers add incoherently, thus making their detection more difficult [13]. Biochimica et Biophysica Acta 1788 (2009) 954–963 ⁎ Corresponding author. Departamento de Biofísica, Universidade Federal de São Paulo, R. Botucatu, 862 7° andar, CEP 04023-062 São Paulo-SP, Brazil. Tel.: +55115576 4530; fax +55 11 5571 5780 E-mail address: kar@biofis.epm.br (K.A. Riske). 1 Present address: Departamento de Biofísica, Universidade Federal de São Paulo, R. Botucatu, 862 7° andar CEP 04023-062, São Paulo-SP, Brazil. 0005-2736/$ – see front matter © 2009 Elsevier B.V. All rights reserved. doi:10.1016/j.bbamem.2009.01.007 Contents lists available at ScienceDirect Biochimica et Biophysica Acta journal homepage: www.elsevier.com/locate/bbamem
Transcript of Lipid bilayer pre-transition as the beginning of the melting process
Biochimica et Biophysica Acta 1788 (2009) 954–963
Contents lists available at ScienceDirect
Biochimica et Biophysica Acta
j ourna l homepage: www.e lsev ie r.com/ locate /bbamem
Lipid bilayer pre-transition as the beginning of the melting process
Karin A. Riske 1,⁎, Rafael P. Barroso, Cíntia C. Vequi-Suplicy, Renato Germano, Vera B. Henriques,M. Teresa LamyInstituto de Física, Universidade de São Paulo, CP 66318, CEP 05315-970 São Paulo-SP, Brazil
⁎ Corresponding author. Departamento de Biofísica,Paulo, R. Botucatu, 862 7° andar, CEP 04023-062 São Pau4530; fax +55 11 5571 5780
E-mail address: [email protected] (K.A. Riske).1 Present address: Departamento de Biofísica, Univer
Botucatu, 862 7° andar CEP 04023-062, São Paulo-SP, Br
0005-2736/$ – see front matter © 2009 Elsevier B.V. Adoi:10.1016/j.bbamem.2009.01.007
a b s t r a c t
a r t i c l e i n f oArticle history:
We investigate the bilayer p Received 5 August 2008Received in revised form 3 December 2008Accepted 19 January 2009Available online 27 January 2009Keywords:Ripple phaseDSCESRLaurdan fluorescenceStatistical modelMonte Carlo simulations
re-transition exhibited by some lipids at temperatures below their main phasetransition, and which is generally associated to the formation of periodic ripples in the membrane.Experimentally we focus on the anionic lipid dipalmytoylphosphatidylglycerol (DPPG) at different ionicstrengths, and on the neutral lipid dipalmytoylphosphatidylcholine (DPPC). From the analysis of differentialscanning calorimetry traces of the two lipids we find that both pre- and main transitions are part of the samemelting process. Electron spin resonance of spin labels and excitation generalized polarization of Laurdanreveal the coexistence of gel and fluid domains at temperatures between the pre- and main transitions ofboth lipids, reinforcing the first finding. Also, the melting process of DPPG at low ionic strength is found to beless cooperative than that of DPPC. From the theoretical side, we introduce a statistical model in which anext-nearest-neighbor competing interaction is added to the usual two-state model. For the first time,modulated phases (ordered and disordered lipids periodically aligned) emerge between the gel and fluidphases as a natural consequence of the competition between lipid–lipid interactions.
© 2009 Elsevier B.V. All rights reserved.
1. Introduction
The spontaneous self-assembly of lipids into bilayers rendersbiological membranes their basic lamellar structure. Thus, physico-chemical properties of pure lipid systems have been thoroughlyinvestigated, in order to better understand the structure and featuresof natural membranes. Special attention has been given to lipid phasetransitions, the most well-studied being the gel–fluid transition. Thismain transition is associated with gauche isomerizations of the acylchains, which brings the bilayer from an ordered gel to a disorderedfluid state. Lipids in biological membranes are mainly in a fluid state,which facilitates lateral mobility and conformational changes ofmembrane proteins. However, the existence ofmore ordered domains,such as the so-called rafts, has called the attention to the differentmembrane packings that might exist in specific regions and couldhave a biological role [1,2]. Furthermore, some organisms adjust theirlipid membrane composition according to the ambient temperaturesuch that their membrane is right above the end of the meltingprocess [3]. Thus, characterization of lipid phases other than the fluidis also biologically relevant.
Universidade Federal de Sãolo-SP, Brazil. Tel.: +55 11 5576
sidade Federal de São Paulo, R.azil.
ll rights reserved.
Some lipids undergo another phase transition below the mainone, the so-called pre-transition, in which a flat membrane in the gelphase transforms into a periodically undulated bilayer [4,5].Although this phase, named ripple phase or Pβ', has been system-atically studied, a complete understating of its origin and moleculardetails is still lacking. Most studies have been performed onphosphatidylcholines (PCs), a major constituent of mammaliancells, which readily form multilamellae with definite interlayerdistance when dispersed in water (for a review see [6]). PCs have afairly bulky headgroup, creating a size mismatch with its acyl chains,especially below the main phase transition. This is believed to be thereason why the acyl chains are tilted in the gel phase of PCs [6,7]. Ithas been proposed that the driving force for the ripple formation isalso coupled to this size mismatch, with headgroup hydration playingan import role [8,9]. It is not yet established whether the chainsremain tilted in the ripple phase [10]. Electron density profilesobtained from small angle X-rays scattering (SAXS) of PCs in theripple phase show an asymmetric undulation pattern resembling asaw-tooth with wavelength of 120–160 Å, depending on chain length[5,10–12]. Studies of the ripple phase are normally done on multi-lamellar systems. Some works propose the existence of surfaceripples even in unilamellar vesicles [13,14], although the pre-transition is less cooperative in that case [15]. For multilamellarsystems, the rippling of the membrane surface is thought to becoupled to interlamellar distance, thus coherently constructing alattice that can easily be detected with diffraction techniques. On theother hand, the undulations of single bilayers add incoherently, thusmaking their detection more difficult [13].
955K.A. Riske et al. / Biochimica et Biophysica Acta 1788 (2009) 954–963
Generally, it is assumed that the lipids in the ripple phase aremainly in an all-trans configuration, as in the gel phase [11]. However,many studies point to the existence of fluid regions coupled with thegeometry of the ripples. Sun et al. [10] could model their SAXS databetter assuming that the ripples were composed of a long saw-tootharm, with characteristics of a gel bilayer, and a short arm, thinner andless densely packed, more compatible with a fluid bilayer. Changes ofbilayer packing along the undulations were also obtained frommolecular [16] and dissipative particle dynamics [17] simulations.Experimental evidence of gel-fluid coexistence in the ripple phasewasreported from NMR [18], ESR [19] and SAXS/WAXS [20,21] data.Startlingly, even though so many authors have been stressing fordecades the existence of fluid lipids coupled to the ripple geometry,this has not yet become an established knowledge.
Apart from PCs, the pre-transition has been detected also fordeprotonated phosphatidylglycerols (PGs) [22–24], although no com-prehensive study has been performed with PGs yet. The pre-transitionhas not been systematically observed for other lipids [8]. The bilayerstructure of PCs and charged PGs at 100 mM salt of the same acyl chainwas shown to be quite similar [22]. Despite the PG headgroup beingconsiderably smaller than the PC headgroup, its charged character couldaccount for an areaperheadgroupof the samemagnitude.However, thisis only true at high ionic strength. At low ionic strength, short chain PGsshow peculiar properties and thermal behavior [24–29].
Theoretical studies (see [30] for a general review) in terms of simplestatistical models have followed mainly two approaches for explainingthe ripple phase: (i) periodic elastic deformations, mainly due tocompetition between curvature and tilting of lipids in the gel state[9,31–34], although Carlson and Sethna [9] suggested a posteriori thatfluid lipids could reside in the packing defects induced by the bilayercorrugation, or (ii) periodic melting of the chains, which, due to curvature,might imply periodic mechanical undulations [30]. Heimburg [30] wasthe first to explicitly couple ripple formation with (periodic) chainmelting, and to compare experimental DSC data for the pre- and maintransitions to results from model simulation. The first group of models[31–34] yield ripple periodsdependenton the relationbetween curvatureand tilting parameters, but do not include melting, whereas Heimburg'smodel [30] requires ad hoc introduction of modulation period.
The purpose of this work is to broaden the experimental andtheoretical knowledge on the pre-transition and to further explore theidea of the existence of fluid regions coupled to the ripple phase.Experimentally, we compare dispersions of dipalmytoylphosphatidyl-choline (DPPC) with its charged analog, dipalmytoylphosphatidylgly-cerol (DPPG). Because of the net negative charge of DPPG, differentconcentrations of salt are used. So far, onlyhigh ionic strengthconditions(at least 100mMsalt)were investigated. Three experimental techniques
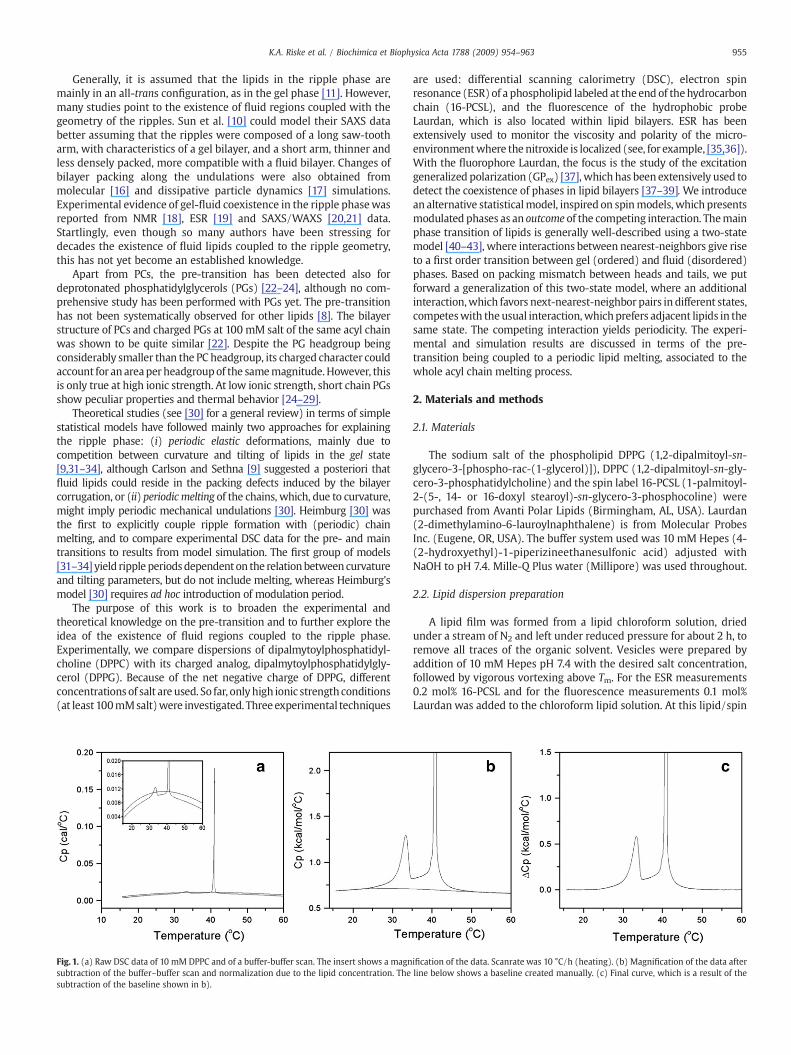
Fig. 1. (a) Raw DSC data of 10 mM DPPC and of a buffer-buffer scan. The insert shows a magnsubtraction of the buffer–buffer scan and normalization due to the lipid concentration. Thesubtraction of the baseline shown in b).
are used: differential scanning calorimetry (DSC), electron spinresonance (ESR) of a phospholipid labeled at the end of thehydrocarbonchain (16-PCSL), and the fluorescence of the hydrophobic probeLaurdan, which is also located within lipid bilayers. ESR has beenextensively used to monitor the viscosity and polarity of the micro-environmentwhere the nitroxide is localized (see, for example, [35,36]).With the fluorophore Laurdan, the focus is the study of the excitationgeneralized polarization (GPex) [37], which has been extensively used todetect the coexistence of phases in lipid bilayers [37–39].We introducean alternative statisticalmodel, inspired on spinmodels, which presentsmodulated phases as an outcome of the competing interaction. Themainphase transition of lipids is generally well-described using a two-statemodel [40–43], where interactions between nearest-neighbors give riseto a first order transition between gel (ordered) and fluid (disordered)phases. Based on packing mismatch between heads and tails, we putforward a generalization of this two-state model, where an additionalinteraction,which favors next-nearest-neighbor pairs in different states,competeswith the usual interaction,whichprefers adjacent lipids in thesame state. The competing interaction yields periodicity. The experi-mental and simulation results are discussed in terms of the pre-transition being coupled to a periodic lipid melting, associated to thewhole acyl chain melting process.
2. Materials and methods
2.1. Materials
The sodium salt of the phospholipid DPPG (1,2-dipalmitoyl-sn-glycero-3-[phospho-rac-(1-glycerol)]), DPPC (1,2-dipalmitoyl-sn-gly-cero-3-phosphatidylcholine) and the spin label 16-PCSL (1-palmitoyl-2-(5-, 14- or 16-doxyl stearoyl)-sn-glycero-3-phosphocoline) werepurchased from Avanti Polar Lipids (Birmingham, AL, USA). Laurdan(2-dimethylamino-6-lauroylnaphthalene) is from Molecular ProbesInc. (Eugene, OR, USA). The buffer system used was 10 mM Hepes (4-(2-hydroxyethyl)-1-piperizineethanesulfonic acid) adjusted withNaOH to pH 7.4. Mille-Q Plus water (Millipore) was used throughout.
2.2. Lipid dispersion preparation
A lipid film was formed from a lipid chloroform solution, driedunder a stream of N2 and left under reduced pressure for about 2 h, toremove all traces of the organic solvent. Vesicles were prepared byaddition of 10 mM Hepes pH 7.4 with the desired salt concentration,followed by vigorous vortexing above Tm. For the ESR measurements0.2 mol% 16-PCSL and for the fluorescence measurements 0.1 mol%Laurdan was added to the chloroform lipid solution. At this lipid/spin
ification of the data. Scanrate was 10 °C/h (heating). (b) Magnification of the data afterline below shows a baseline created manually. (c) Final curve, which is a result of the

Fig. 2. (a) Excess heat capacities (ΔCp) of 10 mM DPPG in 10 mM Hepes pH 7.4 withoutand with 2 and 100 mM NaCl, and 10 mM DPPC in 10 mM Hepes pH 7.4. The DPPG inHepes curve was multiplied by 5. Scans were shifted for clarity. The light curves aboveeach line (below Tm) are 5× magnifications of the correspondent curve below. Scanratewas 10 °C/h (heating). (b) Fraction of fluid lipids calculated as the integral of the ΔCpcurves and normalized by the total enthalpy change ΔH for DPPG in Hepes (light line),+2 mM NaCl (dots), +100 mM NaCl (dashes) and DPPC in Hepes (bold line). Eachcurve is an average over at least two scans of different samples. The estimated error isaround 10% for DPPC and DPPG at high ionic strength and 30% for DPPG at low ionicstrength, due to differences among samples. (c) Detail of the pre-transition region ofpart b).
956 K.A. Riske et al. / Biochimica et Biophysica Acta 1788 (2009) 954–963
label ratio no spin exchange linewidth broadening occurred. For thefluorescence measurements, the lipid dispersion was extrudedthrough polycarbonate filters with pores of 100 nm to yield largeunilamellar vesicles [44], in order to decrease sample turbidity.
2.3. Differential scanning calorimetry
The calorimetric data were carried out in a MicrocalorimeterMicrocal VP-DSC at a scan rate of 10 °C/h (heating). The thermal profileobtained for DPPC and DPPG at high ionic strengthwere independent ofthe scan rate, below 30 °C/h. On the other hand, the profile of DPPG atlow ionic strength (with andwithout 2mMNaCl) changed slightlywithall the scan rates tested (down to 5 °C/h), but within the range ofvariation found for a series of consecutive scanswith the same rate. Fig.1shows the sequence of data treatment performed on a typical scan. Dataanalysiswasdoneusing theMicrocalOrigin softwarewith the additionaldevice for DSC data analysis provided by Microcal: the buffer–bufferscan (shown in Fig. 1a) was subtracted from the raw data, and theresultant curvewas thennormalized for the lipid concentration (Fig.1b).Afterwards a baseline was manually created (Fig. 1b) and subtracted,yielding the excess heat capacityΔCp (Fig.1c). The results shown in Fig. 2are the final results of the same data treatment done on all curves.
2.4. ESR spectroscopy
ESRmeasurements at X-band (9.4 GHz frequency)were performedwith a Bruker EMX spectrometer. Magnetic field modulation ampli-tude of 1 G and a microwave power of 5 mW were used. Thetemperature was controlled with a Bruker BVT-2000 variabletemperature controller, and monitored with a Fluke 51 K/J thermo-meter. The ESR spectra of 0.2 mol% 16-PCSL incorporated in DPPC andDPPG were repeated at least twice with samples prepared at differenttimes and the different experiments were compatible. The ESR spectrashown in Figs. 3 and 4 are the best of these experiments. Spectralsubtractions were done using the WINEPR software (Bruker).
2.5. Fluorescence spectroscopy
The samples were placed in a quartz cuvette, with an optical pathof 2 mm. Spectra were measured with a Fluorolog 3 Jobin YvonSPEX,model FL3-11, equipped with a xenon lamp using a 1.5 nm widebandpass. The excitation spectra were corrected with a quantumcounter (Rhodamine B in 3 mg/mL ethylene glycol). Temperature wascontrolled with a thermal bath Julabo HP 25 and was directlymeasured in the sample with a digital thermocouple. Excitationspectra were obtained with the emission wavelengths (λem) at 440and 490 nm. From these spectra, the excitation generalized polariza-tion (GPex) as a function of the excitation wavelength (λex) wascalculated for each temperature according to [37,45]:
GPex λexð Þ= I440−I490ð ÞI440 + I490ð Þ ð1Þ
where I440 and I490 are the fluorescence intensities at 440 and 490 nm,respectively, at a fixed value of λex. Lipid concentration was 1 mM, toreduce light scattering interferences on thefluorescencemeasurements.DSC thermal profiles of 1 and 10 mMDPPG and DPPC were found to bevery similar. To better analyze the dependence of GPex with λex, linearfittings were performed, GPex=α λex+b, and the slopes α plotted.
3. Results and discussions
3.1. Differential scanning calorimetry
Lipid phase transitions are accompanied by peaks in the heatcapacity profile, and can thus be detected with differential scanning
calorimetry (DSC), which measures the heat capacity at constantpressure as a function of temperature. The lipid main phase transition,also called gel–fluid phase transition, generally gives rise to a veryintense and sharp peak of heat capacity. On the other hand, the pre-transition is usually detected as a much less intense and broader peakat lower temperatures. Fig. 2a shows excess heat capacity (ΔCp)profiles obtained for DPPG, at different concentrations of salt, and forDPPC. PGs and PCs with the same acyl chains are known to exhibit
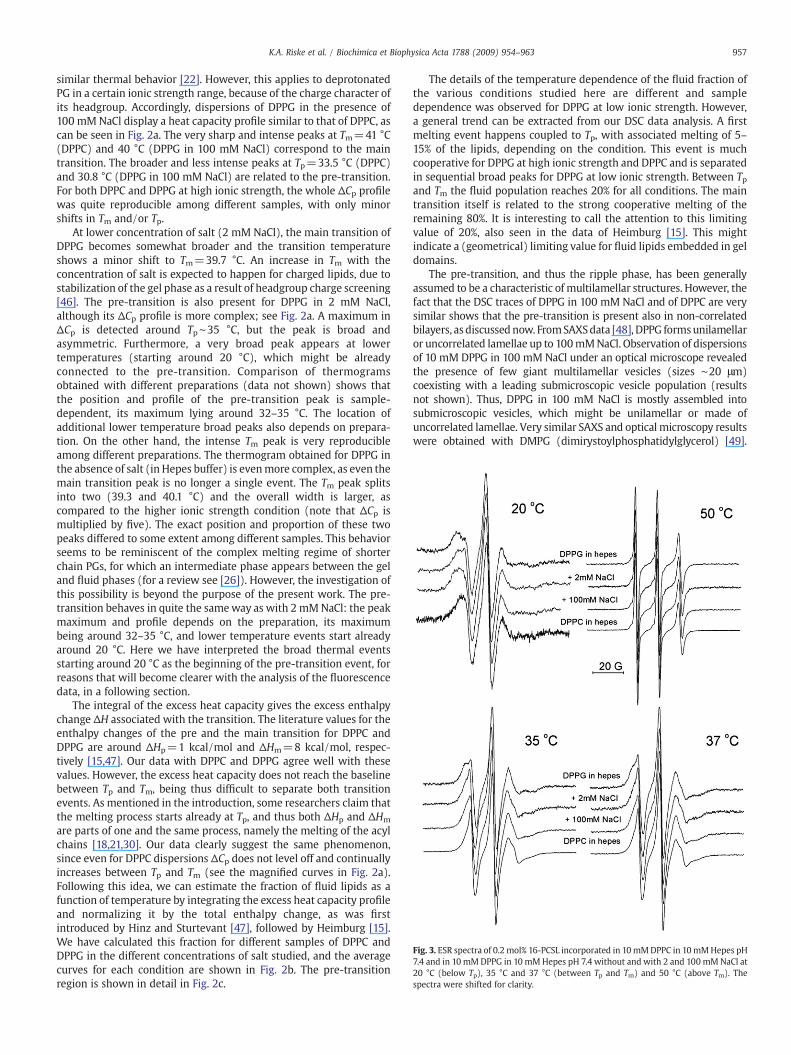
Fig. 3. ESR spectra of 0.2 mol% 16-PCSL incorporated in 10mMDPPC in 10mMHepes pH7.4 and in 10 mMDPPG in 10 mMHepes pH 7.4 without and with 2 and 100 mMNaCl at20 °C (below Tp), 35 °C and 37 °C (between Tp and Tm) and 50 °C (above Tm). Thespectra were shifted for clarity.
957K.A. Riske et al. / Biochimica et Biophysica Acta 1788 (2009) 954–963
similar thermal behavior [22]. However, this applies to deprotonatedPG in a certain ionic strength range, because of the charge character ofits headgroup. Accordingly, dispersions of DPPG in the presence of100 mMNaCl display a heat capacity profile similar to that of DPPC, ascan be seen in Fig. 2a. The very sharp and intense peaks at Tm=41 °C(DPPC) and 40 °C (DPPG in 100 mM NaCl) correspond to the maintransition. The broader and less intense peaks at Tp=33.5 °C (DPPC)and 30.8 °C (DPPG in 100 mM NaCl) are related to the pre-transition.For both DPPC and DPPG at high ionic strength, the whole ΔCp profilewas quite reproducible among different samples, with only minorshifts in Tm and/or Tp.
At lower concentration of salt (2 mM NaCl), the main transition ofDPPG becomes somewhat broader and the transition temperatureshows a minor shift to Tm=39.7 °C. An increase in Tm with theconcentration of salt is expected to happen for charged lipids, due tostabilization of the gel phase as a result of headgroup charge screening[46]. The pre-transition is also present for DPPG in 2 mM NaCl,although its ΔCp profile is more complex; see Fig. 2a. A maximum inΔCp is detected around Tp∼35 °C, but the peak is broad andasymmetric. Furthermore, a very broad peak appears at lowertemperatures (starting around 20 °C), which might be alreadyconnected to the pre-transition. Comparison of thermogramsobtained with different preparations (data not shown) shows thatthe position and profile of the pre-transition peak is sample-dependent, its maximum lying around 32–35 °C. The location ofadditional lower temperature broad peaks also depends on prepara-tion. On the other hand, the intense Tm peak is very reproducibleamong different preparations. The thermogram obtained for DPPG inthe absence of salt (in Hepes buffer) is evenmore complex, as even themain transition peak is no longer a single event. The Tm peak splitsinto two (39.3 and 40.1 °C) and the overall width is larger, ascompared to the higher ionic strength condition (note that ΔCp ismultiplied by five). The exact position and proportion of these twopeaks differed to some extent among different samples. This behaviorseems to be reminiscent of the complex melting regime of shorterchain PGs, for which an intermediate phase appears between the geland fluid phases (for a review see [26]). However, the investigation ofthis possibility is beyond the purpose of the present work. The pre-transition behaves in quite the sameway as with 2 mMNaCl: the peakmaximum and profile depends on the preparation, its maximumbeing around 32–35 °C, and lower temperature events start alreadyaround 20 °C. Here we have interpreted the broad thermal eventsstarting around 20 °C as the beginning of the pre-transition event, forreasons that will become clearer with the analysis of the fluorescencedata, in a following section.
The integral of the excess heat capacity gives the excess enthalpychange ΔH associated with the transition. The literature values for theenthalpy changes of the pre and the main transition for DPPC andDPPG are around ΔHp=1 kcal/mol and ΔHm=8 kcal/mol, respec-tively [15,47]. Our data with DPPC and DPPG agree well with thesevalues. However, the excess heat capacity does not reach the baselinebetween Tp and Tm, being thus difficult to separate both transitionevents. As mentioned in the introduction, some researchers claim thatthe melting process starts already at Tp, and thus both ΔHp and ΔHm
are parts of one and the same process, namely the melting of the acylchains [18,21,30]. Our data clearly suggest the same phenomenon,since even for DPPC dispersions ΔCp does not level off and continuallyincreases between Tp and Tm (see the magnified curves in Fig. 2a).Following this idea, we can estimate the fraction of fluid lipids as afunction of temperature by integrating the excess heat capacity profileand normalizing it by the total enthalpy change, as was firstintroduced by Hinz and Sturtevant [47], followed by Heimburg [15].We have calculated this fraction for different samples of DPPC andDPPG in the different concentrations of salt studied, and the averagecurves for each condition are shown in Fig. 2b. The pre-transitionregion is shown in detail in Fig. 2c.
The details of the temperature dependence of the fluid fraction ofthe various conditions studied here are different and sampledependence was observed for DPPG at low ionic strength. However,a general trend can be extracted from our DSC data analysis. A firstmelting event happens coupled to Tp, with associated melting of 5–15% of the lipids, depending on the condition. This event is muchcooperative for DPPG at high ionic strength and DPPC and is separatedin sequential broad peaks for DPPG at low ionic strength. Between Tpand Tm the fluid population reaches 20% for all conditions. The maintransition itself is related to the strong cooperative melting of theremaining 80%. It is interesting to call the attention to this limitingvalue of 20%, also seen in the data of Heimburg [15]. This mightindicate a (geometrical) limiting value for fluid lipids embedded in geldomains.
The pre-transition, and thus the ripple phase, has been generallyassumed to be a characteristic of multilamellar structures. However, thefact that the DSC traces of DPPG in 100 mM NaCl and of DPPC are verysimilar shows that the pre-transition is present also in non-correlatedbilayers, as discussednow. FromSAXSdata [48], DPPG formsunilamellaror uncorrelated lamellae up to 100mMNaCl. Observation of dispersionsof 10 mM DPPG in 100 mM NaCl under an optical microscope revealedthe presence of few giant multilamellar vesicles (sizes ∼20 μm)coexisting with a leading submicroscopic vesicle population (resultsnot shown). Thus, DPPG in 100 mM NaCl is mostly assembled intosubmicroscopic vesicles, which might be unilamellar or made ofuncorrelated lamellae. Very similar SAXS and optical microscopy resultswere obtained with DMPG (dimirystoylphosphatidylglycerol) [49].

958 K.A. Riske et al. / Biochimica et Biophysica Acta 1788 (2009) 954–963
Conversely, only highly dense giant multilamellar vesicles were seen indispersions of DMPC [49] andDPPC (not shown).We thus conclude thatthe presence of dominantmultilamellar structures is not a pre-requisitefor the development of a cooperative pre-transition, since the DSC scansof DPPC and DPPG at high ionic strength are very similar. Thus, theemergence of a ripple phase seems to be dictated by interactions amonglipids within a single bilayer. Multilamellae, however, are essential tobuild up coherence among ripples in different bilayers so that they canbe easily detected by diffraction techniques [13].
3.2. Electron spin resonance
Electron spin resonance (ESR) of spin labels incorporated in lipidbilayers is a traditional technique to study membrane packing andviscosity [35,36], because it gives information on the mobility, orderand polarity of the probe microenvironment. In this work we used aPC lipid labeled with a nitroxide group at the 16th carbon (16-PCSL),thus at the bilayer center. We chose such position because of its highsensitivity to changes in mobility which takes place at the maintransition [27]. Probes closer to the headgroup region are partlyimmobilized even in the fluid phase, because of the reduced degreesof freedom for that position. On the other hand, probes located at theend of the acyl chain experience much more freedom of movement,and changes along the melting process can be better evaluated.Additionally, this probe has proven to be especially adequate for ourpurpose in previous studies on dispersions of low ionic strengthDMPG, which show an extended melting regime. ESR spectra of 16-PCSL were the only ones that could resolve the presence of twodistinct populations [27]. If the probe senses two different micro-environments, its spectrumwill be a sum of the two populations if theexchange rate between these different locations is slow in the relevanttime scale, set by the microwave frequency (nanoseconds). Moreover,in order to detect these two populations in the composite spectrum,differences in their spectral characteristics are necessary. If theexchange rate between the two populations is fast, their differenceswill be averaged out.
Fig. 4. Examples of 16-PCSL ESR spectra subtraction for DPPG at different salt concentrationphase (markedwith 40 or 42 °C) was subtracted from those obtained in the ripple phase (top“sub”). The percentage of each component (2nd and 3rd spectra from the top) in the compobottom are experimental spectra obtained at 30 °C, where most of the lipids are in the gel
Fig. 3 shows ESR spectra of 0.2 mol% 16-PCSL incorporated in DPPGand DPPC, in the same conditions as studiedwith DSC, at four differenttemperatures: 20 °C (below Tp), 35 and 37 °C (between Tp and Tm)and 50 °C (above Tm). In the fluid phase (50 °C) the spectra obtainedwith DPPC and DPPG with and without salt are all quite similar, withthe high degree of motional averaging expected to happen in a fluidphase, inferred from the sharp linewidths and the relativelysymmetric heights. On the other hand, the spectra in the gel phase(20 °C) obtained for DPPG and DPPC show a large extent of spectralanisotropy, characteristic of the low mobility and high order of thisphase.
The spectra at 35 and 37 °C (Fig. 3), thus between Tp and Tm, arethose we focus in the present work. If we carefully look at the highfield line (first line from the right side), we observe that a second peakis present, being more pronounced in DPPC. In DPPG samples it is onlya shoulder, and a second peak can also be identified in the low fieldline (first line from the left side). Yet, this is a reasonable indication ofthe presence of two populations, a small amount of a more mobilepopulation, together with a predominant gel phase. It is thus temptingto propose that this corresponds to a small fluid population, consistentwith the DSC results.
To test the consistency of this hypothesis, we performed spectrasubtractions. Spectra obtained in the fluid phase (40 or 42 °C,depending on the condition) were subtracted from spectra attemperatures between Tp and Tm. The percentage of the fluid signalsubtracted was varied until the resulting spectrum looked like a one-component signal. Variations on the bilayer packing with temperaturein a phase are expected to happen, so the ESR spectrum of a fluidcomponent at 35–37 °C might not be exactly the same as at 40–42 °C.Moreover, lipids located in small fluid regions might experience aslightly different microviscosity than when placed in a complete fluidbilayer. The same reasoning discussed for the fluid phase applies forlipids in the gel phase.
Despite not being able to perform successful subtractions with allspectra between Tp and Tm, the features of these spectra suggested thepresence of a small percentage of a more mobile component.
s and DPPC. For each condition, a certain percentage of a spectrum obtained in the fluidspectra at the given temperature). The resultant spectra are shown below (indicated bysite spectra (top spectra) is given in the component spectra. The spectra shown at thephase.

Fig. 5. (a) GPex as function of the excitation wavelength (λex) obtained from theexcitation spectra of 0.1 mol% of Laurdan incorporated in 1 mM of DPPC in Hepes buffer,for different temperatures. (b) Temperature dependence of the slope α (GPex=αλex+b) obtained from linear fits of Laurdan GPex as a function of λex in the regionbetween 370 and 390 nm, where clear linear behavior was observed, for DPPG (○)and DPPC (■). The results are the average of three experiments.
959K.A. Riske et al. / Biochimica et Biophysica Acta 1788 (2009) 954–963
Examples of reasonable subtractions are shown in Fig. 4. The spectraobtained from the subtractions were similar to spectra at 30 °C foreach system (shown for comparison below each subtraction in Fig. 4).As compared to spectra obtained at 20 °C, thus really in the gel phase(see Fig. 3), spectra at 30 °C indicate a somewhat more mobileenvironment. In fact, for DPPG at all ionic strengths studied, thebilayer is already experiencing the beginning of the melting process at30 °C (see Fig. 2). From the double integral of the spectrum we caninfer the percentage of each population. The fluid componentsubtracted accounts for 6–9% of the composite spectrum. From theDSC data we have estimated a fluid population around 10–15% at 35–37 °C (Fig. 2c). The subtraction could only be successfully performedwhen small amounts of the fluid component were present. This is anindication that the microenvironment sensed by the probe in the fluidregions between Tp and Tm is somewhat different than in a completefluid phase. From the DSC data, lipid melting can start at temperaturesas low as 20 °C for DPPG at low ionic strength. The ESR spectra,however, would not be sensitive to the presence of less than ∼5% fluidfraction. Evidences for the existence of a fluid fraction could only bedetected above 30 °C.
3.3. Laurdan fluorescence
The fluorescent probe Laurdan has been widely used to study thegel–fluid transition of lipid bilayers, because it is strongly sensitive tothe environment where it resides [39,45,50–52]. Laurdan emissionspectra can be decomposed into two bands, with their relativepercentages being highly dependent on bilayer packing [52]. Theexcitation generalized polarization, GPex, measures a normalizedintensity ratio between the two emission bands centered around 440and 490 nm (see Eq. 1 in Material and methods). It has been shownthat GPex is constant for all excitation wavelengths (λex) whenLaurdan is incorporated in the gel phase, and steadily decreases withλex when the bilayer is in the fluid phase. When coexistence of gel andfluid domains is present, GPex has been shown to linearly increasewith λex [37,45]. To further test the possible gel–fluid coexistencebetween the pre- and main transitions, Laurdan was incorporated inDPPC and DPPG in Hepes buffer (the lowest ionic strength conditionused in the other experiments), and GPex was calculated from theprobe excitation spectrum.
Fig. 5a shows GPex as a function of λex for DPPC at four differenttemperatures: below Tp (20 °C), between Tp and Tm (35 °C), at ∼Tm(41 °C), and above Tm (50 °C). Visual inspection of the curves showsthat the slopes at 20 and 35 °C are close to zero, at 41 °C the slope ispositive and at 50 °C it is negative. However, this does not provide anaccurate evaluation of the slopes, although it is the conventional wayused in the literature to characterize lipid phases with this probe[38,50,53,54]. To better quantify the slopes of the curves, linear fitswere made on the dependence of GPex on λex for DPPC and DPPG atall temperatures. As far as we know, this is the first time these slopesare quantitatively analyzed. The angular coefficients α obtained areplotted as a function of temperature in Fig. 5b. The results shown areaveraged values obtained from three different experiments. Thequantitative analysis of the GPex slopes reveals the dependence of theLaurdan emission spectrum on λex with a much better accuracy.Clear and reproducible profiles of α as a function of temperaturewere obtained for DPPG and DPPC. The careful quantitative analysisof the slopes below Tm reveals that at low temperatures (below∼30 °C for DPPC and ∼20 °C for DPPG) α is actually slightly negative,but is roughly independent of temperature (see dashed lines in Fig.5b). Thus, the gel phase can be characterized by constant slopes,though slightly negative [55]. Between the gel and fluid phases, theslope α increased in two steps. For DPPC, a first small increasehappened at 32 °C, coupled to Tp, followed by a steady increase up to37 °C, after which a large increase in α was observed at Tm. For DPPGat low ionic strength, α first steadily increased between 20 °C and
37 °C, and then also showed a pronounced increase at Tm, whenpositive values were reached. In the fluid phase (above 42 °C), thelinear fits yielded clear negative slopes. Therefore, it is possible toconclude that when α starts to increase from the roughly constantgel phase value, the bilayer is no longer in a homogeneous phase, butcontains fluid domains. For DPPC, fluid domains appears in a definedstep at Tp=32 °C, whereas for DPPG at low ionic strength, it slowlystarts to be perceptible around 20 °C. Laurdan fluorescence was alsoobtained for DPPG in 2 and 100 mM NaCl, the former resemblingDPPG in pure Hepes, whereas the latter showed a similar profile tothat observed with DPPC (not shown).
In summary, the dependence of α with temperature extractedfrom the analysis of the Laurdan spectra parallels that of the fluidfraction obtained from the DSC scans of both DPPC and DPPG (seeFig. 2c). Similar to ESR results, Laurdan fluorescence also indicatesgel–fluid coexistence coupled to the ripple phase.
Before proceeding to the statistical model, we would like to makea short summary of the experimental section. The excess heatcapacity profile of DPPG at all ionic strengths studied and DPPC(Fig. 2) show that Tp and Tm cannot be completely separated,suggesting that both transitions are related to the same physicalphenomenon, namely the acyl chain melting, as proposed earlier[30]. Following this idea, we have estimated that 20% of the lipidsmelt along the ripple phase, starting with a cooperative event at Tp(Fig. 2c). From ESR spectra subtraction and Laurdan fluorescence(Figs. 3–5) we have confirmed that indeed fluid domains are presentin the ripple phase for both lipids. On the other hand, comparing theresults obtained for DPPG at different ionic strengths, we concludethat the thermal behavior of DPPG is similar to that of the well-studied DPPC only at high ionic strength (100 mM NaCl). At low ionicstrength (0 and 2 mM NaCl), DPPG also displays a pre-transition, butit is less defined/cooperative, sample-dependent, and generally startsat a lower temperature.
960 K.A. Riske et al. / Biochimica et Biophysica Acta 1788 (2009) 954–963
3.4. Statistical model
The main phase transition has been adequately described by a verysimple two-state (gel/fluid)model [31,40–43]. Heimburg [30] was thefirst to couple the ripple phase to full acyl chain melting. Based onphenomenological arguments, additional interactions between lipidsin the two states were considered and a period for the melting“defects” was explicitly included. This new model could simulate twopeaks in the excess heat capacity profile. The first smaller peak wasassociated to the pre-transition and to periodically ordered melting. Asecond big peak followed at higher temperature, and led to completemelting.
Modulated (periodic) phases have been extensively studied formagnetic spin systems [56–60]. The simpler ferromagnetic phase isdescribed by an analogous two-state model which favors spinalignment. Those studies have led to the discovery that periodicsequences of particles in states of opposite alignment may arise fromthe addition of a very simple competing interaction with no ad hocperiodicity. Modulation comes out as a result frommodel calculations,but could hardly be predicted a priori, and no qualitative argumentwhich could lead to the prediction of this result exists. Competitionbetween nearest neighbor and next-nearest neighbor interactionsalong some chosen axis generated modulations of different periods,depending on the competition parameter.
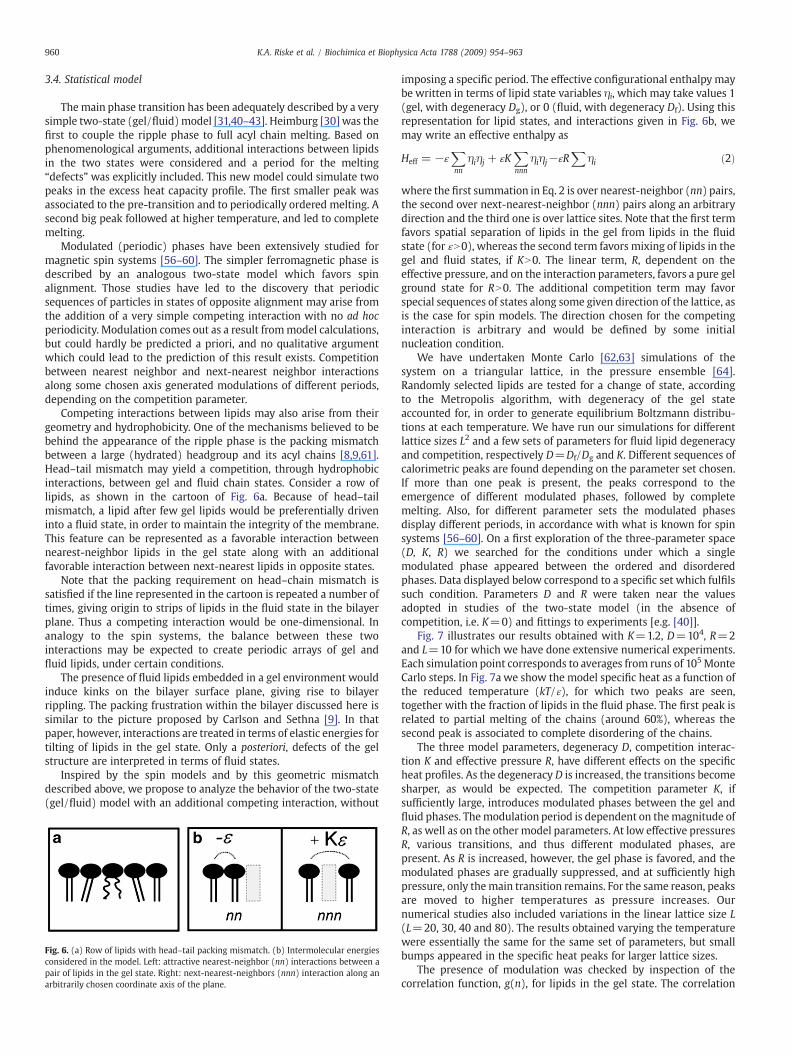
Competing interactions between lipids may also arise from theirgeometry and hydrophobicity. One of the mechanisms believed to bebehind the appearance of the ripple phase is the packing mismatchbetween a large (hydrated) headgroup and its acyl chains [8,9,61].Head–tail mismatch may yield a competition, through hydrophobicinteractions, between gel and fluid chain states. Consider a row oflipids, as shown in the cartoon of Fig. 6a. Because of head–tailmismatch, a lipid after few gel lipids would be preferentially driveninto a fluid state, in order to maintain the integrity of the membrane.This feature can be represented as a favorable interaction betweennearest-neighbor lipids in the gel state along with an additionalfavorable interaction between next-nearest lipids in opposite states.
Note that the packing requirement on head–chain mismatch issatisfied if the line represented in the cartoon is repeated a number oftimes, giving origin to strips of lipids in the fluid state in the bilayerplane. Thus a competing interaction would be one-dimensional. Inanalogy to the spin systems, the balance between these twointeractions may be expected to create periodic arrays of gel andfluid lipids, under certain conditions.
The presence of fluid lipids embedded in a gel environment wouldinduce kinks on the bilayer surface plane, giving rise to bilayerrippling. The packing frustration within the bilayer discussed here issimilar to the picture proposed by Carlson and Sethna [9]. In thatpaper, however, interactions are treated in terms of elastic energies fortilting of lipids in the gel state. Only a posteriori, defects of the gelstructure are interpreted in terms of fluid states.
Inspired by the spin models and by this geometric mismatchdescribed above, we propose to analyze the behavior of the two-state(gel/fluid) model with an additional competing interaction, without
Fig. 6. (a) Row of lipids with head–tail packing mismatch. (b) Intermolecular energiesconsidered in the model. Left: attractive nearest-neighbor (nn) interactions between apair of lipids in the gel state. Right: next-nearest-neighbors (nnn) interaction along anarbitrarily chosen coordinate axis of the plane.
imposing a specific period. The effective configurational enthalpy maybe written in terms of lipid state variables ηi, which may take values 1(gel, with degeneracy Dg), or 0 (fluid, with degeneracy Df). Using thisrepresentation for lipid states, and interactions given in Fig. 6b, wemay write an effective enthalpy as
Heff =−ɛX
nnηiηj + ɛK
X
nnnηiηj−ɛR
Xηi ð2Þ
where the first summation in Eq. 2 is over nearest-neighbor (nn) pairs,the second over next-nearest-neighbor (nnn) pairs along an arbitrarydirection and the third one is over lattice sites. Note that the first termfavors spatial separation of lipids in the gel from lipids in the fluidstate (for ɛN0), whereas the second term favors mixing of lipids in thegel and fluid states, if KN0. The linear term, R, dependent on theeffective pressure, and on the interaction parameters, favors a pure gelground state for RN0. The additional competition term may favorspecial sequences of states along some given direction of the lattice, asis the case for spin models. The direction chosen for the competinginteraction is arbitrary and would be defined by some initialnucleation condition.
We have undertaken Monte Carlo [62,63] simulations of thesystem on a triangular lattice, in the pressure ensemble [64].Randomly selected lipids are tested for a change of state, accordingto the Metropolis algorithm, with degeneracy of the gel stateaccounted for, in order to generate equilibrium Boltzmann distribu-tions at each temperature. We have run our simulations for differentlattice sizes L2 and a few sets of parameters for fluid lipid degeneracyand competition, respectively D=Df/Dg and K. Different sequences ofcalorimetric peaks are found depending on the parameter set chosen.If more than one peak is present, the peaks correspond to theemergence of different modulated phases, followed by completemelting. Also, for different parameter sets the modulated phasesdisplay different periods, in accordance with what is known for spinsystems [56–60]. On a first exploration of the three-parameter space(D, K, R) we searched for the conditions under which a singlemodulated phase appeared between the ordered and disorderedphases. Data displayed below correspond to a specific set which fulfilssuch condition. Parameters D and R were taken near the valuesadopted in studies of the two-state model (in the absence ofcompetition, i.e. K=0) and fittings to experiments [e.g. [40]].
Fig. 7 illustrates our results obtained with K=1.2, D=104, R=2and L=10 for which we have done extensive numerical experiments.Each simulation point corresponds to averages from runs of 105MonteCarlo steps. In Fig. 7a we show the model specific heat as a function ofthe reduced temperature (kT/ɛ), for which two peaks are seen,together with the fraction of lipids in the fluid phase. The first peak isrelated to partial melting of the chains (around 60%), whereas thesecond peak is associated to complete disordering of the chains.
The three model parameters, degeneracy D, competition interac-tion K and effective pressure R, have different effects on the specificheat profiles. As the degeneracy D is increased, the transitions becomesharper, as would be expected. The competition parameter K, ifsufficiently large, introduces modulated phases between the gel andfluid phases. Themodulation period is dependent on themagnitude ofR, as well as on the other model parameters. At low effective pressuresR, various transitions, and thus different modulated phases, arepresent. As R is increased, however, the gel phase is favored, and themodulated phases are gradually suppressed, and at sufficiently highpressure, only themain transition remains. For the same reason, peaksare moved to higher temperatures as pressure increases. Ournumerical studies also included variations in the linear lattice size L(L=20, 30, 40 and 80). The results obtained varying the temperaturewere essentially the same for the same set of parameters, but smallbumps appeared in the specific heat peaks for larger lattice sizes.
The presence of modulation was checked by inspection of thecorrelation function, g(n), for lipids in the gel state. The correlation
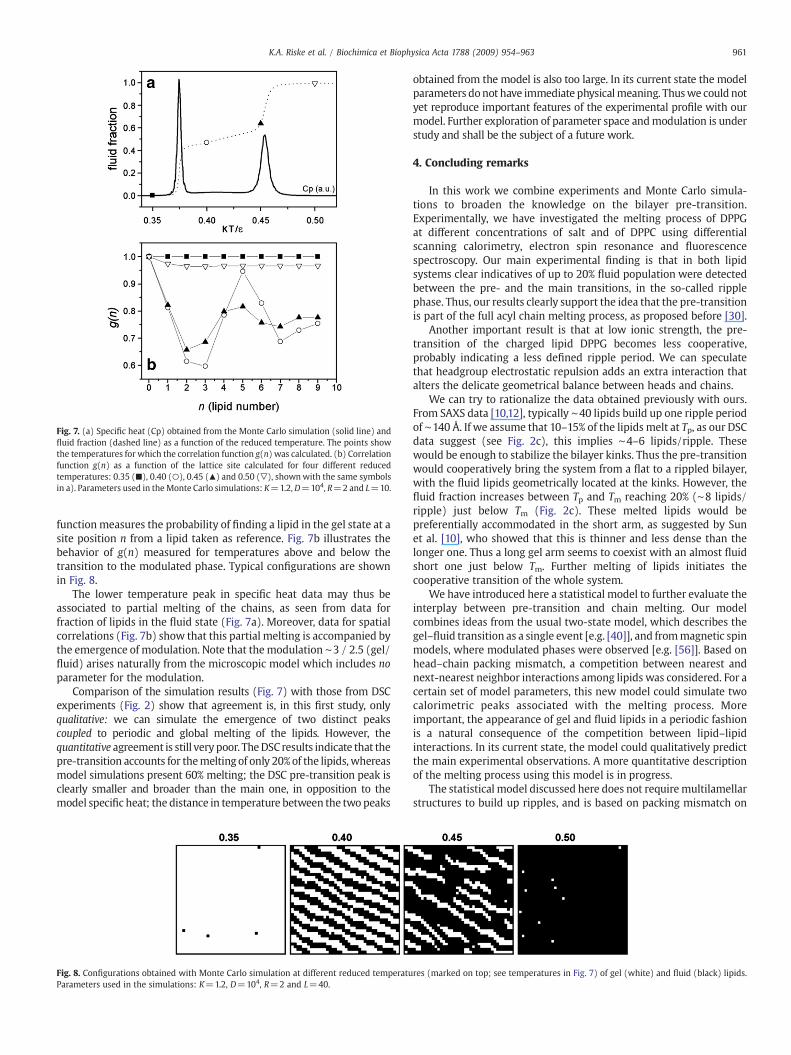
Fig. 7. (a) Specific heat (Cp) obtained from the Monte Carlo simulation (solid line) andfluid fraction (dashed line) as a function of the reduced temperature. The points showthe temperatures for which the correlation function g(n) was calculated. (b) Correlationfunction g(n) as a function of the lattice site calculated for four different reducedtemperatures: 0.35 (■), 0.40 (○), 0.45 (▴) and 0.50 (▽), shownwith the same symbolsin a). Parameters used in theMonte Carlo simulations: K=1.2,D=104, R=2 and L=10.
961K.A. Riske et al. / Biochimica et Biophysica Acta 1788 (2009) 954–963
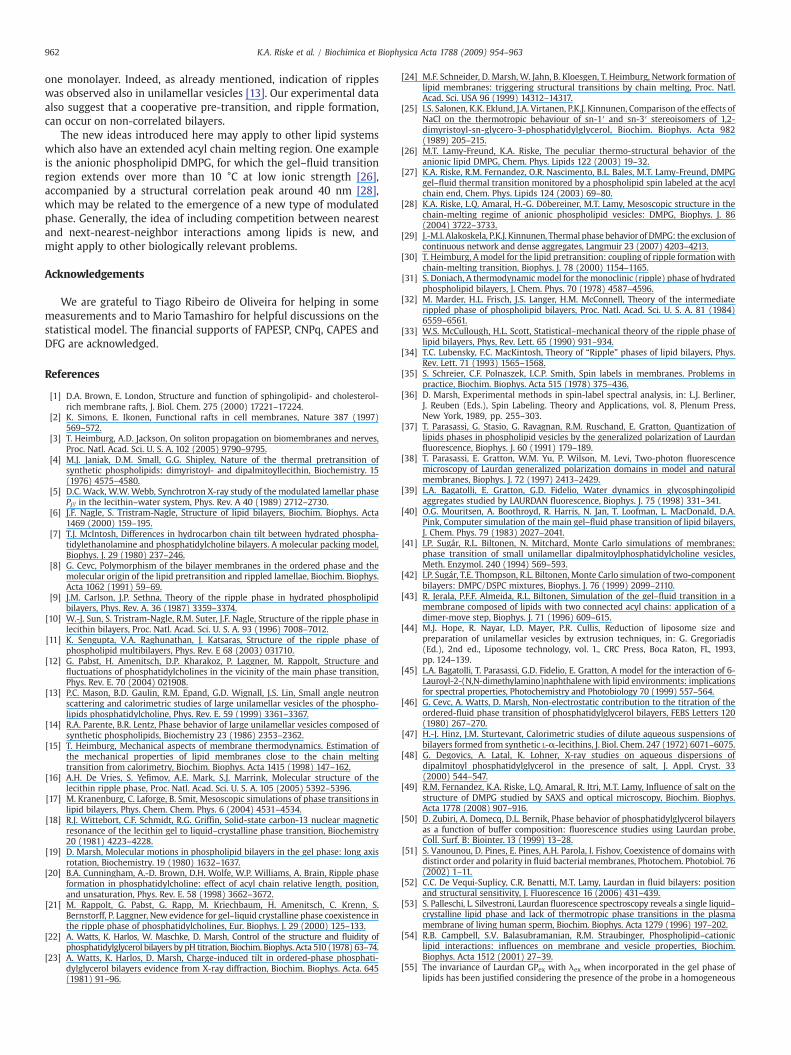
function measures the probability of finding a lipid in the gel state at asite position n from a lipid taken as reference. Fig. 7b illustrates thebehavior of g(n) measured for temperatures above and below thetransition to the modulated phase. Typical configurations are shownin Fig. 8.
The lower temperature peak in specific heat data may thus beassociated to partial melting of the chains, as seen from data forfraction of lipids in the fluid state (Fig. 7a). Moreover, data for spatialcorrelations (Fig. 7b) show that this partial melting is accompanied bythe emergence of modulation. Note that themodulation ∼3 / 2.5 (gel/fluid) arises naturally from the microscopic model which includes noparameter for the modulation.
Comparison of the simulation results (Fig. 7) with those from DSCexperiments (Fig. 2) show that agreement is, in this first study, onlyqualitative: we can simulate the emergence of two distinct peakscoupled to periodic and global melting of the lipids. However, thequantitative agreement is still very poor. TheDSC results indicate that thepre-transition accounts for themelting of only 20%of the lipids,whereasmodel simulations present 60% melting; the DSC pre-transition peak isclearly smaller and broader than the main one, in opposition to themodel specific heat; the distance in temperature between the two peaks
Fig. 8. Configurations obtained with Monte Carlo simulation at different reduced temperatuParameters used in the simulations: K=1.2, D=104, R=2 and L=40.
obtained from the model is also too large. In its current state the modelparameters donot have immediate physicalmeaning. Thuswe could notyet reproduce important features of the experimental profile with ourmodel. Further exploration of parameter space andmodulation is understudy and shall be the subject of a future work.
4. Concluding remarks
In this work we combine experiments and Monte Carlo simula-tions to broaden the knowledge on the bilayer pre-transition.Experimentally, we have investigated the melting process of DPPGat different concentrations of salt and of DPPC using differentialscanning calorimetry, electron spin resonance and fluorescencespectroscopy. Our main experimental finding is that in both lipidsystems clear indicatives of up to 20% fluid population were detectedbetween the pre- and the main transitions, in the so-called ripplephase. Thus, our results clearly support the idea that the pre-transitionis part of the full acyl chain melting process, as proposed before [30].
Another important result is that at low ionic strength, the pre-transition of the charged lipid DPPG becomes less cooperative,probably indicating a less defined ripple period. We can speculatethat headgroup electrostatic repulsion adds an extra interaction thatalters the delicate geometrical balance between heads and chains.
We can try to rationalize the data obtained previously with ours.From SAXS data [10,12], typically ∼40 lipids build up one ripple periodof ∼140 Å. If we assume that 10–15% of the lipids melt at Tp, as our DSCdata suggest (see Fig. 2c), this implies ∼4–6 lipids/ripple. Thesewould be enough to stabilize the bilayer kinks. Thus the pre-transitionwould cooperatively bring the system from a flat to a rippled bilayer,with the fluid lipids geometrically located at the kinks. However, thefluid fraction increases between Tp and Tm reaching 20% (∼8 lipids/ripple) just below Tm (Fig. 2c). These melted lipids would bepreferentially accommodated in the short arm, as suggested by Sunet al. [10], who showed that this is thinner and less dense than thelonger one. Thus a long gel arm seems to coexist with an almost fluidshort one just below Tm. Further melting of lipids initiates thecooperative transition of the whole system.
We have introduced here a statistical model to further evaluate theinterplay between pre-transition and chain melting. Our modelcombines ideas from the usual two-state model, which describes thegel–fluid transition as a single event [e.g. [40]], and frommagnetic spinmodels, where modulated phases were observed [e.g. [56]]. Based onhead–chain packing mismatch, a competition between nearest andnext-nearest neighbor interactions among lipids was considered. For acertain set of model parameters, this new model could simulate twocalorimetric peaks associated with the melting process. Moreimportant, the appearance of gel and fluid lipids in a periodic fashionis a natural consequence of the competition between lipid–lipidinteractions. In its current state, the model could qualitatively predictthe main experimental observations. A more quantitative descriptionof the melting process using this model is in progress.
The statistical model discussed here does not requiremultilamellarstructures to build up ripples, and is based on packing mismatch on
res (marked on top; see temperatures in Fig. 7) of gel (white) and fluid (black) lipids.
962 K.A. Riske et al. / Biochimica et Biophysica Acta 1788 (2009) 954–963
one monolayer. Indeed, as already mentioned, indication of rippleswas observed also in unilamellar vesicles [13]. Our experimental dataalso suggest that a cooperative pre-transition, and ripple formation,can occur on non-correlated bilayers.
The new ideas introduced here may apply to other lipid systemswhich also have an extended acyl chain melting region. One exampleis the anionic phospholipid DMPG, for which the gel–fluid transitionregion extends over more than 10 °C at low ionic strength [26],accompanied by a structural correlation peak around 40 nm [28],which may be related to the emergence of a new type of modulatedphase. Generally, the idea of including competition between nearestand next-nearest-neighbor interactions among lipids is new, andmight apply to other biologically relevant problems.
Acknowledgements
We are grateful to Tiago Ribeiro de Oliveira for helping in somemeasurements and to Mario Tamashiro for helpful discussions on thestatistical model. The financial supports of FAPESP, CNPq, CAPES andDFG are acknowledged.
References
[1] D.A. Brown, E. London, Structure and function of sphingolipid- and cholesterol-rich membrane rafts, J. Biol. Chem. 275 (2000) 17221–17224.
[2] K. Simons, E. Ikonen, Functional rafts in cell membranes, Nature 387 (1997)569–572.
[3] T. Heimburg, A.D. Jackson, On soliton propagation on biomembranes and nerves,Proc. Natl. Acad. Sci. U. S. A. 102 (2005) 9790–9795.
[4] M.J. Janiak, D.M. Small, G.G. Shipley, Nature of the thermal pretransition ofsynthetic phospholipids: dimyristoyl- and dipalmitoyllecithin, Biochemistry. 15(1976) 4575–4580.
[5] D.C. Wack, W.W. Webb, Synchrotron X-ray study of the modulated lamellar phasePβ' in the lecithin–water system, Phys. Rev. A 40 (1989) 2712–2730.
[6] J.F. Nagle, S. Tristram-Nagle, Structure of lipid bilayers, Biochim. Biophys. Acta1469 (2000) 159–195.
[7] T.J. McIntosh, Differences in hydrocarbon chain tilt between hydrated phospha-tidylethanolamine and phosphatidylcholine bilayers. A molecular packing model,Biophys. J. 29 (1980) 237–246.
[8] G. Cevc, Polymorphism of the bilayer membranes in the ordered phase and themolecular origin of the lipid pretransition and rippled lamellae, Biochim. Biophys.Acta 1062 (1991) 59–69.
[9] J.M. Carlson, J.P. Sethna, Theory of the ripple phase in hydrated phospholipidbilayers, Phys. Rev. A. 36 (1987) 3359–3374.
[10] W.-J. Sun, S. Tristram-Nagle, R.M. Suter, J.F. Nagle, Structure of the ripple phase inlecithin bilayers, Proc. Natl. Acad. Sci. U. S. A. 93 (1996) 7008–7012.
[11] K. Sengupta, V.A. Raghunathan, J. Katsaras, Structure of the ripple phase ofphospholipid multibilayers, Phys. Rev. E 68 (2003) 031710.
[12] G. Pabst, H. Amenitsch, D.P. Kharakoz, P. Laggner, M. Rappolt, Structure andfluctuations of phosphatidylcholines in the vicinity of the main phase transition,Phys. Rev. E. 70 (2004) 021908.
[13] P.C. Mason, B.D. Gaulin, R.M. Epand, G.D. Wignall, J.S. Lin, Small angle neutronscattering and calorimetric studies of large unilamellar vesicles of the phospho-lipids phosphatidylcholine, Phys. Rev. E. 59 (1999) 3361–3367.
[14] R.A. Parente, B.R. Lentz, Phase behavior of large unilamellar vesicles composed ofsynthetic phospholipids, Biochemistry 23 (1986) 2353–2362.
[15] T. Heimburg, Mechanical aspects of membrane thermodynamics. Estimation ofthe mechanical properties of lipid membranes close to the chain meltingtransition from calorimetry, Biochim. Biophys. Acta 1415 (1998) 147–162.
[16] A.H. De Vries, S. Yefimov, A.E. Mark, S.J. Marrink, Molecular structure of thelecithin ripple phase, Proc. Natl. Acad. Sci. U. S. A. 105 (2005) 5392–5396.
[17] M. Kranenburg, C. Laforge, B. Smit, Mesoscopic simulations of phase transitions inlipid bilayers, Phys. Chem. Chem. Phys. 6 (2004) 4531–4534.
[18] R.J. Wittebort, C.F. Schmidt, R.G. Griffin, Solid-state carbon-13 nuclear magneticresonance of the lecithin gel to liquid–crystalline phase transition, Biochemistry20 (1981) 4223–4228.
[19] D. Marsh, Molecular motions in phospholipid bilayers in the gel phase: long axisrotation, Biochemistry. 19 (1980) 1632–1637.
[20] B.A. Cunningham, A.-D. Brown, D.H. Wolfe, W.P. Williams, A. Brain, Ripple phaseformation in phosphatidylcholine: effect of acyl chain relative length, position,and unsaturation, Phys. Rev. E. 58 (1998) 3662–3672.
[21] M. Rappolt, G. Pabst, G. Rapp, M. Kriechbaum, H. Amenitsch, C. Krenn, S.Bernstorff, P. Laggner, New evidence for gel–liquid crystalline phase coexistence inthe ripple phase of phosphatidylcholines, Eur. Biophys. J. 29 (2000) 125–133.
[22] A. Watts, K. Harlos, W. Maschke, D. Marsh, Control of the structure and fluidity ofphosphatidylglycerol bilayers by pH titration, Biochim. Biophys. Acta 510 (1978) 63–74.
[23] A. Watts, K. Harlos, D. Marsh, Charge-induced tilt in ordered-phase phosphati-dylglycerol bilayers evidence from X-ray diffraction, Biochim. Biophys. Acta. 645(1981) 91–96.
[24] M.F. Schneider, D. Marsh, W. Jahn, B. Kloesgen, T. Heimburg, Network formation oflipid membranes: triggering structural transitions by chain melting, Proc. Natl.Acad. Sci. USA 96 (1999) 14312–14317.
[25] I.S. Salonen, K.K. Eklund, J.A. Virtanen, P.K.J. Kinnunen, Comparison of the effects ofNaCl on the thermotropic behaviour of sn-1′ and sn-3′ stereoisomers of 1,2-dimyristoyl-sn-glycero-3-phosphatidylglycerol, Biochim. Biophys. Acta 982(1989) 205–215.
[26] M.T. Lamy-Freund, K.A. Riske, The peculiar thermo-structural behavior of theanionic lipid DMPG, Chem. Phys. Lipids 122 (2003) 19–32.
[27] K.A. Riske, R.M. Fernandez, O.R. Nascimento, B.L. Bales, M.T. Lamy-Freund, DMPGgel–fluid thermal transition monitored by a phospholipid spin labeled at the acylchain end, Chem. Phys. Lipids 124 (2003) 69–80.
[28] K.A. Riske, L.Q. Amaral, H.-G. Döbereiner, M.T. Lamy, Mesoscopic structure in thechain-melting regime of anionic phospholipid vesicles: DMPG, Biophys. J. 86(2004) 3722–3733.
[29] J.-M.I. Alakoskela, P.K.J. Kinnunen, Thermal phase behavior of DMPG: the exclusion ofcontinuous network and dense aggregates, Langmuir 23 (2007) 4203–4213.
[30] T. Heimburg, Amodel for the lipid pretransition: coupling of ripple formationwithchain-melting transition, Biophys. J. 78 (2000) 1154–1165.
[31] S. Doniach, A thermodynamic model for themonoclinic (ripple) phase of hydratedphospholipid bilayers, J. Chem. Phys. 70 (1978) 4587–4596.
[32] M. Marder, H.L. Frisch, J.S. Langer, H.M. McConnell, Theory of the intermediaterippled phase of phospholipid bilayers, Proc. Natl. Acad. Sci. U. S. A. 81 (1984)6559–6561.
[33] W.S. McCullough, H.L. Scott, Statistical–mechanical theory of the ripple phase oflipid bilayers, Phys, Rev. Lett. 65 (1990) 931–934.
[34] T.C. Lubensky, F.C. MacKintosh, Theory of “Ripple” phases of lipid bilayers, Phys.Rev. Lett. 71 (1993) 1565–1568.
[35] S. Schreier, C.F. Polnaszek, I.C.P. Smith, Spin labels in membranes. Problems inpractice, Biochim. Biophys. Acta 515 (1978) 375–436.
[36] D. Marsh, Experimental methods in spin-label spectral analysis, in: L.J. Berliner,J. Reuben (Eds.), Spin Labeling. Theory and Applications, vol. 8, Plenum Press,New York, 1989, pp. 255–303.
[37] T. Parasassi, G. Stasio, G. Ravagnan, R.M. Ruschand, E. Gratton, Quantization oflipids phases in phospholipid vesicles by the generalized polarization of Laurdanfluorescence, Biophys. J. 60 (1991) 179–189.
[38] T. Parasassi, E. Gratton, W.M. Yu, P. Wilson, M. Levi, Two-photon fluorescencemicroscopy of Laurdan generalized polarization domains in model and naturalmembranes, Biophys. J. 72 (1997) 2413–2429.
[39] L.A. Bagatolli, E. Gratton, G.D. Fidelio, Water dynamics in glycosphingolipidaggregates studied by LAURDAN fluorescence, Biophys. J. 75 (1998) 331–341.
[40] O.G. Mouritsen, A. Boothroyd, R. Harris, N. Jan, T. Loofman, L. MacDonald, D.A.Pink, Computer simulation of the main gel–fluid phase transition of lipid bilayers,J. Chem. Phys. 79 (1983) 2027–2041.
[41] I.P. Sugár, R.L. Biltonen, N. Mitchard, Monte Carlo simulations of membranes:phase transition of small unilamellar dipalmitoylphosphatidylcholine vesicles,Meth. Enzymol. 240 (1994) 569–593.
[42] I.P. Sugár, T.E. Thompson, R.L. Biltonen, Monte Carlo simulation of two-componentbilayers: DMPC/DSPC mixtures, Biophys. J. 76 (1999) 2099–2110.
[43] R. Jerala, P.F.F. Almeida, R.L. Biltonen, Simulation of the gel–fluid transition in amembrane composed of lipids with two connected acyl chains: application of adimer-move step, Biophys. J. 71 (1996) 609–615.
[44] M.J. Hope, R. Nayar, L.D. Mayer, P.R. Cullis, Reduction of liposome size andpreparation of unilamellar vesicles by extrusion techniques, in: G. Gregoriadis(Ed.), 2nd ed., Liposome technology, vol. 1., CRC Press, Boca Raton, FL, 1993,pp. 124–139.
[45] L.A. Bagatolli, T. Parasassi, G.D. Fidelio, E. Gratton, A model for the interaction of 6-Lauroyl-2-(N,N-dimethylamino)naphthalene with lipid environments: implicationsfor spectral properties, Photochemistry and Photobiology 70 (1999) 557–564.
[46] G. Cevc, A. Watts, D. Marsh, Non-electrostatic contribution to the titration of theordered-fluid phase transition of phosphatidylglycerol bilayers, FEBS Letters 120(1980) 267–270.
[47] H.-J. Hinz, J.M. Sturtevant, Calorimetric studies of dilute aqueous suspensions ofbilayers formed from synthetic L-α-lecithins, J. Biol. Chem. 247 (1972) 6071–6075.
[48] G. Degovics, A. Latal, K. Lohner, X-ray studies on aqueous dispersions ofdipalmitoyl phosphatidylglycerol in the presence of salt, J. Appl. Cryst. 33(2000) 544–547.
[49] R.M. Fernandez, K.A. Riske, L.Q. Amaral, R. Itri, M.T. Lamy, Influence of salt on thestructure of DMPG studied by SAXS and optical microscopy, Biochim. Biophys.Acta 1778 (2008) 907–916.
[50] D. Zubiri, A. Domecq, D.L. Bernik, Phase behavior of phosphatidylglycerol bilayersas a function of buffer composition: fluorescence studies using Laurdan probe,Coll. Surf. B: Biointer. 13 (1999) 13–28.
[51] S. Vanounou, D. Pines, E. Pines, A.H. Parola, I. Fishov, Coexistence of domains withdistinct order and polarity in fluid bacterial membranes, Photochem. Photobiol. 76(2002) 1–11.
[52] C.C. De Vequi-Suplicy, C.R. Benatti, M.T. Lamy, Laurdan in fluid bilayers: positionand structural sensitivity, J. Fluorescence 16 (2006) 431–439.
[53] S. Palleschi, L. Silvestroni, Laurdan fluorescence spectroscopy reveals a single liquid–crystalline lipid phase and lack of thermotropic phase transitions in the plasmamembrane of living human sperm, Biochim. Biophys. Acta 1279 (1996) 197–202.
[54] R.B. Campbell, S.V. Balasubramanian, R.M. Straubinger, Phospholipid–cationiclipid interactions: influences on membrane and vesicle properties, Biochim.Biophys. Acta 1512 (2001) 27–39.
[55] The invariance of Laurdan GPex with λex when incorporated in the gel phase oflipids has been justified considering the presence of the probe in a homogeneous
963K.A. Riske et al. / Biochimica et Biophysica Acta 1788 (2009) 954–963
membrane. However, the discussion about the negative values obtained forLaurdan in pure fluid phases are still not clear [37]. We would like to explain thenon-zero slopes presented here (Fig. 5b) for lipids in pure gel phase (or fluidphase), which were calculated through a rather accurate methodology, callingattention to the two absorption and emission bands seen in Laurdan spectra [37] inpure phases, which could be attributed to Laurdan in different conformations,absorbing and emitting at different wavelengths (the center of the bands). Hence,it is quite understandable that GPex would vary with λex, as the relative excitationof the bands would be dependent on the excitation wavelength: the ratio GPexwould be dependent on λex. This discussion is out of the scope of the presentwork,and will be focused elsewhere (de Vequi-Suplicy, Lamy, Coutinho, in preparation).
[56] W. Selke, The ANNNI model — theoretical analysis and experimental application,Phys. Rep. 170 (1988) 213–264.
[57] N. Bhattacharyya, S. Dasgupta, Statistical mechanics of the 1D ferromagnetic ANNNIchain under an external field: revisited, J. Phys. A: Math. Gen. 24 (1991) 3927–3934.
[58] M.H.R. Tragtenberg, C.S.O. Yokoi, Field behavior of an Ising model with competinginteractions on the Bethe lattice, Phys. Rev. E. 52 (1995) 2187–2197.
[59] A. Sato, F. Matsubara, Equilibrium properties of an axial next-nearest-neighborIsing model in two dimensions, Phys. Rev. B. 60 (1999) 10316–10324.
[60] R.A. Dos Anjos, J.R. Viana, J.R. de Sousa, J.A. Plascak, Three-dimensional Isingmodelwith nearest- and next-nearest-neighbor interactions, Phys. Rev. E. 76 (2007)022103.
[61] S. Kirchner, G. Cevc, On the origin of the thermal Lβ' → Pβ' pretransition in thelamellar phospholipid membranes, Europhys. Lett. 28 (1994) 31–36.
[62] M.E.J. Newman, G.T. Barkema, Monte Carlo Methods in Statistical Physics,Clarendon Press, Gloucestershire, 1999.
[63] D.P. Landau, K. Binder, A Guide to Monte Carlo Simulations in Statistical Physics,2nd ed.Cambridge University Press, Cambridge, 2005.
[64] H.B. Callen, Thermodynamics and an Introduction to Thermostatistics, 2nd ed.John Wiley & Sons Inc., Singapore, 1985.