Life Cycle Assessment of district heat production in a straw fired CHP plant
20
Life Cycle Assessment of district heat production in a straw fired CHP plant Ranjan Parajuli a,* ,Søren Løkke b , Poul Alberg Østergaard b , Marie Trydeman Knudsen a , Jannick H. Schmidt b , Tommy Dalgaard a a Department of Agroecology, Aarhus University, Blichers All e 20, DK-8830, Tjele, Denmark b Department of Development and Planning, Aalborg University, Vestre Havnepromenade 9, DK-9000, Aalborg, Denmark article info Article history: Received 12 November 2013 Received in revised form 31 May 2014 Accepted 6 June 2014 Available online Keywords: Life Cycle Assessment Straw CHP Boiler Environmental performances abstract Due to concerns about the sustainability of the energy sector, conversion of biomass to energy is increasing its hold globally. Life Cycle Impact Assessment (LCIA) is being adopted as an analytical tool to assess the environmental impacts in the entire cycle of biomass production and conversions to different products. This study deals with the LCIA of straw conversion to district heat in a Combined Heat and Power (CHP) plant and in a district heating boiler (producing heat only). Environmental impact categories are Global Warming Potential (GWP), Acidification Potential (AP), aquatic and terrestrial Eutrophication Poten- tial (EP) and Non-Renewable Energy (NRE) use. In the case of CHP, the co-produced elec- tricity is assumed to displace the marginal Danish electricity mix. The current study showed that straw fired in the CHP plant would lead to a GWP of 187 g CO 2 -eq, AP 0.01 m 2 UES (un-protected ecosystem), aquatic EP 0.16 g NO 3 -eq, terrestrial EP 0.008 m 2 UES, and NRE use 0.14 MJ-primary per 1 MJ heat production. Straw conversion to heat in the CHP plant showed better environmental performances compared to the district heating boiler. Furthermore, removing straw from the field is related to the consequence e.g. decline in soil carbon sequestration, limiting soil nutrient availability, and when compared with natural gas the conversion of straw to heat would lead to a higher aquatic and terrestrial EP and AP. The study also outlays spaces for the detail sustainability assessment of straw conversion in a biorefinery and compare with the current study. © 2014 Elsevier Ltd. All rights reserved. 1. Introduction The predictions on the global energy demand have drawn attentions to a wider diversification of biomass and bioenergy use [1]. Political concerns that articulate about energy secu- rity, global climate change issues, land and water manage- ment and rural income are among the factors driving for the maximized use of biomass in the society [2]. Since production of agricultural biomass is related to fulfill the multi-fold de- mands including in food, fuel and feed sectors, it is essential to assess a wider environmental and economic sustainability (e.g. land use impact, soil nutrient loss, biodiversity loss) [3,4] when prioritizing them for any specific purposes. Manure, grass and lignocellulosic biomass (e.g. wood, straw) [5,6] are among the most popular sources of biomass in * Corresponding author. Tel.: þ45 71606831. E-mail addresses: [email protected], [email protected] (R. Parajuli). Available online at www.sciencedirect.com ScienceDirect http://www.elsevier.com/locate/biombioe biomass and bioenergy 68 (2014) 115 e134 http://dx.doi.org/10.1016/j.biombioe.2014.06.005 0961-9534/© 2014 Elsevier Ltd. All rights reserved.
Transcript of Life Cycle Assessment of district heat production in a straw fired CHP plant

ww.sciencedirect.com
b i om a s s a n d b i o e n e r g y 6 8 ( 2 0 1 4 ) 1 1 5e1 3 4
Available online at w
ScienceDirect
http: / /www.elsevier .com/locate/biombioe
Life Cycle Assessment of district heat production ina straw fired CHP plant
Ranjan Parajuli a,*, Søren Løkke b, Poul Alberg Østergaard b,Marie Trydeman Knudsen a, Jannick H. Schmidt b, Tommy Dalgaard a
a Department of Agroecology, Aarhus University, Blichers All�e 20, DK-8830, Tjele, Denmarkb Department of Development and Planning, Aalborg University, Vestre Havnepromenade 9, DK-9000, Aalborg,
Denmark
a r t i c l e i n f o
Article history:
Received 12 November 2013
Received in revised form
31 May 2014
Accepted 6 June 2014
Available online
Keywords:
Life Cycle Assessment
Straw
CHP
Boiler
Environmental performances
* Corresponding author. Tel.: þ45 71606831.E-mail addresses: ranjan.parajuli@agrsci.
http://dx.doi.org/10.1016/j.biombioe.2014.06.0961-9534/© 2014 Elsevier Ltd. All rights rese
a b s t r a c t
Due to concerns about the sustainability of the energy sector, conversion of biomass to
energy is increasing its hold globally. Life Cycle Impact Assessment (LCIA) is being adopted
as an analytical tool to assess the environmental impacts in the entire cycle of biomass
production and conversions to different products. This study deals with the LCIA of straw
conversion to district heat in a Combined Heat and Power (CHP) plant and in a district
heating boiler (producing heat only). Environmental impact categories are Global Warming
Potential (GWP), Acidification Potential (AP), aquatic and terrestrial Eutrophication Poten-
tial (EP) and Non-Renewable Energy (NRE) use. In the case of CHP, the co-produced elec-
tricity is assumed to displace the marginal Danish electricity mix. The current study
showed that straw fired in the CHP plant would lead to a GWP of �187 g CO2-eq, AP
0.01 m2 UES (un-protected ecosystem), aquatic EP 0.16 g NO3-eq, terrestrial EP 0.008 m2 UES,
and NRE use �0.14 MJ-primary per 1 MJ heat production. Straw conversion to heat in the
CHP plant showed better environmental performances compared to the district heating
boiler. Furthermore, removing straw from the field is related to the consequence e.g.
decline in soil carbon sequestration, limiting soil nutrient availability, and when compared
with natural gas the conversion of straw to heat would lead to a higher aquatic and
terrestrial EP and AP. The study also outlays spaces for the detail sustainability assessment
of straw conversion in a biorefinery and compare with the current study.
© 2014 Elsevier Ltd. All rights reserved.
1. Introduction
The predictions on the global energy demand have drawn
attentions to a wider diversification of biomass and bioenergy
use [1]. Political concerns that articulate about energy secu-
rity, global climate change issues, land and water manage-
ment and rural income are among the factors driving for the
dk, parajuliranjan@yahoo005rved.
maximized use of biomass in the society [2]. Since production
of agricultural biomass is related to fulfill the multi-fold de-
mands including in food, fuel and feed sectors, it is essential
to assess a wider environmental and economic sustainability
(e.g. land use impact, soil nutrient loss, biodiversity loss) [3,4]
when prioritizing them for any specific purposes.
Manure, grass and lignocellulosic biomass (e.g. wood,
straw) [5,6] are among the most popular sources of biomass in
.com (R. Parajuli).

Abbreviations
AP Acidification Potential
C Carbon
CHP Combined Heat and Power
CoNG Combustion with Natural Gas
CoWS Combustion with Wheat Straw
DM Dry Matter
EP Eutrophication Potential
GHG Greenhouse Gas
GWP Global Warming Potential
LCA Life Cycle Assessment
LCI Life Cycle Inventory
LCIA Life Cycle Impact Assessment
MJ Mega Joule
Mha Million hectatre
Mt Million ton
m2 UES Square Meter of Un-protected Ecosystem
m2-a Square Meter-annual
N Nitrogen
N2eN Nitrogen Emission from Nitrogen Fertilizer
Application
NH3eN AmmmonicaleNitrogen
NO3eN NitrateeNitrogen
N2OeN Nitrous OxideeNitrogen
NOxeN Nitrogen Oxide as NO2
NRE Non-Renewable Energy
tDM Ton of Dry Matter
PJ Peta Joule
b i om a s s a n d b i o e n e r g y 6 8 ( 2 0 1 4 ) 1 1 5e1 3 4116
the European Union [7], particularly in the context of
achieving the EU 2020 goals targeting to upscale the renewable
energy by 20% by the 2020 [8]. Denmark is the EU pioneer
country for the use of straw as a fuel source, being the result of
dedicated policies started from the first oil crisis of 1973 and
onwards [9,10]. Today Denmark uses approximately 1.8
Million ton (Mt) of straw each year for energy [11]. In the
Danish agricultural system, cereals cover majority of the
agricultural area and straw is dominantly based on these
crops, in particular wheat [12]. The Danish agricultural sta-
tistics shows that of the total area covered by cereals in 2011,
i.e. 1.48 million hectare (Mha), the area covered by wheat was
about 50%. Including other cereals, total straw productionwas
from an area of about 0.96 Mha, with a productivity of about
3.29 ton per hectare (t/ha) [12] making an annual Danish straw
production of nearly 3.3 Mt.
In general, Denmark has relatively limited availability of
renewable energy sources, of which one of the most impor-
tant wind power inherently is of a fluctuating nature [13,14],
and thus needs to be supplemented by fuel-based technolo-
gies [15] in order to ensure that the energy system has the
required load-following capability. This might be very rele-
vant in light of Danish future sustainable energy goals, which
emphasizes integration of wind power in a larger scale to
implement a greater use of renewable energy. In the context,
it is also relevant to address the underlying issues in relation
to the demand side management [13], in the operational
management of existing CHP plants and other district heat
production facilities. District heating represents about 11% of
the gross energy consumption of the country in 2011 and 36%
of the gross energy consumption of the household sector [16].
In 2012, of the total district heat production (136 PJ), 60% was
produced from CHP plants alone (including both large and
small scale), 23% was from district heating boiler, and rest by
auto producers [16], illustrating that CHP plant has a signifi-
cant impact on the sustainability of Danish energy system
[10]. The CHP plant referred in the current study indicates the
production of both heat and electricity simultaneously, and
the district heating boiler represents production of heat only.
Biomass, in particular straw and wood has a larger share in
the total district heat production of the country, almost
covering 39% of the total production in 2012. The analysis of
the Danish Ministry of Climate and Energy [17], as well as in
independent analyses from the Danish Society of Engineers
[18], and in studies including those of Refs [19e21] have also
stressed on the prudent utilization of this finite resource to
meet the country's long term sustainability goal of energy
sector.
Compared to other biomass sources, some of the strong
advantages of straw include: its minimum competition with
food and feed industries and lower land use change impacts
[22]. Regardless of these advantages, there are also some de-
bates particularly related to the wider environmental sus-
tainability, including consequences connected to their
removal from an agriculture field [23e25]. Consequences
include mainly a decline in soil carbon pools with the subse-
quent effect on the soil's water holding capacity, structure
etc., a loss of soil carbon sequestration potential [25], and a
loss of availability of nutrients from straw to the soil [26]. In
order to have a proper basis for decision-making on the large-
scale use of straw for energy purposes, it is thus important to
assess the entire sets of impacts from the biomass generation
to their utilization. This might also bring attention towards
the perspectives, such as (i) what is the optimal use of biomass
for energy and the environmental impacts associated with
them and (ii) what could be the basis for choosing alternative
means of biomass conversions, besides heat and power pro-
duction, etc. In order to work with such perspectives the
concept of Life Cycle Assessment (LCA) is relevant. LCA is a
tool for the assessment of environmental loadings of entire
life cycle processes related to a production system, covering
all the processes, activities and resources used [27]. In the
current study, Life Cycle Impact Assessment (LCIA) of straw
conversion to district heat is discussed. Since, wheat is the
most common crop and the most important source for both
grain and straw in Denmark [28], the source of straw consid-
ered is wheat. The important aspects that have been dis-
cussed in the current paper are: assessment of related
environmental consequences of straw removal, assessment
of time based biomass decay process and their relation to the
soil carbon (C) and Nitrogen (N) build-up. In most of the LCA
studies, when considering the soil C sequestration potential
(related to crop production system and land management),
the time horizon used is mostly less than 100 years. Petersen
et al. [29] suggested to account for the soil carbon changes also
considering the partial carbon budget for individual crops and
combining it with the biomass decay process, which often
changes with the time perspectives on the release of CO2 from

Fig. 1 e System boundary the reference flow of wheat straw for the CHP plant (use left) and for the Boiler use (use right).
b i om a s s a n d b i o e n e r g y 6 8 ( 2 0 1 4 ) 1 1 5e1 3 4 117
the soil to the atmosphere. In the current paper, while
assessing the consequences of straw removal such aspects
have been accounted for, and are discussed in Section 2.3.1.
Regarding the conversion of biomass, two distinct cases of
straw conversion to district heat are discussed: (i) conversion
in the CHP plant and (ii) in the boiler (producing heat only).
Generally the district heating network is primarily supplied by
CHP plants, which are supplemented by thermal storage and
peak-load boilers [30]. Thus it is relevant to assess the envi-
ronmental loadings of the district heating boiler and compare
how they differ with the CHP plant. Generally literature
available in such pathways of biomass conversion, also
considering the consequential behavior of straw removal is
very limited. Furthermore, the study also compares straw
with natural gas as a fuel alternative to produce district heat
in the CHP plant. Finally research perspectives are drawn in
relation to the opportunities of reducing the assessed impacts
and optimizing the biomass conversion efficiency, e.g. in a
biorefinery. The aim of this study is to assess consequences of
straw removal as an alternative fuel to produce district heat in
a CHP plant and a district heating boiler.
2. Material and methods
2.1. Scope, functional unit and LCA method
The functional unit of the LCIA is 1 MJ of heat production, and
the impact categories are: Global Warming Potential (GWP),
Acidification Potential (AP), aquatic and terrestrial Eutrophica-
tion Potentials (EPs), and Non-Renewable Energy (NRE) use.
Units for the selected impact categories, unless otherwise
stated in the text are: GWP (g CO2-eq), AP (m2 UES), EP-aquatic
(gNO3-eq), EP-terrestrial (m2 UES) andNRE use (MJ-primary) per
functional unit. In the case AP and EP (terrestrial), m2 UES is the
site-generic as well as the site-dependent acidification and
terrestrial Eutrophication Potentials of an emission from a
functional unit, which is expressed as the area of ecosystem
within the full deposition area and brought to exceed the crit-
ical load of acidification and eutrophication as consequences of
emission [31,32]. The critical load in the case of terrestrial
eutrophication indicates the availability of excess amount of
nutrients in the ecosystems leading to a change of the species
composition and hence to an unwanted change in the char-
acter of the given ecosystem [32]. In the case of calculating the
EP (aquatic), it is assumed that impact of nitrate leaching is on
the lake ecosystem. Even thoughmost Danish lakes are already
regarded highly eutrophic [33], but with a defined aim to reduce
the present eutrophication status.
The “Stepwise2006” method [34,35] is used to assess the
environmental impacts for the selected impact categories.
GWP factors of methane (CH4), and di-nitrogen monoxide
(N2O) found in the method are adjusted to 25 and 298
respectively, as per IPCC [36], corresponding to a time horizon
of 100 years. The method is implemented in the PC tool
SimaPro 7.3.3 [37].
2.2. Approach of the assessment
With regard to formulation of LCIA model, system expansion
approach is used. In this approach, we have looked into the
effects and influences of a particular product in the overall

Fig. 2 e Decay profile of straw left in field.
b i om a s s a n d b i o e n e r g y 6 8 ( 2 0 1 4 ) 1 1 5e1 3 4118
system. The general idea is that such product(s) could play a
significant role in displacing the environmental impacts of
similar kind of product available in the market. In the current
study, it is considered that the conversion of straw in the CHP
plant leads to production of heat and electricity, and the co-
produced electricity from the plant is assumed to displace
the marginal Danish electricity mix and thus the related
environmental impacts. It is not possible in the case of the
district heating boiler because of the absence of co-production
of electricity. In the current study, the composition of mar-
ginal Danish electricity mix is based on Schmidt and Brandao
[38]. The methodology to estimate the mix is elaborated in
Schmidt et al. [39], which revealed that it was built considering
the future possible outlook of Danish electricity supplies
based on the difference between 2008 and 2020.
The idea behind the consideration of the system expansion
approach is that it allows to assess the changes in the envi-
ronmental consequences with the changes in the demand of
the marginal product [40]. Furthermore, as Schmidt [41]
highlighted, the system expansion approach is also useful to
assess and compare the environmental consequences be-
tween two situations of the material flow, such as; ‘a product
being at a place’ and ‘product being removed’. In the current
study, such cases are (i) straw incorporated into the soil, or,
removed for the energy purpose, (ii) CHP operated to produce
both heat and electricity: the electricity displacing the mar-
ginal supply and (iii) recycling nutrient content of slag back to
field displacing the equivalent amount of mineral fertilizers
(see Section 2.3.3).
2.3. System boundary, process descriptions and basicassumptions
The reference flow of the biomass is 1 ton (t), with 85% dry
matter (DM), which is subjected to produce the district heat
and further analyzed in relation to the functional unit. Straw
harvested from the field is regarded as mostly dried, with dry
matter (DM) content over 85% [42,43]. The system boundary
(Fig. 1) comprises of energy conversion stages: (i) straw
removal, (ii) collection and pre-processing, (iii) combustion
and (iv) management of fly ash and bottom ash (slag), in both
cases of heat production. It is assumed that heat is the main
product and electricity as a co-product of the CHP plant, while
particularly in northern and western European countries
electricity is sold as an additional product [44,45]. Other out-
puts of the system are slag and fly ash, the former is consid-
ered to be reused as fertilizer because of its nutrient value, and
the latter is supposed to be disposed in landfill sites because of
the presence of heavy metals [46,47]. Energy conversion pro-
cesses and basic assumptions employed in this study are
discussed in the Sections 2.3.1e2.3.3.
2.3.1. Straw removalWhen identifying the effects of removing straw, following
questions are crucial:
i. How does the removal of straw limit the soil C sequestra-
tion potential compared to the situation if alternatively
straw is incorporated into the soil in each second cropping
cycle?
ii. How it will have an impact on the availability of soil nu-
trients, and in turn what are the consequences associated
with it?
When crop residues are used as biomass for energy, the
effect is that the carbon content of the straw is emitted as CO2
instantaneously, while a long decay time in the soil causing
the same CO2 emissions but stretched over a longer period of
time is avoided. The decay function for straw can be estab-
lished using different models, e.g. the ‘C-tool’ [48] and the
‘ROTHC-26.3’ [49], and have been used for straw in Denmark,
in Petersen et al. [29] and Schmidt and Brandao [38] respec-
tively. The decay function for straw in Danish climatic con-
ditions based on Ref. [29] is illustrated in Fig. 2. The climatic
effect of affecting the timing of CO2 emission was modeled
using time weighted GWP. In common practice when calcu-
lating carbon footprints (and LCAs), no distinction is made
between different timings of emissions. The IPCC Global
Warming Potentials (GWPs) [36] are normally used for
expressing the relative importance of different GHG-
emissions. Most often (or always) this is done relative to
CO2. The GWP of a GHG emission is calculated based on the
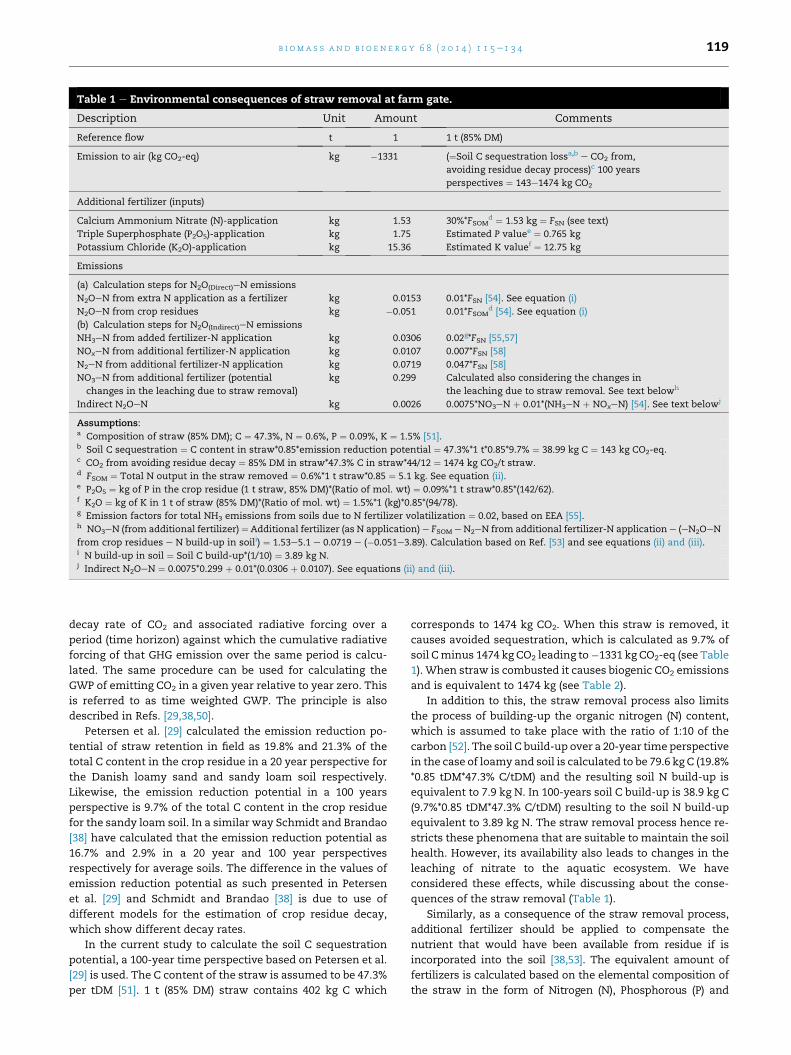
Table 1 e Environmental consequences of straw removal at farm gate.
Description Unit Amount Comments
Reference flow t 1 1 t (85% DM)
Emission to air (kg CO2-eq) kg �1331 (¼Soil C sequestration lossa,b e CO2 from,
avoiding residue decay process)c 100 years
perspectives ¼ 143e1474 kg CO2
Additional fertilizer (inputs)
Calcium Ammonium Nitrate (N)-application kg 1.53 30%*FSOMd ¼ 1.53 kg ¼ FSN (see text)
Triple Superphosphate (P2O5)-application kg 1.75 Estimated P valuee ¼ 0.765 kg
Potassium Chloride (K2O)-application kg 15.36 Estimated K valuef ¼ 12.75 kg
Emissions
(a) Calculation steps for N2O(Direct)eN emissions
N2OeN from extra N application as a fertilizer kg 0.0153 0.01*FSN [54]. See equation (i)
N2OeN from crop residues kg �0.051 0.01*FSOMd [54]. See equation (i)
(b) Calculation steps for N2O(Indirect)eN emissions
NH3eN from added fertilizer-N application kg 0.0306 0.02g*FSN [55,57]
NOxeN from additional fertilizer-N application kg 0.0107 0.007*FSN [58]
N2eN from additional fertilizer-N application kg 0.0719 0.047*FSN [58]
NO3eN from additional fertilizer (potential
changes in the leaching due to straw removal)
kg 0.299 Calculated also considering the changes in
the leaching due to straw removal. See text belowh
Indirect N2OeN kg 0.0026 0.0075*NO3eN þ 0.01*(NH3eN þ NOxeN) [54]. See text belowj
Assumptions:a Composition of straw (85% DM); C ¼ 47.3%, N ¼ 0.6%, P ¼ 0.09%, K ¼ 1.5% [51].b Soil C sequestration ¼ C content in straw*0.85*emission reduction potential ¼ 47.3%*1 t*0.85*9.7% ¼ 38.99 kg C ¼ 143 kg CO2-eq.c CO2 from avoiding residue decay ¼ 85% DM in straw*47.3% C in straw*44/12 ¼ 1474 kg CO2/t straw.d FSOM ¼ Total N output in the straw removed ¼ 0.6%*1 t straw*0.85 ¼ 5.1 kg. See equation (ii).e P2O5 ¼ kg of P in the crop residue (1 t straw, 85% DM)*(Ratio of mol. wt) ¼ 0.09%*1 t straw*0.85*(142/62).f K2O ¼ kg of K in 1 t of straw (85% DM)*(Ratio of mol. wt) ¼ 1.5%*1 (kg)*0.85*(94/78).g Emission factors for total NH3 emissions from soils due to N fertilizer volatilization ¼ 0.02, based on EEA [55].h NO3eN (from additional fertilizer)¼ Additional fertilizer (as N application) e FSOM eN2eN from additional fertilizer-N application e (eN2OeN
from crop residues e N build-up in soili) ¼ 1.53e5.1 e 0.0719 e (�0.051e3.89). Calculation based on Ref. [53] and see equations (ii) and (iii).i N build-up in soil ¼ Soil C build-up*(1/10) ¼ 3.89 kg N.j Indirect N2OeN ¼ 0.0075*0.299 þ 0.01*(0.0306 þ 0.0107). See equations (ii) and (iii).
b i om a s s a n d b i o e n e r g y 6 8 ( 2 0 1 4 ) 1 1 5e1 3 4 119
decay rate of CO2 and associated radiative forcing over a
period (time horizon) against which the cumulative radiative
forcing of that GHG emission over the same period is calcu-
lated. The same procedure can be used for calculating the
GWP of emitting CO2 in a given year relative to year zero. This
is referred to as time weighted GWP. The principle is also
described in Refs. [29,38,50].
Petersen et al. [29] calculated the emission reduction po-
tential of straw retention in field as 19.8% and 21.3% of the
total C content in the crop residue in a 20 year perspective for
the Danish loamy sand and sandy loam soil respectively.
Likewise, the emission reduction potential in a 100 years
perspective is 9.7% of the total C content in the crop residue
for the sandy loam soil. In a similar way Schmidt and Brandao
[38] have calculated that the emission reduction potential as
16.7% and 2.9% in a 20 year and 100 year perspectives
respectively for average soils. The difference in the values of
emission reduction potential as such presented in Petersen
et al. [29] and Schmidt and Brandao [38] is due to use of
different models for the estimation of crop residue decay,
which show different decay rates.
In the current study to calculate the soil C sequestration
potential, a 100-year time perspective based on Petersen et al.
[29] is used. The C content of the straw is assumed to be 47.3%
per tDM [51]. 1 t (85% DM) straw contains 402 kg C which
corresponds to 1474 kg CO2. When this straw is removed, it
causes avoided sequestration, which is calculated as 9.7% of
soil Cminus 1474 kg CO2 leading to�1331 kg CO2-eq (see Table
1). When straw is combusted it causes biogenic CO2 emissions
and is equivalent to 1474 kg (see Table 2).
In addition to this, the straw removal process also limits
the process of building-up the organic nitrogen (N) content,
which is assumed to take place with the ratio of 1:10 of the
carbon [52]. The soil C build-up over a 20-year time perspective
in the case of loamy and soil is calculated to be 79.6 kg C (19.8%
*0.85 tDM*47.3% C/tDM) and the resulting soil N build-up is
equivalent to 7.9 kg N. In 100-years soil C build-up is 38.9 kg C
(9.7%*0.85 tDM*47.3% C/tDM) resulting to the soil N build-up
equivalent to 3.89 kg N. The straw removal process hence re-
stricts these phenomena that are suitable to maintain the soil
health. However, its availability also leads to changes in the
leaching of nitrate to the aquatic ecosystem. We have
considered these effects, while discussing about the conse-
quences of the straw removal (Table 1).
Similarly, as a consequence of the straw removal process,
additional fertilizer should be applied to compensate the
nutrient that would have been available from residue if is
incorporated into the soil [38,53]. The equivalent amount of
fertilizers is calculated based on the elemental composition of
the straw in the form of Nitrogen (N), Phosphorous (P) and
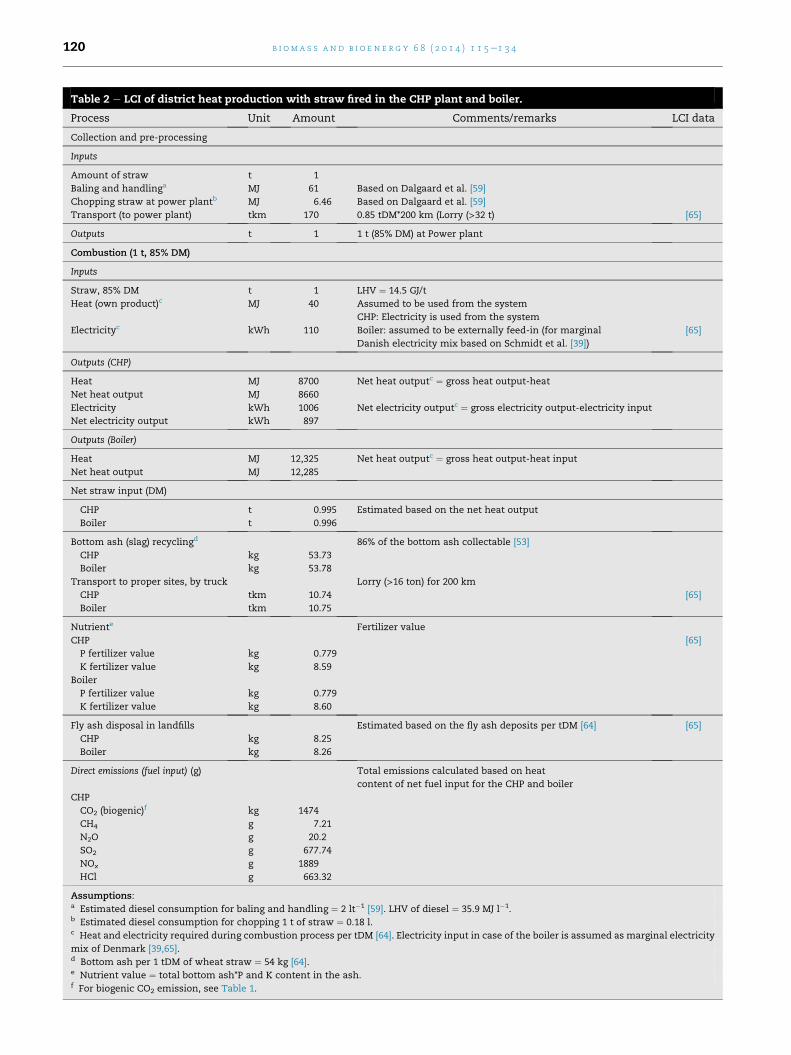
Table 2 e LCI of district heat production with straw fired in the CHP plant and boiler.
Process Unit Amount Comments/remarks LCI data
Collection and pre-processing
Inputs
Amount of straw t 1
Baling and handlinga MJ 61 Based on Dalgaard et al. [59]
Chopping straw at power plantb MJ 6.46 Based on Dalgaard et al. [59]
Transport (to power plant) tkm 170 0.85 tDM*200 km (Lorry (>32 t) [65]
Outputs t 1 1 t (85% DM) at Power plant
Combustion (1 t, 85% DM)
Inputs
Straw, 85% DM t 1 LHV ¼ 14.5 GJ/t
Heat (own product)c MJ 40 Assumed to be used from the system
CHP: Electricity is used from the system
Electricityc kWh 110 Boiler: assumed to be externally feed-in (for marginal [65]
Danish electricity mix based on Schmidt et al. [39])
Outputs (CHP)
Heat MJ 8700 Net heat outputc ¼ gross heat output-heat
Net heat output MJ 8660
Electricity kWh 1006 Net electricity outputc ¼ gross electricity output-electricity input
Net electricity output kWh 897
Outputs (Boiler)
Heat MJ 12,325 Net heat outputc ¼ gross heat output-heat input
Net heat output MJ 12,285
Net straw input (DM)
CHP t 0.995 Estimated based on the net heat output
Boiler t 0.996
Bottom ash (slag) recyclingd 86% of the bottom ash collectable [53]
CHP kg 53.73
Boiler kg 53.78
Transport to proper sites, by truck Lorry (>16 ton) for 200 km
CHP tkm 10.74 [65]
Boiler tkm 10.75
Nutriente Fertilizer value
CHP [65]
P fertilizer value kg 0.779
K fertilizer value kg 8.59
Boiler
P fertilizer value kg 0.779
K fertilizer value kg 8.60
Fly ash disposal in landfills Estimated based on the fly ash deposits per tDM [64] [65]
CHP kg 8.25
Boiler kg 8.26
Direct emissions (fuel input) (g) Total emissions calculated based on heat
content of net fuel input for the CHP and boiler
CHP
CO2 (biogenic)f kg 1474
CH4 g 7.21
N2O g 20.2
SO2 g 677.74
NOx g 1889
HCl g 663.32
Assumptions:a Estimated diesel consumption for baling and handling ¼ 2 lt�1 [59]. LHV of diesel ¼ 35.9 MJ l�1.b Estimated diesel consumption for chopping 1 t of straw ¼ 0.18 l.c Heat and electricity required during combustion process per tDM [64]. Electricity input in case of the boiler is assumed as marginal electricity
mix of Denmark [39,65].d Bottom ash per 1 tDM of wheat straw ¼ 54 kg [64].e Nutrient value ¼ total bottom ash*P and K content in the ash.f For biogenic CO2 emission, see Table 1.
b i om a s s a n d b i o e n e r g y 6 8 ( 2 0 1 4 ) 1 1 5e1 3 4120

b i om a s s a n d b i o e n e r g y 6 8 ( 2 0 1 4 ) 1 1 5e1 3 4 121
Potassium (K) [51]. It is further assumed that about 30% of the N
in straw is available to crop, as N is immobilized instead of
being mineralized at least for first few years [53]. In contrast, it
is assumed that 100% of the fertilizer value available in the
form of P and K in the straw is available to the crop [53]. The P
and K values are further transformed to P2O5 and K2O, by fac-
torizing with the ratio of their molecular weight (see Table 1).
The resulting emissions related to the straw removal pro-
cess are calculated with the aid of following equations,
adapted from IPCC [54] Tier 2 methodology:
(i) Direct N2OeN: It is calculated for N-fertilizer application
and from the crop residues (see equation (i)). In Table 1 of
the current study, N2OeN (from additional N-fertilizer
application) and N2OeN (avoided N2OeN from crop residue
removal) are separately calculated.
N2O�NðDirectÞ ¼ ðFSN þ FSOMÞ*EF1 (i)
where,
N2OeN(Direct) ¼ Direct N2OeN emissions produced from
managed soils, kg N2OeN/yr.
FSN ¼ synthetic fertilizer N applied to soils ¼ additional N-
fertilizer application, kg N/yr.
FSOM ¼ Amount of N in mineral soils that is mineralized
(related to a loss of soil C from soil organic matter as a
result of changes to land use or management, kg N/
yr) ¼ Total N in straw (in the current study).
EF1 ¼ Emission factor for additional N-fertilizer applica-
tion, crop residues, and Nmineralized frommineral soil as
a result of loss of soil carbon [kg N2OeN (kgN)�1]¼ 0.01 [54].
(ii) Indirect N2OeN
N2O�NðLeachÞ ¼ ðFSN þ FSOMÞ*FracLEACH�ðHÞ*EF5 (ii)
where,
N2OeN(Leach) ¼ Amount of N2OeN produced from leaching
and runoff of additional N-fertilizer application (kg N2OeN/
yr) to a managed soils in regions where leaching/runoff
occurs.
FracLEACH-(H) ¼ fraction of all N added to/mineralised in
managed soils in regions where leaching/runoff occurs
that is lost through leaching and runoff, kg N per kg of
additional N-fertilizer application ¼ 0.1 [54]. The potential
changes in the leaching due to straw removal process is
shown in Table 1 and discussed below.
EF5¼ emission factor forN2Oemissions fromN leaching and
runoff, kg N2OeN per kg N leached and runoff ¼ 0.0075 [54].
(iii) N2OeN from atmospheric deposition of N-volatilized
from managed soil:
N2OðATDÞ �N ¼ ðFSN*FracGASFi*EF4Þ (iii)
where,
N2O(ATD)eN ¼ Amount of N2OeN produced from atmo-
spheric deposition of N volatilized from managed soils,
kg N2OeN/yr.
FracGASFi ¼ fraction of synthetic fertilizer N-application (i.e.
FSN) that volatilizes as NH3 and NOx, kg N volatilized per kg
of additional N-fertilizer application under different con-
ditions i, ¼ 0.02 [55]. EF4 ¼ emission factor for N2O emis-
sions from atmospheric deposition of N on soils and water
surfaces, [kg NeN2O per (kg NH3eN þ NOxeN
volatilized)] ¼ 0.01 [54].
Nitrate leaching [56] is calculated considering the amount
of nitrogeneous fertilizer applied, and is based on the equation
(ii) [54]. In Table 1, NO3eN represents the changes in the ni-
trate leaching accounted due to straw removal process.
Furthermore, the emissions related to fertilizer applications,
such as NH3eN is based on the Ref. [55,57] and NOxeN is based
on Ref. [58] (Table 1).
2.3.2. Collection and pre-processingFuel inputs for the processes such as baling and handling of
biomass are calculated based on the methods developed by
Dalgaard et al. [59]. This stage of the energy conversion of the
straw also includes the transportation of the biomass at a
distance of 200 km to deliver it at the power plant.
2.3.3. Heat production and waste managementAt first, the gross district heat output is calculated in relation
to the reference flow of feedstock (i.e. 1 t, 85% DM of straw).
The thermal and electrical efficiencies of the CHP plant is
assumed to be 60% and 25% respectively [60,61]. Similarly, the
thermal efficiency of boiler is taken to be 85% [62]. These ef-
ficiencies are relativelymodest compared to units operated on
fossil fuels due to the corrosiveness of combusting straw at
high temperatures. Generally in the CHP plant operating in the
back-pressure mode, production of heat and electricity takes
place at an almost constant ratio, whilst if is operated in an
extraction mode the ratio is flexible [60]. This may infer to a
situation that in the steam extraction mode production of
heat and electricity primarily depend on the market demand.
For instance, Lund et al. [63] have discussed that the operation
of CHP plant normally responds to the changes in the elec-
tricity demand in a number of ways depending on the load
factor at each hour of operation. This indicates that at all
hours, the different energy plants compete on marginal pro-
duction costs on the electricity market. CHP plants can
decrease production by replacing heat production by heat
from the heat storage or the peak-load boiler. They further
argued that such situations normally occur if the marginal
production costs exceed the market price and if such change
does not violate the restriction of maintaining grid stability in
the system and thus are regulated. In the current study, it is
assumed that the CHP plant will work in an extraction mode,
and district heat production is the prime objective along with
selling electricity to the grid. It further entails that the mar-
ginal electricity production is not based solely on themarginal
change in capacity but can be characterized as a complex set
of affected electricity and heat technologies. Based on these
argumentswe have assumed that (i) partial load efficiencies to
be identical to nominal load efficiencies and (ii) extraction
plants to operate with back-pressure mode efficiencies.
As input to the combustion process, electricity and heat
required are assumed to be 40 MJ and 110 kWh respectively

b i om a s s a n d b i o e n e r g y 6 8 ( 2 0 1 4 ) 1 1 5e1 3 4122
per t (85% DM) [64]. It is assumed that both heat and electricity
required for the combustion are utilized from the produced
power of the straw fired CHP plant. In the case of boiler,
electricity required during the combustion process is assumed
to be from the marginal Danish electricity mix (see Section 2.2
for the marginal electricity mix). Life Cycle Inventory (LCI) for
the marginal technology mix is based on Ecoinvent Centre
[65], but the fuel mix is adjusted as indicated in Schmidt and
Brandao [38]. In the case of biomass fired power plants, the LCI
is based on the process related to “Wood chips, burned in
cogen 6400 kWth, emission control/CH U” [65]. Emissions
relevant to the combustion of straw, as per the selected
impact categories are presented in Table 2 and are based on
Nielsen [64]. The biogenic CO2 emission from the combustion
of straw is calculated as 1474 kg (see Table 2).
Net heat output is calculated by subtracting the heat input
required in the combustion process from the gross heat
output, and thus the net fuel input is also re-calculated. The
net electricity output is calculated accordingly, subtracting
the electricity input required during the combustion process
from the gross electricity produced from the CHP plant.
Furthermore, in the case of CHP plant co-produced electricity
is assumed to displace the marginal electricity mix (i.e. the
marginal Danish electricity mix, as stated above). This
displacement effect also indicates that the environmental
impacts related to their production can also be reduced while
accounting the net environmental impacts (e.g. GWP, NRE
use).
The total amount of bottom ash/slag produced from the
combustion process is assumed to be 54 kg tDM�1 [64].
Nutrient values of the slag are calculated based on the average
weight of P and K content, which are 1.45% and 16% respec-
tively [62] (Table 2). 100% of the nutrient values present in the
slag is assumed to be collected, as also suggested in Nguyen
et al. [53]. We have not accounted the N content of the bottom
ash, as most of the Nitrogen is lost in the combustion process
[53]. The nutrients values (P and K) available in the bottom ash
are assumed to displace the equivalent amount of fertilizer (P
and K fertilizer values). This partial substitution of the fertil-
izer thus displaces the related environmental impact of pro-
ducing them. Transport distance to deliver the bottom ash to
Fig. 3 e Environmental impacts in relatio
the agricultural field is assumed similar to the distance of
transporting the DM (i.e. 200 km). Similarly, fly ash (deposit) is
assumed to be 8.3 kg per t (85% DM) of the residue [64], and is
assumed to be disposed in a landfill site.
3. Results
3.1. Consequence of the straw removal process
Table 1 shows the consequences of removing 1 t (85% DM) of
the straw from the agricultural field, where it relates with
impacts: (i) constraining the soil C sequestration potential and
(ii) limiting the relevant N build-up that would have occurred
due to the biomass decay process if alternatively the residues
were incorporated to the soil. It also accounts the negative CO2
emission to atmosphere, equivalent to the biogenic CO2
release that would have been possible with the biomass
incorporation to the soil and followed by the decay process, as
discussed in Section 2.3.1. The overall consequences of the
straw removal are:
� If straw is not taken away from field, the emission reduc-
tion potential in relation to 1 t (85% DM) is equivalent to
39 kg C (i.e. þ143 kg CO2-eq) in a 100-year time frame. This
much of emission reduction potential is avoided, if the C
content in straw is converted to CO2 immediately after the
removal process (e.g. when used for energy purposes).
Moreover, if the negative CO2 emission is accounted while
estimating the total GWP the straw removal process avoids
the release of 1474 kg CO2-eq per reference flow of straw to
the atmosphere, making the net GWP at �1331 kg CO2-eq
per reference flow of straw (Table 1). At this level the net
GWP does not include emission related to compensating
fertilizer.
� Compensation of fertilizers (i.e. additional input) is
required to fulfill the nutrients that are generally removed
along with the straw. The nutrient values of straw are
calculated as 1.53, 0.765 and 12.75 kg (N, P, K) per reference
flow of straw. The net GWP including emission related to
manufacturing of compensating amount of chemical
n to removal of 1 t (85% DM) straw.

b i om a s s a n d b i o e n e r g y 6 8 ( 2 0 1 4 ) 1 1 5e1 3 4 123
fertilizers is calculated as �1312 kg CO2-eq per reference
quantity of straw.
� Hence, emissions from the fertilizer applications, primarily
from their manufacturing process are the added impact to
the environment.
In addition to the above mentioned consequences,
0.0153 kg of N2OeN is the calculated emission related to N-
fertilizer application. Likewise, in-direct N2OeN is 0.0026 kg
per 1 t (85% DM) straw (Table 1). Likewise, consequence of
limiting the soil C sequestration potential on the soil N build-
up is calculated to be at the rate of 3.89 kg-N per 1 t (85%DM) of
Fig. 4 e Environmental impacts of the straw fired district heat pr
(A): processes at farm gate to the power plant; downstream pro
straw (see Table 1). The potential changes in leaching are
accounted to be 0.299 kg NO3eN per reference flow of straw.
N2O emissions related to the removal of 1tDM of straw, as
stated in Ref. [66] is in the range of 0.1e0.25 kg N, which is
comparable with the current study presenting for 85% DM of
straw.
Based on the current study, if only the avoided soil C build-
up is accounted then the consequence of constraining the
emission reduction potential would cover 85% of the gross
GWP (i.6167 kg CO2-eq) and the rest is related to the emissions
from the manufacturing process of compensating chemical
fertilizers. The figure is comparable to the study [66], stating in
oduction in a CHP plant and in a boiler (upstream processes
cesses (B): combustion, management of slag and fly ash).

b i om a s s a n d b i o e n e r g y 6 8 ( 2 0 1 4 ) 1 1 5e1 3 4124
the range calculated of about 183e366 kg CO2-eq, but Wilhelm
et al. [67] stated it in the range of 36.67e146 kg CO2-eq per tDM
strawDM. It should be noted that the range given is dependent
on a major interaction with tillage and also these studies
calculated the GWP on 30 years perspective for 1 tDM of straw.
The straw removal process also leads to an AP at
3.6 m2 UES, EP (aquatic) 1.1 kg NO3-eq, EP (terrestrial)
10.3 m2 UES and NRE use at 290 MJ-primary per reference flow
of straw. These impacts are primarily because of the conse-
quences related to the fertilizer compensation. 100% of the
NRE use is related to the manufacturing process of the
compensating fertilizers (Fig. 3). Likewise, 38% of the gross AP
is due to processes related to the application of chemical
fertilizers and rest is due to emissions from the
manufacturing process of the compensating fertilizers. 16% of
the aquatic EP is related to the leaching of nitrate from the
added N-fertilizer and rest is emissions related to
manufacturing process of chemical fertilizers. Similarly, 62%
of the calculated terrestrial EP is related to the applied N-
Fig. 5 e Environmental hotspots of straw fired district he
fertilizer and the rest of the impact is related to the
manufacturing process of the calculated additional fertilizers.
These consequences are irrespective of how the application of
the removed straw is taking place, and in Section 3.2 we have
discussed the consequences in relation to the conversion of
the removed straw to district heat.
3.2. Comparison of environmental performance of strawconversion in the CHP plant and the boiler
In Fig. 4, environmental impacts of producing district heat in
the CHP plant and the boiler are presented, where we have
categorized: (A) the upstream processes followed by (Ai) straw
removal, (Aii) collection and pre-processing and (Aiii) trans-
portation of straw to the power plant; and (B) the downstream
processes followed by (Bi) combustion, (Bii) re-use of nutrient
content in the collected slag and their transportation and (Biii)
transportation of fly ash and related emission taking place in
the landfill site. It should be noted that the ‘straw removal
at production (a) CHP versus (b) boiler for heat only.

b i om a s s a n d b i o e n e r g y 6 8 ( 2 0 1 4 ) 1 1 5e1 3 4 125
process’, as mentioned in this section incorporates all the
consequences, as discussed in Section 3.1. Thus the net im-
pacts related to the straw removal process are accounted in
the calculation of entire biomass conversion process and
discussed in this section. The gross value represents the
added (þ) impacts related to the energy conversion processes,
and the net value represents “gross impact minus impacts
that are displaced”. Here displaceable impacts are the envi-
ronmental impacts related to both co-products; electricity and
nutrients values of slag, and thus they are subtracted from the
gross impact. In the case of the CHP plant, these co-products
are accounted, otherwise in the case of the boiler only the
nutrient values of slag are accounted. In the case of the straw
fired CHP plant the equivalent amount of electricity generated
while generating 1 MJ of heat is calculated to be 0.416 MJ
(considering the electricity efficiency of the CHP plant, see
Section 2.3.3). Furthermore, it should be noted that in Fig. 4,
the downstream side represents only the gross values of the
impact and the displaced impacts because of the co-products
(both electricity and nutrient content in the slag in the case of
CHP and only the latter product in the case of boiler) which
also occur at the same stream is separately presented in the
same figure.
3.2.1. Global Warming PotentialThe gross GWPper 1MJ of district heat production in the boiler
is calculated as 4.28 g CO2-eq, whilst the net GWP is
�102 g CO2-eq. The reduction in the GWP is primarily due to
avoidance of CO2 release that would have been possible due to
the biomass decay process if alternately straw is incorporated
into the soil, as discussed in Section 3.1. The reduction in the
calculated gross GWP due to stated (i) consequences of the
straw removal process, accounting both avoidance of soil C
sequestration and avoidance of negative CO2 emission to the
atmosphere is calculated to be �106 g CO2-eq/MJ heat, and (ii)
due to the nutrients available in the slag is calculated as
�0.03 g CO2-eq/MJ heat (Fig. 4a). 56% of the gross impact is
related to the GHG emissions related to the activities involved
in the upstream processes (baling and handling, chopping,
and transportation). It is calculated that 40% of the gross
impact is related to the transportation process, followed by
the combined processes: baling and handling (15%), and the
rest related to the chopping of residues. The downstream side,
in particular electricity input for the initial combustion is
calculated to cover 29% (i.e. 1.23 g CO2-eq/MJ heat) of the gross
GWP. It should be noted that we have assumed that the input
electricity is based on the marginal electricity mix of
Denmark, as stated in Table 2. In the case of the district
heating boiler, nutrient available in the collectable slag is
found insignificantly reducing the GHGs with respect to the
gross value. The detail breakdown of the calculated GWP at
the different stages of energy conversion processes are shown
in Fig. 4a and environmental hotspots are presented in Fig. 5b.
‘Environmental hotspots’ are defined as the most susceptible
stage of the energy conversion processes leading to increase
the respective environmental loadings.
In the samemanner, the net GWP related to the straw fired
CHP plant is calculated as �160 g CO2-eq, whilst the gross
value is 4.31 g CO2-eq per 1 MJ of heat production. Of this gross
GWP, 79% is contributed by upstream process and rest by the
downstream process (see Figs. 4a and 5a). The upstream side
relates to the activities involved at the collection and pre-
processing stages. The GWP related to the transportation of
the biomass is calculated as 2.45 g CO2-eq/MJ heat, which is
57% of the gross GWP of the entire energy conversion process.
Electricity as a co-product is found displacing �13.4 g CO2-eq/
MJ heat, which is as a result of substituting the equivalent
amount of the marginal electricity mix. Likewise, the reduc-
tion in the GWP due to nutrient content in the slag is calcu-
lated taking place at the rate of �0.04 g CO2-eq/MJ heat.
From the comparison of calculated GWP related to the
district heating boiler and the CHP plant, it is found that in the
former case the calculated GWP is higher by 1.6-fold than the
latter. Potential reduction of GWP in the case of the CHP plant
is primarily due to displacement of environmental impacts
related to the marginal electricity mix, which is displaced by
co-produced electricity. Furthermore, these characteristics
may signify the importance of understanding the substitution
effects in a LCA process, particularly when alternatives are
available in the market and have some displacement effects.
3.2.2. Acidification PotentialThe net AP per 1 MJ of heat production in the district heating
boiler is calculated as 0.008 m2 UES, and in the CHP plant it is
0.01 m2 UES. It is found that the AP is mostly related to the
combustion process covering about 94% of the gross impact,
calculated in the similar range for the both CHP plant and
boiler (Fig. 5a and b). In the case of CHP plant, co-produced
electricity would displace the impact at �0.0004 m2 UES/MJ
heat (Fig. 4b).
3.2.3. Aquatic and terrestrial Eutrophication PotentialThe net EP (aquatic) per 1 MJ of heat production in the boiler is
calculated as 0.10 g NO3-eq, where the gross impact is
0.104 g NO3-eq, making no such differences. The gross impact
is basically higher in the upstream activities of the energy
conversion processes, covering 89% of it. The straw removal
process is the primary cause of the EP (aquatic) compared to
other processes. It is calculated that the straw removal pro-
cess would lead to cover 88% of the gross impact (i.e.
0.092 g NO3-eq/MJ heat) (Fig. 5b). This impact is primarily
related to emission related to the compensating fertilizers
(both production and application). Nutrient values in the
bottom ash have insignificant effect to reduce the impact,
which is calculated at �0.004 g NO3-eq/MJ heat (Fig. 4c).
Similarly, in the case of the CHP plant, the calculated net
aquatic EP is 0.14 g NO3-eq/MJ heat, which is higher by 1.4-fold
compared to the boiler. The EP (aquatic) is related to the
quantity of the residue removed and its consequences, which
is relatively higher in CHP plant than in boiler (Table 2), since
the amount of biomass required in the former case is higher
than in the latter because of the lower conversion efficiency to
heat. Moreover, the co-produced electricity in the case of the
CHP plant would make the conversion system more efficient
and system expansion of the co-produced products is
accounted in the LCIA. Nevertheless, in the case of lowering
the EP (aquatic) only the nutrient values in the slag is effective.
In the current study, collectively both co-products are found
able to marginally displace the impact, which is at the rate of
�0.009 g NO3-eq/MJ heat (Fig. 4c). This also reveals that the
b i om a s s a n d b i o e n e r g y 6 8 ( 2 0 1 4 ) 1 1 5e1 3 4126
impact is more related to the N-fertilizer related emissions
compared to the biomass conversion processes.
The net terrestrial EP in the case of the boiler is found to be
0.0066 m2 UES/MJ heat (Fig. 4d). Terrestrial EP is primarily
related to the downstream process, contributing 80% of the
gross impact (0.007m2 UES/MJ heat). Combustion process, as a
part of the downstream processes increases the impact by
0.0052 m2 UES/MJ heat. In the case of CHP plant, the net
terrestrial EP is calculated as 0.008 m2 UES/MJ heat, where co-
products marginally displaces the impact by �0.001 m2 UES/
MJ heat from the gross value (Fig. 4d). 20% of the gross
terrestrial EP is due to upstream process, where the straw
removal process has the highest contribution, covering 13% of
the gross impact. Likewise, the downstream process is found
covering the rest of the impact, where combustion alone
covers 78% of the gross impact (Fig. 5a).
3.2.4. Non-Renewable Energy useThe gross NRE use calculated in the case of straw fired boiler is
0.084 MJ-primary/MJ heat (Fig. 4e). The upstream processes
are calculated to be covering 74% of the gross impact and the
rest by the downstream processes. Collection and pre-
processing of the biomass alone is found to be covering 46%
of the gross NRE use, followed by 28% by the straw removal
process (mainly related to the manufacturing process of
compensating fertilizers), and 23% of the NRE use is related to
the impact of electricity input to the combustion process.
Among the processes involved in the collection and pre-
processing of the biomass, transportation of the biomass
from farm gate to the power plant is calculated at 35% of the
gross impact; baling 10% and rest of the impact is related to
chopping of straw. The nutrient value of the slag has insig-
nificant displacement of the NRE use and is calculated as
0.0004 MJ-primary/MJ heat.
In the case of the CHP plant, the gross and the net NRE use
is calculated as 0.092 MJ-primary/MJ heat and �0.14 MJ-pri-
mary/MJ heat respectively (Fig. 4e). In contrast to the boiler, in
the CHP scenario, 36% of the gross NRE use is due to straw
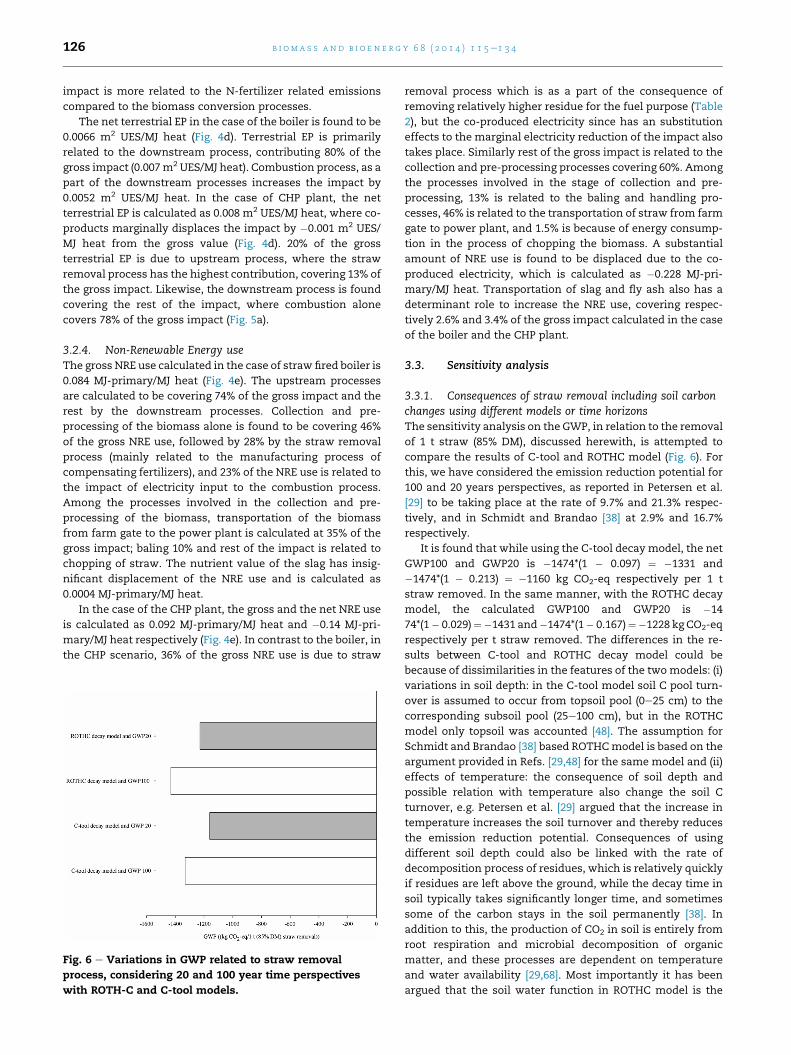
Fig. 6 e Variations in GWP related to straw removal
process, considering 20 and 100 year time perspectives
with ROTH-C and C-tool models.
removal process which is as a part of the consequence of
removing relatively higher residue for the fuel purpose (Table
2), but the co-produced electricity since has an substitution
effects to the marginal electricity reduction of the impact also
takes place. Similarly rest of the gross impact is related to the
collection and pre-processing processes covering 60%. Among
the processes involved in the stage of collection and pre-
processing, 13% is related to the baling and handling pro-
cesses, 46% is related to the transportation of straw from farm
gate to power plant, and 1.5% is because of energy consump-
tion in the process of chopping the biomass. A substantial
amount of NRE use is found to be displaced due to the co-
produced electricity, which is calculated as �0.228 MJ-pri-
mary/MJ heat. Transportation of slag and fly ash also has a
determinant role to increase the NRE use, covering respec-
tively 2.6% and 3.4% of the gross impact calculated in the case
of the boiler and the CHP plant.
3.3. Sensitivity analysis
3.3.1. Consequences of straw removal including soil carbonchanges using different models or time horizonsThe sensitivity analysis on the GWP, in relation to the removal
of 1 t straw (85% DM), discussed herewith, is attempted to
compare the results of C-tool and ROTHC model (Fig. 6). For
this, we have considered the emission reduction potential for
100 and 20 years perspectives, as reported in Petersen et al.
[29] to be taking place at the rate of 9.7% and 21.3% respec-
tively, and in Schmidt and Brandao [38] at 2.9% and 16.7%
respectively.
It is found that while using the C-tool decay model, the net
GWP100 and GWP20 is �1474*(1 � 0.097) ¼ �1331 and
�1474*(1 � 0.213) ¼ �1160 kg CO2-eq respectively per 1 t
straw removed. In the same manner, with the ROTHC decay
model, the calculated GWP100 and GWP20 is �14
74*(1� 0.029)¼�1431 and�1474*(1� 0.167)¼�1228 kg CO2-eq
respectively per t straw removed. The differences in the re-
sults between C-tool and ROTHC decay model could be
because of dissimilarities in the features of the twomodels: (i)
variations in soil depth: in the C-tool model soil C pool turn-
over is assumed to occur from topsoil pool (0e25 cm) to the
corresponding subsoil pool (25e100 cm), but in the ROTHC
model only topsoil was accounted [48]. The assumption for
Schmidt and Brandao [38] based ROTHCmodel is based on the
argument provided in Refs. [29,48] for the same model and (ii)
effects of temperature: the consequence of soil depth and
possible relation with temperature also change the soil C
turnover, e.g. Petersen et al. [29] argued that the increase in
temperature increases the soil turnover and thereby reduces
the emission reduction potential. Consequences of using
different soil depth could also be linked with the rate of
decomposition process of residues, which is relatively quickly
if residues are left above the ground, while the decay time in
soil typically takes significantly longer time, and sometimes
some of the carbon stays in the soil permanently [38]. In
addition to this, the production of CO2 in soil is entirely from
root respiration and microbial decomposition of organic
matter, and these processes are dependent on temperature
and water availability [29,68]. Most importantly it has been
argued that the soil water function in ROTHC model is the
b i om a s s a n d b i o e n e r g y 6 8 ( 2 0 1 4 ) 1 1 5e1 3 4 127
cause of the large build-up of C [48]. Similarly, the ROTHC
model discussed in Schmidt and Brandao [38] also ignored the
changes in the soil C turnover that would be possible due to
changes in the land management (e.g. crop rotation), whilst it
has been considered in C-tool model.
3.3.2. Environmental performances under differentsubstitutable marginal electricity scenariosIn Section 3.2, we discussed about the potential benefits of
straw fired in the CHP plant in comparison to the boiler. We
made an assumption that the co-produced electricity dis-
places the environmental impacts of marginal Danish elec-
tricity mix. Realizing about the debates on the marginal
electricity productions [69e71], this section deals with the
assessment of environmental impacts considering different
types of possible marginal electricity production differing by
fuel types. In the debates, a long term/short term effects of
electricity substitution have been regarded as a measure for
defining the marginal electricity [70,71], whereas Ekvall and
Weidema [70] discussed from the perspectives of market
proportion and competitive alternatives available in the
market. Mathiesen et al. [69] argued on the basis of cost of
production of the alternatives and future energymanagement
perspectives. Weidema et al. [71], argued from the standpoint
of an environmental regulations, and have also highlighted
that due to lower capital cost, natural gas fired power plants
were regarded asmarginal technology in the Nordic electricity
market. The official Danish energy policies of 2003 has
stressed natural gas as the marginal production, where fuel
prices were relatively lower [69]. Likewise, coal can be con-
strained from the environmental regulations, such as carbon
quotas, but differs in individual countries [71,72]. As per the
Danish 2005 energy policy, which had CO2-quota prices
included on top of the expected three different fuel prices,
wind power was identified as the marginal technology, but in
Mathiesen et al. [69], wind power is argued to be disregarded
as the marginal technology from its responses to changes in
demand and its spatial production i.e. differing from one re-
gion to another.
Considering these uncertainties, the assessment is simu-
lated further in three different scenarios of substitutable
marginal electricity: (i) natural gas fired power plant (me1), (ii)
coal fired power plant (me2), (iii) wind power (me3). Table 3
presents the technical information about the power plants
Table 3 e Information about the marginal electricityscenarios.
Marginalelectricityscenarios
Technologyinformationand LCI data
source
Adjustment inthe datasets
me1 “Electricity, natural gas,
at power plant/DE U” [65]
Efficiency of natural
gas fired power plant
adjusted to 46% [60]
me2 “Electricity, hard coal,
at power plant/DE U” [65]
Efficiency of coal fired
power plant adjusted
to 35% [60]
me3 “Electricity, at wind power
plant/RER U’’ [65]
e
and adjustments made in the LCI provided in Ecoinvent
Centre [65].
Table 4 depicts that the environmental performances of
district heat production in the CHP plant favors positively, if
the co-produced electricity is assumed to displace coal as
the substitutable marginal electricity production, compared
to natural gas and wind power. For instance, while dis-
placing coal as the marginal electricity, combustion with
natural gas (CoNG) and combustion with wheat straw
(CoWS) (see Table 3) leads to a GWP at �13 g CO2-eq/MJ heat
and �262 g CO2-eq/MJ heat respectively. In the same
manner, if coal is the substitutable marginal electricity then
NRE use in the case of natural gas and the straw fired dis-
trict heat production are 1.96 MJ-primary/MJ heat and
�1.26 MJ-primary/MJ heat respectively. Other impact cate-
gories are lower in CoNG compared to CoWS with coal as the
displaceable marginal electricity production. Environmental
impacts of both CoWS and CoNG when considering natural
gas and wind power as the substitutable marginal electricity
production are shown in Table 4, where from the standpoint
of GWP and NRE use the former is favorable option
compared to the latter, whilst for other impact categories
CoNG is favorable than the CoWS.
4. Discussions
4.1. Integrating effects of the identified environmentalhotspots in the biomass conversion
In the earlier sections, it is discussed that straw as a fuel input
for district heat production is attractive than natural gas,
primarily from the standpoint of lowering the GWP and NRE
use. Despite this, it is also argued that utilization of this pru-
dent source of renewable energy has higher EP and AP. For
instance, aquatic EP is primarily associated with the conse-
quences of the straw removal process (Fig. 5), in particular due
nitrate leaching and emissions from the manufacturing pro-
cess of the compensating N fertilizers. Some studies
including, McLenaghen et al. [73] and Kirchmann et al. [74]
reported significant potentials for improvement of agricul-
tural management practices thus controlling the nitrate
leaching and reducing aquatic EP. Martinez and Guiraud [75]
have highlighted that an integration of winter “catch crops”
in the agricultural system, following the harvest of the wheat
crop (for instance) and the straw removal prevents fields for
not remained bare and control nitrate leaching. A bare land
without vegetation leads to more leaching compared to fields
with catch crops [76]. The advantage of catch crops, e.g. rye
grass (Lolium perenne) normally decrease leaching loss by
absorbing much of the mineralized N back into the organic
pool [77]. These potential solutions to lower the leaching los-
ses not only help to reduce the environmental impact, but also
ensure the production of additional biomass either for energy
purposes or as animal feed etc. The latter opportunity could
mitigate another crucial consequence of residue removal for
other purposes rather than using as animal feed. Neverthe-
less, LCIA of such additional integration in the agricultural
management practices can be carried out to assess: to what
level aquatic EP may be controlled.
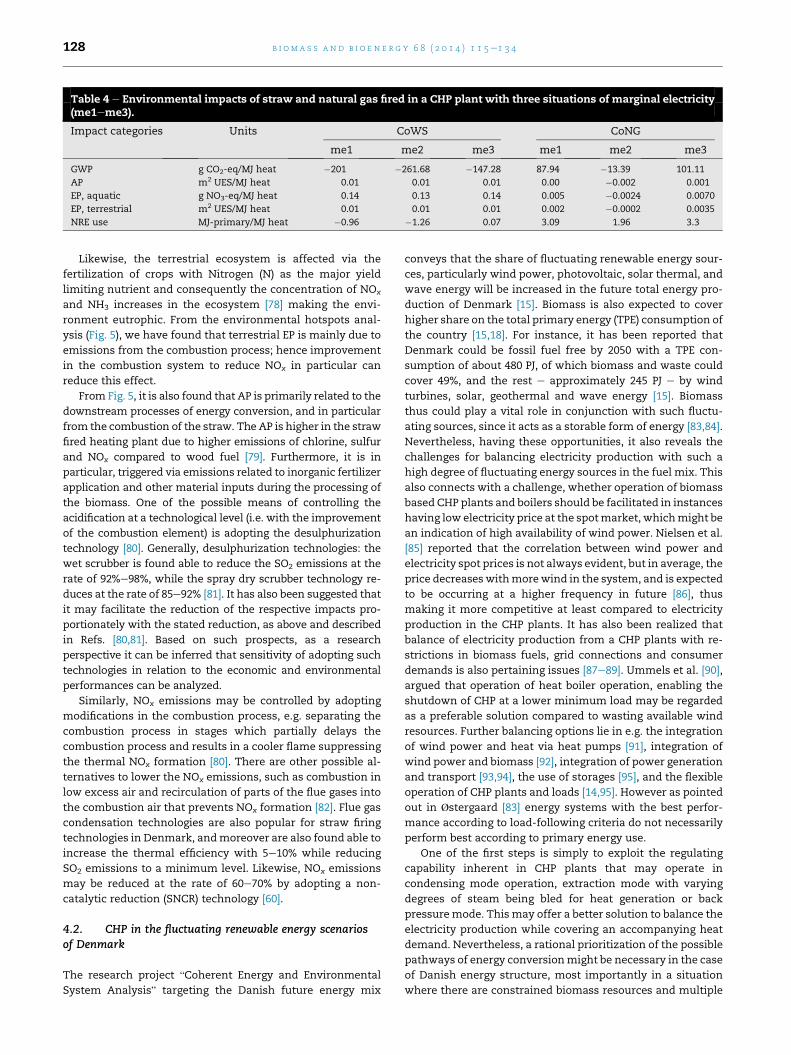
Table 4 e Environmental impacts of straw and natural gas fired in a CHP plant with three situations of marginal electricity(me1eme3).
Impact categories Units CoWS CoNG
me1 me2 me3 me1 me2 me3
GWP g CO2-eq/MJ heat �201 �261.68 �147.28 87.94 �13.39 101.11
AP m2 UES/MJ heat 0.01 0.01 0.01 0.00 �0.002 0.001
EP, aquatic g NO3-eq/MJ heat 0.14 0.13 0.14 0.005 �0.0024 0.0070
EP, terrestrial m2 UES/MJ heat 0.01 0.01 0.01 0.002 �0.0002 0.0035
NRE use MJ-primary/MJ heat �0.96 �1.26 0.07 3.09 1.96 3.3
b i om a s s a n d b i o e n e r g y 6 8 ( 2 0 1 4 ) 1 1 5e1 3 4128
Likewise, the terrestrial ecosystem is affected via the
fertilization of crops with Nitrogen (N) as the major yield
limiting nutrient and consequently the concentration of NOx
and NH3 increases in the ecosystem [78] making the envi-
ronment eutrophic. From the environmental hotspots anal-
ysis (Fig. 5), we have found that terrestrial EP is mainly due to
emissions from the combustion process; hence improvement
in the combustion system to reduce NOx in particular can
reduce this effect.
From Fig. 5, it is also found that AP is primarily related to the
downstream processes of energy conversion, and in particular
from the combustion of the straw. The AP is higher in the straw
fired heating plant due to higher emissions of chlorine, sulfur
and NOx compared to wood fuel [79]. Furthermore, it is in
particular, triggered via emissions related to inorganic fertilizer
application and other material inputs during the processing of
the biomass. One of the possible means of controlling the
acidification at a technological level (i.e. with the improvement
of the combustion element) is adopting the desulphurization
technology [80]. Generally, desulphurization technologies: the
wet scrubber is found able to reduce the SO2 emissions at the
rate of 92%e98%, while the spray dry scrubber technology re-
duces at the rate of 85e92% [81]. It has also been suggested that
it may facilitate the reduction of the respective impacts pro-
portionately with the stated reduction, as above and described
in Refs. [80,81]. Based on such prospects, as a research
perspective it can be inferred that sensitivity of adopting such
technologies in relation to the economic and environmental
performances can be analyzed.
Similarly, NOx emissions may be controlled by adopting
modifications in the combustion process, e.g. separating the
combustion process in stages which partially delays the
combustion process and results in a cooler flame suppressing
the thermal NOx formation [80]. There are other possible al-
ternatives to lower the NOx emissions, such as combustion in
low excess air and recirculation of parts of the flue gases into
the combustion air that prevents NOx formation [82]. Flue gas
condensation technologies are also popular for straw firing
technologies in Denmark, andmoreover are also found able to
increase the thermal efficiency with 5e10% while reducing
SO2 emissions to a minimum level. Likewise, NOx emissions
may be reduced at the rate of 60e70% by adopting a non-
catalytic reduction (SNCR) technology [60].
4.2. CHP in the fluctuating renewable energy scenariosof Denmark
The research project “Coherent Energy and Environmental
System Analysis” targeting the Danish future energy mix
conveys that the share of fluctuating renewable energy sour-
ces, particularly wind power, photovoltaic, solar thermal, and
wave energy will be increased in the future total energy pro-
duction of Denmark [15]. Biomass is also expected to cover
higher share on the total primary energy (TPE) consumption of
the country [15,18]. For instance, it has been reported that
Denmark could be fossil fuel free by 2050 with a TPE con-
sumption of about 480 PJ, of which biomass and waste could
cover 49%, and the rest e approximately 245 PJ e by wind
turbines, solar, geothermal and wave energy [15]. Biomass
thus could play a vital role in conjunction with such fluctu-
ating sources, since it acts as a storable form of energy [83,84].
Nevertheless, having these opportunities, it also reveals the
challenges for balancing electricity production with such a
high degree of fluctuating energy sources in the fuel mix. This
also connects with a challenge, whether operation of biomass
based CHP plants and boilers should be facilitated in instances
having low electricity price at the spotmarket, whichmight be
an indication of high availability of wind power. Nielsen et al.
[85] reported that the correlation between wind power and
electricity spot prices is not always evident, but in average, the
price decreaseswithmorewind in the system, and is expected
to be occurring at a higher frequency in future [86], thus
making it more competitive at least compared to electricity
production in the CHP plants. It has also been realized that
balance of electricity production from a CHP plants with re-
strictions in biomass fuels, grid connections and consumer
demands is also pertaining issues [87e89]. Ummels et al. [90],
argued that operation of heat boiler operation, enabling the
shutdown of CHP at a lower minimum load may be regarded
as a preferable solution compared to wasting available wind
resources. Further balancing options lie in e.g. the integration
of wind power and heat via heat pumps [91], integration of
wind power and biomass [92], integration of power generation
and transport [93,94], the use of storages [95], and the flexible
operation of CHP plants and loads [14,95]. However as pointed
out in Østergaard [83] energy systems with the best perfor-
mance according to load-following criteria do not necessarily
perform best according to primary energy use.
One of the first steps is simply to exploit the regulating
capability inherent in CHP plants that may operate in
condensing mode operation, extraction mode with varying
degrees of steam being bled for heat generation or back
pressuremode. This may offer a better solution to balance the
electricity production while covering an accompanying heat
demand. Nevertheless, a rational prioritization of the possible
pathways of energy conversionmight be necessary in the case
of Danish energy structure, most importantly in a situation
where there are constrained biomass resources and multiple

b i om a s s a n d b i o e n e r g y 6 8 ( 2 0 1 4 ) 1 1 5e1 3 4 129
sustainable outlets of their utilization. The different pathways
of biomass energy conversion chain includes, direct com-
bustion (e.g. combustion in a CHP plant), thermo-chemical
process (e.g. gasification, carbonization), and bio-chemical
processes (e.g. biogas, methane, biofuels), but sustainability
assessment of these energy conversion pathways is necessary
before coming to any conclusion. In Section 4.3, we will
elaborate on relevant environmental impacts related to the
biomass end-uses.
4.3. Resource constraints and perspectives
Parajuli [96] calculated that the levelised cost of district heat
production in the straw fired CHP plant (with coal as substi-
tutable marginal electricity) is about 0.008 V/MJ, which is 69%
and 41% lower compared to production based on natural gas
and imported Wood pellets. Despite biomass, in particular
straw is one of the important sources of renewable energy and
economically attractive, expansions of such power plants are
not gaining proper momentum. For instance, in the Danish
gross district heat production sector, straw fired power plants
have merely increased from 5% to 7%, whereas the wood has
increased from 4% to 19% between 2000 and 2011 [16]. Ea En-
ergy Analyses [97] reported that the barrier is primarily related
with the economic perspectives (e.g. particularly with respect
to biogas), as well as availability of alternative technologies/
fuels in the energy market, such as biogas and other energy
crops. Regardless of the price of straw is lower compared to
other available biomass, the handling and transporting pro-
cess makes straw less favorable compared to wood chips and
pellets [97], particularly due to density of the biomass. The
density of the biomass is important parameter as it influences
the conveniences of collecting, transporting, storing and for
feeding into the combustion chamber. This in turn will influ-
ence the overall efficiency of the biomass conversion [98].
Based on these arguments, production of straw pellets could
support to mitigate the issues associated with the density,
however LCIA of such conversions is yet to present.
Irrespective of these issues, biomass fired in a CHP plant
can be important not only from the perspective of balancing
the electricity, but also ensuring better environmental per-
formance compared to other non-renewable based heat and
power production. As discussed in Section 4.2, it is also
equally relevant to identify the sustainable pathways of
biomass to energy conversions and also about integrating
potential perennial energy crops and grasses if can be utilized
as a feedstock in such pathways.
In Nguyen et al. [99] environmental performance of straw
to produce electricity in a gasification and CHP technology are
discussed, where it is found that the former technology while
producing 1 kWh of electricity leads to a GWP of 80 g CO2-eq,
total EP �1.9 g NO3-eq, and NRE Use 0.2 MJ-primary. For the
equivalent output, straw fired in a CHP plant with heat as a co-
product is reported accompanying a higher environmental
impact than the gasification technology, e.g. 20% higher GWP
in the latter than the former case [99].
Similarly, Parajuli et al. [100] argued that if autumn harvest
Miscanthus is used as a feedstock in a CHP plant, the calcu-
lated GWP is�71 g CO2-eq/MJ heat, and aNRE use is�0.767MJ-
primary/MJ heat, and in the case natural gas was assumed as
the substitutable marginal electricity supply. This indicates
that when larger heat/power demand has to be satisfied with
Miscanthus, as a potential biomass source, it could exacerbate
the land use competition among the energy crops and also
among the cereals. This also shows the importance of crop
residues in the sustainable energy and agriculture manage-
ment. When conversion of straw and Miscanthus to district
heat are compared, the former case leads tomore reduction in
the GWP than the latter. However, it should be noted that in
the case of straw removal both avoided soil C sequestration
loss and avoided CO2 emissions are accounted for, whilst in
the case of Miscanthus only the soil C sequestration gain was
accounted for. Regarding the savings in the NRE use, Mis-
canthus is reported additionally saving it by 0.53 MJ-primary
compared to the straw, since the net heat output and elec-
tricity from the conversion of Miscanthus was higher by 50 MJ
and 25 kWh respectively. The displacement effect of produc-
ing additional 25 kWh of electricity compared to straw thus
makes higher reduction in the NRE use, e.g.�0.76 MJ-primary/
MJ heat (in the case of Miscanthus) and �0.23 MJ-primary/MJ
heat (in the case of straw). At the same time, land occupation
with the cultivation of Miscanthus as alternative fuel was
identified as a disadvantageous element, which accounts at
the rate of 0.09 m2-a/MJ heat (m2-a represents occupancy of
land, as square meter in a year), whereas straw is regarded as
a residual product of cereal crops.
Likewise, Blengini et al. [101] argued with a range of NRE
use while producing 1 MJ of electricity/heat using promising
energy crops such as Maize, Sorghum, Triticale and Mis-
canthus mixed with cow manure in a biogas plant, and is re-
ported to be between 0.2 and 0.3 MJ-primary. The ranges are
due to the consideration of different co-products in the sys-
tem [101]. Similarly, Concawe et al. [102] reported that
biomass use for electricity production enhances larger GHG
savings, especially when compared to first generation bio-
fuels. Searcy and Flynn [103] showed that while producing
electricity from unit input of biomass such as agricultural
residues through the processes such as direct firing or gasifi-
cation can save about three times the amount of GHG emis-
sions compared to the amount saved by bioethanol and
FischereTropsch diesel (i.e. production from switch grass via
gasification of biomass). In this comparison, marginal substi-
tution of electricity was based on coal. Furthermore, Cher-
ubini et al. [104] and Kaltschmitt et al. [105] argued for a
greater GHG savings per hectare of land in the pathway of
utilizing biomass for heat production compared to the con-
ventional biofuels and bioelectricity production systems. In
the conversion of bagasse to either electricity or bioethanol,
electricity was found favorable when indicators as such en-
ergy consumption, GHG, eutrophication and acidification
were considered. Furthermore, bioethanol production was
preferable if indicators such as resource depletion and toxicity
concerns were considered for the evaluation [106]. In the
process of generating electricity willow and hybrid poplar
have been regarded more favorable if their high yield is
compared to food crops like corn and soybean, and also if their
residues are not harvested. Moreover, electricity generation
from the former is less efficient than converting the latter to
ethanol through ‘‘biorefinery’’ process. Biomass power plants
convert only 23e37% of biomass energy content into

b i om a s s a n d b i o e n e r g y 6 8 ( 2 0 1 4 ) 1 1 5e1 3 4130
electricity [107,108], while ethanol contains 53e56% of
biomass energy content [93,109,110]. In addition to the crop
land, a biomass power plant requires 7e11m2/TJ of direct land
area assuming a lifetime of 30 years [108,110].
Despite having potential benefits of different biomass
feedstock in heat and power production, it is essential tomake
an appropriate selection for their best utilization
[103,104,106,111]. The selection should ensure whether
biomass would be used for direct combustion, such as in CHP
plant, or have to be regarded as principal feedstock for
transport fuels production. An indication towards a situation
leading to insignificantly limited availability of biomass is
highlighted in Ref. [20] based on the existing land use pattern
of Denmark and other potential processing of biomass for
alternative transport fuels. It is argued that an increased de-
mand of biomass for more ‘valuable’ transport fuels is ex-
pected in the Danish future energy mix [15,21]. In contrast the
recent ‘ten-million ton plan’ of Denmark claims to addition-
ally produce biomass at 10 Mt per annum without substan-
tially affecting the existing food and feed productions and also
supporting in the reduction of environmental impact
compared to the current level [112]. Moreover for the sus-
tainability of biomass feedstock supply it is important to
judiciously utilize them in days ahead. Most importantly, in
today's world, it is also very relevant to consider the complex
science and market of material demand (chemicals, fuels,
proteins and nutrients to maintain soil health) for the sus-
tainability of agro-ecosystem [3,4,113]. It means that if any
biomass has to be taken into account as a fuel source, it is also
necessary to assess if alternatively they can be processed to
deliver a spectrum of bio-based products including fuel/en-
ergy. This further draws attention towards the biorefinery
technology, which has been regarded as one of the innovative
means of biomass conversions and is taking ground in many
developed economies [114,115]. Furthermore, one may argue
that the demand of biomass (e.g. straw) would bemuch higher
in the biorefinery value chains (e.g. to deliver 2nd generation
bioethanol) if a larger demand of biofuel has to be maintained
leading to a competition among the existing application of
straw e.g. as nutrient supply to soil, fuel for heat and power
production, feed for ruminants and bedding materials for
livestocks. This might also lead to create less attention to-
wards its use in heat and power sector, or may have compe-
tition on the available biomass, between the cases of directly
converting biomass to heat/power and in biorefinery. None-
theless, another corner of argument is that to some extent this
potential competition could be mitigated through the inte-
gration of a biorefinery value chains in the energy system. For
instance, Cherubini and Ulgiati [115] argued that the use of
crop residues in a biorefinery could save GHG emissions by
50% and more than 80% of non-renewable energy could be
saved in comparison to the conventional fossil basedmaterial
processing. Likewise, switch grass use in a biorefinery process
is reported to reduce GHG emissions by 79% and saves NRE use
by 80% with respect to the alternative fossil fuel [116].
It is thus relevant to choose the most appropriate sus-
tainable feedstock supply in the biorefinery value chains,
demanding a comparative assessment of different types of
lignocellulosic feedstocks, and also assess opportunities to
promote both green (grasses) and yellow biomass (straw) [117]
as biorefinery feedstocks. Such assessment will be important
to ensure the sustainable year round supply of biomass [100].
Hence, as a future perspective, assessment of economic and
environmental efficiency of the production of biobased prod-
ucts via biorefineries can be carried out considering the po-
tential feedstocks supply scenarios and be compared with the
case of conversion to heat and power as discussed in the
current study.
5. Summary and conclusions
The assessment of environmental impacts in relation to 1 MJ
of district heat production discussed in this study can be
summarized in following points:
� For 1 MJ of district heat production in the straw fired CHP
plant and assuming the co-produced electricity substitutes
the marginal Danish electricity mix, the net GWP is
calculated as �160 g CO2-eq, AP is at 0.01 m2 UES, EP
(aquatic) 0.14 g NO3-eq, EP (terrestrial) 0.008 m2 UES, and
NRE Use at �0.14 MJ-primary. For the same amount of heat
output, straw fired in the district heating boiler leads to a
GWP of �101 g CO2-eq, AP 0.008 m2 UES, aquatic and
terrestrial EP 0.1 g NO3-eq and 0.0065 m2 UES respectively
and NRE use as 0.084 MJ-primary.
� For 1 MJ of district heat production in the straw fired CHP
plant and assuming coal as the displaceable marginal
electricity, the calculated net GWP is �261 g CO2-eq, AP
0.007 m2 UES, aquatic and terrestrial EP at 0.13 g NO3-eq
and 0.005 m2 UES respectively, and NRE use �1.26 MJ-
primary.
� Straw fired district heat production in the CHP plant is
better than fired with natural gas, e.g. the former leads to a
lower GWP and NRE use. In the latter case, the GWP and
NRE use are�13.4 g CO2-eq/MJ heat and 1.96 MJ primary/MJ
heat respectively assuming coal as the substitutable mar-
ginal electricity production. But for other impact cate-
gories, natural gas fired district heat production shows
better environmental performances. For e.g. compared to
straw it leads to AP of �0.002 m2 UES/MJ heat, and the
aquatic and terrestrial EP of �0.002 g NO3-eq/MJ heat and
0.0002 m2 UES/MJ heat respectively.
Conversion of straw to district heat production in the CHP
plant is better than in district heating boiler for all impact
categories. Furthermore, based on the current study it is also
concluded that sustainability of straw conversion to a com-
bined production of heat and power might be determined by
the potential substitution of marginal electricity by the co-
produced electricity assumed to be taking place somewhere
else. Straw is found attractive as a fuel input to CHP plant
compared to natural gas from the standpoint of lowering GWP
and NRE-use, but also leads to higher AP, EPs compared to the
former case. It is thus necessary to integrate additional system
that would help to mitigate the exhaust emissions of major
pollutants leading to increase AP and EP in the case of straw
conversion to heat and power. One of the prospects to lower
such impacts could be expanding the system boundary of the
assessment, primarily integrating the catch crop at the farm
b i om a s s a n d b i o e n e r g y 6 8 ( 2 0 1 4 ) 1 1 5e1 3 4 131
gate level (beyond straw removal process in the upstream
side) to lower the nitrogen related emissions and the adoption
of desulphurization and flue gas condensation technologies
(in the downstream side) to reduce the AP. This opens area for
the further studies in the related sector.
Nevertheless, straw fired in the CHP plant could play an
important role in conjunction with other fluctuating renew-
able energy technologies, such as wind power, in light of
maximizing the share of renewable energy, e.g. in the Danish
future energy goals. This finite source of biomass is not only
important to maintain the short term energy demand but also
to serve as a storable form of energy carriers. This also means
the good performance of the system depends on the precon-
dition that the future energy system needs the heat input.
Apart from the abovementioned advantages of straw as a fuel
input, there are other potential applications of straw such as
animal feed and feedstock to future biorefineries, but in the
current study we have not compared the environmental per-
formances of such applications. This opens avenues for a
wider sustainability assessment of straw also in the sectors
other than heat/power production.
Acknowledgments
This article is based on the M.Sc. thesis entitled “Life Cycle
Assessment of wheat straw as a fuel input for district heat
production” [96], carried out by the first author at the Depart-
ment of Development and Planning, Aalborg University,
Denmark during the period of FebruaryeJune 2013. The article
is further re-developed as part of the PhD study at the Depart-
ment of Agroecology, Aarhus University (AU), Denmark, which
is co-funded by the Bio-Value Platform (http://biovalue.dk/),
funded under the SPIR initiative by The Danish Council for
Strategic Research and TheDanish Council for Technology and
Innovation, case no: 0603-00522B. The first authorwould like to
thank theGraduate School of Science andTechnology (GSST) of
AU for the PhD scholarship. This article is prepared as a case of
baseline scenario of straw conversion and is aimed to compare
with the cases of conversions in biorefinery product scenarios.
Feedbacks received from the editor and three anonymous
reviewers are highly acknowledged.
r e f e r e n c e s
[1] Volk TA, Verwijst T, Tharakan PJ, Abrahamson LP,White EH. Growing fuel: a sustainability assessment ofwillow biomass crops. Front Ecol Environ 2004;2(8):411e8.
[2] Petersen J-E. Energy production with agricultural biomass:environmental implications and analytical challenges. EurRev Agric Econ 2008;35(3):385e408.
[3] Lin Y, Rujiang G, Chong S. Food and energy of the collisionalarm. Outlook Wkly 2006;50:44e5.
[4] Watson HK. Potential to expand sustainable bioenergy fromsugarcane in southern Africa. Energy Policy2011;39(10):5746e50.
[5] Dale BE. Lignocellulose conversion and the future offermentation biotechnology. Trends Biotechnol1987;5(10):287e91.
[6] Uihlein A, Schebek L. Environmental impacts of alignocellulose feedstock biorefinery system: an assessment.Biomass Bioenergy 2009;33(5):793e802.
[7] Tonini D, Astrup T. LCA of biomass-based energy systems: acase study for Denmark. Appl Energy 2012;99(0):234e46.
[8] Lund H, Mathiesen BV. Energy system analysis of 100%renewable energy systemsdthe case of Denmark in years2030 and 2050. Energy 2009;34(5):524e31.
[9] Skøtt T, BioPress. Straw to energydstatus, technologies andinnovation in Denmark 2011. Niels Pedersens All�e 2, 8830,Tjele: Agro Business Park A/S; 2011. pp. 1e40.
[10] Parajuli R. Looking into the Danish energy system: lesson tobe learned by other communities. Renew Sustain EnergyRev 2012;16(4):2191e9.
[11] Giuntoli J, Boulamanti AK, Corrado S, Motegh M, Agostini A,Baxter D. Environmental impacts of future bioenergypathways: the case of electricity from wheat straw balesand pellets. Glob Chang Biol Bioenergy 2012:497e512.
[12] Statistics Denmark. Statistical year book 2012. Copenhagen:Statitistics Denmark; 2012. pp. 1e542.
[13] Lund H. Large-scale integration of wind power into differentenergy systems. Energy 2005;30(13):2402e12.
[14] Lund H, Munster E. Management of surplus electricity-production from a fluctuating renewable-energy source.Appl Energy 2003;76(1e3):65e74.
[15] Hvelplund F, Lund H, Schaltz E, Pillay JR, Nielsen MP,Felby C, et al. Coherent energy and environmental systemanalysis. Aalborg University; 2011. pp. 1e93.
[16] Danish Energy Agency. Annual energy statistics.Copenhagen: Danish Energy Agency; 2012.
[17] Danish Energy Agency. Energy strategy 2050 e from coal, oiland gas to green energy. 1470 Copenhagen K, Denmark: TheDanish Ministry of Climate and Energy; 2011. pp. 1e66.
[18] IDA. The IDA climate plan. Copenhagen, Denmark: TheDanish Society of Engineers (IDA); 2009. pp. 1e253.
[19] Østergaard PA, Lund H. A renewable energy system inFrederikshavn using low-temperature geothermal energyfor district heating. Appl Energy 2011;88(2):479e87.
[20] Østergaard PA, Mathiesen BV, M€oller B, Lund H. Arenewable energy scenario for Aalborg Municipality basedon low-temperature geothermal heat, wind power andbiomass. Energy 2010;35(12):4892e901.
[21] Kwon PS, Østergaard PA. Comparison of future energyscenarios for Denmark: IDA 2050, CEESA (Coherent Energyand Environmental System Analysis), and ClimateCommission 2050. Energy 2012;46(1):275e82.
[22] Fan Y-T, Zhang Y-H, Zhang S-F, Hou H-W, Ren B-Z. Efficientconversion of wheat straw wastes into biohydrogen gas bycow dung compost. Bioresour Technol 2006;97(3):500e5.
[23] Lal R. Crop residues as soil amendments and feedstock forbioethanol production. Waste Manag 2008;28(4):747e58.
[24] Clapp CE, Allmaras RR, Layese MF, Linden DR, Dowdy RH.Soil organic carbon and 13C abundance as related to tillage,crop residue, and nitrogen fertilization under continuouscorn management in Minnesota. Soil Tillage Res2000;55(3e4):127e42.
[25] Dick WA, Blevins RL, Frye WW, Peters SE, Christenson DR,Pierce FJ, et al. Impacts of agricultural managementpractices on C sequestration in forest-derived soils of theeastern Corn Belt. Soil Tillage Res 1998;47(3e4):235e44.
[26] Christensen BT, Olesen JE. Nitrogen mineralizationpotential of organomineral size separates from soils withannual straw incorporation. Eur J Soil Sci 1998;49(1):25e36.
[27] Mogensen L, Hermansen JE, Halberg N, Dalgaard R, Vis J,Smith BG. Life cycle assessment across the food supplychain. Sustain Food Ind 2009:115e44.
[28] Statistics Denmark. Agricultural statistics. Copenhagen:Statistics Denmark; 2010. p. 182.
b i om a s s a n d b i o e n e r g y 6 8 ( 2 0 1 4 ) 1 1 5e1 3 4132
[29] Petersen BM, Knudsen MT, Hermansen JE, Halberg N. Anapproach to include soil carbon changes in life cycleassessments. J Clean Prod 2013;52(0):217e24.
[30] Connolly D, Mathiesen BV. A technical and economicanalysis of one potential pathway to a 100% renewableenergy system. Int J Sustain Energy Plann Manag2014;1:7e28.
[31] Hauschild M. Spatial differentiation in life cycle impactassessment: a decade of method development to increasethe environmental realism of LCIA. Int J Life Cycle Assess2006;11(1):11e3.
[32] Hauschild M, Potting J. Spatial differentiation in life cycleimpact assessment e the EDIP2003 methodology. DanishMinistry of Environment; 2005. pp. 9e191.
[33] Yang X-E, Wu X, Hao H-L, He Z-L. Mechanisms andassessment of water eutrophication. J Zhejiang Univ Sci B2008;9(3):197e209.
[34] Weidema BP. Using the budget constraint to monetariseimpact assessment results. Ecol Econ 2009;68(6):1591e8.
[35] Weidema BP, Wesnæs M, Hermansen J, Kristensen T,Halberg N, Eder P, et al. Environmental improvementpotentials of meat and dairy products. Sevilla: Institute forProspective Technological Studies; 2008.
[36] IPCC. IPCC fourth assessment report: climate change 2007;2007.
[37] PR�e Consultants. SimaPro 7.3.3. Amersfort, TheNetherlands: Pre Consultants; 2012.
[38] Schmidt JH, Brandao M. LCA screening of biofuels-iLUC,biomass manipulation and soil carbon. Copenhagen,Denmark; 2013. pp. 3e97.
[39] Schmidt JH, Merciai S, Thrane M, Dalgaard R. Inventory ofcountry specific electricity in LCA e consequential andattributional scenarios [Methodology report v2]. Aalborg: 2.-0 LCA Consultants; 2011.
[40] Dalgaard R, Schmidt J, Halberg N, Christensen P, Thrane M,Pengue W. LCA of soybean meal. Int J Life Cycle Assess2008;13(3):240e54.
[41] Schmidt JH. System delimitation in agriculturalconsequential LCA. Int J Life Cycle Assess 2008;13(4):350e64.
[42] L�opez S, Davies DR, Gir�aldez FJ, Dhanoa MS, Dijkstra J,France J. Assessment of nutritive value of cereal and legumestraws based on chemical composition and in vitrodigestibility. J Sci Food Agric 2005;85(9):1550e7.
[43] Jenkins BM, Baxter LL, Miles Jr TR, Miles TR. Combustionproperties of biomass. Fuel Process Technol1998;54(1e3):17e46.
[44] Rasburskis N, Gudzinskas J, Gylys J. Combined heat andpower production: socio-economic and sustainabledevelopment aspects. J Civ Eng Manag 2006;12(1):29e36.
[45] Lund H, Andersen AN. Optimal designs of small CHP plantsin a market with fluctuating electricity prices. EnergyConvers Manag 2005;46(6):893e904.
[46] Cenni R, Janisch B, Spliethoff H, Hein KRG. Legislative andenvironmental issues on the use of ash from coal andmunicipal sewage sludge co-firing as construction material.Waste Manag 2001;21(1):17e31.
[47] P€oyki€o R, R€onkk€om€aki H, Nurmesniemi H, Per€am€aki P,Popov K, V€alim€aki I, et al. Chemical and physicalproperties of cyclone fly ash from the grate-fired boilerincinerating forest residues at a small municipal districtheating plant (6 MW). J Hazard Mater2009;162(2e3):1059e64.
[48] Petersen BM, Knudsen MT. Consequences of straw removalfor soil carbon sequestration of agricultural fields, using soilcarbon in a time frame perspective. Faculty of AgriculturalSciences, Aarhus University. Aarhus, Denmark: AarhusUniversity; 2010. pp. 1e47.
[49] Coleman K, Jenkinson DS. A model for the turnover ofcarbon in soil model description and windows users guide.Harpenden Herts AL5 2JQ, United Kingdom: RothamstedResearch; 2008. pp. 1e43.
[50] Kløverpris J, Mueller S. Baseline time accounting:considering global land use dynamics when estimating theclimate impact of indirect land use change caused bybiofuels. Int J Life Cycle Assess 2013;18(2):319e30.
[51] Møller J, Thøgersen R, Kjeldsen A, Weisbjer M, Søegaard K,Hvelplund T, et al. Fodermiddltabel 2005. Sammensætningog foderværdi af fodermidler til kvæg. LandbrugetsRådgivningscenter; 2005.
[52] Petersen B, Berntsen J. The turnover of soil organic matteron different farm types. 3rd ed. DARCOFenews; 2003.
[53] Nguyen TLT, Hermansen JE, Mogensen L. Environmentalperformance of crop residues as an energy source forelectricity production: the case of wheat straw in Denmark.Appl Energy 2013;104(0):633e41.
[54] IPCC. 2006 IPCC guidelines for National Greenhouse GasInventories; 200611.1e11.24.
[55] EEA. EMEP/EEA air pollutant emission inventory guidebook2013. Copenhagen, Denmark: European EnvironmentAgency; 2013. pp. 1e43.
[56] Cherubini F, Strømman AH. Life cycle assessment ofbioenergy systems: state of the art and future challenges.Bioresour Technol 2011;102(2):437e51.
[57] Nemecek T, K€agi T. Life cycle inventories of agriculturalproduction systems. Duebendorf, Switzerland: Swiss Centrefor Life Cycle Inventories; 2007.
[58] Nguyen TLT, Hermansen JE, Mogensen L. Fossil energy andGHG saving potentials of pig farming in the EU. EnergyPolicy 2010;38(5):2561e71.
[59] Dalgaard T, Halberg N, Porter JR. A model for fossil energyuse in Danish agriculture used to compare organic andconventional farming. Agric Ecosyst Environ2001;87(1):51e65.
[60] Danish Energy Agency. Technology data for energy plants.Generation of electricity and district heating, energy storageand energy carrier generation and conversion. Copenhagen,Denmark; 2012. pp. 5e212.
[61] Centre for Biomass Technology. Straw for energyproduction. Centre for Biomass Technology; 2004. p. 34.
[62] Centre for Biomass Technology. Halmasker, kemisksammensætning; 1998.
[63] Lund H, Mathiesen B, Christensen P, Schmidt J. Energysystem analysis of marginal electricity supply inconsequential LCA. Int J Life Cycle Assess2010;15(3):260e71.
[64] Nielsen P. Heat and power production from straw[Produktion af kraftvarme fra halm]; 1999e2004.
[65] Ecoinvent Centre. Ecoinvent data v2.2. Dubendorf,Switzerland: Swiss Centre for Life Cycle Inventories; 2010.
[66] Gabrielle B, Gagnaire N. Life-cycle assessment of straw usein bio-ethanol production: a case study based onbiophysical modelling. Biomass Bioenergy2008;32(5):431e41.
[67] Wilhelm WW, Johnson JMF, Hatfield JL, Voorhees WB,Linden DR. Crop and soil productivity response to cornresidue removal. This paper is a joint contribution of theUSDA-ARS and the Agricultural Research Division of theUniversity of Nebraska. Published as Journal Ser. no. 13949Agron J 2004;96(1):1e17.
[68] Davidson EA, Janssens IA. Temperature sensitivity of soilcarbon decomposition and feedbacks to climate change.Nature 2006;440(7081):165e73.
[69] Mathiesen BV, Munster M, Fruergaard T. Uncertaintiesrelated to the identification of the marginal energy
b i om a s s a n d b i o e n e r g y 6 8 ( 2 0 1 4 ) 1 1 5e1 3 4 133
technology in consequential life cycle assessments. J CleanProd 2009;17(15):1331e8.
[70] Ekvall T, Weidema B. System boundaries and input data inconsequential life cycle inventory analysis. Int J Life CycleAssess 2004;9(3):161e71.
[71] Weidema BP, Ekvall T, Heijungs R. Guidelines forapplication of deepened and broadened LCA. Int J Life CycleAssess e Co-ord Action Innov Life-Cycle Anal Sustain(Calcas) 2009:1e49.
[72] Weidema BP. Market information in life cycle assessment.Copenhagen: Danish Environmental Protection Agency;2003. pp. 1e147.
[73] McLenaghen RD, Cameron KC, Lampkin NH, Daly ML, Deo B.Nitrate leaching from ploughed pasture and theeffectiveness of winter catch crops in reducing leachinglosses. N Z J Agric Res 1996;39(3):413e20.
[74] Kirchmann H, Johnston AEJ, Bergstr€om LF. Possibilities forreducing nitrate leaching from agricultural land. AMBIO e JHum Environ 2002;31(5):404e8.
[75] Martinez J, Guiraud G. Alysimeter study of the effects of aryegrass catch crop, during a winter wheat/maize rotation,on nitrate leaching and on the following crop. J Soil Sci1990;41(1):5e16.
[76] Eriksen J, Thorup-Kristensen K. The effect of catch crops onsulphate leaching and availability of S in the succeedingcrop on sandy loam soil in Denmark. Agric Ecosyst Environ2002;90(3):247e54.
[77] Whitmore AP, Schr€oder JJ. Intercropping reduces nitrateleaching from under field crops without loss of yield: amodelling study. Eur J Agron 2007;27(1):81e8.
[78] Brentrup F, Kusters J, Kuhlmann H, Lammel J.Environmental impact assessment of agriculturalproduction systems using the life cycle assessmentmethodology: I. Theoretical concept of a LCA methodtailored to crop production. Eur J Agron2004;20(3):247e64.
[79] Pehnt M. Dynamic life cycle assessment (LCA) of renewableenergy technologies. Renew Energy 2006;31(1):55e71.
[80] European Commission. Integrated pollution prevention andcontrol: reference document on best available techniquesfor large combustion plants. Edificio Expo, Inca Garcilaso s/n, E-41092 Seville e Spain: Joint Research Centre, Institutefor Prospective Technological Studies; 2006. pp. 1e578.
[81] Kaminski J. Technologies and costs of SO2-emissionsreduction for the energy sector. Appl Energy2003;75(3e4):165e72.
[82] Graus WHJ, Worrell E. Effects of SO2 and NOx control onenergy-efficiency power generation. Energy Policy2007;35(7):3898e908.
[83] Østergaard PA. Reviewing optimisation criteria for energysystems analyses of renewable energy integration. Energy2009;34(9):1236e45.
[84] Dalgaard T, Olesen JE, Petersen SO, Petersen BM,Jørgensen U, Kristensen T, et al. Developments ingreenhouse gas emissions and net energy use in Danishagriculture e how to achieve substantial CO2 reductions?Environ Pollut 2011;159(11):3193e203.
[85] Nielsen S, Sorknæs P, Østergaard PA. Electricity marketauction settings in a future Danish electricity system with ahigh penetration of renewable energy sources e acomparison of marginal pricing and pay-as-bid. Energy2011;36(7):4434e44.
[86] Lim S, Lee KT. Leading global energy and environmentaltransformation: unified ASEAN biomass-based bio-energysystem incorporating the clean development mechanism.Biomass Bioenergy 2011;35(7):2479e90.
[87] Iqbal MT. Simulation of a small wind fuel cell hybrid energysystem. Renew Energy 2003;28(4):511e22.
[88] Jurado F, Cano A, Carpio J. Modelling of combined cyclepower plants using biomass. Renew Energy2003;28(5):743e53.
[89] Ro K, Rahman S. Control of grid-connected fuel cell plantsfor enhancement of power system stability. Renew Energy2003;28(3):397e407.
[90] Ummels BC, Gibescu M, Pelgrum E, Kling WL, Brand AJ.Impacts of wind power on thermal generation unitcommitment and dispatch. IEEE Trans Energy Convers2007;22(1):44e51.
[91] Farrell AE, Plevin RJ, Turner BT, Jones AD, O'Hare M,Kammen DM. Ethanol can contribute to energy andenvironmental goals. Science 2006;311(5760):506e8.
[92] Claus F, Brian M, Henrik L, Frede H, David C, Poul Ø, et al.Biomasse og det intelligente energisystem; 2012.
[93] Kim S, Dale BE. Life cycle assessment of various croppingsystems utilized for producing biofuels: bioethanol andbiodiesel. Biomass Bioenergy 2005;29(6):426e39.
[94] Rinaldi R, Schuth F. Acid hydrolysis of cellulose as the entrypoint into biorefinery schemes. ChemSusChem2009;2(12):1096e107.
[95] Pimentel D. Ethanol fuels: energy balance, economics, andenvironmental impacts are negative. Nat Resour Res2003;12(2):127e34.
[96] Parajuli R. Life cycle assessment of wheat straw as a fuelinput for district heat production. Aalborg University; 2013.pp. 1e128.
[97] Ea Energy Analyses. Analysis of the market for bio energylocally and internationally. Final report, 29 September 2010ed. Frederiksholms Kanal 4, Copenhagen K: Ea EnergyAnalyses; 2010. pp. 1e90.
[98] Natarajan E, Nordin A, Rao AN. Overview of combustion andgasification of rice husk in fluidized bed reactors. BiomassBioenergy 1998;14(5e6):533e46.
[99] Nguyen TLT, Hermansen JE, Nielsen RG. Environmentalassessment of gasification technology for biomassconversion to energy in comparison with other alternatives:the case of wheat straw. J Clean Prod 2013;53(0):138e48.
[100] Parajuli R, Dalgaard T, Jørgensen U, Adamsen AP, KnudsenMT, Birkved M, et al. Biorefining in the prevailing energyand materials crisis: a review of sustainable pathways forbiorefinery value chains and sustainability assessmentmethodologies. Renew Sustain Energy Rev [unpublishedresults].
[101] Blengini GA, Brizio E, Cibrario M, Genon G. LCA of bioenergychains in Piedmont (Italy): a case study to support publicdecision makers towards sustainability. Resour ConservRecycl 2011;57(0):36e47.
[102] Concawe, EUCAR, EC. Well-to-wheels analysis of futureautomotive fuels and powertrains in the European context;2007. pp. 1e88.
[103] Searcy E, FlynnPC. Processingof straw/corn stover: comparisonof life cycle emissions. Int J Green Energy 2008;5(6):423e37.
[104] Cherubini F, Bird ND, Cowie A, Jungmeier G,Schlamadinger B, Woess-Gallasch S. Energy- andgreenhouse gas-based LCA of biofuel and bioenergysystems: key issues, ranges and recommendations. ResourConserv Recycl 2009;53(8):434e47.
[105] Kaltschmitt M, Reinhardt GA, Stelzer T. Life cycle analysisof biofuels under different environmental aspects. BiomassBioenergy 1997;12(2):121e34.
[106] Botha T, von Blottnitz H. A comparison of theenvironmental benefits of bagasse-derived electricity andfuel ethanol on a life-cycle basis. Energy Policy2006;34(17):2654e61.
[107] EPRI. Renewable energy technology characterizations.Washington, D.C. 20585: Electric Power Research Institute;1997. pp. 1e283.
b i om a s s a n d b i o e n e r g y 6 8 ( 2 0 1 4 ) 1 1 5e1 3 4134
[108] Mann M, Spath P. Life cycle assessment of a biomassgasification combined cycle system. National RenewableEnergy Laboratory; 1997. pp. 1e30.
[109] Marland G, Turhollow AF. CO2 emissions from theproduction and combustion of fuel ethanol from corn.Energy 1991;16(11e12):1307e16.
[110] Pimentel D, Patzek TW. Ethanol production using corn,switchgrass, and wood; biodiesel production using soybeanand sunflower. Nat Resour Res 2005;14(1):65e76.
[111] Uihlein A, Ehrenberger S, Schebek L. Utilisation options ofrenewable resources: a life cycle assessment of selectedproducts. J Clean Prod 2008;16(12):1306e20.
[112] Dalgaard T, Jørgensen U, Kristensen I, Gylling M, Dejgaard J,Dubgaard A, et al. Concepts for a multi-criteriasustainability assessment of a new more biobased economyin rural production landscapes. In: International FarmingSystems Association Conference. Aarhus, Denmark; 2012.p. Workshop 5.1. 9 p.
[113] Yuankun H. On food safety problem in new stages ofagricultural development. Rural Econ China2001;275(3):16e57.
[114] Dorado MP, Lin SKC, Koutinas A, Du C, Wang R, Webb C.Cereal-based biorefinery development: utilisation of wheatmilling by-products for the production of succinic acid. JBiotechnol 2009;143(1):51e9.
[115] Cherubini F, Ulgiati S. Crop residues as raw materials forbiorefinery systems e a LCA case study. Appl Energy2010;87(1):47e57.
[116] Cherubini F, Jungmeier G. LCA of a biorefinery conceptproducing bioethanol, bioenergy, and chemicals fromswitchgrass. Int J Life Cycle Assess 2010;15(1):53e66.
[117] Gylling M, Jørgensen U, Bentsen NS, Kristensen IT,Dalgaard T, Felby C, et al. The þ10 million tonnes study:increasing the sustainable production of biomass forbiorefineries. Fødevareøkonomisk Institut, KøbenhavnsUniversitet; 2013. pp. 1e32.