left–right breast asymmetry and risk of screen - UCL Discovery
12
BJR Cite this article as: Hudson SM, Wilkinson LS, De Stavola BL, dos-Santos-Silva I. Left–right breast asymmetry and risk of screen-detected and interval cancers in a large population-based screening population. Br J Radiol 2020; 93: 20200154. https://doi.org/10.1259/bjr.20200154 FULL PAPER Left–right breast asymmetry and risk of screen- detected and interval cancers in a large population- based screening population 1 SUE M HUDSON, BSc MSc, 2 LOUISE S WILKINSON, 3 BIANCA L DE STAVOLA and 1 ISABEL DOS-SANTOS-SILVA 1 Department of Non-Communicable Disease Epidemiology, London School of Hygiene and Tropical Medicine, Keppel Street, London WC1E 7HT, UK 2 Oxford Breast Imaging Centre, Oxford University Hospitals NHS Foundation Trust, Oxford, UK 3 Faculty of Pop Health Sciences, Institute of Child Health, University College London, London, UK Address correspondence to: Ms Sue M Hudson E-mail: [email protected];[email protected] INTRODUCTION Breast cancer is the most common female cancer. 1 Mammographic screening programmes, such as the England and Wales Breast Screening Programme (NHSBSP), have been found to reduce mortality through earlier detection. 2 However, although increased amount of radio-dense tissue on a mammogram is associated with an increased risk of developing breast cancer, 3–5 there is strong evidence that it also reduces the effectiveness of breast screening 6–10 by decreasing mammographic sensitivity, as radio-dense tissue may hide cancers. Boyd et al found that females in the highest category of mammographic density (density in >= 75% of mammogram) had greater odds of being diagnosed with cancer in the year following a “normal” mammogram than females in the lowest density category (density in <10% of mammogram) (OR of 17.8 (95% CI 4.8–65.9)). 6 Other research has focused on the texture or type of parenchymal pattern in breast tissue as a risk factor for breast cancer; a review of over 40 research papers concluded that automated analysis of quantitative features in mammographic images may be useful in breast cancer risk assessment and potential stratification for screening but that further research was necessary. 11 One little explored potential feature is mammographic asymmetry in the total size of the breast and in the size of the radio-dense tissue between the leſt and the right breasts. Increased “‘fluctuating asymmetry” (FA), that is, increased anthropometrical asymmetry in paired features, is related to both fecundity and general health. 12–15 Furthermore, Received: 17 February 2020 Accepted: 08 June 2020 Revised: 03 June 2020 © 2020 The Authors. Published by the British Institute of Radiology Objectives: To assess the associations between auto- mated volumetric estimates of mammographic asym- metry and breast cancers detected at the same (“contemporaneous”) screen, at subsequent screens, or in between (interval cancers). Methods: Automated measurements from mammographic images (N = 79,731) were used to esti- mate absolute asymmetry in breast volume (BV) and dense volume (DV) in a large ethnically diverse popula- tion of attendees of a UK breast screening programme. Logistic regression models were fitted to assess asym- metry associations with the odds of a breast cancer detected at contemporaneous screen (767 cases), adjusted for relevant confounders. Nested case–control investigations were designed to examine associations between asymmetry and the odds of: (a) interval cancer (numbers of cases/age-matched controls: 153/646) and (b) subsequent screen-detected cancer (345/1438), via conditional logistic regression. Results: DV, but not BV, asymmetry was positively asso- ciated with the odds of contemporaneous breast cancer (P-for-linear-trend (Pt) = 0.018). This association was stronger for first (prevalent) screens (Pt = 0.012). Both DV and BV asymmetry were positively associated with the odds of an interval cancer diagnosis (Pt = 0.060 and 0.030, respectively). Neither BV nor DV asymmetry were associated with the odds of having a subsequent screen- detected cancer. Conclusions: Increased DV asymmetry was associated with the risk of a breast cancer diagnosis at a contempo- raneous screen or as an interval cancer. BV asymmetry was positively associated with the risk of an interval cancer diagnosis. Advances in knowledge: The findings suggest that DV and BV asymmetry may provide additional signals for detecting contemporaneous cancers and assessing the likelihood of interval cancers in population-based screening programmes.
-
Upload
khangminh22 -
Category
Documents
-
view
0 -
download
0
Transcript of left–right breast asymmetry and risk of screen - UCL Discovery

BJR
Cite this article as:Hudson SM, Wilkinson LS, De Stavola BL, dos- Santos- Silva I. Left–right breast asymmetry and risk of screen- detected and interval cancers in a large population- based screening population. Br J Radiol 2020; 93: 20200154.
https:// doi. org/ 10. 1259/ bjr. 20200154
Full PaPer
left–right breast asymmetry and risk of screen- detected and interval cancers in a large population- based screening population1Sue M HudSon, BSc MSc, 2louiSe S WilkinSon, 3Bianca l de Stavola and 1iSaBel doS- SantoS- Silva1Department of Non- Communicable Disease Epidemiology, London School of Hygiene and Tropical Medicine, Keppel Street, London WC1E 7HT, UK2Oxford Breast Imaging Centre, Oxford University Hospitals NHS Foundation Trust, Oxford, UK3Faculty of Pop Health Sciences, Institute of Child Health, University College London, London, UK
Address correspondence to: Ms Sue M HudsonE-mail: susan. hudson@ lshtm. ac. uk; sue. hudson@ pasconsulting. co. uk
introductionBreast cancer is the most common female cancer.1 Mammographic screening programmes, such as the England and Wales Breast Screening Programme (NHSBSP), have been found to reduce mortality through earlier detection.2 However, although increased amount of radio- dense tissue on a mammogram is associated with an increased risk of developing breast cancer,3–5 there is strong evidence that it also reduces the effectiveness of breast screening6–10 by decreasing mammographic sensitivity, as radio- dense tissue may hide cancers. Boyd et al found that females in the highest category of mammographic density (density in >= 75% of mammogram) had greater odds of being diagnosed with cancer in the year following a “normal” mammogram than females in the lowest density
category (density in <10% of mammogram) (OR of 17.8 (95% CI 4.8–65.9)).6 Other research has focused on the texture or type of parenchymal pattern in breast tissue as a risk factor for breast cancer; a review of over 40 research papers concluded that automated analysis of quantitative features in mammographic images may be useful in breast cancer risk assessment and potential stratification for screening but that further research was necessary.11
One little explored potential feature is mammographic asymmetry in the total size of the breast and in the size of the radio- dense tissue between the left and the right breasts. Increased “‘fluctuating asymmetry” (FA), that is, increased anthropometrical asymmetry in paired features, is related to both fecundity and general health.12–15 Furthermore,
Received: 17 February 2020
Accepted: 08 June 2020
Revised: 03 June 2020
© 2020 The Authors. Published by the British Institute of Radiology
objectives: To assess the associations between auto-mated volumetric estimates of mammographic asym-metry and breast cancers detected at the same (“contemporaneous”) screen, at subsequent screens, or in between (interval cancers).Methods: Automated measurements from mammographic images (N = 79,731) were used to esti-mate absolute asymmetry in breast volume (BV) and dense volume (DV) in a large ethnically diverse popula-tion of attendees of a UK breast screening programme. Logistic regression models were fitted to assess asym-metry associations with the odds of a breast cancer detected at contemporaneous screen (767 cases), adjusted for relevant confounders.Nested case–control investigations were designed to examine associations between asymmetry and the odds of: (a) interval cancer (numbers of cases/age- matched controls: 153/646) and (b) subsequent screen- detected cancer (345/1438), via conditional logistic regression.
results: DV, but not BV, asymmetry was positively asso-ciated with the odds of contemporaneous breast cancer (P- for- linear- trend (Pt) = 0.018). This association was stronger for first (prevalent) screens (Pt = 0.012). Both DV and BV asymmetry were positively associated with the odds of an interval cancer diagnosis (Pt = 0.060 and 0.030, respectively). Neither BV nor DV asymmetry were associated with the odds of having a subsequent screen- detected cancer.conclusions: Increased DV asymmetry was associated with the risk of a breast cancer diagnosis at a contempo-raneous screen or as an interval cancer. BV asymmetry was positively associated with the risk of an interval cancer diagnosis.advances in knowledge: The findings suggest that DV and BV asymmetry may provide additional signals for detecting contemporaneous cancers and assessing the likelihood of interval cancers in population- based screening programmes.

2 of 12 birpublications.org/bjr Br J Radiol;93:20200154
BJR Hudson et al
breast FA appears to be related to many of the known reproduc-tive breast cancer risk factors, such as parity, age at first birth and age at menopause.16 Findings to date are consistent with breast volume (BV) asymmetry being associated with the presence of breast cancer17–20 as well as with a higher risk of having a breast cancer diagnosed in the short- and medium- term.21 There is also limited evidence that asymmetry in mammographic density might be associated with higher short- term,22–24 and medium- term25 risk of being diagnosed with breast cancer although the previous research used very specific bespoke algorithms to derive asymmetry scores based on comparing multiple bilateral mammographic density features.
Breast cancer subtypes, based on gene expression or receptor status, are clinically relevant because they are associated with differential treatment options and prognoses. Studies have shown that some hormonal risk factors associated with FA are also associated with particular breast cancer subtypes (e.g., parity is inversely associated with FA16 and with the risk of luminal- like breast tumours26,27).
The aim of this study is to investigate the association between left–right asymmetry in breast size and in the amount of radio- dense tissue, as ascertained by mammography, and the risk of being diagnosed with breast cancer (overall and by subtype) at the same or subsequent screens, or as an interval cancer, among a large population- based sample of 68,776 females who under-went mammographic screening in South West London, England, between March 2013 and June 2017.
MetHodSStudy participantsThe study participants were female residents in one of six London boroughs—Wandsworth, Merton, Croydon, Sutton, Richmond and Kingston—who underwent routine 3 yearly screening mammography as part of the NHSBSP at the South West London Breast Screening Service (SWLBSS) based in the St George’s University Hospitals NHS Foundation Trust. The NHSBSP is an organised population- based mammographic screening programme, with a call–recall system, which targets females aged 50–70 years (with a trial for 50% of females aged 47–50 and 70–73) and has a coverage of approximately 75%.28 Also included were small numbers of younger females who had been identified as having a higher risk of breast cancer and there-fore invited for screening on an annual basis, plus any females over 73 years who had optionally contacted the service for a self- referred screening appointment. Participants were screened during the period 01 March 2013 to 20 June 2017.
Data on ethnicity were collected as part of the standard screening protocol via a self- completed screening questionnaire. Ethnicity was categorised according to the Census classification29 and summarised as, “Asian” (Indian, Pakistani or Bangladeshi or other), “Black- African,” “Black- British or Caribbean or other,” “Chinese,” “Mixed” (White and Black, White and Asian or any other mixed), “White” (British or Irish or other) and “Other.” Data for other known breast cancer risk factors (e.g., reproduc-tive history, body mass index (BMI), family- history of breast
cancer) are not collected in a systematic way across the NHSBSP screening programme and thus were unavailable. The type of screen (first (prevalent) versus subsequent (incident) screens) was recorded.
Exposure assessmentEach female underwent the NHSBSP standard, two- view (cranio- caudal (CC) and medio- lateral- oblique views (MLO)) mammog-raphy of each breast.30 Raw digital mammographic images were processed via an automated algorithm, that is, Volpara® Densi-tyTM V.1.5.11, (Matakina Technology Limited, Wellington, New Zealand)31 ; this algorithm provided fully automated estimates (in cm3) of the volume of the BV and the volume of the radio- dense tissue (DV) separately for each of the four (left–right CC and MLO) images. The volume of non- dense volume (NDV) was calculated as the difference between BV and DV on the same image. The NHSBSP does not use mammographic density as a diagnostic aid, and participants are not informed on whether they have dense breasts.
For each participant, we estimated absolute measures of left–right asymmetry (in cm3), that is, the unsigned difference between left BV (or DV) and right BV (or DV). Absolute asymmetry was esti-mated from the CC images because this view is likely to capture the whole of the breast while being less affected than the MLO view by the inclusion of variable amounts of retro- glandular fat tissue near the chest wall.
Subject eligibilityScreening events where exposure measurements (i.e., breast asymmetry) and outcome ascertainment (screen- detected cancer) were done concurrently, were regarded as “contempo-raneous screens” for the purposes of this study. In all, 93,416 contemporaneous screens took place during the study period. Screens were excluded from this analysis if: females had a previous history of breast cancer (N = 2,068); females had breast implants or where the standard set of four (i.e., left–right CC and MLO) images was incomplete or exceeded (N = 10,234); and of these if one or both of the CC images was rejected by Volpara based on its internal consistency checks (N = 1,383). Thus, a total of 79,731 screens were eligible for inclusion in the analysis. Some females were screened more than once in the study period; 9,600 females had two screens; 221 females had three screens; 72 had four screens; and 3 females had five screens; all valid screens were included in the analysis. “Subsequent” screens were screens that took place, as a result of the next screening round invitation following on from a contemporaneous screen, at approximately 3 years after the contemporaneous screen. Approximately 20% of subsequent screens were also included in the contemporaneous screen study.
Cancer ascertainmentThe images were double read with arbitration by consensus. In this study, cancers detected at the screen when breast asym-metry was estimated were called “contemporaneous screen detected cancers,” cancers diagnosed symptomatically in the 3- year period following this measurement and prior to the next screening invitation were regarded as “interval cancers” and
3 of 12 birpublications.org/bjr Br J Radiol;93:20200154
BJRLeft- right breast asymmetry and risk of screen- detected cancers
breast cancers detected at the subsequent screen were considered as being “subsequent cancers.
Interval cancer case ascertainment was based on the sharing of data between the Screening Quality Assurance Service and Cancer Registries and via direct contact between the screening services and local treating NHS Trusts. Each NHSBSP screening service is responsible for recording and reviewing all reported interval cancers. We included all recorded interval cancers from the SWLBSS database as of 06 November 2019.
Contemporaneous screen cancers were categorised according to histological subtype and laterality (left- side, right- side, bilat-eral tumour). Tumour subtypes are routinely differentiated in the NHSBSP by immunohistochemical (IHC) analysis of the oestrogen (ER) and progesterone (PR) hormone receptors and the human epidermal growth factor (HER2) (using IHC plus in situ hybridisation (ISH) molecular analysis). These tests are carried out on diagnostic or surgical biopsies. In the NHSBSP, ER testing is required for all invasive tumours and guidelines are used to ensure standard reporting of results across the screening programme.32 The results were used to approximately differ-entiate between the most clinically relevant subtypes based on the definitions proposed by Waks and Winer33 as: Hormone+ (H+) cancers if ER +and/or PR+, HER2-; HER2 +cancers if ER ± PR+/-, HER2+; and triple negative cancers if ER-, PR- and HER2-. The size of tumours was estimated as maximum dimen-sion of the whole tumour at surgical excision where such data were available. No data on receptor status or tumour size were available for interval cancers.
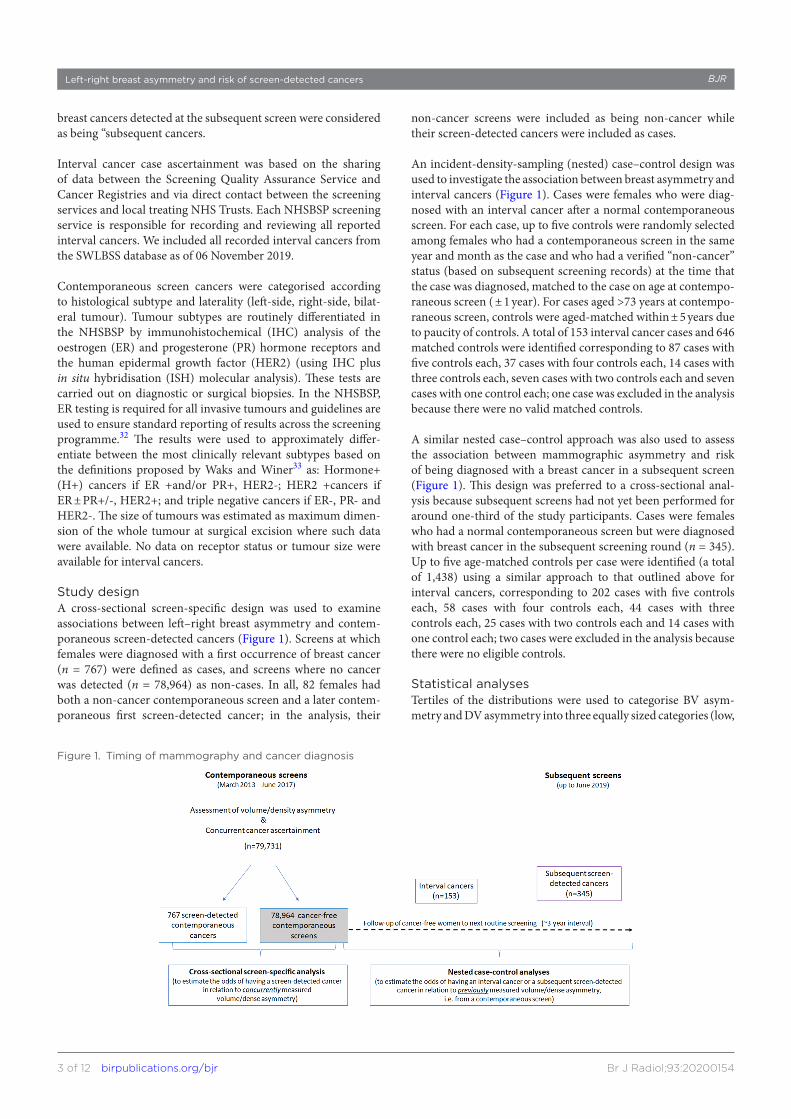
Study designA cross- sectional screen- specific design was used to examine associations between left–right breast asymmetry and contem-poraneous screen- detected cancers (Figure 1). Screens at which females were diagnosed with a first occurrence of breast cancer (n = 767) were defined as cases, and screens where no cancer was detected (n = 78,964) as non- cases. In all, 82 females had both a non- cancer contemporaneous screen and a later contem-poraneous first screen- detected cancer; in the analysis, their
non- cancer screens were included as being non- cancer while their screen- detected cancers were included as cases.
An incident- density- sampling (nested) case–control design was used to investigate the association between breast asymmetry and interval cancers (Figure 1). Cases were females who were diag-nosed with an interval cancer after a normal contemporaneous screen. For each case, up to five controls were randomly selected among females who had a contemporaneous screen in the same year and month as the case and who had a verified “non- cancer” status (based on subsequent screening records) at the time that the case was diagnosed, matched to the case on age at contempo-raneous screen ( ± 1 year). For cases aged >73 years at contempo-raneous screen, controls were aged- matched within ± 5 years due to paucity of controls. A total of 153 interval cancer cases and 646 matched controls were identified corresponding to 87 cases with five controls each, 37 cases with four controls each, 14 cases with three controls each, seven cases with two controls each and seven cases with one control each; one case was excluded in the analysis because there were no valid matched controls.
A similar nested case–control approach was also used to assess the association between mammographic asymmetry and risk of being diagnosed with a breast cancer in a subsequent screen (Figure 1). This design was preferred to a cross- sectional anal-ysis because subsequent screens had not yet been performed for around one- third of the study participants. Cases were females who had a normal contemporaneous screen but were diagnosed with breast cancer in the subsequent screening round (n = 345). Up to five age- matched controls per case were identified (a total of 1,438) using a similar approach to that outlined above for interval cancers, corresponding to 202 cases with five controls each, 58 cases with four controls each, 44 cases with three controls each, 25 cases with two controls each and 14 cases with one control each; two cases were excluded in the analysis because there were no eligible controls.
Statistical analysesTertiles of the distributions were used to categorise BV asym-metry and DV asymmetry into three equally sized categories (low,
Figure 1. Timing of mammography and cancer diagnosis

4 of 12 birpublications.org/bjr Br J Radiol;93:20200154
BJR Hudson et al
medium and high) based on the distributions in the non- cases/controls.
Logistic regression models were used to examine the strength of the associations between the exposures of interest, BV asym-metry and DV asymmetry, and the odds of being diagnosed with a contemporaneous screen- detected breast cancer (overall and by subtype). Robust standard errors (clustering by female) were used to account for the fact that some females had repeat screens over the 52- month study period. Similarly, separate conditional logistic regression models were used to examine the strength of the associations between BV asymmetry and DV asymmetry and the odds of an interval cancer and the odds of a subsequent screen- detected cancer.
All regression models were adjusted for a priori poten-tial confounders: age at screening, ethnicity and mean mammographic NDV (a valid proxy for BMI when data for the latter are not available34) and additionally for mean BV (log transformed) in the BV asymmetry model and mean DV (log transformed) in the DV asymmetry model. DV was not added as a potential confounder in the BV asymmetry model because previous studies using this data showed that there was no asso-ciation between DV and BV asymmetry.35 Mean BV, NDV and DV values were calculated as averages of the corresponding fully automated readings obtained from each female’s four contemporaneous CC and MLO images (all available image sets being used to derive the best estimate for these confounders). Trend tests for the association with the asymmetry measures were carried out fitting models with the ordinal values of each asymmetry measure and assessing their significance using Wald tests.
For the association between breast asymmetry and the odds of having a contemporaneous screen- detected cancer, further analysis included stratification by type of screen (prevalent vs incident) and reanalyses restricted to each tumour subtype. Adjustment for ethnicity was omitted for the latter due to spar-sity of data.
Spearman rank correlation coefficients (r) were estimated to investigate whether the magnitude of the breast asymmetry in BV and DV among contemporaneous screen- detected breast cancer cases was correlated with the size of the tumour. The proportion of cancers detected in the larger breast was also calculated.
In all the analyses, we considered statistical significance (two- sided) at p- value < 0.05. All analyses were conducted in Stata (IC 14)33.
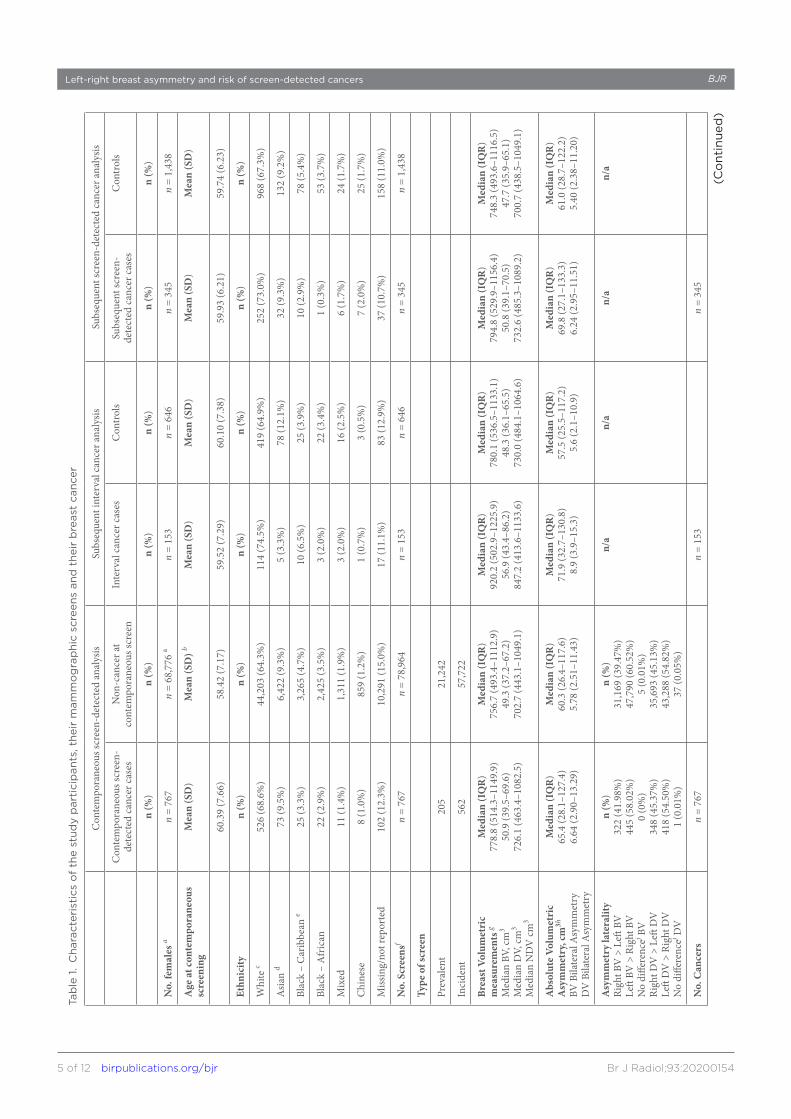
reSultSStudy participantsThe characteristics of the participants, and of their screens, are shown in Table 1. The majority of the participants were White. The mean age at contemporaneous screening was 58.4 years when the screen did not lead to cancer detection and 60.4 years when it did. Mean time between contemporaneous screen and interval cancer diagnosis was 19.2 (range 0.14–36.0; SD = 9.1) months.
Mean time between contemporaneous screen and subsequent screen diagnosis was 36.4 (range 9.6–70.8; SD = 8.2) months.
The median values for BV and DV asymmetry were higher for contemporaneous cases (65.4 cm3 and 6.64 cm3, respectively) than non- cases (60.3 cm3 and 5.78 cm3, respectively; Table 1). Median values for BV asymmetry and DV asymmetry were also higher for interval cancer cases (71.9 cm3 and 8.90 cm3, respectively) than their matched controls (57.5 cm3 and 5.60 cm3, respectively; Table 1). A similar pattern was observed for subsequent cancers but with smaller case–control differ-ences in median BV asymmetry and DV asymmetry (Table 1) (Supplementary Table 1).
Tumour subtype was known for 88% of all contemporaneous screen- detected cases. Of these 84% were HR+, 11% HER2+ and 4.8% triple- negative tumours (Table 1). The median BV and DV asymmetry values for the latter were markedly higher (110.4 cm3 and 11.66 cm3, respectively) than for the other subtypes (average 65.4 cm3 and 6.64 cm3, respectively) (Supplementary Table 2).
Associations between BV and DV asymmetry and contemporaneous screen-detected breast cancerThere was a possible positive, but weak (p- for- linear- trend (Pt) = 0.105), log- linear association between BV asymmetry and the odds of being diagnosed with cancer at the contempora-neous screen. Relative to females in the bottom third of the BV asymmetry distribution (<36.4 cm3), those in the top third (≥93.7 cm3) appeared to have 1.17 times greater odds (OR 1.17; 95% CI 0.97, 1.44) of having a screen- detected cancer, in the fully adjusted models. There was stronger evidence that DV asymmetry was positively associated with the odds of being diagnosed with a cancer at the contemporaneous screen; (Pt = 0.018) with females in the top third of the DV asym-metry (≥9.04 cm3) having 1.26 times greater odds (OR 1.26; 95% CI 1.04, 1.53) than those in the bottom third (<3.48 cm3) (Figure 2).
In stratified analyses by type of screen, BV asymmetry was not associated with the odds of a contemporaneous screen- detected cancer in either group. DV asymmetry was however positively associated with the odds of a contemporaneous screen- detected breast cancer among females who had a prev-alent screen (OR 1.56; 95% CI 1.07, 2.27; Pt = 0.012) but not among those who had an incident screen (OR 1.15 (0.92, 1.45); Pt = 0.21; Figure 3).
No clear associations were found between BV asymmetry and any specific tumour subtype. DV asymmetry however was positively associated with both the odds of having a contem-poraneous screen- detected HR +breast cancer and the odds of having a triple negative breast cancer, but no association was found with HER2 +cancers. Relative to females in the bottom third of the DV asymmetry distribution those in the top third were 3.7 times more likely to have a triple negative cancer (OR 3.72; 95% CI 1.11, 12.45) and 1.3 times more likely to have a HR +cancer (1.28; 1.05, 1.58; Figure 4).
5 of 12 birpublications.org/bjr Br J Radiol;93:20200154
BJRLeft- right breast asymmetry and risk of screen- detected cancersTa
ble
1.
Cha
ract
eris
tics
of
the
stud
y p
arti
cip
ants
, the
ir m
amm
og
rap
hic
scre
ens
and
the
ir b
reas
t ca
ncer
Con
tem
pora
neou
s scr
een-
dete
cted
ana
lysis
Subs
eque
nt in
terv
al c
ance
r ana
lysis
Subs
eque
nt sc
reen
- det
ecte
d ca
ncer
ana
lysis
Con
tem
pora
neou
s scr
een-
de
tect
ed c
ance
r cas
esN
on- c
ance
r at
cont
empo
rane
ous s
cree
nIn
terv
al c
ance
r cas
esC
ontr
ols
Subs
eque
nt sc
reen
- de
tect
ed c
ance
r cas
esC
ontr
ols
n (%
)n
(%)
n (%
)n
(%)
n (%
)n
(%)
No.
fem
ales
an
= 76
7n
= 68
,776
an
= 15
3n
= 64
6n
= 34
5n
= 1,
438
Age
at c
onte
mpo
rane
ous
scre
enin
gM
ean
(SD
)M
ean
(SD
) bM
ean
(SD
)M
ean
(SD
)M
ean
(SD
)M
ean
(SD
)
60.3
9 (7
.66)
58.4
2 (7
.17)
59.5
2 (7
.29)
60.1
0 (7
.38)
59.9
3 (6
.21)
59.7
4 (6
.23)
Ethn
icity
n (%
)n
(%)
n (%
)n
(%)
n (%
)n
(%)
Whi
te c
526
(68.
6%)
44,2
03 (6
4.3%
)11
4 (7
4.5%
)41
9 (6
4.9%
)25
2 (7
3.0%
)96
8 (6
7.3%
)
Asia
n d
73 (9
.5%
)6,
422
(9.3
%)
5 (3
.3%
)78
(12.
1%)
32 (9
.3%
)13
2 (9
.2%
)
Blac
k –
Car
ibbe
an e
25 (3
.3%
)3,
265
(4.7
%)
10 (6
.5%
)25
(3.9
%)
10 (2
.9%
)78
(5.4
%)
Blac
k –
Afr
ican
22 (2
.9%
)2,
425
(3.5
%)
3 (2
.0%
)22
(3.4
%)
1 (0
.3%
)53
(3.7
%)
Mix
ed11
(1.4
%)
1,31
1 (1
.9%
)3
(2.0
%)
16 (2
.5%
)6
(1.7
%)
24 (1
.7%
)
Chi
nese
8 (1
.0%
)85
9 (1
.2%
)1
(0.7
%)
3 (0
.5%
)7
(2.0
%)
25 (1
.7%
)
Miss
ing/
not r
epor
ted
102
(12.
3%)
10,2
91 (1
5.0%
)17
(11.
1%)
83 (1
2.9%
)37
(10.
7%)
158
(11.
0%)
No.
Scr
eens
fn
= 76
7n
= 78
,964
n =
153
n =
646
n =
345
n =
1,43
8
Type
of s
cree
n
Prev
alen
t20
521
,242
Inci
dent
562
57,7
22
Brea
st V
olum
etri
c m
easu
rem
ents
g
Med
ian
BV, c
m3
Med
ian
DV,
cm3
Med
ian
ND
V cm
3
Med
ian
(IQ
R)
778.
8 (5
14.3
–114
9.9)
50.9
(39.
5–69
.6)
726.
1 (4
63.4
–108
2.5)
Med
ian
(IQ
R)
756.
7 (4
93.4
–111
2.9)
49.3
(37.
2–67
.2)
702.
7 (4
43.1
–104
9.1)
Med
ian
(IQ
R)
920.
2 (5
02.9
–122
5.9)
56.9
(43.
4–86
.2)
847.
2 (4
13.6
–113
3.6)
Med
ian
(IQ
R)
780.
1 (5
36.5
–113
3.1)
48.3
(36.
1–65
.5)
730.
0 (4
84.1
–106
4.6)
Med
ian
(IQ
R)
794.
8 (5
29.9
–115
6.4)
50.8
(39.
1–70
.5)
732.
6 (4
85.3
–108
9.2)
Med
ian
(IQ
R)
748.
3 (4
93.6
–111
6.5)
47.7
(35.
9–65
.1)
700.
7 (4
38.5
–104
9.1)
Abs
olut
e Vo
lum
etri
c A
sym
met
ry, c
m3h
BV B
ilate
ral A
sym
met
ryD
V B
ilate
ral A
sym
met
ry
Med
ian
(IQ
R)
65.4
(28.
1–12
7.4)
6.64
(2.9
0–13
.29)
Med
ian
(IQ
R)
60.3
(26.
4–11
7.6)
5.78
(2.5
1–11
.43)
Med
ian
(IQ
R)
71.9
(32.
7–13
0.8)
8.9
(3.9
–15.
3)
Med
ian
(IQ
R)
57.5
(25.
5–11
7.2)
5.6
(2.1
–10.
9)
Med
ian
(IQ
R)
69.8
(27.
1–13
3.3)
6.24
(2.9
5–11
.51)
Med
ian
(IQ
R)
61.0
(28.
7–12
2.2)
5.40
(2.3
8–11
.20)
Asy
mm
etry
late
ralit
yRi
ght B
V >
Left
BV
Left
BV >
Rig
ht B
VN
o di
ffere
ncej B
VRi
ght D
V >
Left
DV
Left
DV
> R
ight
DV
No
diffe
renc
ej DV
n (%
)32
2 (4
1.98
%)
445
(58.
02%
)0
(0%
)34
8 (4
5.37
%)
418
(54.
50%
)1
(0.0
1%)
n (%
)31
,169
(39.
47%
)47
,790
(60.
52%
)5
(0.0
1%)
35,6
93 (4
5.13
%)
43,2
88 (5
4.82
%)
37 (0
.05%
)
n/a
n/a
n/a
n/a
No.
Can
cers
n =
767
n =
153
n =
345
(Co
ntin
ued
)

6 of 12 birpublications.org/bjr Br J Radiol;93:20200154
BJR Hudson et al
Can
cer L
ater
ality
Bila
tera
lLe
ft br
east
Righ
t bre
ast
Unk
now
n
n (%
)20
(2.6
%)
380
(49.
5%)
364
(47.
5%)
3
n (%
)3
(2.0
%)
42 (2
7.5%
)40
(26.
1%)
68 (4
4.4%
)
n (%
)0
165
(47.
8%)
180
(52.
2%)
0
Tum
our s
ubty
peH
R+ (E
R +
and/
or P
R+,
HER
2-)
HER
2+ (E
R+/-
,PR+
/-,
HER
2+)
Trip
le n
egat
ive
(ER-
, PR-
, H
ER2-
)U
nkno
wn
or n
on- in
vasiv
e
n (%
)56
6 (8
4.2%
)74
(11.
0%)
32 (4
.8%
)95
(12.
4%)
n/a
n/a
Tum
our s
ize
mm
i
Left
brea
st (n
= 2
45)
Righ
t bre
ast (
n =
249)
Med
ian
(IQ
R)
19 (1
7 -2
1)20
(18-
22)
n/a
n/a
BV
, bre
ast
volu
me;
DV
, vo
lum
e o
f ra
dio
- den
se t
issu
e o
n a
mam
mo
gra
m; E
R, o
estr
og
en r
ecep
tor;
HE
R2,
hum
an e
pid
erm
al g
row
th f
acto
r; H
R, h
orm
one
rec
epto
r; I
QR
, int
er q
uart
ile r
ang
e; N
DV
, vo
lum
e o
f no
n- ra
dio
- den
se (
fatt
y) t
issu
e o
n a
mam
mo
gra
m; P
R, p
rog
este
rone
rec
epto
r; S
D, s
tand
ard
dev
iati
on;
j, N
o m
easu
reab
le d
iffer
ence
in v
olu
mes
; n/a
, no
t av
aila
ble
.a9
,814
fem
ales
hav
e m
ore
tha
n o
ne c
ont
emp
ora
neo
us s
cree
n.bW
here
fem
ales
hav
e m
ore
tha
n o
ne c
ont
emp
ora
neo
us s
cree
n th
e av
erag
e o
f th
eir
age
at s
cree
n is
tak
en.
cW
hite
incl
udes
: Bri
tish
/Iri
sh a
nd o
ther
dA
sian
incl
udes
: Bri
tish
Ind
ian,
Pak
ista
ni, B
ang
lad
eshi
and
oth
ereB
lack
incl
udes
: Bri
tish
, Car
ibb
ean
and
oth
er (
non-
Afr
ican
)f S
cree
ns in
clud
ed m
ust
have
at
exac
tly
four
imag
es t
aken
, onl
y sc
reen
ing
imag
es a
re in
clud
ed, e
xclu
ded
are
imag
es t
hat
wer
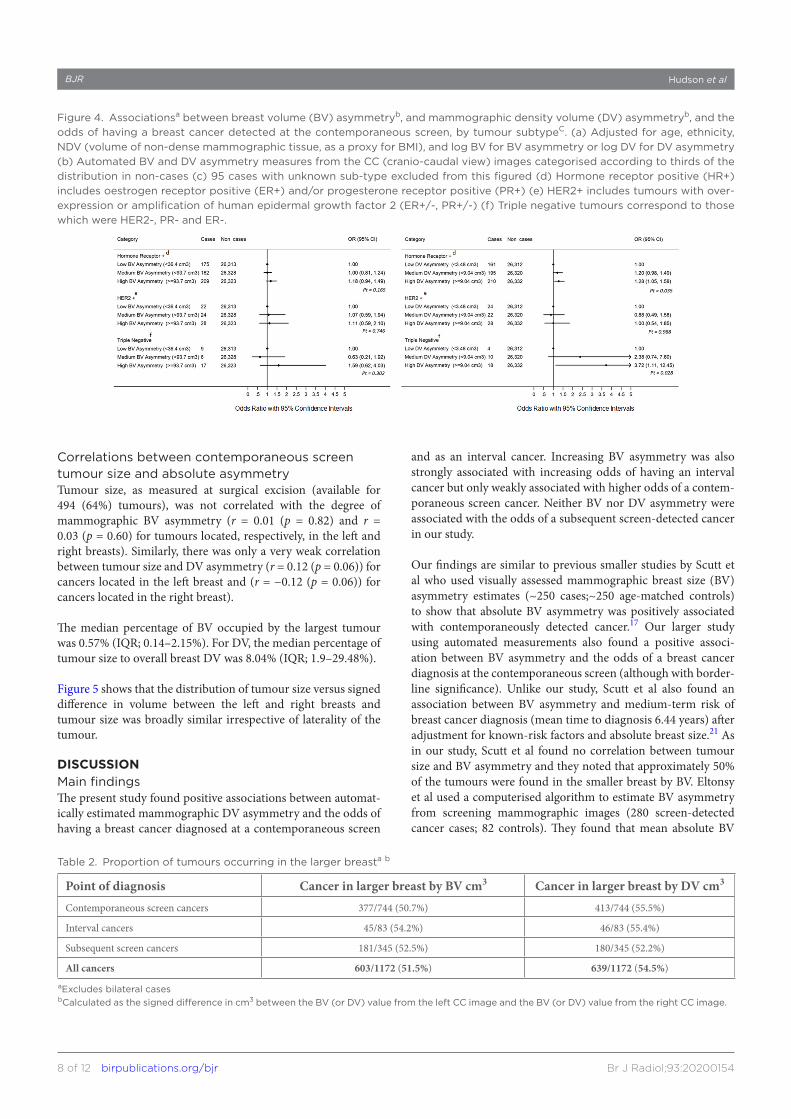
e re
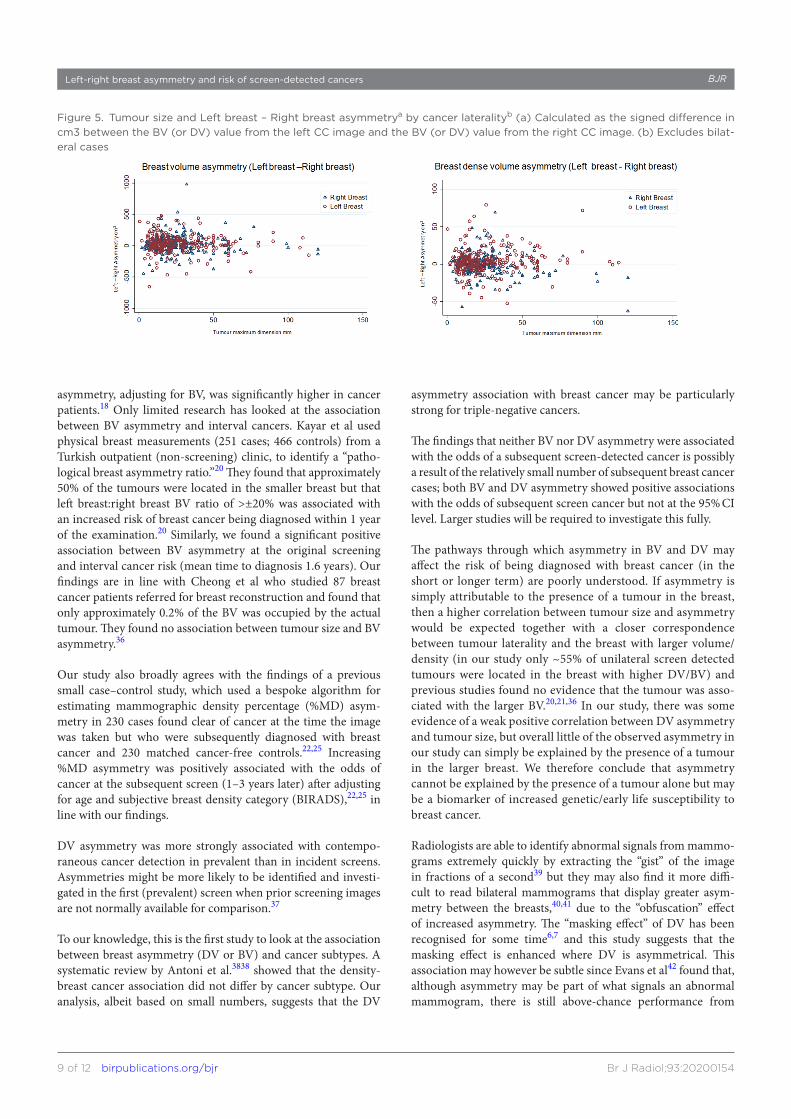
ject
ed a
s o
utlie
rs b
y th
e V
olp
ara
alg
ori
thm
. Scr
eens
fo
r fe
mal
es
kno
wn
to h
ave
pre
vio
us b
reas
t ca
ncer
wer
e al
so e
xclu
ded
.gM
edia
n va
lues
are
cal
cula
ted
usi
ng a
ll av
aila
ble
imag
es f
rom
the
rel
evan
t vi
ew (
MLO
and
CC
fro
m e
ach
sid
e) a
t a
cont
emp
ora
neo
us s
cree
nhM
edia
n va
lue
of
max
imum
dim
ensi
on
in m
m f
or
unila
tera
l can
cers
whe
re s
ize
has
bee
n re
po
rted
i Cal
cula
ted
as
abso
lute
diff
eren
ce b
etw
een
left
CC
imag
e an
d r
ight
CC
imag
ej N
o m
easu
rab
le d
iffer
ence
in v
olu
mes
Tab
le 1
. (C
ont
inue
d)
7 of 12 birpublications.org/bjr Br J Radiol;93:20200154
BJRLeft- right breast asymmetry and risk of screen- detected cancers
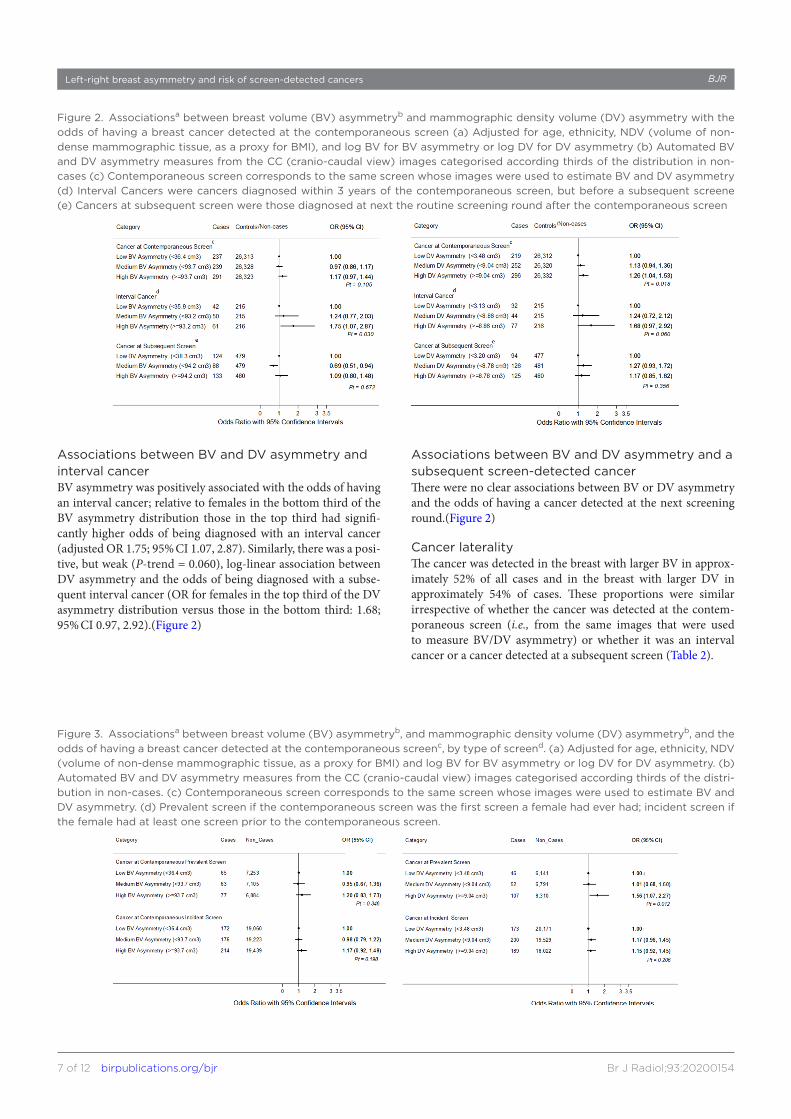
Associations between BV and DV asymmetry and interval cancerBV asymmetry was positively associated with the odds of having an interval cancer; relative to females in the bottom third of the BV asymmetry distribution those in the top third had signifi-cantly higher odds of being diagnosed with an interval cancer (adjusted OR 1.75; 95% CI 1.07, 2.87). Similarly, there was a posi-tive, but weak (P- trend = 0.060), log- linear association between DV asymmetry and the odds of being diagnosed with a subse-quent interval cancer (OR for females in the top third of the DV asymmetry distribution versus those in the bottom third: 1.68; 95% CI 0.97, 2.92).(Figure 2)
Associations between BV and DV asymmetry and a subsequent screen-detected cancerThere were no clear associations between BV or DV asymmetry and the odds of having a cancer detected at the next screening round.(Figure 2)
Cancer lateralityThe cancer was detected in the breast with larger BV in approx-imately 52% of all cases and in the breast with larger DV in approximately 54% of cases. These proportions were similar irrespective of whether the cancer was detected at the contem-poraneous screen (i.e., from the same images that were used to measure BV/DV asymmetry) or whether it was an interval cancer or a cancer detected at a subsequent screen (Table 2).
Figure 2. Associationsa between breast volume (BV) asymmetryb and mammographic density volume (DV) asymmetry with the odds of having a breast cancer detected at the contemporaneous screen (a) Adjusted for age, ethnicity, NDV (volume of non- dense mammographic tissue, as a proxy for BMI), and log BV for BV asymmetry or log DV for DV asymmetry (b) Automated BV and DV asymmetry measures from the CC (cranio- caudal view) images categorised according thirds of the distribution in non- cases (c) Contemporaneous screen corresponds to the same screen whose images were used to estimate BV and DV asymmetry (d) Interval Cancers were cancers diagnosed within 3 years of the contemporaneous screen, but before a subsequent screene (e) Cancers at subsequent screen were those diagnosed at next the routine screening round after the contemporaneous screen
Figure 3. Associationsa between breast volume (BV) asymmetryb, and mammographic density volume (DV) asymmetryb, and the odds of having a breast cancer detected at the contemporaneous screenc, by type of screend. (a) Adjusted for age, ethnicity, NDV (volume of non- dense mammographic tissue, as a proxy for BMI) and log BV for BV asymmetry or log DV for DV asymmetry. (b) Automated BV and DV asymmetry measures from the CC (cranio- caudal view) images categorised according thirds of the distri-bution in non- cases. (c) Contemporaneous screen corresponds to the same screen whose images were used to estimate BV and DV asymmetry. (d) Prevalent screen if the contemporaneous screen was the first screen a female had ever had; incident screen if the female had at least one screen prior to the contemporaneous screen.
8 of 12 birpublications.org/bjr Br J Radiol;93:20200154
BJR Hudson et al
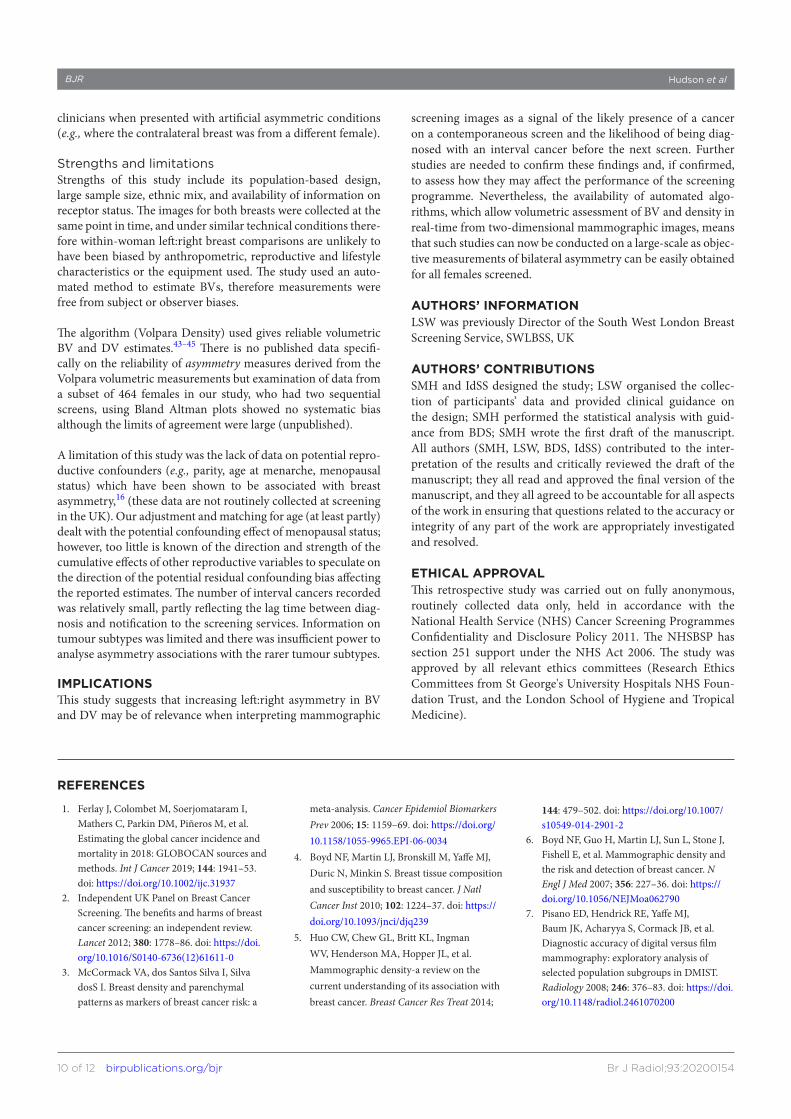
Correlations between contemporaneous screen tumour size and absolute asymmetryTumour size, as measured at surgical excision (available for 494 (64%) tumours), was not correlated with the degree of mammographic BV asymmetry (r = 0.01 (p = 0.82) and r = 0.03 (p = 0.60) for tumours located, respectively, in the left and right breasts). Similarly, there was only a very weak correlation between tumour size and DV asymmetry (r = 0.12 (p = 0.06)) for cancers located in the left breast and (r = −0.12 (p = 0.06)) for cancers located in the right breast).
The median percentage of BV occupied by the largest tumour was 0.57% (IQR; 0.14–2.15%). For DV, the median percentage of tumour size to overall breast DV was 8.04% (IQR; 1.9–29.48%).
Figure 5 shows that the distribution of tumour size versus signed difference in volume between the left and right breasts and tumour size was broadly similar irrespective of laterality of the tumour.
diScuSSionMain findingsThe present study found positive associations between automat-ically estimated mammographic DV asymmetry and the odds of having a breast cancer diagnosed at a contemporaneous screen
and as an interval cancer. Increasing BV asymmetry was also strongly associated with increasing odds of having an interval cancer but only weakly associated with higher odds of a contem-poraneous screen cancer. Neither BV nor DV asymmetry were associated with the odds of a subsequent screen- detected cancer in our study.
Our findings are similar to previous smaller studies by Scutt et al who used visually assessed mammographic breast size (BV) asymmetry estimates (~250 cases;~250 age- matched controls) to show that absolute BV asymmetry was positively associated with contemporaneously detected cancer.17 Our larger study using automated measurements also found a positive associ-ation between BV asymmetry and the odds of a breast cancer diagnosis at the contemporaneous screen (although with border-line significance). Unlike our study, Scutt et al also found an association between BV asymmetry and medium- term risk of breast cancer diagnosis (mean time to diagnosis 6.44 years) after adjustment for known- risk factors and absolute breast size.21 As in our study, Scutt et al found no correlation between tumour size and BV asymmetry and they noted that approximately 50% of the tumours were found in the smaller breast by BV. Eltonsy et al used a computerised algorithm to estimate BV asymmetry from screening mammographic images (280 screen- detected cancer cases; 82 controls). They found that mean absolute BV
Figure 4. Associationsa between breast volume (BV) asymmetryb, and mammographic density volume (DV) asymmetryb, and the odds of having a breast cancer detected at the contemporaneous screen, by tumour subtypeC. (a) Adjusted for age, ethnicity, NDV (volume of non- dense mammographic tissue, as a proxy for BMI), and log BV for BV asymmetry or log DV for DV asymmetry (b) Automated BV and DV asymmetry measures from the CC (cranio- caudal view) images categorised according to thirds of the distribution in non- cases (c) 95 cases with unknown sub- type excluded from this figured (d) Hormone receptor positive (HR+) includes oestrogen receptor positive (ER+) and/or progesterone receptor positive (PR+) (e) HER2+ includes tumours with over-expression or amplification of human epidermal growth factor 2 (ER+/-, PR+/-) (f) Triple negative tumours correspond to those which were HER2-, PR- and ER-.
Table 2. Proportion of tumours occurring in the larger breasta b
Point of diagnosis Cancer in larger breast by BV cm3 Cancer in larger breast by DV cm3
Contemporaneous screen cancers 377/744 (50.7%) 413/744 (55.5%)
Interval cancers 45/83 (54.2%) 46/83 (55.4%)
Subsequent screen cancers 181/345 (52.5%) 180/345 (52.2%)
All cancers 603/1172 (51.5%) 639/1172 (54.5%)aExcludes bilateral casesbCalculated as the signed difference in cm3 between the BV (or DV) value from the left CC image and the BV (or DV) value from the right CC image.
9 of 12 birpublications.org/bjr Br J Radiol;93:20200154
BJRLeft- right breast asymmetry and risk of screen- detected cancers
asymmetry, adjusting for BV, was significantly higher in cancer patients.18 Only limited research has looked at the association between BV asymmetry and interval cancers. Kayar et al used physical breast measurements (251 cases; 466 controls) from a Turkish outpatient (non- screening) clinic, to identify a “patho-logical breast asymmetry ratio.”20 They found that approximately 50% of the tumours were located in the smaller breast but that left breast:right breast BV ratio of >±20% was associated with an increased risk of breast cancer being diagnosed within 1 year of the examination.20 Similarly, we found a significant positive association between BV asymmetry at the original screening and interval cancer risk (mean time to diagnosis 1.6 years). Our findings are in line with Cheong et al who studied 87 breast cancer patients referred for breast reconstruction and found that only approximately 0.2% of the BV was occupied by the actual tumour. They found no association between tumour size and BV asymmetry.36
Our study also broadly agrees with the findings of a previous small case–control study, which used a bespoke algorithm for estimating mammographic density percentage (%MD) asym-metry in 230 cases found clear of cancer at the time the image was taken but who were subsequently diagnosed with breast cancer and 230 matched cancer- free controls.22,25 Increasing %MD asymmetry was positively associated with the odds of cancer at the subsequent screen (1–3 years later) after adjusting for age and subjective breast density category (BIRADS),22,25 in line with our findings.
DV asymmetry was more strongly associated with contempo-raneous cancer detection in prevalent than in incident screens. Asymmetries might be more likely to be identified and investi-gated in the first (prevalent) screen when prior screening images are not normally available for comparison.37
To our knowledge, this is the first study to look at the association between breast asymmetry (DV or BV) and cancer subtypes. A systematic review by Antoni et al.3838 showed that the density- breast cancer association did not differ by cancer subtype. Our analysis, albeit based on small numbers, suggests that the DV
asymmetry association with breast cancer may be particularly strong for triple- negative cancers.
The findings that neither BV nor DV asymmetry were associated with the odds of a subsequent screen- detected cancer is possibly a result of the relatively small number of subsequent breast cancer cases; both BV and DV asymmetry showed positive associations with the odds of subsequent screen cancer but not at the 95% CI level. Larger studies will be required to investigate this fully.
The pathways through which asymmetry in BV and DV may affect the risk of being diagnosed with breast cancer (in the short or longer term) are poorly understood. If asymmetry is simply attributable to the presence of a tumour in the breast, then a higher correlation between tumour size and asymmetry would be expected together with a closer correspondence between tumour laterality and the breast with larger volume/density (in our study only ~55% of unilateral screen detected tumours were located in the breast with higher DV/BV) and previous studies found no evidence that the tumour was asso-ciated with the larger BV.20,21,36 In our study, there was some evidence of a weak positive correlation between DV asymmetry and tumour size, but overall little of the observed asymmetry in our study can simply be explained by the presence of a tumour in the larger breast. We therefore conclude that asymmetry cannot be explained by the presence of a tumour alone but may be a biomarker of increased genetic/early life susceptibility to breast cancer.
Radiologists are able to identify abnormal signals from mammo-grams extremely quickly by extracting the “gist” of the image in fractions of a second39 but they may also find it more diffi-cult to read bilateral mammograms that display greater asym-metry between the breasts,40,41 due to the “obfuscation” effect of increased asymmetry. The “masking effect” of DV has been recognised for some time6,7 and this study suggests that the masking effect is enhanced where DV is asymmetrical. This association may however be subtle since Evans et al42 found that, although asymmetry may be part of what signals an abnormal mammogram, there is still above- chance performance from
Figure 5. Tumour size and Left breast – Right breast asymmetrya by cancer lateralityb (a) Calculated as the signed difference in cm3 between the BV (or DV) value from the left CC image and the BV (or DV) value from the right CC image. (b) Excludes bilat-eral cases
10 of 12 birpublications.org/bjr Br J Radiol;93:20200154
BJR Hudson et al
clinicians when presented with artificial asymmetric conditions (e.g., where the contralateral breast was from a different female).
Strengths and limitationsStrengths of this study include its population- based design, large sample size, ethnic mix, and availability of information on receptor status. The images for both breasts were collected at the same point in time, and under similar technical conditions there-fore within- woman left:right breast comparisons are unlikely to have been biased by anthropometric, reproductive and lifestyle characteristics or the equipment used. The study used an auto-mated method to estimate BVs, therefore measurements were free from subject or observer biases.
The algorithm (Volpara Density) used gives reliable volumetric BV and DV estimates.43–45 There is no published data specifi-cally on the reliability of asymmetry measures derived from the Volpara volumetric measurements but examination of data from a subset of 464 females in our study, who had two sequential screens, using Bland Altman plots showed no systematic bias although the limits of agreement were large (unpublished).
A limitation of this study was the lack of data on potential repro-ductive confounders (e.g., parity, age at menarche, menopausal status) which have been shown to be associated with breast asymmetry,16 (these data are not routinely collected at screening in the UK). Our adjustment and matching for age (at least partly) dealt with the potential confounding effect of menopausal status; however, too little is known of the direction and strength of the cumulative effects of other reproductive variables to speculate on the direction of the potential residual confounding bias affecting the reported estimates. The number of interval cancers recorded was relatively small, partly reflecting the lag time between diag-nosis and notification to the screening services. Information on tumour subtypes was limited and there was insufficient power to analyse asymmetry associations with the rarer tumour subtypes.
iMPlicationSThis study suggests that increasing left:right asymmetry in BV and DV may be of relevance when interpreting mammographic
screening images as a signal of the likely presence of a cancer on a contemporaneous screen and the likelihood of being diag-nosed with an interval cancer before the next screen. Further studies are needed to confirm these findings and, if confirmed, to assess how they may affect the performance of the screening programme. Nevertheless, the availability of automated algo-rithms, which allow volumetric assessment of BV and density in real- time from two- dimensional mammographic images, means that such studies can now be conducted on a large- scale as objec-tive measurements of bilateral asymmetry can be easily obtained for all females screened.
autHorS’ inForMationLSW was previously Director of the South West London Breast Screening Service, SWLBSS, UK
autHorS’ contriButionSSMH and IdSS designed the study; LSW organised the collec-tion of participants’ data and provided clinical guidance on the design; SMH performed the statistical analysis with guid-ance from BDS; SMH wrote the first draft of the manuscript. All authors (SMH, LSW, BDS, IdSS) contributed to the inter-pretation of the results and critically reviewed the draft of the manuscript; they all read and approved the final version of the manuscript, and they all agreed to be accountable for all aspects of the work in ensuring that questions related to the accuracy or integrity of any part of the work are appropriately investigated and resolved.
etHical aPProvalThis retrospective study was carried out on fully anonymous, routinely collected data only, held in accordance with the National Health Service (NHS) Cancer Screening Programmes Confidentiality and Disclosure Policy 2011. The NHSBSP has section 251 support under the NHS Act 2006. The study was approved by all relevant ethics committees (Research Ethics Committees from St George's University Hospitals NHS Foun-dation Trust, and the London School of Hygiene and Tropical Medicine).
reFerenceS
1. Ferlay J, Colombet M, Soerjomataram I, Mathers C, Parkin DM, Piñeros M, et al. Estimating the global cancer incidence and mortality in 2018: GLOBOCAN sources and methods. Int J Cancer 2019; 144: 1941–53. doi: https:// doi. org/ 10. 1002/ ijc. 31937
2. Independent UK Panel on Breast Cancer Screening. The benefits and harms of breast cancer screening: an independent review. Lancet 2012; 380: 1778–86. doi: https:// doi. org/ 10. 1016/ S0140- 6736( 12) 61611-0
3. McCormack VA, dos Santos Silva I, Silva dosS I. Breast density and parenchymal patterns as markers of breast cancer risk: a
meta- analysis. Cancer Epidemiol Biomarkers Prev 2006; 15: 1159–69. doi: https:// doi. org/ 10. 1158/ 1055- 9965. EPI- 06- 0034
4. Boyd NF, Martin LJ, Bronskill M, Yaffe MJ, Duric N, Minkin S. Breast tissue composition and susceptibility to breast cancer. J Natl Cancer Inst 2010; 102: 1224–37. doi: https:// doi. org/ 10. 1093/ jnci/ djq239
5. Huo CW, Chew GL, Britt KL, Ingman WV, Henderson MA, Hopper JL, et al. Mammographic density- a review on the current understanding of its association with breast cancer. Breast Cancer Res Treat 2014;
144: 479–502. doi: https:// doi. org/ 10. 1007/ s10549- 014- 2901-2
6. Boyd NF, Guo H, Martin LJ, Sun L, Stone J, Fishell E, et al. Mammographic density and the risk and detection of breast cancer. N Engl J Med 2007; 356: 227–36. doi: https:// doi. org/ 10. 1056/ NEJMoa062790
7. Pisano ED, Hendrick RE, Yaffe MJ, Baum JK, Acharyya S, Cormack JB, et al. Diagnostic accuracy of digital versus film mammography: exploratory analysis of selected population subgroups in DMIST. Radiology 2008; 246: 376–83. doi: https:// doi. org/ 10. 1148/ radiol. 2461070200

11 of 12 birpublications.org/bjr Br J Radiol;93:20200154
BJRLeft- right breast asymmetry and risk of screen- detected cancers
8. Destounis S, Johnston L, Highnam R, Arieno A, Morgan R, Chan A. Using volumetric breast density to quantify the potential masking risk of mammographic density. AJR Am J Roentgenol 2017; 208: 222–7. doi: https:// doi. org/ 10. 2214/ AJR. 16. 16489
9. Wanders JOP, Holland K, Karssemeijer N, Peeters PHM, Veldhuis WB, Mann RM, et al. The effect of volumetric breast density on the risk of screen- detected and interval breast cancers: a cohort study. Breast Cancer Res 2017; 19: 67. doi: https:// doi. org/ 10. 1186/ s13058- 017- 0859-9
10. Moshina N, Sebuødegård S, Lee CI, Akslen LA, Tsuruda KM, Elmore JG, et al. Automated volumetric analysis of mammographic density in a screening setting: worse outcomes for women with dense breasts. Radiology 2018; 288: 343–52. doi: https:// doi. org/ 10. 1148/ radiol. 2018172972
11. Gastounioti A, Conant EF, Kontos D. Beyond breast density: a review on the advancing role of parenchymal texture analysis in breast cancer risk assessment. Breast Cancer Research 2016; 18: 1–12. doi: https:// doi. org/ 10. 1186/ s13058- 016- 0755-8
12. Moller A, Soler M, Thornhill R. Breast asymmetry, sexual selection, and human reproductive success. 1995;: 207–19p..
13. Thornhill R, Moller AP, stability D. Disease and medicine. Biological Reviews of the Cambridge Philosophical Society 1997; 72: 497–548.
14. Jasienska G, Lipson SF, Ellison PT, Thune I, Ziomkiewicz A. Symmetrical women have higher potential fertility. Evolution and Human Behavior 2006; 27: 390–400. doi: https:// doi. org/ 10. 1016/ j. evolhumbehav. 2006. 01. 001
15. Milne BJ, Belsky J, Poulton R, Thomson WM, Caspi A, Kieser J. Fluctuating asymmetry and physical health among young adults. Evolution and Human Behavior 2003; 24: 53–63. doi: https:// doi. org/ 10. 1016/ S1090- 5138( 02) 00120-4
16. Manning JT, Scutt D, Whitehouse GH, Leinster SJ. Breast asymmetry and phenotypic quality in women. Evolution and Human Behavior 1997; 18: 223–36. doi: https:// doi. org/ 10. 1016/ S0162- 3095( 97) 00002-0
17. Scutt D, Manning JT, Whitehouse GH, Leinster SJ, Massey CP. The relationship between breast asymmetry, breast size and the occurrence of breast cancer. Br J Radiol 1997; 70(OCT): 1017–21. doi: https:// doi. org/ 10. 1259/ bjr. 70. 838. 9404205
18. Eltonsy HN, Elmaghraby A, Tourassi G. Bilateral breast volume asymmetry in screening mammograms as a potential
marker of breast cancer: preliminary experience. 2007;V-5 p.
19. Williams AC, Hitt A, Voisin S, Tourassi G.editors.Automated assessment of bilateral breast volume asymmetry as a breast cancer biomarker during mammographic screening. International Society for Optics and Photonics. 2013;SPIE Medical Imaging; 2013.
20. Kayar R, Çilengiroğlu Özgül V. Breast volume asymmetry value, ratio, and cancer risk. Breast Cancer 2015; 9: 87–92. doi: https:// doi. org/ 10. 4137/ BCBCR. S32789
21. Scutt D, Lancaster GA, Manning JT. Breast asymmetry and predisposition to breast cancer. Breast Cancer Res 2006; 8: R14. doi: https:// doi. org/ 10. 1186/ bcr1388
22. Zheng B, Sumkin JH, Zuley ML, Wang X, Klym AH, Gur D. Bilateral mammographic density asymmetry and breast cancer risk: a preliminary assessment. Eur J Radiol 2012; 81: 3222–8. doi: https:// doi. org/ 10. 1016/ j. ejrad. 2012. 04. 018
23. Tan M, Zheng B, Ramalingam P, Gur D. Prediction of near- term breast cancer risk based on bilateral mammographic feature asymmetry. Acad Radiol 2013; 20: 1542–50. doi: https:// doi. org/ 10. 1016/ j. acra. 2013. 08. 020
24. Sun W, Zheng B, Lure F, Wu T, Zhang J, Wang BY, et al. Prediction of near- term risk of developing breast cancer using computerized features from bilateral mammograms. Comput Med Imaging Graph 2014; 38: 348–57. doi: https:// doi. org/ 10. 1016/ j. compmedimag. 2014. 03. 001
25. Zheng B, Tan M, Ramalingam P, Gur D. Association between computed tissue density asymmetry in bilateral mammograms and near- term breast cancer risk. Breast J 2014; 20: 249–57. doi: https:// doi. org/ 10. 1111/ tbj. 12255
26. Ellingjord- Dale M, Vos L, Tretli S, Hofvind S, Dos- Santos- Silva I, Ursin G, Parity UG. Parity, hormones and breast cancer subtypes - results from a large nested case- control study in a national screening program. Breast Cancer Res 2017; 19: 10. doi: https:// doi. org/ 10. 1186/ s13058- 016- 0798-x
27. Lambertini M, Santoro L, Del Mastro L, Nguyen B, Livraghi L, Ugolini D, et al. Reproductive behaviors and risk of developing breast cancer according to tumor subtype: a systematic review and meta- analysis of epidemiological studies. Cancer Treat Rev 2016; 49: 65–76. doi: https:// doi. org/ 10. 1016/ j. ctrv. 2016. 07. 006
28. Health and Social Care Centre Breast screening programme England. ; 2018;4/4/20182016-2017. UK: NHS Digital.
29. Office for National Statistics (ONS)2011 Census Guidance and Methodology 2015
[Overview of methods and codes used for 2011 census].. Available from: https://www. ons. gov. uk/ census/ 2011census/ 2011censusdata/ 2011censususerguide/ vari able sand clas sifi cations.
30. The Royal College of RadiologistsGuidance on screening and symptomatic breast imaging2013London
31. Matakina Technology Ltd VolparaDensity™ User Manual Version 1.5.11. [User Manual Volpara Software. In press 2014;.
32. TRCo P. Pathology reporting of breast disease in surgical excision specimens incorporating the dataset for histological reporting of breast cancer. London: The Royal College of Pathologists; 2016.
33. Waks AG, Winer EP. Breast cancer treatment: a review. JAMA 2019; 321: 288–300. doi: https:// doi. org/ 10. 1001/ jama. 2018. 19323
34. Hudson S, Hjerkind KV, Vinnicombe S, Allen S, Trewin C, Ursin G, et al. Adjusting for BMI in analyses of volumetric mammographic density and breast cancer risk. 2018;.
35. Hudson SM, Wilkinson LS, Denholm R, De Stavola BL, Dos- Santos- Silva I. Ethnic and age differences in right- left breast asymmetry in a large population- based screening population. Br J Radiol 2020; 93;:: 201903280(0). doi: https:// doi. org/ 10. 1259/ bjr. 20190328
36. Cheong AL, Liu J, Reece GP, Nicklaus KM, Catherine Bordes M, Hanson SE, et al. Natural breast symmetry in preoperative breast cancer patients. Plast Reconstr Surg Glob Open 2019; 7: e2297: e2297: . doi: https:// doi. org/ 10. 1097/ GOX. 0000000000002297
37. Roelofs AAJ, Karssemeijer N, Wedekind N, Beck C, van Woudenberg S, Snoeren PR, et al. Importance of comparison of current and prior mammograms in breast cancer screening. Radiology 2007; 242: 70–7. doi: https:// doi. org/ 10. 1148/ radiol. 2421050684
38. Antoni S, Sasco AJ, dos Santos Silva I, McCormack V. Is mammographic density differentially associated with breast cancer according to receptor status? A meta- analysis. Breast Cancer Res Treat 2013; 137: 337–47. doi: https:// doi. org/ 10. 1007/ s10549- 012- 2362-4
39. Evans KK, Georgian- Smith D, Tambouret R, Birdwell RL, Wolfe JM. The GIST of the abnormal: above- chance medical decision making in the blink of an eye. Psychon Bull Rev 2013; 20: 1170–5. doi: https:// doi. org/ 10. 3758/ s13423- 013- 0459-3
40. Lee HN, Sohn Y- M, Han KH. Comparison of mammographic density estimation by Volpara software with radiologists' visual assessment: analysis of clinical- radiologic

12 of 12 birpublications.org/bjr Br J Radiol;93:20200154
BJR Hudson et al
factors affecting discrepancy between them. Acta Radiol 2015; 56: 1061–8. doi: https:// doi. org/ 10. 1177/ 0284185114554674
41. Onega T, Smith M, Miglioretti DL, Carney PA, Geller BA, Kerlikowske K, et al. Radiologist agreement for mammographic recall by case difficulty and finding type. J Am Coll Radiol 2012; 9: 788–94. doi: https:// doi. org/ 10. 1016/ j. jacr. 2012. 05. 020
42. Evans KK, Haygood TM, Cooper J, Culpan A- M, Wolfe JM. A half- second glimpse often LETS radiologists identify breast cancer cases
even when viewing the mammogram of the opposite breast. Proc Natl Acad Sci U S A 2016; 113: 10292–7. doi: https:// doi. org/ 10. 1073/ pnas. 1606187113
43. Brand JS, Czene K, Shepherd JA, Leifland K, Heddson B, Sundbom A, et al. Automated measurement of volumetric mammographic density: a tool for widespread breast cancer risk assessment. Cancer Epidemiol Biomarkers Prev 2014; 23: 1764–72. doi: https:// doi. org/ 10. 1158/ 1055- 9965. EPI- 13- 1219
44. Alonzo- Proulx O, Mawdsley GE, Patrie JT, Yaffe MJ, Harvey JA. Reliability of automated breast density measurements. Radiology 2015; 275: 366–76. doi: https:// doi. org/ 10. 1148/ radiol. 15141686
45. Holland K, van Zelst J, den Heeten GJ, Imhof- Tas M, Mann RM, van Gils CH, et al. Consistency of breast density categories in serial screening mammograms: a comparison between automated and human assessment. Breast 2016; 29: 49–54. doi: https:// doi. org/ 10. 1016/ j. breast. 2016. 06. 020