A new Fuzzy-LOGIC based Model for Chlorophyll-a in Pulicat Lagoon, India
Upload
independentCategory
view
3download
0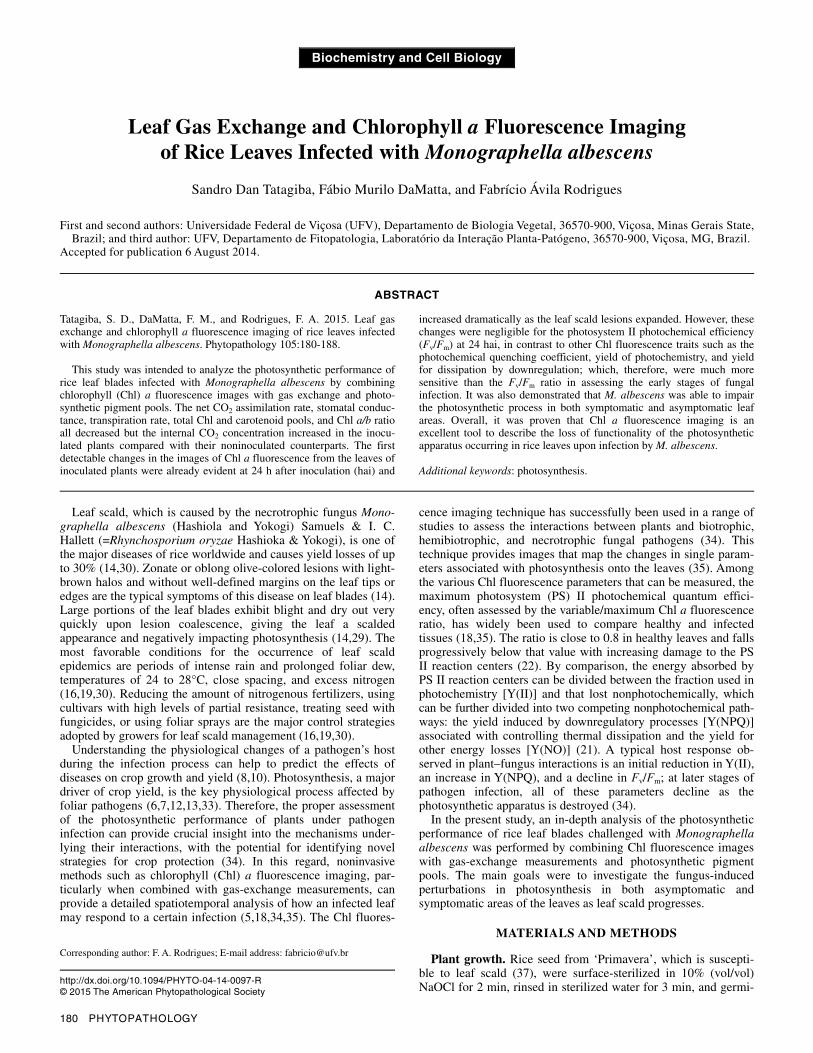
180 PHYTOPATHOLOGY
Biochemistry and Cell Biology
Leaf Gas Exchange and Chlorophyll a Fluorescence Imaging of Rice Leaves Infected with Monographella albescens
Sandro Dan Tatagiba, Fábio Murilo DaMatta, and Fabrício Ávila Rodrigues
First and second authors: Universidade Federal de Viçosa (UFV), Departamento de Biologia Vegetal, 36570-900, Viçosa, Minas Gerais State, Brazil; and third author: UFV, Departamento de Fitopatologia, Laboratório da Interação Planta-Patógeno, 36570-900, Viçosa, MG, Brazil.
Accepted for publication 6 August 2014.
ABSTRACT
Tatagiba, S. D., DaMatta, F. M., and Rodrigues, F. A. 2015. Leaf gas exchange and chlorophyll a fluorescence imaging of rice leaves infected with Monographella albescens. Phytopathology 105:180-188.
This study was intended to analyze the photosynthetic performance of rice leaf blades infected with Monographella albescens by combining chlorophyll (Chl) a fluorescence images with gas exchange and photo-synthetic pigment pools. The net CO2 assimilation rate, stomatal conduc-tance, transpiration rate, total Chl and carotenoid pools, and Chl a/b ratio all decreased but the internal CO2 concentration increased in the inocu-lated plants compared with their noninoculated counterparts. The first detectable changes in the images of Chl a fluorescence from the leaves of inoculated plants were already evident at 24 h after inoculation (hai) and
increased dramatically as the leaf scald lesions expanded. However, these changes were negligible for the photosystem II photochemical efficiency (Fv/Fm) at 24 hai, in contrast to other Chl fluorescence traits such as the photochemical quenching coefficient, yield of photochemistry, and yield for dissipation by downregulation; which, therefore, were much more sensitive than the Fv/Fm ratio in assessing the early stages of fungal infection. It was also demonstrated that M. albescens was able to impair the photosynthetic process in both symptomatic and asymptomatic leaf areas. Overall, it was proven that Chl a fluorescence imaging is an excellent tool to describe the loss of functionality of the photosynthetic apparatus occurring in rice leaves upon infection by M. albescens.
Additional keywords: photosynthesis.
Leaf scald, which is caused by the necrotrophic fungus Mono-
graphella albescens (Hashiola and Yokogi) Samuels & I. C. Hallett (=Rhynchosporium oryzae Hashioka & Yokogi), is one of the major diseases of rice worldwide and causes yield losses of up to 30% (14,30). Zonate or oblong olive-colored lesions with light-brown halos and without well-defined margins on the leaf tips or edges are the typical symptoms of this disease on leaf blades (14). Large portions of the leaf blades exhibit blight and dry out very quickly upon lesion coalescence, giving the leaf a scalded appearance and negatively impacting photosynthesis (14,29). The most favorable conditions for the occurrence of leaf scald epidemics are periods of intense rain and prolonged foliar dew, temperatures of 24 to 28°C, close spacing, and excess nitrogen (16,19,30). Reducing the amount of nitrogenous fertilizers, using cultivars with high levels of partial resistance, treating seed with fungicides, or using foliar sprays are the major control strategies adopted by growers for leaf scald management (16,19,30).
Understanding the physiological changes of a pathogen’s host during the infection process can help to predict the effects of diseases on crop growth and yield (8,10). Photosynthesis, a major driver of crop yield, is the key physiological process affected by foliar pathogens (6,7,12,13,33). Therefore, the proper assessment of the photosynthetic performance of plants under pathogen infection can provide crucial insight into the mechanisms under-lying their interactions, with the potential for identifying novel strategies for crop protection (34). In this regard, noninvasive methods such as chlorophyll (Chl) a fluorescence imaging, par-ticularly when combined with gas-exchange measurements, can provide a detailed spatiotemporal analysis of how an infected leaf may respond to a certain infection (5,18,34,35). The Chl fluores-
cence imaging technique has successfully been used in a range of studies to assess the interactions between plants and biotrophic, hemibiotrophic, and necrotrophic fungal pathogens (34). This technique provides images that map the changes in single param-eters associated with photosynthesis onto the leaves (35). Among the various Chl fluorescence parameters that can be measured, the maximum photosystem (PS) II photochemical quantum effici-ency, often assessed by the variable/maximum Chl a fluorescence ratio, has widely been used to compare healthy and infected tissues (18,35). The ratio is close to 0.8 in healthy leaves and falls progressively below that value with increasing damage to the PS II reaction centers (22). By comparison, the energy absorbed by PS II reaction centers can be divided between the fraction used in photochemistry [Y(II)] and that lost nonphotochemically, which can be further divided into two competing nonphotochemical path-ways: the yield induced by downregulatory processes [Y(NPQ)] associated with controlling thermal dissipation and the yield for other energy losses [Y(NO)] (21). A typical host response ob-served in plant–fungus interactions is an initial reduction in Y(II), an increase in Y(NPQ), and a decline in Fv/Fm; at later stages of pathogen infection, all of these parameters decline as the photosynthetic apparatus is destroyed (34).
In the present study, an in-depth analysis of the photosynthetic performance of rice leaf blades challenged with Monographella albescens was performed by combining Chl fluorescence images with gas-exchange measurements and photosynthetic pigment pools. The main goals were to investigate the fungus-induced perturbations in photosynthesis in both asymptomatic and symptomatic areas of the leaves as leaf scald progresses.
MATERIALS AND METHODS
Plant growth. Rice seed from ‘Primavera’, which is suscepti-ble to leaf scald (37), were surface-sterilized in 10% (vol/vol) NaOCl for 2 min, rinsed in sterilized water for 3 min, and germi-
Corresponding author: F. A. Rodrigues; E-mail address: [email protected]
http://dx.doi.org/10.1094/PHYTO-04-14-0097-R © 2015 The American Phytopathological Society
Vol. 105, No. 2, 2015 181
nated on distilled water-soaked germtest paper in a germination chamber (MA-835/2106UR; Marconi, São Paulo, Brazil) at 25°C for 6 days. Three germinated seedlings were transplanted in plastic pots containing 3 kg of Tropstrato (Vida Verde; Mogi Mirim, São Paulo, Brazil) substrate composed of a 1:1:1 mixture of pine bark, peat, and expanded vermiculite. Plants were grown in a greenhouse (temperature 30 ± 2°C during the day and 25 ± 2°C at night, with relative humidity of 75 ± 5%) from July to December 2012. In total, 1.63 g of calcium phosphate monobasic was added to each plastic pot. Plants were fertilized weekly with 50 ml of a nutrient solution containing KCl at 192 mg liter–1, K2SO4 at 104.42 mg liter–1, MgSO4 7H2O at 150.35 mg liter–1, urea at 61 mg liter–1, NH4NO3 at 100 mg liter–1, NH4MO7O24 4H2O at 0.27 mg liter–1, H3BO3 at 1.61 mg liter–1, ZnSO4 7H2O at 6.67 mg liter–1, CuSO4 5H2O at 1.74 mg liter–1, MnCl2 4H2O at 4.10 mg liter–1, FeSO4 7H2O at 4.08 mg liter–1, and EDTA disodium at 5 mg liter–1. The nutrient solution was prepared using deionized water. Plants were watered as needed.
Plant inoculation with M. albescens. An isolate of M. albes-cens (UFV/DFP-Ma 022) obtained from the symptomatic leaves of ‘Bonança’ rice plants was used to inoculate the plants (37). This isolate was preserved in glass vials containing potato-dextrose-agar (PDA), covered with mineral oil, and maintained at 4°C. Plugs of PDA with fungal mycelia were transferred to Petri dishes containing PDA. After 3 days, the PDA plugs containing the fungal mycelia were transferred to new Petri dishes that also contained PDA. The Petri dishes were maintained in a growth chamber (MA-835/2106UR; Marconi, São Paulo, Brazil) at 25°C with a 12-h photoperiod for 15 days. Three plants per replication of each treatment were inoculated with M. albescens after growing for 45 days (the emergence of the 10th leaf from the main tiller) (26). Three PDA discs (0.3 cm2) containing M. albescens mycelia were placed equidistantly on the adaxial side of the seventh, eighth, and ninth leaves (from the base to the apex) of each plant and gently pressed onto the surface using an index finger. Immediately after inoculation, the plants were transferred to a plastic mist growth chamber (MGC) inside a greenhouse for the duration of the experiments. The MGC was constructed of wood (2 m wide, 1.5 m high, and 5 m long) and covered with 100-µm-thick transparent plastic. The temperature inside the MGC ranged from 25 ± 4°C (day) to 21 ± 2°C (night), and the relative humidity was maintained at 92 ± 3% using a misting system (model NEB-100; KGF Company, São Paulo, Brazil) that sprayed mist above the plant canopies every 30 min. The relative humidity and temperature were measured with a thermohygro-graph (TH-508; Impac, São Paulo, Brazil). The maximum natural photon flux density at the plant canopy height was ≈950 µmol m–2 s–1. For the noninoculated plants, three PDA discs without fungal mycelia were placed equidistantly on the adaxial side of the seventh, eighth, and ninth leaves (from the base to the apex) of each plant and gently pressed onto the surface using an index finger. Noninoculated plants were kept in a separated MGC and exposed to the same environmental conditions as those experi-enced by the inoculated plants.
Lesion expansion. The expansion (in millimeters) of the three leaf scald lesions on the longitudinal axis of the adaxial surfaces of the seventh, eighth, and ninth leaves (from the base to the apex) was measured using an electronic digital caliper (China Suppliers, Suzhou/Jiangsu, China) at 24, 48, 72, 96, and 120 h after inocu-lation (hai).
Determination of leaf gas-exchange parameters. The leaf gas-exchange parameters were determined using a portable open-flow gas-exchange system (LI-6400XT; LI-COR, Lincoln, NE) equipped with a rectangular leaf chamber (dimensions of 20 by 30 mm) that enclosed a 6-cm2 leaf area. The leaf rectangular chamber was placed on the inoculated and noninoculated leaves (Fig. 1A and B, respectively). The net CO2 assimilation rate (A), stomatal conductance to water vapor (gs), internal CO2 concen-
tration (Ci), and transpiration rate (E) were measured on attached leaves (seventh, eighth, and ninth leaves (from the base to the apex) per replication for each treatment) at 24, 48, 72, 96, and 120 hai. The measurements were performed from 0900 to 1030 h (solar time), a time when A was at its maximum, under artificial photosynthetically active radiation (i.e., 1,000 µmol photons m–2 s–1 at the leaf level and 400 µmol CO2 mol–1 of air). The noninocu-lated plants were also evaluated at these times. All of the measure-ments were performed at 25°C, and the vapor pressure deficit was maintained at ≈1.0 kPa; the amount of blue light was set to 10% of the photosynthetic photon flux density to optimize the stomatal aperture.
Chl a fluorescence imaging. Images of the parameters of Chl a fluorescence were obtained on the eighth and ninth leaves (from the base to the apex) at 24, 48, 72, 96, and 120 hai with M. albescens using the MAXI version of the Imaging-PAM fluorom-eter and the Imaging Win software (Heinz Walz GmbH, Effel-trich, Germany). Images of Chl a fluorescence parameters were also obtained from the leaves of noninoculated plants (0 hai). To obtain the images of the Chl a fluorescence parameters at a resolution of 640 by 480 pixels, the leaves of each plant were individually fixed in the holder at a distance of 18.5 cm from the recording camera charge-coupled device (CCD) coupled to fluorescence device. The leaf tissues were then exposed to a weak, modulated measuring beam (0.5 µmol m–2 s–1, 100 µs, 1 Hz) to determine the initial fluorescence (F0) when all the PS II reaction centers are “open”. Next, a saturating white light pulse of 2,400 µmol m–2 s–1 (10 Hz) was applied for 0.8 s to ensure the maximum fluorescence emission (Fm) when all the PS II reaction centers were “closed”. From these initial measurements, the maximum PS II photochemical efficiency of the dark-adapted leaves was estimated through the variable-to-maximum Chl fluores-cence ratio, Fv/Fm = [(Fm – F0)/Fm)]. The leaf tissues were subse-quently exposed to actinic photon irradiance (530 µmol m–2 s–1) for 120 s to obtain the steady-state fluorescence yield (Fs), after
Fig. 1. Schematic representation of noninoculated (NI) and inoculated (I) leaves with Monographella albescens in which the rectangles represent theleaf area of 6 cm2 used to A, assess the gas exchange parameters and the circles represent the asymptomatic area (A1), area intermediate betweenasymptomatic and necrotic areas (A2), and the necrotic area (A3) on I leaves and area on NI leaves (A0) used to B, quantitatively determine the chlorophylla fluorescence imaging parameters. Each circular area corresponded to ≈0.78 cm2. The bar represents 0.5 cm.
182 PHYTOPATHOLOGY
which a saturating white light pulse (2,400 µmol m–2 s–1 for 0.8 s) was applied to achieve the light-adapted maximum fluorescence (Fm′). The light-adapted initial fluorescence (F0′) was estimated according to Oxborough and Baker (31). Following the calcu-lations of Kramer et al. (21), the energy absorbed by PS II for the following three yield components for dissipative processes were determined: the yield of photochemistry [Y(II) = (Fm′ – Fs)/Fm′)], the yield for dissipation by downregulation [Y(NPQ) = (Fs/Fm′) – (Fs/Fm)], and the yield for other nonphotochemical (nonregulated) losses [Y(NO) = Fs/Fm]. Additionally, the photochemical quench-ing coefficient (qP) was calculated as qP = (Fm′ – Fs)/(Fm′ – F0′) (22). The parameters of Chl a fluorescence were determined by selecting the circular option on the Imaging Win software (area of ≈0.78 cm2) for the noninoculated and inoculated leaves. These circular areas were as follows: asymptomatic area (A1), area
intermediate between asymptomatic and necrotic areas (A2), and necrotic area (A3) on the inoculated leaves. Monochrome images of noninoculated (A0) and inoculated leaves at 120 hai (areas A1, A2, and A3) were obtained using the camera of the fluorometer PAM Image in order to highlight their contrast in terms of color (Fig. 1B). A1 and A2 at 24 hai were determined in the leaf tissue where the PDA discs (0.3 cm2) containing M. albescens mycelia were originally placed.
Determination of leaf pigments concentration. Leaf tissue (containing the leaf scald lesions) from the seventh, eighth, and ninth leaves (from the base to the apex) from plants per replication of each treatment were collected at 24, 48, 72, 96, and 120 hai. The noninoculated plants were also evaluated at these times. The leaf samples were kept in liquid nitrogen during sampling and then stored at –80°C until further analysis. In total,
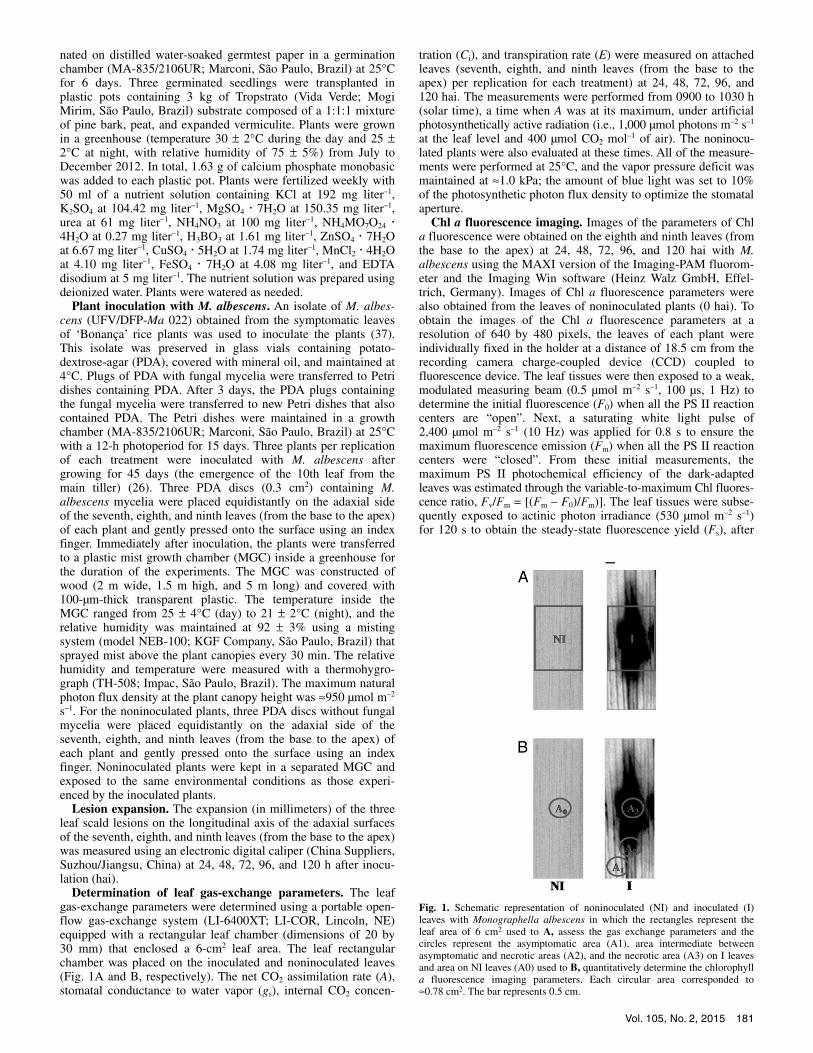
Fig. 3. A, Net carbon assimilation rate (A); B, stomatal conductance to water vapor (gs); C, transpiration rate (E); and D, internal CO2 concentration (Ci) determined on the leaves of rice plants not inoculated (NI) or inoculated (I) with Monographella albescens. Means for NI and I treatments followed by an asterisk (*) for each evaluation time are significantly different according to the t test (P ≤ 0.05). Bars represent the standard deviations of the means; n = 12.
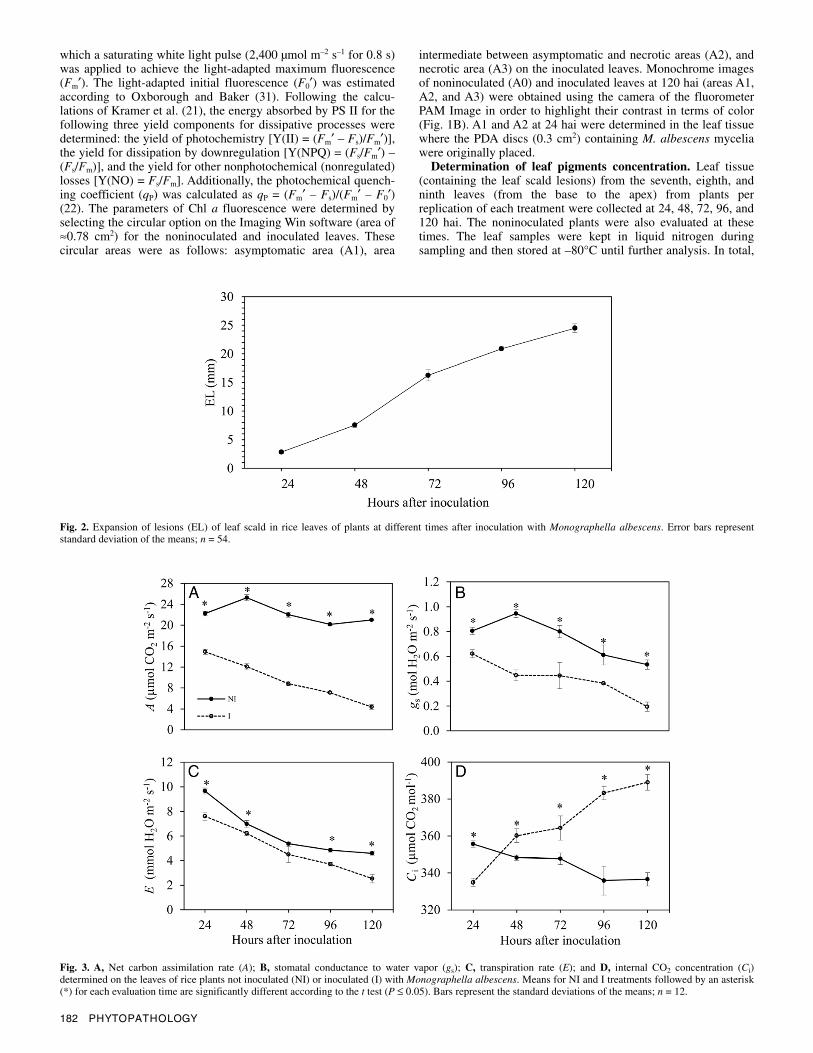
Fig. 2. Expansion of lesions (EL) of leaf scald in rice leaves of plants at different times after inoculation with Monographella albescens. Error bars represent standard deviation of the means; n = 54.
Vol. 105, No. 2, 2015 183
100 mg of leaf tissue was ground into a fine powder using a mortar and pestle with liquid nitrogen and the addition of 1 mg of calcium carbonate. Next, the fine powder was homogenized with 2 ml of aqueous acetone (80%, vol/vol) for 1 min in a room with reduced light intensity. The suspension was filtered through a Whatman number 1 filter paper, and the residue was washed four times with 80% acetone. The volume was increased to 25 ml with the same solvent in a volumetric flask. The absorbance of the samples was recorded at 470, 646.8, and 663.2 nm and the concentrations of photosynthetic pigments (Chl a, Chl b, and carotenoids) were estimated according to Lichtenthaler (24).
Experimental design and statistical analysis. An experiment consisting of two treatments (noninoculated and inoculated plants) was arranged in a completely randomized design with six replications to evaluate the expansion of leaf scald lesions, gas-exchange measurements, and Chl a fluorescence imaging. This ex-periment was repeated once. Each experimental plot corresponded to a plastic pot with three plants. A third experiment was per-formed to obtain leaves to assess chloroplastidic pigment pools, which consisted of noninoculated and inoculated plants and was arranged in a completely randomized design with six replications and repeated once. In total, 180 plants were used in each experi-ment, with 36 plants for each sampling time. The data for the ex-pansion of leaf scald lesions, gas-exchange traits, Chl a fluores-cence imaging, and pigment concentrations were combined after determination of the homogeneity of variance by Cochran’s test (15). The data were subjected to an analysis of variance, and the treatment means were then compared by the t test (P ≤ 0.05) using SAS software (release 8.02 Level 02M0 for Windows; SAS Institute, Inc., Cary, NC).
RESULTS
Lesion expansion. The size of the leaf scald lesions increased by 88% from 24 hai (1.5 mm) to 120 hai (24.5 mm) (Fig. 2).
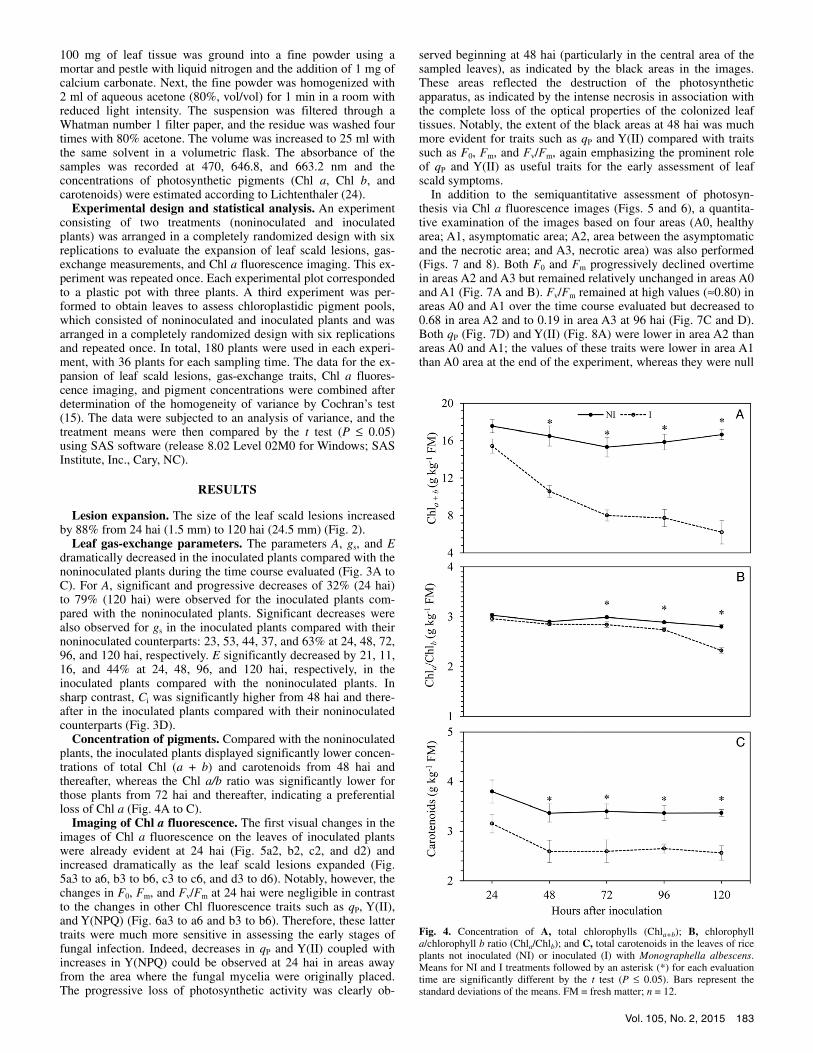
Leaf gas-exchange parameters. The parameters A, gs, and E dramatically decreased in the inoculated plants compared with the noninoculated plants during the time course evaluated (Fig. 3A to C). For A, significant and progressive decreases of 32% (24 hai) to 79% (120 hai) were observed for the inoculated plants com-pared with the noninoculated plants. Significant decreases were also observed for gs in the inoculated plants compared with their noninoculated counterparts: 23, 53, 44, 37, and 63% at 24, 48, 72, 96, and 120 hai, respectively. E significantly decreased by 21, 11, 16, and 44% at 24, 48, 96, and 120 hai, respectively, in the inoculated plants compared with the noninoculated plants. In sharp contrast, Ci was significantly higher from 48 hai and there-after in the inoculated plants compared with their noninoculated counterparts (Fig. 3D).
Concentration of pigments. Compared with the noninoculated plants, the inoculated plants displayed significantly lower concen-trations of total Chl (a + b) and carotenoids from 48 hai and thereafter, whereas the Chl a/b ratio was significantly lower for those plants from 72 hai and thereafter, indicating a preferential loss of Chl a (Fig. 4A to C).
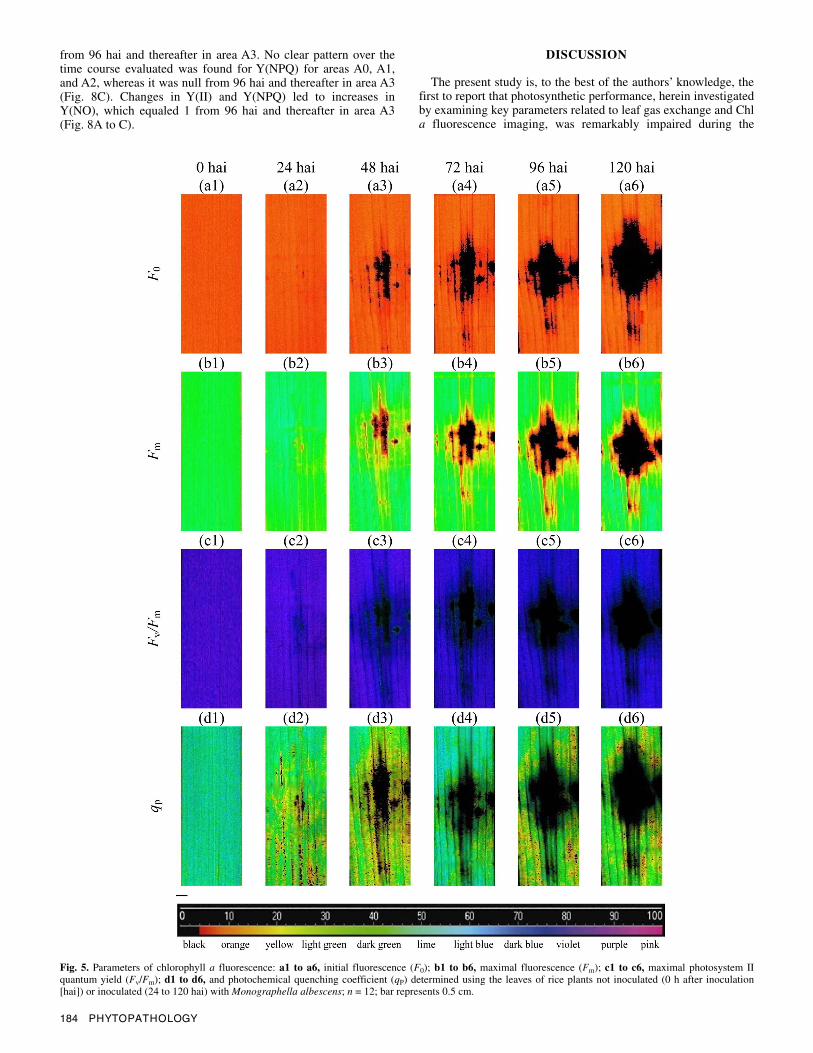
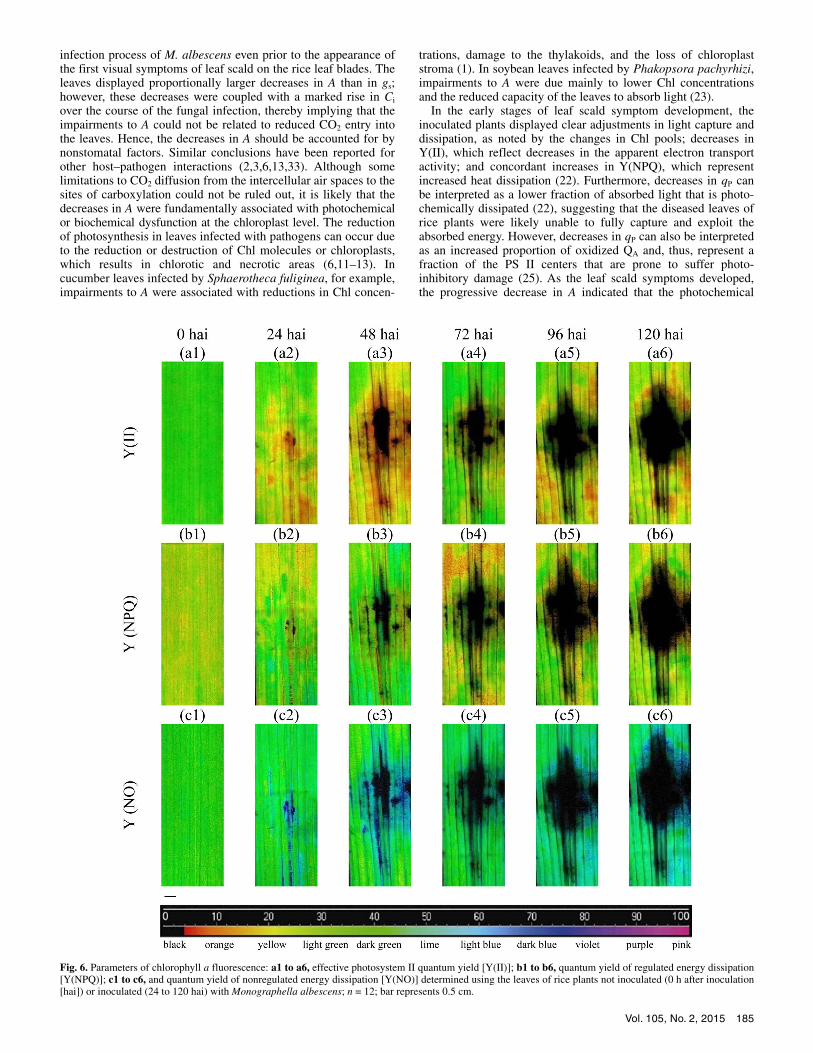
Imaging of Chl a fluorescence. The first visual changes in the images of Chl a fluorescence on the leaves of inoculated plants were already evident at 24 hai (Fig. 5a2, b2, c2, and d2) and increased dramatically as the leaf scald lesions expanded (Fig. 5a3 to a6, b3 to b6, c3 to c6, and d3 to d6). Notably, however, the changes in F0, Fm, and Fv/Fm at 24 hai were negligible in contrast to the changes in other Chl fluorescence traits such as qP, Y(II), and Y(NPQ) (Fig. 6a3 to a6 and b3 to b6). Therefore, these latter traits were much more sensitive in assessing the early stages of fungal infection. Indeed, decreases in qP and Y(II) coupled with increases in Y(NPQ) could be observed at 24 hai in areas away from the area where the fungal mycelia were originally placed. The progressive loss of photosynthetic activity was clearly ob-
served beginning at 48 hai (particularly in the central area of the sampled leaves), as indicated by the black areas in the images. These areas reflected the destruction of the photosynthetic apparatus, as indicated by the intense necrosis in association with the complete loss of the optical properties of the colonized leaf tissues. Notably, the extent of the black areas at 48 hai was much more evident for traits such as qP and Y(II) compared with traits such as F0, Fm, and Fv/Fm, again emphasizing the prominent role of qP and Y(II) as useful traits for the early assessment of leaf scald symptoms.
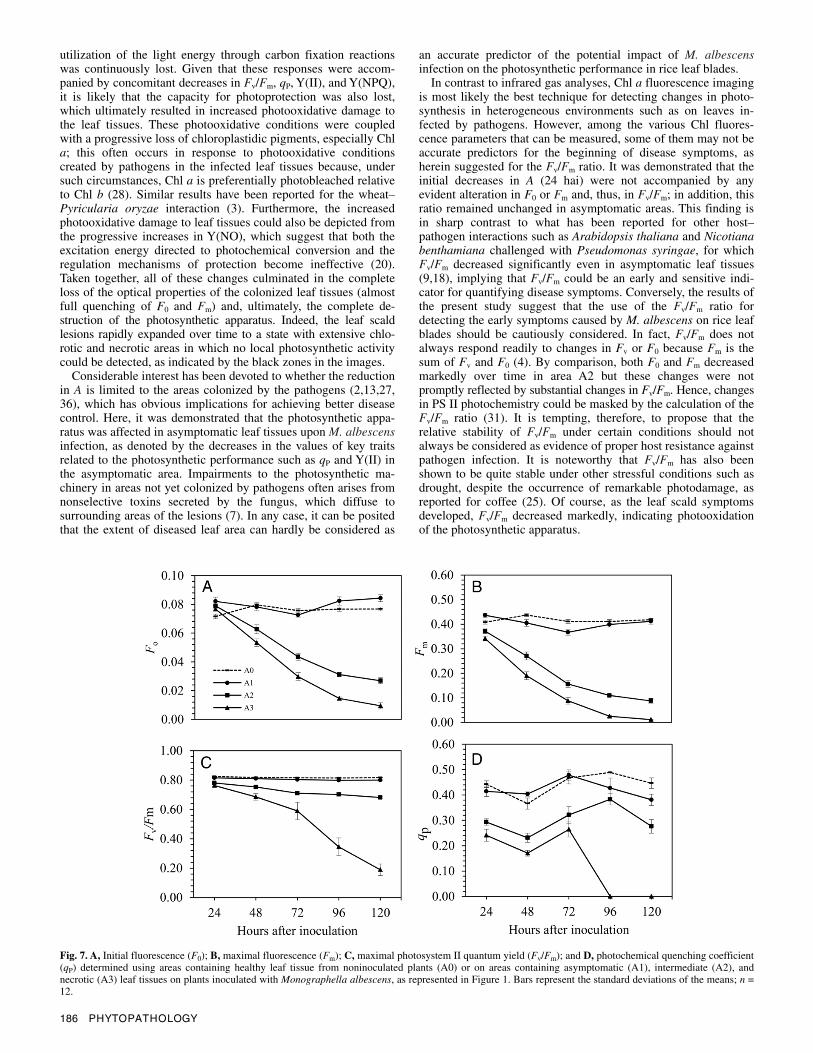
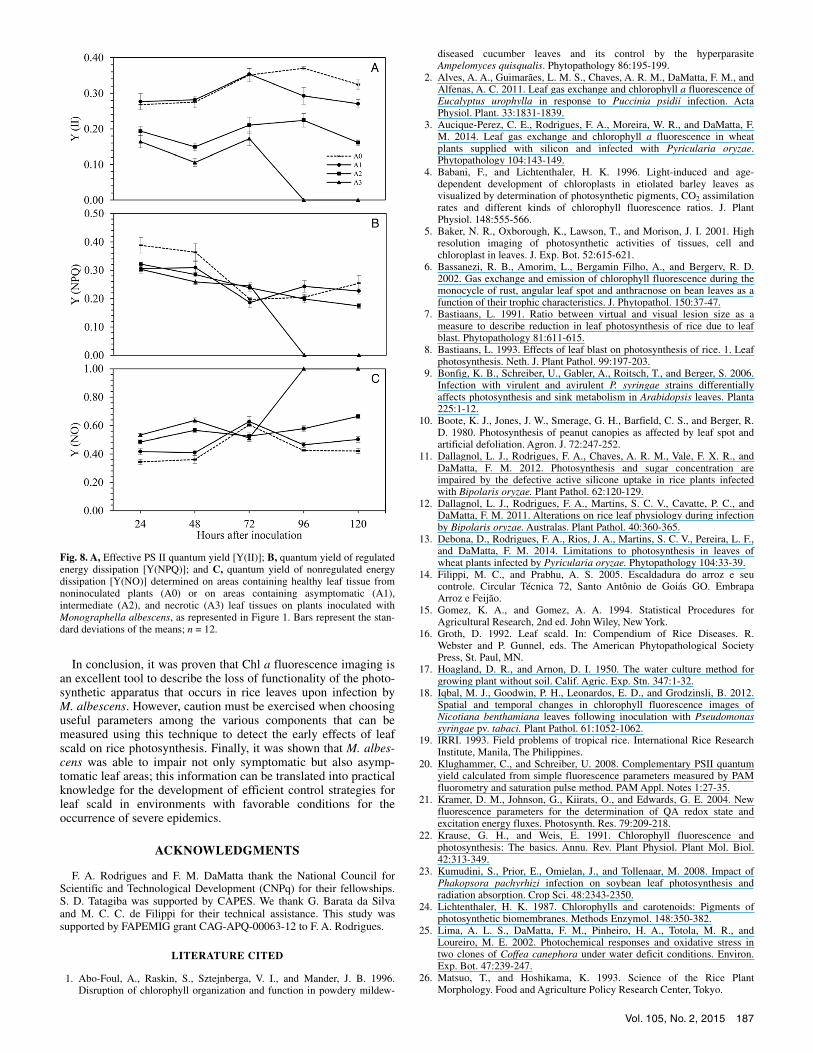
In addition to the semiquantitative assessment of photosyn-thesis via Chl a fluorescence images (Figs. 5 and 6), a quantita-tive examination of the images based on four areas (A0, healthy area; A1, asymptomatic area; A2, area between the asymptomatic and the necrotic area; and A3, necrotic area) was also performed (Figs. 7 and 8). Both F0 and Fm progressively declined overtime in areas A2 and A3 but remained relatively unchanged in areas A0 and A1 (Fig. 7A and B). Fv/Fm remained at high values (≈0.80) in areas A0 and A1 over the time course evaluated but decreased to 0.68 in area A2 and to 0.19 in area A3 at 96 hai (Fig. 7C and D). Both qP (Fig. 7D) and Y(II) (Fig. 8A) were lower in area A2 than areas A0 and A1; the values of these traits were lower in area A1 than A0 area at the end of the experiment, whereas they were null
Fig. 4. Concentration of A, total chlorophylls (Chla+b); B, chlorophyll a/chlorophyll b ratio (Chla/Chlb); and C, total carotenoids in the leaves of rice plants not inoculated (NI) or inoculated (I) with Monographella albescens. Means for NI and I treatments followed by an asterisk (*) for each evaluationtime are significantly different by the t test (P ≤ 0.05). Bars represent the standard deviations of the means. FM = fresh matter; n = 12.
184 PHYTOPATHOLOGY
from 96 hai and thereafter in area A3. No clear pattern over the time course evaluated was found for Y(NPQ) for areas A0, A1, and A2, whereas it was null from 96 hai and thereafter in area A3 (Fig. 8C). Changes in Y(II) and Y(NPQ) led to increases in Y(NO), which equaled 1 from 96 hai and thereafter in area A3 (Fig. 8A to C).
DISCUSSION
The present study is, to the best of the authors’ knowledge, the first to report that photosynthetic performance, herein investigated by examining key parameters related to leaf gas exchange and Chl a fluorescence imaging, was remarkably impaired during the
Fig. 5. Parameters of chlorophyll a fluorescence: a1 to a6, initial fluorescence (F0); b1 to b6, maximal fluorescence (Fm); c1 to c6, maximal photosystem II quantum yield (Fv/Fm); d1 to d6, and photochemical quenching coefficient (qP) determined using the leaves of rice plants not inoculated (0 h after inoculation[hai]) or inoculated (24 to 120 hai) with Monographella albescens; n = 12; bar represents 0.5 cm.
Vol. 105, No. 2, 2015 185
infection process of M. albescens even prior to the appearance of the first visual symptoms of leaf scald on the rice leaf blades. The leaves displayed proportionally larger decreases in A than in gs; however, these decreases were coupled with a marked rise in Ci over the course of the fungal infection, thereby implying that the impairments to A could not be related to reduced CO2 entry into the leaves. Hence, the decreases in A should be accounted for by nonstomatal factors. Similar conclusions have been reported for other host–pathogen interactions (2,3,6,13,33). Although some limitations to CO2 diffusion from the intercellular air spaces to the sites of carboxylation could not be ruled out, it is likely that the decreases in A were fundamentally associated with photochemical or biochemical dysfunction at the chloroplast level. The reduction of photosynthesis in leaves infected with pathogens can occur due to the reduction or destruction of Chl molecules or chloroplasts, which results in chlorotic and necrotic areas (6,11–13). In cucumber leaves infected by Sphaerotheca fuliginea, for example, impairments to A were associated with reductions in Chl concen-
trations, damage to the thylakoids, and the loss of chloroplast stroma (1). In soybean leaves infected by Phakopsora pachyrhizi, impairments to A were due mainly to lower Chl concentrations and the reduced capacity of the leaves to absorb light (23).
In the early stages of leaf scald symptom development, the inoculated plants displayed clear adjustments in light capture and dissipation, as noted by the changes in Chl pools; decreases in Y(II), which reflect decreases in the apparent electron transport activity; and concordant increases in Y(NPQ), which represent increased heat dissipation (22). Furthermore, decreases in qP can be interpreted as a lower fraction of absorbed light that is photo-chemically dissipated (22), suggesting that the diseased leaves of rice plants were likely unable to fully capture and exploit the absorbed energy. However, decreases in qP can also be interpreted as an increased proportion of oxidized QA and, thus, represent a fraction of the PS II centers that are prone to suffer photo-inhibitory damage (25). As the leaf scald symptoms developed, the progressive decrease in A indicated that the photochemical
Fig. 6. Parameters of chlorophyll a fluorescence: a1 to a6, effective photosystem II quantum yield [Y(II)]; b1 to b6, quantum yield of regulated energy dissipation[Y(NPQ)]; c1 to c6, and quantum yield of nonregulated energy dissipation [Y(NO)] determined using the leaves of rice plants not inoculated (0 h after inoculation[hai]) or inoculated (24 to 120 hai) with Monographella albescens; n = 12; bar represents 0.5 cm.
186 PHYTOPATHOLOGY
utilization of the light energy through carbon fixation reactions was continuously lost. Given that these responses were accom-panied by concomitant decreases in Fv/Fm, qP, Y(II), and Y(NPQ), it is likely that the capacity for photoprotection was also lost, which ultimately resulted in increased photooxidative damage to the leaf tissues. These photooxidative conditions were coupled with a progressive loss of chloroplastidic pigments, especially Chl a; this often occurs in response to photooxidative conditions created by pathogens in the infected leaf tissues because, under such circumstances, Chl a is preferentially photobleached relative to Chl b (28). Similar results have been reported for the wheat–Pyricularia oryzae interaction (3). Furthermore, the increased photooxidative damage to leaf tissues could also be depicted from the progressive increases in Y(NO), which suggest that both the excitation energy directed to photochemical conversion and the regulation mechanisms of protection become ineffective (20). Taken together, all of these changes culminated in the complete loss of the optical properties of the colonized leaf tissues (almost full quenching of F0 and Fm) and, ultimately, the complete de-struction of the photosynthetic apparatus. Indeed, the leaf scald lesions rapidly expanded over time to a state with extensive chlo-rotic and necrotic areas in which no local photosynthetic activity could be detected, as indicated by the black zones in the images.
Considerable interest has been devoted to whether the reduction in A is limited to the areas colonized by the pathogens (2,13,27, 36), which has obvious implications for achieving better disease control. Here, it was demonstrated that the photosynthetic appa-ratus was affected in asymptomatic leaf tissues upon M. albescens infection, as denoted by the decreases in the values of key traits related to the photosynthetic performance such as qP and Y(II) in the asymptomatic area. Impairments to the photosynthetic ma-chinery in areas not yet colonized by pathogens often arises from nonselective toxins secreted by the fungus, which diffuse to surrounding areas of the lesions (7). In any case, it can be posited that the extent of diseased leaf area can hardly be considered as
an accurate predictor of the potential impact of M. albescens infection on the photosynthetic performance in rice leaf blades.
In contrast to infrared gas analyses, Chl a fluorescence imaging is most likely the best technique for detecting changes in photo-synthesis in heterogeneous environments such as on leaves in-fected by pathogens. However, among the various Chl fluores-cence parameters that can be measured, some of them may not be accurate predictors for the beginning of disease symptoms, as herein suggested for the Fv/Fm ratio. It was demonstrated that the initial decreases in A (24 hai) were not accompanied by any evident alteration in F0 or Fm and, thus, in Fv/Fm; in addition, this ratio remained unchanged in asymptomatic areas. This finding is in sharp contrast to what has been reported for other host–pathogen interactions such as Arabidopsis thaliana and Nicotiana benthamiana challenged with Pseudomonas syringae, for which Fv/Fm decreased significantly even in asymptomatic leaf tissues (9,18), implying that Fv/Fm could be an early and sensitive indi-cator for quantifying disease symptoms. Conversely, the results of the present study suggest that the use of the Fv/Fm ratio for detecting the early symptoms caused by M. albescens on rice leaf blades should be cautiously considered. In fact, Fv/Fm does not always respond readily to changes in Fv or F0 because Fm is the sum of Fv and F0 (4). By comparison, both F0 and Fm decreased markedly over time in area A2 but these changes were not promptly reflected by substantial changes in Fv/Fm. Hence, changes in PS II photochemistry could be masked by the calculation of the Fv/Fm ratio (31). It is tempting, therefore, to propose that the relative stability of Fv/Fm under certain conditions should not always be considered as evidence of proper host resistance against pathogen infection. It is noteworthy that Fv/Fm has also been shown to be quite stable under other stressful conditions such as drought, despite the occurrence of remarkable photodamage, as reported for coffee (25). Of course, as the leaf scald symptoms developed, Fv/Fm decreased markedly, indicating photooxidation of the photosynthetic apparatus.
Fig. 7. A, Initial fluorescence (F0); B, maximal fluorescence (Fm); C, maximal photosystem II quantum yield (Fv/Fm); and D, photochemical quenching coefficient (qP) determined using areas containing healthy leaf tissue from noninoculated plants (A0) or on areas containing asymptomatic (A1), intermediate (A2), andnecrotic (A3) leaf tissues on plants inoculated with Monographella albescens, as represented in Figure 1. Bars represent the standard deviations of the means; n = 12.
Vol. 105, No. 2, 2015 187
In conclusion, it was proven that Chl a fluorescence imaging is an excellent tool to describe the loss of functionality of the photo-synthetic apparatus that occurs in rice leaves upon infection by M. albescens. However, caution must be exercised when choosing useful parameters among the various components that can be measured using this technique to detect the early effects of leaf scald on rice photosynthesis. Finally, it was shown that M. albes-cens was able to impair not only symptomatic but also asymp-tomatic leaf areas; this information can be translated into practical knowledge for the development of efficient control strategies for leaf scald in environments with favorable conditions for the occurrence of severe epidemics.
ACKNOWLEDGMENTS
F. A. Rodrigues and F. M. DaMatta thank the National Council for Scientific and Technological Development (CNPq) for their fellowships. S. D. Tatagiba was supported by CAPES. We thank G. Barata da Silva and M. C. C. de Filippi for their technical assistance. This study was supported by FAPEMIG grant CAG-APQ-00063-12 to F. A. Rodrigues.
LITERATURE CITED
1. Abo-Foul, A., Raskin, S., Sztejnberga, V. I., and Mander, J. B. 1996. Disruption of chlorophyll organization and function in powdery mildew-
diseased cucumber leaves and its control by the hyperparasite Ampelomyces quisqualis. Phytopathology 86:195-199.
2. Alves, A. A., Guimarães, L. M. S., Chaves, A. R. M., DaMatta, F. M., and Alfenas, A. C. 2011. Leaf gas exchange and chlorophyll a fluorescence of Eucalyptus urophylla in response to Puccinia psidii infection. Acta Physiol. Plant. 33:1831-1839.
3. Aucique-Perez, C. E., Rodrigues, F. A., Moreira, W. R., and DaMatta, F. M. 2014. Leaf gas exchange and chlorophyll a fluorescence in wheat plants supplied with silicon and infected with Pyricularia oryzae. Phytopathology 104:143-149.
4. Babani, F., and Lichtenthaler, H. K. 1996. Light-induced and age-dependent development of chloroplasts in etiolated barley leaves as visualized by determination of photosynthetic pigments, CO2 assimilation rates and different kinds of chlorophyll fluorescence ratios. J. Plant Physiol. 148:555-566.
5. Baker, N. R., Oxborough, K., Lawson, T., and Morison, J. I. 2001. High resolution imaging of photosynthetic activities of tissues, cell and chloroplast in leaves. J. Exp. Bot. 52:615-621.
6. Bassanezi, R. B., Amorim, L., Bergamin Filho, A., and Bergerv, R. D. 2002. Gas exchange and emission of chlorophyll fluorescence during the monocycle of rust, angular leaf spot and anthracnose on bean leaves as a function of their trophic characteristics. J. Phytopathol. 150:37-47.
7. Bastiaans, L. 1991. Ratio between virtual and visual lesion size as a measure to describe reduction in leaf photosynthesis of rice due to leaf blast. Phytopathology 81:611-615.
8. Bastiaans, L. 1993. Effects of leaf blast on photosynthesis of rice. 1. Leaf photosynthesis. Neth. J. Plant Pathol. 99:197-203.
9. Bonfig, K. B., Schreiber, U., Gabler, A., Roitsch, T., and Berger, S. 2006. Infection with virulent and avirulent P. syringae strains differentially affects photosynthesis and sink metabolism in Arabidopsis leaves. Planta 225:1-12.
10. Boote, K. J., Jones, J. W., Smerage, G. H., Barfield, C. S., and Berger, R. D. 1980. Photosynthesis of peanut canopies as affected by leaf spot and artificial defoliation. Agron. J. 72:247-252.
11. Dallagnol, L. J., Rodrigues, F. A., Chaves, A. R. M., Vale, F. X. R., and DaMatta, F. M. 2012. Photosynthesis and sugar concentration are impaired by the defective active silicone uptake in rice plants infected with Bipolaris oryzae. Plant Pathol. 62:120-129.
12. Dallagnol, L. J., Rodrigues, F. A., Martins, S. C. V., Cavatte, P. C., and DaMatta, F. M. 2011. Alterations on rice leaf physiology during infection by Bipolaris oryzae. Australas. Plant Pathol. 40:360-365.
13. Debona, D., Rodrigues, F. A., Rios, J. A., Martins, S. C. V., Pereira, L. F., and DaMatta, F. M. 2014. Limitations to photosynthesis in leaves of wheat plants infected by Pyricularia oryzae. Phytopathology 104:33-39.
14. Filippi, M. C., and Prabhu, A. S. 2005. Escaldadura do arroz e seu controle. Circular Técnica 72, Santo Antônio de Goiás GO. Embrapa Arroz e Feijão.
15. Gomez, K. A., and Gomez, A. A. 1994. Statistical Procedures for Agricultural Research, 2nd ed. John Wiley, New York.
16. Groth, D. 1992. Leaf scald. In: Compendium of Rice Diseases. R. Webster and P. Gunnel, eds. The American Phytopathological Society Press, St. Paul, MN.
17. Hoagland, D. R., and Arnon, D. I. 1950. The water culture method for growing plant without soil. Calif. Agric. Exp. Stn. 347:1-32.
18. Iqbal, M. J., Goodwin, P. H., Leonardos, E. D., and Grodzinsli, B. 2012. Spatial and temporal changes in chlorophyll fluorescence images of Nicotiana benthamiana leaves following inoculation with Pseudomonas syringae pv. tabaci. Plant Pathol. 61:1052-1062.
19. IRRI. 1993. Field problems of tropical rice. International Rice Research Institute, Manila, The Philippines.
20. Klughammer, C., and Schreiber, U. 2008. Complementary PSII quantum yield calculated from simple fluorescence parameters measured by PAM fluorometry and saturation pulse method. PAM Appl. Notes 1:27-35.
21. Kramer, D. M., Johnson, G., Kiirats, O., and Edwards, G. E. 2004. New fluorescence parameters for the determination of QA redox state and excitation energy fluxes. Photosynth. Res. 79:209-218.
22. Krause, G. H., and Weis, E. 1991. Chlorophyll fluorescence and photosynthesis: The basics. Annu. Rev. Plant Physiol. Plant Mol. Biol. 42:313-349.
23. Kumudini, S., Prior, E., Omielan, J., and Tollenaar, M. 2008. Impact of Phakopsora pachyrhizi infection on soybean leaf photosynthesis and radiation absorption. Crop Sci. 48:2343-2350.
24. Lichtenthaler, H. K. 1987. Chlorophylls and carotenoids: Pigments of photosynthetic biomembranes. Methods Enzymol. 148:350-382.
25. Lima, A. L. S., DaMatta, F. M., Pinheiro, H. A., Totola, M. R., and Loureiro, M. E. 2002. Photochemical responses and oxidative stress in two clones of Coffea canephora under water deficit conditions. Environ. Exp. Bot. 47:239-247.
26. Matsuo, T., and Hoshikama, K. 1993. Science of the Rice Plant Morphology. Food and Agriculture Policy Research Center, Tokyo.
Fig. 8. A, Effective PS II quantum yield [Y(II)]; B, quantum yield of regulatedenergy dissipation [Y(NPQ)]; and C, quantum yield of nonregulated energydissipation [Y(NO)] determined on areas containing healthy leaf tissue fromnoninoculated plants (A0) or on areas containing asymptomatic (A1),intermediate (A2), and necrotic (A3) leaf tissues on plants inoculated withMonographella albescens, as represented in Figure 1. Bars represent the stan-dard deviations of the means; n = 12.
188 PHYTOPATHOLOGY
27. Meyer, S., Saccardy-Adji, F., Rizza, F., and Genty, B. 2001. Inhibition of photosynthesis by Colletotrichum lindemuthianum in bean leaves determined by chlorophyll fluorescence imaging. Plant Cell Environ. 24:947-955.
28. Murchie, E. H., and Horton, P. 1997. Acclimation of photosynthesis to irradiance and spectral quality in British plant species: Chlorophyll content, photosynthetic capacity and habitat preference. Plant Cell Environ. 20:438-448.
29. Nunes, C. D. M., Ribeiro, A. S., and Terres, A. L. S. 2004. Principais doenças em arroz irrigado e seu controle. Pages 579-622 in: Arroz irrigado no sul do Brasil. A. S. Gomes and A. M. Magalhães, Jr., eds. Embrapa Informação Tecnológica, Brasília, DF.
30. Ou, S. H. 1985. Rice Diseases. Commonwealth Agricultural Bureau, Slough, UK.
31. Oxborough, K., and Baker, N. R. 1997. Resolving chlorophyll a fluorescence images of photosynthetic efficiency into photochemical and non-photochemical components—calculation of qP and Fv/Fm; without measuring Fo. Photosynth. Res. 54:135-142.
32. Pompelli, M. F., Martins, S. C. V., Antunes, W. C., Chaves, A. R. M., and
DaMatta, F. M. 2010. Photosynthesis and photoprotection in coffee leaves is affected by nitrogen and light availabilities in winter conditions. J. Plant Physiol. 167:1052-1060.
33. Resende, R. S., Rodrigues, F. A., Cavatte, P. C., Martins, S. C. V., Moreira, R. M., Chaves, A. R. M., and DaMatta, F. M. 2012. Leaf gas exchange and oxidative stress in sorghum plants supplied with silicon and infected by Colletotrichum sublineolum. Phytopathology 102:892-898.
34. Rolfe, S. A., and Scholes, J. D. 2010. Chlorophyll fluorescence imaging of plant-pathogen interactions. Protoplasma 247:163-175.
35. Rousseau, C., Belin, E., Bove, E., Rousseau, D., Fabre, F., Berruyer, R., Guillaumès, J., Manceau, C., Jacques, M. A., and Boureau, T. 2013. High throughput quantitative phenotyping of plant resistance using chlorophyll fluorescence image analysis. Plant Methods 9:17.
36. Shtienberg, D. 1992. Effects of foliar diseases on gas exchange processes: A comparative study. Phytopathology 82:760-765.
37. Tatagiba, S. D., Rodrigues, F. A., Filippi, M. C. C., Silva, G. B., and Silva, L. C. 2014. Physiological responses of rice plants supplied with silicon to Monographella albescens infection. J. Phytopathol. 162: 596-606.
Copyright © 2022 FDOKUMEN