
Excited state dynamics in chlorophyll-based antennae: the role of transfer equilibrium
17
Biophysical Journal Volume 66 March 1994 844-860 Excited State Dynamics in Chlorophyll-Based Antennae: The Role of Transfer Equilibrium Philip D. Laible, Warren Zipfel, and Thomas G. Owens Section of Plant Biology, Cornell University, Ithaca, New York 14853-5908 ABSTRACT We present computer simulations of excited state dynamics in models of PS I and PS 11 which are based upon known structural and spectral properties of the antennae. In particular, these models constrain the pigment binding sites to three-dimensional volumes determined from molecular properties of the antenna complexes. The simulations demonstrate that within a 10-30 ps after light absorption, rapid energy transfer among coupled antenna chlorophylls leads to a quasiequilibrium state in which the fraction of the excited state on any antenna chlorophyll, normalized to the total excited state remaining on the model, remains constant with time. We describe this quasiequilibrium state as a "transfer equilibrium" (TE) state because of its dependence on the rates of processes that couple excited state motion and quenching in the antenna as well as on the individual antenna site energies and temperature. The TE state is not a true equilibrium in that loss of the excited state primarily due to photochemistry (but also due to fluorescence, thermal emission, and intersystem crossing) continues once TE is es- tablished. Depending on the dynamics of the system, the normalized distribution of excited state at TE may differ substantially from the Boltzmann distribution (the state of the model at infinite time in the absence of any avenues for decay of excited state). The models predict lifetimes, equilibration times, and photochemical yields that are in agreement with experimental data and affirm trap-limited dynamics in both photosystems. The rapid occurrence of TE states implies that any excited state dynamics that depends on antenna structure and excitation wavelength must occur before the TE state is established. We demonstrate that the excited state distribution of the TE state is central to determining the excited state lifetime and quantum efficiency of photochemistry. INTRODUCTION The primary functions of light-harvesting complexes in the early events in photosynthesis are the absorption of light and efficient transfer of excited state energy to the reaction center where primary charge separation occurs. During the time the excited state resides in the antenna, the processes of fluo- rescence, thermal emission, and intersystem crossing com- pete for the excited state and ultimately limit the photochemi- cal efficiency of the system. However, it is in part due to the presence of these measurable competing processes that in- formation on the structure and function of the antennae may be obtained. Time-resolved fluorescence studies are one way excited state motion and trapping can be probed through the measurement of excited state decay components (exponen- tially decaying lifetimes and associated amplitudes) and their dependence upon excitation and emission wavelengths (Holzwarth, 1989; 1991). Many time-resolved fluorescence studies on various pho- tosynthetic systems reveal complex decay-associated spec- tra. Based upon the shape of the spectra and the relative magnitude of the lifetimes, the decays are assigned to pro- cesses within the functional antenna/reaction center com- plex. Several processes are known to contribute to the ob- servation of multiexponential decays. Among these processes are bulk transfer from short to long wavelength- Received for publication 7 June 1993 and in final form 6 December 1993. Address reprint requests to Thomas G. Owens at the Section of Plant Bi- ology, Cornell University, Ithaca, NY 14853-5908. Tel.: 607-255-8516; Fax: 607-255-5407; e-mail: [email protected]. C 1994 by the Biophysical Society 0006-3495/94/03/844/17 $2.00 absorbing pigments leading to spectral redistribution of ex- cited state (Turconi et al., 1993; Zipfel, 1993), electron trans- port (Schatz et al., 1988; Zipfel, 1993), antenna size heterogeneity or state transitions (Roelofs et al., 1992; Bruce et al. 1985; 1986), and transfer between spatially and/or spec- trally segregated pigment pools within chl-based (Knox and Lin, 1988; Lin and Knox, 1988; 1991; Wittmershaus et al., 1985; Turconi et al., 1993) and phycobilisome-based (Biggins and Bruce, 1988; Suter and Holzwarth, 1987; Holzwarth et al., 1987; Mullineaux and Holzwarth, 1991) antennae at both room and low temperature. Although an understanding of the origin and nature of multiexponential decays is essential for the complete understanding of excited state motion and trapping, this report focuses primarily on the photochemically limited lifetimes of excited states which dominate decays in photosynthetic systems with high photochemical efficiencies. At the present time, there are substantial experimental limitations (primarily time resolution and spectral overlap) which preclude the determination of detailed structural fea- tures of photosynthetic antennae from experimentally deter- mined excited state lifetimes and amplitudes (Wittmershaus et al., 1985; Lin and Knox, 1988; 1991; Biggins and Bruce, 1988; Suter and Holzwarth, 1987; Mullineaux and Holzwarth, 1991; Jean et al., 1989). Computer simulations of excited state dynamics in models of photosynthetic antennae may be complementary to experimental studies, providing information that is critical to the interpretation of experi- mental data, as well as a detailed knowledge of how antenna structure can dictate excited state motion and trapping. The time-dependent motion and decay of the excited state in pho- tosynthetic systems has been simulated using random walk 844
-
Upload
independent -
Category
Documents
-
view
2 -
download
0
Transcript of Excited state dynamics in chlorophyll-based antennae: the role of transfer equilibrium
Biophysical Journal Volume 66 March 1994 844-860
Excited State Dynamics in Chlorophyll-Based Antennae:The Role of Transfer Equilibrium
Philip D. Laible, Warren Zipfel, and Thomas G. OwensSection of Plant Biology, Cornell University, Ithaca, New York 14853-5908
ABSTRACT We present computer simulations of excited state dynamics in models of PS I and PS 11 which are based uponknown structural and spectral properties of the antennae. In particular, these models constrain the pigment binding sites tothree-dimensional volumes determined from molecular properties of the antenna complexes. The simulations demonstrate thatwithin a 10-30 ps after light absorption, rapid energy transfer among coupled antenna chlorophylls leads to a quasiequilibriumstate in which the fraction of the excited state on any antenna chlorophyll, normalized to the total excited state remaining onthe model, remains constant with time. We describe this quasiequilibrium state as a "transfer equilibrium" (TE) state becauseof its dependence on the rates of processes that couple excited state motion and quenching in the antenna as well as on theindividual antenna site energies and temperature. The TE state is not a true equilibrium in that loss of the excited state primarilydue to photochemistry (but also due to fluorescence, thermal emission, and intersystem crossing) continues once TE is es-tablished. Depending on the dynamics of the system, the normalized distribution of excited state at TE may differ substantiallyfrom the Boltzmann distribution (the state of the model at infinite time in the absence of any avenues for decay of excited state).The models predict lifetimes, equilibration times, and photochemical yields that are in agreement with experimental data andaffirm trap-limited dynamics in both photosystems. The rapid occurrence of TE states implies that any excited state dynamicsthat depends on antenna structure and excitation wavelength must occur before the TE state is established. We demonstratethat the excited state distribution of the TE state is central to determining the excited state lifetime and quantum efficiency ofphotochemistry.
INTRODUCTION
The primary functions of light-harvesting complexes in theearly events in photosynthesis are the absorption of light andefficient transfer of excited state energy to the reaction centerwhere primary charge separation occurs. During the time theexcited state resides in the antenna, the processes of fluo-rescence, thermal emission, and intersystem crossing com-pete for the excited state and ultimately limit the photochemi-cal efficiency of the system. However, it is in part due to thepresence of these measurable competing processes that in-formation on the structure and function of the antennae maybe obtained. Time-resolved fluorescence studies are one wayexcited state motion and trapping can be probed through themeasurement of excited state decay components (exponen-tially decaying lifetimes and associated amplitudes) and theirdependence upon excitation and emission wavelengths(Holzwarth, 1989; 1991).Many time-resolved fluorescence studies on various pho-
tosynthetic systems reveal complex decay-associated spec-tra. Based upon the shape of the spectra and the relativemagnitude of the lifetimes, the decays are assigned to pro-cesses within the functional antenna/reaction center com-plex. Several processes are known to contribute to the ob-servation of multiexponential decays. Among theseprocesses are bulk transfer from short to long wavelength-
Received for publication 7June 1993 and in final form 6 December 1993.Address reprint requests to Thomas G. Owens at the Section of Plant Bi-ology, Cornell University, Ithaca, NY 14853-5908. Tel.: 607-255-8516;Fax: 607-255-5407; e-mail: [email protected] 1994 by the Biophysical Society0006-3495/94/03/844/17 $2.00
absorbing pigments leading to spectral redistribution of ex-cited state (Turconi et al., 1993; Zipfel, 1993), electron trans-port (Schatz et al., 1988; Zipfel, 1993), antenna sizeheterogeneity or state transitions (Roelofs et al., 1992; Bruceet al. 1985; 1986), and transfer between spatially and/or spec-trally segregated pigment pools within chl-based (Knox andLin, 1988; Lin and Knox, 1988; 1991; Wittmershaus et al.,1985; Turconi et al., 1993) and phycobilisome-based(Biggins and Bruce, 1988; Suter and Holzwarth, 1987;Holzwarth et al., 1987; Mullineaux and Holzwarth, 1991)antennae at both room and low temperature. Although anunderstanding of the origin and nature of multiexponentialdecays is essential for the complete understanding of excitedstate motion and trapping, this report focuses primarily on thephotochemically limited lifetimes of excited states whichdominate decays in photosynthetic systems with highphotochemical efficiencies.At the present time, there are substantial experimental
limitations (primarily time resolution and spectral overlap)which preclude the determination of detailed structural fea-tures of photosynthetic antennae from experimentally deter-mined excited state lifetimes and amplitudes (Wittmershauset al., 1985; Lin and Knox, 1988; 1991; Biggins and Bruce,1988; Suter and Holzwarth, 1987; Mullineaux andHolzwarth, 1991; Jean et al., 1989). Computer simulations ofexcited state dynamics in models of photosynthetic antennaemay be complementary to experimental studies, providinginformation that is critical to the interpretation of experi-mental data, as well as a detailed knowledge of how antennastructure can dictate excited state motion and trapping. Thetime-dependent motion and decay of the excited state in pho-tosynthetic systems has been simulated using random walk
844
Transfer Equilibrium in Photosynthetic Antennae
theory (Montroll, 1969), transition probability matrix meth-ods (Seely, 1973; Fetisova et al., 1985), and analytical(Knox, 1968; Pearlstein, 1982; 1984; 1992) or numerical(Shipman, 1980; Jean et al., 1989; Beauregard et al., 1991;Zipfel, 1993) solutions to the Pauli master equation.
In many studies, models of reaction center/core antennacomplexes were severely constrained in order to insure asystematic (analytical) solution to the Pauli master equation.For example, the requirement for equal Forster rate constantsbetween all nearest-neighbor sites restricts models to thosewith isoenergetic antenna pigments placed at lattice siteswithin a regular array with an internally located reactioncenter (Pearlstein, 1982). Nonetheless, these simulation tech-niques have provided valuable information on excited statedynamics in a variety of photosynthetic antenna systems. Astechniques matured, allowing one to obtain numerical solu-tions to more complex models of photosynthetic systems, thetwo-dimensional (2D) nature of the initial models persisted(Jean et al., 1989; Beauregard et al., 1991). Zipfel (1993)has demonstrated that the use of 2D models places signifi-cant limitations on the interpretation of excited state dy-namics when comparing computer simulations with experi-mental results.
In the present study, we introduce models for studyingexcited state dynamics ofPS I and PS II in which the pigmentbinding sites are constrained to volumes (three-dimensional)determined from known properties of the antenna com-
plexes. The simulation technique that we have chosen is toobtain an exact numerical solution to the Pauli master equa-tion; this procedure places no structural or functional limi-tations on the model. The phenomenon which we explore isnot new but is similar to the zero-mode dominance of ana-
lytical solutions proposed by Pearlstein (1982; 1984; 1991),Knox (1968; 1986), and Borisov (1990) and that briefly sug-gested in the discussion of Robinson (1967), Ross and Calvin(1967), and Zankel and Clayton (1969). Several new termsare defined in the discussion of this phenomenon and are
summarized in Appendix A.
SIMULATION METHODSThe procedure that we have adopted for computer simulationof excited state migration and trapping dynamics in modelphotosynthetic systems is essentially that described in Jeanet al. (1989) with some important modifications. Our ob-jective is to use as much structural information and appro-
priate physical laws to describe the system. Where infor-mation is lacking, assumptions are made (Justified by ourcurrent state-of-knowledge) while still applying the most ap-
propriate physical laws.Initially, a physical model is constructed by assigning po-
sitions, orientations, and site energies (absorption maxima)to each of the N pigment binding sites in the model. Pairwisetransfer of energy between all sites is assumed to occur viaan incoherent hopping mechanism described by Forster(1965). This assumption is not required by the simulationprotocol as monopole or higher order Coulombic interactionscould be included (Chang, 1977) as could exchange inter-
actions for closer pigment pairs. Even in the event of strongcoupling between sites, Knox and Gulen (1993) suggestedthat F6rster is still an appropriate description of the coupling.Orientation factors are explicitly calculated. With the ex-
ception of the reaction center (see below), all of the orien-tations are randomly assigned giving a range of orientationfactors between 0 and 4.A value of 1.0 is chosen for the index of refraction (TJ) for
nearest-neighbor pairs in the Forster transfer equation; valuesof q between 1.2 and 1.4 were randomly assigned for all otherpairs. As discussed in Moog et al. (1984), the value of qreflects the properties of the medium (amino acids, otherpigments, ions, water molecules, etc.) found between thedonor and acceptor molecules which are not already takeninto account by absorption of the pigments. Since neighbor-ing pigments are bound in close proximity (mean spacing of10-15 A), absorption already takes into account index ofrefraction in the immediate vicinity of nearest-neighbor pig-ments (Moog et al., 1984).
In all models the reaction center is assumed to be dimericwith double the oscillator strength of the antenna pigments.For simplicity, a single unimolecular rate constant (kf =
(1 ns)-1) for decay of excited states on each pigment site isassigned representing the sum of the rate constants for fluo-rescence, thermal emission, and intersystem crossing. How-ever, the simulation protocol allows for unique assignmentof rate constants for all sites. The photochemical rate con-
stant, kp, on the reaction center is assigned a value of (2.8ps)-1. Photochemistry is modeled as an irreversible process.Thus, our simulations are designed to examine excited statedynamics without the coupling of reversible electron trans-port steps. Such coupling may result in additional contribu-tions to the fluorescence decay kinetics (Schatz et al., 1988;Zipfel, 1993). However, Zipfel (1993) also showed withsimulations using similar models that neglecting the contri-butions of electron transport does not alter the fundamentalconclusions of this paper.
The Pauli master equation describing this system ofNcoupledfirst-order differential equations (whereNalso refers to the num-ber of pigment-binding sites in the model) is given by
dp(t)/dt = W * p(t) (1)where p(t) is a vector of site occupation probabilities, andW isanN X Nrate matrix ofpairwie transfer and unimolecular decayrates. The general solution to the Pauli master equation is con-
veniently expressed asN time-dependent site occupation prob-abilities, where the time-dependent site occupation probabilityfor pigment i, pi(t), is given by
pi(t) = clxileA1 + c2xi2eA2t + * * * + cNxjAeAN (2)Here, the A1 terms refer to the eigenvalues of the rate matrix', the
1 In our models in which losses of excited state are irreversible, all of theeigenvalues of the rate matrix must be negative. We have ordered the eig-envalues according to Xj such that A1 < Aj with 1 < j c N. The sub-script j refers to a specific eigenvalue, not pigment.
Laible et al. 845
Volume 66 March 1994
x, terms refer to eigenvector elements corresponding to pigmenti and eigenvalue j, and the cj terms refer to constants determinedsuch that pi(t) terms at t = 0 are equal to the initial distributionpi(O) terms. The initial excited state distribution, p(0), may beassigned in any arbitary fashion with the constraints that lp,(0)= 1 and pi(0) . 0 for all i. However, to duplicate experimentalconditions, the value of p(0) is determined by the relative ab-sorption cross-section of each individual pigment at the excita-tion wavelength. Simulation results presented are averages over15 random configurations. Averaging over three times as manyconfigurations did not quantitatively change the results as thepigment binding sites in the models are highly constrained (seebelow). Simulated lifetimes (i = -1/AX) are nearly identical toexperimental lifetimes which would be obtained by fittingsingle-photon counting data in the absence of noise and in theabsence of an instrument response function. In the absence ofelectron transfer and antenna-size heterogeneity, the largesteigenvalue gives rise to the photochemically limited life-time T (where T = -1/Al). Photochemical yield 4p iscalculated as:
kp JFp, (t) dt
Op = (3)kp pr (t)dt + kf fp (t)dt
An important modification from the procedure of Jeanet al. (1989) is our use of realistic, asymmetric spectral line-shapes for chlorophyll (chl) a absorption and emission basedupon the in vitro data of Shipman and Housman (1979).Previous simulations (Jean et al., 1989; Beauregard et al.,1991; Jia et al., 1992) assumed simple Gaussian lineshapesfor chl a, determined the forward transfer rates by numericalintegration of Forster overlap integrals, and calculated re-verse transfer rates using the Boltzmann factors (eAE/kt; withthe energy difference measured as differences in peak en-ergies of the pigments) as a criterion for detailed balance. Inthe present study, values of the Forster rates for both forwardand reverse transfer were determined using analytic expres-sions for the overlap integral based upon assumed chl a line-shapes having constant absorption and emission bandwidths(Shipman and Housman, 1979) and a constant Stokes shiftof 150 cm-'. Typically, the range of nearest neighbor transferrate constants were between 1-30 and 0.01-8 ps-1 for for-ward and reverse transfer, respectively.
In our simulations we used an improved procedure to cal-culate the eigenvalues, eigenvectors, and inverse of the eig-envector matrix. The details of this procedure are presentedin Zipfel (1993). Briefly, the procedure utilizes a similaritytransform of the rate matrix to take advantage of the prop-erties ofsymmetric matrices. The transform is based upon theBoltzmann equilibrium distribution of the excited state; thus,detailed balance is an inherent property of the system. Thetechnique removes potential problems due to the accumu-lation of floating point errors in calculating the eigensystemof large, real matrices (Zipfel, 1993).
MODELS
PS I core antenna/reaction center complexOur PS I model consists of the reaction center/core antennacomplex which binds P700 and about 120 core chl a pig-ments in a dimeric protein complex made up of the 83-kDaproducts of the psaA and psaB genes (Golbeck and Bryant,1991; Bruce and Malkin, 1988; Bryant et al., 1987; Golbeck,1987). Based on structural studies of the bacterial reactioncenter (Deisenhofer and Michel, 1989), LHC II (Kuhlbrandtand Wang, 1991), and PS I (Krauss et al., 1993), pigmentbinding sites are restricted to the a-helices in the membrane-spanning region.The pigment binding volume of the complex is estimated
from the molecular mass of the pigment-binding proteins(166 kDa) and from a specific molecular volume of 3300i3/kDa (Kuhlbrandt and Wang, 1991). Although this value
is larger than that for average proteins (1200-1400 A3/kDa(Teller, 1976)) or the bacterial RC (1500 A3/kDa (Deisen-hofer and Michel, 1989)), it was selected because the protein/pigment ratio in the PS I core (1.28 kDa/pigment) is moresimilar to that of LHC 11 (1.67 kDa/pigment) than the bac-terial reaction center (24.0 kDa/pigment). By restricting thepigment binding sites to the membrane-spanning region(40% of the protein mass based upon hydropathy plots (Fishet al., 1985)), we arrive at a binding volume of 219,000 Alper complex. Mean pigment spacing in the model is esti-mated assuming that this binding volume was filled with 120sites in either face-centered or body-centered lattices. Thegeometric mean spacing for these two lattice structures is12.8 A. This compares with nearest neighbor spacings in therange of 8-15 A in PS I (Krauss et al., 1993) and 9-14 A inLHC II (Kuhlbrandt and Wang, 1991).The binding volume of the complex is modeled to be an
ellipsoid with its minor axis (40 A) normal to the membraneplane and a major axis of 104 A in the membrane plane.These dimensions are nearly identical to the membrane-spanning region of the PS I core complex determined byx-ray crystallography (Krauss et al., 1993). P700 is posi-tioned on one end of the minor axis on the surface of thecomplex (Krauss et al., 1993). The complex also binds sev-eral components involved in vectorial electron transport fromP700 to the opposite side of the membrane (Golbeck andBryant, 1991; Krauss et al., 1993). Due to restrictions im-posed by the presence of electron transport components(Pearlstein, 1992), the four nearest neighbors of P700 areplaced at adjacent corners of a body-centered cube (withP700 in the central site). The plane defined by the four near-est neighbors is perpendicular to the membrane normal andinterior to the binding volume. Two of these nearest neigh-bors are assigned absorption maxima at 705 nm (Butler,1961). The presence of antenna spectral forms with S, en-ergies below that of P700 are required to account for thesteady state emission of PS I (Zipfel, 1993; Turconi et al.,1993) and to model the temperature-dependent decay of ex-cited states in PS I (Werst et al., 1992; Jia et al., 1992). Theremaining pigment sites are randomly distributed with a
846 Biophysical Joumal
Transfer Equilibrium in Photosynthetic Antennae
minimum separation of 12.0 and a mean spacing of 12.8 A.The chl a spectral forms modeled in the complex are thosedetermined by Gaussian deconvolution of the PS I core com-plex absorption (Owens et al., 1988) with the inclusion oftwo705-nm pigments (Table 1). However, models including alarger number of spectral forms (e.g., those described byTrissl et al. (1993)) do not differ quantitatively from thosereported here. P700 is modeled as a dimer of chl a with anoscillator strength twice that of the antenna chls. The tran-sition dipole of P700 is set parallel to the membrane normal(Rutherford and Setif, 1990); all other orientations were ran-domly assigned.
PS 11 core antenna/reaction center complex withassociated LHC 11
The core antenna complex of PS II binds about 45 chl apigments in a dimeric protein complex made up of the 45-51and 40-45-kDa proteins referred to as CP47 and CP43, re-spectively (Hansson and Wydrzynski, 1990). The reactioncenter P680 and five additional pigments are bound in theD1-D2-cytochrome b559 reaction center complex (Nanba andSatoh, 1987). Because there is no evidence that energy trans-fer between the core antenna and reaction center complexesis any slower than transfer within the core antenna, the re-action center/core antenna aggregate is modeled with P680included within the binding volume of the core antenna apo-proteins. The pigment binding volume of the core complexis estimated from the molecular mass (k90 kDa) and fromspecific molecular volume of 3300 A3/kDa. By restrictingthe pigment binding sites to the membrane-spanning region(-"50% of the protein mass based upon hydropathy plots (Altet al., 1984)), we arrive at a binding volume of 120,000A3 per core complex. Mean pigment spacing in the modelsis estimated assuming that this binding volume was filledwith 45 sites in either face-centered or body-centered lattices.The geometric mean spacing for these two lattices structuresis 14.5 A.The binding volume of the complex is modeled as an el-
lipsoid with its minor axis (40 A) normal to the membraneplane and a major axis of 70 A in the membrane plane. Forcomparison, Dekker et al. (1988) estimated the dimensionsof a PS II reaction center/core complex from Synechococcusto be 130 X 75 X 60A (note that our model lacks the volumecontributed by the reaction center complex). The position of
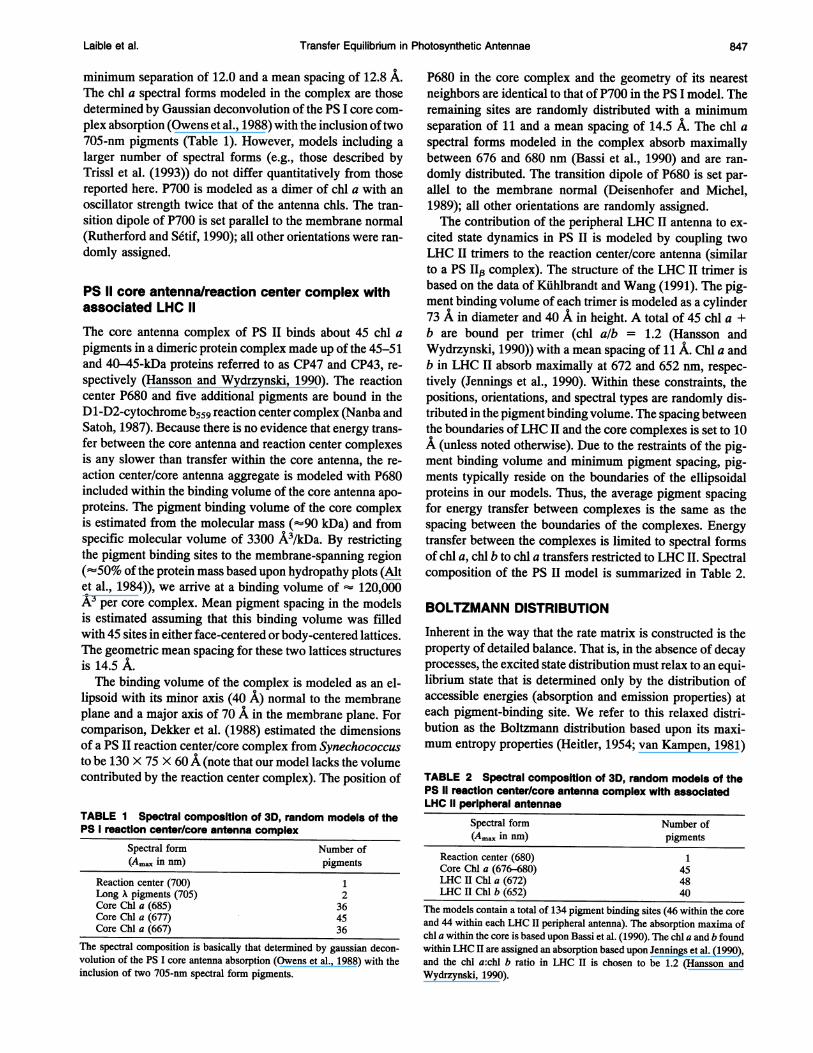
TABLE I Spectral composition of 3D, random models of thePS I reaction center/core antenna complex
Spectral form Number of(Am,, in nm) pigments
Reaction center (700) 1Long A pigments (705) 2Core Chl a (685) 36Core Chl a (677) 45Core Chl a (667) 36
The spectral composition is basically that determined by gaussian decon-
P680 in the core complex and the geometry of its nearestneighbors are identical to that of P700 in the PS I model. Theremaining sites are randomly distributed with a minimumseparation of 11 and a mean spacing of 14.5 A. The chl aspectral forms modeled in the complex absorb maximallybetween 676 and 680 nm (Bassi et al., 1990) and are ran-domly distributed. The transition dipole of P680 is set par-allel to the membrane normal (Deisenhofer and Michel,1989); all other orientations are randomly assigned.The contribution of the peripheral LHC II antenna to ex-
cited state dynamics in PS II is modeled by coupling twoLHC II trimers to the reaction center/core antenna (similarto a PS II1 complex). The structure of the LHC II trimer isbased on the data of Kuhlbrandt and Wang (1991). The pig-ment binding volume of each trimer is modeled as a cylinder73 A in diameter and 40 A in height. A total of 45 chl a +b are bound per trimer (chl a/b = 1.2 (Hansson andWydrzynski, 1990)) with a mean spacing of 11 A. Chl a andb in LHC II absorb maximally at 672 and 652 nm, respec-tively (Jennings et al., 1990). Within these constraints, thepositions, orientations, and spectral types are randomly dis-tributed in the pigment binding volume. The spacing betweenthe boundaries ofLHC II and the core complexes is set to 10A (unless noted otherwise). Due to the restraints of the pig-ment binding volume and minimum pigment spacing, pig-ments typically reside on the boundaries of the ellipsoidalproteins in our models. Thus, the average pigment spacingfor energy transfer between complexes is the same as thespacing between the boundaries of the complexes. Energytransfer between the complexes is limited to spectral formsof chl a, chl b to chl a transfers restricted to LHC II. Spectralcomposition of the PS II model is summarized in Table 2.
BOLTZMANN DISTRIBUTIONInherent in the way that the rate matrix is constructed is theproperty of detailed balance. That is, in the absence of decayprocesses, the excited state distribution must relax to an equi-librium state that is determined only by the distribution ofaccessible energies (absorption and emission properties) ateach pigment-binding site. We refer to this relaxed distri-bution as the Boltzmann distribution based upon its maxi-mum entropy properties (Heitler, 1954; van Kampen, 1981)
TABLE 2 Spectral composition of 3D, random models of thePS 11 reaction center/core antenna complex with associatedLHC 11 peripheral antennae
Spectral form Number of(Am. in nm) pigments
Reaction center (680) 1Core Chl a (676-680) 45LHC II Chl a (672) 48LHC II Chl b (652) 40
The models contain a total of 134 pigment binding sites (46 within the coreand 44 within each LHC II peripheral antenna). The absorption maxima ofchl a within the core is based upon Bassi et al. (1990). The chl a and b foundwithin LHC II are assigned an absorption based upon Jennings et al. (1990),and the chl a:chl b ratio in LHC II is chosen to be 1.2 (Hansson andWydrzynski, 1990).
volution of the PS I core antenna absorption (Owens et al., 1988) with theinclusion of two 705-nm spectral form pigments.
Laible et al. 847
Volume 66 March 1994
and its equivalence to the most probable or maximum like-lihood description of the system (Atkins, 1990). The Boltz-mann distribution for any given model p(B) is comprised ofN individual pigment distributions, pi(B). This Boltzmanndistribution is identical to the stationary state in stochasticphysics (van Kampen, 1981).
Spectral composition is the sole factor contributing to theBoltzmann distribution, p(B). In a homogeneous antennamodel with an isoenergetic reaction center, all pi(B) are ex-actly 1/N (includingprc(B), the Boltzmann distribution on thereaction center). In models with spectral heterogeneity,Prc(B) > 1/N when all antenna pigments have a peak ab-sorptions at higher energy than that of the reaction center.The models presented by Seely (1973), Shipman (1980),Fetisova et al. (1985), Jean et al. (1989), Pullerits andFreiberg (1991), and Jia et al. (1992), and the PS I and PSII models described above are examples of models with suchspectral heterogeneity, whereas the canonical models inKnox (1968) and Pearlstein (1982, 1984, 1992) are not. Notethat p(B) and pi(B) are not affected by spatial arrangementor distribution; therefore, funnel and random models with theidentical spectral composition will have identical p(B).The Boltzmann distribution is temperature-dependent due
to the effect of temperature on absorption and emission line-shapes. With decreasing temperature, rate constants for bothforward and reverse transfer will decrease due to smalleroverlap of donor and acceptor states. This decrease will bemost pronounced for reverse transfer because the 0,1 and 1,0vibrational bands contribute almost nothing to the overlapintegral. In contrast, forward transfer may depend largely onoverlap of the vibrational bands at decreased temperature.The term Boltzmann distribution (or thermal equilibrium)
has been previously used to describe the decay of a systemwhen the shape of the time-dependent emission spectra nolonger changes with increasing time (van Grondelle, 1985;Feick et al., 1980; Rijgersberg et al., 1980; Schatz et al.,1988; Holzwarth, 1991; Sundstrom et al., 1986; Borisov,1990; Owens et al., 1987,1988, 1989; McCauley et al., 1989;Shipman, 1980). In our terminology, this state is referred toas a transfer equilibrium (TE) state. Boltzmann equilibriumis reserved for the distribution reached at long times in mod-els without decay. In subsequent sections, we will show thatp(TE) can vary substantially from p(B) due to the nature ofthe dynamics of the system. Some insight into the differencebetween the Boltzmann (or thermal) and transfer equilibriumdistributions have been alluded to by Zankel and Clayton(1969), Rijgersberg et al. (1980), Pearlstein (1982), andKnox (1968).
TRANSFER EQUILIBRIUM PHENOMENON
Equation 2 demonstrates that the decay of the system,P(t) = lpi(t), is determined by the eigenvalues (Aj) andthe pre-exponential weighting factors (cjxij). In the limitas t 00, the contribution to P(t) from all eigenvalues exceptone (the smallest or dominant eigenvalue A1) will have van-ished. Defining te as the time at which A1 dominates P(t), it
can be shown from Equation 2 that at t > te, the fraction ofthe excited state on any pigment (i) when normalized to thetotal excited state remaining on the model,,,i(TE), will re-main constant
(TE) = pi(t>t) Xi
N=l Pmt> tc) m=l Xml(4)
where xi, is the ith element in the eigenvector of A1. Forconvenience, te is defined as the time at which^,,(t) is within5% of^C(TE), where^#c(t) and^,,,(TE) are the normalizedamount of excited state on the reaction center at time t andat TE, respectively. Equation 4 shows that the normalizedeigenvector elements of A1 (where the sum of eigenvectorelements is the normalization factor) are equivalent to thesite-dependent fractions of the total excited state remainingon the array at t > te. We have described this state of P(t) asthe TE state. The TE state is not a true equilibrium in thatirreversible loss of the excited state continues (via photo-chemistry, fluorescence, etc.). However, the rate of loss oneach site is such that the normalized distribution remainsconstant. This situation is equivalent to the zero-mode domi-nance predicted from analytical solutions to excited statedynamics found by Pearlstein (1982, 1984, 1992), Knox(1968), and Schatz et al. (1988) and to the quasi-steady-statedescription of Borisov (1990).
EVIDENCE FOR THE OCCURRENCE OFTRANSFER EQUILIBRIUM IN CHLOROPHYLLANTENNAE
There exists compelling experimental evidence for the oc-currence of TE states in the chl antennae of photosyntheticsystems. Sundstrom et al. (1986) discussed the equilibrationof exciton density in the spectrally distinct pigment pools intwo bacterial antenna systems during the lifetime of the ex-cited state. Owens et al. (1987, 1988, 1989) concluded fromseveral different types of experiments that excited statesequilibrate or delocalize among the PS I core chl a spectralforms on time scales which were short compared with thephotochemically limited lifetime. Holzwarth and coworkers(Turconi et al., 1993; Holzwarth, 1987; Lee et al., 1989)reported complex decay-associated spectra ( < 20 ps) in bothPS I and PS II of green algae and higher plants. These com-ponents were also attributed to equilibration of the excitedstate among the antenna spectral forms on times which areshort compared to the excited state lifetimes. McCauley et al.(1989) and Owens et al. (1989) described blue-shifted fluo-rescence emission when the long wavelength edge of antennaabsorption was excited. Similarly, Owens et al. (1988) andTrissl et al. (1993) observed that photochemically limitedlifetimes in PS I were independent of excitation on the blueor red edge of the antenna absorption, indicative of delo-calization of the excited state among antenna spectral forms.Finally, Schatz et al. (1988), proposed a model for excita-tion motion and trapping in PS II based upon experimentaldata (Schatz et al., 1987) which includes rapid equilibra-tion of the excitation among antenna spectral forms and
Biophysical Journal848
Transfer Equilibrium in Photosynthetic Antennae
the reaction center on time scales comparable or shorterthan the time resolution of a single-photon-counting fluo-rescence apparatus. Together, these data strongly indicatethat TE states are rapidly established among the chl anten-nae of PS I and PS II.
Simulations of excitation dynamics in model photosyn-thetic antennae have also demonstrated the characteristics ofTE states. Shipman (1980) stressed the importance of de-trapping in order to create a near-thermal equilibrium be-tween the antenna and the reaction center. Jean et al. (1989)showed that the time-dependent evolution of the total emis-sion from PS I-like models changed only during the first 10ps and remained constant thereafter. Beauregard et al.(1991), using similar simulation protocols, reported thatequilibration of the excited state between various spectralforms in spectrally heterogeneous antenna occurs on rela-tively short time scales. In both studies, equilibration wasdependent on rapid (--1 ps) transfer between antenna sitesand is supported by theoretical studies (Owens et al., 1987;Schatz et al., 1988) and by the close packing of chl pigmentsin vivo (Owens et al., 1989; Kuhlbrandt and Wang, 1991;Krauss et al., 1993). The early occurrence of TE states in theexcited state decay is completely consistent with the trap-limited description of excited state dynamics in both PS I andPS II (Holzwarth, 1991; Turconi et al., 1993). In bacterialmodels, Borisov (1990) also suggested that the observationof a TE-like state was a criterion for assigning trap-limitedkinetics.
TRANSFER EQUILIBRIUM STATES IN MODELSOF PS I AND PS 11
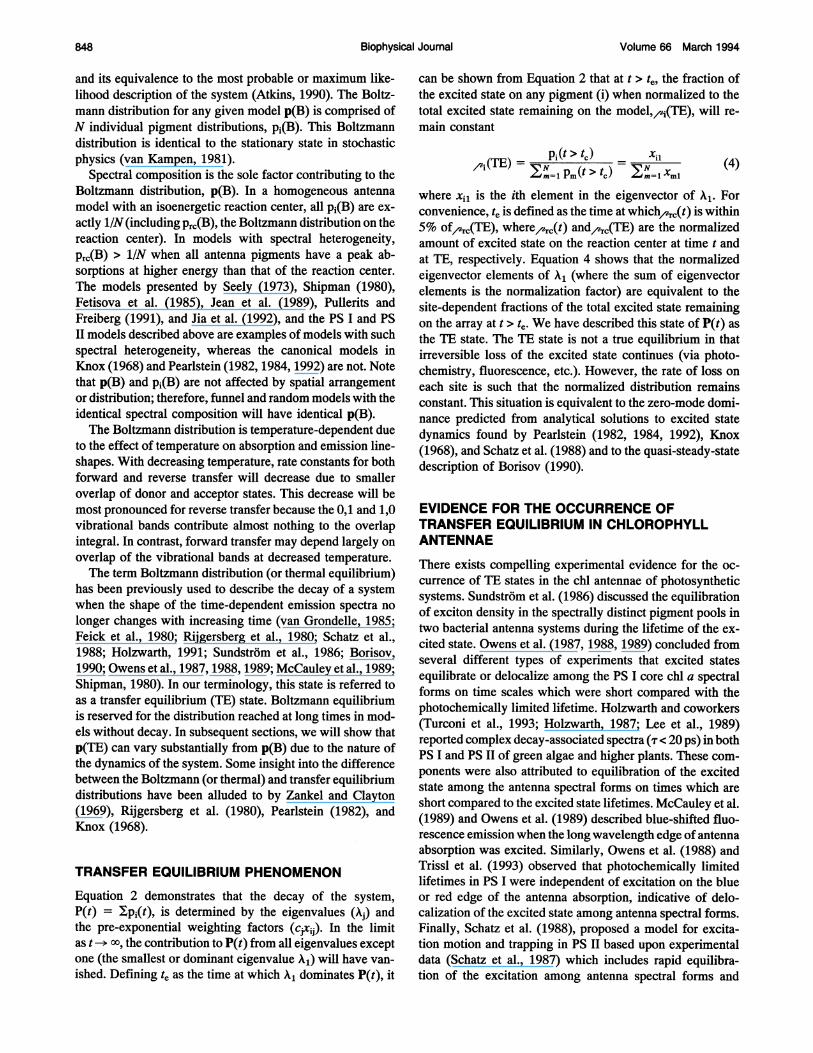
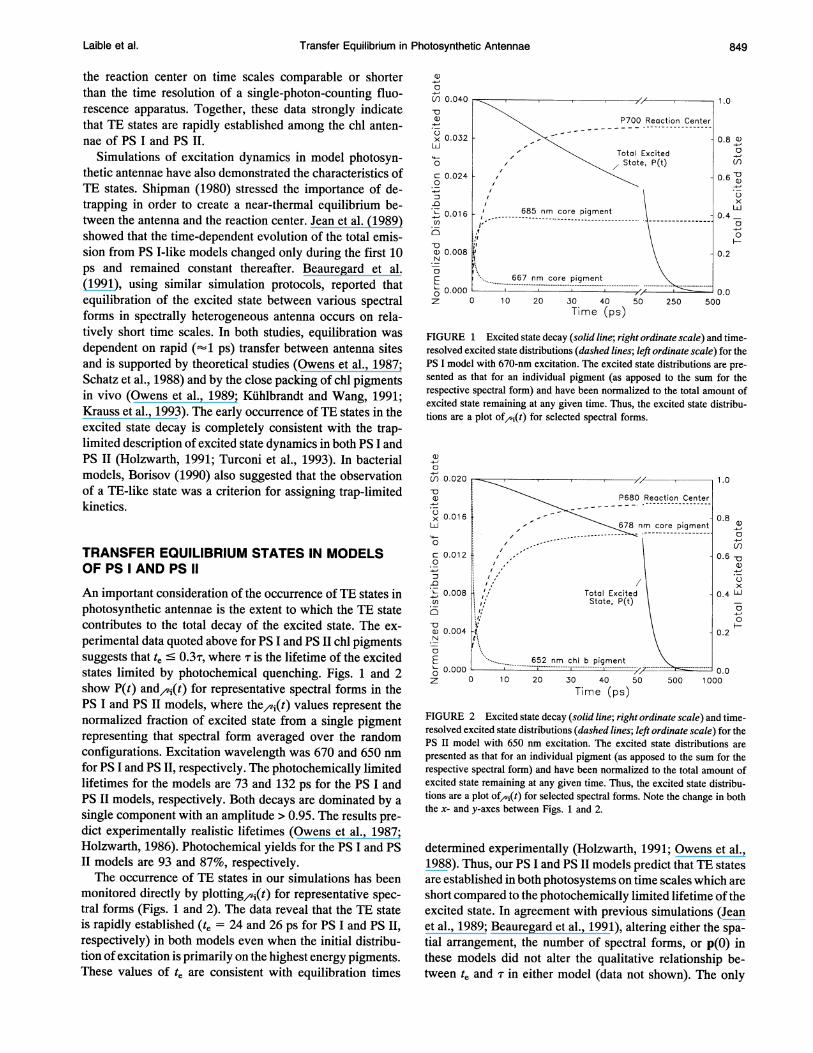
An important consideration of the occurrence of TE states inphotosynthetic antennae is the extent to which the TE statecontributes to the total decay of the excited state. The ex-perimental data quoted above for PS I and PS IT chl pigmentssuggests that te ' 03T, where T is the lifetime of the excitedstates limited by photochemical quenching. Figs. 1 and 2show P(t) and,(t) for representative spectral forms in thePS I and PS II models, where the,(t) values represent thenormalized fraction of excited state from a single pigmentrepresenting that spectral form averaged over the randomconfigurations. Excitation wavelength was 670 and 650 nmfor PS I and PS II, respectively. The photochemically limitedlifetimes for the models are 73 and 132 ps for the PS I andPS II models, respectively. Both decays are dominated by asingle component with an amplitude > 0.95. The results pre-dict experimentally realistic lifetimes (Owens et al., 1987;Holzwarth, 1986). Photochemical yields for the PS I and PSII models are 93 and 87%, respectively.The occurrence of TE states in our simulations has been
monitored directly by plotting/,i(t) for representative spec-tral forms (Figs. 1 and 2). The data reveal that the TE stateis rapidly established (te = 24 and 26 ps for PS I and PS II,respectively) in both models even when the initial distribu-tion of excitation is primarily on the highest energy pigments.These values of te are consistent with equilibration times
a)
C)
(1 0.040
-,oa)
0x 0.032LLJ
0
C 0.0240
:-Q'- 0.016u)
Q) 0.008N
Eo 0.000z (
1.0
P700 Reaction Center
0.88
Total Excited I,State, P(t) (f)
0.6
x685 nm core pigment 0.4_-
0\ ~~~~F--0.2
667 nm core pigment.................................................................................... . ......................
0.010 20 30 40 50 250 500
Time (ps)0
FIGURE 1 Excited state decay (solid line; right ordinate scale) and time-resolved excited state distributions (dashed lines; left ordinate scale) for thePS I model with 670-nm excitation. The excited state distributions are pre-sented as that for an individual pigment (as apposed to the sum for therespective spectral form) and have been normalized to the total amount ofexcited state remaining at any given time. Thus, the excited state distribu-tions are a plot of^(t) for selected spectral forms.
ci)
(n 0.020
C)
x 0.016LL
0
C 0.0120
' 0.008
C)
a) 0.004N
E
z c
1.0
0.8IIOIf)-I-II n0.6 -0I a)
C)
0
Ix0.4 LXJ
IF0.2
cl. -------l 0.0500 1000
652 nm chl b pigment"I .. ..
0 10 20 30 40 50Time (ps)
FIGURE 2 Excited state decay (solid line; right ordinate scale) and time-resolved excited state distributions (dashed lines; left ordinate scale) for thePS II model with 650 nm excitation. The excited state distributions arepresented as that for an individual pigment (as apposed to the sum for therespective spectral form) and have been normalized to the total amount ofexcited state remaining at any given time. Thus, the excited state distribu-tions are a plot of,-i(t) for selected spectral forms. Note the change in boththe x- and y-axes between Figs. 1 and 2.
determined experimentally (Holzwarth, 1991; Owens et al.,1988). Thus, our PS I and PS II models predict that TE statesare established in both photosystems on time scales which areshort compared to the photochemically limited lifetime of theexcited state. In agreement with previous simulations (Jeanet al., 1989; Beauregard et al., 1991), altering either the spa-tial arrangement, the number of spectral forms, or p(O) inthese models did not alter the qualitative relationship be-tween te and T in either model (data not shown). The only
Laible et al. 849

Volume 66 March 1994
critical factor is that energy transfer between adjacent pig-ment sites is rapid, on a time scale of a few picoseconds orless (Jean et al., 1989).Log plots of P(t) for the same two models (Fig. 3) reveal
that in both cases the decay is single exponential except attimes less that about 0.5te. The initial nonexponential decayis a manifestation of the structure-dependent dynamics thatoccurs during the transition from p(O) to the TE state(Turconi et al., 1993). Hereafter, decay resulting from asingle exponential will be inferred from horizontal plots of
,-i(t), since establishment of the TE state corresponds to P(t)being determined by a single eigenvalue, A1 (Eqs. 2 and 4).Figs. 1 and 2 show that all pigments reach TE simultaneouslyindicating that the occurrence ofTE can be monitored via anynormalized pigment distribution.
These simulations and the experimental data quoted abovestrongly suggest the occurrence of TE states among thecoupled chl pigments of PS I and PS II, and that the TE statemay dominate P(t). The occurrence of a TE state implies thatall of the structure-dependent excited state dynamics (thatcan be probed by varying excitation wavelength) occur ontime scales that are short compared to te. If te is comparableto the lifetime of the excited state, then these structure-dependent dynamics dominate the decay. On the other hand,if te < T, the characteristics of the TE state will dominate thetotal decay. Under these circumstances, decay componentsassociated with the transition from any arbitrary p(O) to theTE state (those that may be most revealing in terms of an-tenna structure), probably occur on time scales which are ator below the limits of detection using single photon countingtechniques (Beauregard et al., 1991; Turconi et al., 1993).
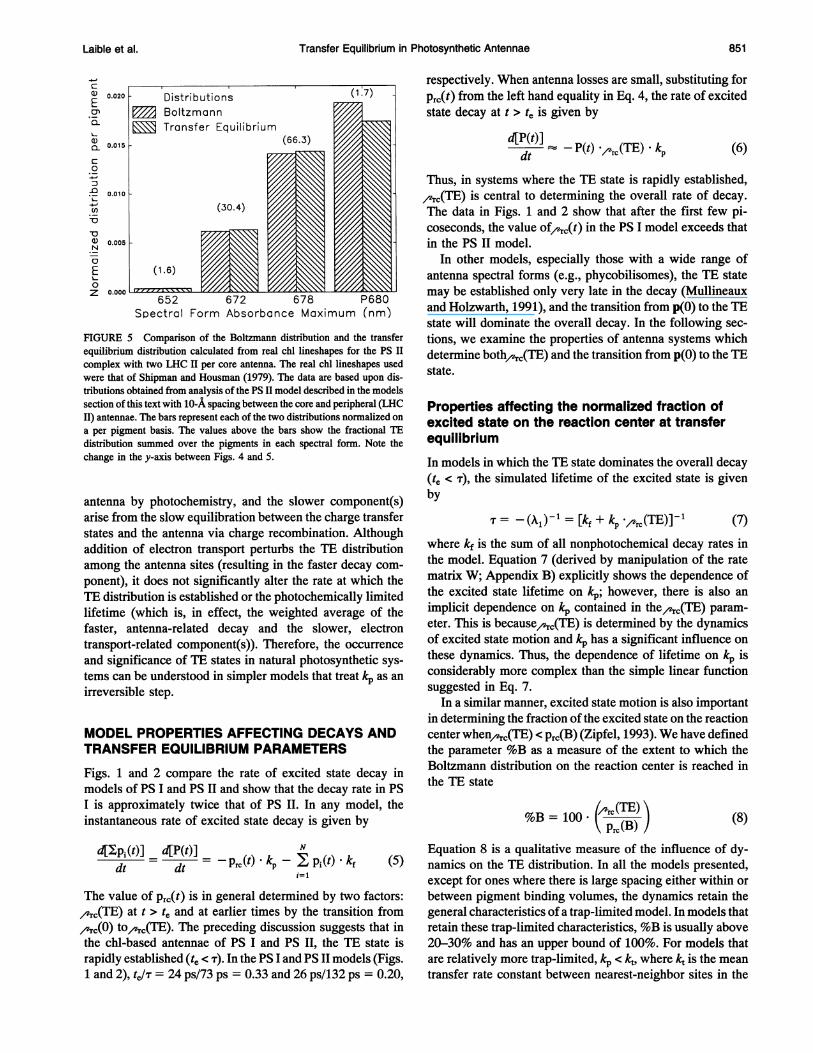
Figs. 4 and 5 show a comparison of the TE and Boltzmanndistributions for the spectral forms contained in the PS I andPS II models. The bars report normalized distributions on aper pigment basis, while the numbers above the bars indicatethe total normalized distribution residing on the spectral format TE. Due to the large photochemical losses that occur one°
2 3
Time (ps)
FIGURE 3 Log plot of excited state decays for the PS I and PS II modelswith 670- and 650-nm excitation, respectively, at both short (main) and long(inset) times.
c)
Q)
E
i)
0-
(0
o
0
z-
0.14l
Distributions0.12 Boltzmann
B Transfer Equilibrium0.10 -
0.08 (3.6)
0.06
0.04-
0.02 -(50.7)(4.3) (23.9) pM
0.00 P7Z-~667 677 685 P700 705
Spectral Form Absorbance Maximum (nm)
FIGURE 4 Comparison of the Boltzmann distribution and the transferequilibrium distribution calculated from real chl lineshapes for the coreantenna/reaction center complex of PS I. The real chl lineshapes used werethat of Shipman and Housman (1979). The data are based upon distributionsobtained from analysis of the PS I model described in the models sectionof this text. The bars represent each of the two distributions normalized ona per pigment basis. The values above the bars show the fractional TEdistribution summed over the pigments in each spectral form.
the reaction center, the TE distribution on the reaction centeris less than the corresponding Boltzmann distribution. As aresult, TE distributions on antenna pigments are generallygreater than their Boltzmann distributions. However, thoseantenna pigments that are directly coupled to the reactioncenter (regardless of their energies) exhibit a TE distributionwhich is lower than that predicted at Boltzmann equilibriumbecause of the influence of photochemical losses on the re-action center (Fig. 4). Deviations from Boltzmann equilib-rium at TE are more dramatic in the PS I model due to thedepth of the trap and the inclusion of low energy pigmentsclose to the reaction center (see below). The equilibrium issuch that the excited state is almost entirely distributed on chla with only a small fraction (< 2%) found on chl b in the PSII model (Fig. 5).
In the models presented above, photochemistry wastreated as an irreversible reaction. Recent experimental(Schatz et al., 1987) and theoretical studies (Schatz et al.,1988; Kallebring and Hansson, 1991) and computer simu-lations (Zipfel, 1993) have shown that reversible electrontransport reactions can show up as components of fluores-cence decay. In agreement with experiment (Turconi et al.,1993; Schatz et al., 1987), computer simulations have shownthat electron transfer influences fluorescence decays in PS IImore markedly than in PS I (Zipfel, 1993). Simulation of asystem that includes reversible electron transport requires theaddition of nonfluorescent sites to the model. Partitioning ofexcited state between fluorescent and nonfluorescent sitesresults in a splitting of the photochemically limited lifetime(determined in the absence of electron transfer) into onefaster and one or more slower decay components. The fastercomponent represents the removal of excited states from the
850 Biophysical Joumal
Transfer Equilibrium in Photosynthetic Antennae
E 0.020EaQ)
CL 0.015
C0
.D 0.010
(n-Q
-a°) 0.005N
C
0Z 0.000
,F
F
T(17)Distributions
m BoltzmannTransfer Equilibrium
(66.3)
(30.4)
(1.6)
652 672 678 P680Spectral Form Absorbance Maximum (nm)
FIGURE 5 Comparison of the Boltzmann distribution and the transferequilibrium distribution calculated from real chl lineshapes for the PS IIcomplex with two LHC II per core antenna. The real chl lineshapes usedwere that of Shipman and Housman (1979). The data are based upon dis-tributions obtained from analysis of the PS II model described in the modelssection of this text with 10-A spacing between the core and peripheral (LHCII) antennae. The bars represent each of the two distributions normalized ona per pigment basis. The values above the bars show the fractional TEdistribution summed over the pigments in each spectral form. Note thechange in the y-axis between Figs. 4 and 5.
antenna by photochemistry, and the slower component(s)arise from the slow equilibration between the charge transferstates and the antenna via charge recombination. Althoughaddition of electron transport perturbs the TE distributionamong the antenna sites (resulting in the faster decay com-ponent), it does not significantly alter the rate at which theTE distribution is established or the photochemically limitedlifetime (which is, in effect, the weighted average of thefaster, antenna-related decay and the slower, electrontransport-related component(s)). Therefore, the occurrenceand significance of TE states in natural photosynthetic sys-tems can be understood in simpler models that treat kp as anirreversible step.
MODEL PROPERTIES AFFECTING DECAYS ANDTRANSFER EQUILIBRIUM PARAMETERS
Figs. 1 and 2 compare the rate of excited state decay inmodels of PS I and PS II and show that the decay rate in PSI is approximately twice that of PS II. In any model, theinstantaneous rate of excited state decay is given by
dIjlpi(t)] _d[P(t)] _Ndt = dt = -Prc(t) kp- pi(t)
-
kf (5)i=1
The value of Prc(t) is in general determined by two factors:,vr(TE) at t > te and at earlier times by the transition from,'r(0) to^,(TE). The preceding discussion suggests that inthe chl-based antennae of PS I and PS II, the TE state israpidly established (t, <4). In the PS I and PS II models (Figs.1 and 2), tjT = 24 ps/73 ps = 0.33 and 26 ps/132 ps = 0.20,
respectively. When antenna losses are small, substituting forPrc(t) from the left hand equality in Eq. 4, the rate of excitedstate decay at t > te is given by
d[P(t)]-P(t)-P(t) yr(TE) . k (6)
Thus, in systems where the TE state is rapidly established,,eC(TE) is central to determining the overall rate of decay.The data in Figs. 1 and 2 show that after the first few pi-coseconds, the value of^c(t) in the PS I model exceeds thatin the PS II model.
In other models, especially those with a wide range ofantenna spectral forms (e.g., phycobilisomes), the TE statemay be established only very late in the decay (Mullineauxand Holzwarth, 1991), and the transition from p(O) to the TEstate will dominate the overall decay. In the following sec-tions, we examine the properties of antenna systems whichdetermine both,-^c(TE) and the transition from p(O) to the TEstate.
Properties affecting the normalized fraction ofexcited state on the reaction center at transferequilibrium
In models in which the TE state dominates the overall decay(te < T), the simulated lifetime of the excited state is givenby
T = -(AI) -1 = [kf + kp *,t?rc (TE)] - 1 (7)where kf is the sum of all nonphotochemical decay rates inthe model. Equation 7 (derived by manipulation of the ratematrix W; Appendix B) explicitly shows the dependence ofthe excited state lifetime on kp; however, there is also animplicit dependence on kp contained in the,,c(TE) param-eter. This is because,-c(TE) is determined by the dynamicsof excited state motion and kp has a significant influence onthese dynamics. Thus, the dependence of lifetime on kp isconsiderably more complex than the simple linear functionsuggested in Eq. 7.
In a similar manner, excited state motion is also importantin determining the fraction of the excited state on the reactioncenter when,,c(TE) < Prc(B) (Zipfel, 1993). We have definedthe parameter %B as a measure of the extent to which theBoltzmann distribution on the reaction center is reached inthe TE state
(8)%B = 1oo. (r(TE)Prc(B)
Equation 8 is a qualitative measure of the influence of dy-namics on the TE distribution. In all the models presented,except for ones where there is large spacing either within orbetween pigment binding volumes, the dynamics retain thegeneral characteristics of a trap-limited model. In models thatretain these trap-limited characteristics, %B is usually above20-30% and has an upper bound of 100%. For models thatare relatively more trap-limited, kp < kt, where k, is the meantransfer rate constant between nearest-neighbor sites in the
Laible et al. 851
Volume 66 March 1994
model (Pearlstein, 1982; 1984), we observe that %B and thedecay of P(t) are extremely sensitive to the ratio kp/k,. Incontrast, models that are relatively more diffusion limitedexhibit lifetimes and %B values that are largely independentof kp/k, (not shown).
Combining Eqs. 7 and 8 gives
T -(X)-l =[kf + kp Prc(B) %B(100
which shows an explicit parameterization of the separate ef-fects of variations in antenna spectral composition, directlyaffecting Prc(B) and indirectly affecting the dynamics of ex-
cited state motion (contained within the %B term), on thephotochemically limited lifetime. In addition to the explicitand implicit dependencies of T on kp, the lifetime of theexcited state also depends on the dynamics of the excitedstate motion among all of the coupled pigment-binding sitesin the model (including the reaction center). In models thatreasonably seek to mimic natural photosynthetic systems,analysis of the effects of excited state dynamics on %Bmust include contributions from transfer between pigmentsites within physically separable complexes (e.g., the PS Icore complex or LHC 1) as well as transfer between thesecomplexes.The effects of varied coupling between pigments within a
defined physical complex were examined using the PS I re-
action center/core antenna complex. The coupling betweenpigments was varied by altering the pigment-binding volumeof the complex, and thus the mean spacing between pigmentbinding sites. The PS I model described above was con-
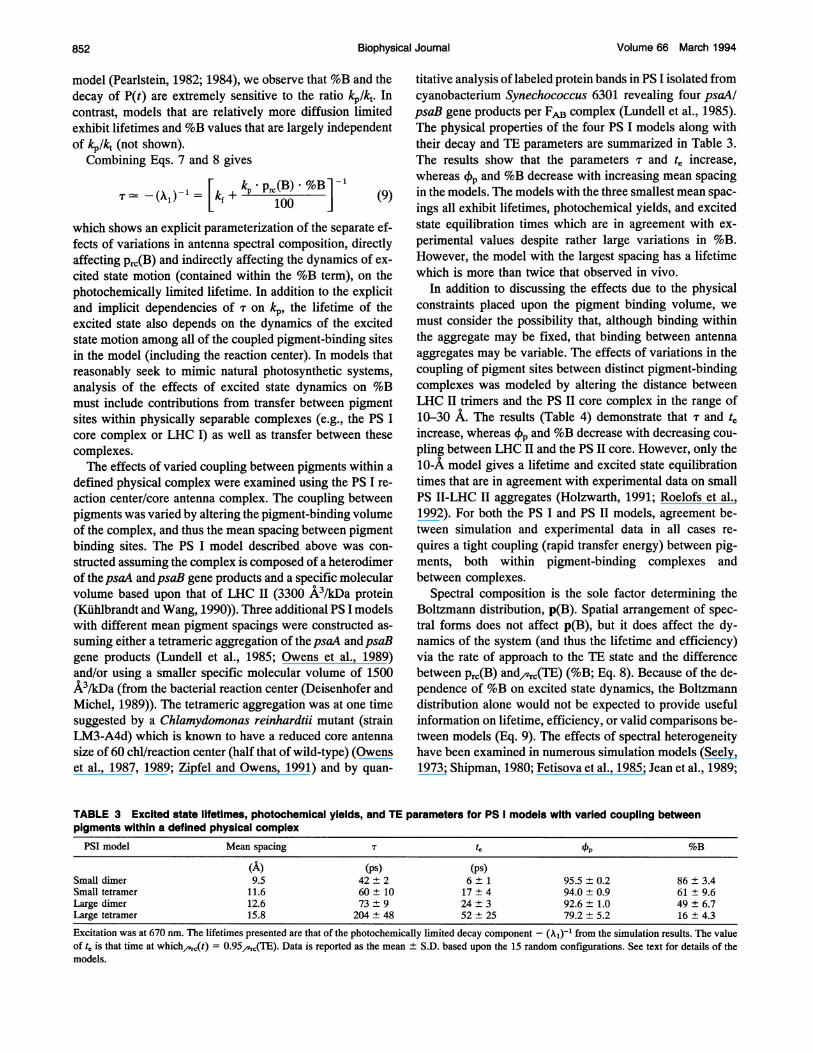
structed assuming the complex is composed of a heterodimerof thepsaA andpsaB gene products and a specific molecularvolume based upon that of LHC II (3300 A3/kDa protein(Kuhlbrandt and Wang, 1990)). Three additional PS I modelswith different mean pigment spacings were constructed as-
suming either a tetrameric aggregation of thepsaA andpsaBgene products (Lundell et al., 1985; Owens et al., 1989)and/or using a smaller specific molecular volume of 1500A3/kDa (from the bacterial reaction center (Deisenhofer andMichel, 1989)). The tetrameric aggregation was at one timesuggested by a Chlamydomonas reinhardtii mutant (strainLM3-A4d) which is known to have a reduced core antennasize of 60 chl/reaction center (half that of wild-type) (Owenset al., 1987, 1989; Zipfel and Owens, 1991) and by quan-
titative analysis of labeled protein bands in PS I isolated fromcyanobacterium Synechococcus 6301 revealing four psaA/psaB gene products per FAB complex (Lundell et al., 1985).The physical properties of the four PS I models along withtheir decay and TE parameters are summarized in Table 3.The results show that the parameters T and te increase,whereas 4Pp and %B decrease with increasing mean spacingin the models. The models with the three smallest mean spac-
ings all exhibit lifetimes, photochemical yields, and excitedstate equilibration times which are in agreement with ex-
perimental values despite rather large variations in %B.However, the model with the largest spacing has a lifetimewhich is more than twice that observed in vivo.
In addition to discussing the effects due to the physicalconstraints placed upon the pigment binding volume, we
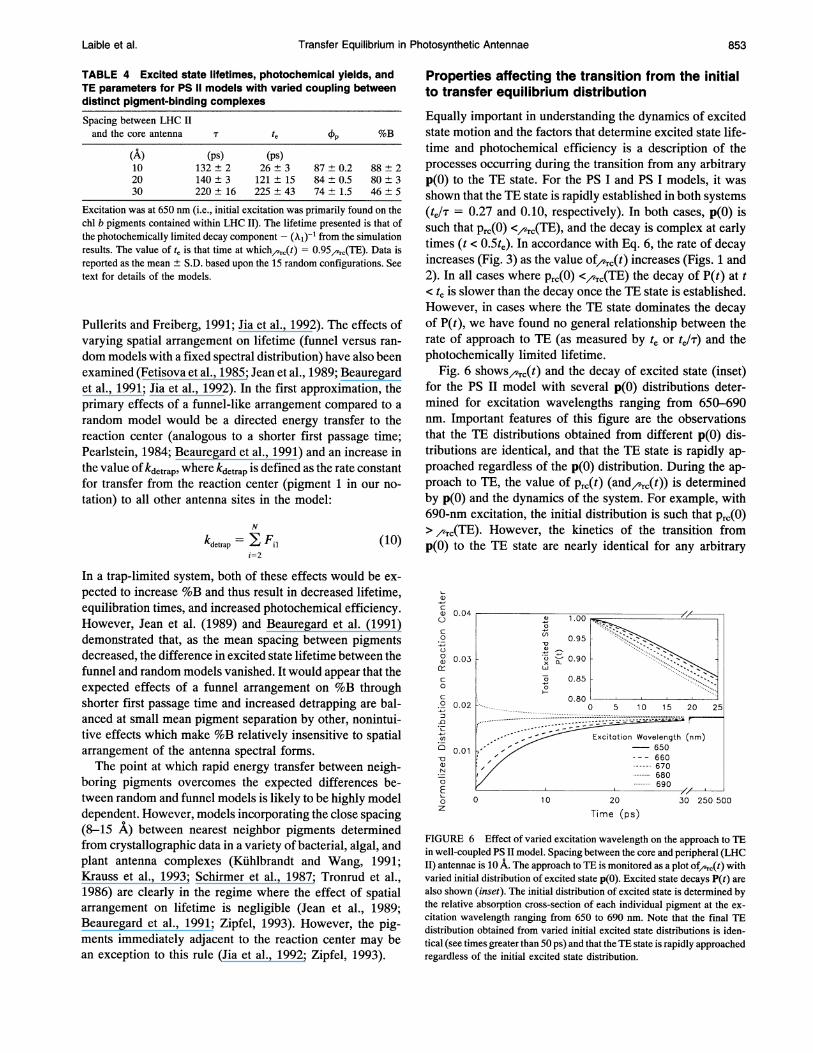
must consider the possibility that, although binding withinthe aggregate may be fixed, that binding between antennaaggregates may be variable. The effects of variations in thecoupling of pigment sites between distinct pigment-bindingcomplexes was modeled by altering the distance betweenLHC II trimers and the PS II core complex in the range of10-30 A. The results (Table 4) demonstrate that T and teincrease, whereas 4Ap and %B decrease with decreasing cou-
pling between LHC II and the PS II core. However, only the10-A model gives a lifetime and excited state equilibrationtimes that are in agreement with experimental data on smallPS II-LHC II aggregates (Holzwarth, 1991; Roelofs et al.,1992). For both the PS I and PS II models, agreement be-tween simulation and experimental data in all cases re-
quires a tight coupling (rapid transfer energy) between pig-ments, both within pigment-binding complexes andbetween complexes.
Spectral composition is the sole factor determining theBoltzmann distribution, p(B). Spatial arrangement of spec-
tral forms does not affect p(B), but it does affect the dy-namics of the system (and thus the lifetime and efficiency)via the rate of approach to the TE state and the differencebetween Prc(B) and,c(TE) (%B; Eq. 8). Because of the de-pendence of %B on excited state dynamics, the Boltzmanndistribution alone would not be expected to provide usefulinformation on lifetime, efficiency, or valid comparisons be-tween models (Eq. 9). The effects of spectral heterogeneityhave been examined in numerous simulation models (Seely,1973; Shipman, 1980; Fetisova et al., 1985; Jean et al., 1989;
TABLE 3 Excited state lifetimes, photochemical yields, and TE parameters for PS I models with varied coupling betweenpigments within a defined physical complex
PSI model Mean spacing T Op %B
(A) (ps) (ps)Small dimer 9.5 42 ± 2 6 ± 1 95.5 ± 0.2 86 ± 3.4Small tetramer 11.6 60 ± 10 17 ± 4 94.0 ± 0.9 61 ± 9.6Large dimer 12.6 73 ± 9 24 ± 3 92.6 ± 1.0 49 ± 6.7Large tetramer 15.8 204 ± 48 52 ± 25 79.2 ± 5.2 16 ± 4.3
Excitation was at 670 nm. The lifetimes presented are that of the photochemically limited decay component - (Aj)-1 from the simulation results. The valueof t. is that time at which,,(t) = 0.95,c(TE). Data is reported as the mean ± S.D. based upon the 15 random configurations. See text for details of themodels.
852 Biophysical Journal
Transfer Equilibrium in Photosynthetic Antennae
TABLE 4 Excited state lifetimes, photochemical yields, andTE parameters for PS 11 models with varied coupling betweendistinct pigment-binding complexesSpacing between LHC IIand the core antenna T te P %B
(A) (ps) (Ps)10 132+2 26±3 87±0.2 88±220 140±3 121±15 84±0.5 80±330 220 ± 16 225 ± 43 74 ± 1.5 46 ± 5
Excitation was at 650 nm (i.e., initial excitation was primarily found on thechl b pigments contained within LHC II). The lifetime presented is that ofthe photochemically limited decay component - (k?)-l from the simulationresults. The value of te is that time at which/,Tc(t) = 0.95,,^c(TE). Data isreported as the mean ± S.D. based upon the 15 random configurations. Seetext for details of the models.
Pullerits and Freiberg, 1991; Jia et al., 1992). The effects ofvarying spatial arrangement on lifetime (funnel versus ran-dom models with a fixed spectral distribution) have also beenexamined (Fetisova et al., 1985; Jean et al., 1989; Beauregardet al., 1991; Jia et al., 1992). In the first approximation, theprimary effects of a funnel-like arrangement compared to arandom model would be a directed energy transfer to thereaction center (analogous to a shorter first passage time;Pearlstein, 1984; Beauregard et al., 1991) and an increase inthe value of kdetrap, where kdetrap is defined as the rate constantfor transfer from the reaction center (pigment 1 in our no-tation) to all other antenna sites in the model:
N
kdetrap = I Fil (10)i=2
In a trap-limited system, both of these effects would be ex-pected to increase %B and thus result in decreased lifetime,equilibration times, and increased photochemical efficiency.However, Jean et al. (1989) and Beauregard et al. (1991)demonstrated that, as the mean spacing between pigmentsdecreased, the difference in excited state lifetime between thefunnel and random models vanished. It would appear that theexpected effects of a funnel arrangement on %B throughshorter first passage time and increased detrapping are bal-anced at small mean pigment separation by other, nonintui-tive effects which make %B relatively insensitive to spatialarrangement of the antenna spectral forms.The point at which rapid energy transfer between neigh-
boring pigments overcomes the expected differences be-tween random and funnel models is likely to be highly modeldependent. However, models incorporating the close spacing(8-15 A) between nearest neighbor pigments determinedfrom crystallographic data in a variety of bacterial, algal, andplant antenna complexes (Kuhlbrandt and Wang, 1991;Krauss et al., 1993; Schirmer et al., 1987; Tronrud et al.,1986) are clearly in the regime where the effect of spatialarrangement on lifetime is negligible (Jean et al., 1989;Beauregard et al., 1991; Zipfel, 1993). However, the pig-ments immediately adjacent to the reaction center may bean exception to this rule (Jia et al., 1992; Zipfel, 1993).
Properties affecting the transition from the initialto transfer equilibrium distribution
Equally important in understanding the dynamics of excitedstate motion and the factors that determine excited state life-time and photochemical efficiency is a description of theprocesses occurring during the transition from any arbitraryp(O) to the TE state. For the PS I and PS I models, it wasshown that the TE state is rapidly established in both systems(tJT = 0.27 and 0.10, respectively). In both cases, p(O) issuch that Prc(O) <rc(TE), and the decay is complex at earlytimes (t < 0.5te). In accordance with Eq. 6, the rate of decayincreases (Fig. 3) as the value of/c(t) increases (Figs. 1 and2). In all cases where Prc(O) <rc(TE) the decay of P(t) at t< te is slower than the decay once the TE state is established.However, in cases where the TE state dominates the decayof P(t), we have found no general relationship between therate of approach to TE (as measured by te or te/T) and thephotochemically limited lifetime.
Fig. 6 shows^,c(t) and the decay of excited state (inset)for the PS II model with several p(O) distributions deter-mined for excitation wavelengths ranging from 650-690nm. Important features of this figure are the observationsthat the TE distributions obtained from different p(0) dis-tributions are identical, and that the TE state is rapidly ap-proached regardless of the p(0) distribution. During the ap-proach to TE, the value of Prc(t) (and^c(t)) is determinedby p(O) and the dynamics of the system. For example, with690-nm excitation, the initial distribution is such that Prc(O)>,C(TE). However, the kinetics of the transition fromp(O) to the TE state are nearly identical for any arbitrary
a)0 0.04C)
c
CX 0.03
0
° 0.020
2 0.01la).N
0
E
:0
zoz
F
0
e 1.00
U) 0.95
0.90x-
C) 0.85
0.800 5 10 15 20 25
------- --------
--- --~-;-- - - -- Excitation Wavelength (nm)- 650
660670680690
10 20 30 250 500
Time (ps)
FIGURE 6 Effect of varied excitation wavelength on the approach to TEin well-coupled PSII model. Spacing between the core and peripheral (LHCII) antennae is 10 A. The approach to TE is monitored as a plot of^c(t) withvaried initial distribution of excited state p(O). Excited state decays P(t) arealso shown (inset). The initial distribution of excited state is determined bythe relative absorption cross-section of each individual pigment at the ex-citation wavelength ranging from 650 to 690 nm. Note that the final TEdistribution obtained from varied initial excited state distributions is iden-tical (see times greater than 50 ps) and that the TE state is rapidly approachedregardless of the initial excited state distribution.
r _ _
Laible et al. 853

Volume 66 March 1994
p(O) (Fig. 6). The most common case for experimentalconditions is one in which Prc(O) <,c(TE). Here, the ini-tial dynamics are involved in increasing,,^c(t) with time.The time where,,c(t) <^-c(TE) contributes to slower de-cay of P(t) and decreased Op. An alternative situation isone where Prc(O) >^c(TE). Here, the limiting case is Prc(O)= 1, and this gives the fastest decay possible for the model(as unrealistic as this p(O) may be). Now the initial dynam-ics are involved in decreasing^c(t) with time. Time where^ec(t) >^c(TE) contributes to faster decay of the system(increased efficiency). This case also demonstrates theproblem of determining kp directly in a trap-limited model.Even if the reaction center can be preferentially excited, aconsiderable amount of the initial decay of Prc(t) is due toback-transfer to the antenna.
Finally, we consider the special case where prc(O) =,,C(TE), or more specifically p(O) = p(TE). Here, dynamicshave no direct influence on the decay of P(t), and a singleexponential is observed, even with infinite time resolution.In our simulations, a pure single exponential decay can bedetected as a solution to the Pauli master equation having adominant decay component with amplitude of 1.0. In thesimulations, p(O) = p(TE) is determined from the normal-ized eigenvector of the dominant eigenvalue (A1) as de-scribed in Eq. 4. However, obtaining p(0) = p(TE) is prob-ably not possible experimentally, although p(0) p(TE)may be. In order to detect such a state, one would need veryhigh time resolution (a few hundred femtoseconds). Note thatthis analysis includes exponential decay components arisingonly from antenna structure and not those arising from an-tenna size heterogeneity or coupling to electron transfer re-actions. In the absence of such complications, appropriatevariations in p(0) may be very useful in obtaining struc-tural information from a system even though the TE statemay dominate the overall decay. Zipfel (1993) has sug-gested that knowledge of p(TE) may impose structuralconstraints on physical models intended to represent invivo systems.
In agreement with numerous theoretical and experimentalstudies (e.g., Jean et al., 1989; Beauregard et al., 1991;Owens et al., 1987; 1988, 1989; Holzwarth et al., 1987), oursimulations show that the decay of a sample can vary sig-nificantly with changes in excitation wavelength although,depending on the value of te, these variations may occur ona time scale that is experimentally inaccessible using thesingle photon counting technique. According to Eq. 2, thevariations in the decay of P(t) with excitation wavelength canonly arise because of changes in cj terms, the constants whichscale the eigenvector elements xii terms to the initial distri-bution p(O). Experimentally, this must result in changes inamplitudes and not in lifetimes of decay components. Anyapparent changes in lifetime must be attributed to excita-tion wavelength-dependent changes in the amplitudes oftwo or more unresolved eigenvalues. The frequent obser-vation of several subdominant eigenvalues of approxi-mately the same magnitude (0.05 Al < Aj < 0.2 A1) in our
simulations suggests that interpretation of decay- orspecies-associated spectra associated with these lifetimes isdifficult at best. The same conclusion has been reached inanalysis of experimental systems (Zipfel, 1993; Turconiet al., 1993).
In some models, especially those with a wide range ofspectral forms (phycobilisomes are a possible example), TEmay be established only very late in the decay and the tran-sition' from p(0) to TE dominates the decay. Simple, smoothtransitions from p(O) to the TE state are typically observed(Figs. 1, 2, and 6); however, eigenvalues other than A1 (sub-dominant eigenvalues), may dominate the decay at t < t,. Byextrapolation from our description of TE states, periods ofthe decay dominated by subdominant eigenvalues may sig-nificantly influence the dynamics, lifetime, and photochemi-cal efficiency of a system as shown experimentally in a phy-cobilisome containing system (Sauer et al. 1988; Holzwarthet al., 1987). The fact that the subdominant eigenvalues arecontrolling redistribution of excited state from the initial tothe TE state on experimentally accessible timescales, indi-cates that selection of excitation wavelength may determinethe degree to which multiexponential decays are observed inlarge, spectrally diverse systems.
EXPRESSIONS FOR TRANSFER EQUILIBRIUMPARAMETERS
In the above discussion, parameters such as^c(TE) havebeen emphasized as being important to our understanding ofTE and excited state decays. One may ask whether or notthese parameters are simple functions of basic model prop-erties. Appendix B contains derivations for two separate andgeneral expressions for the eigenvalues of the rate matrix.Eq. 7 presents the relationship between , A1, and,zrc(TE)that is specific for a system in which a TE state dominatesthe overall decay. The derivation of an alternate expressionfor the eigenvalues of the rate matrix relating their valuesto other model parameters is contained within Appendix Band is presented here as an expression for the dominanteigenvalue:
N I pi(B) xi,Al= kp -kf kdetrap+ Ia F1 . .i2 pj(B) x11
(11)
Note that the reaction center is denoted as pigment 1 in ournotation. Equation 11 suggests relationships between theeigenvalues of the rate matrix and kp, kf, kdetrap, and asummed expression involving detrapping rate constants,Boltzmann equilibrium levels, and eigenvector elements.The complex term closely resembles kdetrap (Eq. 10) butdiffers in the fact that each detrapping rate constant (Fil) isweighted by terms containing eigenvector elements andBoltzmann distributions before summation.
854 Biophysical Journal
Transfer Equilibrium in Photosynthetic Antennae
Equating Eqs. 7 and 11 leads to a useful expressionfor^,,(T'E):
F N p, (B) xi,
kdetrap _ (F pip(B) J (12)~ (TE)kp L kdetrap
Equation 12 shows the importance of the contribution ofkp/kdetrap to^C(TE). The kp/kdetrap ratio has previously beensuggested to be an important model parameter (Pearlstein,1982, 1984; Owens et al., 1987) and a similar ratio of kp/kt(where kt is the average rate constant for nearest neighbortransfer) has frequently been the means by which diffusion-and trap-limited models have been differentiated (Pearlstein,1982, 1984; van Grondelle, 1985). The importance of sucha ratio has also been exploited in simulations involving a"focusing zone" around the reaction center, achieved eitherthrough structure of the arrays near the reaction center (pig-ment placement and mutual orientations (Fetisova et al.,1985)) or through spectral heterogeneity via placement oflong wavelength pigments near the reaction center (Seely,1973; Fetisova et al., 1985). The main reason for includingthese expressions is to demonstrate their complex nature andto stress the fact that excited state dynamics influences all ofthe important TE parameters except prc(B) (which dependssolely on site energies). The emphasis is that excited statedynamics determines,.(TE) (and %B) in a nonintuitiveway; the expression for^c(TE) (Eq. 12) is one which cannotbe simply evaluated without knowledge of the complete nu-merical solution of the Pauli master equation.
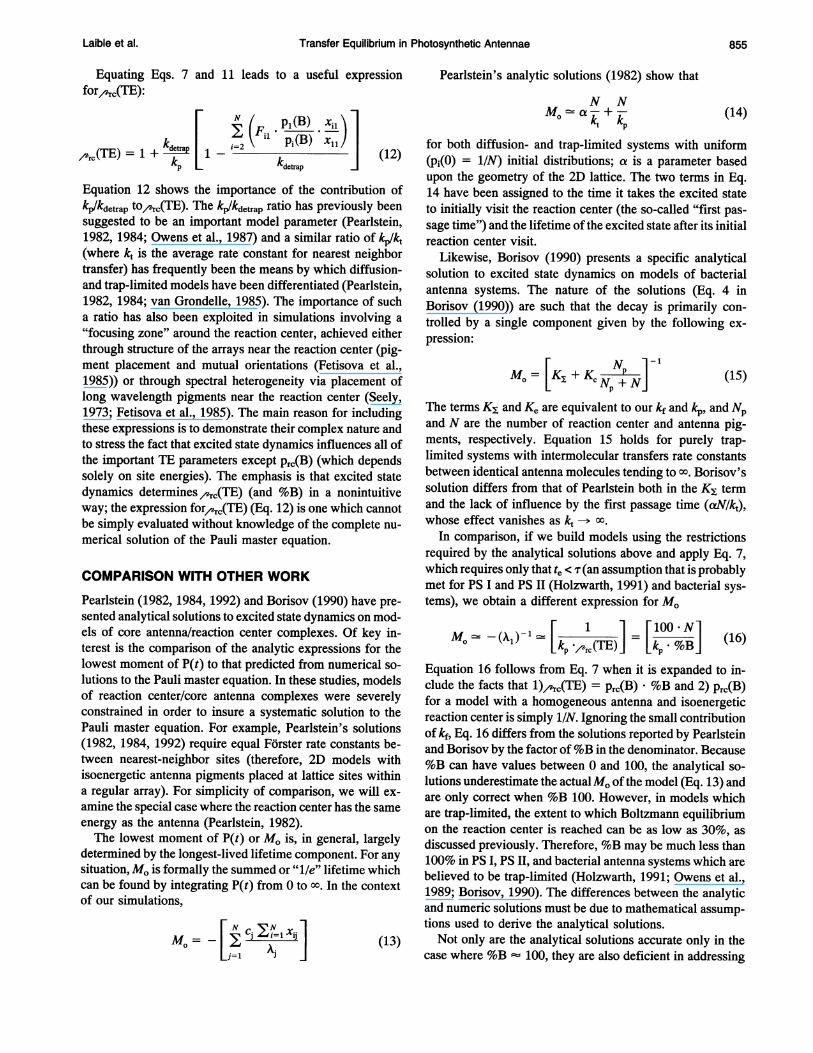
COMPARISON WITH OTHER WORKPearlstein (1982, 1984, 1992) and Borisov (1990) have pre-sented analytical solutions to excited state dynamics on mod-els of core antenna/reaction center complexes. Of key in-terest is the comparison of the analytic expressions for thelowest moment of P(t) to that predicted from numerical so-lutions to the Pauli master equation. In these studies, modelsof reaction center/core antenna complexes were severelyconstrained in order to insure a systematic solution to thePauli master equation. For example, Pearlstein's solutions(1982, 1984, 1992) require equal Forster rate constants be-tween nearest-neighbor sites (therefore, 2D models withisoenergetic antenna pigments placed at lattice sites withina regular array). For simplicity of comparison, we will ex-amine the special case where the reaction center has the sameenergy as the antenna (Pearlstein, 1982).The lowest moment of P(t) or M. is, in general, largely
determined by the longest-lived lifetime component. For anysituation, M. is formally the summed or "1/e" lifetime whichcan be found by integrating P(t) from 0 to oo. In the contextof our simulations,
MO N C ] (13)
Pearlstein's analytic solutions (1982) show that
N NM ka-+-
kt kp (14)
for both diffusion- and trap-limited systems with uniform(pi(O) = 1/N) initial distributions; a is a parameter basedupon the geometry of the 2D lattice. The two terms in Eq.14 have been assigned to the time it takes the excited stateto initially visit the reaction center (the so-called "first pas-sage time") and the lifetime of the excited state after its initialreaction center visit.
Likewise, Borisov (1990) presents a specific analyticalsolution to excited state dynamics on models of bacterialantenna systems. The nature of the solutions (Eq. 4 inBorisov (1990)) are such that the decay is primarily con-trolled by a single component given by the following ex-pression:
MO= LK +KC#KNY (15)
The terms K, and Ke are equivalent to our kf and kp, and Npand N are the number of reaction center and antenna pig-ments, respectively. Equation 15 holds for purely trap-limited systems with intermolecular transfers rate constantsbetween identical antenna molecules tending to mo. Borisov'ssolution differs from that of Pearlstein both in the K, termand the lack of influence by the first passage time (aN/Ik,),whose effect vanishes as kt -- co.
In comparison, if we build models using the restrictionsrequired by the analytical solutions above and apply Eq. 7,which requires only that te < T(an assumption that is probablymet for PS I and PS II (Holzwarth, 1991) and bacterial sys-tems), we obtain a different expression for M.
1 100. Nkp (TE) = [k %B (16)
Equation 16 follows from Eq. 7 when it is expanded to in-clude the facts that 1),rc(TE) = Prc(B) - %B and 2) Prc(B)for a model with a homogeneous antenna and isoenergeticreaction center is simply 1/N. Ignoring the small contributionof kf, Eq. 16 differs from the solutions reported by Pearlsteinand Borisov by the factor of%B in the denominator. Because%B can have values between 0 and 100, the analytical so-lutions underestimate the actualM. of the model (Eq. 13) andare only correct when %B 100. However, in models whichare trap-limited, the extent to which Boltzmann equilibriumon the reaction center is reached can be as low as 30%, asdiscussed previously. Therefore, %B may be much less than100% in PS I, PS II, and bacterial antenna systems which arebelieved to be trap-limited (Holzwarth, 1991; Owens et al.,1989; Borisov, 1990). The differences between the analyticand numeric solutions must be due to mathematical assump-tions used to derive the analytical solutions.Not only are the analytical solutions accurate only in the
case where %B 100, they are also deficient in addressing
Laible et al. 855
Volume 66 March 1994
naturally occurring spectral heterogeneity and geometric fac-tors such as spatial arrangement and mutual orientationwhich can dramatically influence decays through their af-fects on the dynamics of the system. Also, the assumption ofhomogeneous antennae (with or without isoenergetic reac-tion centers) can lead to large errors when estimating theBoltzmann distribution on the reaction center. Since bothbacterial and higher plant antennae are known to be spec-trally heterogeneous with pigments both of higher and lowerenergy than that of the reaction center, Prc(B) may be quitedifferent than 1/N. Thus, the applicability of such analyticalsolutions is severely restricted to specific models which maybear little resemblance to in vivo systems. Finally, compari-son of the analytical and numerical solutions redirects theemphasis of excited state dynamics from experimentally in-accessible parameters such as "first passage time" and thelifetime of the excited state after its initial visit to the reactioncenter to an understanding of the importance of the normal-ized fraction of excited state on the reaction center at TE,^c(TE) (Eqs. 7 and 17).
SUMMARY
In these simulations, we have attempted to use realistic struc-tural and spectral information and appropriate physical lawsto calculate the time-dependent properties of excited statedecay in the chl-based antennae of PS I and PS II. Wheredetailed spectral or structural data is lacking, we have as-sumed that we know the correct in vivo spectra and appliedthe appropriate overlap calculations and averaged over ran-dom spatial configurations. Similarly, we have assumed thatenergy transfer occurs only by dipole interactions. Alteringthese assumptions would quantitatively change the data pre-sented, but it would not modify the conclusion that transferequilibrium states are a requisite component of any systemwhich models antenna processes and primary photochem-istry as a system of coupled, first-order differential equa-tions. The only requirement is that the system is tightlycoupled: energy transfer between neighboring sites be onthe time scale of a few picoseconds or less (Jean et al.,1989; Beauregard et al., 1991).Although the concept of transfer equilibrium is rather
simple, the consequences of its occurrence are significant.After a certain time (te), which is model- and p(O)-dependent,the contribution to the model's total decay from all eigen-values except one (X1) will have vanished and the fractionaldistribution of the excited state among coupled pigments re-mains constant over time. The transfer equilibrium which wedescribe differs from Boltzmann equilibrium (the state of amodel without decay at infinite time) due to the nature ofexcited state migration and trapping. The contribution of theTE state to the total decay depends on when the TE state isestablished in the decay of P(t). If TE is established rapidlycompared to the lifetime of the excited state (te < ), then theproperties of the TE state dominate the decay. In agreementwith previous experimental studies (Turconi et al., 1993;
Roelofs et al., 1992; Owens et al., 1987, 1989), we provideevidence that TE states are rapidly established in the chl-based antennae of both PS I and PS II on time scales that areshort compared to their photochemically limited lifetimes.Properties of the TE state dominate key observables. Inparticular, the normalized fraction on the reaction center atTE is directly proportional to the excited state lifetime.Thus, knowledge of the excited state distribution of the TEstate is central to determining the overall excited state life-time and photochemical efficiency of the system. Finally,the results from the models of PS I and PS II demonstratethe power of simulations and TE parameters in selectingbetween various physical models to describe experimentalresults.
We thank J. W. Lee, C. Ting, A. Ganago, I. Ganago, and R. Knox for helpfuldiscussions and insightful comments.This research was supported by grants (to T. G. 0.) from the NationalScience Foundation (DMB 8803626 and DMB 9005574). P. D. L. wassupported by an A. D. White fellowship from Cornell University. W. Z.and P. D. L. acknowledge support from a National Institutes of Healthtraining grant in Molecular Physics of Biological Systems (08-T26M08267A).
APPENDIX A
Definition of TE terms found throughout the textand appendicesNEiFij
w
A.
AlXj
xii
TEte
pi(t)
p(t)P(t)pi(O)p(O)A(t)
number of pigment binding sites in modelpeak absorption (energy) of pigment iForster rate constant for transfer from pigment jto iphotochemical rate constantsummation of all nonphotochemical unimoleculardecay ratesmean transfer rate constant between nearest-neighbor pigments in the modelN X N rate matrix of pairwise transfer rates andunimolecular decay ratesjth eigenvalue ofWsmallest or dominant eigenvalue of WN X 1 eigenvector of W corresponding to Aj witheigenvector elements xijindividual eigenvector elements; subscript i refers topigment, j to eigenvaluearbitrary constants in general solution chosen suchthat p(t) at t = 0 equals p(O)transfer equilibriumtime at which transfer equilibrium is reached; de-fined as time at which^,(t) = 0.95rc(TE)lie lifetime of the excited state (photochemicallylimited)time-dependent site occupation probability for pig-ment i at time tvector of site occupation probabilities at time ttotal excited state remaining at time t; P(t) = :pi(t)initial distribution of excitation on pigment ivector of initial distribution of excitationnormalized time-dependent site occupation prob-ability for pigment i; i(t) = (pQ(t)/Ipj(t))
856 Biophysical Journal
Transfer Equilibrium in Photosynthetic Antennae
normalized amount of excitation residing on pig-ment i at transfer equilibriumvector of transfer equilibrium distribution of excitedstateBoltzmann population on pigment i obtained fromsimulations of models with no decayBoltzmann distribution at 298 K obtained fromsimulations of models with no decay
%B percentage of Boltzmann population reached on thereaction center at transfer equilibrium
J N X N square matrix with all elements of unitypigment 1 reaction center capable of photochemistry (also de-
noted as "rc" subscript in text)kdetrap sum of rate constants for transfer of excitation from
the reaction center to antenna pigmentsWxj = Ajxj the eigenvalue equation
Expanded format of the rate matrix W
-(kp + kf + I F1l)
F21F31
F12- (kf + 2aFi2)
F32F23
- (kf + Y Fi3)
*.** FNN- (kf + E FjN)
Derivation of expressions for the eigenvalues ofthe system
1) Derivation of the expression relating the eigenvalues of the system tothe values of kf, kp, and the eigenvalue's normalized eigenvector ele-ments. The derivation initiates by multiplying both sides of the eigen-value equation involving the rate matrix W by a special square matrix,the J matrix.
JVxj = JAjx) = AjJxj (Bi)
The left-hand side of Eq. B1 is easily simplified to an N X 1 matrixthrough a series of matrix multiplication steps. In the first step, the ratematrix is multiplied from the left by the J matrix resulting in an N X Nmatrix:
-(kp + kf) kf kfJW = (B2)
-(kp + kf) kf -kfJ
Next, if the vector Xj is multiplied from the left by the resulting matrix inEq. B2 and one notes that
N
-(kp + kf)xlj-kf 2 xij =kpxl- kf xi, (B3)i=2
then the desired simplification of the left-hand side of Eq. BR (an N x 1matrix) is obtained:
JWxj =
_-
-kpxj-kf I xj1
-kpx- kf E Xjj
multiplied from the left by the J matrix followed by scalar multipli-caion of the resultant matrix by Aj to obtain the desired outcomefound in Eq. B5.
X i A1 2 xi
AjJxj = A' i z x
If the top row of the matrix found in Eq. B4 is equated with thetop rows of the matrix found in Eq. B5, then the following expressionis obtained:
-kxj- kf,E xi = Aj x1j (B6)
Dividing both sides of Eq. B6 by Yx1; results in a general expression forthe eigenvalues of W as a function of kf, kp, and its respective eigenvec-tor elements.
Aj= -[kf+ kp. £x] (B7)
Equation B7 is completely general and holds for any system independentof the contribution of the TE state to the total decay. In models where theTE state is quickly established and dominates the decay, the resulting T ispredicted by (Al)-1. Replacing xljIx,j with/,,r,(TE) from Eq. 4 in the textas the reaction center is denoted as pigment 1 in our Forster rate constantand eigenvector notation, one obtains:
r -(A1) -1 = [kf + kpvrc(TE))] 1
(B4)
Likewise, the right-hand side of Eq. BR is easily simplified to an N X 1matrix through matrix multiplication. First, the eigenvector Xj is
(B8)
2) Derivation of the expression relating the eigenvalues of the system tothe values of kp, kdetrap, and %B. As in the first derivation of Appendix B,the derivation initiates with the eigenvalue equation.
Simplification of the left-hand side of the eigenvalue equation via matrixmultiplication leads to the N X 1 matrix found in Eq. B9. The subscript m
(B5)
A(TE)
p(TE)
pi(B)
p(B)
* . .
F34
FN1
... F2NV
... F3N
APPENDIX B
I
857Laible et al.
858 Biophysical Joumal Volume 66 March 1994
is temporarily introduced in the summation notation to represent simulta-neously the pigment in the eigenvector elements and the donor pigment inthe Forster rate constants.
-(kp + kf + > Fil )xj + N Fimxmj
F21x,j- (kf + F12 + iFi X2j + 2 F2mXmj
Wxj =
7, FNi-lnXmj - (kf + z Fij,NI + FN,N_I )XNij + FN_IJNXArj
N-1
1: FN.Xmj - (kf + Y, FLv )xNj
(B9)Simplification of the right-hand side of the eigenvalu'e equation via matrixmultiplication leads also to an N X 1 matrix
[xjxljjXj = .J (B 10)
xiXNJ-If the rows of the matrix found in Eq. B9 are equated with the rows of thematrix found in Eq. B10, then Nexpressions are obtained-the first ofwhichis presented in Eq. B I 1.
- kp + kf + Fil |xj + T FlFmxmj =AjXIj (Bl1)i=2 / m=2
Dividing both sides of Eq. B 11 by the first eigenvector element xIj, thefollowing expression results:
-(kp + kf + j Fj) + 2 [Fim * ' ] =Aj (B12)i=2 m=2 xij
In models with no decay at infinite time, an expression equating the rate ofexcitation transfer from pigment i to pigment j with the rate of excitationtransfer from pigment j to pigment i may be proposed.
Fji * p,(B) = Fij * pj(B) (B 13)Rearrangement of Eq. B13 leads to the following expression:
Fij = *Pi(B) (B 14)pj(B)Replacing F,.. in Eq. B12 with its equivalent from Eq. B14 (which elimi-nates the need for the m subscript) yields:
-(k + kf + ) + F p,(B)I .] = Aj (B15)
Using the definition of kdC,r,p from Eq. 10 in the text, then B15 can beexpressed equivalently as
kp- kf - kde,p + i [Fi, pi(s) ,] i (B16)
Subsequently, if (a) the eigenvector xj is normalized in such a way that thenormalization factor is the sum of its elements and (b) one defines thepercentage of the Boltzmann population reached at transfer equilibrium(%B) as xjj/pc(B), then the following expression is an alternate form of Eq.B16.
-kp-kf -k + =[%B pj( i (B17)
REFERENCESAlt, J., J. Morris, P. Westhoff, and R. G. Herrmann. 1984. Nucleotide se-
quence of the clustered genes for the 44-kDa chlorophyll a apoprotein and
the 32-kDa-like' protein of the photosystem II reaction center in the spin-ach plastid chromosome. Curr. Genet. 8:597-606.
Atkins, P. W. 1990. Physical Chemistry, 4th ed. W. H. Freeman. New York.995 pp.
Bassi, R., F. Rigoni, and G. M. Giacometti. 1990. Chlorophyll bindingproteins with antenna function in higher plants and green algae. Photo-chem. Photobiol. 52:1187-1206.
Beauregard, M., I. Martin, and A. R. Holzwarth. 1991. Kinetic modellingof exciton migration in photosynthetic systems. (1) Effects of pigmentheterogeneity and antenna topography on exciton kinetics and chargeseparation yields. Biochim. Biophys. Acta. 1060:271-283.
Biggins, J., and D. Bruce. 1988. Regulation of excitation energy transfer inorganisms containing phycobilins. Photosyn. Res. 20:1-34.
Borisov, A. Y. 1990. Energy migration in purple bacteria. The criterion fordiscrimination between migration- and trapping- limited photosyntheticunits. Photosyn. Res. 23:283-289.
Bruce, D., J. Biggins, T. Steiner, and M. Thewalt. 1985. Mechanism of thelight state transition in photosynthesis. IV. Picosecond fluorescence spec-troscopy ofAnacystis nidulans and Porphyridium cruentum in state 1 andstate 2 at 77 K. Biochim. Biophys. Acta. 806:237-246.
Bruce, D., C. Hanzlik, L. N. Hancock, J. Biggins, and R. S. Knox. 1986.Energy distribution in the photochemical apparatus of Prophyridium cru-entum: picosecond fluorescence spectroscopy of cells in state 1 and state2 at 77 K. Photosyn. Res. 10:283-290.
Bruce, B. D., and R. Malkin. 1988. Structural aspects of photosystem I fromDunaliella salina. Plant Physiol. 88:1201-1206.
Butler, W. L. 1961. A far-red absorbing form of chlorophyll, in vivo. Arch.Biochem. Biophys. 93:413-422.
Cantrell, A., and D. A. Bryant. 1987. Molecular cloning and nucleotidesequence of the pea psaA and psaB genes of cyanobacterium Synecho-coccus PCC 7002. Plant Mol. Biol. 9:453-468.
Chang, J. C. 1977. Monopole effects on electronic excitation interactionsbetween large molecules. I. Application to energy transfer in chloro-phylls. J. Chem. Phys. 67:3901-3909.
Deisenhofer, J., and H. Michel. 1989. The photosynthetic reaction centrefrom the purple bacterium Rhodopseudomonas viridis. EMBO J. 8:2149-2170.
Dekker, J. P., E. J. Boekema, H. T. Witt, and M Rogner. 1988. Refinedpurification and further characterization of oxygen-evolving and tris-treated photosystem II particles from the thermophilic cyanobacteriumSynechococcus sp. Biochim. Biophys. Acta. 936:307-318.
Feick R., R. van Grondelle, C. P Rijgersberg, and G. Drews. 1980. Fluo-rescence emission by wild-type- and mutant-strains of Rhodopseudomo-nas capsulata. Biochim. Biophys. Acta. 593:241-253.
Fetisova, Z. G., A. Y. Borisov, and M. V. Fok. 1985. Analysis of structure-function correlations in light-harvesting photosynthetic antenna: structureoptimization parameters. J. Theor. Biol. 112:41-75.
Fish, L. E., U. Kuck, and L. Bogorad. 1985. Two partially homologousadjacent light-inducible maize chloroplast genes encoding polypeptidesof the P700 chlorophyll a-protein complex of photosystem I. J. Biol.Chem. 260:1413-1421.
Forster, T. 1965. Delocalized excitation and excitation transfer. In ModemQuantum Chemistry. Vol III. 0. Sinanoglu, editor. Academic Press, Inc.,New York. 93-137.
Golbeck, J. H. 1987. Structure, function, and organization of the photo-system I reaction center complex. Biochim. Biophys. Acta.895:167-204.
Golbeck, J. H., and D. A. Bryant. 1991. Photosystem I. In Current Topicsin Bioenergetics. Vol 16. C. P. Lee, editor. Academic Press, San Diego,CA. 83-177.
Hansson, O., and T. Wydrzynski. 1990. Current perceptions of photosystemII. Photosyn. Res. 23:131-162.
Heitler, W. 1954. The quantum theory of radiation, 3rd ed. Oxford Uni-versity Press, London. 430 pp.
Holzwarth, A. R. 1986. Fluorescence lifetimes in photosynthetic systems.Photochem. Photobiol. 43:707-725.
Holzwarth, A. R. 1987. A model for the functional antenna organization andenergy distribution in the photosynthetic apparatus of higher plants andgreen algae. In Progress in Photosynthesis Research. Vol 1. J. Biggins,editor. Martinus Nijhoff, Dordrecht. 53-60.
Holzwarth, A. R. 1989. Applications of ultrafast laser spectroscopy for the
Laible et al. Transfer Equilibrium in Photosynthetic Antennae 859
study of biological systems. Quart. Rev. Biophys. 22:239-326.Holzwarth, A. R. 1991. Excited state kinetics in chlorophyll systems and its
relationship to the functional organization of the photosystems. In TheChlorophylls, H. Scheer, editor. CRC Press, Boca Raton. 1125-1151.
Holzwarth, A. R., J. Wendler, and G. W. Suter. 1987. Studies on chromo-phore coupling in isolated phycobiliproteins. II. Picosecond energy trans-fer kinetics and time-resolved fluorescence spectra of C-phycocyaninfrom Synechococcus 6301 as a function of the aggregation state. Biophys.J. 51:1-12.
Jean, J. M., C. K Chan, G. R. Fleming, and T. G. Owens. 1989. Excitationtransport and trapping on spectrally disordered lattices. Biophys. J. 56:1203-1215.
Jennings, R. C., G. Zucchelli, and F. M. Garhaschi. 1990. Excitation energytransfer from the chlorophyll spectral forms to Photosystem II reactioncentres: a fluorescence induction study. Biochim. Biophys. Acta. 1016:259-265.
Jia, Y., J. M. Jean, M. M. Werst, C.-K. Chan, and G. R. Fleming. 1992.Simulations of the temperature dependence of energy transfer in the PSI core antenna. Biophys. J. 63:259-273.
Kallebring, B., and 0. Hansson. 1991. A theoretical study of the effect ofcharge recombination on the transfer and trapping of excitation energy inphotosynthesis. Chem. Phys. 149:361-372.
Knox, R. S. 1968. On the theory of trapping of excitation in the photo-synthetic unit. J. Theor. Biol. 21:244-259.
Knox, R. S. 1986. Trapping events in light-harvesting assemblies. Theoryand modeling of excitation delocalization and trapping. In Encyclopediaof Plant Physiology, New Series. L. A. Staehelin and C. J. Arntzen,editors. Springer-Verlag, New York. 286-298.
Knox, R., and D. Gulen 1993. Theory of polarized fluorescence from mo-lecular pairs: Forster transfer al large electronic coupling. Photochem.Photobiol. 57:40-43
Knox, R., and S. Lin. 1988. Time resolution and kinetics of "F680" at lowtemperatures in spinach chloroplasts. In Photosynthetic Light-HarvestingSystems. H. Scheer and S. Schneider, editors. Walter de Gruyter & Co.,New York. 567-577.
Krauss, N., W. Hinrichs, I. Witt, P. Fromme, W. Pritzkow, Z. Dauter, C.Betzel, K. S. Wilson, H. T. Witt, and W. Saenger. 1993. Three-dimensional structure of system I of photosynthesis at 6 A resolution.Nature (Lond). 361:326-331.
Kiihlbrandt, W., and D. N. Wang. 1991. Three-dimensional structure ofplant light-harvesting complex determined by electron crystallography.Nature (Lond). 350:130-134.
Lee, C. H., T. A. Roelofs, and A. R. Holzwarth. 1990. Target analysis ofpicosecond fluorescence kinetics in green algae: characterization of pir-mary processes in photosystem II alpha and beta. In Current Research inPhotosynthesis. Vol 1. M. Baltscheffsky, editor. Kluwer Academic Pub-lishers, Dordrecht. 387-390.
Lin, S., and R. S. Knox. 1988. Time resolution of a short-wavelength chlo-roplast fluorescence component at low temperature. J. Lumin. 40 & 41:209-210.
Lin, S., and R. S. Knox. 1991. Studies of excitation energy transfer withinthe green alga Chlamydomonas reinhardtii and its mutants at 77 K.Photosyn. Res. 27:157-168.
Lundell, D. J., A. N. Glazer, A. Melis, and R. Malkin. 1985. Characterizationofa cynanobacterial photosystem I complex.J. Biol. Chem. 260:646-654.
McCauley, S., E. Bittersmann, and A. R. Holzwarth. 1989. Time-resolvedultrafast blue-shifted fluorescence from pea chloroplasts. FEBSLett. 249:285-288.
Montroll, E. W. 1969. Random walks on latices. III. Claculation of firstpassage times with application to exciton trapping on photosyntheticunits. J. Math. Phys. 10:753-765.
Moog, R. S., A. Kuki, M. D. Fayer, and S. G. Boxer. 1984. Excitationtransport and trapping in a synthetic chlorophyllide substituted hemo-globin: orientation of the chlorophyll S, transition dipole. Biochemistry.23:1564-1571.
Mullineaux, C. W., and A. R. Holzwarth. 1991. Kinetics of excitation energytransfer in the cyanobacterial phycobilisome-Photosystem II complex.Biochim. Biophys. Acta. 1098:68-78.
Nanba, O., and K. Satoh. 1987. Isolation of a photosystem II reaction centerconsisting of D-1 and D-2 polypeptides and cytochrome b-559. Proc.Nati. Acad. Sci. USA. 84:109-112.
Owens, T. G., S. P. Webb, R. S. Alberte, L. Mets, and G. R. Fleming. 1988.Antenna structure and excitation dynamics in photosystem I. I. Studiesof detergent isolated photosystem I preparations using time-resolved fluo-rescence analysis. Biophys. J. 53:733-745.
Owens, T. G., S. P. Webb, L. Mets, R. S. Alberte, and G. R. Fleming. 1987.Antenna size dependence of fluorescence decay in the core antenna ofphotosystem I: estimates of charge separation and energy transfer rates.Proc. Nat. Acad. Sci USA. 84:1532-1536.
Owens, T. G., S. P. Webb, L. Mets, R. S. Alberte, and G. R. Fleming. 1989.Antenna structure and excitation dynamics in photosystem I. II. Studieswith mutants of Chlamydomonas rheinhardtii lacking photosystem II.Biophys. J. 56:95-106.
Pearlstein, R. M. 1982. Exciton migration and trapping in photosynthesis.Photochem. Photobiol. 35:835-844.
Pearlstein, R. M. 1984. Photosynthetic exciton migration and trapping. InAdvances in Photosynthesis Research. Vol 1. C. Synbesma, editor. Mar-tinus Nijhoff, The Hague. 1:13-20.
Pearlstein, R. M. 1992. Kinetics of exciton trapping by monocoordinatereaction centers. J. Lumin. 51:139-147.
Pullerits, T., and A. Freiberg. 1991. Picosecond fluorescence of simple pho-tosynthetic membranes: evidence of spectral inhomogeneity and directedenergy transfer. Chem. Phys. 149:409-418.
Rijgersberg, C. P., R. van Grondelle, and J. Amesz. 1980. Energy transferand bacteriochlorophyll fluorescence in purple bacteria at low tempera-ture. Biochin Biophys. Acta. 592:53-64.
Robinson, G. W. 1967. Excitation transfer and trapping in photosynthesis.Brookhaven Symp. Biol. 19:16-48.
Roelofs, T. A., C. H. Lee, and A. R. Holzwarth. 1992. Global target analysisof picosecond chlorophyll fluorescence kinetics from pea chloroplasts: anew approach to the characterization of the primary processes in pho-tosystem II a- and 3-units. Biophys. J. 61:1147-1163.
Ross, R. T., and M. Calvin. 1967. Thermodynamics of light emission andfree-energy storage in photosynthesis. Biophys. J. 7:595-614.
Rutherford, A. W., and P. S6tif. 1990. Orientation of P700, the primaryelectron donor of photosystem I. Biochim. Biophys. Acta.1019:128-132.
Sauer, K., and H. Scheer. 1988. Excitation transfer in C-phycocyanin:F6rster transfer rate and exciton calculations based on new crystal struc-ture data for C-phycocyanins from Agmenellum quadruplicatum andMastigocladus laminosus. Biochim. Biophys. Acta. 936:157-170.
Schatz, G. H., H. Brock, and A. R. Holzwarth. 1987. Picosecond kineticsof fluorescence and of absorbance changes in photosystem II particlesexcited at low photon density. Proc. Natl. Acad Sci. USA.84:8414-8418.
Schatz, G. H., H. Brock, and A. R. Holzwarth. 1988. Kinetics and energeticmodel for the primary processes in photosystem H. Biophys. J. 54:397-405.
Schirmer, T., W. Bode, and R. Huber. 1987. Refined three-dimensionalstructures of two cyanobacterial C-phycocyanins at 2:1 and 2.5 A reso-lution. J. Mol. Biol. 196:677-695.
Seely, G. R. 1973. Effects of spectral variety and molecular orientation onenergy trapping in the photosynthetic unit: a model calculation. J. Theor.Biol. 40:173-187.
Shipman, L. L. 1980. A theoretical study of excitons in chlorophyll a on apicosecond timescale. Photochem. Photobiol. 31:157-167.
Shipman, L. L., and D. L. Housman 1979. Forster transfer rates for Chlo-rophyll a. Photochem. Photobiol. 29:1163-1167.
Sundstr6m, V., R. van Grondelle, H. Bergstrom, E. Akesson, and T. Gillbro.1986. Excitation-energy transport in the bacteriochlorophyll antenna sys-tems ofRhodospirillum rubrum and Rhodobacter sphaeroides studied bylow-intensity picosecond absorption spectroscopy. Biochim. Biophys.Acta. 851:431-446.
Suter, G. W., and A. R. Holzwarth. 1987. A kinetic model for the energytransfer in physobilisomes. Biophys. J. 52:673-683.
Teller, D. C. 1976. Accessible area, packing volumes, and interaction sur-faces of globular proteins. Nature (Lond.). 260:729-731.
Trissl, H. W., B. Hecks, and K Wulf. 1993. Invariable trapping times inphotosystem I upon excitation of minor long-wavelength-absorbing pig-ments. Photochem. Photobiol. 57:108-112.
Tronrud, D. E., M. F. Schmid, and B. W. Matthews. 1986. Structure and

860 Biophysical Journal Volume 66 March 1994
X-ray amino acid sequence of a bacteriochlorophyll a protein from Pros-thecochloris aestuarii refined at 1:9 A resolution. J. Mol. Biol. 188:443-454.
Turconi, S., G. Schweitzer, and A. R. Holzwarth. 1993. Temperature de-pendence of picosecond fluorescence kinetics of a cyanobacterial pho-tosystem I particle. Photochem. Photobiol. 57:113-119.
van Grondelle, R. 1985. Excitation energy transfer, trapping and annihila-tion in photosynthetic systems. Biochim. Biophys. Acta. 811:147-195.
van Kampen, N. G. 1981. Stochastic Processes in Physics and Chemistry.North-Holland Publishing Company. New York. 419 pp.
Werst, M., Y. Jia, L. Mets, and G. R. Fleming. 1992. Energy transfer andtrapping in the photosystem I core antenna. A temperature study. Biophys.J. 61:868-878.
Wittmershaus, B., T. M. Nordlund, W. H. Knox, R. S. Knox, N. E. Gea-cintov, and J. Breton. 1985. Picosecond studies at 77 K of energy trnasferin chloroplasts at low and high excitation intensities. Biochim. Biophys.Acta. 806:93-106.
Zankel, K. L., and R. K. Clayton. 1969. Uphill energy transfer in a pho-tosynthetic bacterium. Photochem. Photobiol. 9:7-15.
Zipfel, W. 1993. Modelling photon capture, excitation energy transfer,and charge transfer kinetics in photosynthesis. Ph.D. thesis. CornellUniversity. 290 pp.
Zipfel W., and T. G. Owens. 1991. Calculation of absolute photosystem Iabsorption cross-sections from P700 photo-oxidation kinetics. Photosyn.Res. 29:23-35.