A new Fuzzy-LOGIC based Model for Chlorophyll-a in Pulicat Lagoon, India
12
Int. J. Environ. Res., 4(4): 837-848, Autumn 2010 ISSN: 1735-6865 Received 12 June 2009; Revised 27 April 2010; Accepted 15 May 2010 *Corresponding author E-mail: [email protected] 837 A new Fuzzy-LOGIC based Model for Chlorophyll-a in Pulicat Lagoon, India Santhanam, H. 1 and Amal Raj, S. 2* 1 Centre for Earth Sciences, Indian Institute of Science, Bangalore – 560 012, India 2 Centre for Environmental Studies, Anna University-Chennai, Chennai 600 025, India ABSTRACT: Coastal lagoons are complex ecosystems exhibiting a high degree of non-linearity in the distribution and exchange of nutrients dissolved in the water column due to their spatio-temporal characteristics. This factor has a direct influence on the concentrations of chlorophyll-a, an indicator of the primary productivity in the water bodies as lakes and lagoons. Moreover the seasonal variability in the characteristics of large-scale basins further contributes to the uncertainties in the data on the physico-chemical and biological characteristics of the lagoons. Considering the above, modelling the distributions of the nutrients with respect to the chlorophyll-concentrations, hence requires an effective approach which will appropriately account for the non-linearity of the ecosystem as well as the uncertainties in the available data. In the present investigation, fuzzy logic was used to develop a new model of the primary production for Pulicat lagoon, Southeast coast of India. Multiple regression analysis revealed that the concentrations of chlorophyll-a in the lagoon was highly influenced by the dissolved concentrations of nitrate, nitrites and phosphorous to different extents over different seasons and years. A high degree of agreement was obtained between the actual field values and those predicted by the new fuzzy model (d = 0.881 to 0.788) for the years 2005 and 2006, illustrating the efficiency of the model in predicting the values of chlorophyll-a in the lagoon. Key words: Coastal lagoon, Pulicat lagoon, Chlorophyll-a, Fuzzy logic, Multiple Regression analysis INTRODUCTION From the past, several studies have been undertaken till date to understand the complex physico-chemical cum biological characteristics of coastal lakes and lagoons (Praveena et al., 2008; Priju and Narayana, 2007; Mensi et al., 2008) and their inter-relationships, and the different techniques are available to model their biogeochemical interactions. However, since successful interpretation of scientific data on lagoons is critical for designing an effective modelling approach, it is imperative to utilise the available scientific knowledgebase on lakes and lagoons to build a methodology to model the lagoon characteristics to aid in the effective management these intriguing coastal ecosystems. The use of simple ecological models in assessing the status of ecosystems as lakes and lagoons has been abundantly recorded in the scientific literature over the past centuries. The earliest of these approaches was by Lotka (1925) and Volterra (1926) who expressed change in a single population as a function of a constant birth rate and death rate. Riley (1947) had, by the use of a model of an ecosystem, projected changes in the herbivores per unit biomass as the sum of a constant assimilation balance against temperature dependant respiration, carnivorous predation and the natural mortality of that system. Further, Riley (1946) had created a coupled model to calculate steady state plankton population levels for North Atlantic Ocean. Empirical budgeting approaches have also been popular with researchers worldwide. Most widely used approach is the budgeting proposed by the budgeting node of Land-Ocean Interaction in Coastal Zone (LOICZ) of the International Geosphere-Biosphere Programme (IGBP). With the biogeochemical modelling guidelines developed by LOICZ (Gordon et al., 1996) to implement nutrient budgets, several reports of applications of the model have been available describing the testing and use of the approach for CNP (Carbon Nitrogen Phosphorus) budgets in estuarine and coastal systems (Smith & Crossland, 1999; Smith et al., 1999, Dupra et al., 2000a & b). In the Indian scenario, Girija et al. (2005) had described the development of a two-dimensional depth-averaged hydrodynamic model and simulation of the currents and salinity corresponding to monsoonal regime as well as lagoon mouth conditions for Chilika lagoon in www.SID.ir Archive of SID
-
Upload
independent -
Category
Documents
-
view
0 -
download
0
Transcript of A new Fuzzy-LOGIC based Model for Chlorophyll-a in Pulicat Lagoon, India
Int. J. Environ. Res., 4(4): 837-848, Autumn 2010ISSN: 1735-6865
Received 12 June 2009; Revised 27 April 2010; Accepted 15 May 2010
*Corresponding author E-mail: [email protected]
837
A new Fuzzy-LOGIC based Model for Chlorophyll-a in Pulicat Lagoon, India
Santhanam, H.1 and Amal Raj, S. 2*
1 Centre for Earth Sciences, Indian Institute of Science, Bangalore – 560 012, India2 Centre for Environmental Studies, Anna University-Chennai, Chennai 600 025, India
ABSTRACT: Coastal lagoons are complex ecosystems exhibiting a high degree of non-linearity in thedistribution and exchange of nutrients dissolved in the water column due to their spatio-temporal characteristics.This factor has a direct influence on the concentrations of chlorophyll-a, an indicator of the primary productivityin the water bodies as lakes and lagoons. Moreover the seasonal variability in the characteristics of large-scalebasins further contributes to the uncertainties in the data on the physico-chemical and biological characteristicsof the lagoons. Considering the above, modelling the distributions of the nutrients with respect to thechlorophyll-concentrations, hence requires an effective approach which will appropriately account for thenon-linearity of the ecosystem as well as the uncertainties in the available data. In the present investigation,fuzzy logic was used to develop a new model of the primary production for Pulicat lagoon, Southeast coast ofIndia. Multiple regression analysis revealed that the concentrations of chlorophyll-a in the lagoon was highlyinfluenced by the dissolved concentrations of nitrate, nitrites and phosphorous to different extents overdifferent seasons and years. A high degree of agreement was obtained between the actual field values and thosepredicted by the new fuzzy model (d = 0.881 to 0.788) for the years 2005 and 2006, illustrating the efficiencyof the model in predicting the values of chlorophyll-a in the lagoon.
Key words: Coastal lagoon, Pulicat lagoon, Chlorophyll-a, Fuzzy logic, Multiple Regression analysis
INTRODUCTIONFrom the past, several studies have been undertaken
till date to understand the complex physico-chemicalcum biological characteristics of coastal lakes andlagoons (Praveena et al., 2008; Priju and Narayana,2007; Mensi et al., 2008) and their inter-relationships,and the different techniques are available to model theirbiogeochemical interactions. However, sincesuccessful interpretation of scientific data on lagoonsis critical for designing an effective modelling approach,it is imperative to utilise the available scientificknowledgebase on lakes and lagoons to build amethodology to model the lagoon characteristics toaid in the effective management these intriguing coastalecosystems.
The use of simple ecological models in assessingthe status of ecosystems as lakes and lagoons hasbeen abundantly recorded in the scientific literatureover the past centuries. The earliest of these approacheswas by Lotka (1925) and Volterra (1926) who expressedchange in a single population as a function of aconstant birth rate and death rate. Riley (1947) had, bythe use of a model of an ecosystem, projected changesin the herbivores per unit biomass as the sum of a
constant assimilation balance against temperaturedependant respiration, carnivorous predation and thenatural mortality of that system. Further, Riley (1946)had created a coupled model to calculate steady stateplankton population levels for North Atlantic Ocean.
Empirical budgeting approaches have also beenpopular with researchers worldwide. Most widely usedapproach is the budgeting proposed by the budgetingnode of Land-Ocean Interaction in Coastal Zone(LOICZ) of the International Geosphere-BiosphereProgramme (IGBP). With the biogeochemical modellingguidelines developed by LOICZ (Gordon et al., 1996)to implement nutrient budgets, several reports ofapplications of the model have been availabledescribing the testing and use of the approach forCNP (Carbon Nitrogen Phosphorus) budgets inestuarine and coastal systems (Smith & Crossland,1999; Smith et al., 1999, Dupra et al., 2000a & b). In theIndian scenario, Girija et al. (2005) had described thedevelopment of a two-dimensional depth-averagedhydrodynamic model and simulation of the currentsand salinity corresponding to monsoonal regime aswell as lagoon mouth conditions for Chilika lagoon in
www.SID.ir
Archive of SID
838
Santhanam, H. and Amal Raj. S
India. More recently, Gupta et al. (2006) provided thebudgets of nitrogen and phosphorus constructedusing LOICZ approach for Muthupet lagoon.
However, despite recounting the experiences ofmodelling coastal lagoons from various researchersworldwide, these studies have at the same time,indicated the need for realistic and simple models ofecosystem for unique coastal ecotones such aslagoons. For example, in their study of the role ofcarbonate dissolution in determining the complexdynamics of dissolved inorganic carbon in estuarineecosystems such as Gautami - Godavari estuary,Bouillon et al. (2003) had indicated that at least a simpleand reliable nutrient budgeting of the coastal zone wasnecessary for quantifying the changes in thebiogeochemistry and productivity of the coastalecosystems.
At present, a complete study of the various sourcesof external inputs and internal transformation in acoastal lagoon in connection with its productivity is,at large, a subject that requires greater introspectionin India. Given the multi-faceted role of a coastal lagoonas an socio-economic lifeline, an eco-cultural entity aswell as a environmental laboratory for research,modelling the biology and hydro-chemicalcharacteristics, albeit a necessary component forsustainable management of these resources, remainsan gargantuan scientific quest with little direction andlots of uncertainties.
However, modelling the ecosystem status andpredicting productivity within large basins of highspatio-temporal and seasonal variability is the greatestchallenge at present for the modellers. While differentmodelling techniques are available to represent theseecosystems, their applicability is often limited to thosesystems having similar conditions to the range of dataprescribed in these models (Soyupak and Chen, 2004).Further, these empirical or statistical models do notconsider the spatio-temporal aspects of the lagoons.Rast et al (1983) carried out an assessment of thepredictive power of the available simple empiricalmodels for primary productivity and found that thepredicted values of the chlorophyll-a were within afactor of ± 3 in all lakes.
Dynamic water quality modelling software such asCE-QUAL is more accurate, and includes the spatio-temporality of the lagoons as a factor in modelling.Using differential equations, they help to investigatethe relationships between the physico-chemical orbiological mechanisms. But these involve expensiveand time-consuming data collection as well asextensive numerical calculation (Soyupak and Chen,2004) in which the potential for error is greater with
increasing complexity in calculation. Hence, thecombination of uncertainty in data and complexity incalculation may give erroneous results.
In the past few years, soft computing techniques,such as fuzzy logic, neural networks and cellularautomata that are capable of handling the uncertaintyin data and analysis have been used in ecosystemmodelling (Rene and Saidutta, 2008; Nakane andHaidary, 2010; Tuzkaya and Gulsun, 2008). Fuzzy logicsystems can be used to model non-linear relationshipseasily and effectively even when only limited data isavailable (Silvert, 1997). Fuzzy rules provide a common-sense description of the action of the system and theinformation in a fuzzy-logic system are processed interms of fuzzy sets defined through an associatedmembership function. The ability of the fuzzy logicsystems, being universally approximators and also well–defined functions mapping real-value input to real-value output has made them powerful tools forexploring complex non-linear biological problems in thecontext of an ecosystem.
MATERIALS & METHODSThe study area for the present investigation is
situated near the village of Pulicat Town, located about60 km from Chennai city (Fig. 1). It is a coastal inlandwater embayment in the form of a lagoon, known asthe Pulicat lagoon, which is the second largestbrackish water lake in India. Geographically the coastallagoon is situated between latitudes 13° 25´– 13° 55´N and longitudes 80° 03 ́– 80°19 ́E with and an altitudeof 0-10 m (Azariah, 1988). The lagoon is a cross-boundary ecosystem extending between theneighbouring states of Andhra Pradesh (AP) and TamilNadu (TN). According to WWF report (1993), about84% of the Pulicat Lake ecosystem lies in AP. Itoccupies a total area 650 km2 with a high tide waterspread area of about 178 m2 (Rao and Rao, 1975). Theentire lake is a huge evaporating basin and hasbeen known to fall 3.9 feet below the mean sealevel during April – May and June. The lake isabout 60 km in length and 0.2 to 17.5 km in width.The total area of about 72,000 ha includes about 20,000ha (27.7%) of swamps to north of the lake. It has ahigh water spread area of 460 Km and low waterspread area of 250 Km. The seawater enters the lakethrough two bar mouths located at the north and southends of the lagoons (WWF, 1993). The lake is shallowwith an average depth of about 1.5 m; the maximumdepth being 9.0 m near the entrance to the sea. Thelake is separated from the Bay of Bengal by aninland spit called the Sriharikota Island, which iscurrently used as a launching pad of India’s spaceresearch programme. The main source of fresh water
www.SID.ir
Archive of SID

Int. J. Environ. Res., 4(4):837-848, Autumn 2010
839
80° 20'0" E
80°20 '0"E
80°10 '0"E
80°1 0'0"E
80°0 '0"E
80°0'0 "E
13°5
0'0"
N
13°5
0'0"
N
13°4
0'0"
N
13°4
0'0"
N
13°3
0'0"
N
13°3
0'0"
N
µ
4 0 42 km
B A YO F
B E N G A L
PU L I C AT L AG O O N
Ven adu
I rak kam
Sr ih ariko ta Is lan d
Ka lang i R ive r
A raniar R iver
IN D IA
Legen dRoad
Railw ay T rack
River
Pulica t lago on
Islan d
Back w ater
Lan d
Sea
N
80° 20'0" E
80°20 '0"E
80°10 '0"E
80°1 0'0"E
80°0 '0"E
80°0'0 "E
13°5
0'0"
N
13°5
0'0"
N
13°4
0'0"
N
13°4
0'0"
N
13°3
0'0"
N
13°3
0'0"
N
µ
4 0 42 km
B A YO F
B E N G A L
PU L I C AT L AG O O N
Ven adu
I rak kam
Sr ih ariko ta Is lan d
Ka lang i R ive r
A raniar R iver
IN D IA
Legen dRoad
Railw ay T rack
River
Pulica t lago on
Islan d
Back w ater
Lan d
Sea
NN
Fig. 1. Study Area
to the lake is due to the run-off by 3 seasonal rivers,which open into the lake. Of these rivers, river Araniflows at its southern side and Kalangi (Chacko et al.,1953; Rao and Rao, 1975) at its mid western regionwhile Swarnamukhi scarcely joins the northern endof the lagoon. Fresh water input is effective only duringthe North East monsoon (October to December). Thespecies composition and hydrobiology of Pulicatlagoon are well documented from earlier investigations(Krishnan and Sampath, 1972; ENVIS Report, 2001;Ramesh and Ramachandran, 2002 and Rema Devi etal., 2004) which provide specific information on itscharacteristics.
Pulicat lagoon and its environs serve as a goodfeeding and breeding ground for a variety of aquaticand terrestrial birds. About 16 island villages and atotal of 97 other villages adjoining the water bodyare directly or indirectly dependent on the it fortheir livelihood. The lagoon supports a richbiodiversity of high biomass of fish, prawn,crustaceans and plankton, which form the principle
source of food for the birds. An estimated number of15,000 flamingos and other birds like grey pelicans,painted storks, grey herons, ducks, teals, terns, herons,gulls, a number of waders and several other migratorywater birds have been reported to visit Pulicat everyyear (Azariah, 1988). Despite the availability of dataon the characteristics of the lagoon, a comprehensivemodelling study for representing the lagoon status ishitherto lacking. The present investigation henceassumes the importance of providing the first modellingstudy aimed to represent the primary productivity ofthe lagoon considering the influence of the otherphysico-chemical factors that influence the lagoonproduction.
Water samples collected from 12 sampling pointsin Pulicat lagoon (Fig. 2) in the years 2005 and 2006were analyzed for the following physico-chemicalparameters Water Temperature, Extinction Coefficient(Secchi disk depth), Dissolved Oxygen, bicarbonate,Calcium, Chloride, Silicate, Ammonia Nitrogen, NitriteNitrogen, Nitrate Nitrogen and Inorganic Phosphate
www.SID.ir
Archive of SID

840
Model for Chlorophyll-a in Pulicat Lagoon
NN
along with chlorophyll-a according to the methods foranalyses described in Strickland and Parsons (1965).The data on water quality was used to determine therelationships of these physico-chemical parameters tothe productivity of the lagoon (represented bychlorophyll-a) using in two steps –
1. Constructing a multiple regression model (toidentify the important factors influencing chlorophyll-a production in the lagoon) and,
2. Using fuzzy logic to construct a fuzzy modelto determine the chlorophyll-a concentrations in thelagoon.
For this modelling study, the data on the waterquality for the years 2005 and 2006 were used. For theselection of the variables for fuzzy modelling, a multipleregression analysis was performed as follows. Soyupakand Chen (2004) had constructed a multiple regressionmodel assuming that chlorophyll-concentrations couldbe modelled as linearly dependant to the measuredwater quality parameters.
These water quality variables exhibit high temporalvariability from season to season for any samplingstation. Since the system is very large the observationsfor any season can be assumed as representing pseudosteady state conditions within that season. The
Fig. 2. Sampling Locations in Pulicat Lagoon
chlorophyll-a concentrations can be modelled aslinearly dependent to the measured water qualityvariables if classical multiple regression modelassumption is considered as applicable. The sameassumption is adopted in the present study and amultiple regression model (Equation 1) in the followingform was used to calculate the concentrations ofchlorophyll-a from the concentrations of the waterquality parameters:
)( aChly −=
ε++++
+++
++++
+++
+++=
414313212
411310
98376
543
210
POaNOaNOa
NHaSiOa
ClaCaaHCOaDOa
salinityapHaDeptha
ExtCoeffaTempaa
(1)
www.SID.ir
Archive of SID

Int. J. Environ. Res., 4(4):837-848, Autumn 2010
Where, ai (i = 0-14) are the regression coefficients,ε is the error term which is normally distributed (ε ~N(0,σ2),Temp = Temperature (°C)ExtCoeff = Extinction Coefficient (m)DO = Dissolved Oxygen (mL/L)HCO3 = Bicarbonate (mg/L)Ca = Calcium (mg/L)Cl = Chloride (mg/L)SiO3= Silicate (mg/L)NH4 = Ammoniacal Nitrogen (µg/L)NO2 = Nitrite Nitrogen (µg/L)NO3 = Nitrate Nitrogen (µg/L)PO4 = Phosphate (µg/L)
For the regression equation to be valid to be usedfor predictions, it must reflect the regression model forthe population. The regression statistics including the
Multiple R (used to measure the strength of therelationship between the independent variables anddependent variable); the R Square, Adjusted R Squareand the Standard Error were obtained from the analysesand are summarized in Tables 1 to 4 along with theAnalysis of Variance (ANOVA) table. From the ANOVAtable, the F-statistic and the significance F are used totest the validity of the regression. In the present studyrelationships between the physico-chemical parametersof water quality derived from earlier analyses were usedto formulate the fuzzy rules which describe thesecomplex inter-relationships in logical statements. Theobserved values were normalised to a scale of 0 to 1for fuzzification using the Fuzzy Logic Toolbox ofMATLAB 7.0 software. This process yielded the fuzzymemberships functions (FMF) that defined how eachpoint in the input space was mapped to a membershipvalue (also called the ‘degree of membership’ denotedas‘d’ between 0 and 1.
Regression Statistics Multiple R 0.826621717 R Square 0.683303462 Adjusted R Square 0.190664404 Standard Error 0.009439559
ANOVA
df SS MS F Significance F Regression 14 0.001730279 0.000123591 1.387026567 0.316285563 Residual 9 0.000801947 8.91053E-05 Total 23 0.002532227
Coefficients Standard
Error t Stat P-value
Significance Intercept -0.010 0.257 -0.040 0.969 -
Temperature 0.003 0.007 0.419 0.685 N Extinction Coefficient -0.008 0.011 -0.728 0.485
N
Depth 0.003 0.019 0.146 0.887 N
pH 0.001 0.010 0.075 0.942 N
Salinity -0.001 0.002 -0.643 0.536 N
DO 0.003 0.008 0.404 0.696 N
Bicarbonate 0.000 0.000 0.751 0.472 N
Calcium 0.000 0.000 1.278 0.233 N
Chloride 0.000 0.000 -1.001 0.343 N
Silicate 0.000 0.000 0.796 0.447 N
Ammonia-N 0.000 0.000 0.731 0.483 N
Nitrite-N 0.001 0.001 0.605 0.560 N
Nitrate-N 0.000 0.000 -0.297 0.773 N
Phosphate-P 0.000 0.000 -0.913 0.385 N Significant / most influential variables: none
Table 1. Summary Of the Output for Multiple Regression Analysis For Post Monsoon Season
841
www.SID.ir
Archive of SID

842
Santhanam, H. and Amal Raj. S
Table 2. Summary of the output for multiple regression analysis for summer season
Regression Statistics Multiple R 0.907401565 R Square 0.823377601 Adjusted R Square 0.548631646 Standard Error 0.01146902
ANOVA
df SS MS F Significance F Regression 14 0.005518847 0.000394203 2.996868876 0.05139974 Residual 9 0.001183846 0.000131538 Total 23 0.006702693
Coefficients Standard Error t Stat P-value Significance
Intercept -0.436 0.352 -1.240 0.246 - Temperature 0.012 0.010 1.212 0.257 N Extinction Coefficient -0.020 0.022 -0.917 0.383 N Depth -0.108 0.057 -1.893 0.091 Y pH -0.015 0.008 -1.952 0.083 Y Salinity 0.003 0.001 2.304 0.047 Y DO 0.013 0.010 1.222 0.253 N Bicarbonate 0.000 0.000 1.007 0.340 N Calcium 0.000 0.000 -2.837 0.019 Y Chloride 0.000 0.000 2.318 0.046 Y Silicate 0.000 0.000 -2.945 0.016 Y Ammonia-N 0.000 0.000 0.781 0.455 N Nitrite-N -0.003 0.001 -3.416 0.008 Y Nitrate-N 0.000 0.000 -1.034 0.328 N Phosphate-P 0.000 0.000 0.378 0.714 N
Significant / most influential variables: Depth, pH, Salinity, Calcium, Chloride, Silicate ions, Nitrite-N
If X is the input space containing the differentparameters and its elements are denoted by x, then afuzzy set Ain X is defined as a set of ordered pairsrepresented in a general form as:
}|)(,{ XxxxA A ∈= µ (2)
Where,µA(x) = the fuzzy membership function (FMF) of x in A.This FMF (Equation 2) maps each element of Xcontaining the observed field values of allenvironmental parameters in the present study to amembership value between 0 and 1. In this way, fuzzymembership values (FMV) for each parameter fordifferent stations and seasons over two years 2005and 2006 were obtained by applying the FMFs andthese values were used in the development of thevarious fuzzy models in the present investigation.The Fuzzy Logic Toolbox of MATLAB 7.0 softwarewas used for the analyses in which the fuzzy decisionrules are determined by the choice of the FMFs. Thegeneral form of a fuzzy decision rule has been shownin below in Equation 3:
IFTemp is <L> or <H> or <M> or <E>, ExtCoeff is <L> or<H> or <M> or <E>, Depth is <L> or <H> or <M> or<E>, DO is <L> or <H> or <M> or <E>, Salinity is <L>or <H> or <M> or <E>, HCO3 is <L> or <H> or <M> or<E>, Ca is <L> or <H> or <M> or <E> , Cl is <L> or <H>or <M> or <E>, SiO3 is <L> or <H> or <M> or <E>, NH4is <L> or <H> or <M> or <E>, NO2 is <L> or <H> or<M> or <E>, NO3 is <L> or <H> or <M> or <E> , PO4 is<L> or <H> or <M> or <E>,THENy1 = [<fmvL> or <fmvH> or <fmvM> oe <fmvE>TEMP] +[<fmvL> or <fmvH> or <fmvM> oe <fmvE> DO] +[<fmvL> or <fmvH> or <fmvM> oe <fmvE> Depth] +[<fmvL> or <fmvH> or <fmvM> oe <fmvE> ExtCoeff] +[<fmvL> or <fmvH> or <fmvM> oe <fmvE> Salinity] +[<fmvL> or <fmvH> or <fmvM> oe <fmvE> HCO3] +[<fmvL> or <fmvH> or <fmvM> oe <fmvE> Cl] +[<fmvL> or <fmvH> or <fmvM> oe <fmvE> Ca] +[<fmvL> or <fmvH> or <fmvM> oe <fmvE> SiO3] +[<fmvL> or <fmvH> or <fmvM> oe <fmvE> NH4] +[<fmvL> or <fmvH> or <fmvM> oe <fmvE> NO3] +
(3)
www.SID.ir
Archive of SID

843
Int. J. Environ. Res., 4(4):837-848, Autumn 2010
Table 3. Summary of the output for multiple regression analysis for pre monsoon season
Regression Statistics Multiple R 0.894500129 R Square 0.800130481 Adjusted R Square 0.489222339 Standard Error 0.012477878
ANOVA
df SS MS F Significance F Regression 14 0.005609681 0.000400692 2.573526949 0.078763567 Residual 9 0.001401277 0.000155697 Total 23 0.007010958
Coefficients Standard Error t Stat P-value
Significance Intercept 0.196 0.463 0.423 0.682 - Temperature -0.010 0.011 -0.910 0.386 N Extinction Coefficient -0.007 0.099 -0.070 0.946
N
Depth 0.014 0.080 0.170 0.869 N pH 0.013 0.010 1.275 0.234 N Salinity -0.006 0.003 -2.148 0.060 Y DO -0.008 0.006 -1.353 0.209 N Bicarbonate 0.000 0.000 -1.459 0.179 Y Calcium 0.000 0.000 1.616 0.141 Y Chloride 0.000 0.000 2.724 0.023 Y Silicate 0.000 0.000 1.241 0.246 N Ammonia-N 0.000 0.000 -0.841 0.422 N Nitrite-N 0.000 0.001 0.757 0.468 N Nitrate-N 0.000 0.000 -0.219 0.832 N
Phosphate-P 0.000 0.000 1.734 0.117 Y Significant / most influential variables: Salinity, Bicarbonate, Calcium, Chloride, Phosphate-P
[<fmvL> or <fmvH> or <fmvM> or <fmvE> NO2] +[<fmvL> or <fmvH> or <fmvM> oe <fmvE> PO4]
Where,<fmv> denoted the fuzzy membership values of therespective fuzzy parameters to be the estimated,L = Low membership valueH = High membership valueM= Medium membership valueE = Extreme membership value
In this manner a set of fuzzy rules were derived andthe membership values for chlorophyll-a were derivedusing these rules. These were subjected to the processof defuzzification for fuzzy reasoning. The ‘min’operator was applied to the fuzzy membership functions(FMF) from each rule as given below (Equation 4):For Rule i ( i = 1 to n) :
Wi, t = min [FMV (Temp, Ai) + FMV (DO, Ai) + FMV(SAL, Ai)+……..+ FMV (PO, Ai)] (4)
Where, Ai is the fuzzy set defined in the ‘If’ part of theRule i ( i = 1 to 16).For each rule the modelled value of y is calculated bythe ‘Then’ part of the rule base and the final output ofthe fuzzy model is defuzzified using the weightedaverage as given in Equation 5 :
∑
∑
=
==N
iti
ti
N
i
w
y
1,
,1
ti,
ti,
w
y (5)
The results of the multiple regression analyses andthe fuzzy model have been summarized in the followingsection under Results and discussions.
RESULTS & DISCUSSIONIn general it is understood from the results of the
ANOVA obtained, that if the calculated F is higherthan the significance F, the null hypothesis can be
www.SID.ir
Archive of SID
844
Model for Chlorophyll-a in Pulicat Lagoon
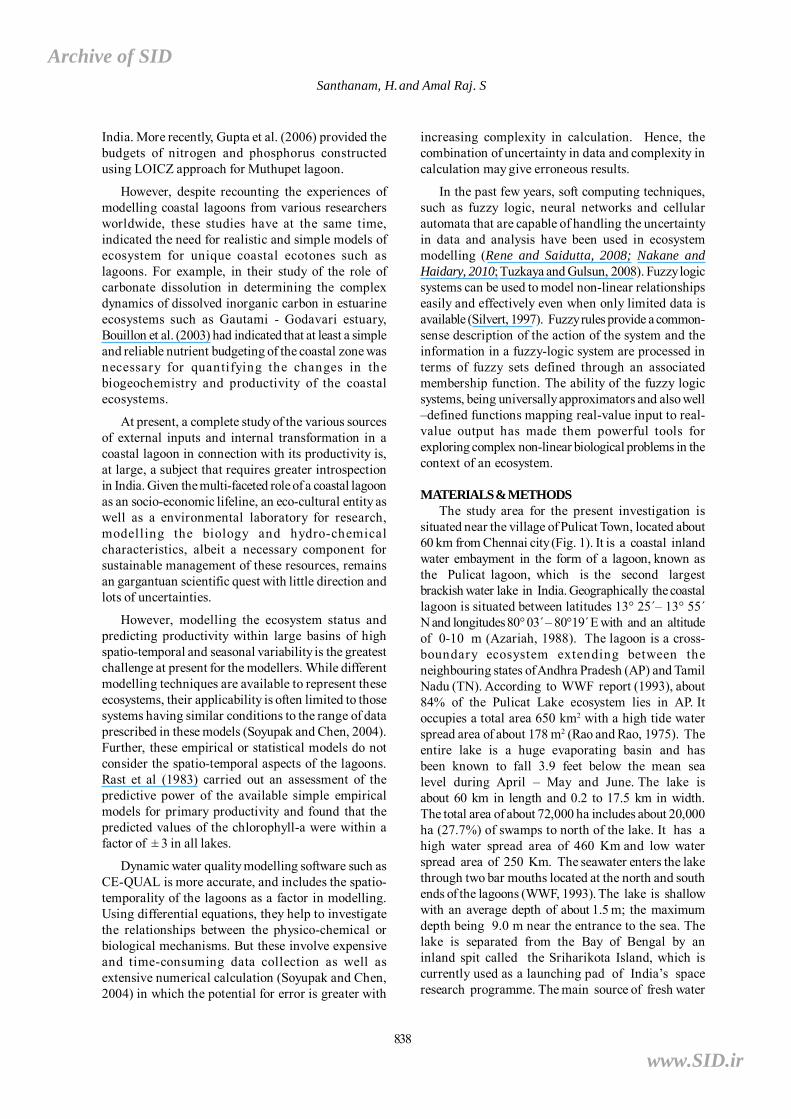
Table 4. Summary of the output for multiple regression analysis for monsoon season
Regression Statistics Multiple R 0.82788733 R Square 0.685397431 Adjusted R Square 0.196015658 Standard Error 0.005065188
ANOVA
df SS MS F Significance F Regression 14 0.000503053 3.59324E-05 1.400537308 0.310885417 Residual 9 0.000230905 2.56561E-05 Total 23 0.000733958
Coefficients Standard Error t Stat P-value
Significance Intercept -0.407 0.221 -1.846 0.098 - Temperature 0.016 0.008 2.050 0.071 Y Extinction Coefficient -0.003 0.001 -1.983 0.079
Y
Depth 0.005 0.005 0.906 0.388 N pH -0.007 0.005 -1.436 0.185 Y Salinity 0.004 0.002 1.618 0.140 Y DO 0.004 0.003 1.430 0.187 Y Bicarbonate 0.000 0.000 1.349 0.210 N Calcium 0.000 0.000 -0.232 0.822 N Chloride 0.000 0.000 -1.707 0.122 Y Silicate 0.000 0.000 1.203 0.260 N Ammonia-N 0.000 0.000 -1.466 0.177 Y Nitrite-N 0.000 0.000 0.352 0.733 N Nitrate-N 0.000 0.000 0.459 0.657 N
Phosphate-P 0.000 0.000 0.598 0.565 N Significant / most influential variables: Temperature, Extinction Coefficient, pH, Salinity, DO, Chloride,Ammonia-N
rejected and it is then concluded that at least one ofindependent variable is correlated to the dependentvariable. In the present study, the calculated F (shownin the Tables 1 to 4) is high and significance F valuesare all close to zero, therefore, the null hypothesishas been rejected and it was concluded that at leastone of the independent variable explains thevariations in the dependent variable. Thus the validityof the multiple regression models was verified. Theanalysis of the residuals for homogeneity alsoindicated that the model is valid and therefore we canperform a statistical test for the significance of theregression variables which is summarized in Tables 1to 4.
Hence, from these tables, the following variableswere considered influential and were focused uponfor the model development - Depth, pH, Salinity,Calcium, Chloride, Silicate ions, Nitrite-N, Bicarbonate,
Phosphate, Temperature, Extinction Coefficient, DO,Ammonia-N. As mentioned in the methodology, thefuzzy model for predicting the chlorophyll-concentrations was constructed and the resultsobtained were analysed from which the major trendsobserved in the relationship between chlorophyll aand the other parameters were inferred. The trends inthe chlorophyll-a distribution obtained from the modelindicate that the productivity of the algal biota in thelagoon is influenced by the amount of availablenutrients in the water column, the temperature of thewater and the depth of the water column. Further, theresults obtained showed that the chlorophyll–aproduction was highly influenced by seasonalconcentrations of dissolved oxygen, nitrates, nitrites,phosphates and ammonia. The performance of themodel has been discussed below. Tables 5 and 6 showthe differences between the observed and predictedvalues of chlorophyll-concentrations for the years
www.SID.ir
Archive of SID

Int. J. Environ. Res., 4(4):837-848, Autumn 2010
Post monsoon Summer Pre monsoon Monsoon Sampling
Stations Predicted
Values
(µg/L)
Observed
values
(µg/L)
Predicted
Values
(µg/L)
Observed
values
(µg/L)
Predicted
Values
(µg/L)
Observed
values
(µg/L)
Predicted
Values
(µg/L)
Observed
values
(µg/L)
1 0.12 0.40 0.19 0.34 0.23 0.28 0.16 0.70
2 0.00 0.25 0.90 0.30 0.45 0.22 0.25 0.57
3 0.55 0.36 0.87 0.30 0.10 0.26 0.11 0.37
4 0.00 0.01 0.14 0.32 0.22 0.21 0.23 0.57
5 0.00 0.28 0.18 0.33 0.21 0.25 0.27 0.37
6 0.11 0.32 0.25 0.35 0.26 0.28 0.24 0.48 7 0.18 0.34 0.19 0.34 0.27 0.29 0.17 0.74
8 0.45 0.39 0.25 0.35 0.23 0.32 0.17 0.41
9 0.32 0.37 0.56 0.39 0.58 0.31 0.24 0.40
10 0.08 0.31 0.79 0.41 0.89 0.27 0.27 0.84
11 0.02 0.24 0.13 0.32 0.12 0.22 0.2 0.37
12 0.14 0.33 0.14 0.32 0.08 0.28 0.09 0.31
Table 5. Observed and predicted values of chlorophyll-a concentrations from fuzzy model for the year 2005
2005 and 2006. In order to evaluate the modelperformance, a statistical measure called the ‘degreeof agreement’ has been used to determine the extentto which the model predictions are error free. Degreeof agreement is a statistical measure of model
Table 6. Observed and predicted values of chlorophyll-a concentrations from fuzzy model for the year 2006
Post monsoon Summer Pre monsoon Monsoon Sampling
Stations Predicted
Values
(µg/L)
Observed
values
(µg/L)
Predicted
Values
(µg/L)
Observed
values
(µg/L)
Predicted
Values
(µg/L)
Observed
values
(µg/L)
Predicted
Values
(µg/L)
Observed
values
(µg/L)
1 0.14 0.32 0.11 0.37 0.21 0.31 0.23 0.72
2 0.05 0.19 0.70 0.33 0.22 0.25 0.21 0.59
3 0.70 0.29 0.27 0.33 0.12 0.29 0.19 0.39
4 0.02 0.04 0.1 0.35 0.13 0.24 0.1 0.59
5 0.03 0.30 0.11 0.36 0.19 0.28 0.16 0.39
6 0.60 0.33 0.21 0.38 0.15 0.31 0.23 0.50
7 0.19 0.34 0.13 0.37 0.17 0.32 0.16 0.76
8 0.23 0.39 0.19 0.38 0.27 0.35 0.17 0.43
9 0.16 0.37 0.44 0.42 0.34 0.34 0.15 0.42
10 0.17 0.24 0.32 0.44 0.33 0.30 0.90 0.86
11 0.09 0.23 0.11 0.35 0.27 0.25 0.18 0.39
12 0.12 0.31 0.12 0.35 0.19 0.31 0.1 0.33
performance advocated by Willmot (1982) and Willmotet al., (1985). The value of the degree of agreement(d) is reflects the degree to which the observedvariant is accurately estimated by the simulatedvariant. In the present case, it determines the degree
845
www.SID.ir
Archive of SID

Santhanam, H. and Amal Raj. S
of match between the observed and predictedchlorophyll-a concentration. Being a standardisedmeasure,‘d’ can be easily interpreted and cross-comparisons of its magnitudes for a variety of modelsregardless of units can be easily made (Willmot, 1982).It varies between 0 and 1, in which a computed valueof 1 indicates perfect agreement between the observedand predicted observations, while 0 denotes completedisagreement. In the present study, the degree ofagreement (d) was calculated using the followingformula provided in Equation 6:
∑
∑
=
=
−+−
−
−=N
iii
N
iii
OOOP
OP
d
1
2
1
2
|]||[|
)(
1 (6)
Where,d = Degree of agreement,Pi = Predicted value or simulated variateOi = Observed value or variateŌ = Average of observed valuesN = number of observations
Table 7 shows the degree of agreement (d)between the predicted chlorophyll-a from waterquality variables with the observed values. Thevalue of d was found to range between 0.876 to0.788 over the different seasons and years. Ingeneral, the performance of the model (Table 7) isfound to be higher in the year 2005 (d = 0.876 to0.799) than in 2006 (d = 0.881 to 0.788). The highestdegree of agreement between the observed andpredicted values was observed in the post -monsoon (0.854 and 0.881 in 2005 and 2006respectively) and pre-monsoon seasons (0.876 and0.856 in 2005 and 2006 respect ively) . The
Table 7. Degree of agreement between predicted values from fuzzy model and observed values of chlorophyll-a
SEASON YEAR DEGREE OF AGREEMENT (d)
2005 0.854 POST MONSOON
2006 0.881
2005 0.840 SUMMER
2006 0.835
2005 0.876 PRE MONSOON
2006 0.856
2005 0.799 MONSOON
2006 0.788
performance of the model for the summer andmonsoon seasons was found to be lower whencompared to the post-monsoon and pre-monsoonperiods. This is an interesting point to be noted asit is clear from the present investigation that thesea sona l dis t r ibut ion of t he n utr ien ts andchlorophyll-a being highly non-linear, cannot bemodelled using a formalised approach strictly as amathematical or numerical approach.
CONCLUSIONThe present investigation indicates that the
productivity of the algal biota in the lagoon asevidenced by the production and distribution ofchlorophyll-an in Pulicat lagoon, was highlyinfluenced by seasonal concentrations of dissolvedoxygen, nitrate and nitrite nitrogen, phosphates andammonia present in the dissolved form in the water.The present investigation has hence highlightedthe impor tant factor s affecting the primaryproduction of the lagoon, which is important to acoastal manager aiming for sustainable resourceutilisation of the lagoon.
The modelling attempt described in the presentstudy has proven the efficiency in the use of fuzzylogic to model non-l inear r ela t ionsh ips ofecosystem parameters easily and effectively evenwhen only limited data is available. From the resultsof the present study, it is clear that the non-linearityin the distribution of the nutrients (which in turnaffect the productivity of the lagoon) definitely playan importan t factor in affect ing the modelperformance and only when this aspect of multi-environmental ecosystems as coastal lagoons isconsidered while modelling, can the resultsobtained give a reasonable and meaningful picture.Thus, the present investigation has highlighted theeffectiveness of logic-based model such as the one
846
www.SID.ir
Archive of SID

Int. J. Environ. Res., 4(4):837-848, Autumn 2010
developed presently in modelling a complexenvironment as coastal lagoons.
ACKNOWLEDGEMENTThe authors are extremely grateful to Dr. A.
Navaneetha Gopalakr ishnan, Professor andDirector, Centre for Environmental Studies, AnnaUniversity, Chennai (CES), Dr. K. Thanasekaran,Professor, CES and Dr. K. Palanivelu, AssistantProfessor, CES, for their suggestions, support andencouragement. The authors express their thanksto All India Council for Technical Education(AICTE), New Delhi for the ‘National DoctoralFellowship’ (NDF) received by the first author forpursuing her Ph.D of which this study comprises apart.
REFERENCESAzariah. J, Banth, P., Azariah, H. and Selvam, V. (1988)Impact of urbanization in the status of mangroveswamps of Madras, In: The Ecology and Managementof Wetlands. Volume 2: Management, Use and Value ofWetlands, D.D Hook (Ed.), Timber Press, Portland,Oregon. USA, pp. 225 - 233. Reprinted in: Bulletin No. 4Madras. Fisheries Investigation of Madras, pp 1-24.
Bouillon, S, Frankignoulle, M., Dehairs, F., Velimirov, B,Eiler, A, Abril, G, Etcheber, H and Borges, A.V (2003)Inorganic and organic carbon biogeochemistry in theGautami Godavari estuary (Andhra Pradesh, India) duringpre-monsoon: The local impact of extensive mangroveforests. Global Biogeochem. Cycles, 17 (4), 25-1 to 12.
Chacko, P. I., Abraham, J. G. and Andal, R. (1953) Reporton a survey of the flora, fauna and fisheries of Pulicat lake,Madras, India’ Cent. Freshwater Fish Biol., 8, 1-20.
Dupra, V., Smith, S. V., Crossland, J. I. M. and Crossland,C. J. (2000a). Estuarine systems of the South China Searegion: carbon, nitrogen and phosphorus fluxes’ LOICZReports and Studies 14, LOICZ, Texel, The Netherlands,156 pp, from : http://www.loicz.org/products/publication/reports/index.html.en
Dupra, V., Smith, S. V., Marshall Crossland, J. I. andCrossland, C. J. (2000 b) ‘Estuarine systems of the SouthAmerican region: carbon, nitrogen and phosphorus fluxes’LOICZ Reports and Studies 15, LOICZ, Texel, TheNetherlands, 87 pp, from : http://www.loicz.org/products/publication/reports/index.html.en
Jayaraman, G., D. Rao, A., Dube, A. and Pratap K. andMohanty, P. K. (2000) Numerical Simulation of Circulationand Salinity Structure in Chilika Lagoon, J. of Coast.Research, 22,195-211.
Gordon, Jr., D. C., P. R. Boudreau, K. H. Mann, J. -E.Ong, W. L. Silvert, S. V. Smith, G. Wattayakorn, F. Wulff
and Yanagi, T. (1996) LOICZ Biogeochemical ModellingGuidelines. LOICZ Reports & Studies No 5, pp 1-96,from: http://www.loicz.org/products/publication/reports/index.html.en
Gupta , G. V. M., Natesan, U., Ramana Murthy, M. V.,Sravan Kumar, V. G., Viswanathan, S., Bhat, M. S., KumarRay, A. and Subramanian, B. R. (2006) ‘Nutrient budgetsfor Muthupet lagoon, Southeastern India’, Curr. Sci., 90(7), 967-972.
Krishnan , P. and Sampath, V. (1972). Report onDevelopment of Pulicat Lake and its Fisheries,Department of Fisheries, Government. of Tamil Nadu,1-60.
Lagoons of India State-of-the-art report, (2001) ENVISPublication Series: 3/2001 CAS in Marine Biology,Parangipettai.
Lotka, A. J . (1925). Elements of physical biology’ ,Williams and Wilkins, Baltimore, MD. Reprinted in 1956:Elements of mathematical biology. Dover Publications, Inc.,New York.
Mensi, Gh. S., Moukha, S., Creppy, E. E. and Maaroufi,K. (2008).Metals Accumulation in Marine Bivalves andSeawater from theLagoon of Boughrara in Tunisia (NorthAfrica). Int. J. Environ. Res., 2 (3), 279-284.
Nakane, K. and Haidary, A. (2010).Sensitivity Analysisof Stream Water Quality and Land Cover Linkage ModelsUsing Monte Carlo Method. Int. J. Environ. Res., 4 (1),121-130.
Praveena, S. M., Ahmed, A., Radojevic, M., Abdullah, M.H. and Aris, A. Z. (2008).Heavy Metals in MangroveSurface Sediment of Mengkabong Lagoon, Sabah:Multivariate and Geo-Accumulation Index Approaches.Int. J. Environ. Res., 2 (2), 139-148.
Priju, C. P. and Narayana, A. C. (2007). Heavy and TraceMetals in Vembanad Lake Sediments. Int. J. Environ. Res.,1 (4), 280-289.
Ramesh, R. and Ramachandran, S. (2002). CoastalEnvironment and Management – Anna UniversityPublication’, 389 pp.
Rao, N. V. N. D. and Rao, M. P. (1975). AqueousEnvironment’s in the Pulicat Lake, East coast of India.R. Natarajan (Eds), Resent Researches in EstuarineBiology, Hindustan Publishing Corporation (I) Delhi(India), pp.109-122.
Rast, W., Lee, G. F. and Jones, R. A. (1983). Predictivecapability of U.S. OECD phosphorus loading - lakeresponse models’ J. Wat. Pollut. Cont. Fed., 55, 990-1003.
Rema Devi, K., Indra, T. J. and Raghunathan, M. B.(2004). Fisheries of Pulicat Lake. Rec. Zool. Surv. India,102 (Part 3-4), 33-42.
Rene, E. R. and Saidutta, M. B. (2008). Prediction ofWater Quality Indices by Regression Analysis andArtificial Neural Networks. Int. J. Environ. Res., 2 (2),183-188.
847
www.SID.ir
Archive of SID
Model for Chlorophyll-a in Pulicat Lagoon
Riley, G. A., and Bumpus, D. F. (1946). Phytoplankton –zooplankton relationships on Georges Bank’ J. of Mar.Res., 6 (1), 33-47.
Silvert, W. (1997). Ecological impact classification withfuzzy sets’, Ecol. Model., 96,1-10.
Smith, S. V. and Crossland, C. J. (Eds).(1999). AustralasianEstuarine Systems: Carbon, Nitrogen, and PhosphorusFluxes’ LOICZ reports and Studies No. 12. 182 pp. from: http://www.loicz.org/products/publication/reports/index.html.en
Smith, S. V., Marshall Crossland, J. I. and Crossland, C. J.(1999). Mexican and Central American coastal lagoonsystems: carbon, nitrogen and phosphorus fluxes’ LOICZReports and Studies 13, LOICZ, Texel, the Netherlands,115 pp. from : http://www.loicz.org/products/publication/reports/index.html.en
Soyupak, S. and Chen, D. (2004). Fuzzy logic model toestimate seasonal pseudo steady state chlorophyll-aconcentrations in reservoirs’. Env.Mod. and Ass., 9, 51-59.
Strickland, J. D. H and Parsons, T. R. (1965). A Manual ofseawater analyses, Fisheries Research Board of Canada,Ottawa, Bull., 2 (125), 117-124
Tuzkaya, G. and Gulsun, B. (2008). Evaluating centralizedreturn centers in a reverse logistics network: An integratedfuzzy multi-criteria decision approach . Int. J. Environ.Sci. Tech., 5 (3), 339-352.
Volterra, B. (1926). Fluctuations in the abundance of aspecies mathematically Nature, 118, 558-560.
Willmot, C. J. (1982). Some comments on the evaluationof model performance, Bull. Amer. Meteo. Soc., 63, 1309-1313.
Willmot, C. J., Ackleson, S. G., Davis, R. E., Feddema, J.J., Klink, K. M., Legates, D. R., O’Donnel, J. and Powe,C. M. (1985). Statistics for evaluation and comparison ofmodels’, J. Geophy. Res., 90, 8995-9005.
WWF, (1993). Directory of Indian Wetlands. Worldwide Fundof Nature, India. Asian Wetland Bureau. pp. 1 – 264, from,http://www.wwfindia.org.
848
www.SID.ir
Archive of SID