comradeship and cupidity in Gibraltar and neighbouring Spain ...

This article appeared in a journal published by Elsevier. The attachedcopy is furnished to the author for internal non-commercial researchand education use, including for instruction at the authors institution
and sharing with colleagues.
Other uses, including reproduction and distribution, or selling orlicensing copies, or posting to personal, institutional or third party
websites are prohibited.
In most cases authors are permitted to post their version of thearticle (e.g. in Word or Tex form) to their personal website orinstitutional repository. Authors requiring further information
regarding Elsevier’s archiving and manuscript policies areencouraged to visit:
http://www.elsevier.com/copyright

Author's personal copyARTICLE IN PRESS
Chlorophyll maxima and water mass interfaces: Tidally induceddynamics in the Strait of Gibraltar
D. Macıas a,�, L.M. Lubian b, F. Echevarrıa a,c, I.E. Huertas b, C.M. Garcıa a
a Departamento de Biologıa, Area de Ecologıa, Facultad de Ciencias del Mar y Ambientales, Universidad de Cadiz, 11510 Puerto Real, Cadiz, Spainb Instituto de Ciencias Marinas de Andalucıa (ICMAN), CSIC, 11510 Puerto Real, Cadiz, Spainc Centro Andaluz de Ciencia y Tecnologıa Marina (CACYTMAR), 11510 Puerto Real, Cadiz, Spain
a r t i c l e i n f o
Article history:
Received 24 May 2007
Received in revised form
24 March 2008
Accepted 30 March 2008Available online 3 April 2008
Keywords:
Strait of Gibraltar
Atlantic jet
Tidal forcing
Deep chlorophyll maximum
Circulation schemes
Interfaces
Vertical structure
a b s t r a c t
A conceptual model proposing the distribution and dynamics of water masses and
chlorophyll maxima according to tidal cycle is presented for the Strait of Gibraltar. The
proposal is based on the analysis of data registered in a section along the strait at different
stages of the tidal cycle. Basic water characteristics were established from CTD casts
combined with bottle sampling. Composition and nature of the phytoplankton
assemblage were studied by analysis of chlorophyll, pulse amplitude modulated
fluorometry, flow cytometry and light microscopy analyses. The usual occurrence of
deep chlorophyll maximum (DCM) linked to pycnoclines and/or water mass interfaces
draws complicate patterns in the Gibraltar region, as three water masses (SAW, MOW and
NACW) meet in the upper layers of the water column. The results indicate that the
chlorophyll maxima found in the channel of the strait are not homogeneous and could be
classified into at least three types: Atlantic maxima, linked to the SAW–NACW interface;
suction maxima, present only in the SAW–MOW interface and deep maxima, associated
with the transition NACW–MOW on the eastern side of the strait. These chlorophyll
maxima are strongly associated with the different water mass interfaces and, even more,
to a specific water density following the movement of these water mass interfaces, which
is forced mainly by the tidal amplitude in this area. This study also adds new elements
supporting the hypothesis that some of the pulsating chlorophyll patches observed in the
strait could have a coastal origin, as their characteristics were clearly different from those
of other chlorophyll maxima detected in the channel but originating in the open sea.
& 2008 Elsevier Ltd. All rights reserved.
1. Introduction
One of the most distinct and ubiquitous biologicalfeatures in the world’s ocean is the presence of a deep(or sub-surface) chlorophyll maximum (DCM) associatedwith discontinuities in the water column, such asthe seasonal thermocline or the presence of haloclines,particularly where different water masses meet.This situation is often the case in semi-enclosed basins
(such as the Mediterranean or Baltic Sea) and coastal areaswhere river discharges create intense pycnoclines.
The existence of a DCM, in conjunction with seasonalvariations in the depth of the mixed layer, is of crucialimportance for explaining the annual cycle of primaryproduction in the open ocean (Gran, 1931; Sverdrup,1953). Thus, coupled biological–physical studies whichfocus on the interfaces separating different water massesare of particular relevance, since it is presumably in theseareas, characterised by marked gradients, where phyto-plankton cells tend to accumulate (Mann and Lazier, 1991;Rodrıguez et al., 1998).
Although the mechanism of DCM formation is stillunder debate, it can be attributed either to an increase in
Contents lists available at ScienceDirect
journal homepage: www.elsevier.com/locate/dsri
Deep-Sea Research I
0967-0637/$ - see front matter & 2008 Elsevier Ltd. All rights reserved.
doi:10.1016/j.dsr.2008.03.008
� Corresponding author. Tel.: +34 956 016025; fax: +34 956 016019.
E-mail address: [email protected] (D. Macıas).
Deep-Sea Research I 55 (2008) 832– 846
Author's personal copyARTICLE IN PRESS
the cell chlorophyll content due to photoadaptation(Taguchi et al., 1984); to an increase in phytoplanktongrowth rates due to the existence of a marked nutricline(Jamart et al., 1977; Cullen and Eppley, 1981) or tophysical accumulation of phytoplankton cells at interfaces(Herbland and Voituriez, 1979; Longhurst and Harrison,1989; Margalef, 1978; Ruiz et al., 2004).
The relationship between DCM, water masses andhydrodynamic conditions has been extensively studiedboth in the Mediterranean basin and in the Gulf of Cadiz,the two oceanographic regions connected by the Strait ofGibraltar. The existence of a DCM in the MediterraneanSea is of particular relevance; surface waters of this basinare typically very oligotrophic and the development ofvertical patterns of chlorophyll distribution is intimatelylinked both to the hydrographical characteristics atdifferent spatio-temporal scales (Estrada et al., 1999) andthe fertilisation mechanisms of the photic layer (Estradaet al., 1993; Moran et al., 2001). Moreover, Mediterraneanwaters are a mixture of different water masses withspecific thermohaline characteristics (Guibout, 1987; LaViolette, 1995); hence addressing the importance ofinterfaces on the development of DCM is of capitalimportance for the conjunct of this basin.
Phytoplankton biomass accumulation at density sin-gularities (pycnoclines) was recently demonstrated in theGulf of Cadiz, where chlorophyll maximum were clearlyassociated with the interface between the Surface AtlanticWaters (SAW) and the North Atlantic Central Waters(NACW) on the 26.6 isopycnal (Navarro et al., 2006). Theoccurrence of this maximum was explained by theexistence of a marked nutricline between both watermasses.
In the Strait of Gibraltar, the vertical distributionof DCM is likely to be far more complicated because ofthe simultaneous presence of different typical watermasses (SAW, NACW and Mediterranean OutflowingWater (MOW)), leading to the presence of multipledensity interfaces. In addition, due to the complexity ofthe hydrodynamic processes within the strait, some ofthese water masses appear intermittently (particularly theless abundant NACW, see Gascard and Richez, 1985;Macıas et al., 2006), creating considerable spatial andtemporal variations in the position and intensity ofinterfaces.
The average circulation through the strait can bedescribed as a two-layer inverse-estuarine exchange witha superficial inflow of Atlantic waters and a deep outflowof Mediterranean waters (Armi and Farmer, 1988).Circulation is maintained by the negative hydrologicalbudget of the Mediterranean basin, where evaporationexceeds precipitation plus river discharges (Bethoux,1979). However, this general scheme undergoes strongmodifications that are particularly noticeable at tidal scale(Garcıa-Lafuente and Vargas, 2003), as tide-forced flowsinteract with the sharp topography of the channel of thestrait. This interaction generates undulatory features atthe Atlantic–Mediterranean Interface (AMI) such as inter-nal bores (Boyce, 1975; Armi and Farmer, 1985) or internalwaves (Bruno et al., 2002). These processes can producevigorous interfacial mixing (Bray et al., 1995; Wesson and
Gregg, 1994), changing the properties of the Atlantic jet atit enters the Mediterranean.
Water mass distribution in the Atlantic jet andbiological patterns are highly related in this region(Gomez et al., 2001, 2004; Macıas et al., 2006), with tidalphase and magnitude (Macıas et al., 2006) or wind regimebeing the principle factors that control the discontinuous(horizontal entrainment) entrance of chlorophyll patchesinto the Alboran Sea. The vertical distribution of chloro-phyll is also expected to be linked to the dynamics of thewater masses, which show clear vertical segregation, withSAW at the surface, MOW in the deeper layers and NACWat mid-depths. Thus, three important contact zones can bedefined, SAW–NACW, SAW–MOW, and NACW–MOW,where according to previous observations (Macıas et al.,2006) using in vivo Chla fluorescence, DCM are likely tooccur. This discontinuity in the vertical composition of theDCM could be of particular relevance for the pelagicecosystem of the Alboran Sea as the discontinuousentrance of biogeochemical material should affect thecomposition and behaviour of the planktonic community.
Up to date, there is no specific study aimed to analysethe relationship between chlorophyll patches and watermasses and their interfaces in this oceanographic area.The highly dynamic nature of the physical structures andbiological patterns in the strait means that an extensivedata set is required in order to derive accurate conclusionsabout general trends. As tidal amplitude is a priori animportant source of variability, it was convenient to focusthe analysis on the observation of several tidal cycles.
Therefore, the main goals of this work were: (1) todetermine whether an accumulation of phytoplanktoncells could be observed at the different water interfacespresent in the Strait of Gibraltar, (2) relate their dynamicsto the stages of the tidal cycle and (3) characterise thepossible differences (in composition, source and origin) ofthe maxima observed. Using this information, a concep-tual model is developed that represents patterns of watermass circulation and biological variable distribution inrelation to the tidal cycle within the strait. This modelprovides new information about the origin and mecha-nisms involved in the formation of DCMs, a subject stillunder debate.
2. Material and methods
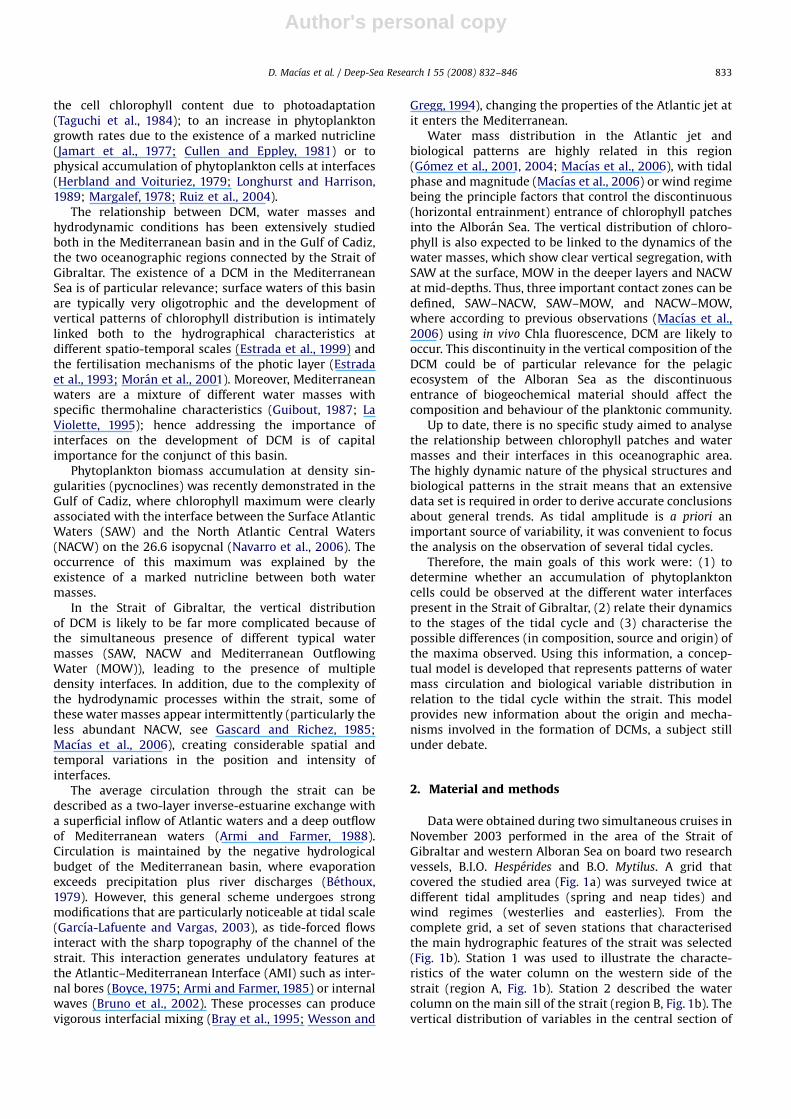
Data were obtained during two simultaneous cruises inNovember 2003 performed in the area of the Strait ofGibraltar and western Alboran Sea on board two researchvessels, B.I.O. Hesperides and B.O. Mytilus. A grid thatcovered the studied area (Fig. 1a) was surveyed twice atdifferent tidal amplitudes (spring and neap tides) andwind regimes (westerlies and easterlies). From thecomplete grid, a set of seven stations that characterisedthe main hydrographic features of the strait was selected(Fig. 1b). Station 1 was used to illustrate the characte-ristics of the water column on the western side of thestrait (region A, Fig. 1b). Station 2 described the watercolumn on the main sill of the strait (region B, Fig. 1b). Thevertical distribution of variables in the central section of
D. Macıas et al. / Deep-Sea Research I 55 (2008) 832–846 833
Author's personal copyARTICLE IN PRESS
the channel (region C, Fig. 1b) was examined using thecasts performed in stations 3 and 4. The description andmonitoring of the eastern sector of the strait (region D,Fig. 1b) were based on data acquired at stations 5–7. Eachstation was sampled several times, making a total of 32observations within the main channel of the strait.
Basic information on physical structure of the watercolumn at each station was obtained from CTD casts.Discrete water samples were also collected at differentdepths to analyse several variables related to thedynamics of the pelagic ecosystem. At daytime, between8:00 AM and 19:00 PM, photosynthetic available radiation(PAR) profiles were measured with a Satlantic PRR-600instrument at four stations within the channel of thestrait.
Total chlorophyll concentration was estimated byfiltering 0.5 L of seawater through Whatman GF/F filtersusing the fluorometric method described by Yentsch andMenzel (1963) and modified by Holm-Hassen et al. (1965).The percentage of chlorophyll contained within cellslarger than 10 mm was measured by filtering 5 L ofseawater through a nylon mesh of 10 mm nominal porediameter. The retained material was then collected bywashing the mesh using a sprayer filled with clean,filtered (0.7 mm) seawater, and filtering through WhatmanGF/F filters following the same protocol described above.The chlorophyll contained within cells larger than 10 mmwas compared to the total chlorophyll concentration of asample to obtain the percentage of chlorophyll attributedto larger cells.
Transparent exopolymeric particle (TEP) concentrationwas estimated following the colorimetric method des-cribed by Passow and Alldredge (1995) and modified byPrieto et al. (2002).
The percentage of active chlorophyll was calculatedusing a pulse amplitude modulated (PAM) fluorometer
specifically designed to study phytoplankton cells(PhytoPAM&, see detailed description in Kolbowski andSchreiber, 1995 and in Schreiber, 1998). The PAM usesweak probe flashes to measure the change in the quantumyield of fluorescence induced by a strong pump flash. Thisrelative change is proportional to the quantity of chlor-ophyll included in active phtosystem II (PS II) reactioncentres as successive light pulse leads to a saturation of PSII centres and a diminution of the fluorescence quantumyield. Thus the PhytoPAM provides an estimate of theproportion of total chlorophyll within active PS II, i.e., thechlorophyll available for photosynthesis (Kolberg andFalkowski, 1993), or ‘‘active chlorophyll’’. Six on-boardmeasurements of two dark-adapted replicates (previouslystored in polypropylene bottles) were performed perstation.
Three replicates of filtered seawater (12 mL, WhatmanGF/F filters) were collected at each sampling point andstored at �20 1C for inorganic nutrient concentrationdetermination. Concentrations of nitrate, nitrite, phosphate,silicate and ammonia were measured in the laboratoryusing an autoanalyser (Technicon-TRACCS 800) followingthe techniques of Strickland and Parsons (1972).
Analysis of pico- and nanoplankton was carried outusing a flow cytometer FACSCalibur (Becton Dickinson)using two different gain settings aiming to cover the highvariability of the natural phytoplankton community andred fluorescence as a threshold parameter. Acquisitiontime was set at 600 s and MiliQ water was used as sheathfluid. Acquisition and data analysis were carried out withthe software CELL QuestTM (Becton Dickinson). Identifica-tion of Prochlorococcus, Synechococcus, small nanoplank-ton, large nanoplankton and Cryptophyceae was completedusing a three-dimensional gate based on green fluores-cence, red fluorescence and side scatter signal (SSC). Thetwo prokaryotic picoplankton groups identified present acomplementary distribution in the marine environment(Chisholm, 1992), as Synechococcus is usually moreabundant in coastal regions while Prochlorococcus nor-mally occurs in deeper regions of the open sea (Goerickeet al., 2000; Pan et al., 2004). Differentiation betweensmall nanoplankton (2–10 mm) and large nanoplankton(10–20 mm) was made using the size threshold defined byRodrıguez et al. (2002).
Cell abundance was transformed to carbon content(in pg C mL�1) according to Heldad et al. (2003), using theratios 0.203 and 0.031 pg C cell�1 for Synechococcus andProchlorococcus, respectively. For nanoplankton species, SSCsignal was converted to biovolume (BV, in mm3) using theempirical relationship shown in Eq. (1). The regressionequation was obtained by measuring the BV of four differentcultures of phytoplankton (measured by optic imagery) andcomparing the results to the SSC signal. BV was converted tocarbon using Eq. (2), proposed by Verity et al. (1992).
BVðmm3Þ ¼ 0:3534� SSCþ 2:885
ðr2 ¼ 0:928; n ¼ 4; po0:01Þ (1)
pgC ¼ 0:433� BV0:863
ðr2 ¼ 0:984Þ (2)
Fig. 1. (a) Grid of stations sampled in the Strait of Gibralter and NW
Alboran Sea. (b) Stations selected within the main channel of the strait.
D. Macıas et al. / Deep-Sea Research I 55 (2008) 832–846834
Author's personal copyARTICLE IN PRESS
Samples for microplankton (20–200mm) analysis werecollected using a 10mm mesh, fixed with formalin (4–5%),and then analysed by inverted microscopy (Utermohl, 1931,1958).
2.1. Temporal framework and presentation of results
As tidal forcing is a priori one of the main elements thatexplains circulation dynamics in the Strait of Gibraltar,three specific periods of the tidal cycle were chosen toshow the variability of water mass distribution. Theselected periods were referenced to the stages of the tidalcycle recorded in the town of Tarifa, located in the middlesection of the strait (Fig. 1). Thus, 2 h before high water(HW�2), 2 h after high water (HW+2) and low water (LW)were selected as periods of reference to analyse the watermass distribution and plankton patterns during the wholetidal cycle.
These stages were not selected arbitrarily, but ratheron the basis of the hydrodynamics within the strait. Thus,HW�2 corresponds to the time when enhanced outflowand high current velocities over the Camarinal Sill arepredicted, which can cause the generation of arrestedinternal waves on the sill (Bruno et al., 2002). Thesearrested or stationary internal waves are established overthe sill 2–3 h before high water (Alonso Del Rosario et al.,2003); when the tide turns (HW), they start to move,propagating towards the Mediterranean. This is the reasonwhy HW+2 was chosen, as it is a time when internalwaves are propagating eastwards and the Atlantic flow tothe Mediterranean has been re-established. The thirdstage (LW) corresponds to the time when the outcomingflow over the Camarinal Sill starts to increase and theinternal waves nearly reach the eastern side of the strait(Farmer and Armi, 1986).
The second subsection of the results gathers togetherall the characteristics of the different DCMs associatedwith each water mass interface. For this purpose weused all the observations made during the cruise (i.e., the32 casts).
3. Results
3.1. Tide-related variability
CTD profiles corresponding to each region within thestrait at each of the selected tidal stages have been plottedtogether (Figs. 2–5) to allow a comparison of the tidaldynamics of water masses in each zone.
3.1.1. Region A: Atlantic sector
The TS diagram of the three casts performed in theAtlantic side of the Strait of Gibraltar during the threestages of the tidal cycle (Fig. 2a) revealed the characte-ristic presence of SAW, NACW and MOW. A distinctivevertical pattern was maintained throughout the tidalcycle, characterised by a superficial thermocline around25 m between SAW and NACW and a deeper haloclinesituated around 150 m separating NACW and MOW(Fig. 2b).
A clear, but not very large (0.4 mg m�3), chlorophyllmaximum was associated with the SAW–NACW interfaceand strong thermocline situated at around 50–70 m.This maximum was characterised by a low percentage ofchlorophyll within cells 410 mm (4–8%), low percentage ofactive chlorophyll (8–10%) and a relatively high TEP/Chlaratio (600–800) (Table 1).
The great similarities of the CTD cast and DCMcharacteristics along the tidal cycle in this area indicatethat tidal forcing is not very important as a regulatingfactor of the hydrodynamics in this outer zone of thestrait’s channel.
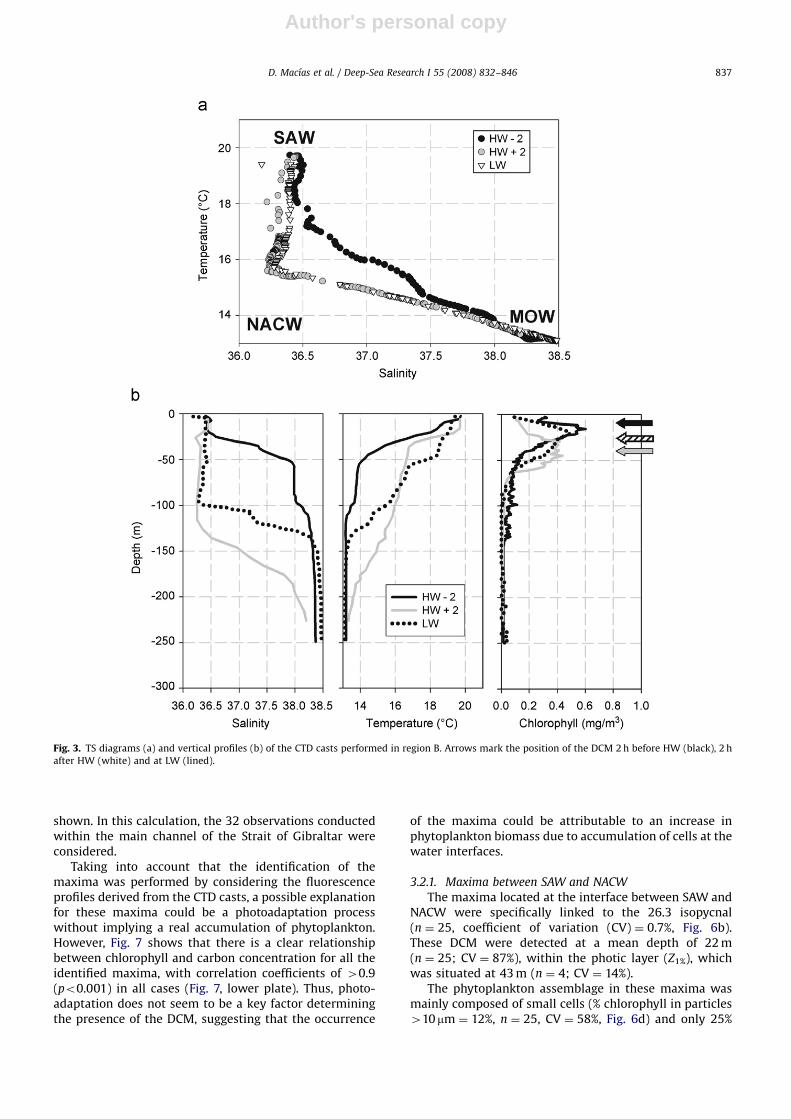
3.1.2. Region B: Camarinal Sill
Water column composition over the Camarinal Sill wasstrongly dependent on the tidal cycle (Fig. 3), with a shiftfrom a two-layer (SAW–MOW) water column in HW�2 tothree-layers (SAW–NACW–MOW) during the other twostages of the tidal cycle (Fig. 3a).
When NACW was detected (HW+2 and LW), achlorophyll maximum associated with the SAW–NACWinterface (grey and dashed arrows in Fig. 3b) was found, asoccurred in region A. The characteristics of this DCM weresimilar to those found in the western section of the strait;a low percentage of chlorophyll in cells 410 mm (9%) andlow active chlorophyll (10%) (Table 1).
However, when NACW was absent (HW�2), ashallow and intense chlorophyll maximum with values40.6 mg m�3 was linked to the intense thermocline andhalocline associated with the SAW–MOW interface (blackarrow in Fig. 3b). The main characteristics of thismaximum were clearly different from the one previouslydescribed, with a considerably higher percentage ofchlorophyll in cells 410 mm (20%), more active chlorophyll(60%) and a lower TEP/Chla ratio (409, Table 1).
3.1.3. Region C: central channel
Due to logistic problems, water column characteristicsin the central region of the main channel were recordedonly during the first tidal stage (HW�2). All three watermasses (SAW, NACW and MOW) were also observed inthis zone. The vertical chlorophyll profile (Fig. 4b) wascharacterised by two maxima situated at differentdepths (black arrows). The shallowest DCM, of approxi-mately 0.5 mg m�3, was observed at the SAW–NACWinterface situated at 20 m, while the deeper DCM, whichhad lower values of chlorophyll (0.3 mg m�3) was detectedat the NACW–MOW interface (defined mainly by ahalocline) at 50 m. The shallow maximum was similar tothose found associated with the SAW–NACW interface inthe rest of the region; it was characterised by a lowquantity of chlorophyll in cells 410 mm (12%) and a lowpercentage of active chlorophyll (4%, Table 1). In contrast,the deeper maximum was characterised by a higherpercentage of chlorophyll in cells 410 mm (80%), lowactive chlorophyll (8%) and an extremely high TEP/Chlaratio (6669, Table 1).
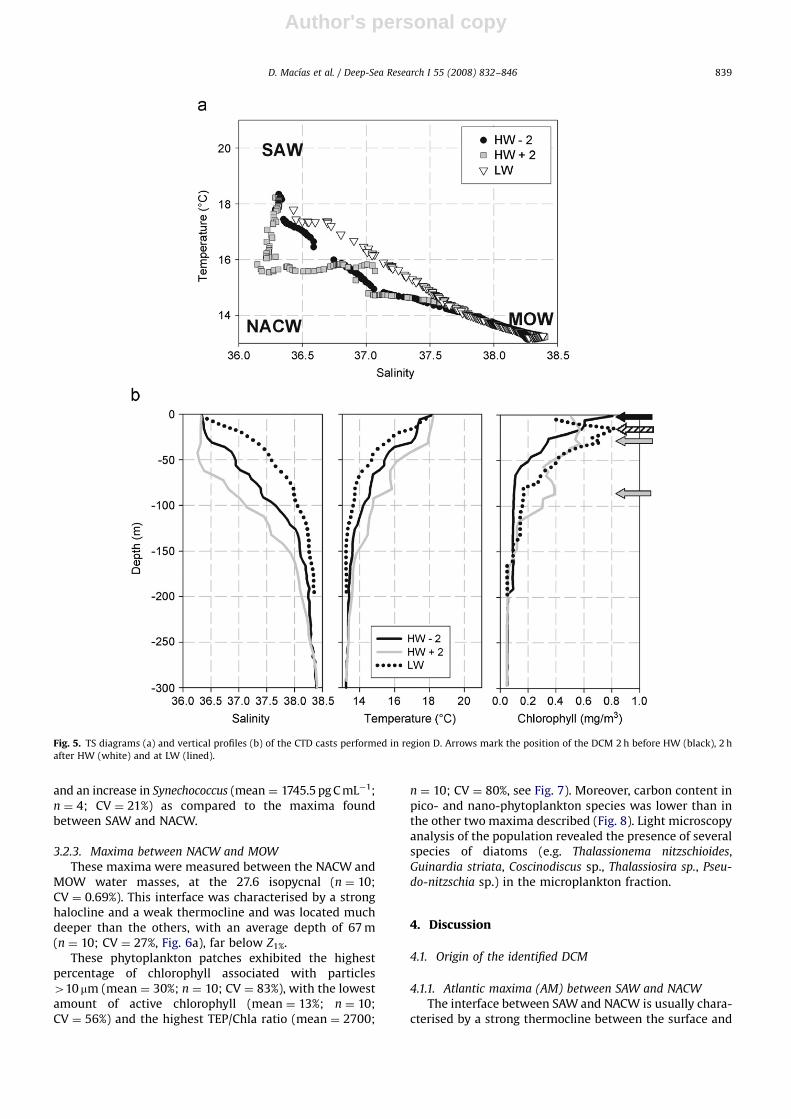
3.1.4. Region D: Mediterranean sector
In the eastern sector of the channel of the strait, analternation of the composition of the water column was
D. Macıas et al. / Deep-Sea Research I 55 (2008) 832–846 835

Author's personal copyARTICLE IN PRESS
observed again along the tidal cycle (Fig. 4a). DuringHW�2 and LW, only SAW and MOW were detected, whileduring HW+2, all three water masses were observed.
This shift in the water column composition also hadeffects on the vertical distribution of chlorophyll (Fig. 5b).When NACW (HW�2) was present, two maxima weredetected, one at 25 m (at the SAW–NACW interface) and asecond situated 75 m deep (in the NACW–MOW inter-face). Both DCMs were not especially intense, with themaximum values of around 0.5 mg m�3 being very similarto those found in region C during HW�2. When only SAWand MOW were detected (HW�2 and LW), a singlechlorophyll maximum of 40.8 mg m�3 was observed inthe upper 20 m of the water column. This maximum had ahigh percentage of chlorophyll in cells 410 mm (21–22%),
high active chlorophyll (47–50%) and low TEP/Chla ratio(75, Table 1).
3.2. Chlorophyll maxima and water masses interfaces
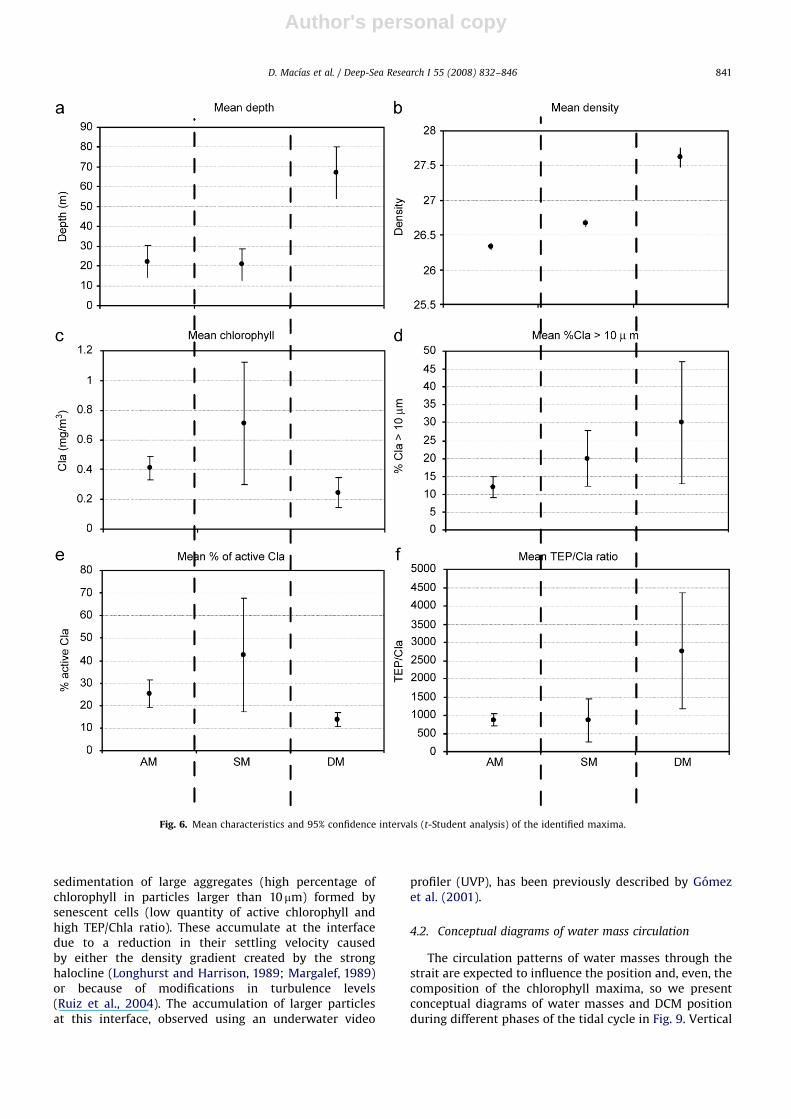
At least three different types of chlorophyll maximacould be identified, each with different absolute chlor-ophyll values, position within the water column andphysiological properties. The three types of maxima were:(i) those associated with the SAW–NACW interface,(ii) those situated between SAW and MOW and (iii) thosefound in the transition between NACW and MOW. Themean characteristics of each type of maximum aresummarised in Fig. 6, where the confidence intervalscalculated using the t-Student analysis (Zar, 1984) are also
Fig. 2. TS diagrams (a) and vertical profiles (b) of the CTD casts performed in region A. Arrows mark the position of the DCM 2 h before HW (black), 2 h
after HW (white) and at LW (lined).
D. Macıas et al. / Deep-Sea Research I 55 (2008) 832–846836
Author's personal copyARTICLE IN PRESS
shown. In this calculation, the 32 observations conductedwithin the main channel of the Strait of Gibraltar wereconsidered.
Taking into account that the identification of themaxima was performed by considering the fluorescenceprofiles derived from the CTD casts, a possible explanationfor these maxima could be a photoadaptation processwithout implying a real accumulation of phytoplankton.However, Fig. 7 shows that there is a clear relationshipbetween chlorophyll and carbon concentration for all theidentified maxima, with correlation coefficients of 40.9(po0.001) in all cases (Fig. 7, lower plate). Thus, photo-adaptation does not seem to be a key factor determiningthe presence of the DCM, suggesting that the occurrence
of the maxima could be attributable to an increase inphytoplankton biomass due to accumulation of cells at thewater interfaces.
3.2.1. Maxima between SAW and NACW
The maxima located at the interface between SAW andNACW were specifically linked to the 26.3 isopycnal(n ¼ 25, coefficient of variation (CV) ¼ 0.7%, Fig. 6b).These DCM were detected at a mean depth of 22 m(n ¼ 25; CV ¼ 87%), within the photic layer (Z1%), whichwas situated at 43 m (n ¼ 4; CV ¼ 14%).
The phytoplankton assemblage in these maxima wasmainly composed of small cells (% chlorophyll in particles410 mm ¼ 12%, n ¼ 25, CV ¼ 58%, Fig. 6d) and only 25%
Fig. 3. TS diagrams (a) and vertical profiles (b) of the CTD casts performed in region B. Arrows mark the position of the DCM 2 h before HW (black), 2 h
after HW (white) and at LW (lined).
D. Macıas et al. / Deep-Sea Research I 55 (2008) 832–846 837

Author's personal copyARTICLE IN PRESS
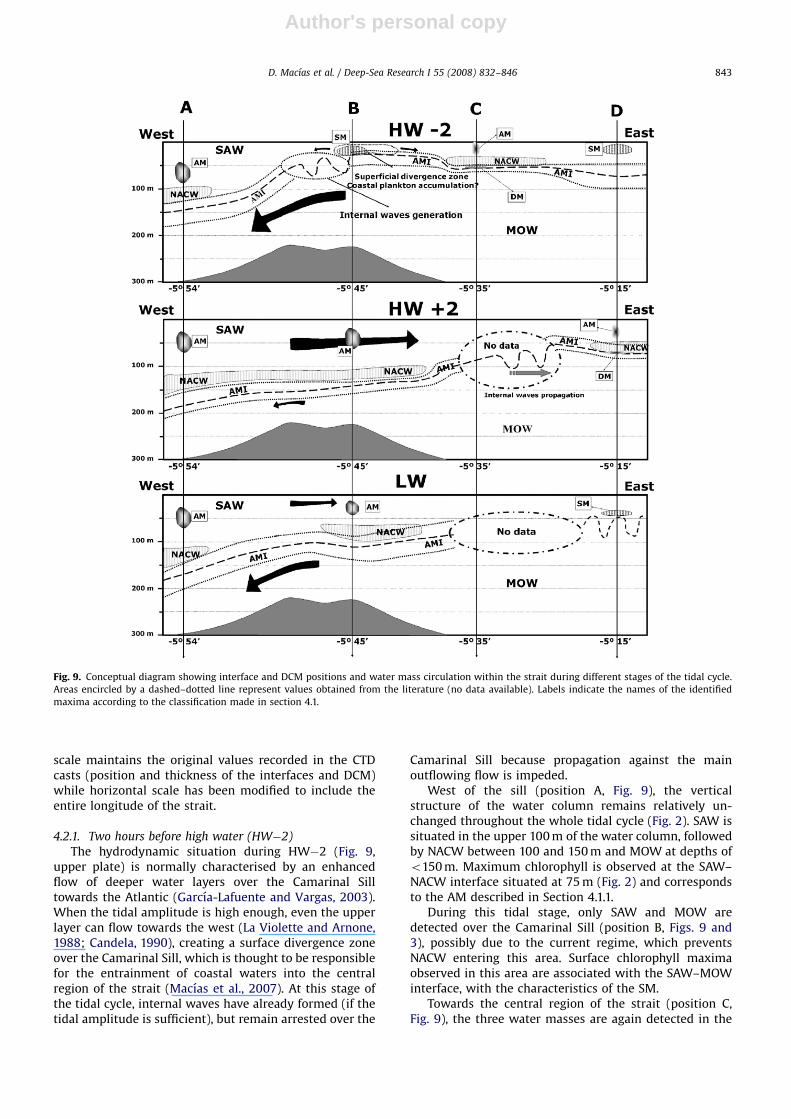
(n ¼ 25, CV ¼ 60%) of the total chlorophyll was found tobe photosynthetically active (Fig. 6e). Furthermore, thesesamples had a relatively high amount of extracellularexopolymers (mean TEP/Chla ratio ¼ 870, n ¼ 25,CV ¼ 47%). The composition of the smallest fraction(picoplankton) of this phytoplankton assemblage wasdominated by Prochlorococcus (mean 1346 pg C mL�1;n ¼ 8, CV ¼ 12%, Fig. 8).
Light microscopy analysis revealed that the micro-phytoplankton fraction of these maxima consisted mainlyof detritus, with only a few viable cells (data not shown).
3.2.2. Maxima between SAW and MOW
These DCMs were only present when NACW wasabsent, and were observed at the SAW–MOW interface
on the 26.5 isopycnal (n ¼ 6; CV ¼ 0.57%, Fig. 6b). Thisinterface was defined by the presence of both a thermo-cline and halocline. The mean depth where these maximawere found (20 m, n ¼ 6; CV ¼ 70%) was always lowerthan the calculated Z1%.
Mean chlorophyll concentration in these maxima washigh (0.7 mg m�3; n ¼ 6; CV ¼ 60%; Fig. 6b) and a largeproportion was found in larger cells (around 20% of thetotal chlorophyll corresponded to particles 410 mm;n ¼ 6; CV ¼ 50%). Moreover, the percentage of activechlorophyll was higher than the SAW–NACW maxima(mean ¼ 42%; n ¼ 6; CV ¼ 64%).
Flow cytometry analysis of the samples collected inthis maxima (Fig. 8) showed a decrease in the quantity ofProchlorococcus (mean ¼ 671 pg C mL�1; n ¼ 4; CV ¼ 20%)
Fig. 4. TS diagrams (a) and vertical profiles (b) of the CTD casts performed in region C. Arrows mark the position of the two DCMs detected in the
chlorophyll profile.
D. Macıas et al. / Deep-Sea Research I 55 (2008) 832–846838
Author's personal copyARTICLE IN PRESS
and an increase in Synechococcus (mean ¼ 1745.5 pg C mL�1;n ¼ 4; CV ¼ 21%) as compared to the maxima foundbetween SAW and NACW.
3.2.3. Maxima between NACW and MOW
These maxima were measured between the NACW andMOW water masses, at the 27.6 isopycnal (n ¼ 10;CV ¼ 0.69%). This interface was characterised by a stronghalocline and a weak thermocline and was located muchdeeper than the others, with an average depth of 67 m(n ¼ 10; CV ¼ 27%, Fig. 6a), far below Z1%.
These phytoplankton patches exhibited the highestpercentage of chlorophyll associated with particles410 mm (mean ¼ 30%; n ¼ 10; CV ¼ 83%), with the lowestamount of active chlorophyll (mean ¼ 13%; n ¼ 10;CV ¼ 56%) and the highest TEP/Chla ratio (mean ¼ 2700;
n ¼ 10; CV ¼ 80%, see Fig. 7). Moreover, carbon content inpico- and nano-phytoplankton species was lower than inthe other two maxima described (Fig. 8). Light microscopyanalysis of the population revealed the presence of severalspecies of diatoms (e.g. Thalassionema nitzschioides,Guinardia striata, Coscinodiscus sp., Thalassiosira sp., Pseu-
do-nitzschia sp.) in the microplankton fraction.
4. Discussion
4.1. Origin of the identified DCM
4.1.1. Atlantic maxima (AM) between SAW and NACW
The interface between SAW and NACW is usually chara-cterised by a strong thermocline between the surface and
Fig. 5. TS diagrams (a) and vertical profiles (b) of the CTD casts performed in region D. Arrows mark the position of the DCM 2 h before HW (black), 2 h
after HW (white) and at LW (lined).
D. Macıas et al. / Deep-Sea Research I 55 (2008) 832–846 839
Author's personal copyARTICLE IN PRESS
the central waters (Gascard and Richez, 1985; Ochoa andBray, 1991). A chlorophyll maximum linked to that shallowthermocline has been previously registered in the westernsection of the strait (Gomez et al., 2000; Echevarria et al.,2002; Reul et al., 2002) and in the Gulf of Cadiz (Navarroet al., 2006). Because of this, the denomination of ‘‘Atlanticmaxima’’ (AM) was used to define this SAW–NACWchlorophyll maximum.
Navarro et al. (2006) suggested that the chlorophyllmaxima associated with that interface were attributed toa functional response of the picoplankton to the existenceof a nutricline between the nutrient-rich NACW and theimpoverished SAW (Herbland and Voituriez, 1979). Nu-trient concentration measurements in the strait duringthe present study support this hypothesis and the Atlanticorigin of this particular DCM. Mean nitrate+nitrite (NN)concentration in the overlying waters was 0.6 mM (n ¼ 26;CV ¼ 70%), a concentration less than the threshold of 1mMaccepted as limiting for phytoplankton proliferation(Eppley et al., 1969; Wash, 1988). In contrast, NNconcentration in the deeper water layer (between the26.35 and 26.5 isopicnals) was a mean value of 2.0 mM(n ¼ 21; CV ¼ 76%), confirming the existence of a markednutricline in this region of the water column.
The predominance of small cells in the phytoplanktonassemblage of the AM (Fig. 6) is typical of oligotrophicenvironments (Malone, 1980; Chisholm, 1992; Li, 2002),where maxima are usually associated with gradients innutrient distribution (Moran et al., 2001). Picoplanktoncomposition also supports this hypothesis, as Prochlor-
ococcus has been reported to be more abundant inoffshore waters (Goericke et al., 2000) and is prevalentin the open region of the Gulf of Cadiz (Zabala, 1999; Reulet al., 2006).
The low percentage of active chlorophyll and the highTEP/Chla ratio (Fig. 6) of these maxima are indicative of asenescent phytoplankton population; mucilage produc-tion is known to be a good indicator of declining planktoncommunities (Prieto et al., 2006).
4.1.2. Suction maxima (SM) in the SAW–MOW interface
Enhanced chlorophyll maxima associated with thecombined presence of a thermocline and a halocline(i.e., the SAW–MOW interface) has been previouslydescribed eastwards of the Camarinal Sill (Rodrıguezet al., 1998; Gomez et al., 2000). These maxima do notseem to be linked to the presence of a nutricline, as NNconcentration in the overlaying waters was around 2.2 mM(n ¼ 9, CV ¼ 53%), well above the threshold limiting valuethat limits phytoplankton growth. Therefore, the genera-tion of these chlorophyll patches is likely to be related tophysical processes, rather than in situ growth.
The higher mean concentration of chlorophyll, percen-tage of larger cells and active chlorophyll in these maximawould indicate a coastal origin, as larger cells aregenerally found in coastal environments, where nutrientinputs to the surface layer are more frequent (Malone,1980; Mann and Lazier, 1991). Moreover, the increase inthe quantity of Synechococcus and the decrease ofProchlorococcus (Fig. 8) also support the coastal origin ofthese chlorophyll patches as Synechococcus occurs mainlyin shallow inshore areas (Chisholm, 1992; Goericke et al.,2000; Pan et al., 2004) and it is usually found in thecoastal region of the Gulf of Cadiz (Zabala, 1999; Huertaset al., 2005; Reul et al., 2006). Also, the relatively low TEP/Chla ratio in SM is an indicator of a actively growingpopulation as it has been documented that in early bloomstages the production of TEP is minor (Corzo et al., 2000).
These maxima appear to be linked with undulatoryprocesses that take place in the Atlantic–Mediterraneaninterface (Macıas et al., 2006) and, thereby, their occur-rence seems to be related to the mechanisms that generatesuch processes. Briefly, the generation of internal wavesover the Camarinal Sill is linked to the reinforcement of theoutflowing Mediterranean flux occurring before the HW.At the same time, if the tidal amplitude is high enough,even the Atlantic layer reverses its movement over the Sill,flowing back to the west (Izquierdo et al., 2001). However,eastwards of the Tarifa narrows, the Atlantic layer flows tothe east throughout the complete tidal cycle. Thesecircumstances could lead to the appearance of horizontaldivergences in the Atlantic layer between the CamarinalSill and the Tarifa narrows. It has been proposed that,depending on tidal cycle’s amplitude, this divergencecan cause an enhanced interchange and intrusion(i.e., ‘‘suction’’) of coastal waters into the centre of thechannel in a pulsating manner (Macıas et al., 2007).Therefore, if the suggested hypothesis is valid, somechlorophyll-rich coastal waters would be incorporatedinto the main channel of the strait. Consequently, thesechlorophyll maxima are named ‘‘suction maxima’’ (SM)after their probable formation mechanism. That could alsoexplain why no NACW signal is detected when SM arepresent, as this water mass could not overflow the Sillagainst the tidal current around the HW time (see schemesin Fig. 9) being retained in the western section of the strait.
4.1.3. Deep maxima (DM) in the interface between NACW
and MOW
The origin of these DM is not clear, but examination oftheir characteristics suggests that they are generated by
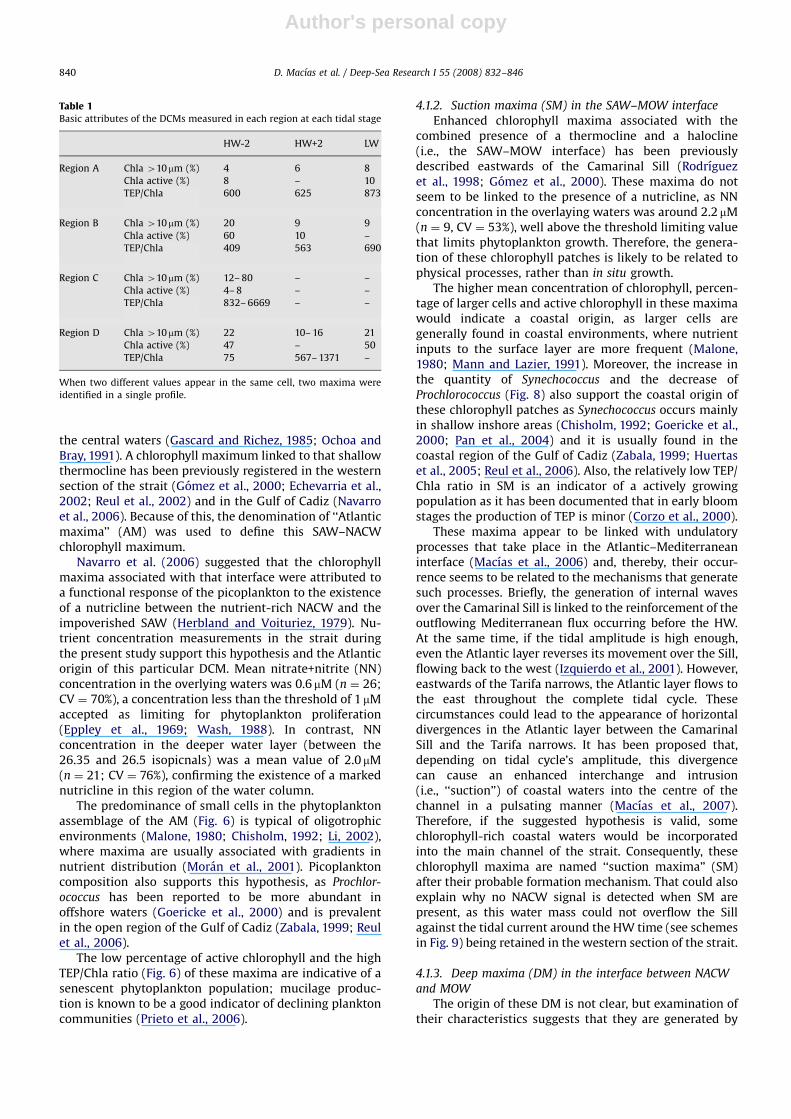
Table 1Basic attributes of the DCMs measured in each region at each tidal stage
HW-2 HW+2 LW
Region A Chla 410mm (%) 4 6 8
Chla active (%) 8 – 10
TEP/Chla 600 625 873
Region B Chla 410mm (%) 20 9 9
Chla active (%) 60 10 –
TEP/Chla 409 563 690
Region C Chla 410mm (%) 12– 80 – –
Chla active (%) 4– 8 – –
TEP/Chla 832– 6669 – –
Region D Chla 410mm (%) 22 10– 16 21
Chla active (%) 47 – 50
TEP/Chla 75 567– 1371 –
When two different values appear in the same cell, two maxima were
identified in a single profile.
D. Macıas et al. / Deep-Sea Research I 55 (2008) 832–846840
Author's personal copyARTICLE IN PRESS
sedimentation of large aggregates (high percentage ofchlorophyll in particles larger than 10 mm) formed bysenescent cells (low quantity of active chlorophyll andhigh TEP/Chla ratio). These accumulate at the interfacedue to a reduction in their settling velocity causedby either the density gradient created by the stronghalocline (Longhurst and Harrison, 1989; Margalef, 1989)or because of modifications in turbulence levels(Ruiz et al., 2004). The accumulation of larger particlesat this interface, observed using an underwater video
profiler (UVP), has been previously described by Gomezet al. (2001).
4.2. Conceptual diagrams of water mass circulation
The circulation patterns of water masses through thestrait are expected to influence the position and, even, thecomposition of the chlorophyll maxima, so we presentconceptual diagrams of water masses and DCM positionduring different phases of the tidal cycle in Fig. 9. Vertical
Fig. 6. Mean characteristics and 95% confidence intervals (t-Student analysis) of the identified maxima.
D. Macıas et al. / Deep-Sea Research I 55 (2008) 832–846 841
Author's personal copyARTICLE IN PRESS
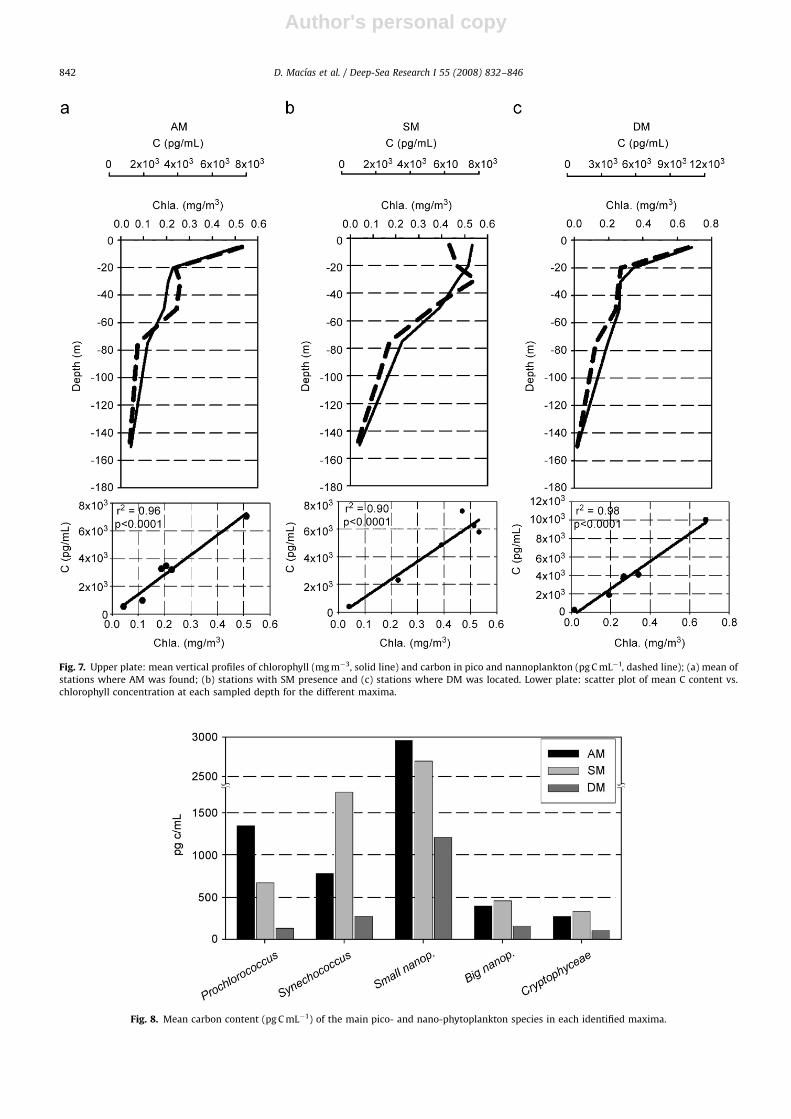
Fig. 7. Upper plate: mean vertical profiles of chlorophyll (mg m�3, solid line) and carbon in pico and nannoplankton (pg C mL�1, dashed line); (a) mean of
stations where AM was found; (b) stations with SM presence and (c) stations where DM was located. Lower plate: scatter plot of mean C content vs.
chlorophyll concentration at each sampled depth for the different maxima.
Fig. 8. Mean carbon content (pg C mL�1) of the main pico- and nano-phytoplankton species in each identified maxima.
D. Macıas et al. / Deep-Sea Research I 55 (2008) 832–846842
Author's personal copyARTICLE IN PRESS
scale maintains the original values recorded in the CTDcasts (position and thickness of the interfaces and DCM)while horizontal scale has been modified to include theentire longitude of the strait.
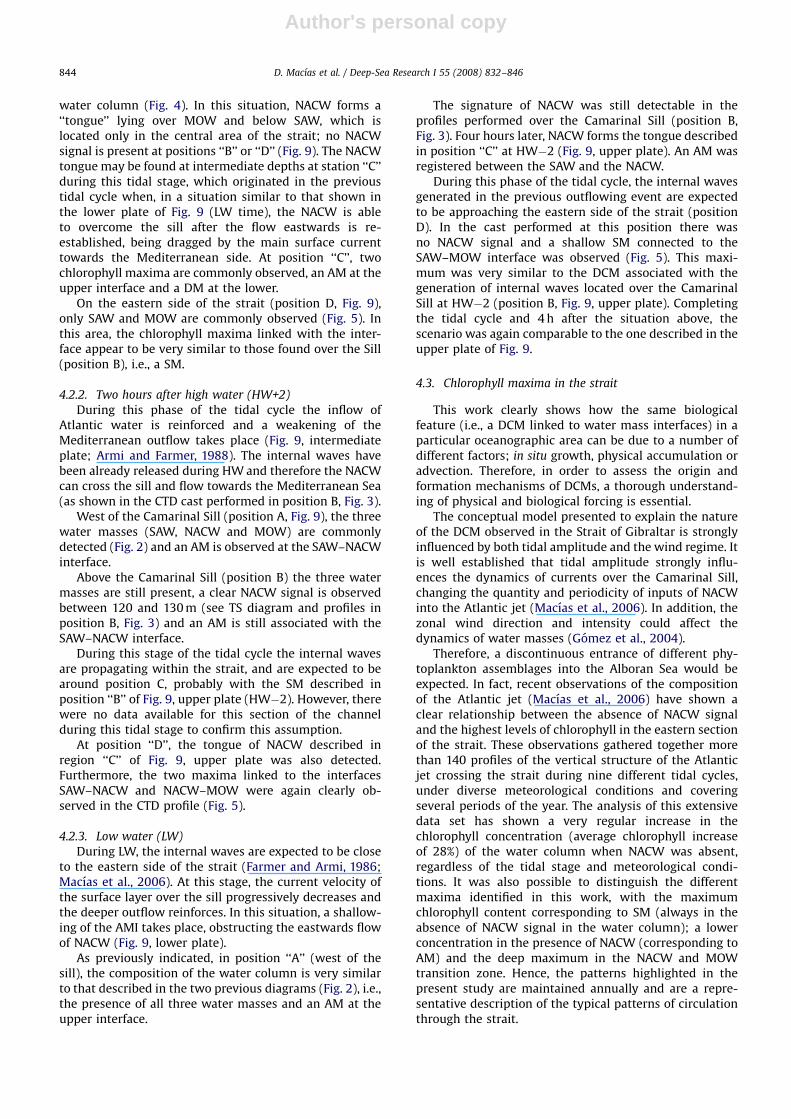
4.2.1. Two hours before high water (HW�2)
The hydrodynamic situation during HW�2 (Fig. 9,upper plate) is normally characterised by an enhancedflow of deeper water layers over the Camarinal Silltowards the Atlantic (Garcıa-Lafuente and Vargas, 2003).When the tidal amplitude is high enough, even the upperlayer can flow towards the west (La Violette and Arnone,1988; Candela, 1990), creating a surface divergence zoneover the Camarinal Sill, which is thought to be responsiblefor the entrainment of coastal waters into the centralregion of the strait (Macıas et al., 2007). At this stage ofthe tidal cycle, internal waves have already formed (if thetidal amplitude is sufficient), but remain arrested over the
Camarinal Sill because propagation against the mainoutflowing flow is impeded.
West of the sill (position A, Fig. 9), the verticalstructure of the water column remains relatively un-changed throughout the whole tidal cycle (Fig. 2). SAW issituated in the upper 100 m of the water column, followedby NACW between 100 and 150 m and MOW at depths ofo150 m. Maximum chlorophyll is observed at the SAW–NACW interface situated at 75 m (Fig. 2) and correspondsto the AM described in Section 4.1.1.
During this tidal stage, only SAW and MOW aredetected over the Camarinal Sill (position B, Figs. 9 and3), possibly due to the current regime, which preventsNACW entering this area. Surface chlorophyll maximaobserved in this area are associated with the SAW–MOWinterface, with the characteristics of the SM.
Towards the central region of the strait (position C,Fig. 9), the three water masses are again detected in the
Fig. 9. Conceptual diagram showing interface and DCM positions and water mass circulation within the strait during different stages of the tidal cycle.
Areas encircled by a dashed–dotted line represent values obtained from the literature (no data available). Labels indicate the names of the identified
maxima according to the classification made in section 4.1.
D. Macıas et al. / Deep-Sea Research I 55 (2008) 832–846 843
Author's personal copyARTICLE IN PRESS
water column (Fig. 4). In this situation, NACW forms a‘‘tongue’’ lying over MOW and below SAW, which islocated only in the central area of the strait; no NACWsignal is present at positions ‘‘B’’ or ‘‘D’’ (Fig. 9). The NACWtongue may be found at intermediate depths at station ‘‘C’’during this tidal stage, which originated in the previoustidal cycle when, in a situation similar to that shown inthe lower plate of Fig. 9 (LW time), the NACW is ableto overcome the sill after the flow eastwards is re-established, being dragged by the main surface currenttowards the Mediterranean side. At position ‘‘C’’, twochlorophyll maxima are commonly observed, an AM at theupper interface and a DM at the lower.
On the eastern side of the strait (position D, Fig. 9),only SAW and MOW are commonly observed (Fig. 5). Inthis area, the chlorophyll maxima linked with the inter-face appear to be very similar to those found over the Sill(position B), i.e., a SM.
4.2.2. Two hours after high water (HW+2)
During this phase of the tidal cycle the inflow ofAtlantic water is reinforced and a weakening of theMediterranean outflow takes place (Fig. 9, intermediateplate; Armi and Farmer, 1988). The internal waves havebeen already released during HW and therefore the NACWcan cross the sill and flow towards the Mediterranean Sea(as shown in the CTD cast performed in position B, Fig. 3).
West of the Camarinal Sill (position A, Fig. 9), the threewater masses (SAW, NACW and MOW) are commonlydetected (Fig. 2) and an AM is observed at the SAW–NACWinterface.
Above the Camarinal Sill (position B) the three watermasses are still present, a clear NACW signal is observedbetween 120 and 130 m (see TS diagram and profiles inposition B, Fig. 3) and an AM is still associated with theSAW–NACW interface.
During this stage of the tidal cycle the internal wavesare propagating within the strait, and are expected to bearound position C, probably with the SM described inposition ‘‘B’’ of Fig. 9, upper plate (HW�2). However, therewere no data available for this section of the channelduring this tidal stage to confirm this assumption.
At position ‘‘D’’, the tongue of NACW described inregion ‘‘C’’ of Fig. 9, upper plate was also detected.Furthermore, the two maxima linked to the interfacesSAW–NACW and NACW–MOW were again clearly ob-served in the CTD profile (Fig. 5).
4.2.3. Low water (LW)
During LW, the internal waves are expected to be closeto the eastern side of the strait (Farmer and Armi, 1986;Macıas et al., 2006). At this stage, the current velocity ofthe surface layer over the sill progressively decreases andthe deeper outflow reinforces. In this situation, a shallow-ing of the AMI takes place, obstructing the eastwards flowof NACW (Fig. 9, lower plate).
As previously indicated, in position ‘‘A’’ (west of thesill), the composition of the water column is very similarto that described in the two previous diagrams (Fig. 2), i.e.,the presence of all three water masses and an AM at theupper interface.
The signature of NACW was still detectable in theprofiles performed over the Camarinal Sill (position B,Fig. 3). Four hours later, NACW forms the tongue describedin position ‘‘C’’ at HW�2 (Fig. 9, upper plate). An AM wasregistered between the SAW and the NACW.
During this phase of the tidal cycle, the internal wavesgenerated in the previous outflowing event are expectedto be approaching the eastern side of the strait (positionD). In the cast performed at this position there wasno NACW signal and a shallow SM connected to theSAW–MOW interface was observed (Fig. 5). This maxi-mum was very similar to the DCM associated with thegeneration of internal waves located over the CamarinalSill at HW�2 (position B, Fig. 9, upper plate). Completingthe tidal cycle and 4 h after the situation above, thescenario was again comparable to the one described in theupper plate of Fig. 9.
4.3. Chlorophyll maxima in the strait
This work clearly shows how the same biologicalfeature (i.e., a DCM linked to water mass interfaces) in aparticular oceanographic area can be due to a number ofdifferent factors; in situ growth, physical accumulation oradvection. Therefore, in order to assess the origin andformation mechanisms of DCMs, a thorough understand-ing of physical and biological forcing is essential.
The conceptual model presented to explain the natureof the DCM observed in the Strait of Gibraltar is stronglyinfluenced by both tidal amplitude and the wind regime. Itis well established that tidal amplitude strongly influ-ences the dynamics of currents over the Camarinal Sill,changing the quantity and periodicity of inputs of NACWinto the Atlantic jet (Macıas et al., 2006). In addition, thezonal wind direction and intensity could affect thedynamics of water masses (Gomez et al., 2004).
Therefore, a discontinuous entrance of different phy-toplankton assemblages into the Alboran Sea would beexpected. In fact, recent observations of the compositionof the Atlantic jet (Macıas et al., 2006) have shown aclear relationship between the absence of NACW signaland the highest levels of chlorophyll in the eastern sectionof the strait. These observations gathered together morethan 140 profiles of the vertical structure of the Atlanticjet crossing the strait during nine different tidal cycles,under diverse meteorological conditions and coveringseveral periods of the year. The analysis of this extensivedata set has shown a very regular increase in thechlorophyll concentration (average chlorophyll increaseof 28%) of the water column when NACW was absent,regardless of the tidal stage and meteorological condi-tions. It was also possible to distinguish the differentmaxima identified in this work, with the maximumchlorophyll content corresponding to SM (always in theabsence of NACW signal in the water column); a lowerconcentration in the presence of NACW (corresponding toAM) and the deep maximum in the NACW and MOWtransition zone. Hence, the patterns highlighted in thepresent study are maintained annually and are a repre-sentative description of the typical patterns of circulationthrough the strait.
D. Macıas et al. / Deep-Sea Research I 55 (2008) 832–846844

Author's personal copyARTICLE IN PRESS
Also, a recently developed physical–biological coupledmodel of the channel of the strait (Macıas et al., 2007) hasshown that the high chlorophyll patches consistentlydetected in the eastern sector of the strait (the SMpresented in this work) cannot be explained only by in situ
growth of the phytoplankton while crossing the strait, asthe average residence time in the channel is not longenough to allow noticeable growth. Furthermore, dilutioneffects due to mixing would prevail, impeding phytoplank-ton proliferation. In this sense, the present work adds newelements that support the hypothesis that some of thesepulsating chlorophyll patches (the so-called SM) could havea coastal origin through lateral advection and mixing.
This discontinuous entrance of biogeochemical mate-rial through the strait is important for the pelagicecosystem of the Alboran Sea, as a pulsating input of bothplankton and nutrients could drive the behaviour of thesystem. Therefore, the nature of this input should be takeninto account when explaining the spatial and temporalpatterns of biogeochemical elements in the Alboran basin.For example, Ruiz et al. (2001) linked chlorophyll maximathat gradually became more intense towards the east ofthe basin with the presence of nutrient enriched surfacelayers by NACW injection.
Furthermore, as the strait is the sole connexionbetween the Mediterranean Sea and the open AtlanticOcean, understanding of the specific mechanisms ofbiogeochemical interchanges is extremely important forassessing the element budget of this semi-enclosed basin.
In summary, tide-induced variability within the Straitof Gibraltar not only affects the transport and circulationof the water masses that meet in the area, but also thedistribution and characteristics of chlorophyll patches.This fact corroborates the importance of tide-inducedphenomena in explaining physical and biological struc-tures at the regional scale. In the future, special attentionmust be paid for understanding the mechanisms (andtheir variability) controlling the interchange betweencoastal areas and the centre of the channel. Specificresearch cruises with the necessary spatial–temporalresolution to resolve these relatively fast processes, aswell as accurate two-dimensional models, are required tostudy these phenomena, especially in the nearest shallowcoastal areas, which have a high chlorophyll concentrationand higher residence time, and in those areas whereinterchanges (such as the Tarifa–Camarinal Sill region) arelikely (Izquierdo et al., 2001).
Acknowledgements
This work was funded by the Spanish National ResearchProgram, Projects; REN-2001-2733-C02-02 and CTM2005-08142-C03-01. D.M. was supported by a grant from theSpanish FPI fellowship program. We thank S. Rivas andE.P. Morris for correcting the English language of the text.
References
Alonso Del Rosario, J.J., Bruno, M., Vazquez, A., 2003. The influenceof tidal hydrodynamic conditions on the generation of lee waves at
the main sill of the Strait of Gibraltar. Deep-Sea Research I 50,1005–1021.
Armi, L., Farmer, D., 1985. The internal hydraulics of the Strait ofGibraltar and associated sill and narrows. Oceanologica Acta 8 (1),37–46.
Armi, L., Farmer, D., 1988. The flow of Mediterranean Water through theStrait of Gibraltar. Progress in Oceanography 21, 41–82.
Bethoux, J.P., 1979. Budgets of the Mediterranean Sea, their dependenceon local climate and on the characteristics of the Atlantic waters.Oceanologica Acta 2, 137–163.
Boyce, F.M., 1975. Internal waves in the Strait of Gibraltar. Deep-SeaResearch 22, 597–610.
Bray, N.A., Ochoa, J., Kinder, T.H., 1995. The role of interface in exchangethrough the Strait of Gibraltar. Journal of Geophysical Research 100(C6), 10755–10776.
Bruno, M., Alonso, J.J., Cozar, A., Vidal, J., Ruiz-Canavate, A., Echevarrıa, F.,Ruiz, J., 2002. The boiling-water phenomena at Camarinal Sill, theStrait of Gibraltar. Deep-Sea Research II 49, 4097–4113.
Candela, J., 1990. The Barotrophic Tide in the Strait of Gibraltar. ThePhysical Oceanography of Sea Straits. Kluwer Academic Publishers,Dordrecht, The Netherlands, pp. 457–475.
Chisholm, S.W., 1992. Phytoplankton size. In: Falkowski, P.G., Woodhead,A.D. (Eds.), Primary Productivity and Biogeochemical Cycles in theSEA. Plenum Press, New York, pp. 213–223.
Corzo, A., Morillo, J.A., Rodrıguez, S., 2000. Production of transparentexopolymer particles (TEP) in cultures of Chaetoceros calcitransunder nitrogen limitation. Aquatic Microbial Ecology 23, 63–72.
Cullen, J.J., Eppley, R.W., 1981. Chlorophyll maximum layers of thesouthern California Bight and possible mechanisms of their forma-tion and maintenance. Oceanologica Acta 4, 23–32.
Echevarria, F., Garcıa-Lafuente, J., Bruno, M., Gorsky, G., Goutx, M.,Gonzalez, N., Garcıa, C.M., Gomez, F., Vargas, J.M., Picheral, M., Striby,L., Varela, M., Alonso, J.J., Reul, A., Cozar, A., Prieto, L., Sarhan, T., Plaza,F., Jimenez-Gomez, F., 2002. Physical–biological coupling in the Straitof Gibraltar. Deep-Sea Research II 49, 4115–4130.
Eppley, R.W., Rogers, J.N., McCarthy, J.J., 1969. Half saturation constantsfor uptake of nitrate and ammonium by marine phytoplankton.Limnology and Oceanogaphy 14, 912–920.
Estrada, M., Marrase, C., Latasa, M., Berdalet, E., Delgado, M., Riera, T.,1993. Variability of the Deep Chlorophyll Maximum characteristicsin the northwestern Mediterranean. Marine Ecology Progress Series92 (3), 289–300.
Estrada, M., Varela, R.A., Salat, J., Cruzado, A., Arias, E., 1999. Spatio-temporal variability of the winter phytoplankton distribution acrossthe Catalan and North Balearic fronts (NW Mediterranean). Journalof Plankton Research 21 (1), 1–20.
Farmer, D., Armi, L., 1986. Maximal two-layer exchange over a sill andthrough the combination of a sill and contraction with barotropicflow. Journal of Fluid Mechanics 164, 53–76.
Garcıa-Lafuente, J., Vargas, J.M., 2003. Recent observations of theexchanged flows through the Strait of Gibraltar and their fluctuationsat different time scales. Recent Research Development in Geophysics5, 73–84.
Gascard, J.C., Richez, C., 1985. Water masses and circulation in theWestern Alboran Sea and in the Straits of Gibraltar. Progress inOceanography 15, 157–216.
Goericke, R., Olson, R.J., Shalapyonok, A., 2000. A novel niche forPhroclorococcus sp. in low light suboxic environments in the ArabianSea and the Eastern Tropical North Atlantic. Deep-Sea Research I 47,1183–1205.
Gomez, F., Echevarrıa, F., Garcıa, C.M., Prieto, L., Ruız, J., Reul, A., Jimenez-Gomez, F., Varela, M., 2000. Microplankton distribution in the Straitof Gibraltar, coupling between organism and hydrodynamicsstructures. Journal of Plankton Research 22 (4), 603–617.
Gomez, F., Gorsky, G., Striby, L., Vargas, J.M., Gonzalez, N., Picheral, M.,Garcıa-Lafuente, J., Varela, M., Goutx, M., 2001. Small-scale temporalvariations in biogeochemical features in the Strait of Gibraltar,Mediterranean side—the role of NACW and the interface oscillation.Journal of Marine Systems 30, 207–220.
Gomez, F., Gorsky, G., Garcıa-Gorriz, E., Picheral, M., 2004. Control of thephytoplankton distribution in the Strait of Gibraltar by wind andfortnightly tides. Estuarine Coastal and Shelf Science 59, 485–497.
Gran, H.H., 1931. On the conditions for the production of plankton in thesea. Raap. P.-v Reun. Conseil International pour l’Exploration de laMer 75, 37–46.
Guibout, P., 1987. Atlas Hydrologique de la Mediterranee. Lab. D’Ocean.Phys. du Mus. d’Historie Nat., Paris.
Heldad, M., Sacanlan, D.J., Norlan, S., Thingstad, F., Mann, N.H., 2003.Elemental composition of single cells of various strains of marine
D. Macıas et al. / Deep-Sea Research I 55 (2008) 832–846 845
Author's personal copyARTICLE IN PRESS
Prochlorococcus and Synechococcus using X-ray microanalysis. Lim-nology and Oceanography 48 (5), 1732–1743.
Herbland, A., Voituriez, B., 1979. Hydrological structure analysis forestimating the primary production in the tropical Atlantic Ocean.Journal of Marine Research 37, 87–101.
Holm-Hassen, O., Lorenzen, C.J., Homes, R.W., Strickland, J.D.H., 1965.Fluorometric determination of chlorophyll. Journal du ConseilInternational pour l’Exploration de la Mer 187, 9–18.
Huertas, E., Navarro, G., Rodrıguez-Galvez, S., Prieto, L., 2005. Theinfluence of phytoplankton biomass on the spatial distribution ofcarbon dioxide in surface sea water of a coastal area of the Gulfof Cadiz (southwestern Spain). Canadian Journal of Botany 83,929–940.
Izquierdo, A., Tejedor, L., Sein, D.V., Backhaus, J.O., Brandt, P., Rubino, A.,Kagan, B.A., 2001. Control variability and internal bore evolution inthe Strait of Gibraltar: a 2-D two-layer model study. Estuarine,Coastal and Shelf Science 53, 637–651.
Jamart, B.M., Winter, D.F., Banse, K., Anderson, G.C., Lam, R.K., 1977. Atheoretical study of phytoplankton growth and nutrient distributionin the Pacific Ocean off the northwestern US coast. Deep-SeaResearch 24, 733–753.
Kolberg, Z., Falkowski, P.G., 1993. Use of active fluorescence to estimatephytoplankton photosynthesis in situ. Limnology and Oceanography38 (8), 1646–1665.
Kolbowski, J., Schreiber, U., 1995. Computer-controlled phytoplanktonanalyzer based on a 4-wavelengths PAM chlorophyll fluorometer. In:Mathis, V.P. (Ed.), Photosynthesis, From Light to Biosphere. KluwerAcademic Publishers, Dordrecht, The Netherlands, pp. 825–828.
La Violette, P.E., 1995. Seasonal and interannual variability of the westernMediterranean Sea. In: Coastal and Estuarine Studies, vol. 46.American Geophysical Union Edition.
La Violette, P.E., Arnone, R.A., 1988. A tide-generated internal waveformin the western approaches to the Strait of Gibraltar. Journal ofGeophysical Research 93 (C12), 15653–15667.
Li, W.K.W., 2002. Macroecological patterns of phytoplankton in thenorthwestern North Atlantic Ocean. Nature 419, 154–157.
Longhurst, A., Harrison, A., 1989. The biological pump, profiles ofplankton production and consumption in the upper ocean. Progressin Oceanography 22, 47–123.
Macıas, D., Garcıa, C.M., Echevarrıa, F., Vazquez, A., Bruno, M., 2006. Tidalinduced variability of mixing processes on Camarinal Sill, Strait ofGibraltar. A pulsating event. Journal of Marine Systems 60, 177–192.
Macıas, D., Martin, A.P., Garcıa, C.M., Bruno, M., Garcıa Lafuente, J.,Izquierdo, A., Vazquez, A., Yool, A., Sein, D., Echevarrıa, F., 2007.Mixing and biogeochemical effects induced by tides on theAtlantic–Mediterranean flow in the Strait of Gibraltar. An analysisthrough a physical–biological coupled model. Progress in Oceano-graphy 74, 252–272.
Malone, T.C., 1980. Algal size. In: Morris, I. (Ed.), The PhysiologicalEcology of Phytoplankton. Blackwell Scientific Publications, Oxford,pp. 133–463.
Mann, K.H., Lazier, J.R.N., 1991. Dynamics of marine ecosystems. In:Biological–Physical Interactions in the Oceans. Blackwell ScientificPublications, Oxford.
Margalef, R., 1978. Life-forms of phytoplankton as survival alternatives inan unstable environment. Oceanologica Acta 1, 493–509.
Margalef, R., 1989. Ecologıa. Ediciones Omega.Moran, X.A.G., Taupier-Letage, I., Vazquez-Dominguez, E., Ruiz, S., Arin, L.,
Raimbault, P., Estrada, M., 2001. Physical–biological coupling inAlgerian Basin (SW Mediterranean): influence of mesoscales in-stabilities on the biomass and production of phytoplankton andbacterioplankton. Deep-Sea Research I 48, 405–437.
Navarro, G., Ruiz, J., Huertas, I.E., Garcıa, C.M., Criado-Aldeanueva, F.,Echevarrıa, F., 2006. Basin scale structures governing the position ofthe subsurface chl maximum in the gulf of Cadiz. Deep-Sea ResearchII 53, 1461–1481.
Ochoa, J., Bray, N.A., 1991. Water mass exchange in the Gulf of Cadiz.Deep-Sea Research 38 (1), S465–S503.
Pan, L.A., Zhang, L.H., Zhang, J., Gasol, J.M., Chao, M., 2004. On board flowcytometry observations of picoplankton comunity structure in theEast China Sea during the fall of different years. FEMS MicrobiologyEcology.
Passow, U., Alldredge, A.L., 1995. A dye-binding assay for the spectro-photometric measurement of transparent exopolymer particles TEP.Limnology and Oceanography 40 (7), 1326–1335.
Prieto, L., Ruiz, J., Echevarrıa, F., Garcıa, C.M., Bartual, A., Galvez, J.A.,Corzo, A., Macıas, D., 2002. Scales and processes in the aggregation ofdiatom blooms, high time resolution and wide size range records in amesocosm study. Deep-Sea Research I 49, 1233–1253.
Prieto, L., Navarro, G., Cozar, A., Echevarrıa, F., Garcıa, C.M., 2006.Distribution of TEP in the euphotic and upper mesopelagic zones ofthe southern Iberian coasts. Deep-Sea Research II 53, 1314–1328.
Reul, A., Vargas, J.M., Jimenez-Gomez, F., Echevarrıa, F., Garcıa-Lafuente,J., Rodrıguez, J., 2002. Exchange of planktonic biomass through theStrait of Gibraltar in late summer conditions. Deep-Sea Research II49, 4131–4144.
Reul, A., Munoz, M., Criado-Aldeanueva, F., Rodrıguez, V., 2006. Spatialdistribution of phytoplankton o13 mm in the Gulf of Cadiz in relationto water masses and circulation pattern under westerly and easterlywind regimes. Deep-Sea Research II 53, 1294–1313.
Rodrıguez, J., Blanco, J.M., Jimenez-Gomez, F., Echevarrıa, F., Gil, J.,Rodrıguez, V., Ruiz, J., Bautista, B., Guerrero, F., 1998. Patterns in thesize structure of the phytoplankton community in the deepfluorescence maximum of the Alboran Sea southwestern Mediterra-nean. Deep-Sea Research I 45, 1577–1593.
Rodrıguez, J., Jimenez-Gomez, F., Blanco, J.M., Lopez-Figueroa, F., 2002.Physical gradients, and spatial variability of the size structure andcomposition of phytoplankton in the Gerlache Strait (Antarctica).Deep-Sea Research II 49, 693–706.
Ruiz, J., Echevarrıa, F., Font, J., Ruiz, S., Garcıa, E., Blanco, J.M., Jimenez-Gomez, F., Prieto, L., Gonzalez-Alaminos, A., Garcıa, C.M., Cipollini, P.,Snaith, H., Bartual, A., Reul, A., Rodrıguez, V., 2001. Surfacedistribution of chl, particles and gelbstoff in the Atlantic jet of theAlboran Sea, from submesoscale to subinertial scales of variability.Journal of Marine Systems 29, 277–292.
Ruiz, J., Macıas, D., Peters, F., 2004. Turbulence increases the averagesettling velocity of phytoplankton cells. Proceedings of the NationalAcademy of Sciences of USA 101 (51), 17720–17724.
Schreiber, U., 1998. Chlorophyll fluorescence, new instruments for newapplications. In: Garab, V.G. (Ed.), Photosynthesis, Mechanisms andEffects. Kluwer Academic Publishers, Dordrecht, The Netherlands,pp. 4253–4258.
Strickland, J.D.H., Parsons, T.R., 1972. A practical handbook of seawateranalysis, second ed. In: Bulletin of Fisheries Research Board ofCanada, vol. 167, pp. 1–310.
Sverdrup, H.U., 1953. On conditions for the vernal blooming ofphytoplankton. Journal du Conseil Permanante International pourl’Exploration de la Mer 18, 287–295.
Taguchi, S., Ditullio, G.R., Laws, E.A., 1984. Physiological characteristicsand production of mixed layer and chl maximum phytoplanktonpopulations in the Caribbean Sea and western Atlantic Ocean. Deep-Sea Research 35, 1363–1377.
Utermohl, H., 1931. Neue Wege in der quantitaven Erfassung desPlanktons. Internationale Vereinigung fur Theoretische und Ange-wandte Limnologie Verhandlungen 5 (2), 567–597.
Utermohl, H., 1958. Zur Vervollkommnung der quantitativen Phyto-plankton-Methodik. Internationale Vereinigung fur Limnologie,Mitteilungen 9, 1–38.
Verity, P., Robertson, G., Tronzo, C., Andrews, M., Nelson, R., 1992.Relationships between cell volume and the carbon and nitrogencontent of marine photosynthetic nanoplankton. Limnology andOceanography 37 (7), 1434–1446.
Wash, J.J., 1988. On the Nature of Continental Shelves. Academic Press,New York, p. 126.
Wesson, J.C., Gregg, M.C., 1994. Mixing at Camarinal Sill in the Strait ofGibraltar. Journal of Geophysical Research 99 (C5), 9847–9878.
Yentsch, C.S., Menzel, D.W., 1963. A method for the determination ofphytoplankton chl and phaeophytin by fluorescence. Deep-SeaResearch 21, 1191–1218.
Zabala, L., 1999. Estudio del Picoplancton Autotrofo en el Golfo de Cadiz yMar de Alboran Mediante Citometrıa de Flujo. Departamento deBiologıa, Universidad de Cadiz, Cadiz.
Zar, J.H., 1974. Biostatistical Analysis. Prentice Hall International Editions,Englewood Cliffs, NJ, 265pp.
D. Macıas et al. / Deep-Sea Research I 55 (2008) 832–846846
Copyright © 2022 FDOKUMEN