Physical–biological coupling in the Strait of Gibraltar
16
Deep-Sea Research II 49 (2002) 4115–4130 Physical–biological coupling in the Strait of Gibraltar Fidel Echevarr ! ıa a, *, Jes ! us Garc ! ıa Lafuente b , Miguel Bruno c , Gabriel Gorsky d , Madeleine Goutx e , Nicol ! as Gonz ! alez f , Carlos M. Garc ! ıa a , Fernando G ! omez a , Juan M. Vargas b , Marc Picheral d , Laurent Striby e , Manuel Varela f , Jose J. Alonso c , Andreas Reul g , Andr ! es C ! ozar a , Laura Prieto a , Tarek Sarhan b , Francisco Plaza b , Francisco Jim! enez-G ! omez h a Area de Ecolog ! ıa, Facultad de Ciencias del Mar, Universidad de C ! adiz, 11510 Puerto Real, C ! adiz, Spain b Departamento de F! ısica Aplicada II. Universidad de M ! alaga. Campus de Teatinos. 29071 M ! alaga, Spain c Departamento de F! ısica Aplicada, Facultad de Ciencias del Mar, Universidad de C ! adiz, 11510 Puerto Real, C ! adiz, Spain d Laboratoire d’Oceanographie Biologique et Ecologie du Plancton Marin, Station Zoologique, 06234 Villefranche sur Mer, France e Laboratoire de Microbiologie Marine, CNRS/INSU-EP2032, Universite de la Mediterranee, Campus de Luminy, Case 907, Marseille Cedex 9, France f Instituto Espa * nol de Oceanograf ! ıa, Muelle de Animas s/n, 15001 A Coru * na, Spain g Departamento de Ecolog ! ıa. Universidad de M ! alaga. Campus de Teatinos. 29071 Malaga, Spain h Departamento de Biolog ! ıa Animal, Vegetal y Ecolog ! ıa. Universidad de Jaen. Paraje Las Lagunillas s/n. 23071 Jaen, Spain Received 28 April 2000; received in revised form 28 March 2001; accepted 17 July 2001 Abstract This study presents a joint analysis of the distributions of some biogeochemical variables and their relation to the hydrodynamics of Gibraltar Strait. It is a synthesis paper that brings together many results obtained during CANIGO project. We show the role of hydrodynamics as a forcing agent for the plankton community structure in the Strait, with emphasis on the two physical processes that we propose as key factors for the coupling: interface position and oscillations, and mixing processes along the Strait. As a general pattern, autotrophic plankton biomass increases at the Strait from southwest to northeast, a tendency that coincides with a gradual elevation of the interface depth in the same direction. The different mechanisms of mixing that take place in the Strait are briefly reviewed: The occurrence of the internal hydraulic jump is an important mechanism of mixing constrained to the spring tide situations, but other processes such as the generation of arrested internal waves of wavelength around 1 km are proposed as a complementary mixing mechanism, particularly during neap tides situations. Both mechanisms, the elevation of the pycnocline and these mixing events, can enhance biological productivity and biomass accumulation on the northeastern sector of the Strait, since phytoplankton cells are there packaged in a water mass with sufficient light and nutrients and smaller advective velocity. There is a clear north–south difference in the biological response to these upwelling episodes in the eastern section, with high nutrient and low chlorophyll in the south and the opposite in the north. The deeper interface and the greater water speed are the proposed reasons for this lower nutrient uptake on the southeastern sector. Finally, the temporal scales of variation of the mixing events, the influence of its periodicity on the productivity of the area and the influence of these upwelling episodes in the nearest Albor ! an Sea are discussed. r 2002 Elsevier Science Ltd. All rights reserved. *Corresponding author. Tel.: +34-956-01-6025; fax: +34-956-01-6019. E-mail address: fi[email protected] (F. Echevarr ! ıa). 0967-0645/02/$ - see front matter r 2002 Elsevier Science Ltd. All rights reserved. PII:S0967-0645(02)00145-5
-
Upload
independent -
Category
Documents
-
view
5 -
download
0
Transcript of Physical–biological coupling in the Strait of Gibraltar

Deep-Sea Research II 49 (2002) 4115–4130
Physical–biological coupling in the Strait of Gibraltar
Fidel Echevarr!ıaa,*, Jes !us Garc!ıa Lafuenteb, Miguel Brunoc, Gabriel Gorskyd,Madeleine Goutxe, Nicol!as Gonz!alezf, Carlos M. Garc!ıaa, Fernando G !omeza,
Juan M. Vargasb, Marc Picherald, Laurent Stribye, Manuel Varelaf,Jose J. Alonsoc, Andreas Reulg, Andr!es C !ozara, Laura Prietoa,Tarek Sarhanb, Francisco Plazab, Francisco Jim!enez-G !omezh
aArea de Ecolog!ıa, Facultad de Ciencias del Mar, Universidad de C !adiz, 11510 Puerto Real, C !adiz, SpainbDepartamento de F!ısica Aplicada II. Universidad de M !alaga. Campus de Teatinos. 29071 M !alaga, Spain
cDepartamento de F!ısica Aplicada, Facultad de Ciencias del Mar, Universidad de C !adiz, 11510 Puerto Real, C !adiz, SpaindLaboratoire d’Oceanographie Biologique et Ecologie du Plancton Marin, Station Zoologique, 06234 Villefranche sur Mer, France
eLaboratoire de Microbiologie Marine, CNRS/INSU-EP2032, Universite de la Mediterranee, Campus de Luminy, Case 907,
Marseille Cedex 9, Francef Instituto Espa *nol de Oceanograf!ıa, Muelle de Animas s/n, 15001 A Coru *na, Spain
gDepartamento de Ecolog!ıa. Universidad de M !alaga. Campus de Teatinos. 29071 Malaga, SpainhDepartamento de Biolog!ıa Animal, Vegetal y Ecolog!ıa. Universidad de Jaen. Paraje Las Lagunillas s/n. 23071 Jaen, Spain
Received 28 April 2000; received in revised form 28 March 2001; accepted 17 July 2001
Abstract
This study presents a joint analysis of the distributions of some biogeochemical variables and their relation to the
hydrodynamics of Gibraltar Strait. It is a synthesis paper that brings together many results obtained during CANIGO
project. We show the role of hydrodynamics as a forcing agent for the plankton community structure in the Strait, with
emphasis on the two physical processes that we propose as key factors for the coupling: interface position and
oscillations, and mixing processes along the Strait. As a general pattern, autotrophic plankton biomass increases at the
Strait from southwest to northeast, a tendency that coincides with a gradual elevation of the interface depth in the same
direction. The different mechanisms of mixing that take place in the Strait are briefly reviewed: The occurrence of the
internal hydraulic jump is an important mechanism of mixing constrained to the spring tide situations, but other
processes such as the generation of arrested internal waves of wavelength around 1 km are proposed as a
complementary mixing mechanism, particularly during neap tides situations. Both mechanisms, the elevation of the
pycnocline and these mixing events, can enhance biological productivity and biomass accumulation on the northeastern
sector of the Strait, since phytoplankton cells are there packaged in a water mass with sufficient light and nutrients and
smaller advective velocity. There is a clear north–south difference in the biological response to these upwelling episodes
in the eastern section, with high nutrient and low chlorophyll in the south and the opposite in the north. The deeper
interface and the greater water speed are the proposed reasons for this lower nutrient uptake on the southeastern sector.
Finally, the temporal scales of variation of the mixing events, the influence of its periodicity on the productivity of the
area and the influence of these upwelling episodes in the nearest Albor!an Sea are discussed. r 2002 Elsevier Science
Ltd. All rights reserved.
*Corresponding author. Tel.: +34-956-01-6025; fax: +34-956-01-6019.
E-mail address: [email protected] (F. Echevarr!ıa).
0967-0645/02/$ - see front matter r 2002 Elsevier Science Ltd. All rights reserved.
PII: S 0 9 6 7 - 0 6 4 5 ( 0 2 ) 0 0 1 4 5 - 5

1. Introduction
The Strait of Gibraltar is the narrow andshallow connection between the MediterraneanSea and the Atlantic Ocean, with a minimumwidth of about 14 km and a sill depth of about300m. The water circulation in the Strait ischaracterised by a surface inflow of Atlanticwaters and a deep outflow of dense Mediterraneanwater, which is ultimately driven by the excess ofevaporation over precipitation in this basin (seeLacombe and Richez, 1982, for instance). Accord-ing to Bryden et al. (1994), the exchanged flows atthe sill, the section of minimum cross-area, are ofthe order of 0.7 Sv, (1Sv=106m3 s�1) with a netflow into the Mediterranean of around 0.05 Svnecessary to balance the evaporative losses. Thedescription of the exchange as a simple one-dimensional, two-layer system flowing in oppositedirections is a good first approximation (Armi andFarmer, 1988), but it is deficient in describing thevertical structure of some variables and theirchanges across and along the Strait.
A variety of phenomena are superposed on, andinteract with, this basic inverse estuarine circula-tion (e.g., Armi and Farmer, 1988). Transportfluctuations at tidal and longer periods can reversethe flows. At spring tides, in particular, an internalbore tends to be released from the sill as the tidereverses from ebb to flood, this bore breaking upinto a series of large internal waves (Alpers et al.,1996). Important mixing can accompany the large-amplitude internal motions (Wesson and Gregg,1994). Recently, other processes producing mixingalso during neap tides has been identified (Brunoet al., 2002). The effect of these mixing mechan-isms on the biology is explored in this paper.
Research in biological oceanography at theStrait has been very scarce. There are someestimations of different biogeochemical variablessampled in surveys with large spatial grid and notspecifically designed to investigate the Gibraltararea itself, and without an analysis aimed toconnect the distribution of these variables andhydrodynamics. During the MEDIPROD IVsurvey (October–November 1981), the interpreta-tion of some biological and geochemical distribu-tions was made from the standpoint of very
general principles of the physical oceanography(i.e. Packard et al., 1988; Minas et al., 1991), withemphasis in the Mediterranean sector of the Straitand without a detailed study of the biologicalcommunities.
Within CANIGO, a large set of physical andbiogeochemical observations was collected inorder to carry out an analysis of the influence ofthe physical structure on the distribution ofnutrients, organisms, and particles. Preliminaryobservations of the distribution of some diatomspecies led us to propose a re-circulation model ora conveyor-belt-like system drawn by the two-layer structure of the Strait (G !omez et al., 2000a).Efforts also were done during CANIGO toestimate the fluxes of several materials throughthe strait (e.g. G !omez et al. (2000b), for nutrientfluxes; Dafner et al. (2001), for organic andinorganic carbon fluxes; Elbaz-Poulichet et al.(2001), for metal fluxes; Reul et al. (2002), forbiomass fluxes).
Here, we synthesise information split betweenseveral works (Bruno et al., 2002; Garc!ıa Lafuenteet al., 2000; Garc!ıa Lafuente et al., 2002; G !omezet al., 2000a, b; Reul et al., 2002) to show the roleof hydrodynamics as a forcing agent for theplankton community structure and associatedwater chemistry in the Strait of Gibraltar. First,we describe the main oceanographic features at theStrait, with emphasis on the two physical processesthat we propose as key factors for the coupling:the interface position and oscillations, and themixing processes along the Strait, especially at thesill area. Then, we analyse the mechanismsinvolved in the suggested coupling given theresponse of organisms to these physical phenom-ena.
2. Methods
During two cruises on board R/V Cornide de
Saavedra (June 18–25, 1997) and R/V Thalassa
(September 2–9, 1997), we sampled eight stationsarranged in three transects at the Atlantic, Centraland Mediterranean sections of the Strait (Fig. 1).The stations were repeatedly sampled during asemidiurnal tidal cycle at a variable sampling
F. Echevarr!ıa et al. / Deep-Sea Research II 49 (2002) 4115–41304116

interval that ranged between 1 and 3 h. Finally, weinclude observations made at the sill area of theStrait (Fig. 1) on board R/V Investigador inNovember 1998, an opportunity ship equippedwith ADCP and a CTD with an additional sensorof transmissivity. The details of this last cruise aregiven in Bruno et al. (2002). Other observationsfrom a mooring array deployed at the easternsection of the Strait (see Fig. 1; Garc!ıa Lafuenteet al., 2002) also have been used.
During the CANIGO cruises water sampleswere collected with a CTD-rosette outfitted with20-l Niskin bottles. Also, several UnderwaterVideo Profiler (UVP) (Gorsky et al., 2000) castswere performed at each station. This multisensorincluded CTD, fluorometer, nephelometer (turbid-ity measurements), and a video system for theabundance and size assessment of particles>500 mm. These large particles (marine snow)were filmed by a video camera and analysed by anautomatic image analyser (Gorsky et al., 2000,Stemmann et al., 2000).
Samples of dissolved inorganic nutrients (5ml)taken at the different sampling depths were frozen(�201C). After thawing, concentration of nitratewas measured with an automatic Technicon AA-IIanalyser following the method described by
Grasshoff et al. (1983). For total chlorophyll aconcentration, 500ml of seawater were filteredthrough Whatman GF/F glass fibre filters andchlorophyll was extracted in a 90% acetonesolution overnight (UNESCO, 1994). Fluores-cence was measured in a Turner Designs-10fluorometer. To estimate the concentration ofchlorophyll >20 mm, 2.5 l of water were filteredthrough a 20 mm pore size mesh.
For microplankton analysis, 2 l of water werefiltered through a 5-mm pore sized mesh and theretained material was preserved with Lugol’ssolution. Subsamples (10–50ml) were settled inUtermohl chambers and counted with an invertedmicroscope. Simultaneously to the counting pro-cess, microplankton biomass expressed as biovo-lume was calculated by approximation to regularfigures (ellipsoid, cylinder, hemisphere) using aVIDS V (Analytical Measuring Systems, Inc.)semiautomatic image analysis system. Abundanceof smaller size categories of plankton was esti-mated by using flow cytometry.
2.1. Interface definition
The conveyor-belt biophysical model previouslysuggested for the Strait (G !omez et al., 2000a) has a
100100100
100100100
300300
3003000
0010000
00100 300300
300300
700700
700700
3000300 300300
30030001000
10100100100100100
sillll
66
7
884
5555
1
2
3
2
33
0 10101010
JuneSeptember
EUROPE
AFRICA
Tarifa
Tanger
Ceuta
36˚10'
36˚ 00'
35˚ 50'
5˚ 50' 5˚ 40' 5˚ 30' 5˚ 20'
Longitude West
Latit
ude
N
Fig. 1. Map of the Strait of Gibraltar, showing the bathimetry and the position of the sampling stations at June (open circles) and
September (filled circles). Crosses represent the position of the three mooring lines with currentmeters. The Camarinal Sill position is
also shown.
F. Echevarr!ıa et al. / Deep-Sea Research II 49 (2002) 4115–4130 4117

time scale related to the time it takes a water parcelin the upper layer (lower layer) to travel from theCamarinal sill to the eastern section of the Strait,which are a distance of about 40 km. For aspatially averaged typical inflowing velocity of0.5m s�1, this time is 1 day, while the time it takesa water parcel in the lower layer to move theopposite way is somewhat longer because of theslower outflowing velocity. Tidal velocities maymodify these times slightly. Thus, the time scale ofinterest is from several hours to several days.
At these time scales, tidal fluctuations dominatethe flow variability. Tidal transports are two orthree times greater than the time-averaged trans-port (Bryden et al., 1994; Garc!ıa Lafuente et al.,2000). Consequently, the flow of one of the layersreverses in some places of the Strait during someperiods of the tidal cycle (Candela et al., 1990;Bryden et al., 1994; Garc!ıa Lafuente et al., 2000),and the entire water column moves in the samedirection. When this unidirectional flow happens,the two-way exchange interface, which separatesinflow and outflow, disappears. However, from thestandpoint of water mass characteristics the inter-face still exists and it must be defined in terms ofthese characteristics. Due to mixing, this hypothe-tical interface actually becomes a mixing inter-facial layer separating purer Atlantic andMediterranean waters. In order to characterisethis mixing-layer we have followed a methodsimilar to that used by Bray et al. (1995). Itconsists of fitting a ‘‘smooth two layer function’’ ofthe form
SðzÞ ¼S2 � S1
1þ expz� z0
Dz
� �þ S1
to the observed salinity profiles. Here, z is thedepth, and S1; S2; z0 and Dz are parameters to beestimated. S1 and S2 can be identified with thesalinity of the Atlantic and Mediterranean layersin a two-layer system, z0 is the depth of the mid-point of the halocline (and of the maximumsalinity gradient, as well), which would correspondto the depth of the interface in a two-layer system,and 6�Dz is the halocline thickness that weidentify with the mixing-layer thickness. Thequality coefficient of the fitting, defined in the
same way as in Bray et al (1995), was greater than0.9 in 184 out of 222, fits and only in 11 cases itwas less than 0.7. Therefore, the fitting is good andexplains more than 90% of the variance of theoriginal data on average.
3. Results and discussion
3.1. The position of the interface
Figs. 2A and B show the spatial distribution ofz0 (i.e. of the interface) during both cruises. Itagrees well with the classically reported interfaceshape in the Strait, showing the along-straitgradient, typical of a density driven two-layerflow, and the across-strait gradient forced by theearth rotation. The surface of null along-straitvelocity that is well defined for slowly varyingsubinertial flows (Garc!ıa Lafuente et al, 2002)must lay somewhere within this mixing layer (anexample of this feature can be seen in Fig. 3 ofReul et al., 2002). Therefore, our definition of theinterfacial mixing layer is consistent with thestricter definition used in studies of low frequencyvariability of the steady exchange.
The combination of the aforementioned gradi-ents produces a shallower interface at the north-eastern side of the Strait. Figs. 2C and D show thethickness of the mixing layer in June andSeptember, respectively. It is thicker in the southand thinner in the north, with the northeasternpart of the Strait being the place with the thinnestmixing layer. Globally, this layer was thicker inSeptember than in June and the along-strait slopewas noticeably steeper in June. These differencesare not surprising if we consider the importantsubinertial variability of the exchange through theStrait (Candela et al., 1989).
The method followed to determine the interfaceand the mixing layer has the advantage ofdescribing these important parameters taking intoaccount the local properties of the water column.We can easily determine which value of salinitycorresponds to z0 at each station, and use thisvalue to decide if a given sample was acquired inthe upper or in the lower layer. In other words, ifS0 is the local salinity in z0ðx; yÞ; then a biological
F. Echevarr!ıa et al. / Deep-Sea Research II 49 (2002) 4115–41304118

sample collected in point ½x; y; z� is considered asbelonging to the upper (lower) layer if the salinitySðx; y; zÞ at this point is less (greater) than S0: All
vertical salinity profiles collected verified thatwherever Sðx; y; zÞ was less (greater) thanS0ðz0ðx; yÞÞ; z was above (below) z0ðx; yÞ: This
Fig. 2. (a,b) Maps of the mean interface depth (m) defined as the mean value of z0 (see text) for all the CTD casts accomplished at each
station during the cruises of June and September, respectively. (c,d) Maps of the mean interface thickness (m) defined as the mean value
of 6� Dz (see text) for all the CTD casts accomplished at each station during the cruises of June and September, respectively. (e)
Variance (m2) of the mean interface depth during June (that is, variance of the variable in (a)). (f) Variance (m2) of the mean interface
thickness during June (that is, variance of the variable in (c)).
F. Echevarr!ıa et al. / Deep-Sea Research II 49 (2002) 4115–4130 4119

additional test is necessary to ensure the correct-ness of the criterion because salinity does notincrease monotonically with depth (small salinityinversions are often found in the upper layer of theStrait because of the presence of North AtlanticCentral Water, NACW). Table 1 shows the valuesof S0ðx; yÞ for the different stations, which agreewith the values reported in the literature (Brydenet al., 1994; Garc!ıa Lafuente et al., 2000). Theimportance of this criterion is evident in order toidentify the layer to which a biological samplebelongs.
3.2. Distribution of biomass and particles
Our results show a relevant role of interfaceposition and oscillations explaining the biomassdistribution pattern. The depth-integrated chlor-ophyll values at the 8 stations sampled at bothcruises (June and September) are plotted in Fig. 3.A clear general increase towards the northeast canbe found, an increase, which parallels the interfaceascent. Similar tendencies have been found for thetwo cruises performed, although June chlorophyllpatterns show higher spatial heterogeneity and amore marked N–S gradient than in September.This is especially clear in the eastern section of theStrait. The tidal phase when stations were sampledcan have an influence on the variability; found,thus in June almost all the stations were samplednear HW (high-water), whereas in September thestations placed on the main SW–NE axis werevisited near LW (low-water). Another temporal
difference is that station 1 showed high variabilitybetween both sampling periods. The shallownessof this coastal station (B150m depth) favours theappearance of events that lead to an enhancedproduction (Establier and Margalef, 1964).
The distribution of chlorophyll and microphy-toplankton is affected by the depth of the inter-face, which shows a clear ascent towards thenortheast. But also the position of the thermoclineand the separation between the two discontinu-ities, thermocline and interface, affect thesedistributions: In the Atlantic side, the thermoclineis more than 100m shallower than the interface,the chlorophyll showing subsurface maxima asso-ciated with the thermocline. Northeastwards, theinterface rises and gradually merges with thethermocline in a shallow position. This coinci-dence reinforces the stratification and can enhancethe chlorophyll-rich area observed. The magnitude
Table 1
Depth of the interface, thickness of the interfacial mixing layer,
and salinity at the depth of the interface (see text for details)
during both cruises
St. June September
z0 6� Dz S0 z0 6� Dz S0
2 185 90 37.18 170 100 37.35
3 230 110 37.28 195 115 37.30
4 65 55 37.27 110 105 37.42
5 135 80 37.35 150 145 37.40
6 35 40 37.80 80 55 37.63
7 60 60 37.46 90 80 37.56
8 70 70 37.40 105 125 37.56
50
100
50
100
150200
5º 20'5º 40' 5º 30'5º 50'
36º 10'
36º 00'
35º 50'
36º 10'
36º 00'
35º 50'
5º 20'5º 40' 5º 30'5º 50'
40 60
80
100
JUNE
SEPTEMBER
Fig. 3. Integrated chlorophyll distribution (mgm�2) for the
upper 100m at both CANIGO cruises.
F. Echevarr!ıa et al. / Deep-Sea Research II 49 (2002) 4115–41304120

of the chlorophyll value is inversely related to thedistance between the interface and the thermo-cline, a fact previously reported by Rodr!ıguez et al.(1998) in a frontal region in the adjacent Albor!anSea. The contribution of chlorophyll>20 mm tototal chlorophyll also differs between Atlantic andMediterranean waters (Fig. 5C). Around 40% oftotal chlorophyll corresponds to the fraction ofcells >20 mm in NE stations whereas only less than10% of total chlorophyll belongs to cells largerthan 20 mm in the Atlantic transect (specially at thesouthern station). Therefore, there is a differencein the predominant sizes and species of phyto-plankton cells, with larger cells occurring prefer-entially in the Mediterranean stations of the Strait.This fact is not surprising as the selection of sizeand shape of phytoplankton species that leads tothe observed assemblages structure have beenclassically related both to nutrient and turbulentenergy levels (Margalef, 1978) and recently tovertical velocities (Rodr!ıguez et al., 2001). Indeed,the smaller size fractions of picoplankton (0.2–2 mm) and nanoplankton (0.2–2 mm) behave in adifferent manner, with higher concentrations atthe Atlantic side (Reul et al., 2002).
Although casts were not coincident with watersampling, the results from the Underwater VideoProfiler fit well with the distribution of phyto-plankton (Figs. 4 and 5). In the Mediterraneanside, the high concentration of phytoplankton iscorrelated to the concentration of large particles(>500 mm) and turbidity (particles o50 mm). Thedistribution of turbidity along the Strait shows thesame pattern described by Jerlov (1953). Thisauthor reported high-turbid waters located in theupper layer of the Mediterranean entrance of theStrait (associated with high phytoplankton bio-mass) and near the bottom of the Atlantic entrance(associated with the Mediterranean OutflowingWaters—MOW) (Fig. 4 in Jerlov, 1953). However,the deep Mediterranean current presented lowvalues of turbidity before crossing the sill (Med-iterranean side). The minimum value of turbidityreported by Jerlov (1953) coincided with theNACW layer in the Gulf of Cadiz. The lowervalues of turbidity observed in the NACW incomparison with the Surface Atlantic Water(SAW) could be related to the position of the
NACW in the stratified water column in the Gulfof Cadiz. If we consider that the distribution ofsuspended matter is closely related to the produc-tion of living matter, the SAW (in the euphoticzone) could present high concentration of smallparticles originated from biological activity. Incontrast, NACW (aphotic zone) presents lowparticle values that depend on the fallout fromthe overlying SAW. Although the concentration ofparticles in the NACW increased along the Strait,it did not reach the values observed in the SAW.
The biological similarity between upper layers ofMediterranean stations and lower layers of central(and sometimes Atlantic) stations could indicateadvective connections between the stations (Figs. 4and 5). This similarity also is supported by thedistribution of the main taxonomic groups ofmicrophytoplankton. Phytoplankton assemblagesare very similar in central and Mediterraneanstations; both placed at the same side of CamarinalSill. The microphytoplankton assemblage at thesestations is dominated by diatoms, mainly thegenera Chaetoceros, Guinardia, and Rhizosolenia,and is very different to the phytoplanktonassemblage typical of the Atlantic sector, on theother side of the sill, with a dominance ofdinoflagellates and relatively more microhetero-trophs (G !omez et al., 2000a). These differencesmatch well with the consideration of eutrophicconditions toward the east and oligotrophic to thewest of the Sill. To explain the differences in thecommunity structure found on either side of theSill, it is important to take into account the mixingprocesses that take place along the Strait, butespecially at the Camarinal Sill region. We reviewthis subject in the following section.
3.3. Mixing processes in the Strait
Mixing is a key issue in the conveyor-beltscheme. It is responsible for the degeneration ofthe interface into an interfacial mixing layer, thuscontributing to the enrichment processes of theupper layer. There are several sources of mixingassociated with the different time scales of the flowvariability. The first one is related to the shearedvertical structure of the mean flow, which ismore important in those zones where the spatial
F. Echevarr!ıa et al. / Deep-Sea Research II 49 (2002) 4115–4130 4121

acceleration of the flow is high. East of CamarinalSill, the inflow accelerates and entrains water fromthe lower layer. The interfacial layer moves, onaverage, toward the east driven by this mechanism(Bray et al., 1995). A consequence is that theamount of inflow and outflow at the easternsection is greater than at the sill section, whichimplies upward motion from the lower layer toconserve mass.
A second source is tidal in origin, particularlyassociated with the semidiurnal M2 tide, which isthe main source of flow variability (see, for
instance, Candela et al., 1990). Tidal flow isstrongly dependent on the along-strait coordinate.Garc!ıa Lafuente et al. (2000) reported a M2 inflowsignal of 0.3 Sv at the eastern section, while Brydenet al. (1994) calculated 2.3 Sv at Camarinal Sill.The difference must remain in between (internaldivergence), feeding a fluctuating reservoir andmaking the interface to oscillate up and down.Important mixing is expected to occur in thisreservoir, which is associated with the baroclinicnature of the tidal motions. Also, the thickness ofthe interface is sensitive to this dynamics since
0
100
200
300
400
3 75
0
100
200
300
400
3 75
500
600
0
100
200
300
400
3 75
0
100
200
300
400
3 75
500
600
0.04
0.02 0.06
0.04
2535
50 35
100
0.10.3
0.5
0.70.3
0.10.001
0.002
0.005
0.010
0.020
JUNE
Chlorophyll a (µg L-1) Diatoms (L-1)
Particles (L-1) Turbidity (FTU)
Dep
th (
m)
Dep
th (
m)
50
(A) (B)
(C) (D)
Fig. 4. Along-strait vertical distribution of (A) chlorophyll a (mg l�1), (B) diatoms concentration (cells l�1), both down to 400m. (C)
particles (No. l�1) and turbidity (FTU) down to 700m during the June cruise. Stations 3, 5 and 7 have been selected because they are
aligned along the main channel. Note the instantaneous position of the Atlantic–Mediterranean Interface as a horizontal thick line in
the upper profiles.
F. Echevarr!ıa et al. / Deep-Sea Research II 49 (2002) 4115–41304122
mixing is enhanced during flood tide when thevertical shear of horizontal velocity is greater(Garc!ıa Lafuente et al., 2000). The series of CTDcasts accomplished during both CANIGO cruisesallow us to roughly depict these features. Figs. 2Eand F show the variance of the interface depth (z0)
and interface thickness (Dz) during June. The sillarea is the place with the greatest variance ofboth parameters. Also, a clear south to northgradient is observed at the eastern section,suggesting that internal tidal dynamics is enhancedin the south.
SEPTEMBER
Dep
th (
m)
400
0
100
200
300
3 75
0.10
0.25 0.5 1 1.5
0
100
200
300
400
3 75
500
600
0
100
200
300
400
3 75
500
600
Dep
th (
m)
1020
30
40
50
60
40
40
4050
60
30
0.02
0.04
0.06
0.1
0.02
0.04
0.08
400
0
100
200
300
3 75
10
25
2550
400
0
100
200
300
3 75
0.01
0.05 0.10
0.200.40
Dep
th (
m)
(A) (B)
(C)
(D) (E)
Fig. 5. Along-strait vertical distribution during the September cruise: (A) chlorophyll a (mg l�1), (B) diatoms concentration (cells l�1),
(C) percentage of chlorophyll in cells larger than 20 mm, (D) particles (No. l�1) and (E) turbidity (FTU).
F. Echevarr!ıa et al. / Deep-Sea Research II 49 (2002) 4115–4130 4123

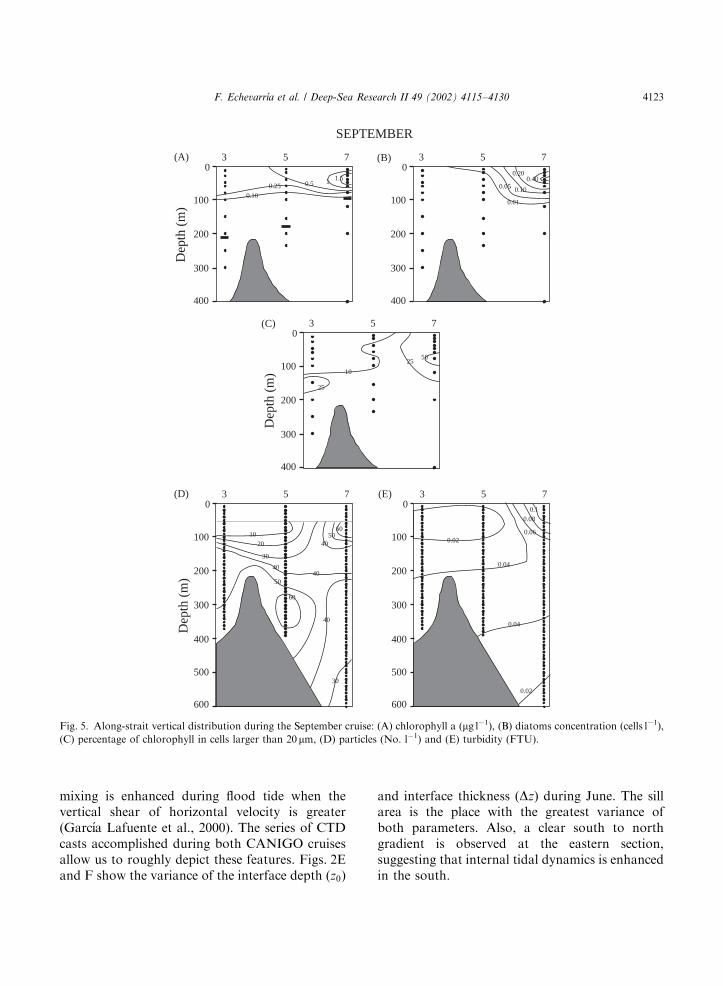
A third and more important source is linked toprocesses occurring at subtidal time scales, such asthe periodic formation during flood tide (westwardflow) of internal hydraulic jumps west of Camar-inal Sill and their subsequent release (Armi andFarmer, 1988). These authors showed the existenceof fine structure in the salinity and temperatureprofiles taken in the jump, which is indicative ofactive mixing. Another short time-scale internalprocess producing significant mixing is the gen-eration of arrested internal waves over theCamarinal Sill crest during some flood tides,
whose wavelength is around 1 km (Bruno at al.,2002). The interaction of the velocity profile of thewave and the basic flow increases the velocityshear in the wave trough, enhancing the interfacialmixing, as suggested by the fine structure visible inthe vertical profiles of salinity and temperaturetaken in the trough of one of these waves (seeFig. 6 of Bruno et al., 2002). Figs. 6A–C illustratethe coupling between the wave shape (determinedby the position of the isohalines), the verticalvelocity, and the concentration of particulatematerial measured by the transmissometer. The
Fig. 6. Contour plot of salinity (a), vertical velocity (b), and turbidity (c) during an ‘‘arrested wave’’ episode at the sill region of the
Strait.
F. Echevarr!ıa et al. / Deep-Sea Research II 49 (2002) 4115–41304124
vertical velocity has the expected pattern for awave that has tendency to propagate toward theeast but that remains arrested by the flow. Theparticulate material is concentrated in the wavetrough as a consequence of vertical advection bythe velocity wave field. Further mixing wouldspread this material and fertilise the upper layer.The details of the sampling and analysis of thearrested wave event presented in Fig. 6 can befound at Bruno et al. (2002).
These two processes are mutually exclusive.Trapping of the waves always occurs undersubcritical conditions over Camarinal Sill whenthe internal Froude number (G2 ¼ ½u21=g
0h1�þ½u22=g
0h2�; where ui and hi; i ¼ 1; 2; are the velocityand thickness of layer i; respectively, and g0 is thereduced gravity) is 0.6–0.7 (Farmer and Armi,1999). The internal hydraulic jump needs criticalcondition at the sill (G2 ¼ 1). Since G2o1 isassociated with weaker tidal flows, the formationof arrested waves is more frequent during neaptides and appears to be the replacing mixingmechanism of the hydraulic jump. In both cases,when the flood tide slacks, the waves or theinternal jump are released, facilitating the advec-tion of the material previously pumped by thewave or the jump to the east. Further mixing in theleading border of the released wave trains orinternal bore is expected to happen during itssubsequent eastward propagation. For G2 greaterthan 0.7, however, no arrested waves wereobserved (Bruno et al., 2002) and the interval0:7oG2o1 is not adequate for mixing processesassociated with these hydrodynamic features.G2o0:6 leads to neither the generation of arrestedwaves nor to the hydraulic jump, so that mixing atCamarinal Sill is greatly reduced.
All these processes, particularly the arrestedwaves and the hydraulic jump, are effective mixingmechanisms, though they are difficult to quantify.Wesson and Gregg (1994) estimated the mixingbetween both layers to be about 0.1 Sv, which is asignificant percentage of the outflow.
3.4. Nutrients and plankton response to mixing
Nitrate concentrations along the Strait (st. 3, 5,7) are shown in Figs. 7A and B, with similar trends
found at June and September cruises. On theAtlantic side, the interface is deeper and the nitrateconcentration in the upper layer is low. In thecentral station the nitrate concentration in theupper layer increases, regardless of the depth ofthe interface, which was significantly differentduring both cruises. The mixing events at the sillregion previously discussed should be the reasonfor this increase in nutrient concentration. Duringthe eastwards displacement of upper water thisnutrient could be progressively consumed byphytoplankton, as is suggested by the lowerconcentration in the Mediterranean side (st. 7).
Minas et al. (1991) have previously proposed theinfluence of mixing events at the sill. These authorsshowed the highest nutrient concentration of theMediterranean at the middle of the Strait as aconsequence of these mixing events. However, it isuncertain the amount of nutrient recovered byvertical mixing through the interface and theincidence of the injection of nutrient-rich NorthAtlantic Central Water at the sill (Minas andMinas, 1993).
When mixing events occur at the sill region ofthe Strait, the surface water enriched with nu-trients is advected towards the Mediterranean,with decrease of nutrients and an increase ofchlorophyll (Figs. 4, 5 and 7). Mixing processesdescribed in the previous section imply significantrecirculation of Mediterranean waters, whichaffects the surface nutrient concentration, andpropitiates the ascent of seeding cells. G !omez et al.(2000b) proposed a potential value of 40 kgC s�1
as a preliminary estimation of the contribution ofthe upwelled nutrients (estimated in 500molNO3 s
�1, taking the value of 0.1 Sv of upwelledwater mentioned by Wesson and Gregg (1994) anda NO3 concentration of 5 mmol l�1) to planktonbiomass, assuming the constant 1.59 to convertmmol nitrate to mg Chl a (Takahashi et al., 1986),a carbon to chlorophyll ratio of 50 (Harris, 1986),and the Redfield ratio (C:N=6.6).
However, there is a clear north–south differencein the plankton response to this enrichment. Theincrease of chlorophyll occurs only in the north (st.6 and 7) while it does not occur in the south (st 8)(Fig. 3). Nutrients are low in the north, probablybecause of phytoplankton uptake, and are highest
F. Echevarr!ıa et al. / Deep-Sea Research II 49 (2002) 4115–4130 4125

in the SE (st 8). To explain this different N–Sresponse, there are two variables that changesignificantly in this across strait direction andmust be taken into account: interface depth andwater velocity.
On the eastern side of the Strait the averageinterface is shallower towards the north (Fig. 2). Inthe upper layer of the station 6, the low nutrientconcentrations could be attributed to the highphytoplankton abundance, although in June, theproximity of the interface to the surface alters thegeneral trend. In the Station 8, on the southeasternside, we found the highest concentration of nitrateat both cruises, together with lower chlorophyllvalues (Fig. 7). Station 8 also must receive the
upwelled nutrients from the sill region, butphytoplankton does not incorporate these nutri-ents which may be due to the fact that the interfaceis deeper. Also, it does not coincide with thermo-cline. We could relate these patterns to theSverdrup effect, which can be described as theenhancement in productivity that occurs when anepisode of mixing is followed by stratificationshallow enough to confine the cells in a well-illuminated layer (i.e. Mann and Lazier, 1991).Sverdrup (1953) introduced the concept of ‘‘cri-tical depth’’ as the depth at which the integrated(through depth and time) gross photosynthesisequals the integrated respiration by phytoplank-ton. If there is no nutrient limitation and the depth
0
100
200
300
400
3 750
100
200
300
400
3 75
Dep
th (
m)
JUNE SEPTEMBER
2.51
7.5
5
1
2.5
5
7.5
2.5
1
7.5
5 52.5
1
0
100
200
6 87
2.5
1
7.5
5
2.5
5
Dep
th (
m)
0
100
200
6 87
2
10.5
0.1
0.5
0.5
1
Dep
th (
m)
0
100
200
6 87
2 1
0.1
1.5
100
200
06 87
1
7.5
2.55
Nitrate (µM)
Nitrate (µM)
Chlorophyll (µg L-1)
(A) (B)
(C) (D)
(E) (F)
Fig. 7. (Upper panels) Along-strait (st. 3, 5, 7) vertical distribution of NO3 during June and September cruises. (Central panels)
Across-strait vertical distribution of NO3 at the eastern section of the strait (st. 6,7,8) during June and September cruises. (Lower
panels) Across-strait vertical distribution of chlorophyll at the same eastern section of the Strait.
F. Echevarr!ıa et al. / Deep-Sea Research II 49 (2002) 4115–41304126

of mixing is less than the critical depth, integratedgross photosynthesis is larger than integratedrespiration, and net production will result.
The horizontal water velocity also has impor-tant across-strait structure (Pettigrew and Hyde,1990; Fig. 3 of Reul et al., 2002). Mean inflowingvelocities increase from B40 cm s�1 in the north toB75 cm s�1 in the south. The depth of the nullalong-strait velocity of the mean exchange deepensfrom 100m at the north mooring to 130m at thesouth (see Fig. 3 of Reul et al., 2002). Bothfeatures would produce a mean transport perwidth unit around 2.5 times greater in the souththan in the north. This across-strait structure ofthe flow influences the spatial distribution ofbiological variables. For instance, if we assumethat the aforementioned nutrient fertilisation ofthe upper layer in Camarinal Sill is spatiallyhomogeneous, then the nutrient flux on the easternsection would be around 2.5 times higher at thesouthern part of the Strait. In addition, the fasterinflowing velocity in the south implies thatmicrophytoplankton has less time to convertnutrients into biomass. Thus, the 40 kgC s�1 oftotal biomass generated at the Strait proposed byG !omez et al. (2000b) should be an overestimationif taking only into account the northern halfeastern cross-section of the Strait as the place inwhich the nutrients upwelled are converted intobiomass.
The across strait slope of the interface makes thebiomass to lie closer to the interface, and hence tothe zero-velocity layer, in the north than in thesouth at the eastern Mediterranean stations. Thisfacilitates the biomass accumulation and preventsthe cells from being advected quickly into theAlboran Sea: repositioning in the water columndue to changes in buoyancy is usually found inmicrophytoplankton cells (Smayda, 1970). Theadvantages of this ability becomes noteworthy inthis particular situation, since a population in thevicinity of the interface experiences a diminishedeastward speed and, simultaneously, a morecontinuous nutrient supply.
Recently, we have proposed the countercurrentsystem of the Strait as a conveyor-belt scheme towhich some diatoms species could couple their lifecycles (G !omez et al., 2000a). This scheme would
allow the diatoms in the surface waters of theeastern side of the Strait to aggregate and to sinkbelow the interface, with resting or less activepropagules moving westwards and a part of thepopulation returning to the surface waters bymeans of the mixing of deep Mediterranean waterat the sill. This mechanism could contribute tomaintain both high biomass values in the Medi-terranean side of the Strait and taxonomicsimilarities among these stations. Nevertheless,this hypothesis needs further validation throughfield analysis.
3.5. Temporal variation of mixing phenomena
Mixing phenomena in the Strait occur at adiversity of time-scales. The fortnightly cycle isresponsible for two types of phenomena thatinfluence the mixing. On one hand, spring tidesare the times of the highest probability offormation of large internal hydraulic jumps westof Camarinal Sill (Armi and Farmer, 1988).Mixing in the jump and in the internal travellingbore after the jump’s release, would produce athicker interfacial or mixing layer. In addition, thevertical shear of horizontal velocities is increasedsince tidal velocities are higher. Garc!ıa Lafuenteet al. (2000) show a clear fortnightly signal in thethickness of the interfacial layer at the easternsection, with maximum thickness one day afternew or full moon, according to the aforemen-tioned comments. Out of spring tides the hydraulicjump can be replaced by the topographicallyarrested wave, which is another important me-chanism for mixing and pumping nutrients intothe euphotic zone.
Although more observations are needed toelucidate the ranking of importance of these twomixing mechanisms, it seems that the internalhydraulic jump is more efficient. The jump is themechanism by which the kinetic energy of the flowtransforms into turbulent (and potential) energy toadjust the energetic supercritical flow upstream ofthe jump to subcritical flow downstream. Thearrested wave does not undergo such adjustment,so that turbulence would be less. Therefore, mixingwould be enhanced in spring tides and theproposed mechanism of coupling would find better
F. Echevarr!ıa et al. / Deep-Sea Research II 49 (2002) 4115–4130 4127

conditions during spring tides than during neaptides. On the contrary, in very weak neap tides,neither internal bore nor arrested waves willprobably happen and mixing events will beinterrupted. The previous argument allows us toput forward the existence of conditions for afortnightly cycle in biomass.
Seasonal signals are more difficult to assess.Garc!ıa Lafuente et al. (2002) shows the existenceof an annual cycle of the inflow that peaks in latesummer. Its amplitude is 10% of the mean inflow,and it is related to the annual cycle of the densitydifferences between inflowing and outflowingwaters (this cycle follows the seasonal warmingof the Atlantic Water, since Mediterranean Out-flowing Water is not exposed to the solar heating).The interface has an annual cycle that places itdeeper in summer and shallower in late winter(February–March). The cycle in the position of theinterface, which obviously has an associated cyclein the inflowing cross-area, only explains 30% ofthe total annual signal in the inflow. The remain-ing percentage is accounted for by velocityvariations linked to the annual cycle of the densitydifferences. This implies that horizontal velocitiesare stronger in late summer, which could favoursome of the phenomena discussed here (greatershear, more mixing). On the other hand, thesimultaneous sinking of the interface and thedevelopment of a seasonal thermocline will hinderthe pumping of nutrients and other particles to theeuphotic zone. These counteracting influenceswould probably obscure the biological cycle itself,and any reliable description of the seasonal cycle,if any, needs the availability of more in situ data.
3.6. The Gibraltar upwelling: concluding remarks
Mixing processes at the Sill region periodicallyfertilise the upper layer that enters into theMediterranean Sea. The evidences of mixing atCamarinal allows us to present the Strait as apulsating upwelling area because the mechanismsregulating the mixing events (formation of arrestedwaves and hydraulic jumps) are tidally induced.Therefore, the time when they take place is highlypredictable, which is very important for evolution
and ecology of organisms, as they may adapt andexploit this kind of periodicity.
Diatoms species with the ‘‘ability’’ of enhancedsinking rates when nutrients are limiting or long-term survival in dark environments, should beparticularly suitable for these special environ-ments. The coupling mechanisms may be ineffi-cient, if a low percentage of diatoms is upwelled tosurface waters through the conveyor belt, butdiatoms are adapted to fluctuating environmentsand have different strategies to compensate highbiomass losses (Smetacek, 1985) such as highturnover rates or resistance mechanisms includingspore formation (Pitcher, 1990).
The coincidence of both the double-layercountercurrent scheme of circulation and thepulsating upwelling on the sill determines thephysical structure and dynamics of the Strait.These hydrological features are closely related tothe biology. In the near future the connection ofthe local processes taking place at the Strait to awider scheme involving the western side ofAlboran Sea should be studied.
Acknowledgements
This work was supported by the Commission ofthe European Communities Marine Science andTechnology (MAST III) Program under ContractMAST3-96-0060 (CANIGO Project). SpanishCICYT Projects MAR96-1837 and MAR96-1950-CO2-01 supported partially our participationin non-CANIGO cruises. We also thank to thecrew of the R/V Cornide de Saavedra, Thalassa
and El Investigador for their assistance. Twoanonymous referees greatly improved the manu-script. Dr. G. Parrilla made useful comments onan earlier version and is also acknowledged for hiswork as coordinator of CANIGO project.
References
Alpers, W., Brandt, P., Rubino, A., Backhaus, J.O., 1996.
Recent contributions of remote sensing to the study of
internal waves in the Straits of Gibraltar and Messina.
F. Echevarr!ıa et al. / Deep-Sea Research II 49 (2002) 4115–41304128

Bulletin of the Institute of Oceanography Monaco 17,
21–40.
Armi, L., Farmer, D.M., 1988. The flow of Mediterranean
water through the Strait of Gibraltar. Progress in Oceano-
graphy 21, 1–105.
Bray, N.A., Ochoa, J., Kinder, T.H., 1995. The role of the
interface in exchange through the Strait of Gibraltar.
Journal of Geophysical Research 100, 10775–10776.
Bruno, M., Alonso, J.J., C !ozar, A., Vidal, J., Echevarr!ıa, F.,
Ruiz, J., Ruiz-Ca *navate, A., G !omez, F., 2002. The boiling-
water phenomena at Camarinal Sill, the Strait of Gibraltar.
Deep-Sea Research II 49 (19), 4097–4113.
Bryden, H.L., Candela, J., Kinder, T.H., 1994. Exchange
through the Strait of Gibraltar. Progress in Oceanography
33, 201–248.
Candela, J., Winant, C.D., Bryden, H.L., 1989. Meteorologi-
cally forced subinertial flows through the Strait of Gibraltar.
Journal of Geophysical Research 94, 12667–12674.
Candela, J., Winant, C., Ruiz, A., 1990. Tides in the Strait of
Gibraltar. Journal of Geophysical Research 95, 7313–7335.
Dafner, E., Gonz!alez D!avila, M., Santana-Casiano, J.M.,
Sempere, R., 2001. Total organic and inorganic carbon
exchange through the Strait of Gibraltar in September 1997.
Deep-Sea Research I 48, 1217–1235.
Elbaz-Poulichet, F., Morley, N.H., Beckers, J.M., Nomerange,
P., 2001. Metal fluxes through the Strait of Gibraltar: the
influence of the Tinto and Odiel rivers (SW Spain). Marine
Chemistry 73, 193–213.
Establier, R., Margalef, R., 1964. Fitoplancton e hidrograf!ıa de
las costas de C!adiz (Barbate), de junio de 1961 a agosto de
1962. Investigaciones Pesqueras 25, 5–31.
Farmer, D., Armi, L., 1999. The generation and trapping of
solitary waves over topography. Science 283, 188–190.
Garc!ıa Lafuente, J., Vargas, J.M., Plaza, F., Sarhan, T.,
Candela, J., Basheck, B., 2000. Tide at the eastern section
of the Strait of Gibraltar. Journal of Geophysical Research
105 (C6), 14197–14213.
Garc!ıa Lafuente, J., Delgado, J., Vargas, J.M., Vargas, M.,
Plaza, F., Sarhan, T., 2002. Low frequency variability of the
exchanged flows through the Strait of Gibraltar during
CANIGO. Deep-Sea Research II 49 (19), 4051–4067.
Gomez, F., Echevarr!ıa, F., Garcia, C.M., Prieto, L., Ruiz, J.,
Reul, A., Jimenez-Gomez, F., Varela, M., 2000a. Micro-
plankton distribution in the Strait of Gibraltar: coupling
between organisms and hydrodynamic structures. J Plank-
ton Research 22 (4), 603–617.
G !omez, F., Gonz!alez, N., Echevarr!ıa, F., Garc!ıa, C.M.,
2000b. Distribution and fluxes of dissolved nutrients in the
Strait of Gibraltar and its relationships to microphyto-
plankton biomass. Estuarine, Coastal and Shelf Science 51,
439–449.
Gorsky, G., Picheral, M., Stemmann, L., 2000. Use of the
underwater video profiler for the study of aggregate
dynamics in the North Mediterranean. Estuarine Coastal
and Shelf Science 50 (1), 121–128.
Grasshoff, K., Erhardt, M., Kremling, K., 1983. Methods of
Seawater Analysis, 2nd Edition. Verlag Chemie, Weinheim.
Harris, G.P., 1986. Phytoplankton Ecology: Structure,
Function and Fluctuation. Chapman & Hall, New York,
384pp.
Jerlov, N.G., 1953. Particle distribution in the Ocean. Report of
the Swedish Deep-Sea Expedition 3, 73–97.
Lacombe, H., Richez, C., 1982. The regime of the
Strait of Gibraltar. In: Nihoul, J.C.J. (Ed.), Hydrody-
namics of Semi-enclosed Seas. Elsevier, Amsterdam,
pp. 13–73.
Mann, K.H., Lazier, J.R.N., 1991. Dynamics of the Marine
Ecosystems. Biological–Physical Interactions in the Oceans.
Blackwell, Boston.
Margalef, R., 1978. Life-forms of phytoplankton as survival
alternatives in an unestable environment. Oceanologica
Acta 1, 493–509.
Minas, H.J., Coste, B., Le Corre, P., Minas, M., Raimbault, P.,
1991. Biological and geochemical signatures associated with
the water circulation through the strait of Gibraltar and in
the western Albor!an Sea. Journal of Geophysical Research
96, 8755–8771.
Minas, H.J., Minas, M., 1993. Influence du D!etroit de Gibralter
sur la biog!eochime de la Mediterran!ee et du proche
Atlantique. Annales de L’Institute Oc!eanographique Paris
69, 203–214.
Packard, T.T., Minas, H.J., Coste, B., Mart!ınez, R., Bonin,
M.C., Gostan, J., Garfield, P., Christensen, J., Dortch, Q.,
Minas, M., Copin-Montegut, G., Copin-Montegut, C.,
1988. Formation of the Alboran oxygen minimum zone.
Deep-Sea Research 35 (7), 1111–1118.
Pettigrew, N.R., Hyde, R.A., 1990. The structure of the internal
bore in the Strait of Gibraltar and its influence on the
Atlantic inflow. In: Pratt, J.L. (Ed.), The Physical Oceano-
graphy of Sea Straits, NATO ASI Series. Kluwer Academic,
London, pp. 493–508.
Pitcher, G.C., 1990. Phytoplankton sea population of the Cape
Peninsula upwelling plume, with particular reference to
resting spores of Chaetoceros (Bacillariophyceae) and their
role in seeding upwelling waters. Estuarine Coastal and
Shelf Science 31, 283–301.
Reul, A., Vargas, J.M., Jim!enez-G !omez, F., Echevarr!ıa, F.,
Garc!ıa-Lafuente, J., Rodr!ıguez, J., 2002. Exchange of
planktonic biomass through the Strait of Gibraltar in lake
summer. Deep-Sea Research II 49 (19), 4131–4144.
Rodr!ıguez, J., Blanco, J.M., Jim!enez-G!omez, F., Echevarr!ıa,
F., Gil, J., Rodr!ıguez, V., Ruiz, J., Bautista, B., Guerrero,
F., 1998. Patterns in the size structure of the phytoplankton
community in the deep fluorescence maximum of the
Alboran Sea (southwestern Mediterranean). Deep-Sea
Research I 45, 1577–1593.
Rodr!ıguez, J., Tintor!e, J., Allen, J.T., Blanco, J.M., Gom!ıs, D.,
Reul, A., Ruiz, J., Rodr!ıguez, V., Echevarr!ıa, F., Jim!enez-
G !omez, F., 2001. Mesoscale vertical motion and the size
structure of phytoplankton in the ocean. Nature 410,
360–363.
Smayda, T.J., 1970. The suspension and sinking of phyto-
plankton in the sea. Oceanography and Marine Biology
Annual review 8, 353–414.
F. Echevarr!ıa et al. / Deep-Sea Research II 49 (2002) 4115–4130 4129

Smetacek, V.S., 1985. Role of sinking in diatoms life-history
cycles: ecological, evolutionary and geological significance.
Marine Biology 84, 239–251.
Stemmann, L., Picheral, M., Gorsky, G., 2000. Diel variation in
the vertical distribution of particulate matter (>0.15mm) in
the NW Mediterranean Sea investigated with the Under-
water Video Profiler. Deep-Sea Research I 47, 505–531.
Sverdrup, H.U., 1953. On conditions for the vernal blooming of
phytoplankton. Journal du Conseil Permanent Interna-
tional pour l’Exploration de la Mer 18, 287–295.
Takahashi, M., Ishizaka, J., Ishimaru, T., Atkinson, L.P., Lee,
T.N., Yamaguchi, Y., Fujita, Y., Ishimura, S., 1986.
Temporal change in nutrient concentrations and phyto-
plankton biomass in short time scale local upwelling around
the Izu Peninsula, Japan. Journal of Plankton Research 8,
1039–1049.
UNESCO, 1994. Protocols for the joint global ocean flux study
(JGOFS) core measurements. Manuals and Guides 29,
pp. 1–170.
Wesson, J.C., Gregg, M.C., 1994. Mixing at Camarinal Sill in
the Strait of Gibraltar. Journal of Geophysical Research 99,
9847–9878.
F. Echevarr!ıa et al. / Deep-Sea Research II 49 (2002) 4115–41304130