
Lazard Credit Opportunities- Annual Report Liechtenstein
108
French open-end investment fund (SICAV) LAZARD FUNDS ANNUAL REPORT At September 30th, 2021 Management company: Lazard Frères Gestion SAS Custodian: Caceis Bank Statutory auditor: Deloitte & Associés Lazard Frères Gestion SAS - 25 rue de Courcelles - 75008 - Paris - France
-
Upload
khangminh22 -
Category
Documents
-
view
5 -
download
0
Transcript of Lazard Credit Opportunities- Annual Report Liechtenstein

French open-end investment fund
(SICAV)
LAZARD FUNDS
ANNUAL REPORT
At September 30th, 2021
Management company: Lazard Frères Gestion SAS
Custodian: Caceis Bank
Statutory auditor: Deloitte & Associés
Lazard Frères Gestion SAS - 25 rue de Courcelles - 75008 - Paris - France

2
CONTENTS
1. Certification by the statutory auditor 3
2. Consolidated financial statements 10
Sub-fund: LAZARD CREDIT OPPORTUNITIES 15
3. Characteristics of the UCI 16
4. Changes affecting the UCI 22
5. Management report 25
6. Regulatory information 28
7. Annual financial statements 34
Sub-fund: LAZARD EURO SHORT DURATION HIGH YIELD SRI 64
8. Characteristics of the UCI 65
9. Changes affecting the UCI 71
10. Management report 74
11. Regulatory information 77
12. Annual financial statements 82

3
1. CERTIFICATION BY THE STATUTORY AUDITOR

Deloitte & Associés
6, place de la Pyramide
92908 Paris-La Défense Cedex
France
Telephone: + 33 (0) 1 40 88 28 00
www.deloitte.fr
Postal address:
TSA 20303
92030 Paris La Défense Cedex France
LAZARD FUNDS French open-end investment company with sub-funds (Société d'Investissement à Capital Variable à Compartiments)
25, Rue de Courcelles 75008 Paris, France
Statutory Auditor's report on the annual financial statements
Financial year ended September 30th, 2021
To the Shareholders’ Meeting,
Opinion
In accordance with the terms of our appointment by your board of directors, we conducted our audit of the accompanying annual financial statements of the Undertaking for Collective Investment LAZARD FUNDS, incorporated as a French open-end investment company (SICAV), for the financial year ended September 30th, 2021.
We certify that the annual financial statements provide a true and fair view of the results of operations for the financial year under review and of the financial position and assets and liabilities of the Fund at the end of said financial year, in accordance with the accounting rules and principles generally accepted in France.
Basis of our opinion
Audit standards
We conducted our audit in accordance with the professional standards applicable in France. We
believe that our audit has provided us with sufficient relevant information on which to base our
opinion.
Our responsibilities under these standards are set out in the section entitled “Statutory auditor's
responsibilities concerning the audit of the financial statements” in this report.
French simplified joint stock company (Société par Actions Simplifiée) with capital of €2 188 160 Accounting firm registered with the Order of Chartered Accountants of the Paris Ile-de-France region Member firm of the regional institute of statutory auditors of Versailles (Compagnie régionale de Versailles) Nanterre Trade and Companies Register 572 028 041 VAT: FR 02 572 028 041 A member entity of the Deloitte network


2 l LAZARD FUNDS l Statutory Auditor's report on the annual financial statements for the year ended September 30th, 2021
Independence We conducted our audit in accordance with the rules of independence set out in the French Commercial Code and the code of ethics for statutory auditors, for the period from October 1st, 2020 to the date of issue of our report.
Basis of our opinions
The global crisis linked to the COVID-19 pandemic creates special conditions for the preparation and audit of the financial statements for this financial year. Indeed, this crisis and the exceptional measures taken in the context of a health emergency have multiple consequences for funds, their investments and the valuation of the corresponding assets and liabilities. Some of these measures, such as travel restrictions and remote working, have also had an impact on the operational management of funds and on audit implementation methods.
In this complex and changing context, in accordance with the provisions of Articles L. 823-9 and R. 823-7 of the French Commercial Code relating to the justification of our assessments, we inform you that the most important assessments we carried out, in our professional judgement, focused on the appropriateness of the accounting principles applied, notably with regard to the financial instruments in the portfolio, and the overall presentation of the financial statements in accordance with the chart of accounts for open-end collective investment undertakings.
The assessments we have made are part of our audit of the annual financial statements as a whole and the opinion expressed above. We express no opinion on the elements of the annual financial statements taken in isolation.
Specific verifications
We have also performed, in accordance with applicable professional standards in
France, the specific verifications required by the laws and regulations.
Information provided in the management report, other financial reports and the
annual financial statements addressed to the shareholders
We have no matters to report regarding the true and fair presentation of the information provided in the Board of Directors’ management report and in the documents sent to shareholders on the company’s financial position and the annual financial statements, or its consistency with the annual financial statements.
Information on corporate governance
We certify that the information required under Article L.225-37-4 of the French Commercial Code is provided in the section of the board of directors' management report on corporate governance.
Responsibilities of the management and persons charged with governance of the annual financial statements
It is the management’s role to draw up annual financial statements that give a fair and true
picture in accordance with French accounting rules and principles and to implement the
necessary internal control to be able to provide reasonable assurance that they are free from
material misstatement, whether due to fraud or error.
3 l LAZARD FUNDS l Statutory Auditor's report on the annual financial statements for the year ended September 30th, 2021
As part of the preparation of the annual financial statements, the management is responsible for assessing the SICAV’s capacity to continue operating as a going concern, to present in its financial statements, where necessary, information concerning business continuity, and to apply the accounting conventions of a going concern, unless it is planned to liquidate the SICAV or terminate its activity.
The Board of Directors is responsible for the preparation of the annual financial statements.
Statutory auditor’s responsibilities concerning the audit of the annual financial
statements Our role is to prepare a report on the annual financial statements and to obtain reasonable assurance that the annual financial statements as a whole are free of material misstatements. Reasonable assurance means a high but not absolute level of assurance that an audit performed in accordance with professional standards is free of material misstatement. Anomalies may stem from fraud or errors and are considered material when it can reasonably be expected that, taken individually or together, they could influence the economic decisions of users of the financial statements.
As stipulated in Article L. 823-10-1 of the French Commercial Code (Code de commerce), our audit assignment does not consist in guaranteeing the viability or quality of the management of the SICAV.
In the context of an audit performed in accordance with professional standards applicable in
France, the statutory auditor must exercise its judgement throughout the course of the audit.
Moreover:
• It identifies and assess the risks that the annual financial statements may contain material misstatements, whether from fraud or error, defines and implements audit procedures to resolve these risks, and collects all elements deemed necessary and appropriate in order to give its opinion. The risk of failure to detect a material misstatement resulting from fraud is higher than that resulting from an error because fraud may involve collusion, falsification, deliberate omissions, false statements or by-passing of internal controls;
• it takes due note of the internal control relevant to the audit in order to define audit
procedures that are appropriate to the circumstances, and not with a view to expressing
an opinion on the efficiency of the internal control;
• it assesses the appropriateness of the accounting methods used and the reasonable nature of the accounting estimates made by the management, and the related information provided in the annual financial statements;
• it assesses the appropriateness of the management company's application of the accounting policy for a going concern and, based on the information collected, whether there is a significant uncertainty linked to events or circumstances that is likely to call into question the Fund's capacity to continue operating as a going concern. This assessment is based on the information collected up to the date of the report, bearing in mind nevertheless that subsequent circumstances or events could jeopardise the continuity of operation. If the statutory auditor observes the existence of a material uncertainty, it shall draw the attention of the readers of its report to the information provided in the annual financial statements on the subject of this uncertainty, or if this information has not been provided or is not relevant, it shall attach reservations to its certification or shall refuse to certify the accounts;
4 l LAZARD FUNDS l Statutory Auditor's report on the annual financial statements for the year ended September 30th, 2021
• it assesses the overall presentation of the annual financial statements and whether they provide a true picture of the underlying operations and events.
In Paris La Défense, January 3rd, 2022
The Statutory Auditor
Deloitte & Associés
[signature]
Olivier GALIENNE

Deloitte & Associés
6, place de la Pyramide
92908 Paris-La Défense Cedex
France
Telephone: + 33 (0) 1 40 88 28 00
www.deloitte.fr
Postal address:
TSA 20303
92030 Paris La Défense Cedex France
LAZARD FUNDS French open-end investment company with sub-funds (Société d'Investissement à Capital Variable à Compartiments)
34, rue de la Fédération
75737 Paris Cedex 15
Statutory Auditor's special report on related-party agreements
General Meeting to approve the financial statements for the financial year ended September
30th, 2021
To the Shareholders’ Meeting,
In our capacity as statutory auditors of your company, we hereby present to you our
report on related party agreements.
We are required to report to you, based on the information we have been provided, on the characteristics, the main terms and the details of the benefits for the company, of any agreements disclosed to us or that we may have discovered during our audit, without being required to comment on their relevance or substance, or to identify any other agreements. It is your responsibility, pursuant to the terms of Article R. 225-31 of the French Commercial Code (Code de commerce), to assess the benefits of entering into these agreements, prior to approving them.
We are also required, where applicable, to report to you as provided for in Article R. 225-31 of the French Commercial Code on the performance over the past year of any agreements already approved by the shareholders' meeting.
We have performed those checks that we considered necessary in accordance with the professional guidance issued by the national auditing body (Compagnie nationale des commissaires aux comptes) relating to this operation.
AGREEMENTS SUBMITTED FOR THE APPROVAL OF THE SHAREHOLDERS’ MEETING
We hereby inform you that we have not been advised of any agreement authorised during the past financial year to be submitted for the approval of the shareholders' meeting pursuant to Article L. 225-38 of the French Commercial Code.
French simplified joint stock company (Société par Actions Simplifiée) with capital of €1 723 040. Accounting firm registered with the Order of Chartered Accountants of the Paris Ile-de-France region Member firm of the regional institute of statutory auditors of Versailles (Compagnie régionale de Versailles) Nanterre Trade and Companies Register 572 028 041 VAT: FR 02 572 028 041 A member entity of the Deloitte network

3 | LAZARD FUNDS | Statutory Auditor's special report on regulated agreements | Financial year ended September 30th, 2021
AGREEMENTS ALREADY APPROVED BY THE SHAREHOLDERS’ MEETING
We hereby inform you that we have not been advised of any agreement already approved by the shareholders’ meeting that remained effective during the past financial year.
In Paris La Défense, January 3rd, 2022
The statutory auditor
Deloitte & Associés
Olivier GALÏENNE
10
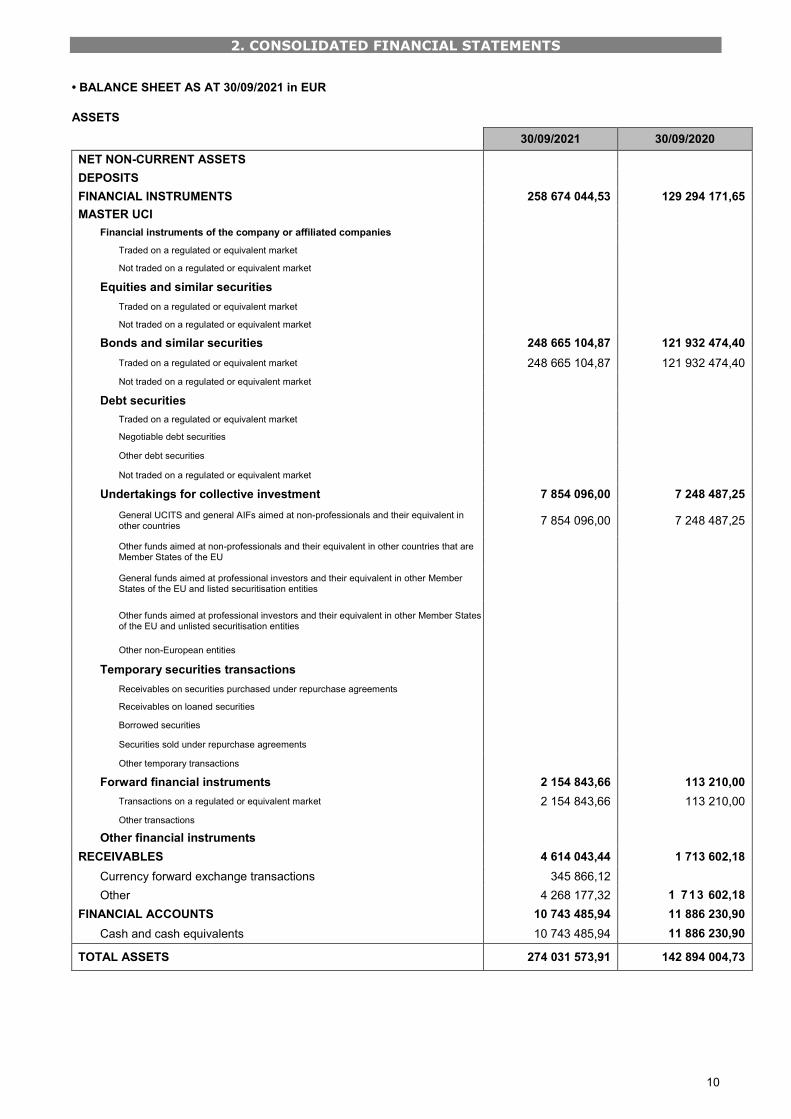
2. CONSOLIDATED FINANCIAL STATEMENTS
• BALANCE SHEET AS AT 30/09/2021 in EUR
ASSETS
30/09/2021 30/09/2020
NET NON-CURRENT ASSETS
DEPOSITS
FINANCIAL INSTRUMENTS 258 674 044,53 129 294 171,65
MASTER UCI
Financial instruments of the company or affiliated companies
Traded on a regulated or equivalent market
Not traded on a regulated or equivalent market
Equities and similar securities
Traded on a regulated or equivalent market
Not traded on a regulated or equivalent market
Bonds and similar securities 248 665 104,87 121 932 474,40
Traded on a regulated or equivalent market 248 665 104,87 121 932 474,40
Not traded on a regulated or equivalent market
Debt securities
Traded on a regulated or equivalent market
Negotiable debt securities
Other debt securities
Not traded on a regulated or equivalent market
Undertakings for collective investment 7 854 096,00 7 248 487,25
General UCITS and general AIFs aimed at non-professionals and their equivalent in other countries 7 854 096,00 7 248 487,25
Other funds aimed at non-professionals and their equivalent in other countries that are Member States of the EU
General funds aimed at professional investors and their equivalent in other Member States of the EU and listed securitisation entities
Other funds aimed at professional investors and their equivalent in other Member States of the EU and unlisted securitisation entities
Other non-European entities
Temporary securities transactions
Receivables on securities purchased under repurchase agreements
Receivables on loaned securities
Borrowed securities
Securities sold under repurchase agreements
Other temporary transactions
Forward financial instruments 2 154 843,66 113 210,00
Transactions on a regulated or equivalent market 2 154 843,66 113 210,00
Other transactions
Other financial instruments
RECEIVABLES 4 614 043,44 1 713 602,18
Currency forward exchange transactions 345 866,12
Other 4 268 177,32 1 713 602,18
FINANCIAL ACCOUNTS 10 743 485,94 11 886 230,90
Cash and cash equivalents 10 743 485,94 11 886 230,90
TOTAL ASSETS 274 031 573,91 142 894 004,73

11
LIABILITIES AND SHAREHOLDERS’ EQUITY
30/09/2021 30/09/2020
SHAREHOLDERS’ EQUITY
Share capital 262 247 523,45 121 757 895,87
Undistributed net capital gains and losses recognised in previous years
Retained earnings 128,73 205,37
Net capital gains and losses for the year 2 079 642,93 8 824 966,48
Net income for the year 6 496 755,14 3 118 005,12
TOTAL SHAREHOLDERS' EQUITY * Sum representing the net assets
270 824 050,25 133 701 072,84
FINANCIAL INSTRUMENTS 2 154 843,41 113 210,00
Sales of financial instruments
Temporary securities transactions
Liabilities on securities sold under repurchase agreements
Liabilities on borrowed securities
Other temporary transactions
Forward financial instruments 2 154 843,41 113 210,00
Transactions on a regulated or equivalent market 2 154 843,41 113 210,00
Other transactions
LIABILITIES 1 052 679,68 9 079 721,89
Currency forward exchange transactions 343 816,85
Other 708 862,83 9 079 721,89
FINANCIAL ACCOUNTS 0,57
Bank overdrafts 0,57
Borrowings
TOTAL LIABILITIES AND SHAREHOLDERS’ EQUITY 274 031 573,91 142 894 004,73

12
OFF-BALANCE SHEET ITEMS AS AT 30/09/2021 in EUR
30/09/2021 30/09/2020
HEDGING TRANSACTIONS
Commitments on regulated or similar markets
Futures contracts
EURO SCHATZ 1221 5 610 250,00
EURO BOBL 1221 8 095 800,00
US 10YR NOTE 1221 12 491 506,32
Commitments on OTC markets
Other commitments
OTHER TRANSACTIONS
Commitments on regulated or similar markets
Futures contracts
XEUR FGBL BUN 1220 104 712 000,00
FGBL BUND 10A 1221 42 455 000,00
TU CBOT UST 2 1221 132 911 930,28
XEUR FGBX BUX 1221 24 400 800,00
CBOT USUL 30A 1221 24 728 741,53
Commitments on OTC markets
Other commitments

13
INCOME STATEMENT AS AT 30/09/2021 in EUR
30/09/2021 30/09/2020
Income from financial transactions
Income from deposits and financial accounts 342,83 0,19
Income from equities and similar securities 1 606,50
Income from bonds and similar securities 7 262 322,80 4 239 653,40
Income from debt securities
Income from temporary purchases and sales of securities 5 133,39 169,76
Income from forward financial instruments
Other financial income
TOTAL (1) 7 269 405,52 4 239 823,35
Expenses related to financial transactions
Expenses related to temporary purchases and sales of securities 12 563,66 2 845,51
Expenses related to forward financial instruments
Expenses related to financial liabilities 19 546,39 9 742,03
Other financial charges
TOTAL (2) 32 110,05 12 587,54
INCOME FROM FINANCIAL TRANSACTIONS (1 - 2) 7 237 295,47 4 227 235,81
Other income (3)
Management fees and depreciation and amortisation (4) 2 157 046,10 1 329 475,61
Net income for the financial year (L. 214-17-1) (1 - 2 + 3 - 4) 5 080 249,37 2 897 760,20
Income adjustment for the financial year (5) 1 416 505,77 220 244,92
Interim dividends paid on net income for the financial year (6)
Net income (1 - 2 + 3 - 4 + 5 - 6) 6 496 755,14 3 118 005,12
14
NOTES TO THE FINANCIAL STATEMENTS
ACCOUNTING RULES AND PRINCIPLES
The annual financial statements are presented in accordance with Regulation 2014-01, as amended, of the French
accounting standards body (Autorité des Normes Comptables - ANC).
The general accounting principles apply:
- true and fair view, comparability, business continuity,
- regularity, sincerity,
- prudence, - permanence of the accounting methods used each year.
Income from fixed-income securities is recorded on the basis of accrued interest. Purchases and sales of securities are recorded excluding expenses. The accounting currency of the portfolio is the euro. Information on the impact of the COVID-19 crisis These financial statements were prepared by the management company on the basis of available information in the context of the evolving COVID-19 crisis. The LAZARD FUNDS SICAV is made up of two sub-funds:
- LAZARD CREDIT OPPORTUNITIES
- LAZARD EURO SHORT DURATION HIGH YIELD SRI The aggregation of the annual financial statements is presented in euros. In the absence of inter-sub-fund holdings, no restatement has been made for assets and liabilities.
- Accounting rules and principles (*)
- Additional information (*)
(*) Please refer to the information on each sub-fund.

LAZARD CREDIT OPPORTUNITIES
Sub-fund
16
3. CHARACTERISTICS OF THE UCI
LEGAL FORM
French open-end investment company (Société d'Investissement à Capital Variable - SICAV)
CLASSIFICATION
International bonds and other debt securities.
ALLOCATION OF DISTRIBUTABLE INCOME
Distributable income consists of:
1) net income plus retained earnings, plus or minus the balance of the revenue adjustment account. Net income for the financial year is equal to the amount of interest, arrears, dividends, bonuses and prizes, directors’ fees and all income generated by the securities that make up the UCI’s portfolio, plus income generated by temporary cash holdings and minus management fees and borrowing costs.
2) Realised capital gains, net of charges, minus realised capital losses, net of charges, recognised for the financial year, plus any net capital gains of the same kind recognised over previous years that have not been distributed or accumulated, plus or minus the balance of the capital gains adjustment account. The amounts referred to in 1) and 2) may be accumulated and/or distributed and/or retained independently of each other, in whole or in part. RC EUR, PC EUR, PVC EUR, TC EUR shares: Distributable income shall be fully accumulated, with the exception of those amounts subject to compulsory distribution by law. PD EUR shares: Net income is distributed in full and the allocation of net realised capital gains is decided each year at the shareholders’ meeting. It may pay interim dividends.
INVESTMENT OBJECTIVE
RC EUR shares The investment objective is to outperform, over the recommended investment period of three years and net of charges, the following benchmark index: Capitalised €STR + 1,25% The benchmark index is expressed in euros. PC EUR, PD EUR shares: The investment objective is to outperform, over the recommended investment period of three years and net of charges, the following benchmark index: Capitalised €STR + 1,75% The benchmark index is expressed in euros. PVC EUR shares: The investment objective is to outperform, over the recommended investment period of three years and net of charges, the following benchmark index: Capitalised €STR + 2,40% The benchmark index is expressed in euros. TC EUR shares: The investment objective is to outperform, over the recommended investment period of three years and net of charges, the following benchmark index: Capitalised €STR + 1,50% The benchmark index is expressed in euros.
BENCHMARK
RC EUR shares Capitalised €STR + 1,25% The capitalised €STR is the main benchmark index of the Eurozone money market. This rate is calculated based on the volume-weighted average of the overnight interbank rates at which the 57 reference banks carry out their transactions. It is established by the European Central Bank on the basis of the “exact number of days/360” and is published by the European Banking Federation. Additional information is available on the website www.banque-france.fr TC EUR shares Capitalised €STR + 1,50%
The capitalised €STR is the main benchmark index of the Eurozone money market. This rate is calculated based on the volume-weighted average of the overnight interbank rates at which the 57 reference banks carry out their transactions. It is established by the European Central Bank on the basis of the “exact number of days/360” and is published by the European Banking Federation. Additional information is available on the website www.banque-france.fr PVC EUR shares: Capitalised €STR + 2,40% The capitalised €STR is the main benchmark index of the Eurozone money market. This rate is calculated based on the volume-weighted average of the overnight interbank rates at which the 57 reference banks carry out their transactions. It is established by the European Central Bank on the basis of the “exact number of days/360” and is published by the European Banking Federation. Additional information is available on the website www.banque-france.fr
17
PC EUR, PD EUR shares: Capitalised €STR + 1,75% The capitalised €STR is the main benchmark index of the Eurozone money market. This rate is calculated based on the volume-weighted average of the overnight interbank rates at which the 57 reference banks carry out their transactions. It is established by the European Central Bank on the basis of the “exact number of days/360” and is published by the European Banking Federation. Additional information is available on the website www.banque-france.fr
INVESTMENT STRATEGY
1. Strategies used
The Sub-fund aims to outperform the capitalised €STR + 1,25% annually for the RC EUR shares, the capitalised €STR + 1,50% annually for the TC EUR shares, the capitalised €STR + 1,75% annually for the PC EUR and PD EUR shares, and the capitalised €STR + 2,40% annually for the PVC EUR shares, net of expenses, through dynamic management of interest rate risk, credit risk and currency risk and by investing primarily in risky debt issued by governments, companies, financial institutions and financial structures that offer a yield premium in relation to sovereign debt. Outperformance in relation to the index is achieved in two ways: additional yield offered by risky debt, in particular corporate and government debt potentially linked to emerging markets, and dynamic portfolio rotation when there is a decline in this yield premium. The portfolio manager may invest in any type of issuer, without restrictions in terms of credit quality or geographical location. The portfolio manager conducts his own credit assessment for selection purposes, both at the time of purchase and during the life of the securities. He does not rely solely on ratings issued by rating agencies and develops credit risk analysis and the necessary procedures to make purchase decisions or buy or hold decisions in the event of a downgrade. The portfolio manager does not automatically use agency ratings but gives precedence to his own analysis to assess the credit quality of said assets and decide on possible downgrades.
2. Assets excluding derivatives
The Sub-fund's portfolio comprises: Equities
- A maximum of 5% of the net assets in preference shares insofar as they may be considered deeply subordinated instruments with the following characteristics: rated investment grade by a ratings agency or an equivalent rating by the management company; a fixed dividend comparable to accrued interest; perpetual debt likely to be called in by the issuer under specified conditions; sensitive to interest rates.
- A maximum of 5% of the net assets in ordinary shares. The Sub-fund will not invest actively in equities but may hold equities if they derive from a debt restructuring, typically following an exchange of shares for debt. The fund manager will do his best to sell the shares received as soon as possible depending on market conditions with a view to optimising the exit price for the shareholders. Debt securities and money market instruments:
- A maximum of 100% of the net assets in euro or any other currency denominated bonds and negotiable debt securities issued by companies and financial institutions, without any credit restrictions.
- A maximum of 60% of the net assets in bonds and negotiable debt securities denominated in currencies other than the euro and the US dollar.
- A maximum of 100% of the net assets in debt denominated in euros and/or any currency issued by governments in any geographical location, by any institution and of any rating.
- A maximum of 10% of the net assets in convertible bonds.
- Perpetual subordinated bonds up to a maximum of 50% of the net assets, of which a maximum of 30% of the net assets in contingent convertible bonds (CoCos).
- Specific euro-denominated instruments:
• Securities issued as part of a EMTN programme whose issuer is not the same as the issuer of the underlying security, insofar as the performance of these securities is index-linked to changes in interest rate or credit spread risk. Up to a maximum of 20% of the net assets. UCIs
French or foreign UCITS or AIFs that meet the four criteria of Article R. 214-13 of the French Monetary and Financial Code (Code Monétaire et Financier), money market, short-term money market and bond funds up to a maximum of 10% of the net assets.
3. Derivatives
Types of markets:
regulated
organised
OTC
The manager intends to seek exposure to:

18
equities
interest rates
currency
credit
other: volatility
Transaction types – all transactions must be limited to achieving the investment objective:
hedging
exposure
arbitrage
other
Types of instruments used:
futures:
equity and equity indices
interest rate: interest rate risk
currency
other
options:
equity and equity indices
interest rates: interest rate and interest rate volatility risk
currency
other
swaps:
equity swaps
interest rate swaps: transformation of fixed-rate income to variable-rate income and vice versa
currency swaps
performance swaps
currency forwards
credit derivatives
other
Derivatives strategy to achieve the investment objective:
partial or general hedging of the portfolio, some risks and securities
creation of synthetic exposure to assets and risks
increasing exposure to the market without leverage
maximum permitted and sought
other
4. Securities with embedded derivatives
The fund manager may invest in any securities with embedded derivatives permitted under the management company’s business plan, whose issuer is not the same as the issuer of the underlying security, insofar as the performance of these securities is index-linked to changes in interest rate or credit spread risk. Within this framework, the manager may take positions with a view to hedging the portfolio against and/or exposing it to particular business sectors, geographic regions, shares (all capitalisation types), stocks and similar securities in order to achieve the investment objective. Total investments in securities with embedded derivatives may not exceed 100% of the net assets. Contingent convertible bonds are limited to a maximum of 30% of the net assets.
5. Deposits
Up to 10% of the Sub-fund’s assets may be held in deposits.
6. Cash borrowings
The Sub-fund may borrow cash within the limit of 10% of its net assets to meet specific cash requirements related to its operating needs.
7. Temporary purchases and sales of securities
None.
8. Information on financial guarantees
In connection with over-the-counter derivative transactions, and in accordance with Position paper 2013-06 issued by the French financial markets regulator (Autorité des Marchés Financiers – AMF), the Sub-fund may receive collateral in the

19
form of securities (such as bonds or other securities issued or guaranteed by a State or issued by international financing agencies and bonds or securities issued by high quality corporate issuers), or cash. Any cash collateral received is reinvested in accordance with the applicable rules. All such assets must be from high-quality issuers that are not an entity of the counterparty or its group, and must be liquid and diversified with low volatility. Discounts may be applied to the collateral received; they take into account the quality of credit and the price volatility of the securities.
RISK PROFILE
Your money will be mainly invested in financial instruments selected by the management company. These instruments will be exposed to market trends and fluctuations.
Risk of capital loss
The Sub-fund provides no capital guarantee or protection. As such, the investor may not get back the full amount of the initial investment during redemption.
Interest rate risk
The risk of a decline in debt instruments as a result of changes in interest rates. This risk is measured by the level of sensitivity. For instance, bond prices tend to move in the opposite direction to interest rates. The net asset value may decline during periods when there is an increase (positive sensitivity) or decrease (negative sensitivity) in interest rates.
Credit risk
The risk of a deterioration in the credit quality of or default by a public or private issuer. The Sub-fund's exposure to issuers either through direct investment or via other UCIs may give rise to a decline in the net asset value. If the Sub-fund is exposed to unrated or speculative/high yield debt, the credit risk is high and may lead to a decline in the Sub-fund’s net asset value.
Foreign exchange risk
The Sub-fund may invest in securities and other UCI that in turn are authorised to acquire instruments denominated in currencies other than the fund’s base currency. The value of these instruments may fall if the exchange rates vary, which may lead to a decrease in the Sub-fund’s net asset value. Where units (or shares) denominated in a currency other than the fund’s base currency have been hedged, the foreign exchange risk is residual as a result of systematic hedging, potentially leading to a performance gap between the different units (or shares).
Derivative financial instrument risk
The risk arising from the Sub-fund's use of forward financial instruments (derivatives), which may lead to a bigger decrease in the net asset value than on the markets or in the underlying assets in which the sub-fund has invested.
Counterparty risk:
This is a risk associated with the use of OTC forward financial instruments. These transactions, entered into with one or more counterparties, potentially expose the Sub-fund to a risk of failure of any such counterparty, which may lead to default in payment and cause the Sub-fund’s NAV to fall.
Liquidity risk
The risk that a financial market cannot absorb transaction volumes due to trading volumes being too low or pressure on the markets. Such a situation may impact the pricing or timing when the Sub-fund liquidates, initiates or modifies positions and thus cause a decline in the Sub-fund’s net asset value.
Risks linked to hybrid or subordinated securities:
The sub-fund may be exposed to hybrid or subordinated securities. Hybrid and subordinated debt are subject to specific risks of non-payment of coupons and capital loss in certain circumstances. For non-financial bonds, since hybrid debt securities are "deeply subordinated", there is a low recovery rate in the event of issuer default.
Risk related to overexposure
The Sub-fund may use forward financial instruments (derivatives) to generate overexposure and thus bring the Sub-fund’s exposure above its net asset value. Depending on the transactions, the impact of a decrease (purchase of exposure) or increase (sale of exposure) in the derivative’s underlying instrument may be amplified and thus amplify any decrease in the Sub-fund’s net asset value. Because of the hedging strategy applied, shareholders may not benefit from potential upside on certain markets.
Equity risk
Fluctuations in share prices may have a negative impact on the Sub-fund’s net asset value. The net asset value may decrease during periods in which equity markets are falling.
Sustainability risk
Any environmental, social or governance event or situation that, if it occurs, could have an actual or potential negative impact on the value of the investment. Specifically, the negative effects of sustainability risks can affect issuers via a range
20
of mechanisms, including: 1) lower revenues; 2) higher costs; 3) damage or impairment of asset value; 4) higher cost of capital; and 5) fines or regulatory risks. Due to the nature of sustainability risks and specific issues such as climate change, the likelihood of sustainability risks impacting returns on financial products is likely to increase in the longer term.
GUARANTEE OR PROTECTION
None.
ELIGIBLE SUBSCRIBERS AND TYPICAL INVESTOR PROFILE
This Sub-fund is aimed at all investors who are aware of the risks associated with investing in the international credit markets. The Fund may be used with life insurance and savings policies. Subscribers are strongly advised to diversify their investments sufficiently to avoid exposure solely to the risks of this Sub-fund.
Information on US investors:
The Sub-fund is not registered as an investment vehicle in the United States and its units are not and will not be registered under the Securities Act of 1933 and, therefore, they may not be offered or sold in the United States to Restricted Persons, as defined hereafter. A Restricted Person is (i) any person or entity located in the United States (including US residents), (ii) any corporation or any other entity subject to the laws of the United States or any state thereof, (iii) any US military personnel or any employee of a US government department or agency located outside the United States, or (iv) any other person that would be considered a US Person under Regulation S of the Securities Act of 1933, as amended. FATCA:
Pursuant to the provisions of the Foreign Account Tax Compliance Act (“FATCA”) applicable as of July 1st, 2014, if the Sub-fund invests directly or indirectly in US assets, the capital and income arising from such investments may be subject to withholding tax of 30%. To avoid paying the 30% withholding tax, France and the United States have entered into an intergovernmental agreement under which non-US financial institutions (“foreign financial institutions”) agree to institute procedures for identifying direct or indirect investors who qualify as US taxpayers and to provide certain information about these investors to the French tax authorities, which will disclose said information to the US tax authority, the Internal Revenue Service. As a foreign financial institution, the Sub-fund undertakes to comply with the FATCA and to take all appropriate measures pursuant to the aforementioned intergovernmental agreement. The amount that it is reasonable to invest in this Sub-fund depends on each investor’s personal circumstances. To determine this, investors should take account of their personal financial situation, current needs and the recommended investment period, and should also consider their ability to assume risk or whether they prefer instead to opt for a more cautious investment. This Sub-fund may not be suitable for investors planning to withdraw their contributions within three years.

21
4. CHANGES AFFECTING THE UCI
CHANGES WHICH TOOK PLACE DURING THE PERIOD OR ARE STILL TO TAKE PLACE The Extraordinary Shareholders' Meeting of the SICAV LAZARD FUNDS (a SICAV with sub-funds: LAZARD CREDIT
OPPORTUNITIES (ISIN code: FR0010230490), LAZARD EURO SHORT DURATION HIGH YIELD (ISIN code: FR0013506987), on January 29th, 2021, decided to transfer the SICAV's registered office to 10, avenue Percier, Paris (8th district).
Effective date: 30/01/2021 The Board of Directors of the LAZARD FUNDS SICAV (SICAV with sub-funds) on January 15th, 2021 (sub-funds:
LAZARD CREDIT OPPORTUNITIES (ISIN code: FR0010230490) and LAZARD EURO SHORT DURATION HIGH YIELD (ISIN code: FR0013506987)) decided:
- The creation of a new PVC H-CHF share in the LAZARD CREDIT OPPORTUNITIES Sub-fund (ISIN code:
FR0010230490).
Effective date: 21/04/2021
- The merger/absorption of LAZARD CREDIT OPPORTUNITIES I and LAZARD CREDIT OPPORTUNITIES II by the LAZARD CREDIT OPPORTUNITIES Sub-fund (ISIN code: FR0010230490).
Effective date: 30/06/2021

22
Corporate governance (CSR) section
I. List of appointments
Directors’ names Number of
offices held
List of offices and functions
Eleonore Bunel Managing Director of Lazard Frères Gestion SAS
1 - Chairman and Chief Executive Officer of
Lazard Funds (SICAV with sub-funds)
François-Marc Durand Chairman of Lazard Frères Gestion SAS
4
- Chairman and Chief Executive Officer of the Norden SRI SICAV
- Member of the Boards of Directors of the SICAVs: . Lazard Small Caps Euro SRI . Lazard Funds (SICAV with sub-funds) . Lazard Alpha Allocation
Jean-Jacques de Gournay Managing Director of Lazard Frères Gestion SAS
5
- Chairman and Chief Executive Officer of the Norden Family SICAV
- Member of the Boards of Directors of the SICAVs: . Lazard Funds (SICAV with sub-funds) . Lazard Small Caps Euro SRI . Lazard Equity SRI . Lazard Convertible Global
Monica Nescaut Managing Director of Lazard Frères Gestion SAS
5
- Member of the Boards of Directors of the SICAVs:
. Lazard Small Caps Euro SRI
. Lazard Funds (SICAV with sub-funds)
. Norden SRI
. Lazard Equity SRI
. Lazard Convertible Global
Paul Castello Managing Director of Lazard Frères Gestion SAS
5
- Member of the Boards of Directors of the SICAVs: . Lazard Sustainable Euro Short Duration . Lazard Equity SRI . Norden Small . Lazard Funds (SICAV with sub-funds)
- Chief Executive Officer and board member of the SICAV Lazard Convertible Global

23
II. Directors’ fees
Members of the Board of Directors Directors’ fees paid
by the SICAV
Eléonore Bunel 0
François-Marc Durand 0
Jean-Jacques de Gournay 0
Monica Nescaut 0
Lazard Frères Gestion SAS
represented by Alexia Latorre 0
MGEN Represented by Charles Bouffier
€1 600
Union Mutualiste Retraite (UMR)
Represented by Philippe Rey €1 600
Paul Castello 0
III. Agreements covered by Article L.225-37-4 para.2 of the French Commercial Code (Code de commerce)
The SICAV was not informed of the conclusion of any agreements covered by Article L.225-37-4 para.2 of the
French Commercial Code during the financial year ended September 30th, 2021.
IV. Table of currently valid delegations of powers granted by the shareholders’ meeting, as stipulated in Article L.225-
37-4 para.3 of the French Commercial Code
No delegation of authority pursuant to Article L225-37-4 paragraph 3 of the French Commercial Code was granted
or was ongoing during the financial year ended September 30th, 2021.
V. Method of operation of the general management
The Board of Directors decided to separate the functions of Chairman of the Board of Directors from that of Chief
Executive Officer.
24
5. MANAGEMENT REPORT
At the date of preparation of the management report and in the context of uncertainty linked to the Covid-19 health crisis,
the events listed below have not occurred:
• significant events occurring during the financial year such as changes in the methods of applying accounting methods
(implementation of model valuation, activation of gates, suspension of NAV).
• other elements such as information relating to possible situations of suspension of subscriptions/redemptions,
liquidation of funds or creation of a ring-fencing fund.
PERFORMANCE
The performance of the sub-fund's shares over the period was:
RC shares: FR0010230490: 9,91% TC shares: FR0010235499: 10,55% PC shares: FR0010235507: 10,61% PVC shares: FR0013432143: 9,19% PVC H-CHF shares: FR0014002X15: -0,04% (since inception) PD shares: FR0012156347: 10,61%.
Performances vary over time and past performance is no guarantee of the sub-fund's future results.
The benchmark's* performance over the period was as follows:
RC shares: 0,70%, (*€ster +1,25% since 04/11/2019, before Eonia +1,25%). TC shares: 0,95%, (*€ster +1,50% since 04/11/2019, before Eonia +1,50%). PC/PD shares: 1,22%, (*€ster +1,75% since 04/11/2019, before Eonia +1,75%). PVC shares: 1,88%, (*€ster +2,40%).
PVC H-CHF shares: -0,80%, (*€ster +2,40%). (since inception)
ECONOMIC ENVIRONMENT
Global economic growth has rebounded strongly since its low point in spring 2020. The deployment of effective vaccines has allowed economies to gradually reopen and demand has been boosted by exceptional support measures from public authorities and central banks. High frequency activity indicators remain consistent with buoyant demand, although they suggest that growth has peaked, while production is hampered by labour shortages and supply chain problems, with shortages in some key sectors such as semiconductors and shipping. Inflation accelerated sharply, reflecting in particular the rise in commodity prices, supply problems and the normalisation of certain prices that had fallen due to health restrictions measures. The acceleration of inflation is creating uncertainty about the timing of monetary policy normalisation, but central banks have until recently generally maintained a very accommodative stance, insisting on the transitory nature of inflationary pressures, a question that remains open as supply pressures continue, energy prices tighten and US wages accelerate. In the United States, GDP was up by +12,2% year-on-year in Q2 2021 and by +0,9% from its Q4 2019 level. 5.7 million jobs were created over the last twelve months, bringing total employment to 148 million, compared to 153 million before the crisis. The unemployment rate fell from 11,1% to 4,8%. Wages rose by +4,6% year-on-year in September. The number of unfilled job vacancies jumped to 10.4 million in August. Headline inflation rose from +1,4% to +5,3% year-on-year and core inflation from +1,7% to +4,0%.
The Fed maintained its main monetary policy parameters. The key rate stayed within the 0%-0,25% range and asset purchases continued at a pace of $120 billion a month. In June 2021, Jerome Powell indicated that the debate on reducing asset purchases had begun. In September 2021, Jerome Powell set the stage for a formal announcement in November. Democratic candidate Joe Biden won the November 2020 presidential election. Democrats retained their majority in the House of Representatives and took control of the Senate. The US Congress adopted two massive fiscal stimulus packages during the past year: a first package of $900 billion in December 2020 and a second package of $1 900 billion in March 2021. In September 2021, two stimulus packages were being

25
negotiated: a $1 200 billion infrastructure package and a $3 500 billion social spending package. In the Eurozone, GDP grew by +14,3% year-on-year in Q2 2021 and fell by 2,5% from its Q4 2019 level. It increased by +18,7% in France, +9,8% in Germany, +17,6% in Italy and +17,5% in Spain. The unemployment rate fell from 8,6% to 7,5%. Headline inflation rose from -0,3% to +3,4% year-on-year and core inflation from +0,2% to +1,9%. The ECB has left the deposit rate unchanged at -0,50%. The amount of the pandemic emergency purchase programme was increased by €500bn in December 2020, bringing the total envelope to €1 850bn. In March 2021, the ECB announced that it would significantly increase the pace at which it invests this envelope, before indicating in September 2021 that it would slow down slightly. In Germany, the September 2021 parliamentary elections resulted in a fragmented parliament, opening a period of negotiations to form a majority coalition. In July 2020, EU countries reached an agreement on a European recovery plan of €750 billion, equivalent to 5,4% of GDP. In China, GDP grew by +7,9% year-on-year in Q2 2021 and by +8,2% from Q4 2019. The urban unemployment rate fell from 5,4% to 5,1%. Headline inflation rose from +1,7% to +0,8% year-on-year and core inflation from +0,5% to +1,2%. The Chinese central bank maintained its key interest rate at 2,95%. The reserve requirement ratio for the main banks was lowered by 50 basis points in July 2021 to 12,00%. In March 2021, the government presented its economic priorities for the next twelve months and the five-year plan for the period 2021-2025. The government has announced that it is aiming for GDP growth "above 6%" in 2021. The fiscal deficit is expected to fall from 3,7% to 3,2% of GDP. Monetary policy should remain "prudent, appropriate and flexible". The 2021-2025 five-year plan calls for further structural reforms. In May 2021, the government allowed families to have three children. A new emphasis on "shared prosperity" has led to several announcements targeting sectors such as technology and education. Some major real estate developers have run into financial difficulties.
MANAGEMENT POLICY
2020 ended on a high note, thanks to good news on vaccines, approval of a new fiscal stimulus package in the United States and the Brexit deal taking precedence over the reintroduction of lockdown measures in Europe. The ECB strengthened its support for the economy by recalibrating its monetary policy, with the main measure being an increase and extension of its emergency purchase programme to €1 850 billion (+€500 billion until March 2022). Long-term yields fell in Europe (-5bp) but rose on the other side of the Atlantic (+23bp). Appetite for risky assets increased. A record year for volumes in the High Yield segment and also for the hybrid format is over. Against this backdrop, Lazard Credit Opportunities generated performance over the period thanks to its aggressive positioning in subordinated debt, peripheral issuers, the addition of cyclical stocks and High Yield and its pronounced negative sensitivity to interest rates. An emerging credit exposure was initiated in December. The rise continued in the first quarter of 2021, benefiting stocks most exposed to a rebound in activity as fiscal stimulus in the United States is increased and vaccination becomes more prevalent. The expected strong economic recovery fuelled fears of an inflationary surge, but central banks maintained their accommodative stance. Long-term interest rates rose sharply across the board (+83bp in the US and +28bp in the EU). Yield curves have steepened on the theme of reflation and optimism about the speed and scale of the economic recovery, particularly in the United States where the stimulus package is on the brink of being voted. All credit asset classes tightened, with greater movements in the riskiest segments. Lazard Credit Opportunities posted a positive performance for the quarter. A US 10-year inflation-linked position was added during January. The main positive contributors to credit performance were subordinated financials, the increased positions in cyclical stocks and High Yield. The positive interest rate effect was mainly driven by hedges on German 10-year and US 30-year bonds. In the second quarter of 2021, thanks to the improvement in the economic and health situation, the equity markets hit new all-time highs in Europe and the US. Corporate earnings releases were generally better than expected. All credit segments tightened once again. The monetary policy stance remained the focus of attention. Dissension emerged within central banks. In the United States, some Fed members spoke out to underscore the risk that a late reaction could lead to an overheating of the economy. In the meantime, Jerome Powell reaffirmed the transitory nature of inflation, while stressing that the priority is the recovery of the labour market. In Europe, despite some dissent, the ECB did not change its support, maintaining the same pace of purchases. US long-term interest rates dropped by 27bp while in Europe they rose by 8bp. The performance of the Lazard Credit Opportunities fund was hurt by the fall in US interest rates, but its

26
aggressive positioning on credit through High Yield and AT1 securities enabled it to limit the underperformance. The third quarter of 2021 was marked by a more mixed macroeconomic environment. The rise continued in July and August before a correction in September against a backdrop of concerns about Chinese growth, a slightly less accommodating stance by the Fed, persistent cyclical inflation and a rapid rise in sovereign yields. Lazard Credit Opportunities generated a positive performance over the entire period. The credit effect largely offset the negative interest rate effect, thanks to peripheral subordinated financial and High Yield bonds, as well as exposure to inflation-indexed US Treasury bonds. The portfolio has completely eliminated its exposure to emerging credit, which was reduced over the year. The fund is still positioned for a rise in interest rates with a modified duration of -4,4 at the end of the month.
Past performance is no guarantee of future results.
Main changes in the portfolio during the year
Securities
Changes (“accounting currency”)
Purchases Sales
UNITED STATES TREAS INFLATION BONDS 0.125% 15-07-30 12 227 323,34
LAZARD EM MK TOT RT D-HA-EUR 5 838 180,00 5 853 836,00
AIR FR KLM 1.875% 16-01-25 3 942 931,13 3 173 407,19
BANKIA SA 6.0% PERP 3 596 960,00 1 840 030,43
BANCO NTANDER 6.25% PERP 1 952 131,76 3 300 000,00
DEUTSCHE LUFTHANSA AG 2.875% 11-02-25 2 986 050,00 2 022 805,48
QUATRIM SASU 5.875% 15-01-24 2 097 444,45 2 108 409,72
UNICREDIT 4.45% PERP EMTN 2 500 000,00 1 576 451,64
FIDELIDADE COMPANHIADE SEGUROS 4.25% 04-09-31 2 700 000,00 1 343 349,66
CAIXABANK 3,625% PERP 2 000 000,00 2 006 140,00
.

27
6. REGULATORY INFORMATION
EFFICIENT PORTFOLIO MANAGEMENT TECHNIQUES AND DERIVATIVE FINANCIAL INSTRUMENTS (ESMA) IN
EUROS
a) Exposure through efficient portfolio management techniques and derivative financial instruments
• Exposure through efficient management techniques:
o Securities lending:
o Securities borrowing:
o Repurchase agreements:
o Reverse repurchase agreements:
• Underlying exposure through derivative financial instruments: 237 333 844,25
o Currency forwards: 345 866,12
o Futures: 236 987 978,13
o Options:
o Swaps:
b) Identity of the counterparty or counterparties for efficient portfolio management techniques and derivative
financial instruments
Efficient portfolio management techniques Derivative financial instruments (*)
CACEIS BANK, LUXEMBOURG BRANCH
(*) Excluding listed derivatives

28
c) Financial guarantees received by the UCITS to reduce counterparty risk
Instrument type Amount in the currency of the portfolio
Efficient portfolio management techniques
. Term deposits
. Equities
. Bonds
. UCITS
. Cash (*)
Total
Derivative financial instruments
. Term deposits
. Equities
. Bonds
. UCITS
. Cash
Total
(*) The Cash account also includes liquidity from reverse repurchase agreements.
d) Operating income and expenses related to efficient management techniques
Operating income and expenses Amount in the currency of the portfolio
. Income (***) 5 101,52
. Other income
Total income 5 101,52
. Direct operating expenses 12 257,40
. Indirect operating expenses
. Other expenses
Total expenses 12 257,40
(*) Income on securities lending and repurchase agreements
29
TRANSPARENCY OF SECURITIES FINANCING TRANSACTIONS AND THE REUSE OF FINANCIAL INSTRUMENTS – SFTR – in the accounting currency of the UCI (€)
The UCI carried out no transactions during the year in the context of the SFTR.
PROCEDURE FOR SELECTING AND ASSESSING INTERMEDIARIES AND COUNTERPARTIES The brokers used by the management company are selected on the basis of various evaluation criteria, covering
research, quality of order execution and processing and the range of services offered. The management company’s
“Broker Committee” validates any updates to the list of authorised brokers. Each investment division (fixed income and
equities) reports to the Broker Committee at least twice a year on the evaluation of the services provided by the various
brokers and the breakdown of the volume of transactions handled.
The information can be consulted on the management company's website: www.lazardfreresgestion.fr
BROKERAGE FEES Information about brokerage fees is available on the website: www.lazardfreresgestion.fr.
EXERCISING VOTING RIGHTS Lazard Frères Gestion S.A.S. exercises the voting rights attached to the securities held in the UCIs it manages in
accordance with the scope and procedures specified in the guidelines it has drawn up concerning its voting policy. This
document can be consulted on the management company’s website: www.lazardfreresgestion.fr.
COMMUNICATION OF ENVIRONMENTAL, SOCIAL AND GOVERNANCE CRITERIA Lazard Frères Gestion firmly believes that the integration of environmental, social and governance (ESG) criteria in the
management of assets provides an additional guarantee in terms of a durable economic performance.
In fact, the long-term performance of investments is not limited solely to adherence to the financial strategy, but must also
take the company's interactions with its social, economic and financial environment into account.
The incorporation of ESG criteria therefore is a natural component of our investment process.
Our overall approach can be summarised as follows:
Rigorous financial analysis of the company covering the quality of assets, financial soundness, projected cash
flows and their reinvestment by the company, the strength of economic profits, profit durability, and quality of
management.
This durability is strengthened by incorporating non-financial criteria:
- Social criteria: through the development of human capital.
- Environmental criteria: through the prevention of all environmental risks.
- Governance criteria: by respecting the balance between the managerial and shareholder structures so as to prevent
potential conflicts of interest and safeguard the interests of minority shareholders.
The intensity and methods by which we incorporate ESG criteria may vary depending on the asset class and investment
process involved, but the common objective is to ensure better apprehension of ESG risks that are likely to have a strong
impact on the value of a company or sovereign asset.
Information on ESG criteria is available on the website: www.lazardfreresgestion.fr.
ARTICLE 8 (SFDR) The UCI promotes environmental and/or social characteristics within the meaning of Article 8 of Regulation (EU) 2019/2088, the so-called “SFDR Regulation”. Regulation (EU) 2020/852, known as the “Taxonomy Regulation” The European Union Taxonomy aims to identify economic activities that are considered environmentally sustainable. The Taxonomy identifies these activities according to their contribution to six broad environmental objectives:
• Climate change mitigation,
• Climate change adaptation,
• Sustainable use and protection of water and marine resources,

30
• Transition to the circular economy (waste, prevention and recycling),
• Pollution prevention and control,
• Protection of healthy ecosystems.
Currently, Technical Screening Criteria have been developed for a number of economic activities that can contribute
substantially to two of these objectives: climate change mitigation and climate change adaptation. These criteria are currently awaiting publication in the Official Journal of the European Union. The data presented below therefore only reflect alignment with these two objectives, based on the not-yet-finally published criteria as submitted to the European co-legislators. We will update this information in the event of changes to these criteria, the development of new review criteria relating to these two objectives, as well as when the criteria relating to the other four environmental objectives come into effect: sustainable use and protection of aquatic and marine resources; the transition to a circular economy; pollution prevention and reduction; the protection and restoration of biodiversity and ecosystems. To be considered sustainable, an economic activity must demonstrate that it contributes substantially to the achievement of one of the six objectives, while not harming any of the other five (the so-called DNSH principle, standing for “Do No Significant Harm”). In order for an activity to be considered aligned with the European Taxonomy, it must also respect the human and social rights guaranteed under international law. The “Do No Harm” principle applies only to investments underlying the financial product that take into account the European Union’s criteria for environmentally sustainable economic activities. The investments underlying the remaining portion of this financial product do not take into account the European Union’s criteria for environmentally sustainable economic activities. The minimum percentage of alignment with the European Union Taxonomy is 0%. Consideration of the alignment of companies’ activities is carried out qualitatively in the internal analysis process based on the data published by the companies themselves as well as data made available by our ESG data providers.
USE OF FINANCIAL INSTRUMENTS MANAGED BY THE MANAGEMENT COMPANY OR AN AFFILIATED COMPANY
The table of financial instruments managed by the management company or an affiliated company can be found in the notes to the UCI's annual financial statements.
METHOD USED TO CALCULATE GLOBAL RISK The overall risk is calculated as the absolute VaR, as defined in Article 41177 et seq. of the General Regulation of the French financial markets regulator (Autorité des Marchés Financiers - AMF).. The absolute VaR corresponds to the potential loss in 99% of cases over a horizon of 20 working days under normal market conditions. The VaR level must remain lower than 15% and leverage must not exceed 400% gross.
Maximum level of VaR per month: 12,23%.
Minimum level of VaR per month: 4,75%.
Average level of VaR per month: 7,09%.
SWING PRICING In order to protect the UCI's long-term unitholders, a swing factor will be applied to subscriptions and redemptions that have a significant impact on the UCI's outstandings, which may generate costs for unitholders entering and leaving the UCI that would otherwise have been allocated across all unitholders in the UCI. Therefore, if, on a particular NAV calculation date, the total net subscription/redemption orders of investors across all categories of UCI units or shares exceeds a threshold predetermined by the management company on the basis of objective criteria and expressed as a percentage of the net assets in the UCI, the NAV may be adjusted upwards or downwards to take account of the readjustment costs attributable to the net subscription/redemption orders. The NAV of each unit or share category shall be calculated separately, but any adjustment shall have an identical impact, expressed as a percentage, on all of the NAV calculations of each unit or share category in the UCI. The cost parameters and trigger level shall be determined by the management company and shall be reviewed periodically, and at least every six months. These costs shall be estimated by the management company based on transaction fees, bid/offer spreads and tax charges applicable to the UCI. Insofar as this adjustment mechanism is linked to the net balance of subscriptions/redemptions within the UCI, it is not possible to accurately predict a given time in the future at which swing pricing will be applied. Consequently, neither is it possible to predict the precise frequency at which the management company will have to make such adjustments, which shall not exceed 1% of the NAV (see prospectus). Investors should be aware that the volatility of the UCI’s NAV may not reflect solely that of the securities in the portfolio arising from the application of swing pricing.
31
INFORMATION ON DISTRIBUTED INCOME ELIGIBLE FOR THE 40% ALLOWANCE (FOR DISTRIBUTING UCIs)
Pursuant to the provisions of Article 41 sexdecies H of the French General Tax Code, income on distributing shares is subject to an allowance of 40%.
REMUNERATION The fixed and variable remuneration paid during the financial year ended on December 31st, 2020 by the management company to its personnel, in proportion to their investment in the management of the AIFs, excluding the management of the UCITS and discretionary mandates, can be obtained on request by post from the UCI legal department of Lazard Frères Gestion, and are included in the company's annual report. The total variable remuneration is set by the Lazard Group based on different criteria, including the Lazard Group's financial performance over the past year, taking its earnings into account. The General Management decides on the total remuneration amount that will be split between the fixed and variable components, complying with the policy to maintain a complete separation between the fixed and variable components. All risks are incorporated into the calculation of the variable remuneration. It is then individualised and determined partly based on the performance of each identified member of staff. The remuneration policy is reviewed each year and is in line with the remuneration policies and procedures established by Lazard Frères Gestion. Each year, Lazard Frères Gestion's Remuneration Policy Compliance Monitoring Committee, which also has two members independent from the management company, is responsible for issuing an opinion on the proper application of the remuneration policy and its compliance with applicable regulations:
Population at 31/12/2020: fixed-term and permanent contracts of LFG and LFG Belgique
(therefore excluding interns and apprentices and excluding LFG Courtage)
Headcount at 31-12-2020 LFG - LFG-Belgium
Fixed annual remuneration 2020 in €
Variable remuneration for 2020 (cash paid in 2021 and deferred compensation allocated in 2021) in €
179 16 522 853 22 155 596
32
“Identified employees”
Category Number of employees 2020 aggregate fixed and variable remuneration (annual salaries and cash and deferred bonuses)
Senior management 3 4 310 982
Other 51 21 362 196
Total 54 25 673 178
Note: the amounts are stated excluding charges
OTHER INFORMATION The UCI's full prospectus and the most recent annual and interim reports will be sent out within one week of request in writing by unitholders to:
LAZARD FRERES GESTION SAS 25, Rue de Courcelles – 75008 Paris, France www.lazardfreresgestion.fr

33
7. ANNUAL FINANCIAL STATEMENTS
• BALANCE SHEET AS AT 30/09/2021 in EUR
ASSETS
30/09/2021 30/09/2020
NET NON-CURRENT ASSETS
DEPOSITS
FINANCIAL INSTRUMENTS 228 015 364,64 118 551 644,53
Equities and similar securities
Traded on a regulated or equivalent market
Not traded on a regulated or equivalent market
Bonds and similar securities 218 062 474,98 111 189 947,28
Traded on a regulated or equivalent market 218 062 474,98 111 189 947,28
Not traded on a regulated or equivalent market
Debt securities
Traded on a regulated or equivalent market
Negotiable debt securities
Other debt securities
Not traded on a regulated or equivalent market
Undertakings for collective investment 7 854 096,00 7 248 487,25
General UCITS and general AIFs aimed at non-professionals and their
equivalent in other countries 7 854 096,00 7 248 487,25
Other funds aimed at non-professionals and their equivalent in other
countries that are Member States of the EU
General funds aimed at professional investors and their equivalent in other Member States of the EU and listed securitisation entities
Other funds aimed at professional investors and their equivalent in other Member States of the EU and unlisted securitisation entities
Other non-European entities
Temporary securities transactions
Receivables on securities purchased under repurchase agreements
Receivables on loaned securities
Borrowed securities
Securities sold under repurchase agreements
Other temporary transactions
Forward financial instruments 2 098 793,66 113 210,00
Transactions on a regulated or equivalent market 2 098 793,66 113 210,00
Other transactions
Other financial instruments
RECEIVABLES 4 477 571,61 1 701 335,51
Currency forward exchange transactions 345 866,12
Other 4 131 705,49 1 701 335,51
FINANCIAL ACCOUNTS 9 160 901,31 10 889 813,47
Cash and cash equivalents 9 160 901,31 10 889 813,47
TOTAL ASSETS 241 653 837,56 131 142 793,51

34
LIABILITIES AND SHAREHOLDERS’ EQUITY
30/09/2021 30/09/2020
SHAREHOLDERS’ EQUITY
Share capital 231 246 340,46 111 125 269,11
Undistributed net capital gains and losses recognised in previous years (a)
Retained earnings (a) 128,73 205,37
Net capital gains and losses for the year (a, b) 2 110 174,88 8 703 860,80
Net income for the year (a, b) 5 230 611,00 3 015 480,20
TOTAL SHAREHOLDERS' EQUITY * Sum representing the net assets
238 587 255,07 122 844 815,48
FINANCIAL INSTRUMENTS 2 098 793,41 113 210,00
Sales of financial instruments
Temporary securities transactions
Liabilities on securities sold under repurchase agreements
Liabilities on borrowed securities
Other temporary transactions
Forward financial instruments 2 098 793,41 113 210,00
Transactions on a regulated or equivalent market 2 098 793,41 113 210,00
Other transactions
LIABILITIES 967 788,51 8 184 768,03
Currency forward exchange transactions 343 816,85
Other 623 971,66 8 184 768,03
FINANCIAL ACCOUNTS 0,57
Bank overdrafts 0,57
Borrowings
TOTAL LIABILITIES AND SHAREHOLDERS’ EQUITY 241 653 837,56 131 142 793,51
(a) Including accrued income (b) Less interim dividends paid for the financial year
35
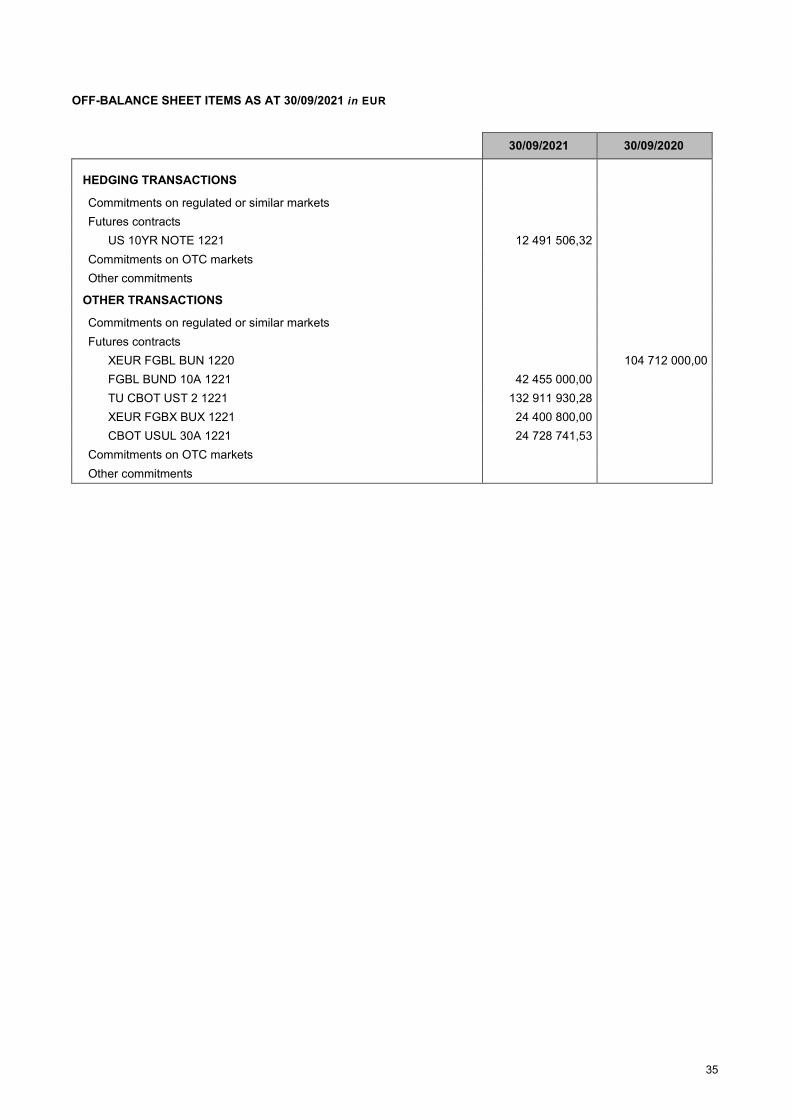
OFF-BALANCE SHEET ITEMS AS AT 30/09/2021 in EUR
30/09/2021 30/09/2020
HEDGING TRANSACTIONS
Commitments on regulated or similar markets
Futures contracts
US 10YR NOTE 1221 12 491 506,32
Commitments on OTC markets
Other commitments
OTHER TRANSACTIONS
Commitments on regulated or similar markets
Futures contracts
XEUR FGBL BUN 1220 104 712 000,00
FGBL BUND 10A 1221 42 455 000,00
TU CBOT UST 2 1221 132 911 930,28
XEUR FGBX BUX 1221 24 400 800,00
CBOT USUL 30A 1221 24 728 741,53
Commitments on OTC markets
Other commitments
36
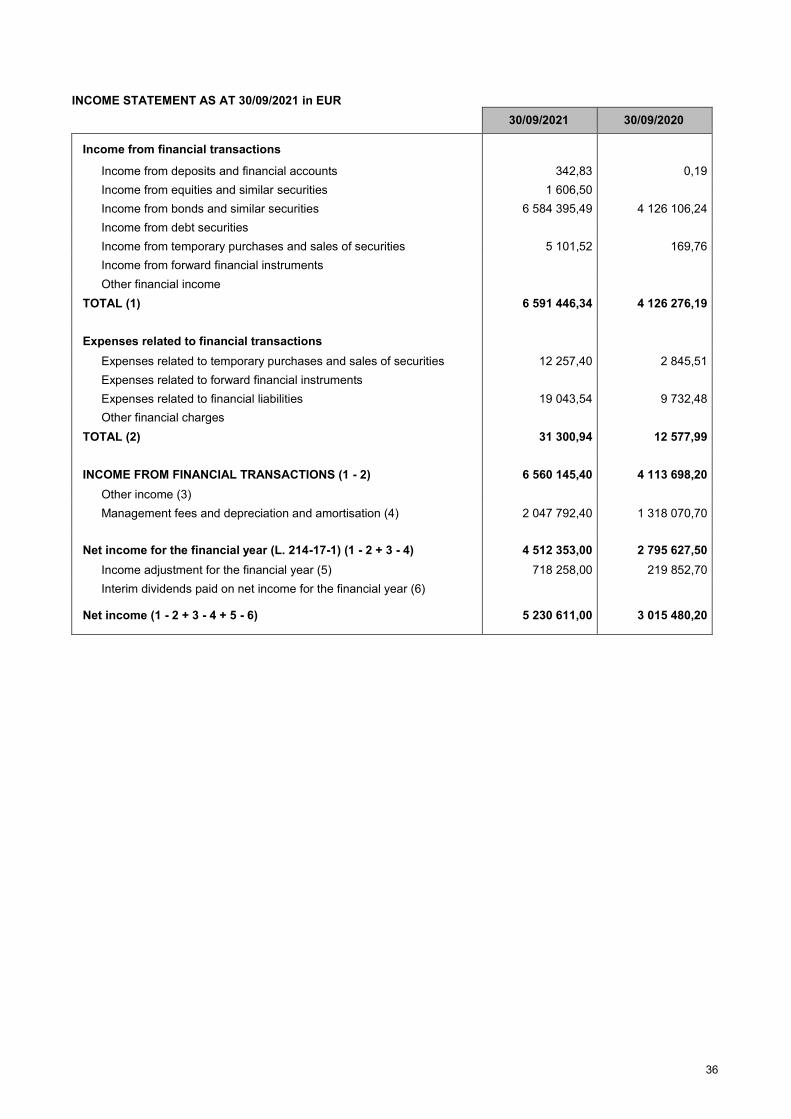
INCOME STATEMENT AS AT 30/09/2021 in EUR
30/09/2021 30/09/2020
Income from financial transactions
Income from deposits and financial accounts 342,83 0,19
Income from equities and similar securities 1 606,50
Income from bonds and similar securities 6 584 395,49 4 126 106,24
Income from debt securities
Income from temporary purchases and sales of securities 5 101,52 169,76
Income from forward financial instruments
Other financial income
TOTAL (1) 6 591 446,34 4 126 276,19
Expenses related to financial transactions
Expenses related to temporary purchases and sales of securities 12 257,40 2 845,51
Expenses related to forward financial instruments
Expenses related to financial liabilities 19 043,54 9 732,48
Other financial charges
TOTAL (2) 31 300,94 12 577,99
INCOME FROM FINANCIAL TRANSACTIONS (1 - 2) 6 560 145,40 4 113 698,20
Other income (3)
Management fees and depreciation and amortisation (4) 2 047 792,40 1 318 070,70
Net income for the financial year (L. 214-17-1) (1 - 2 + 3 - 4) 4 512 353,00 2 795 627,50
Income adjustment for the financial year (5) 718 258,00 219 852,70
Interim dividends paid on net income for the financial year (6)
Net income (1 - 2 + 3 - 4 + 5 - 6) 5 230 611,00 3 015 480,20

37
NOTES TO THE FINANCIAL STATEMENTS
1. ACCOUNTING RULES AND PRINCIPLES
The annual financial statements are presented in accordance with regulation 2014-01, as amended, of the French accounting standards body (Autorité des Normes Comptables - ANC). The general accounting principles apply:
- true and fair view, comparability, business continuity,
- regularity, sincerity,
- prudence,
- consistency of accounting methods from one financial year to the next. Income from fixed-income securities is recorded on the basis of accrued interest. Purchases and sales of securities are recorded excluding expenses. The accounting currency of the portfolio is the euro. The financial year comprises 12 months.
Information on the impact of the COVID-19 crisis
The financial statements were approved by the Board of Directors on the basis of available information in the context of the evolving COVID-19 crisis.
Asset valuation rules
Financial instruments and securities traded on a regulated market are valued at their market price. o Shares and similar securities are valued on the basis of the last known price on their main market.
If applicable, prices are translated into euros using the exchange rate prevailing in Paris on the valuation day (as published by WM Closing).
o Fixed-income securities:
Fixed-income securities are for the most part marked to market based on either Bloomberg prices (BGN)® derived from averages of contributed prices, or on those of direct contributors.
There may be a discrepancy between the carrying amounts, valued as indicated above, and the actual disposal prices that would be obtained if a portion of these portfolio assets were to be sold. o Bonds and similar instruments are valued on the basis of the average of the closing prices gathered from several contributors.
Financial instruments whose prices have not been determined on the valuation day or whose prices have been adjusted are valued at their probable trading price under the responsibility of the management company. These estimates and their supporting documentation will be provided to the statutory auditor during audits. However, the
following instruments are valued using the following specific methods:
o Negotiable debt securities:
- Negotiable debt securities with a residual maturity of more than three months:
Negotiable debt securities traded in large volumes are valued at market price.
In the absence of significant trading volumes, these securities are valued using an actuarial method, with a benchmark
rate plus, where applicable, a margin representative of the issuer’s intrinsic features.

38
Benchmark rate
Negotiable debt securities in euros Negotiable debt securities in other currencies
Euribor, overnight indexed swaps (OIS) and French treasury bills (BTF)
- 3 – 6 – 9 – 12 months
BTAN medium-term treasury notes
- 18 months, 2 - 3 - 4 - 5 years
Official key rates in the relevant countries
- Negotiable debt securities with a residual maturity of three months or less:
Negotiable debt securities with a residual maturity of three months or less are valued using the straight-line method.
However, this method would not be applied if any of these securities were particularly sensitive to market movements.
o UCIs:
Units or shares of UCIs are valued at the last known net asset value.
Units or shares of UCIs for which net asset values are published monthly may be valued on the basis of interim net asset
values calculated from estimated prices.
o Temporary purchases and sales of securities:
Securities purchased under repurchase agreements are valued at their contract price using an actuarial method with a
benchmark rate (overnight EONIA, one- or two-week interbank rates, one- to 12-month EURIBOR) corresponding to the
term of the contract.
Securities sold under repurchase agreements continue to be valued at their market price. Liabilities on securities sold
under repurchase agreements are calculated using the same method as that used for securities purchased under
repurchase agreements.
o Futures and options:
Futures and options are valued on the basis of intraday trading prices the timing of which is based on that of the valuation
of the underlying assets.
Positions taken on the futures or options markets and over the counter are valued at their market price or at the value of
the equivalent underlying asset.
Financial instruments and securities not traded on a regulated market
All of the UCI’s financial instruments are traded on regulated markets.
Valuation methods for off-balance sheet commitments
Off-balance sheet transactions are valued at the commitment value.
The commitment value for futures contracts is equal to the price (in the SICAV’s currency) multiplied by the number of
contracts multiplied by the face value.
The commitment value for options is equal to the price of the underlying security (in the SICAV’s currency) multiplied by
the number of contracts multiplied by the delta multiplied by the face value of the underlying security. The commitment value for swaps is equal to the face value of the contract (in the SICAV’s currency).
Swing Pricing
The management company has been applying a swing pricing adjustment to the net asset value with a trigger level since
July 27th, 2015. Unitholders can consult information on this mechanism in the SICAV's prospectus, which is available at
the management company's head office and on its website.
Management fees
Management fees are calculated on each valuation day.
The annual management fee rate is applied to gross assets (equal to net assets before deduction of the day’s
management fees) less UCIs managed by Lazard Frères Gestion SAS using the following formula:
Net assets excluding UCIs managed by Lazard Frères Gestion SAS
x operating and management fees rate
x no. of days between the calculated NAV and the previous NAV
365 (or 366 in a leap year)
39
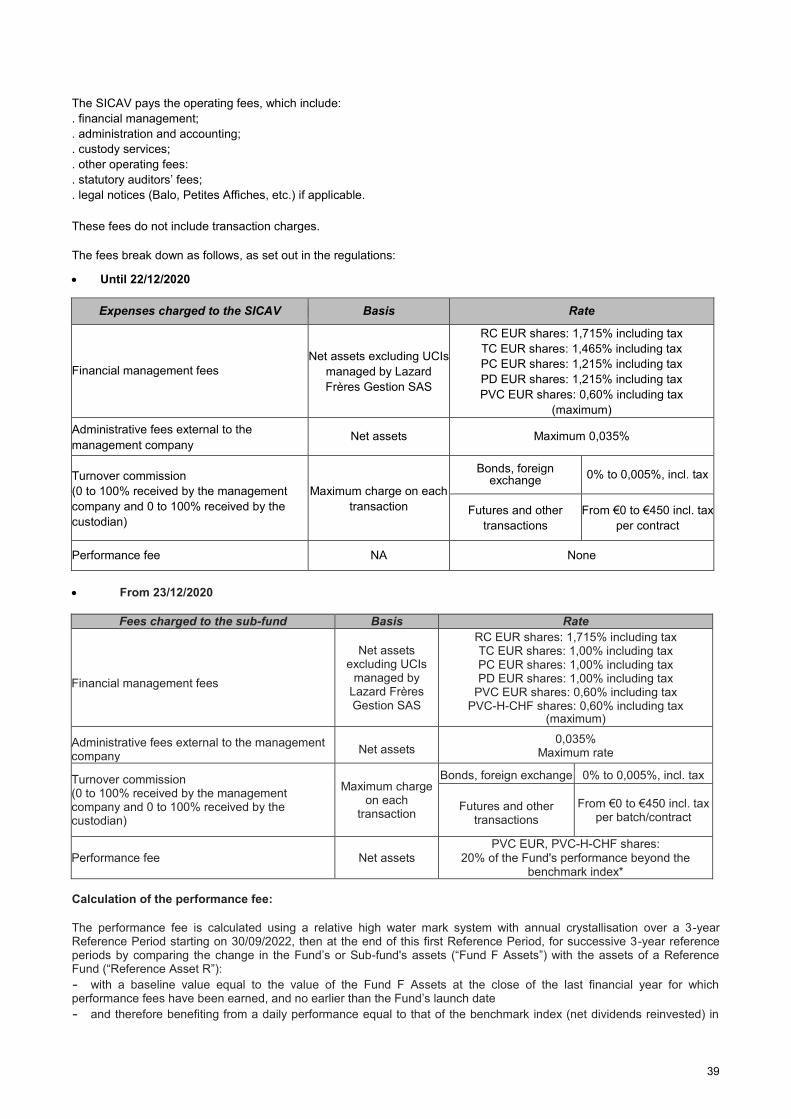
The SICAV pays the operating fees, which include:
. financial management;
. administration and accounting;
. custody services;
. other operating fees:
. statutory auditors’ fees;
. legal notices (Balo, Petites Affiches, etc.) if applicable.
These fees do not include transaction charges.
The fees break down as follows, as set out in the regulations:
Until 22/12/2020
Expenses charged to the SICAV Basis Rate
Financial management fees
Net assets excluding UCIs
managed by Lazard
Frères Gestion SAS
RC EUR shares: 1,715% including tax
TC EUR shares: 1,465% including tax
PC EUR shares: 1,215% including tax
PD EUR shares: 1,215% including tax
PVC EUR shares: 0,60% including tax
(maximum)
Administrative fees external to the
management company Net assets Maximum 0,035%
Turnover commission
(0 to 100% received by the management
company and 0 to 100% received by the
custodian)
Maximum charge on each
transaction
Bonds, foreign exchange
0% to 0,005%, incl. tax
Futures and other
transactions
From €0 to €450 incl. tax
per contract
Performance fee NA None
From 23/12/2020
Fees charged to the sub-fund Basis Rate
Financial management fees
Net assets excluding UCIs
managed by Lazard Frères Gestion SAS
RC EUR shares: 1,715% including tax TC EUR shares: 1,00% including tax PC EUR shares: 1,00% including tax PD EUR shares: 1,00% including tax
PVC EUR shares: 0,60% including tax PVC-H-CHF shares: 0,60% including tax
(maximum)
Administrative fees external to the management company
Net assets 0,035%
Maximum rate
Turnover commission (0 to 100% received by the management company and 0 to 100% received by the custodian)
Maximum charge on each
transaction
Bonds, foreign exchange 0% to 0,005%, incl. tax
Futures and other transactions
From €0 to €450 incl. tax per batch/contract
Performance fee Net assets
PVC EUR, PVC-H-CHF shares:
20% of the Fund's performance beyond the benchmark index*
Calculation of the performance fee:
The performance fee is calculated using a relative high water mark system with annual crystallisation over a 3-year Reference Period starting on 30/09/2022, then at the end of this first Reference Period, for successive 3-year reference periods by comparing the change in the Fund’s or Sub-fund's assets (“Fund F Assets”) with the assets of a Reference Fund (“Reference Asset R”):
- with a baseline value equal to the value of the Fund F Assets at the close of the last financial year for which performance fees have been earned, and no earlier than the Fund’s launch date
- and therefore benefiting from a daily performance equal to that of the benchmark index (net dividends reinvested) in

40
euros, and recording the same variations in subscriptions and redemptions as the Fund. If, at the close of the financial year, the “Fund F Assets” (net dividends reinvested and excluding variable management fees) exceed those of the “Reference Assets R”, a performance fee equal to 20% (including taxes) of the difference in value between the “Fund F Assets” and the “Reference Assets R” will be charged, even if the Fund’s performance is negative. If the Sub-fund underperforms the benchmark fund between two net asset value dates, any provision previously recognised will be reversed. Amounts deducted from provisions may not exceed the amount previously accumulated.
The method used to calculate retrocession amounts is set out in the sales and marketing agreements. - If the amount is significant, a provision is recognised in account 617. - The final amount is recognised upon settlement of invoices after reversal of any provisions. Allocation of distributable income
Definition of distributable income:
Distributable income consists of:
Net income:
Net income for the financial year is equal to the amount of interest, arrears, bonuses and prizes, dividends, directors' fees
and all other income generated by the securities that make up the portfolio, plus income generated by temporary cash
holdings, minus the amount of management fees and borrowing costs.
Retained earnings are added, plus or minus the balance of the revenue adjustment account.
Capital gains and losses:
Realised capital gains, net of expenses, less realised capital losses, net of expenses, recognised for the financial year,
plus any net capital gains of the same kind recognised over previous years that have not been distributed or accumulated,
plus or minus the balance of the capital gains adjustment account.
Allocation of distributable income:
Share(s) Allocation of net income Allocation of net realised
capital gains or losses
LAZARD CREDIT OPPORTUNITIES PC
EUR shares Accumulation Accumulation
LAZARD CREDIT OPPORTUNITIES PD
EUR shares Distribution
Accumulation and/or Distribution
and/or Retention
LAZARD CREDIT OPPORTUNITIES PVC
EUR shares Accumulation Accumulation
LAZARD CREDIT OPPORTUNITIES PVC
H-CHF shares Accumulation Accumulation
LAZARD CREDIT OPPORTUNITIES RC
EUR shares Accumulation Accumulation
LAZARD CREDIT OPPORTUNITIES TC
EUR shares Accumulation Accumulation

41
2. CHANGE IN NET ASSETS AT 30/09/2021 in EUR
(*) N: Result of the merger of the 106016 Lazard Crédit Opportunities I and 106017 Lazard Crédit Opportunities II funds into the 106002 Lazard Crédit Opportunities SICAV for an amount of €303,31.
30/09/2021 30/09/2020
NET ASSETS AT START OF YEAR
122 844 815,48
90 392 045,05
Subscriptions (including subscription fees retained by the Fund) 147 306 615,40 36 195 055,88
Redemptions (net of redemption fees retained by the Fund) -45 082 351,38 -13 062 172,71
Realised capital gains on deposits and financial instruments 5 573 117,80 8 329 896,73
Realised capital losses on deposits and financial instruments -842 621,39 -3 885 914,96
Realised capital gains on forward financial instruments 394 902 620,23 183 356 496,21
Realised capital losses on forward financial instruments -401 243 705,02 -179 803 563,78
Transaction charges -216 298,15 -340 929,90
Exchange rate differences 599 046,75 -319,77
Changes in valuation difference of deposits and financial instruments 8 787 454,73 -927 286,00
Valuation difference for financial year N 6 194 094,05 -2 593 360,68
Valuation difference for financial year N-1 2 593 360,68 1 666 074,68
Changes in valuation difference of forward financial instruments 2 212 003,66 529 580,00
Valuation difference for financial year N 2 098 793,66 -113 210,00
Valuation difference for financial year N-1 113 210,00 642 790,00
Distribution of prior year's net capital gains and losses
Dividends paid in the previous financial year -766 099,35 -733 698,77
Net profit/loss for the financial year prior to income adjustment 4 512 353,00 2 795 627,50
Interim dividend(s) paid on net capital gains/losses during the financial year
Interim dividend(s) paid on net income during the financial year
Other items 303,31 (*)
NET ASSETS AT END OF YEAR 238 587 255,07 122 844 815,48

42
3. ADDITIONAL INFORMATION
3.1. BREAKDOWN OF FINANCIAL INSTRUMENTS BY LEGAL OR ECONOMIC STATUS
Amount %
ASSETS
BONDS AND SIMILAR SECURITIES
Fixed-rate bonds traded on a regulated or similar market 197 918 555,76 82,96
Variable/adjustable rate bonds traded on a regulated or equivalent market 5 509 964,03 2,31
Convertible bonds traded on a regulated or equivalent market 1 938 379,18 0,81
Other bonds (index-linked, equity securities) 12 695 576,01 5,32
TOTAL BONDS AND SIMILAR SECURITIES 218 062 474,98 91,40
DEBT SECURITIES
TOTAL DEBT SECURITIES
LIABILITIES AND SHAREHOLDERS’ EQUITY
SALES OF FINANCIAL INSTRUMENTS
TOTAL SALES OF FINANCIAL INSTRUMENTS
OFF-BALANCE SHEET
HEDGING TRANSACTIONS
Interest rates 12 491 506,32 5,24
TOTAL HEDGING TRANSACTIONS 12 491 506,32 5,24
OTHER TRANSACTIONS
Interest rates 224 496 471,81 94,09
TOTAL OTHER TRANSACTIONS 224 496 471,81 94,09

43
3.2. BREAKDOWN OF ASSET, LIABILITY AND OFF-BALANCE SHEET ITEMS BY INTEREST RATE TYPE
Fixed rate % Variable rate % Revisable rate % Other %
ASSETS
Deposits
Bonds and similar securities 197 918 555,76 82,95 7 448 343,21 3,12 12 695 576,01 5,32
Debt securities
Temporary securities transactions
Financial accounts 9 160 901,31 3,84
LIABILITIES AND SHAREHOLDERS’ EQUITY
Temporary securities transactions
Financial accounts 0,57
OFF-BALANCE SHEET
Hedging transactions 12 491 506,32 5,24
Other transactions 224 496 471,81 94,09
3.3. BREAKDOWN OF ASSET, LIABILITY AND OFF-BALANCE SHEET ITEMS BY RESIDUAL MATURITY(*)
< 3 months %
3 months-1
year % 1-3 years % 3-5 years % > 5 years %
ASSETS
Deposits
Bonds and similar
securities
8 671,64
1 940 996,19
0,81
14 851 525,23
6,22
32 660 728,99
13,69
168 600 552,93
70,67
Debt securities
Temporary
securities
transactions
Financial accounts 9 160 901,31 3,84
LIABILITIES AND SHAREHOLDERS’ EQUITY
Temporary
securities
transactions
Financial accounts 0,57
OFF-BALANCE SHEET
Hedging
transactions
12 491 506,32 5,24
Other transactions 132 911 930,28 55,71
91 584 541,53 38,39
(*) Forward interest rate positions are presented according to the maturity of the underlying.

44
3.4. BREAKDOWN OF ASSET, LIABILITY AND OFF-BALANCE SHEET ITEMS BY LISTING OR VALUATION
CURRENCY Currency 1
USD Currency 2
GBP Currency 3
CHF Currency N
OTHER
Amount % Amount % Amount % Amount %
ASSETS
Deposits
Equities and similar securities
Bonds and similar securities 15 409 117,00 6,46 2 517 892,73 1,06
Debt securities
UCIs
Temporary securities transactions
Receivables 1 277 535,70 0,54 345 866,12 0,14
Financial accounts 1 312 159,06 0,55 5 279,52 4,25
LIABILITIES AND SHAREHOLDERS’ EQUITY
Sales of financial instruments
Temporary securities transactions
Liabilities 263,11
Financial accounts 0,57
OFF-BALANCE SHEET
Hedging transactions 12 491 506,32 5,24
Other transactions 157 640 671,81 66,07
3.5. RECEIVABLES AND PAYABLES: BREAKDOWN BY TYPE
Debit/credit item 30/09/2021
RECEIVABLES
Forward currency purchases 345 866,12
Deferred settlement sale 1 043 281,16
Subscription receivables 257 201,13
Margin cash deposits 2 677 919,20
Coupons and dividends in cash 153 304,00
TOTAL RECEIVABLES 4 477 571,61
LIABILITIES
Payables on forward currency purchases 343 816,85
Redemptions payable 302 681,23
Fixed management fees 214 240,05
Variable management fees 107 050,38
TOTAL LIABILITIES 967 788,51
TOTAL LIABILITIES AND RECEIVABLES
3 509 783,10
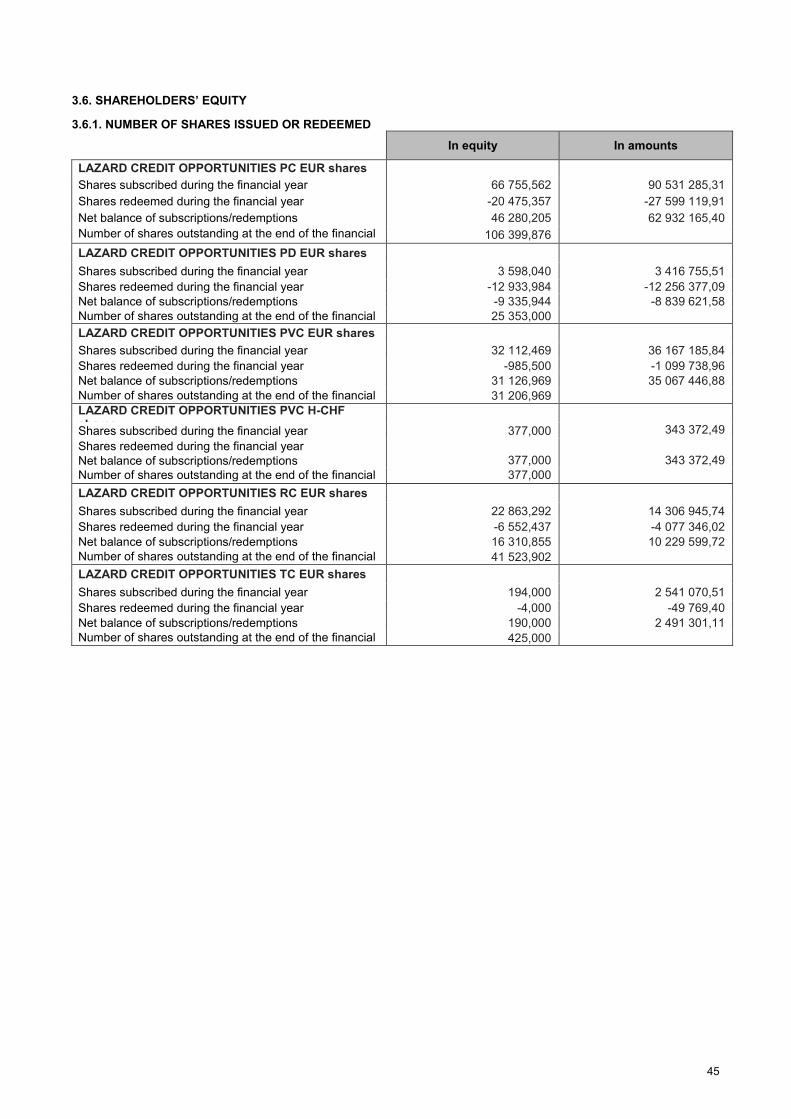
45
3.6. SHAREHOLDERS’ EQUITY 3.6.1. NUMBER OF SHARES ISSUED OR REDEEMED
In equity In amounts
LAZARD CREDIT OPPORTUNITIES PC EUR shares
Shares subscribed during the financial year 66 755,562 90 531 285,31
Shares redeemed during the financial year -20 475,357 -27 599 119,91
Net balance of subscriptions/redemptions 46 280,205 62 932 165,40
Number of shares outstanding at the end of the financial year
106 399,876
LAZARD CREDIT OPPORTUNITIES PD EUR shares
Shares subscribed during the financial year 3 598,040 3 416 755,51
Shares redeemed during the financial year -12 933,984 -12 256 377,09
Net balance of subscriptions/redemptions -9 335,944 -8 839 621,58
Number of shares outstanding at the end of the financial year
25 353,000
LAZARD CREDIT OPPORTUNITIES PVC EUR shares
Shares subscribed during the financial year 32 112,469 36 167 185,84
Shares redeemed during the financial year -985,500 -1 099 738,96
Net balance of subscriptions/redemptions 31 126,969 35 067 446,88
Number of shares outstanding at the end of the financial year
31 206,969
LAZARD CREDIT OPPORTUNITIES PVC H-CHF shares
Shares subscribed during the financial year 377,000 343 372,49
Shares redeemed during the financial year
Net balance of subscriptions/redemptions 377,000 343 372,49
Number of shares outstanding at the end of the financial year
377,000
LAZARD CREDIT OPPORTUNITIES RC EUR shares
Shares subscribed during the financial year 22 863,292 14 306 945,74
Shares redeemed during the financial year -6 552,437 -4 077 346,02
Net balance of subscriptions/redemptions 16 310,855 10 229 599,72
Number of shares outstanding at the end of the financial year
41 523,902
LAZARD CREDIT OPPORTUNITIES TC EUR shares
Shares subscribed during the financial year 194,000 2 541 070,51
Shares redeemed during the financial year -4,000 -49 769,40
Net balance of subscriptions/redemptions 190,000 2 491 301,11
Number of shares outstanding at the end of the financial year
425,000
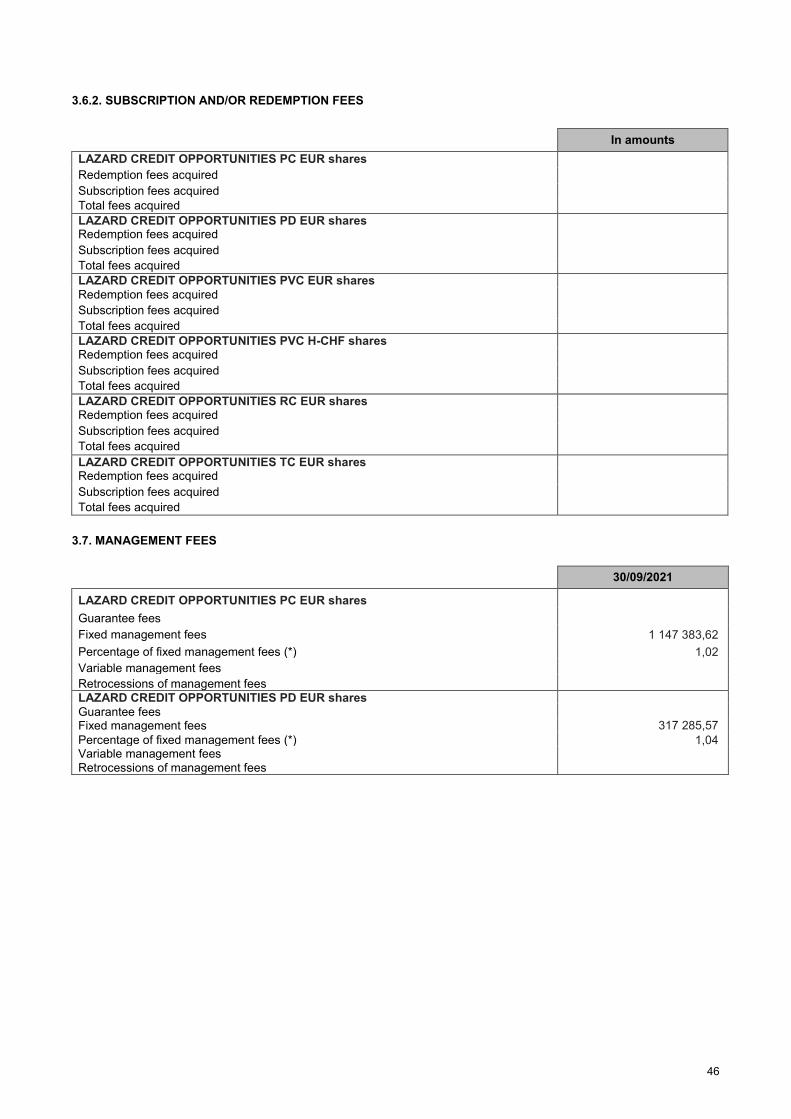
46
3.6.2. SUBSCRIPTION AND/OR REDEMPTION FEES
In amounts
LAZARD CREDIT OPPORTUNITIES PC EUR shares
Redemption fees acquired
Subscription fees acquired
Total fees acquired
LAZARD CREDIT OPPORTUNITIES PD EUR shares
Redemption fees acquired
Subscription fees acquired
Total fees acquired
LAZARD CREDIT OPPORTUNITIES PVC EUR shares
Redemption fees acquired
Subscription fees acquired
Total fees acquired
LAZARD CREDIT OPPORTUNITIES PVC H-CHF shares
Redemption fees acquired
Subscription fees acquired
Total fees acquired
LAZARD CREDIT OPPORTUNITIES RC EUR shares
Redemption fees acquired
Subscription fees acquired
Total fees acquired
LAZARD CREDIT OPPORTUNITIES TC EUR shares
Redemption fees acquired
Subscription fees acquired
Total fees acquired
3.7. MANAGEMENT FEES
30/09/2021
LAZARD CREDIT OPPORTUNITIES PC EUR shares
Guarantee fees
Fixed management fees 1 147 383,62
Percentage of fixed management fees (*) 1,02
Variable management fees
Retrocessions of management fees
LAZARD CREDIT OPPORTUNITIES PD EUR shares
Guarantee fees
Fixed management fees 317 285,57
Percentage of fixed management fees (*) 1,04
Variable management fees
Retrocessions of management fees
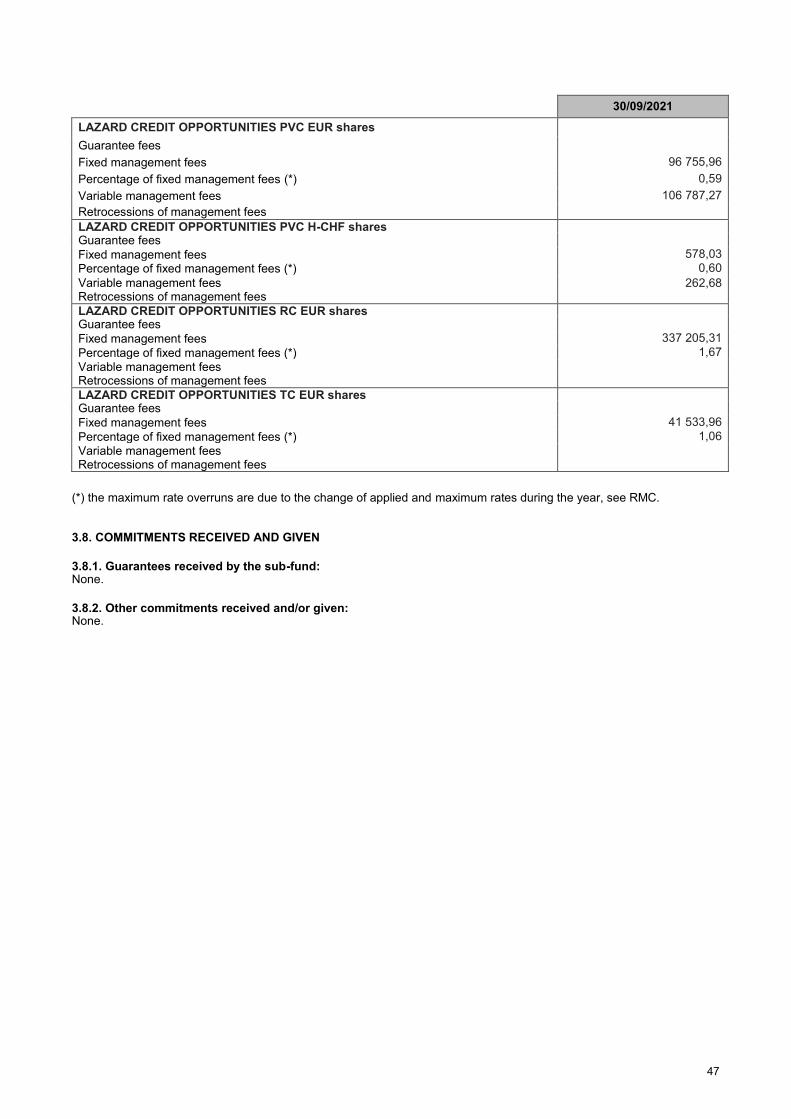
47
30/09/2021
LAZARD CREDIT OPPORTUNITIES PVC EUR shares
Guarantee fees
Fixed management fees 96 755,96
Percentage of fixed management fees (*) 0,59
Variable management fees 106 787,27
Retrocessions of management fees
LAZARD CREDIT OPPORTUNITIES PVC H-CHF shares Guarantee fees
Fixed management fees 578,03
Percentage of fixed management fees (*) 0,60
Variable management fees 262,68 Retrocessions of management fees
LAZARD CREDIT OPPORTUNITIES RC EUR shares Guarantee fees
Fixed management fees 337 205,31
Percentage of fixed management fees (*) 1,67
Variable management fees Retrocessions of management fees
LAZARD CREDIT OPPORTUNITIES TC EUR shares Guarantee fees
Fixed management fees 41 533,96
Percentage of fixed management fees (*) 1,06
Variable management fees Retrocessions of management fees
(*) the maximum rate overruns are due to the change of applied and maximum rates during the year, see RMC. 3.8. COMMITMENTS RECEIVED AND GIVEN
3.8.1. Guarantees received by the sub-fund: None.
3.8.2. Other commitments received and/or given: None.

48
3.9. OTHER INFORMATION 3.9.1. PRESENT VALUE OF SECURITIES HELD TEMPORARILY
30/09/2021
Securities held under repurchase agreements
Borrowed securities
3.9.2. PRESENT VALUE OF SECURITIES REPRESENTING SECURITY DEPOSITS
30/09/2021
Financial instruments given as security and retained under their original classification
Financial instruments received as security and not recorded on the balance sheet
3.9.3. GROUP FINANCIAL INSTRUMENTS HELD IN THE PORTFOLIO
ISIN code Description 30/09/2021
Equities
Bonds
Negotiable debt securities
UCIs 7 854 096,00
FR0010505313 LAZARD EURO CORP HIGH YIELD PC EUR 2 267 892,00
FR0013507027 LAZARD EURO SHORT DURATION HIGH YIELD SRI EVC shares
2 749 150,00
FR0013314440 LAZARD GLOBAL HYBRID BONDS EV EUR 2 837 054,00
Forward financial instruments
Total group securities 7 854 096,00

49
3.10. APPROPRIATION OF DISTRIBUTABLE AMOUNTS
Table of appropriation of distributable income pertaining to net income
30/09/2021 30/09/2020
Remaining amounts to be allocated
Retained earnings 128,73 205,37
Net income 5 230 611,00 3 015 480,20
Total 5 230 739,73 3 015 685,57
30/09/2021 30/09/2020
LAZARD CREDIT OPPORTUNITIES PC EUR shares
Appropriation
Distribution
Balance brought forward for the financial year
Accumulation 3 578 141,19 1 872 677,16
Total 3 578 141,19 1 872 677,16
30/09/2021 30/09/2020
LAZARD CREDIT OPPORTUNITIES PD EUR shares
Appropriation
Distribution 598 837,86 775 991,68
Balance brought forward for the financial year 189,87 176,18
Accumulation
Total 599 027,73 776 167,86
Information on units with dividend rights
Number of units 25 353,000 34 688,944
Dividend per unit 23,62 22,37
Tax credit
Tax credit attached to the distribution of earnings 35,03

50
30/09/2021 30/09/2020
LAZARD CREDIT OPPORTUNITIES PVC EUR shares
Appropriation
Distribution
Balance brought forward for the financial year
Accumulation 432 912,65 2 049,77
Total 432 912,65 2 049,77
30/09/2021 30/09/2020
LAZARD CREDIT OPPORTUNITIES PVC H-CHF shares
Appropriation
Distribution
Balance brought forward for the financial year
Accumulation 3 691,91
Total 3 691,91
30/09/2021 30/09/2020
LAZARD CREDIT OPPORTUNITIES RC EUR shares
Appropriation
Distribution
Balance brought forward for the financial year
Accumulation 482 192,61 300 513,10
Total 482 192,61 300 513,10
30/09/2021 30/09/2020
LAZARD CREDIT OPPORTUNITIES TC EUR shares
Appropriation
Distribution
Balance brought forward for the financial year
Accumulation 134 773,64 64 277,68
Total 134 773,64 64 277,68
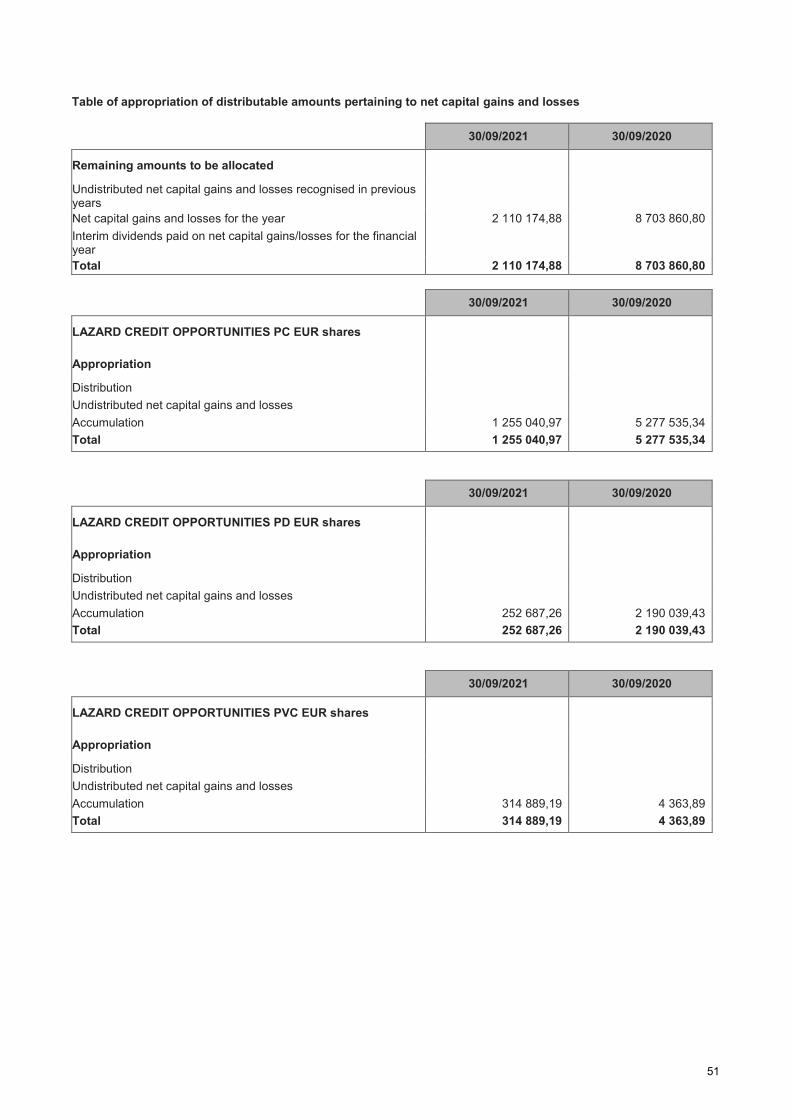
51
Table of appropriation of distributable amounts pertaining to net capital gains and losses
30/09/2021 30/09/2020
Remaining amounts to be allocated
Undistributed net capital gains and losses recognised in previous years
Net capital gains and losses for the year 2 110 174,88 8 703 860,80
Interim dividends paid on net capital gains/losses for the financial year
Total 2 110 174,88 8 703 860,80
30/09/2021 30/09/2020
LAZARD CREDIT OPPORTUNITIES PC EUR shares
Appropriation
Distribution
Undistributed net capital gains and losses
Accumulation 1 255 040,97 5 277 535,34
Total 1 255 040,97 5 277 535,34
30/09/2021 30/09/2020
LAZARD CREDIT OPPORTUNITIES PD EUR shares
Appropriation
Distribution
Undistributed net capital gains and losses
Accumulation 252 687,26 2 190 039,43
Total 252 687,26 2 190 039,43
30/09/2021 30/09/2020
LAZARD CREDIT OPPORTUNITIES PVC EUR shares
Appropriation
Distribution
Undistributed net capital gains and losses
Accumulation 314 889,19 4 363,89
Total 314 889,19 4 363,89
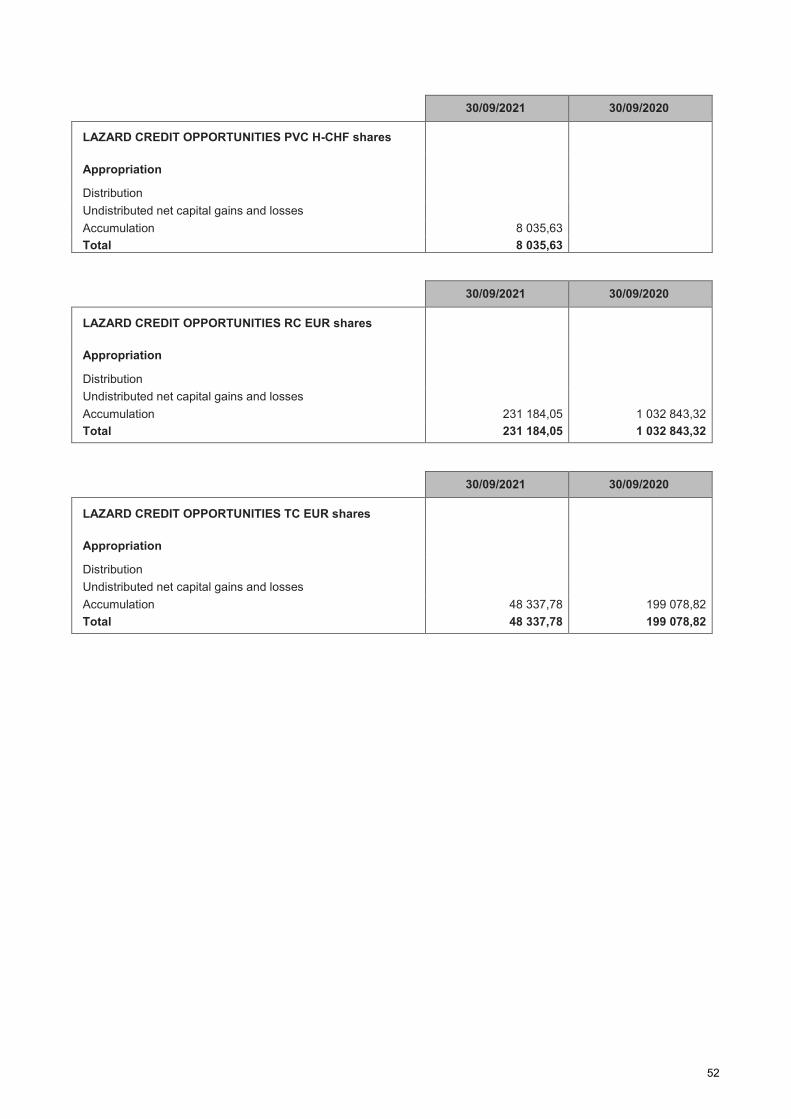
52
30/09/2021 30/09/2020
LAZARD CREDIT OPPORTUNITIES PVC H-CHF shares
Appropriation
Distribution
Undistributed net capital gains and losses
Accumulation 8 035,63
Total 8 035,63
30/09/2021 30/09/2020
LAZARD CREDIT OPPORTUNITIES RC EUR shares
Appropriation
Distribution
Undistributed net capital gains and losses
Accumulation 231 184,05 1 032 843,32
Total 231 184,05 1 032 843,32
30/09/2021 30/09/2020
LAZARD CREDIT OPPORTUNITIES TC EUR shares
Appropriation
Distribution
Undistributed net capital gains and losses
Accumulation 48 337,78 199 078,82
Total 48 337,78 199 078,82
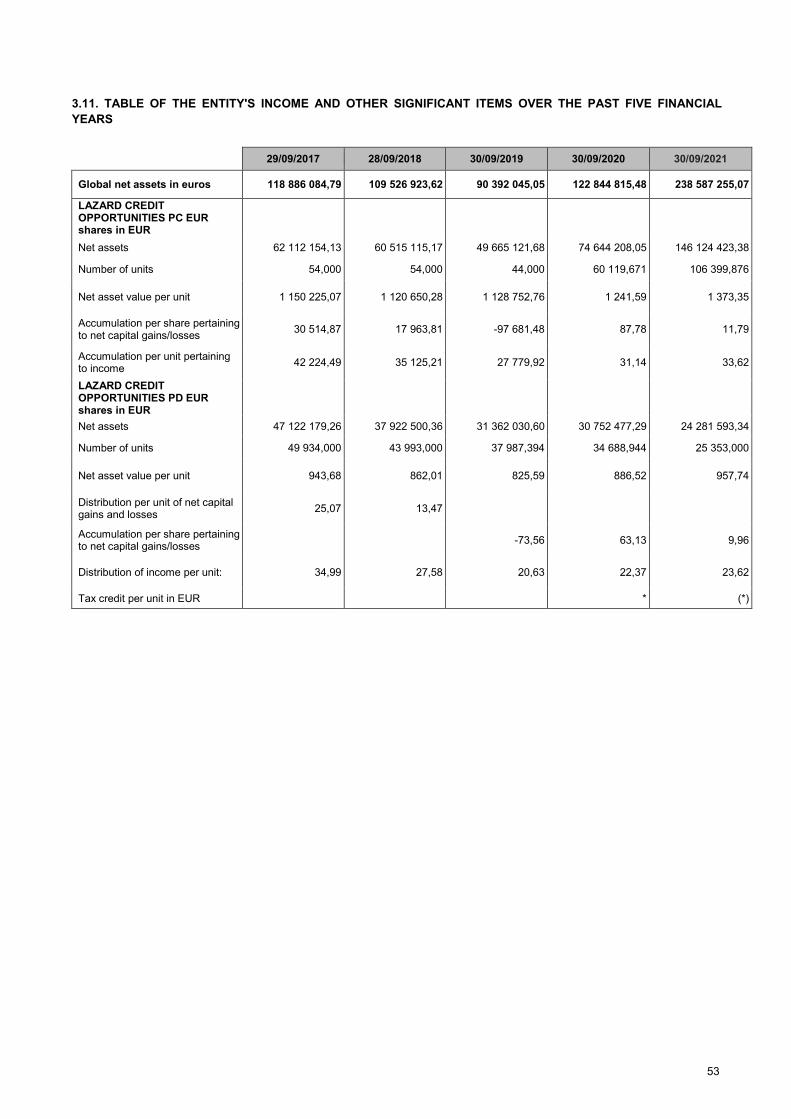
53
3.11. TABLE OF THE ENTITY'S INCOME AND OTHER SIGNIFICANT ITEMS OVER THE PAST FIVE FINANCIAL
YEARS
29/09/2017 28/09/2018 30/09/2019 30/09/2020 30/09/2021
Global net assets in euros 118 886 084,79 109 526 923,62 90 392 045,05 122 844 815,48 238 587 255,07
LAZARD CREDIT OPPORTUNITIES PC EUR shares in EUR
Net assets 62 112 154,13 60 515 115,17 49 665 121,68 74 644 208,05 146 124 423,38
Number of units 54,000 54,000 44,000 60 119,671 106 399,876
Net asset value per unit 1 150 225,07 1 120 650,28 1 128 752,76 1 241,59 1 373,35
Accumulation per share pertaining to net capital gains/losses
30 514,87 17 963,81 -97 681,48 87,78 11,79
Accumulation per unit pertaining to income
42 224,49 35 125,21 27 779,92 31,14 33,62
LAZARD CREDIT OPPORTUNITIES PD EUR shares in EUR
Net assets 47 122 179,26 37 922 500,36 31 362 030,60 30 752 477,29 24 281 593,34
Number of units 49 934,000 43 993,000 37 987,394 34 688,944 25 353,000
Net asset value per unit 943,68 862,01 825,59 886,52 957,74
Distribution per unit of net capital gains and losses
25,07 13,47
Accumulation per share pertaining to net capital gains/losses
-73,56 63,13 9,96
Distribution of income per unit: 34,99 27,58 20,63 22,37 23,62
Tax credit per unit in EUR * (*)
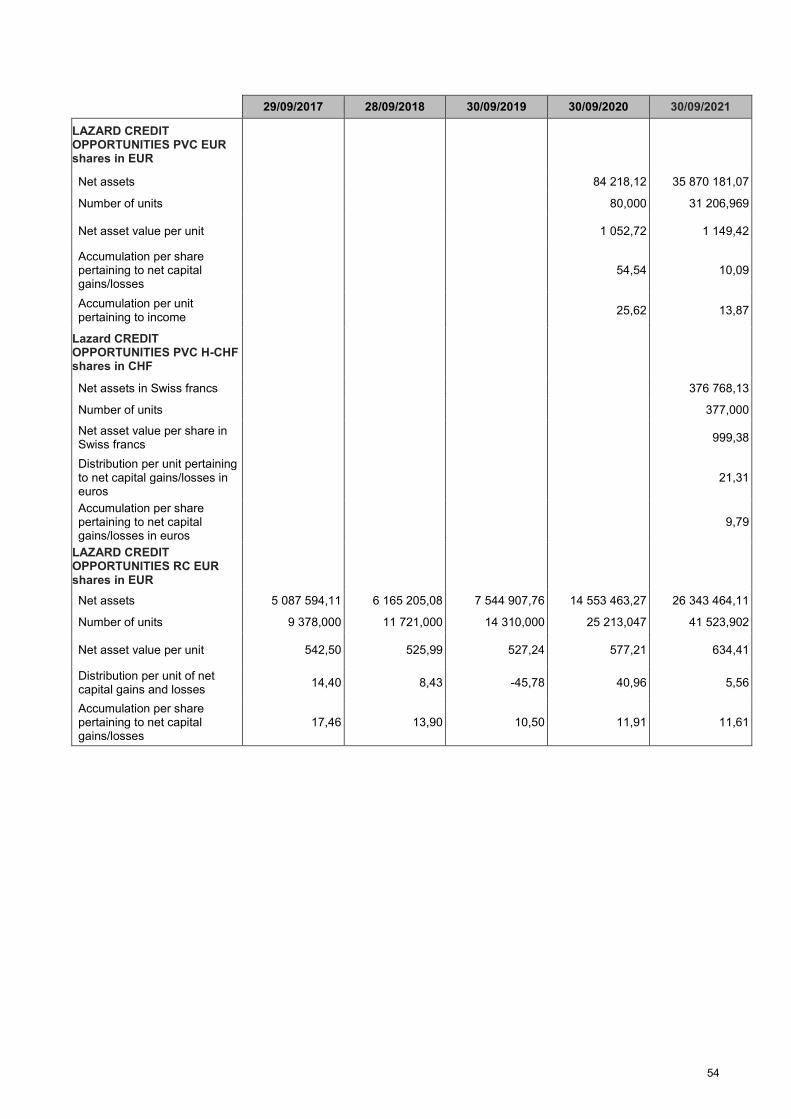
54
29/09/2017 28/09/2018 30/09/2019 30/09/2020 30/09/2021
LAZARD CREDIT OPPORTUNITIES PVC EUR shares in EUR
Net assets 84 218,12 35 870 181,07
Number of units 80,000 31 206,969
Net asset value per unit 1 052,72 1 149,42
Accumulation per share pertaining to net capital gains/losses
54,54 10,09
Accumulation per unit pertaining to income
25,62 13,87
Lazard CREDIT OPPORTUNITIES PVC H-CHF shares in CHF
Net assets in Swiss francs 376 768,13
Number of units 377,000
Net asset value per share in Swiss francs
999,38
Distribution per unit pertaining to net capital gains/losses in euros
21,31
Accumulation per share pertaining to net capital gains/losses in euros
9,79
LAZARD CREDIT OPPORTUNITIES RC EUR shares in EUR
Net assets 5 087 594,11 6 165 205,08 7 544 907,76 14 553 463,27 26 343 464,11
Number of units 9 378,000 11 721,000 14 310,000 25 213,047 41 523,902
Net asset value per unit 542,50 525,99 527,24 577,21 634,41
Distribution per unit of net capital gains and losses
14,40 8,43 -45,78 40,96 5,56
Accumulation per share pertaining to net capital gains/losses
17,46 13,90 10,50 11,91 11,61
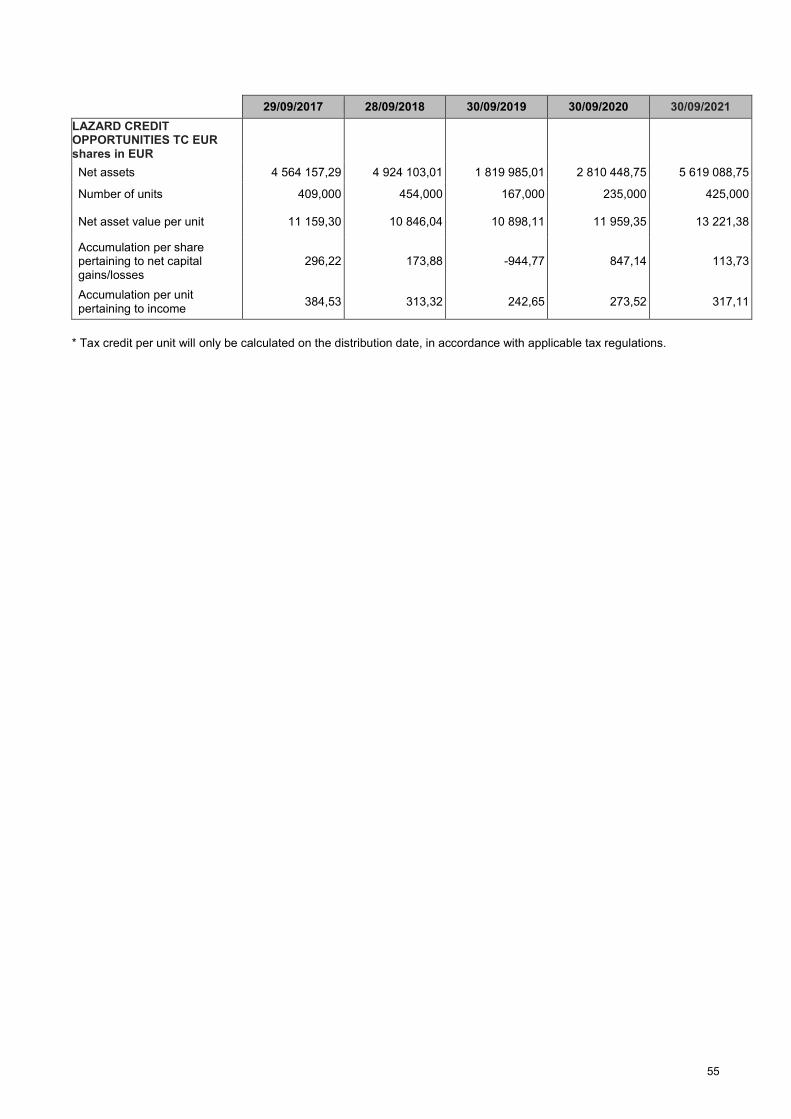
55
29/09/2017 28/09/2018 30/09/2019 30/09/2020 30/09/2021
LAZARD CREDIT OPPORTUNITIES TC EUR shares in EUR
Net assets 4 564 157,29 4 924 103,01 1 819 985,01 2 810 448,75 5 619 088,75
Number of units 409,000 454,000 167,000 235,000 425,000
Net asset value per unit 11 159,30 10 846,04 10 898,11 11 959,35 13 221,38
Accumulation per share pertaining to net capital gains/losses
296,22 173,88 -944,77 847,14 113,73
Accumulation per unit pertaining to income
384,53 313,32 242,65 273,52 317,11
* Tax credit per unit will only be calculated on the distribution date, in accordance with applicable tax regulations.
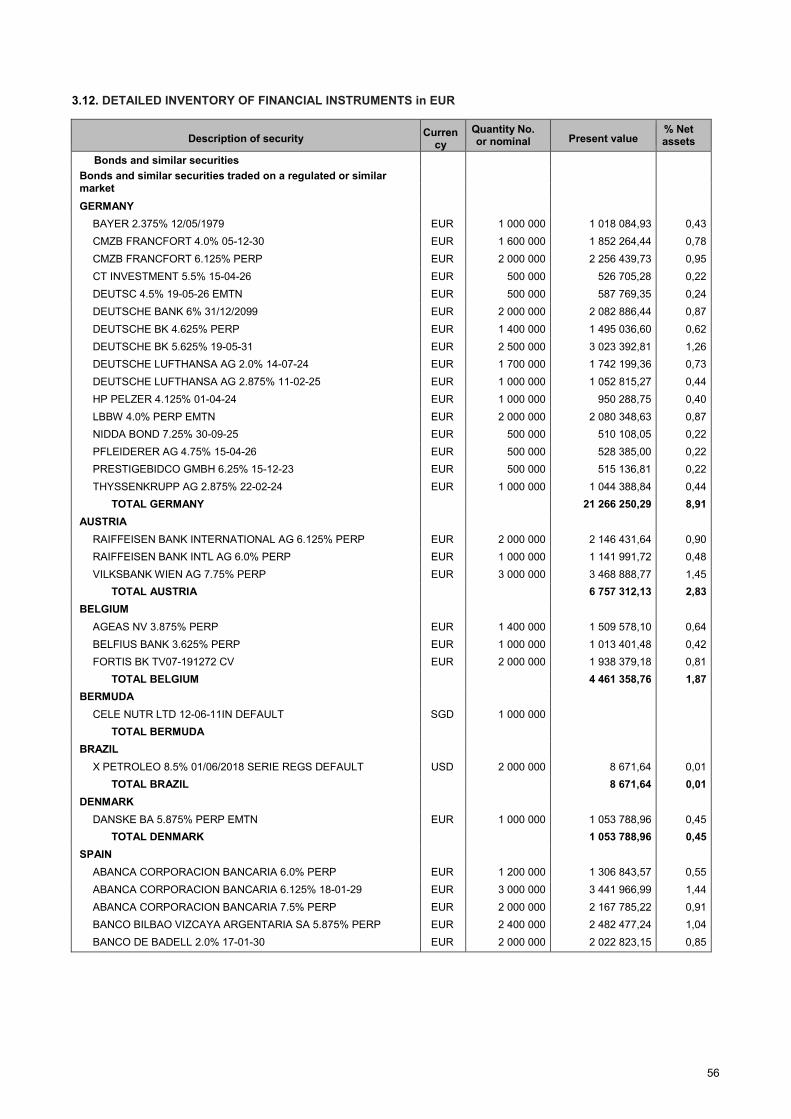
56
3.12. DETAILED INVENTORY OF FINANCIAL INSTRUMENTS in EUR
Description of security Curren
cy
Quantity No. or nominal Present value
% Net assets
Bonds and similar securities
Bonds and similar securities traded on a regulated or similar market
GERMANY
BAYER 2.375% 12/05/1979 EUR 1 000 000 1 018 084,93 0,43
CMZB FRANCFORT 4.0% 05-12-30 EUR 1 600 000 1 852 264,44 0,78
CMZB FRANCFORT 6.125% PERP EUR 2 000 000 2 256 439,73 0,95
CT INVESTMENT 5.5% 15-04-26 EUR 500 000 526 705,28 0,22
DEUTSC 4.5% 19-05-26 EMTN EUR 500 000 587 769,35 0,24
DEUTSCHE BANK 6% 31/12/2099 EUR 2 000 000 2 082 886,44 0,87
DEUTSCHE BK 4.625% PERP EUR 1 400 000 1 495 036,60 0,62
DEUTSCHE BK 5.625% 19-05-31 EUR 2 500 000 3 023 392,81 1,26
DEUTSCHE LUFTHANSA AG 2.0% 14-07-24 EUR 1 700 000 1 742 199,36 0,73
DEUTSCHE LUFTHANSA AG 2.875% 11-02-25 EUR 1 000 000 1 052 815,27 0,44
HP PELZER 4.125% 01-04-24 EUR 1 000 000 950 288,75 0,40
LBBW 4.0% PERP EMTN EUR 2 000 000 2 080 348,63 0,87
NIDDA BOND 7.25% 30-09-25 EUR 500 000 510 108,05 0,22
PFLEIDERER AG 4.75% 15-04-26 EUR 500 000 528 385,00 0,22
PRESTIGEBIDCO GMBH 6.25% 15-12-23 EUR 500 000 515 136,81 0,22
THYSSENKRUPP AG 2.875% 22-02-24 EUR 1 000 000 1 044 388,84 0,44
TOTAL GERMANY 21 266 250,29 8,91
AUSTRIA
RAIFFEISEN BANK INTERNATIONAL AG 6.125% PERP EUR 2 000 000 2 146 431,64 0,90
RAIFFEISEN BANK INTL AG 6.0% PERP EUR 1 000 000 1 141 991,72 0,48
VILKSBANK WIEN AG 7.75% PERP EUR 3 000 000 3 468 888,77 1,45
TOTAL AUSTRIA 6 757 312,13 2,83
BELGIUM
AGEAS NV 3.875% PERP EUR 1 400 000 1 509 578,10 0,64
BELFIUS BANK 3.625% PERP EUR 1 000 000 1 013 401,48 0,42
FORTIS BK TV07-191272 CV EUR 2 000 000 1 938 379,18 0,81
TOTAL BELGIUM 4 461 358,76 1,87
BERMUDA
CELE NUTR LTD 12-06-11IN DEFAULT SGD 1 000 000
TOTAL BERMUDA
BRAZIL
X PETROLEO 8.5% 01/06/2018 SERIE REGS DEFAULT USD 2 000 000 8 671,64 0,01
TOTAL BRAZIL 8 671,64 0,01
DENMARK
DANSKE BA 5.875% PERP EMTN EUR 1 000 000 1 053 788,96 0,45
TOTAL DENMARK 1 053 788,96 0,45
SPAIN
ABANCA CORPORACION BANCARIA 6.0% PERP EUR 1 200 000 1 306 843,57 0,55
ABANCA CORPORACION BANCARIA 6.125% 18-01-29 EUR 3 000 000 3 441 966,99 1,44
ABANCA CORPORACION BANCARIA 7.5% PERP EUR 2 000 000 2 167 785,22 0,91
BANCO BILBAO VIZCAYA ARGENTARIA SA 5.875% PERP EUR 2 400 000 2 482 477,24 1,04
BANCO DE BADELL 2.0% 17-01-30 EUR 2 000 000 2 022 823,15 0,85
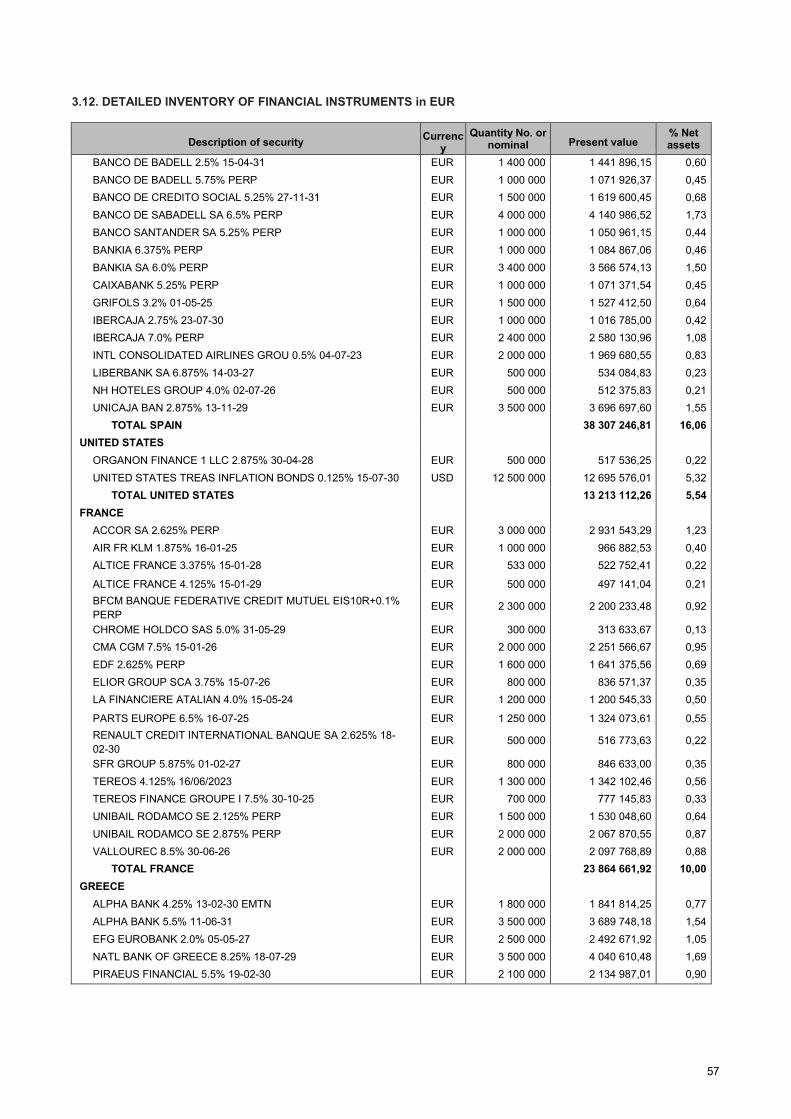
57
3.12. DETAILED INVENTORY OF FINANCIAL INSTRUMENTS in EUR
Description of security Currenc
y
Quantity No. or nominal Present value
% Net assets
BANCO DE BADELL 2.5% 15-04-31 EUR 1 400 000 1 441 896,15 0,60
BANCO DE BADELL 5.75% PERP EUR 1 000 000 1 071 926,37 0,45
BANCO DE CREDITO SOCIAL 5.25% 27-11-31 EUR 1 500 000 1 619 600,45 0,68
BANCO DE SABADELL SA 6.5% PERP EUR 4 000 000 4 140 986,52 1,73
BANCO SANTANDER SA 5.25% PERP EUR 1 000 000 1 050 961,15 0,44
BANKIA 6.375% PERP EUR 1 000 000 1 084 867,06 0,46
BANKIA SA 6.0% PERP EUR 3 400 000 3 566 574,13 1,50
CAIXABANK 5.25% PERP EUR 1 000 000 1 071 371,54 0,45
GRIFOLS 3.2% 01-05-25 EUR 1 500 000 1 527 412,50 0,64
IBERCAJA 2.75% 23-07-30 EUR 1 000 000 1 016 785,00 0,42
IBERCAJA 7.0% PERP EUR 2 400 000 2 580 130,96 1,08
INTL CONSOLIDATED AIRLINES GROU 0.5% 04-07-23 EUR 2 000 000 1 969 680,55 0,83
LIBERBANK SA 6.875% 14-03-27 EUR 500 000 534 084,83 0,23
NH HOTELES GROUP 4.0% 02-07-26 EUR 500 000 512 375,83 0,21
UNICAJA BAN 2.875% 13-11-29 EUR 3 500 000 3 696 697,60 1,55
TOTAL SPAIN 38 307 246,81 16,06
UNITED STATES
ORGANON FINANCE 1 LLC 2.875% 30-04-28 EUR 500 000 517 536,25 0,22
UNITED STATES TREAS INFLATION BONDS 0.125% 15-07-30 USD 12 500 000 12 695 576,01 5,32
TOTAL UNITED STATES 13 213 112,26 5,54
FRANCE
ACCOR SA 2.625% PERP EUR 3 000 000 2 931 543,29 1,23
AIR FR KLM 1.875% 16-01-25 EUR 1 000 000 966 882,53 0,40
ALTICE FRANCE 3.375% 15-01-28 EUR 533 000 522 752,41 0,22
ALTICE FRANCE 4.125% 15-01-29 EUR 500 000 497 141,04 0,21
BFCM BANQUE FEDERATIVE CREDIT MUTUEL EIS10R+0.1%
PERP EUR 2 300 000 2 200 233,48 0,92
CHROME HOLDCO SAS 5.0% 31-05-29 EUR 300 000 313 633,67 0,13
CMA CGM 7.5% 15-01-26 EUR 2 000 000 2 251 566,67 0,95
EDF 2.625% PERP EUR 1 600 000 1 641 375,56 0,69
ELIOR GROUP SCA 3.75% 15-07-26 EUR 800 000 836 571,37 0,35
LA FINANCIERE ATALIAN 4.0% 15-05-24 EUR 1 200 000 1 200 545,33 0,50
PARTS EUROPE 6.5% 16-07-25 EUR 1 250 000 1 324 073,61 0,55
RENAULT CREDIT INTERNATIONAL BANQUE SA 2.625% 18-
02-30 EUR 500 000 516 773,63 0,22
SFR GROUP 5.875% 01-02-27 EUR 800 000 846 633,00 0,35
TEREOS 4.125% 16/06/2023 EUR 1 300 000 1 342 102,46 0,56
TEREOS FINANCE GROUPE I 7.5% 30-10-25 EUR 700 000 777 145,83 0,33
UNIBAIL RODAMCO SE 2.125% PERP EUR 1 500 000 1 530 048,60 0,64
UNIBAIL RODAMCO SE 2.875% PERP EUR 2 000 000 2 067 870,55 0,87
VALLOUREC 8.5% 30-06-26 EUR 2 000 000 2 097 768,89 0,88
TOTAL FRANCE 23 864 661,92 10,00
GREECE
ALPHA BANK 4.25% 13-02-30 EMTN EUR 1 800 000 1 841 814,25 0,77
ALPHA BANK 5.5% 11-06-31 EUR 3 500 000 3 689 748,18 1,54
EFG EUROBANK 2.0% 05-05-27 EUR 2 500 000 2 492 671,92 1,05
NATL BANK OF GREECE 8.25% 18-07-29 EUR 3 500 000 4 040 610,48 1,69
PIRAEUS FINANCIAL 5.5% 19-02-30 EUR 2 100 000 2 134 987,01 0,90

58
3.12. DETAILED INVENTORY OF FINANCIAL INSTRUMENTS in EUR
Description of security Currenc
y
Quantity No. or nominal Present value
% Net assets
PIRAEUS FINANCIAL 8.75% PERP EUR 3 200 000 3 347 225,01 1,40
PIRAEUS FINANCIAL 9.75% 26-06-29 EUR 2 000 000 2 250 274,66 0,94
TOTAL GREECE 19 797 331,51 8,29
CAYMAN ISLANDS
CHINA MILK 0% 05/01/12 CV *USD USD 1 000 000
TOTAL CAYMAN ISLANDS
IRELAND
BANK OF CYPRUS 6.625% 23-10-31 EUR 2 200 000 2 348 196,67 0,99
TOTAL IRELAND 2 348 196,67 0,99
ITALY
AUTOSTRADE PER L ITALILIA 1.75% 01-02-27 EUR 1 500 000 1 571 582,36 0,66
BANCA IFIS 4.5% 17-10-27 EMTN EUR 2 000 000 2 123 794,52 0,89
BANCO BPM 2.875% 29-06-31 EMTN EUR 2 200 000 2 224 948,90 0,93
BANCO BPM 4.25% 01-10-29 EUR 1 500 000 1 600 963,97 0,67
BANCO BPM 6.125% PERP EUR 1 000 000 1 069 043,02 0,45
BANCO BPM 8.75% PERP EMTN EUR 1 000 000 1 156 119,67 0,48
CORDUSIO RMBS 3 SRL 5.0% 05-04-27 USD 3 000 000 2 704 869,35 1,13
DIOCLE SPA E3R+3.875% 30-06-26 EUR 1 000 000 798 039,15 0,34
ENI 3.375% PERP EUR 1 500 000 1 651 024,21 0,69
FONDIARIA SAI 5.75% 31-12-99 EUR 1 500 000 1 685 825,55 0,70
GAMMA BID 5.125% 15-07-25 EUR 625 000 646 150,95 0,27
INTE 3.75% PERP EUR 2 000 000 1 988 074,57 0,83
LEATHER 2 E3R+4.5% 30-09-28 EUR 1 200 000 1 204 020,00 0,50
MEDIOBANCABCA CREDITO FINANZ 2.3% 23-11-30 EUR 450 000 470 758,19 0,20
REKEEP 7.25% 01/02/2026 EUR 600 000 656 344,50 0,28
UNICREDIT 3,875% PERP EMTN EUR 1 000 000 992 732,54 0,42
UNICREDIT 4.45% PERP EMTN EUR 1 000 000 1 048 791,04 0,44
UNICREDIT SPA 6.625% PERP EUR 2 000 000 2 172 858,69 0,91
UNICREDIT SPA FIX PERP EUR 2 500 000 2 710 340,16 1,14
TOTAL ITALY 28 476 281,34 11,93
JERSEY
ADIE GLOB HOL 3.5% 15-08-24 EUR 1 000 000 1 015 515,43 0,42
TOTAL JERSEY 1 015 515,43 0,42
LUXEMBOURG
ALTICE FINANCING 2.25% 15-01-25 EUR 2 000 000 1 939 145,00 0,82
ALTICE FINANCING 4.25% 15-08-29 EUR 900 000 890 153,00 0,37
ALTICE FRANCE 8.0% 15-05-27 EUR 450 000 493 962,25 0,20
ARD FINANCE SA 5.0% 30-06-27 EUR 600 000 632 532,33 0,26
AROUNDTOWN 1.625% PERP EMTN EUR 1 400 000 1 369 285,63 0,58
BK LC LUX FINCO1 SARL 5.25% 30-04-29 EUR 1 000 000 1 061 929,72 0,45
CIRSA FINANCE INTL SARL 4.5% 15-03-27 EUR 1 000 000 992 580,00 0,42
CIRSA FINANCE INTL SARL 6.25% 20-12-23 EUR 1 000 000 879 155,08 0,37
CRYSTAL ALMOND SA RL 4.25% 15-10-24 EUR 967 000 1 008 292,24 0,43
FLAMINGO LUX II SCA 5.0% 31-03-29 EUR 500 000 497 065,28 0,21
GOLDEN GOOSE E3R+4.875% 14-05-27 EUR 800 000 799 108,67 0,33
HERENS MIDCO SARL 5.25% 15-05-29 EUR 500 000 495 884,25 0,20

59
3.12. DETAILED INVENTORY OF FINANCIAL INSTRUMENTS in EUR
Description of security Currency
Quantity No. or nominal
Present value % Net assets
HSE FINANCE SARL 5.625% 15-10-26 EUR 500 000 532 732,50 0,22
KLEOPATRA FINCO SARL 4.25% 01-03-26 EUR 700 000 687 953,58 0,28
PICARD BOND 5.375% 01-07-27 EUR 875 000 895 514,01 0,38
PLT VII FINANCE SA RL 4.625% 05-01-26 EUR 1 000 000 1 039 854,31 0,44
ROSSINI SARL 6.75% 30-10-25 EUR 250 000 266 921,25 0,11
SES 2.875% PERP EUR 1 000 000 1 022 858,15 0,43
TOTAL LUXEMBOURG 15 504 927,25 6,50
MEXICO
PETROLEOS MEXICANOS 2.5% 24-11-22 EUR 1 500 000 1 556 860,27 0,66
TOTAL MEXICO 1 556 860,27 0,66
PANAMA
CARN CORP 1.875% 07-11-22 EUR 2 000 000 2 025 426,85 0,85
CARNIVAL CORPORATION 10.125% 01-02-26 EUR 1 000 000 1 169 063,75 0,49
TOTAL PANAMA 3 194 490,60 1,34
NETHERLANDS
ABERTIS FINANCE BV 3.248% PERP EUR 1 100 000 1 152 909,27 0,49
ATHORA NETHERLANDS NV 2.25% 15-07-31 EUR 1 000 000 1 027 573,15 0,43
DUFRY ONE B.V 2.5% 31-12-24 EUR 1 500 000 1 503 279,17 0,63
IPD 3 BV 5.5% 01-12-25 EUR 1 000 000 1 066 511,67 0,44
MAXEDA DIY HOLDING BV 5.875% 01-10-26 EUR 1 067 000 1 097 231,18 0,46
OCI NV 3.625% 15-10-25 EUR 100 000 105 672,55 0,05
PROMONTORIA HOLDING 264 BV 6.75% 15-08-23 EUR 600 000 610 225,50 0,26
REPSOL INTL FINANCE BV 4.247% PERP EUR 750 000 849 024,59 0,35
TELEFONICA EUROPE BV 2.875% PERP EUR 500 000 515 813,84 0,22
TELEFONICA EUROPE BV 4.375% PERP EUR 3 000 000 3 331 056,16 1,39
TEVA PHARMACEUTICAL FINANCE II BV 3.25% 15-04-22 EUR 1 900 000 1 940 996,19 0,82
TEVA PHARMACEUTICAL FINANCE II BV 6.0% 31-01-25 EUR 1 500 000 1 641 332,50 0,68
TOTAL NETHERLANDS 14 841 625,77 6,22
PORTUGAL
BCP 3.871% 27-03-30 EMTN EUR 1 500 000 1 577 664,70 0,66
BCP 4.5% 07-12-27 EMTN EUR 2 000 000 2 147 269,18 0,90
BCP 9.25% PERP EUR 1 000 000 1 074 828,32 0,45
BES FINANCE LTD EURIBOR 3 MOIS REV +2.65 31/12/2099
DEFAULT EUR 2 000 000 3 273,28
CAIXA GERAL DE DEPOSITOS 10.75% PERP EUR 2 000 000 2 095 148,89 0,88
FIDELIDADE COMPANHIADE SEGUROS 4.25% 04-09-31 EUR 1 400 000 1 451 559,41 0,61
NOVO BAN 8.5% 06-07-28 EUR 2 000 000 2 103 707,81 0,88
TOTAL PORTUGAL 10 453 451,59 4,38
UNITED KINGDOM
BP CAP MK 3.625% PERP EUR 1 000 000 1 095 135,83 0,46
CYBG PLC 8.0% PERP GBP 2 000 000 2 517 892,73 1,06
EG GLOBAL FINANCE 6.25% 30-10-25 EUR 950 000 998 712,31 0,42
INEOS FINANCE 3.375% 31-03-26 EUR 1 844 000 1 912 187,61 0,80
INEOS QUATTRO FINANCE 1 3.75% 15-07-26 EUR 1 000 000 1 037 919,17 0,43
VICTORIA 3.625% 24-08-26 EUR 550 000 565 781,49 0,23
YULE CATTO AND 3.875% 01-07-25 EUR 250 000 261 638,85 0,11
TOTAL UNITED KINGDOM 8 389 267,99 3,51

60
3.12. DETAILED INVENTORY OF FINANCIAL INSTRUMENTS in EUR
Description of security Currency
Quantity No. or nominal
Present value % Net assets
SWEDEN
ASSEMBLIN FINANCING E3R+5.0% 15-05-25 EUR 500 000 505 289,45 0,21
CASTELLUM AB 3.125% PERP EUR 1 700 000 1 695 775,03 0,71
UNILABS SUBHOLDINGS AB 5.75% 15-05-25 EUR 1 300 000 1 351 059,31 0,57
TOTAL SWEDEN 3 552 123,79 1,49
TOTAL Bonds and similar securities traded on a regulated or similar market
218 062 474,98 91,40
TOTAL Bonds and similar securities 218 062 474,98 91,40
Undertakings for collective investment
General UCITS and general AIFs aimed at non-professionals and their equivalent in other countries
FRANCE
LAZARD EURO CORP HIGH YIELD PC EUR EUR 1 200 2 267 892,00 0,95
LAZARD EURO SHORT DURATION HIGH YIELD SRI EVC shares EUR 2 500 2 749 150,00 1,15
LAZ GL HYBR BD EV EUR EUR 25 2 837 054,00 1,19
TOTAL FRANCE 7 854 096,00 3,29
TOTAL general UCITS and general AIFs aimed at non-professionals and their equivalent in other countries
7 854 096,00 3,29
TOTAL Undertakings for collective investment 7 854 096,00 3,29
Forward financial instruments
Futures contracts
Futures contracts on a regulated or equivalent market
CBOT USUL 30A 1221 USD -150 40 446,09 0,02
FGBL BUND 10A 1221 EUR -250 807 500,00 0,34
TU CBOT UST 2 1221 USD -700 32 356,63 0,01
US 10YR NOTE 1221 USD -110 123 090,94 0,05
XEUR FGBX BUX 1221 EUR -120 1 095 400,00 0,46
TOTAL Futures contracts on a regulated or equivalent market
2 098 793,66 0,88
TOTAL Futures contracts 2 098 793,66 0,88
TOTAL Forward financial instruments 2 098 793,66 0,88
Margin call
CACEIS MARGIN CALL USD -227 030,67 -195 893,41 -0,08
CACEIS MARGIN CALL EUR -1 902 900 -1 902 900,00 -0,80
TOTAL Margin call -2 098 793,41 -0,88
Receivables 4 477 571,61 1,88
Liabilities -967 788,51 -0,41
Financial accounts 9 160 900,74 3,84
Net assets 238 587 255,07 100,00
LAZARD CREDIT OPPORTUNITIES PD EUR shares EUR 25 353,000 957,74
LAZARD CREDIT OPPORTUNITIES PC EUR shares EUR 106 399,876 1 373,35
LAZARD CREDIT OPPORTUNITIES TC EUR shares EUR 425,000 13 221,38
LAZARD CREDIT OPPORTUNITIES PVC EUR shares EUR 31 206,969 1 149,42
LAZARD CREDIT OPPORTUNITIES PVC H-CHF shares CHF 377,000 999,38
LAZARD CREDIT OPPORTUNITIES RC EUR shares EUR 41 523,902 634,41

61
ADDITIONAL INFORMATION ON THE TAX REGIME APPLICABLE TO INTEREST PAYMENTS Breakdown of interest: LAZARD CREDIT OPPORTUNITIES PD EUR shares
NET OVERALL CURRENCY
NET PER UNIT CURRENCY
Revenue subject to non-definitive withholding tax 598 584,33 EUR 23,61 EUR
Equities eligible for a tax allowance and
subject to non-definitive withholding tax 253,53 EUR 0,01 EUR
Other income not eligible for a tax allowance and subject to non-definitive withholding tax
Non-declarable and non-taxable income
Amounts paid out in relation to capital gains and losses
TOTAL 598 837,86 EUR 23,62 EUR

62
TEXT OF RESOLUTIONS
LAZARD FUNDS French open-end investment company (Société d'Investissement à Capital Variable - SICAV)
Registered office: 10,avenue Percier - 75008 Paris Paris Trade and Companies Register no. 484 947 627
RESOLUTION ON THE ALLOCATION OF DISTRIBUTABLE INCOME PROPOSED TO THE
ORDINARY SHAREHOLDERS’ MEETING FOR THE SUB-FUND LAZARD CREDIT OPPORTUNITIES
FINANCIAL YEAR ENDED 30 September 2021
Second resolution
The Shareholders’ Meeting approves the distributable income for the financial year, which amounts to: €5 230 611,00 Distributable amount pertaining to net income €2 110 174,88 Distributable amount pertaining to net capital gains and losses
and decides that they shall be allocated as follows:
1) Distributable amount pertaining to net income - RC shares: Accumulation: €482 192,61 - TC shares: Accumulation: €134 773,64 - PC shares: Accumulation: €3 578 141,19 - PVC shares: Accumulation: €432 912,65 - PVC H-CHF shares Accumulation: CHF 3 691,91 - PD shares: Distribution: €598 837,86
Each shareholder holding PD EUR shares on the detachment date will receive a dividend of €23,62 which will be detached on January 20th, 2022 and paid on January 24th, 2022.
2) Distributable amount pertaining to net capital gains and losses - RC shares: Accumulation: €231 184,05 - TC shares: Accumulation: €48 337,78 - PC shares: Accumulation: €1 255 040,97 - PVC shares: Accumulation: €314 889,19 - PVC H-CHF shares Accumulation: CHF 8 035,63 - PD shares: Accumulation: €252 687,26
Reminder of amounts distributed from previous years' results Unit amount/share
- 2020 €22,37 PD shares - 2019 €20,63 PD shares - 2018 €27,58 PD shares - 2017 €34,99 PD shares
LAZARD EURO SHORT DURATION HIGH YIELD
SRI Sub-fund
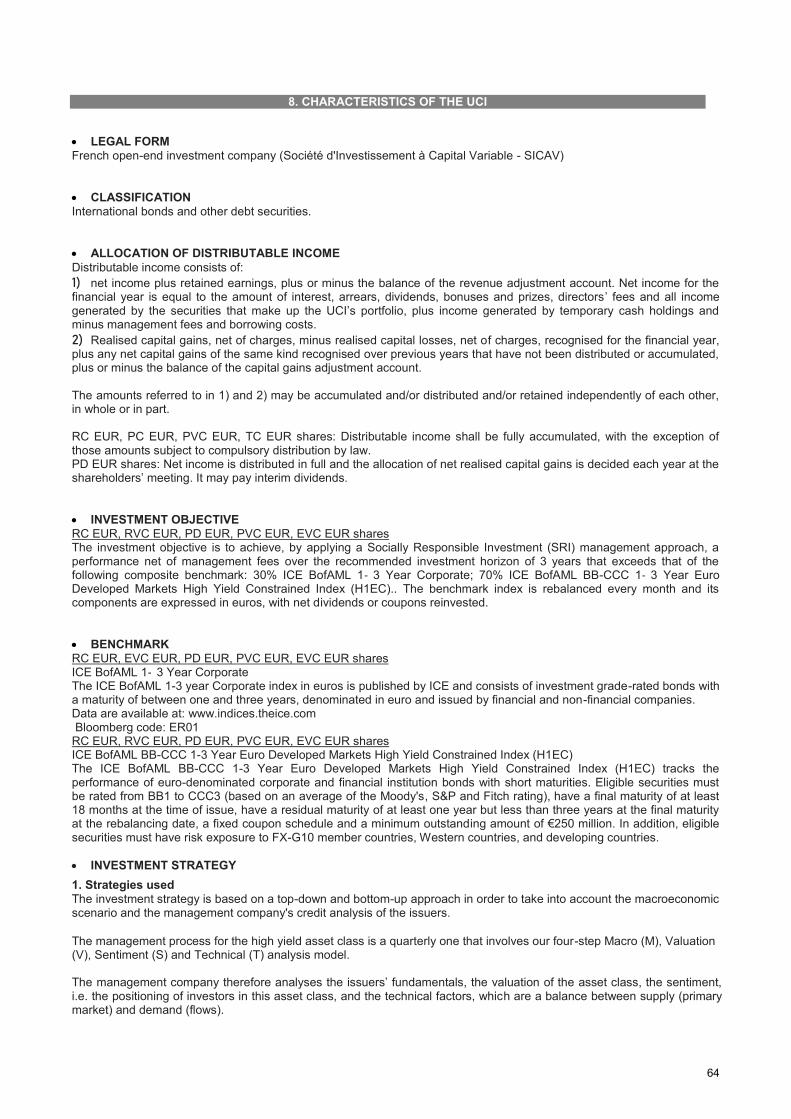
64
8. CHARACTERISTICS OF THE UCI
LEGAL FORM
French open-end investment company (Société d'Investissement à Capital Variable - SICAV)
CLASSIFICATION
International bonds and other debt securities.
ALLOCATION OF DISTRIBUTABLE INCOME
Distributable income consists of:
1) net income plus retained earnings, plus or minus the balance of the revenue adjustment account. Net income for the financial year is equal to the amount of interest, arrears, dividends, bonuses and prizes, directors’ fees and all income generated by the securities that make up the UCI’s portfolio, plus income generated by temporary cash holdings and minus management fees and borrowing costs.
2) Realised capital gains, net of charges, minus realised capital losses, net of charges, recognised for the financial year, plus any net capital gains of the same kind recognised over previous years that have not been distributed or accumulated, plus or minus the balance of the capital gains adjustment account. The amounts referred to in 1) and 2) may be accumulated and/or distributed and/or retained independently of each other, in whole or in part. RC EUR, PC EUR, PVC EUR, TC EUR shares: Distributable income shall be fully accumulated, with the exception of those amounts subject to compulsory distribution by law. PD EUR shares: Net income is distributed in full and the allocation of net realised capital gains is decided each year at the shareholders’ meeting. It may pay interim dividends.
INVESTMENT OBJECTIVE
RC EUR, RVC EUR, PD EUR, PVC EUR, EVC EUR shares The investment objective is to achieve, by applying a Socially Responsible Investment (SRI) management approach, a performance net of management fees over the recommended investment horizon of 3 years that exceeds that of the following composite benchmark: 30% ICE BofAML 1‑ 3 Year Corporate; 70% ICE BofAML BB-CCC 1‑ 3 Year Euro Developed Markets High Yield Constrained Index (H1EC).. The benchmark index is rebalanced every month and its components are expressed in euros, with net dividends or coupons reinvested.
BENCHMARK
RC EUR, EVC EUR, PD EUR, PVC EUR, EVC EUR shares ICE BofAML 1‑ 3 Year Corporate The ICE BofAML 1-3 year Corporate index in euros is published by ICE and consists of investment grade-rated bonds with a maturity of between one and three years, denominated in euro and issued by financial and non-financial companies. Data are available at: www.indices.theice.com Bloomberg code: ER01 RC EUR, RVC EUR, PD EUR, PVC EUR, EVC EUR shares ICE BofAML BB-CCC 1-3 Year Euro Developed Markets High Yield Constrained Index (H1EC) The ICE BofAML BB-CCC 1-3 Year Euro Developed Markets High Yield Constrained Index (H1EC) tracks the performance of euro-denominated corporate and financial institution bonds with short maturities. Eligible securities must be rated from BB1 to CCC3 (based on an average of the Moody's, S&P and Fitch rating), have a final maturity of at least 18 months at the time of issue, have a residual maturity of at least one year but less than three years at the final maturity at the rebalancing date, a fixed coupon schedule and a minimum outstanding amount of €250 million. In addition, eligible securities must have risk exposure to FX-G10 member countries, Western countries, and developing countries.
INVESTMENT STRATEGY
1. Strategies used
The investment strategy is based on a top-down and bottom-up approach in order to take into account the macroeconomic scenario and the management company's credit analysis of the issuers.
The management process for the high yield asset class is a quarterly one that involves our four-step Macro (M), Valuation (V), Sentiment (S) and Technical (T) analysis model. The management company therefore analyses the issuers’ fundamentals, the valuation of the asset class, the sentiment, i.e. the positioning of investors in this asset class, and the technical factors, which are a balance between supply (primary market) and demand (flows).
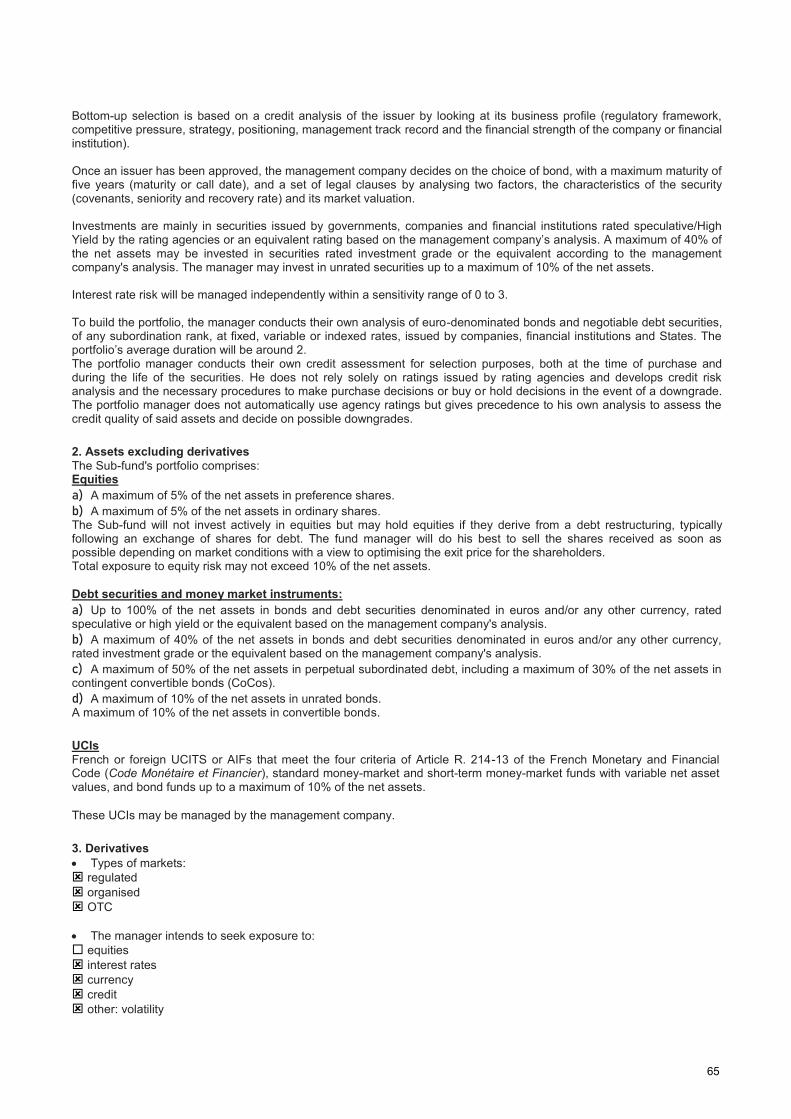
65
Bottom-up selection is based on a credit analysis of the issuer by looking at its business profile (regulatory framework, competitive pressure, strategy, positioning, management track record and the financial strength of the company or financial institution). Once an issuer has been approved, the management company decides on the choice of bond, with a maximum maturity of five years (maturity or call date), and a set of legal clauses by analysing two factors, the characteristics of the security (covenants, seniority and recovery rate) and its market valuation. Investments are mainly in securities issued by governments, companies and financial institutions rated speculative/High Yield by the rating agencies or an equivalent rating based on the management company’s analysis. A maximum of 40% of the net assets may be invested in securities rated investment grade or the equivalent according to the management company's analysis. The manager may invest in unrated securities up to a maximum of 10% of the net assets. Interest rate risk will be managed independently within a sensitivity range of 0 to 3. To build the portfolio, the manager conducts their own analysis of euro-denominated bonds and negotiable debt securities, of any subordination rank, at fixed, variable or indexed rates, issued by companies, financial institutions and States. The portfolio’s average duration will be around 2. The portfolio manager conducts their own credit assessment for selection purposes, both at the time of purchase and during the life of the securities. He does not rely solely on ratings issued by rating agencies and develops credit risk analysis and the necessary procedures to make purchase decisions or buy or hold decisions in the event of a downgrade. The portfolio manager does not automatically use agency ratings but gives precedence to his own analysis to assess the credit quality of said assets and decide on possible downgrades.
2. Assets excluding derivatives
The Sub-fund's portfolio comprises: Equities
a) A maximum of 5% of the net assets in preference shares.
b) A maximum of 5% of the net assets in ordinary shares. The Sub-fund will not invest actively in equities but may hold equities if they derive from a debt restructuring, typically following an exchange of shares for debt. The fund manager will do his best to sell the shares received as soon as possible depending on market conditions with a view to optimising the exit price for the shareholders. Total exposure to equity risk may not exceed 10% of the net assets.
Debt securities and money market instruments:
a) Up to 100% of the net assets in bonds and debt securities denominated in euros and/or any other currency, rated speculative or high yield or the equivalent based on the management company's analysis.
b) A maximum of 40% of the net assets in bonds and debt securities denominated in euros and/or any other currency, rated investment grade or the equivalent based on the management company's analysis.
c) A maximum of 50% of the net assets in perpetual subordinated debt, including a maximum of 30% of the net assets in contingent convertible bonds (CoCos).
d) A maximum of 10% of the net assets in unrated bonds. A maximum of 10% of the net assets in convertible bonds.
UCIs
French or foreign UCITS or AIFs that meet the four criteria of Article R. 214-13 of the French Monetary and Financial Code (Code Monétaire et Financier), standard money-market and short-term money-market funds with variable net asset values, and bond funds up to a maximum of 10% of the net assets.
These UCIs may be managed by the management company.
3. Derivatives
Types of markets:
regulated
organised
OTC
The manager intends to seek exposure to:
equities
interest rates
currency
credit
other: volatility

66
Transaction types – all transactions must be limited to achieving the investment objective:
hedging
exposure
arbitrage
other
Types of instruments used:
futures:
equity and equity indices
interest rate: interest rate risk
currency
other
options:
equity and equity indices
interest rates: interest rate and interest rate volatility risk
currency
other
swaps:
equity swaps
interest rate swaps: transformation of fixed-rate income to variable-rate income and vice versa
currency swaps
performance swaps
currency forwards
credit derivatives
other
Derivatives strategy to achieve the investment objective:
partial or general portfolio hedging
creation of synthetic exposure to assets
increasing exposure to the market
maximum permitted and sought
other
4. Securities with embedded derivatives
The fund manager may invest in any securities with embedded derivatives permitted under the management company’s business plan, whose issuer is not the same as the issuer of the underlying security, insofar as the performance of these securities is index-linked to changes in interest rate or credit spread risk. Within this framework, the manager may take positions with a view to hedging the portfolio against and/or exposing it to particular business sectors, geographic regions, shares (all capitalisation types), stocks and similar securities in order to achieve the investment objective.
Total investments in securities with embedded derivatives may not exceed 100% of the net assets. Contingent convertible bonds are limited to a maximum of 30% of the net assets.
5. Deposits
Up to 10% of the Sub-fund’s assets may be held in deposits.
6. Cash borrowings
The Sub-fund may borrow cash within the limit of 10% of its net assets to meet specific cash requirements related to its operating needs.
7. Temporary purchases and sales of securities
None.
8. Information on financial guarantees
In connection with over-the-counter derivative transactions, and in accordance with Position paper 2013-06 issued by the French financial markets regulator (Autorité des Marchés Financiers – AMF), the Sub-fund may receive collateral in the form of securities (such as bonds or other securities issued or guaranteed by a State or issued by international financing agencies and bonds or securities issued by high quality corporate issuers), or cash. Any cash collateral received is reinvested in accordance with the applicable rules. All such assets must be from high-quality issuers that are not an entity of the counterparty or its group, and must be liquid and diversified with low volatility. Discounts may be applied to the
67
collateral received; they take into account the quality of credit and the price volatility of the securities.
RISK PROFILE
Your money will be mainly invested in financial instruments selected by the management company. These instruments will be exposed to market trends and fluctuations.
Risk of capital loss
The Sub-fund provides no capital guarantee or protection. As such, the investor may not get back the full amount of the initial investment during redemption.
Interest rate risk
The risk of a decline in debt instruments as a result of changes in interest rates. This risk is measured by the level of sensitivity. For instance, bond prices tend to move in the opposite direction to interest rates. The net asset value may decline during periods when there is an increase (positive sensitivity) or decrease (negative sensitivity) in interest rates.
Credit risk
The risk of a deterioration in the credit quality of or default by a public or private issuer. The Sub-fund's exposure to issuers either through direct investment or via other UCIs may give rise to a decline in the net asset value. If the Sub-fund is exposed to unrated or speculative/high yield debt, the credit risk is high and may lead to a decline in the Sub-fund’s net asset value.
Derivative financial instrument risk
The risk arising from the Sub-fund's use of forward financial instruments (derivatives), which may lead to a bigger decrease in the net asset value than on the markets or in the underlying assets in which the sub-fund has invested.
Counterparty risk:
This is a risk associated with the use of OTC forward financial instruments. These transactions, entered into with one or more counterparties, potentially expose the Sub-fund to a risk of failure of any such counterparty, which may lead to default in payment and cause the Sub-fund’s NAV to fall.
Risks linked to hybrid or subordinated securities:
The sub-fund may be exposed to hybrid or subordinated securities. Hybrid and subordinated debt are subject to specific risks of non-payment of coupons and capital loss in certain circumstances. For non-financial bonds, since hybrid debt securities are "deeply subordinated", there is a low recovery rate in the event of issuer default.
Liquidity risk
The risk that a financial market cannot absorb transaction volumes due to trading volumes being too low or pressure on the markets. Such a situation may impact the pricing or timing when the Sub-fund liquidates, initiates or modifies positions and thus cause a decline in the Sub-fund’s net asset value.
Risk related to the holding of contingent convertible bonds (CoCos)
Subordinated debt and contingent convertible bonds are subject to specific risks of non-payment of coupons and capital loss in certain circumstances. According to a certain solvency threshold called trigger, the issuer may or is obliged to suspend the payment of interest and/or reduce the nominal value of the security or convert the bonds into equity. Notwithstanding the thresholds defined in the issue prospectus, the supervisory authorities have the possibility of applying in a preventive manner these rules if the circumstances require based on an objective threshold, the point of non-viability. These securities expose holders to either a total or partial loss of their investment following their conversion into shares at a predetermined price or because of the application of a discount provided for contractually in the issuing prospectus or applied arbitrarily by a supervisory authority. Holders of these securities are also exposed to potentially large price fluctuations in the event that the issuer has insufficient equity or experiences difficulties.
Risk related to overexposure
The Sub-fund may use forward financial instruments (derivatives) to generate overexposure and thus bring the Sub-fund’s exposure above its net asset value. Depending on the transactions, the impact of a decrease (purchase of exposure) or increase (sale of exposure) in the derivative’s underlying instrument may be amplified and thus amplify any decrease in the Sub-fund’s net asset value. Because of the hedging strategy applied, shareholders may not benefit from potential upside on certain markets.
Foreign exchange risk (ancillary):
The Sub-fund may invest in securities and UCIs that are themselves permitted to purchase stocks denominated in currencies other than the euro. The value of the assets of such UCIs may fall if exchange rates fluctuate, which may lead to a fall in the Sub-fund’s NAV.
Sustainability risk
The risk that an environmental, social or governance event or situation will occur that could have a material adverse effect,

68
actual or potential, on the value of an investment.
GUARANTEE OR PROTECTION
None.
ELIGIBLE SUBSCRIBERS AND TYPICAL INVESTOR PROFILE
This sub-fund is aimed at all investors who are aware of the risks associated with investing in the international credit markets. The Fund may be used with life insurance and savings policies. Subscribers are strongly advised to diversify their investments sufficiently to avoid exposure solely to the risks of this Sub-fund.
Information on US investors:
The Sub-fund is not registered as an investment vehicle in the United States and its units are not and will not be registered under the Securities Act of 1933 and, therefore, they may not be offered or sold in the United States to Restricted Persons, as defined hereafter. A Restricted Person is (i) any person or entity located in the United States (including US residents), (ii) any corporation or any other entity subject to the laws of the United States or any state thereof, (iii) any US military personnel or any employee of a US government department or agency located outside the United States, or (iv) any other person that would be considered a US Person under Regulation S of the Securities Act of 1933, as amended.
FATCA:
Pursuant to the provisions of the Foreign Account Tax Compliance Act (“FATCA”) applicable as of July 1st, 2014, if the Sub-fund invests directly or indirectly in US assets, the capital and income arising from such investments may be subject to withholding tax of 30%. To avoid paying the 30% withholding tax, France and the United States have entered into an intergovernmental agreement under which non-US financial institutions (“foreign financial institutions”) agree to institute procedures for identifying direct or indirect investors who qualify as US taxpayers and to provide certain information about these investors to the French tax authorities, which will disclose said information to the US tax authority, the Internal Revenue Service. As a foreign financial institution, the Sub-fund undertakes to comply with the FATCA and to take all appropriate measures pursuant to the aforementioned intergovernmental agreement. The amount that it is reasonable to invest in this Sub-fund depends on each investor’s personal circumstances. To determine this, investors should take account of their personal financial situation, current needs and the recommended investment period, and should also consider their ability to assume risk or whether they prefer instead to opt for a more cautious investment. This Sub-fund may not be suitable for investors planning to withdraw their contributions within three years.
69
9. CHANGES AFFECTING THE SUB-FUND
CHANGES WHICH TOOK PLACE DURING THE PERIOD OR ARE STILL TO TAKE PLACE The Extraordinary Shareholders' Meeting of the SICAV LAZARD FUNDS (SICAV with sub-funds) (LAZARD CREDIT
OPPORTUNITIES sub-fund: ISIN code: FR0010230490 and the LAZARD EURO SHORT DURATION HIGH YIELD sub-fund: ISIN code: FR0013506987), on January 29th, 2021, decided to transfer the SICAV's registered office to 10, avenue Percier, Paris (8th district).
Effective date: 30/01/2021 Lazard Frères Gestion, delegated financial manager of the SICAV LAZARD FUNDS (SICAV with sub-funds), in
agreement with the Board of Directors meeting of 15/01/2021, asked the audit firm Ernst & Young to obtain the SRI (Socially Responsible Investment) label for the LAZARD EURO SHORT DURATION HIGH YIELD Sub-fund (ISIN code: FR0013506987). The latter received the SRI label on 16/12/2020. Obtaining this label led us to integrate SRI criteria into the selection of directly held bonds. At this time, it was decided to change the Sub-fund’s name. Its new name will be: LAZARD EURO SHORT DURATION HIGH YIELD SRI
Effective date: 09/02/2021 As part of the financial management delegation granted by LAZARD FUNDS (SICAV with sub-funds) (LAZARD EURO
SHORT DURATION HIGH YIELD sub-fund ISIN code: FR0013506987), Lazard Frères Gestion SAS has decided to make the following changes:
1) Editorial change to the investment policy as part of the ESG/SFDR update.
2) Addition of sustainability risk.
Effective date: 16/03/2021 As part of the financial management delegation granted by the LAZARD FUNDS SICAV (SICAV with sub-funds)
(LAZARD CREDIT OPPORTUNITIES sub-fund: ISIN code : FR0010230490 and LAZARD EURO SHORT DURATION HIGH YIELD sub-fund ISIN code: FR0013506987), Lazard Frères Gestion SAS has decided to modify the wording of the SRI management policy
Effective date: 11/08/2021

70
Corporate governance (CSR) section
I. List of appointments
Directors’ names Number of
offices
held
List of offices and functions
Eleonore Bunel Managing Director of Lazard Frères Gestion SAS
1 Chairman and Chief Executive Officer of the
SICAV Lazard Funds (SICAV with sub-funds)
François-Marc Durand Chairman of Lazard Frères Gestion SAS
4
- Chairman and Chief Executive Officer of the Norden SRI SICAV
- Member of the Boards of Directors of the SICAVs: . Lazard Small Caps Euro SRI . Lazard Funds (SICAV with sub-funds) . Lazard Alpha Allocation
Jean-Jacques de Gournay Managing Director of Lazard Frères Gestion SAS
5
- Chairman and Chief Executive Officer of the Norden Family SICAV
- Member of the Boards of Directors of the SICAVs: . Lazard Funds (SICAV with sub-funds) . Lazard Small Caps Euro SRI . Lazard Equity SRI . Lazard Convertible Global
Monica Nescaut Managing Director of Lazard Frères Gestion SAS
5
- Member of the Boards of Directors of the SICAVs:
. Lazard Small Caps Euro SRI
. Lazard Funds (SICAV with sub-funds)
. Norden SRI
. Lazard Equity SRI
. Lazard Convertible Global
Paul Castello Managing Director of Lazard Frères Gestion SAS
5
- Member of the Boards of Directors of the SICAVs: . Lazard Sustainable Euro Short Duration . Lazard Equity SRI . Norden Small . Lazard Funds (SICAV with sub-funds)
- Chief Executive Officer and board member of the SICAV Lazard Convertible Global

71
II. Directors’ fees
Members of the Board of Directors Directors’ fees paid by
the SICAV
Eléonore Bunel 0
François-Marc Durand 0
Jean-Jacques de Gournay 0
Monica Nescaut 0
Lazard Frères Gestion SAS
represented by Alexia Latorre 0
MGEN Represented by Charles Bouffier
€1 600
Union Mutualiste Retraite (UMR)
Represented by Philippe Rey €1 600
Paul Castello 0
III Agreements covered by Article L.225-37-4 para.2 of the French Commercial Code The SICAV was not informed of the conclusion of any agreements covered by Article L.225-37-4 para.2 of the French Commercial Code during the financial year ended September 30th, 2021.
IV Table of currently valid delegations of powers granted by the shareholders' meeting, as stipulated in Article L.2257-4 para.3 of the French Commercial Code No delegation of authority pursuant to Article L225-37-4 paragraph 3 of the French Commercial Code was granted or was ongoing during the financial year ended September 30th, 2021. V Method of operation of the executive management The Board of Directors has opted to combine the functions of Chairman of the Board of Directors and Chief Executive Officer and will be called Chairman and Chief Executive Officer.
72
10 MANAGEMENT REPORT
At the date of preparation of the management report and in the context of uncertainty linked to the Covid-19 health crisis,
the events listed below have not occurred:
• significant events occurring during the financial year such as changes in the methods of applying accounting methods
(implementation of model valuation, activation of gates, suspension of NAV).
• other elements such as information relating to possible situations of suspension of subscriptions/redemptions,
liquidation of funds or creation of a ring-fencing fund.
PERFORMANCE
The UCI's performance over the period was as follows:
PVC unit: 7,44% EVC unit: 7,53% PD unit: 6,81% RC unit: 7,80%
RVC unit: 7,70%
Performances vary over time and past performance is no guarantee of the UCI's future results.
The benchmark's* performance over the period was as follows:
The benchmark's* performance over the period was as follows: 5,43%. (*) 30% ER01 + 70% H1EC
ECONOMIC ENVIRONMENT
Global economic growth has rebounded strongly since its low point in spring 2020. The deployment of effective vaccines has allowed economies to gradually reopen and demand has been boosted by exceptional support measures from public authorities and central banks. High frequency activity indicators remain consistent with buoyant demand, although they suggest that growth has peaked, while production is hampered by labour shortages and supply chain problems, with shortages in some key sectors such as semiconductors and shipping. Inflation accelerated sharply, reflecting in particular the rise in commodity prices, supply problems and the normalisation of certain prices that had fallen due to health restrictions measures. The acceleration of inflation is creating uncertainty about the timing of monetary policy normalisation, but central banks have until recently generally maintained a very accommodative stance, insisting on the transitory nature of inflationary pressures, a question that remains open as supply pressures continue, energy prices tighten and US wages accelerate. In the United States, GDP was up by +12,2% year-on-year in Q2 2021 and by +0,9% from its Q4 2019 level. 5.7 million jobs were created over the last twelve months, bringing total employment to 148 million, compared to 153 million before the crisis. The unemployment rate fell from 11,1% to 4,8%. Wages rose by +4,6% year-on-year in September. The number of unfilled job vacancies jumped to 10.4 million in August. Headline inflation rose from +1,4% to +5,3% year-on-year and core inflation from +1,7% to +4,0%. The Fed maintained its main monetary policy parameters. The key rate stayed within the 0%-0,25% range and asset purchases continued at a pace of $120 billion a month. In June 2021, Jerome Powell indicated that the debate on reducing asset purchases had begun. In September 2021, Jerome Powell set the stage for a formal announcement in November.
Democratic candidate Joe Biden won the November 2020 presidential election. Democrats retained their majority in the
House of Representatives and took control of the Senate. The US Congress adopted two massive fiscal stimulus
packages during the past year: a first package of $900 billion in December 2020 and a second package of $1 900 billion in
March 2021. In September 2021, two stimulus packages were being negotiated: a $1 200 billion infrastructure package
and a $3 500 billion social spending package.
In the Eurozone, GDP grew by +14,3% year-on-year in Q2 2021 and fell by 2,5% from its Q4 2019 level. It increased by +18,7% in France, +9,8% in Germany, +17,6% in Italy and +17,5% in Spain. The unemployment rate fell from 8,6% to 7,5%. Headline inflation rose from -0,3% to +3,4% year-on-year and core inflation from +0,2% to +1,9%. The ECB has left the deposit rate unchanged at -0,50%. The amount of the pandemic emergency purchase programme was increased by €500bn in December 2020, bringing the total envelope to €1 850bn. In March 2021, the ECB announced that it would significantly increase the pace at which it invests this envelope, before indicating in September 2021 that it would slow down slightly. In Germany, the September 2021 parliamentary elections resulted in a fragmented parliament, opening a period of negotiations to form a majority coalition.
73
In July 2020, EU countries reached an agreement on a European recovery plan of €750 billion, equivalent to 5,4% of GDP. In China, GDP grew by +7,9% year-on-year in Q2 2021 and by +8,2% from Q4 2019. The urban unemployment rate fell from 5,4% to 5,1%. Headline inflation rose from +1,7% to +0,8% year-on-year and core inflation from +0,5% to +1,2%. The Chinese central bank maintained its key interest rate at 2,95%. The reserve requirement ratio for the main banks was lowered by 50 basis points in July 2021 to 12,00%.
In March 2021, the government presented its economic priorities for the next twelve months and the five-year plan for the
period 2021-2025. The government has announced that it is aiming for GDP growth "above 6%" in 2021. The fiscal deficit
is expected to fall from 3,7% to 3,2% of GDP. Monetary policy should remain "prudent, appropriate and flexible". The
2021-2025 five-year plan calls for further structural reforms. In May 2021, the government allowed families to have three
children. A new emphasis on "shared prosperity" has led to several announcements targeting sectors such as technology
and education. Some major real estate developers have run into financial difficulties.
MANAGEMENT POLICY
2020 ended on a high note, thanks to good news on vaccines, approval of a new fiscal stimulus package in the United States and the Brexit deal taking precedence over the reintroduction of lockdown measures in Europe. The ECB strengthened its support for the economy by recalibrating its monetary policy, with the main measure being an increase and extension of its emergency purchase programme to €1 850 billion (+€500 billion until March 2022). Long-term yields fell in Europe (-5bp) but rose on the other side of the Atlantic (+23bp). Appetite for risky assets increased. A record year for volumes in the High Yield segment and also for the hybrid format is over. The Lazard Euro Short Duration High Yield fund outperformed over the period thanks to its aggressive positioning in high yield credit and subordinated bonds. The rise continued in the first quarter of 2021, benefiting stocks most exposed to a rebound in activity as fiscal stimulus in the United States is increased and vaccination becomes more prevalent. The expected strong economic recovery fuelled fears of an inflationary surge, but central banks maintained their accommodative stance. Long-term interest rates rose sharply across the board (+83bp in the US and +28bp in the EU). Yield curves have steepened on the theme of reflation and optimism about the speed and scale of the economic recovery, particularly in the United States where the stimulus package is on the brink of being voted. All credit asset classes tightened, with greater movements in the riskiest segments. Lazard Euro Short Duration High Yield outperformed this quarter. The main positive contributions came from subordinated financials, High Yield and interest rate hedges. In the second quarter of 2021, thanks to the improvement in the economic and health situation, the equity markets hit new all-time highs in Europe and the US. Corporate earnings releases were generally better than expected. All credit segments tightened once again. The monetary policy stance remained the focus of attention. Dissension emerged within central banks. In the United States, some Fed members spoke out to underscore the risk that a late reaction could lead to an overheating of the economy. In the meantime, Jerome Powell reaffirmed the transitory nature of inflation, while stressing that the priority is the recovery of the labour market. In Europe, despite some dissent, the ECB did not change its support, maintaining the same pace of purchases. US long-term interest rates dropped by 27bp while in Europe they rose by 8bp. The Lazard Euro Short Duration High Yield fund's still aggressive positioning enabled it to outperform. The third quarter of 2021 was marked by a more mixed macroeconomic environment. The rise continued in July and August before a correction in September against a backdrop of concerns about Chinese growth, a slightly less accommodating stance by the Fed, persistent cyclical inflation and a rapid rise in sovereign yields. Over the last quarter, the credit effect of Lazard Euro Short Duration High Yield, driven by peripheral subordinated financial and High Yield bonds, explains the fund's outperformance.
Past performance is no guarantee of future results.
74
Main changes in the portfolio during the year
Securities
Changes (“accounting currency”)
Purchases Sales
ENERGIAS DE PORTUGAL EDP 4.496% 30-04-79 553 372,01 227 164,68
ENI 2.625% PERP 630 262,29 104 848,37
SG 6.75% 31/12/2099 314 389,67 411 134,61
ALPHA BANK 4.25% 13-02-30 EMTN 711 276,58
BNP PARIBAS FIX PERP 427 180,71 273 993,33
ABN AMRO BK 4.375% PERP 440 851,60 213 056,21
TELECOM ITALIA SPA EX OLIVETTI 2.75% 26-03-22 531 533,70 108 447,81
DANSKE BA 5.875% PERP EMTN 421 822,68 213 793,27
UNICREDIT 5.375% PERP 314 460,04 320 380,95
EUROFINS SCIENTIFIC 2.875% PERP 511 113,29 122 593,94
75
11. REGULATORY INFORMATION
EFFICIENT PORTFOLIO MANAGEMENT TECHNIQUES AND DERIVATIVE FINANCIAL INSTRUMENTS (ESMA) IN
EUROS
a) Exposure through efficient portfolio management techniques and derivative financial instruments
• Exposure through efficient management techniques:
o Securities lending:
o Securities borrowing:
o Repurchase agreements:
o Reverse repurchase agreements:
• Underlying exposure through derivative financial instruments: 13,706,050,00
o Currency forwards:
o Futures: 13,706,050,00
o Options :
o Swap :
b) Identity of the counterparty or counterparties for efficient portfolio management techniques and derivative
financial instruments
Efficient portfolio management techniques Derivative financial instruments (*)
(*) Excluding listed derivatives

76
c) Financial guarantees received by the UCITS to reduce counterparty risk
Instrument type Amount in the currency of the portfolio
Efficient portfolio management techniques
. Term deposits
. Equities
. Bonds
. UCITS
. Cash (*)
Total
Derivative financial instruments
. Term deposits
. Equities
. Bonds
. UCITS
. Cash
Total
(*) The Cash account also includes liquidity from reverse repurchase agreements.
d) Operating income and expenses related to efficient management techniques
Operating income and expenses Amount in the currency of the portfolio
. Income (*) 31,87
. Other income
Total income 31,87
. Direct operating expenses 306,26
. Indirect operating expenses
. Other expenses
Total expenses 306,26
(*) Income on securities lending and repurchase agreements

77
TRANSPARENCY OF SECURITIES FINANCING TRANSACTIONS AND THE REUSE OF FINANCIAL INSTRUMENTS – SFTR – in the accounting currency of the UCI (€)
The UCI carried out no transactions during the year in the context of the SFTR.
PROCEDURE FOR SELECTING AND ASSESSING INTERMEDIARIES AND COUNTERPARTIES
The brokers used by the management company are selected on the basis of various evaluation criteria, covering research, quality of order execution and processing and the range of services offered. The management company’s “Broker Committee” validates any updates to the list of authorised brokers. Each investment division (fixed income and equities) reports to the Broker Committee at least twice a year on the evaluation of the services provided by the various brokers and the breakdown of the volume of transactions handled.
The information can be consulted on the management company's website: www.lazardfreresgestion.fr
BROKERAGE FEES
Information about brokerage fees is available on the website: www.lazardfreresgestion.fr.
EXERCISING VOTING RIGHTS
The scope and procedures for Lazard Frères Gestion SAS’ exercise of the voting rights attached to the securities held in the UCIs managed by it are set out in the guidelines it has drawn up on its voting policy. This document can be consulted on the management company’s website: www.lazardfreresgestion.fr.
DISCLOSURE OF ENVIRONMENTAL, SOCIAL AND GOVERNANCE (ESG) CRITERIA
Lazard Frères Gestion firmly believes that the integration of environmental, social and governance (ESG) criteria in the management of assets provides an additional guarantee in terms of a durable economic performance. In fact, the long-term performance of investments is not limited solely to adherence to the financial strategy, but must also take the company's interactions with its social, economic and financial environment into account. The incorporation of ESG criteria therefore is a natural component of our investment process. Our overall approach can be summarised as follows:
Rigorous financial analysis of the company covering the quality of assets, financial soundness, projected cash flows and their reinvestment by the company, the strength of economic profits, profit durability, and quality of management.
This durability is strengthened by incorporating non-financial criteria:
- Social criteria: through the development of human capital.
- Environmental criteria: through the prevention of all environmental risks.
- Governance criteria: by respecting the balance between the managerial and shareholder structures so as to prevent potential conflicts of interest and safeguard the interests of minority shareholders. The intensity and methods by which we incorporate ESG criteria may vary depending on the asset class and investment process involved, but the common objective is to ensure better apprehension of ESG risks that are likely to have a strong impact on the value of a company or sovereign asset.
Information on ESG criteria is available on the website: www.lazardfreresgestion.fr.
ARTICLE 8 (SFDR)
The UCI promotes environmental and/or social characteristics within the meaning of Article 8 of Regulation (EU) 2019/2088, the so-called “SFDR Regulation”. Regulation (EU) 2020/852, known as the “Taxonomy Regulation” The European Union Taxonomy aims to identify economic activities that are considered environmentally sustainable. The Taxonomy identifies these activities according to their contribution to six broad environmental objectives:
• Climate change mitigation,
• Climate change adaptation,
• Sustainable use and protection of water and marine resources,
• Transition to the circular economy (waste, prevention and recycling),
• Pollution prevention and control,

78
• Protection of healthy ecosystems.
Currently, Technical Screening Criteria have been developed for a number of economic activities that can contribute substantially to two of these objectives: climate change mitigation and climate change adaptation. These criteria are currently awaiting publication in the Official Journal of the European Union. The data presented below therefore only reflect alignment with these two objectives, based on the not-yet-finally published criteria as submitted to the European co-legislators. We will update this information in the event of changes to these criteria, the development of new review criteria relating to these two objectives, as well as when the criteria relating to the other four environmental objectives come into effect: sustainable use and protection of aquatic and marine resources; the transition to a circular economy; pollution prevention and reduction; the protection and restoration of biodiversity and ecosystems. To be considered sustainable, an economic activity must demonstrate that it contributes substantially to the achievement of one of the six objectives, while not harming any of the other five (the so-called DNSH principle, standing for “Do No Significant Harm”). In order for an activity to be considered aligned with the European Taxonomy, it must also respect the human and social rights guaranteed under international law. The “Do No Harm” principle applies only to investments underlying the financial product that take into account the European Union’s criteria for environmentally sustainable economic activities. The investments underlying the remaining portion of this financial product do not take into account the European Union’s criteria for environmentally sustainable economic activities. The minimum percentage of alignment with the European Union Taxonomy is 0%. Consideration of the alignment of companies’ activities is carried out qualitatively in the internal analysis process based on the data published by the companies themselves as well as data made available by our ESG data providers.
USE OF FINANCIAL INSTRUMENTS MANAGED BY THE MANAGEMENT COMPANY OR AN AFFILIATED COMPANY
The table of financial instruments managed by the management company or an affiliated company can be found in the notes to the UCI's annual financial statements.
METHOD USED TO CALCULATE GLOBAL RISK
The Fund uses the commitment method to calculate its global risk on financial contracts.
INFORMATION ON DISTRIBUTED INCOME ELIGIBLE FOR THE 40% ALLOWANCE (FOR DISTRIBUTING UCIs)
Pursuant to the provisions of Article 41 sexdecies H of the French General Tax Code, income on distributing shares is
subject to an allowance of 40%.
• REMUNERATION
The fixed and variable remuneration paid during the financial year ended on December 31st, 2020 by the management company to its personnel, in proportion to their investment in the management of the AIFs, excluding the management of the UCITS and discretionary mandates, can be obtained on request by post from the UCI legal department of Lazard Frères Gestion, and are included in the company's annual report. The total variable remuneration is set by the Lazard Group based on different criteria, including the Lazard Group's financial performance over the past year, taking its earnings into account. The General Management decides on the total remuneration amount that will be split between the fixed and variable components, complying with the policy to maintain a complete separation between the fixed and variable components. All risks are incorporated into the calculation of the variable remuneration. It is then individualised and determined partly based on the performance of each identified member of staff. The remuneration policy is reviewed each year and is in line with the remuneration policies and procedures established by Lazard Frères Gestion. Each year, Lazard Frères Gestion's Remuneration Policy Compliance Monitoring Committee, which is made up of two independent members of the management company, is responsible for issuing an opinion on the proper application of the remuneration policy and its compliance with applicable regulations.

79
Population at 31/12/2020: fixed-term and permanent contracts of LFG and LFG-Belgique
(therefore excluding interns and apprentices and excluding LFG-Courtage)
Headcount at December 31st, 2020
LFG - LFG-Belgium Fixed annual remuneration 2020 in €
Variable remuneration for 2020 (cash
paid in 2021 and deferred in 2021) in €
179 16 522 853 22 155 596
“Identified employees”
Category Number of employees Aggregated fixed and variable
remuneration 2020 (including
deferred) in euros
Senior management 3 4 310 982
Other 51 21 362 196
Total 54 25 673 178
Note: the amounts are unloaded
• OTHER INFORMATION
The sub-fund's complete prospectus and the most recent annual and interim reports will be sent out within one week of
request made in writing by the shareholder to:
LAZARD FRERES GESTION SAS
25, Rue de Courcelles – 75008 Paris, France
www.lazardfreresgestion.fr
80
12. ANNUAL FINANCIAL STATEMENTS
• BALANCE SHEET AS AT 30/09/2021 in EUR
ASSETS
30/09/2021 30/09/2020
NET NON-CURRENT ASSETS
DEPOSITS
FINANCIAL INSTRUMENTS 30 658 679,89 10 742 527,12
Equities and similar securities
Traded on a regulated or equivalent market
Not traded on a regulated or equivalent market
Bonds and similar securities 30 602 629,89 10 742 527,12
Traded on a regulated or equivalent market 30 602 629,89 10 742 527,12
Not traded on a regulated or equivalent market
Debt securities
Traded on a regulated or equivalent market
Negotiable debt securities
Other debt securities
Not traded on a regulated or equivalent market
Undertakings for collective investment
General UCITS and general AIFs aimed at non-professionals and their equivalent in other countries
Other funds aimed at non-professionals and their equivalent in other countries that are Member States of the EU
General funds aimed at professional investors and their equivalent in other Member States of the EU and listed securitisation entities
Other funds aimed at professional investors and their equivalent in other Member States of the EU and unlisted securitisation entities
Other non-European entities
Temporary securities transactions
Receivables on securities purchased under repurchase agreements
Receivables on loaned securities
Borrowed securities
Securities sold under repurchase agreements
Other temporary transactions
Forward financial instruments 56 050,00
Transactions on a regulated or equivalent market 56 050,00
Other transactions
Other financial instruments
RECEIVABLES 136 471,83 12 266,67
Currency forward exchange transactions
Other 136 471,83 12 266,67
FINANCIAL ACCOUNTS 1 582 584,63 996 417,43
Cash and cash equivalents 1 582 584,63 996 417,43
TOTAL ASSETS 32 377 736,35 11 751 211,22

81
LIABILITIES AND SHAREHOLDERS’ EQUITY
30/09/2021 30/09/2020
SHAREHOLDERS’ EQUITY
Share capital 31 001 182,99 10 632 626,76
Undistributed net capital gains and losses recognised in previous years (a)
Retained earnings (a)
Net capital gains and losses for the year (a, b) -30 531,95 121 105,68
Net income for the year (a, b) 1 266 144,14 102 524,92
TOTAL SHAREHOLDERS' EQUITY * Sum representing the net assets
32 236 795,18 10 856 257,36
FINANCIAL INSTRUMENTS 56 050,00
Sales of financial instruments
Temporary securities transactions
Liabilities on securities sold under repurchase agreements
Liabilities on borrowed securities
Other temporary transactions
Forward financial instruments 56 050,00
Transactions on a regulated or equivalent market 56 050,00
Other transactions
LIABILITIES 84 891,17 894 953,86
Currency forward exchange transactions
Other 84 891,17 894 953,86
FINANCIAL ACCOUNTS
Bank overdrafts
Borrowings
TOTAL LIABILITIES AND SHAREHOLDERS’ EQUITY 32 377 736,35 11 751 21 ,22
(a) Including accrued income (b) Less interim dividends paid for the financial year

82
OFF-BALANCE SHEET ITEMS AS AT 30/09/2021 in EUR
30/09/2021 30/09/2020
HEDGING TRANSACTIONS
Commitments on regulated or similar markets
Futures contracts
EURO SCHATZ 1221 5 610 250,00
EURO BOBL 1221 8 095 800,00
Commitments on OTC markets
Other commitments
OTHER TRANSACTIONS
Commitments on regulated or similar markets
Commitments on OTC markets
Other commitments
83
INCOME STATEMENT AS AT 30/09/2021 in EUR
30/09/2021 30/09/2020
Income from financial transactions
Income from deposits and financial accounts
Income from equities and similar securities
Income from bonds and similar securities 677 927,31 113 547,16
Income from debt securities
Income from temporary purchases and sales of securities 31,87
Income from forward financial instruments
Other financial income
TOTAL (1) 677 959,18 113 547,16
Expenses related to financial transactions
Expenses related to temporary purchases and sales of securities 306,26
Expenses related to forward financial instruments
Expenses related to financial liabilities 502,85 9,55
Other financial charges
TOTAL (2) 809,11 9,55
INCOME FROM FINANCIAL TRANSACTIONS (1 - 2) 677 150,07 113 537,61
Other income (3)
Management fees and depreciation and amortisation (4) 109 253,70 11 404,91
NET INCOME FOR THE FINANCIAL YEAR (L. 214-17-1) (1 - 2 + 3 - 4) 567 896,37 102 132,70
Income adjustment for the financial year (5) 698 247,77 392,22
Interim dividends paid on net income for the financial year (6)
NET INCOME (1 - 2 + 3 - 4 + 5 - 6) 1 266 144,14 102 524,92
84
NOTES TO THE FINANCIAL STATEMENTS
1. ACCOUNTING RULES AND PRINCIPLES
The annual financial statements are presented in accordance with regulation 2014-01, as amended, of the French
accounting standards body (Autorité des Normes Comptables - ANC).
The general accounting principles apply:
- true and fair view, comparability, business continuity,
- regularity, sincerity,
- prudence,
- permanence of the accounting methods used each year.
Income from fixed-income securities is recorded on the basis of accrued interest.
Purchases and sales of securities are recorded excluding expenses.
The accounting currency of the portfolio is the euro.
The first financial year has an exceptional duration of 12 months.
Information on the impact of the COVID-19 crisis
The financial statements were approved by the Board of Directors on the basis of available information in the context of
the evolving Covid-19 crisis.
Asset valuation rules
Financial instruments and securities traded on a regulated market are valued at their market price.
o Shares and similar securities are valued on the basis of the last known price on their main market.
If applicable, prices are translated into euros using the exchange rate prevailing in Paris on the valuation day (as
published by WM Closing).
o Fixed-income securities:
Fixed-income securities are for the most part marked to market based on either Bloomberg prices (BGN)® derived from
averages of contributed prices, or on those of direct contributors.
There may be a discrepancy between the carrying amounts, valued as indicated above, and the actual disposal prices that
would be obtained if a portion of these portfolio assets were to be sold.
o Bonds and similar instruments are valued on the basis of the average of the closing prices gathered from several
contributors.
Financial instruments whose prices have not been determined on the valuation day or whose prices have been adjusted
are valued at their probable trading price under the responsibility of the management company.
These estimates and their supporting documentation will be provided to the statutory auditor during audits.
However, the following instruments are valued using the following specific methods:
o Negotiable debt securities:
- Negotiable debt securities with a residual maturity of more than three months:
Negotiable debt securities traded in large volumes are valued at market price.
In the absence of significant trading volumes, these securities are valued using an actuarial method, with a benchmark
rate plus, where applicable, a margin representative of the issuer’s intrinsic features.
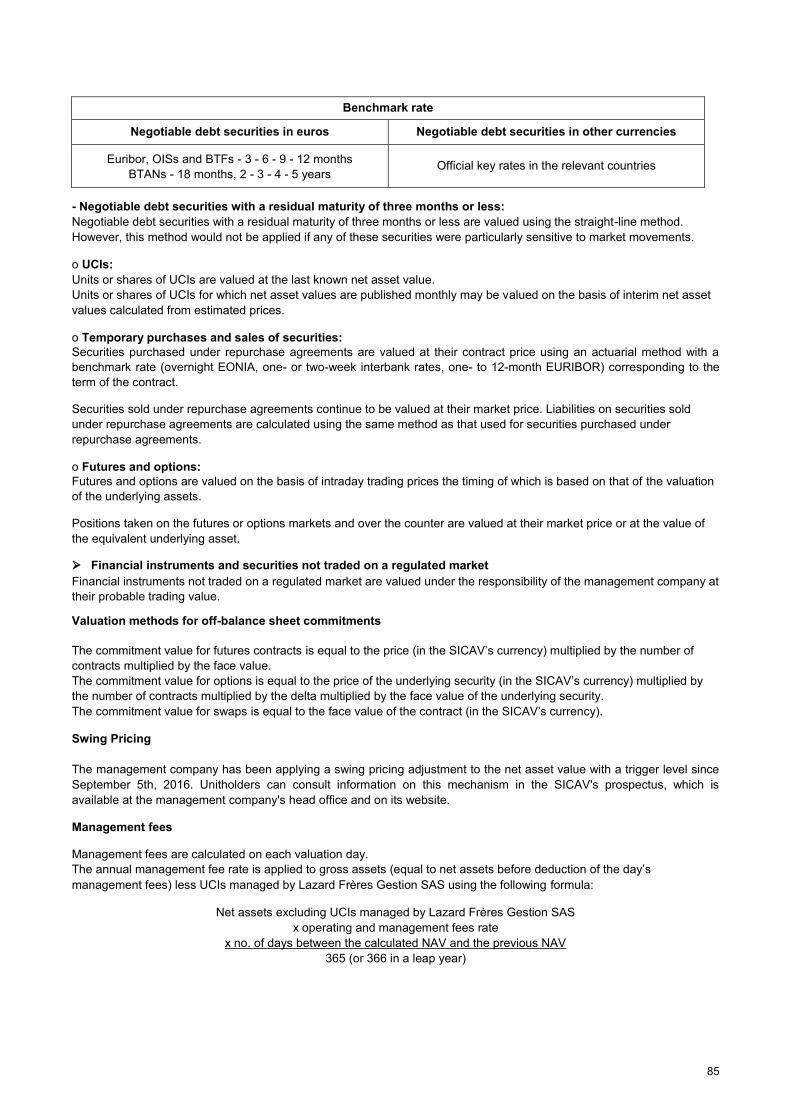
85
Benchmark rate
Negotiable debt securities in euros Negotiable debt securities in other currencies
Euribor, OISs and BTFs - 3 - 6 - 9 - 12 months
BTANs - 18 months, 2 - 3 - 4 - 5 years Official key rates in the relevant countries
- Negotiable debt securities with a residual maturity of three months or less:
Negotiable debt securities with a residual maturity of three months or less are valued using the straight-line method.
However, this method would not be applied if any of these securities were particularly sensitive to market movements.
o UCIs:
Units or shares of UCIs are valued at the last known net asset value.
Units or shares of UCIs for which net asset values are published monthly may be valued on the basis of interim net asset
values calculated from estimated prices.
o Temporary purchases and sales of securities:
Securities purchased under repurchase agreements are valued at their contract price using an actuarial method with a
benchmark rate (overnight EONIA, one- or two-week interbank rates, one- to 12-month EURIBOR) corresponding to the
term of the contract.
Securities sold under repurchase agreements continue to be valued at their market price. Liabilities on securities sold
under repurchase agreements are calculated using the same method as that used for securities purchased under
repurchase agreements.
o Futures and options:
Futures and options are valued on the basis of intraday trading prices the timing of which is based on that of the valuation
of the underlying assets.
Positions taken on the futures or options markets and over the counter are valued at their market price or at the value of
the equivalent underlying asset.
Financial instruments and securities not traded on a regulated market
Financial instruments not traded on a regulated market are valued under the responsibility of the management company at
their probable trading value.
Valuation methods for off-balance sheet commitments
The commitment value for futures contracts is equal to the price (in the SICAV’s currency) multiplied by the number of
contracts multiplied by the face value.
The commitment value for options is equal to the price of the underlying security (in the SICAV’s currency) multiplied by
the number of contracts multiplied by the delta multiplied by the face value of the underlying security.
The commitment value for swaps is equal to the face value of the contract (in the SICAV’s currency).
Swing Pricing
The management company has been applying a swing pricing adjustment to the net asset value with a trigger level since
September 5th, 2016. Unitholders can consult information on this mechanism in the SICAV's prospectus, which is
available at the management company's head office and on its website.
Management fees Management fees are calculated on each valuation day.
The annual management fee rate is applied to gross assets (equal to net assets before deduction of the day’s
management fees) less UCIs managed by Lazard Frères Gestion SAS using the following formula:
Net assets excluding UCIs managed by Lazard Frères Gestion SAS
x operating and management fees rate
x no. of days between the calculated NAV and the previous NAV
365 (or 366 in a leap year)
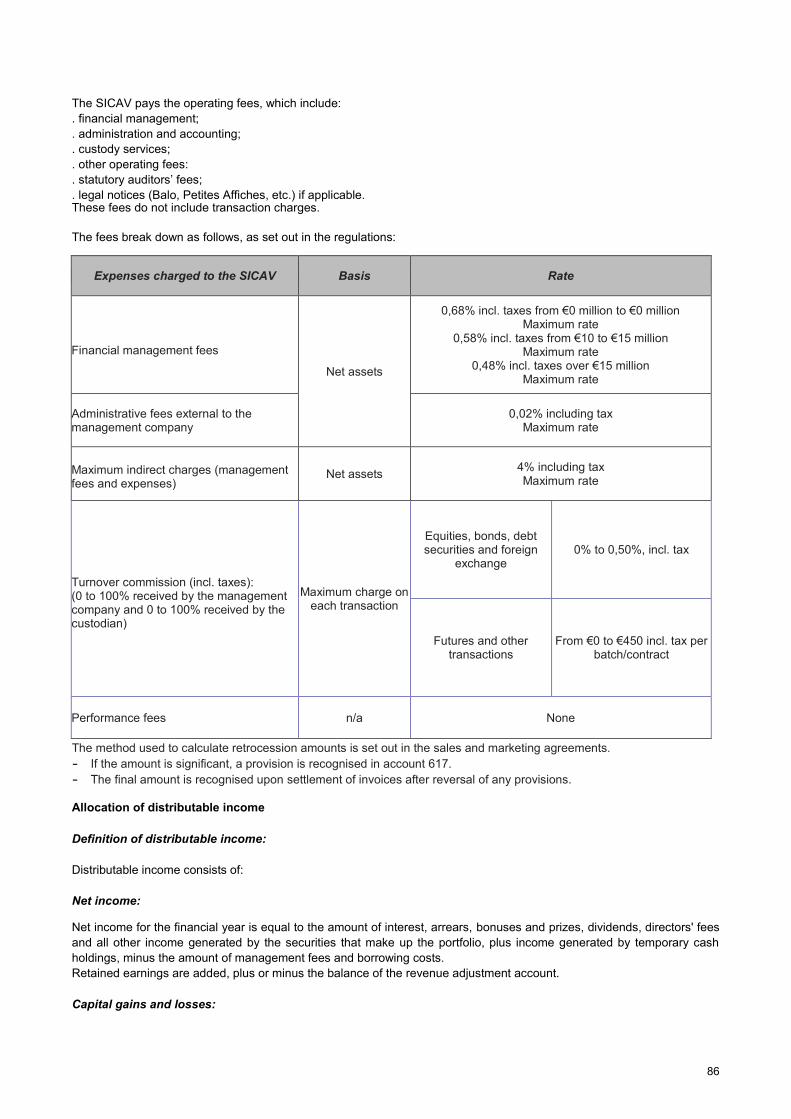
86
The SICAV pays the operating fees, which include:
. financial management;
. administration and accounting;
. custody services;
. other operating fees:
. statutory auditors’ fees;
. legal notices (Balo, Petites Affiches, etc.) if applicable. These fees do not include transaction charges.
The fees break down as follows, as set out in the regulations:
Expenses charged to the SICAV Basis Rate
Financial management fees
Net assets
0,68% incl. taxes from €0 million to €0 million Maximum rate
0,58% incl. taxes from €10 to €15 million Maximum rate
0,48% incl. taxes over €15 million Maximum rate
Administrative fees external to the management company
0,02% including tax Maximum rate
Maximum indirect charges (management fees and expenses)
Net assets 4% including tax Maximum rate
Turnover commission (incl. taxes): (0 to 100% received by the management company and 0 to 100% received by the custodian)
Maximum charge on each transaction
Equities, bonds, debt securities and foreign
exchange 0% to 0,50%, incl. tax
Futures and other transactions
From €0 to €450 incl. tax per batch/contract
Performance fees n/a None
The method used to calculate retrocession amounts is set out in the sales and marketing agreements.
- If the amount is significant, a provision is recognised in account 617.
- The final amount is recognised upon settlement of invoices after reversal of any provisions.
Allocation of distributable income
Definition of distributable income:
Distributable income consists of:
Net income:
Net income for the financial year is equal to the amount of interest, arrears, bonuses and prizes, dividends, directors' fees
and all other income generated by the securities that make up the portfolio, plus income generated by temporary cash
holdings, minus the amount of management fees and borrowing costs.
Retained earnings are added, plus or minus the balance of the revenue adjustment account.
Capital gains and losses:

87
Realised capital gains, net of expenses, less realised capital losses, net of expenses, recognised for the financial year,
plus any net capital gains of the same kind recognised over previous years that have not been distributed or accumulated,
plus or minus the balance of the capital gains adjustment account.
Allocation of distributable income:
Share(s) Allocation of net income Allocation of net realised capital
gains or losses
LAZARD EURO SHORT DURATION
HIGH YIELD PART SRI RVC shares Accumulation Accumulation
LAZARD EURO SHORT DURATION
HIGH YIELD SRI PART EVC shares Accumulation Accumulation
LAZARD EURO SHORT DURATION
HIGH YIELD SRI PART PD shares Distribution
Accumulation and/or Distribution
and/or Retention as decided by the
SICAV
LAZARD EURO SHORT DURATION
HIGH YIELD SRI PART PVC shares Accumulation Accumulation
LAZARD EURO SHORT DURATION
HIGH YIELD SRI PART RC shares Accumulation Accumulation

88
2. CHANGE IN NET ASSETS AT 30/09/2021 in euros
30/09/2021 30/09/2020
NET ASSETS AT START OF YEAR
10 856 257,36
Subscriptions (including subscription fees retained by the Fund) 20 704 054,84 10 624 277,90
Redemptions (net of redemption fees retained by the Fund) -250 029,76 -6 064,48
Realised capital gains on deposits and financial instruments 216 870,16 37 346,97
Realised capital losses on deposits and financial instruments -34 977,09 -17 475,26
Realised capital gains on forward financial instruments 13 098 036,44 1 453 546,53
Realised capital losses on forward financial instruments -13 323 664,87 -1 351 813,87
Transaction charges -7 332,69 -693,10
Exchange rate differences
Changes in valuation difference of deposits and financial instruments 353 644,09 14 999,97
Valuation difference for financial year N 368 644,06 14 999,97
Valuation difference for financial year N-1 -14 999,97
Changes in valuation difference of forward financial instruments 56 050,00
Valuation difference for financial year N 56 050,00
Valuation difference for financial year N-1
Distribution of prior year's net capital gains and losses
Dividends paid in the previous financial year -9,67
Net profit/loss for the financial year prior to income adjustment 567 896,37 102 132,70
Interim dividend(s) paid on net capital gains/losses during the financial year
Interim dividend(s) paid on net income during the financial year
Other items
NET ASSETS AT END OF YEAR 32 236 795,18 10 856 257,36
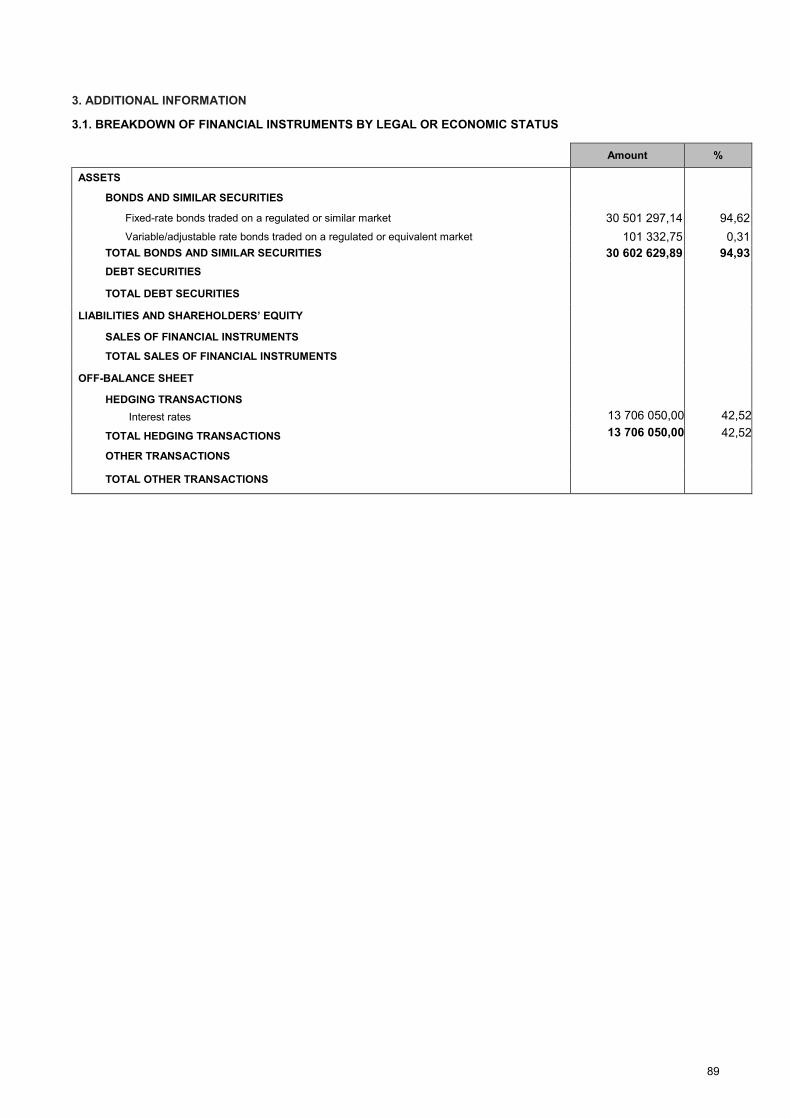
89
3. ADDITIONAL INFORMATION 3.1. BREAKDOWN OF FINANCIAL INSTRUMENTS BY LEGAL OR ECONOMIC STATUS
Amount %
ASSETS
BONDS AND SIMILAR SECURITIES
Fixed-rate bonds traded on a regulated or similar market 30 501 297,14 94,62
Variable/adjustable rate bonds traded on a regulated or equivalent market 101 332,75 0,31
TOTAL BONDS AND SIMILAR SECURITIES 30 602 629,89 94,93
DEBT SECURITIES
TOTAL DEBT SECURITIES
LIABILITIES AND SHAREHOLDERS’ EQUITY
SALES OF FINANCIAL INSTRUMENTS
TOTAL SALES OF FINANCIAL INSTRUMENTS
OFF-BALANCE SHEET
HEDGING TRANSACTIONS
Interest rates 13 706 050,00 42,52
TOTAL HEDGING TRANSACTIONS 13 706 050,00 42,52
OTHER TRANSACTIONS
TOTAL OTHER TRANSACTIONS
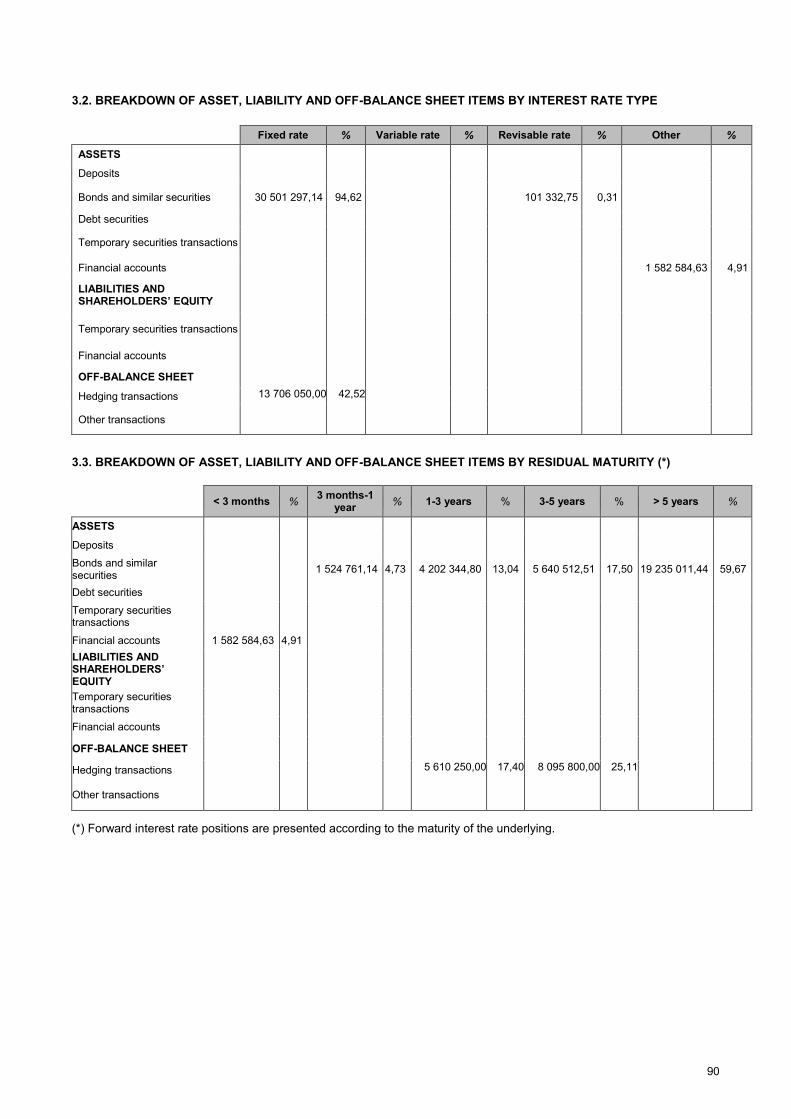
90
3.2. BREAKDOWN OF ASSET, LIABILITY AND OFF-BALANCE SHEET ITEMS BY INTEREST RATE TYPE
Fixed rate % Variable rate % Revisable rate % Other %
ASSETS
Deposits
Bonds and similar securities 30 501 297,14 94,62 101 332,75 0,31
Debt securities
Temporary securities transactions
Financial accounts 1 582 584,63 4,91
LIABILITIES AND SHAREHOLDERS’ EQUITY
Temporary securities transactions
Financial accounts
OFF-BALANCE SHEET
Hedging transactions 13 706 050,00 42,52
Other transactions
3.3. BREAKDOWN OF ASSET, LIABILITY AND OFF-BALANCE SHEET ITEMS BY RESIDUAL MATURITY (*)
< 3 months % 3 months-1
year % 1-3 years % 3-5 years % > 5 years %
ASSETS
Deposits
Bonds and similar securities
1 524 761,14 4,73 4 202 344,80 13,04 5 640 512,51 17,50 19 235 011,44 59,67
Debt securities
Temporary securities transactions
Financial accounts 1 582 584,63 4,91
LIABILITIES AND SHAREHOLDERS’ EQUITY
Temporary securities transactions
Financial accounts
OFF-BALANCE SHEET
Hedging transactions 5 610 250,00 17,40 8 095 800,00 25,11
Other transactions
(*) Forward interest rate positions are presented according to the maturity of the underlying.
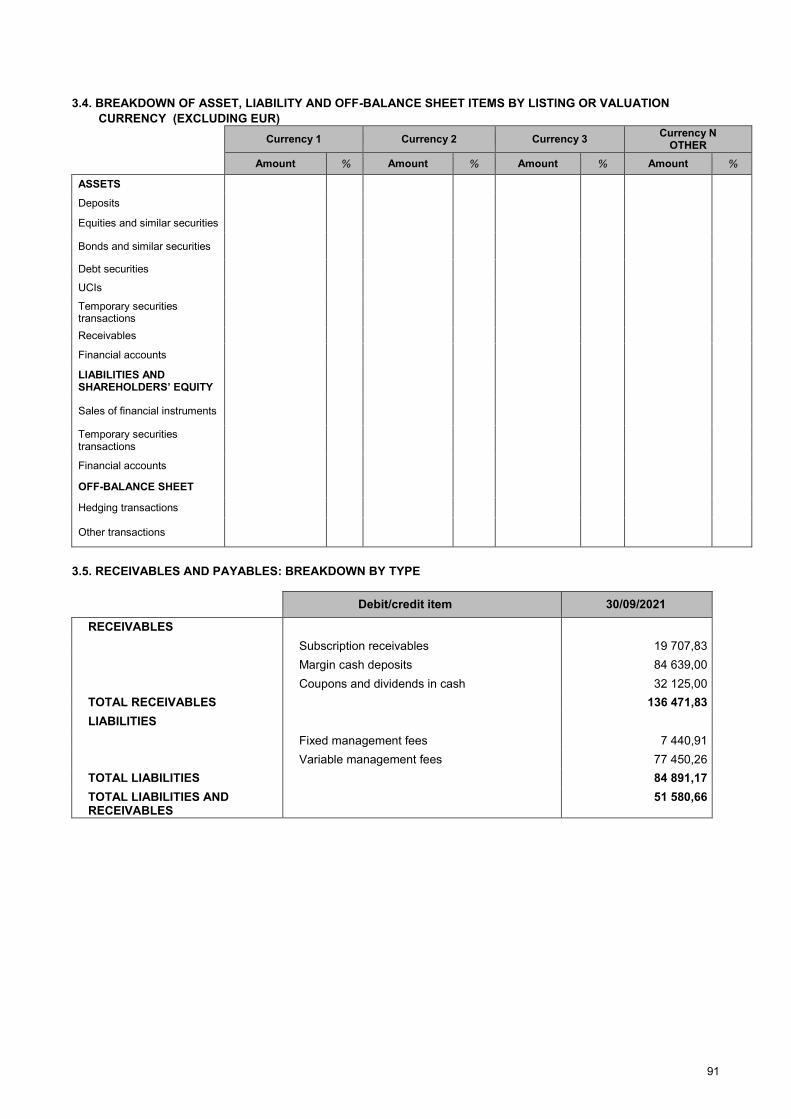
91
3.4. BREAKDOWN OF ASSET, LIABILITY AND OFF-BALANCE SHEET ITEMS BY LISTING OR VALUATION
CURRENCY (EXCLUDING EUR)
Currency 1 Currency 2 Currency 3 Currency N
OTHER
Amount % Amount % Amount % Amount %
ASSETS
Deposits
Equities and similar securities
Bonds and similar securities
Debt securities
UCIs
Temporary securities transactions
Receivables
Financial accounts
LIABILITIES AND SHAREHOLDERS’ EQUITY
Sales of financial instruments
Temporary securities transactions
Financial accounts
OFF-BALANCE SHEET
Hedging transactions
Other transactions
3.5. RECEIVABLES AND PAYABLES: BREAKDOWN BY TYPE
Debit/credit item 30/09/2021
RECEIVABLES
Subscription receivables 19 707,83
Margin cash deposits 84 639,00
Coupons and dividends in cash 32 125,00
TOTAL RECEIVABLES 136 471,83
LIABILITIES
Fixed management fees 7 440,91
Variable management fees 77 450,26
TOTAL LIABILITIES 84 891,17
TOTAL LIABILITIES AND RECEIVABLES
51 580,66
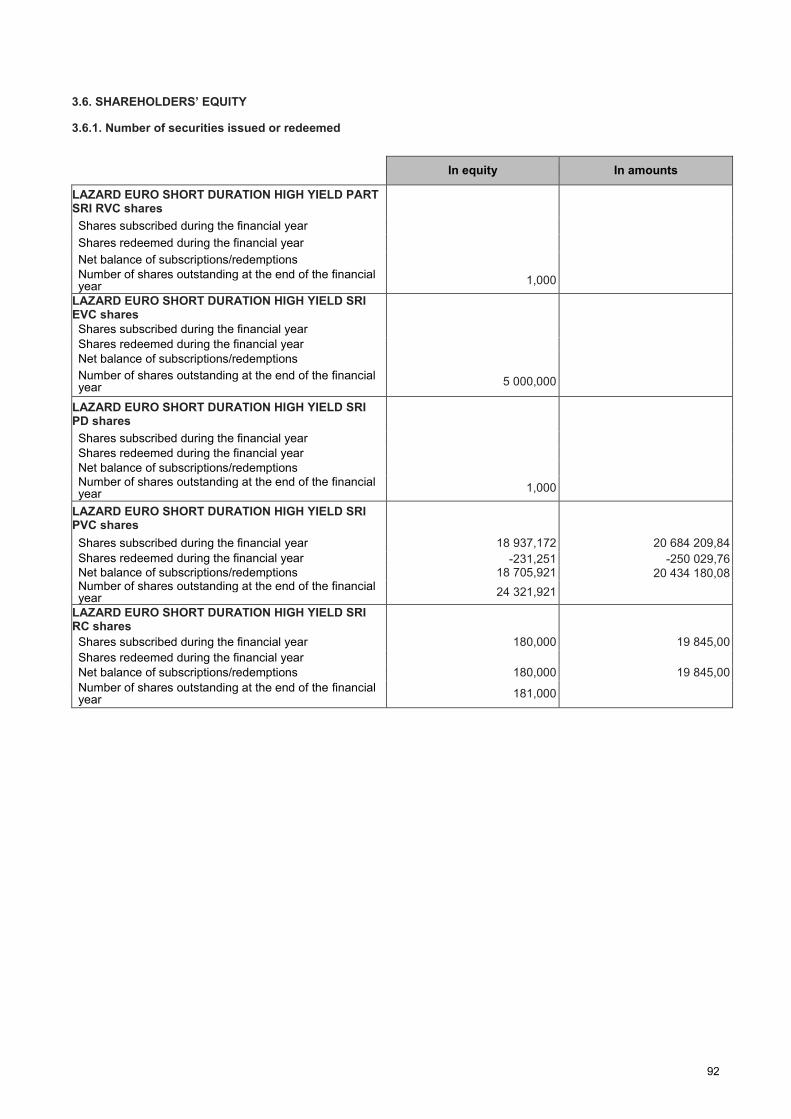
92
3.6. SHAREHOLDERS’ EQUITY 3.6.1. Number of securities issued or redeemed
In equity In amounts
LAZARD EURO SHORT DURATION HIGH YIELD PART SRI RVC shares
Shares subscribed during the financial year
Shares redeemed during the financial year
Net balance of subscriptions/redemptions
Number of shares outstanding at the end of the financial year
1,000
LAZARD EURO SHORT DURATION HIGH YIELD SRI EVC shares
Shares subscribed during the financial year
Shares redeemed during the financial year Net balance of subscriptions/redemptions
Number of shares outstanding at the end of the financial year
5 000,000
LAZARD EURO SHORT DURATION HIGH YIELD SRI PD shares
Shares subscribed during the financial year
Shares redeemed during the financial year
Net balance of subscriptions/redemptions
Number of shares outstanding at the end of the financial year
1,000
LAZARD EURO SHORT DURATION HIGH YIELD SRI PVC shares
Shares subscribed during the financial year 18 937,172 20 684 209,84
Shares redeemed during the financial year -231,251 -250 029,76 Net balance of subscriptions/redemptions 18 705,921 20 434 180,08 Number of shares outstanding at the end of the financial year
24 321,921
LAZARD EURO SHORT DURATION HIGH YIELD SRI RC shares
Shares subscribed during the financial year 180,000 19 845,00
Shares redeemed during the financial year
Net balance of subscriptions/redemptions 180,000 19 845,00
Number of shares outstanding at the end of the financial year
181,000
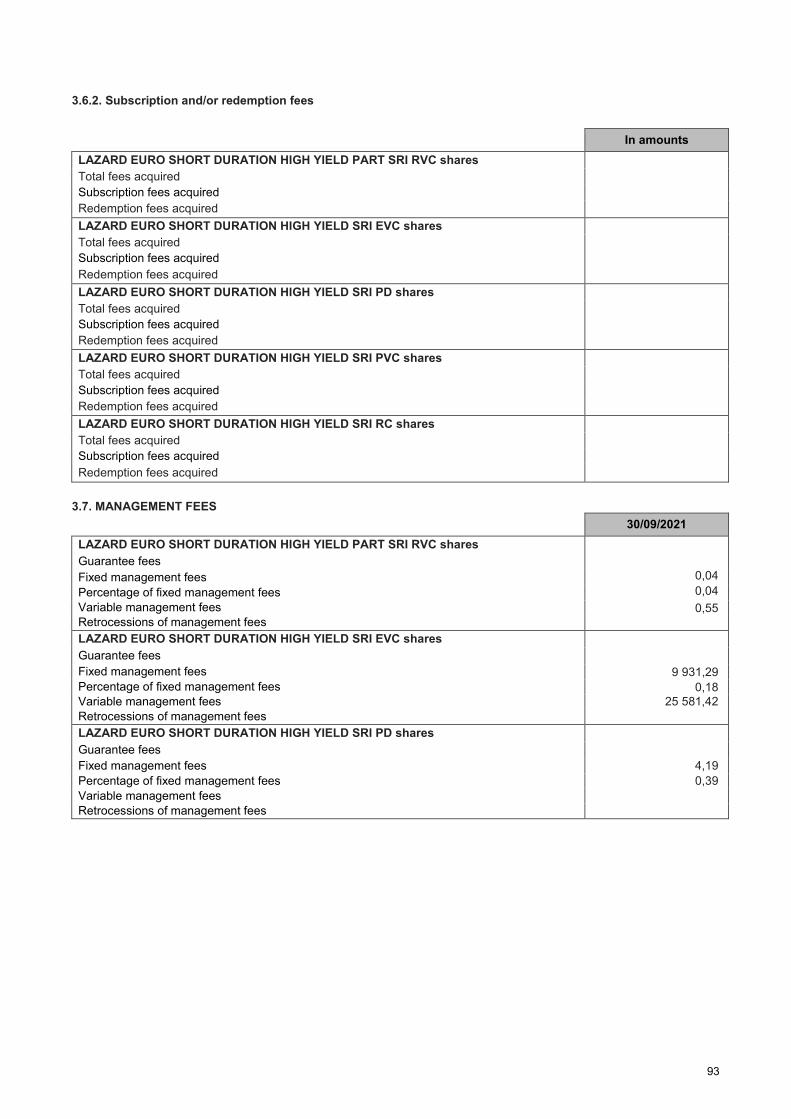
93
3.6.2. Subscription and/or redemption fees
In amounts
LAZARD EURO SHORT DURATION HIGH YIELD PART SRI RVC shares
Total fees acquired
Subscription fees acquired
Redemption fees acquired
LAZARD EURO SHORT DURATION HIGH YIELD SRI EVC shares
Total fees acquired
Subscription fees acquired
Redemption fees acquired
LAZARD EURO SHORT DURATION HIGH YIELD SRI PD shares
Total fees acquired
Subscription fees acquired
Redemption fees acquired
LAZARD EURO SHORT DURATION HIGH YIELD SRI PVC shares
Total fees acquired
Subscription fees acquired
Redemption fees acquired
LAZARD EURO SHORT DURATION HIGH YIELD SRI RC shares
Total fees acquired
Subscription fees acquired
Redemption fees acquired
3.7. MANAGEMENT FEES
30/09/2021
LAZARD EURO SHORT DURATION HIGH YIELD PART SRI RVC shares
Guarantee fees
Fixed management fees 0,04
Percentage of fixed management fees 0,04
Variable management fees 0,55
Retrocessions of management fees
LAZARD EURO SHORT DURATION HIGH YIELD SRI EVC shares
Guarantee fees
Fixed management fees 9 931,29
Percentage of fixed management fees 0,18
Variable management fees 25 581,42
Retrocessions of management fees
LAZARD EURO SHORT DURATION HIGH YIELD SRI PD shares
Guarantee fees
Fixed management fees 4,19
Percentage of fixed management fees 0,39
Variable management fees
Retrocessions of management fees
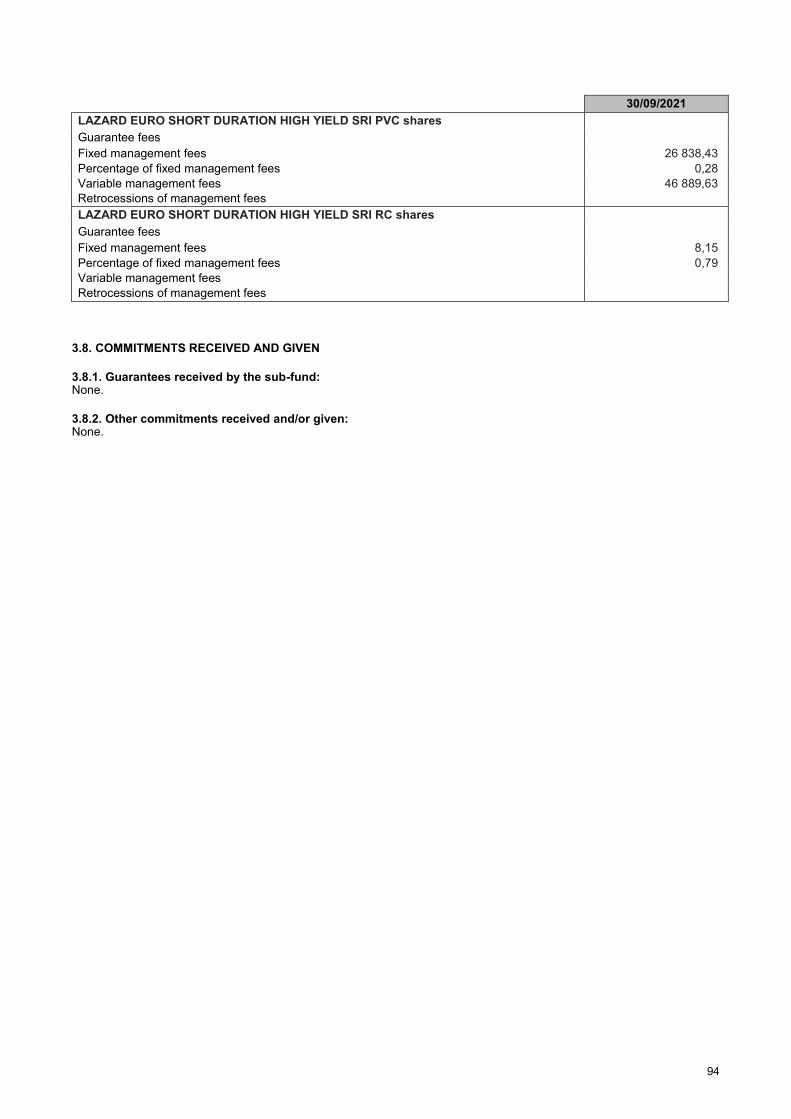
94
30/09/2021
LAZARD EURO SHORT DURATION HIGH YIELD SRI PVC shares
Guarantee fees
Fixed management fees 26 838,43
Percentage of fixed management fees 0,28
Variable management fees 46 889,63
Retrocessions of management fees
LAZARD EURO SHORT DURATION HIGH YIELD SRI RC shares
Guarantee fees
Fixed management fees 8,15
Percentage of fixed management fees 0,79
Variable management fees
Retrocessions of management fees
3.8. COMMITMENTS RECEIVED AND GIVEN
3.8.1. Guarantees received by the sub-fund: None.
3.8.2. Other commitments received and/or given: None.

95
3.9. OTHER INFORMATION 3.9.1. Present value of financial instruments held temporarily
30/09/2021
Securities held under repurchase agreements
Borrowed securities
3.9.2. Present value of securities representing security deposits
30/09/2021
Financial instruments given as security and retained under their original classification
Financial instruments received as security and not recorded on the balance sheet
3.9.3. Financial instruments held, issued and/or managed by the Group
ISIN code Description 30/09/2021
Equities
Bonds
Negotiable debt securities
UCIs
Forward financial instruments
Total group securities

96
3.10. APPROPRIATION OF DISTRIBUTABLE AMOUNTS |
Table of appropriation of distributable income pertaining to net income
30/09/2021 30/09/2020
Remaining amounts to be allocated
Retained earnings
Net income 1 266 144,14 102 524,92
Total 1 266 144,14 102 524,92
30/09/2021 30/09/2020
LAZARD EURO SHORT DURATION HIGH YIELD PART SRI RVC shares
Appropriation
Distribution
Balance brought forward for the financial year
Accumulation 4,56 1,02
Total 4,56 1,02
30/09/2021 30/09/2020
LAZARD EURO SHORT DURATION HIGH YIELD SRI EVC shares
Appropriation
Distribution
Balance brought forward for the financial year
Accumulation 219 769,04 48 831,55
Total 219 769,04 48 831,55
30/09/2021 30/09/2020
LAZARD EURO SHORT DURATION HIGH YIELD SRI PD shares
Appropriation
Distribution 46,74 9,67
Balance brought forward for the financial year
Accumulation
Total 46,74 9,67
Information on units with dividend rights
Number of units 1,000 1,000
Dividend per unit 46,74 9,67
Tax credit
Tax credit attached to the distribution of earnings

97
30/09/2021 30/09/2020
LAZARD EURO SHORT DURATION HIGH YIELD SRI PVC shares
Appropriation
Distribution
Balance brought forward for the financial year
Accumulation 1 045 488,58 53 681,73
Total 1 045 488,58 53 681,73
30/09/2021 30/09/2020
LAZARD EURO SHORT DURATION HIGH YIELD SRI RC shares
Appropriation
Distribution
Balance brought forward for the financial year
Accumulation 835,22 0,95
Total 835,22 0,95
Table of appropriation of distributable amounts pertaining to net capital gains and losses
30/09/2021 30/09/2020
Remaining amounts to be allocated
Undistributed net capital gains and losses recognised in previous years
Net capital gains and losses for the year -30 531,95 121 105,68
Interim dividends paid on net capital gains/losses for the financial year
Total -30 531,95 121 105,68
30/09/2021 30/09/2020
LAZARD EURO SHORT DURATION HIGH YIELD PART SRI RVC shares
Appropriation
Distribution
Undistributed net capital gains and losses
Accumulation -0,08 1,15
Total -0,08 1,15
30/09/2021 30/09/2020
LAZARD EURO SHORT DURATION HIGH YIELD SRI EVC shares
Appropriation
Distribution
Undistributed net capital gains and losses
Accumulation -5 253,92 57 038,01
Total -5 253,92 57 038,01
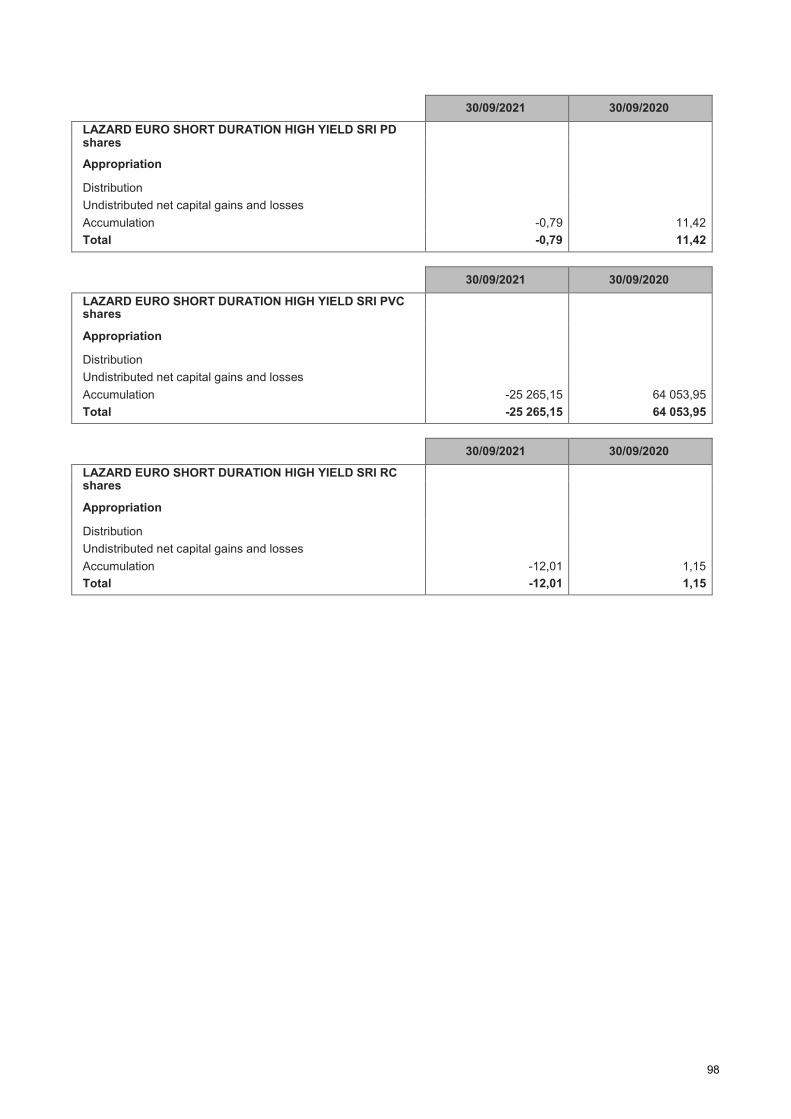
98
30/09/2021 30/09/2020
LAZARD EURO SHORT DURATION HIGH YIELD SRI PD shares
Appropriation
Distribution
Undistributed net capital gains and losses
Accumulation -0,79 11,42
Total -0,79 11,42
30/09/2021 30/09/2020
LAZARD EURO SHORT DURATION HIGH YIELD SRI PVC shares
Appropriation
Distribution
Undistributed net capital gains and losses
Accumulation -25 265,15 64 053,95
Total -25 265,15 64 053,95
30/09/2021 30/09/2020
LAZARD EURO SHORT DURATION HIGH YIELD SRI RC shares
Appropriation
Distribution
Undistributed net capital gains and losses
Accumulation -12,01 1,15
Total -12,01 1,15
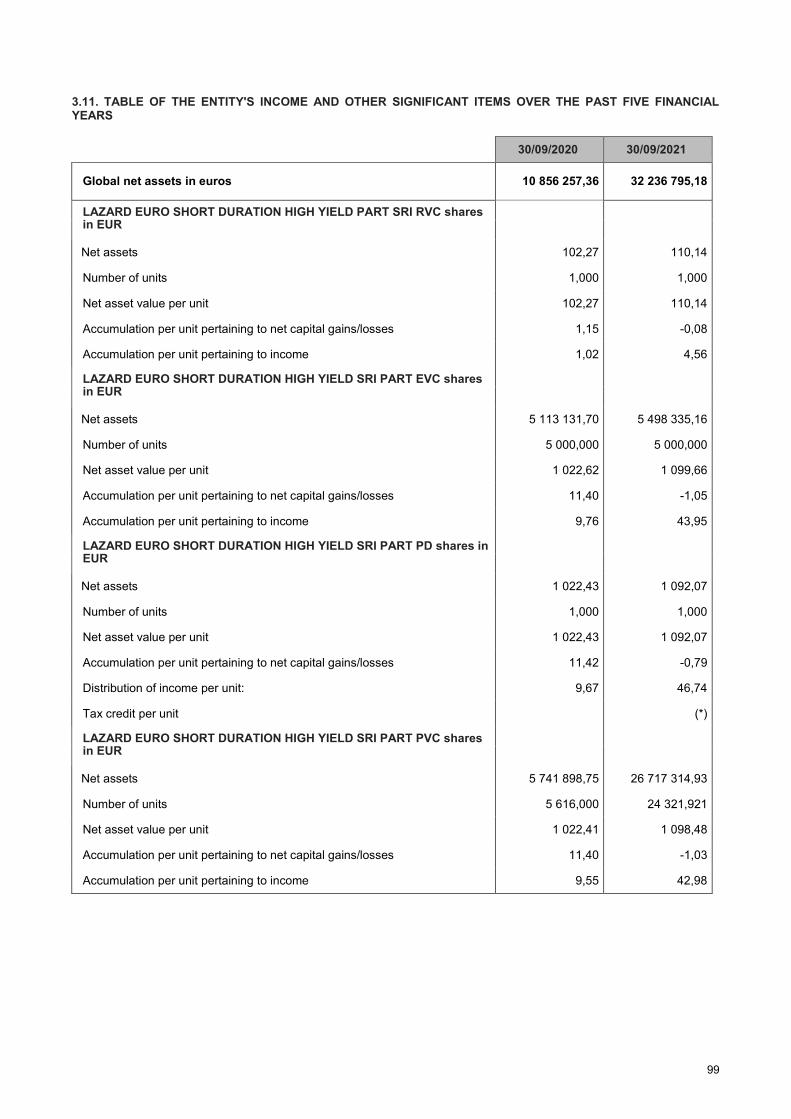
99
3.11. TABLE OF THE ENTITY'S INCOME AND OTHER SIGNIFICANT ITEMS OVER THE PAST FIVE FINANCIAL YEARS
30/09/2020 30/09/2021
Global net assets in euros 10 856 257,36 32 236 795,18
LAZARD EURO SHORT DURATION HIGH YIELD PART SRI RVC shares in EUR
Net assets 102,27 110,14
Number of units 1,000 1,000
Net asset value per unit 102,27 110,14
Accumulation per unit pertaining to net capital gains/losses 1,15 -0,08
Accumulation per unit pertaining to income 1,02 4,56
LAZARD EURO SHORT DURATION HIGH YIELD SRI PART EVC shares in EUR
Net assets 5 113 131,70 5 498 335,16
Number of units 5 000,000 5 000,000
Net asset value per unit 1 022,62 1 099,66
Accumulation per unit pertaining to net capital gains/losses 11,40 -1,05
Accumulation per unit pertaining to income 9,76 43,95
LAZARD EURO SHORT DURATION HIGH YIELD SRI PART PD shares in EUR
Net assets 1 022,43 1 092,07
Number of units 1,000 1,000
Net asset value per unit 1 022,43 1 092,07
Accumulation per unit pertaining to net capital gains/losses 11,42 -0,79
Distribution of income per unit: 9,67 46,74
Tax credit per unit
(*)
LAZARD EURO SHORT DURATION HIGH YIELD SRI PART PVC shares in EUR
Net assets 5 741 898,75 26 717 314,93
Number of units 5 616,000 24 321,921
Net asset value per unit 1 022,41 1 098,48
Accumulation per unit pertaining to net capital gains/losses 11,40 -1,03
Accumulation per unit pertaining to income 9,55 42,98
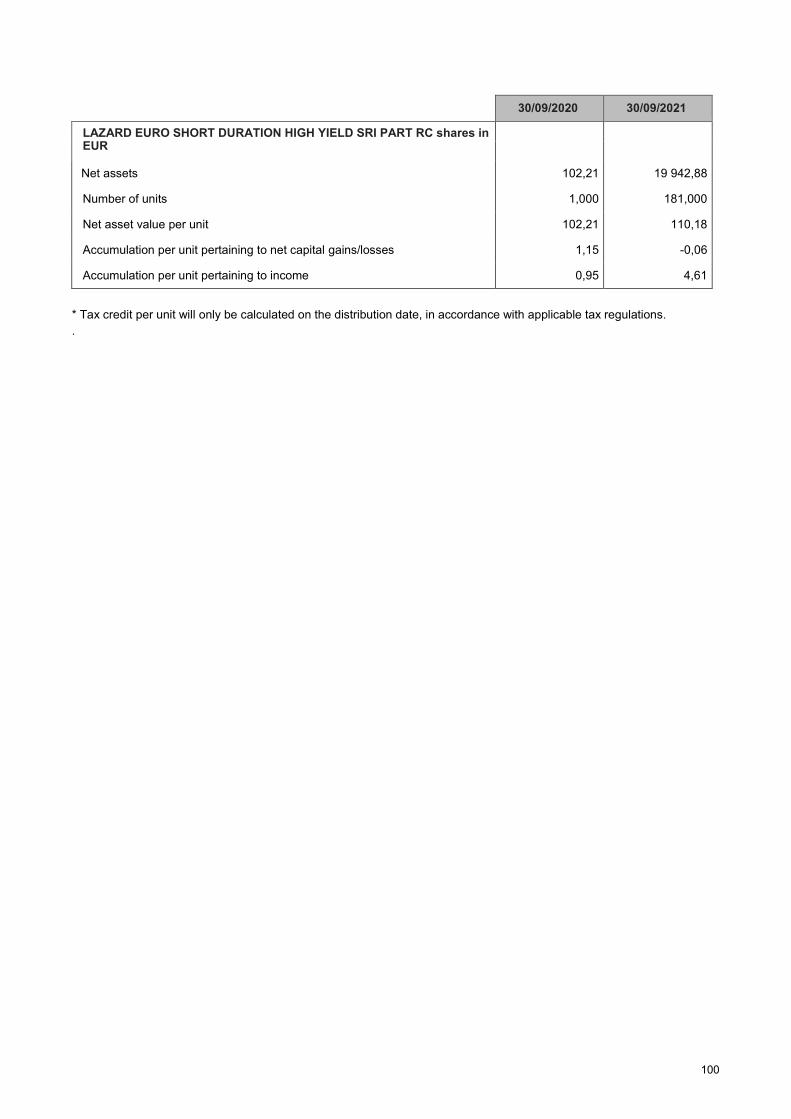
100
30/09/2020 30/09/2021
LAZARD EURO SHORT DURATION HIGH YIELD SRI PART RC shares in EUR
Net assets 102,21 19 942,88
Number of units 1,000 181,000
Net asset value per unit 102,21 110,18
Accumulation per unit pertaining to net capital gains/losses 1,15 -0,06
Accumulation per unit pertaining to income 0,95 4,61
* Tax credit per unit will only be calculated on the distribution date, in accordance with applicable tax regulations.
.
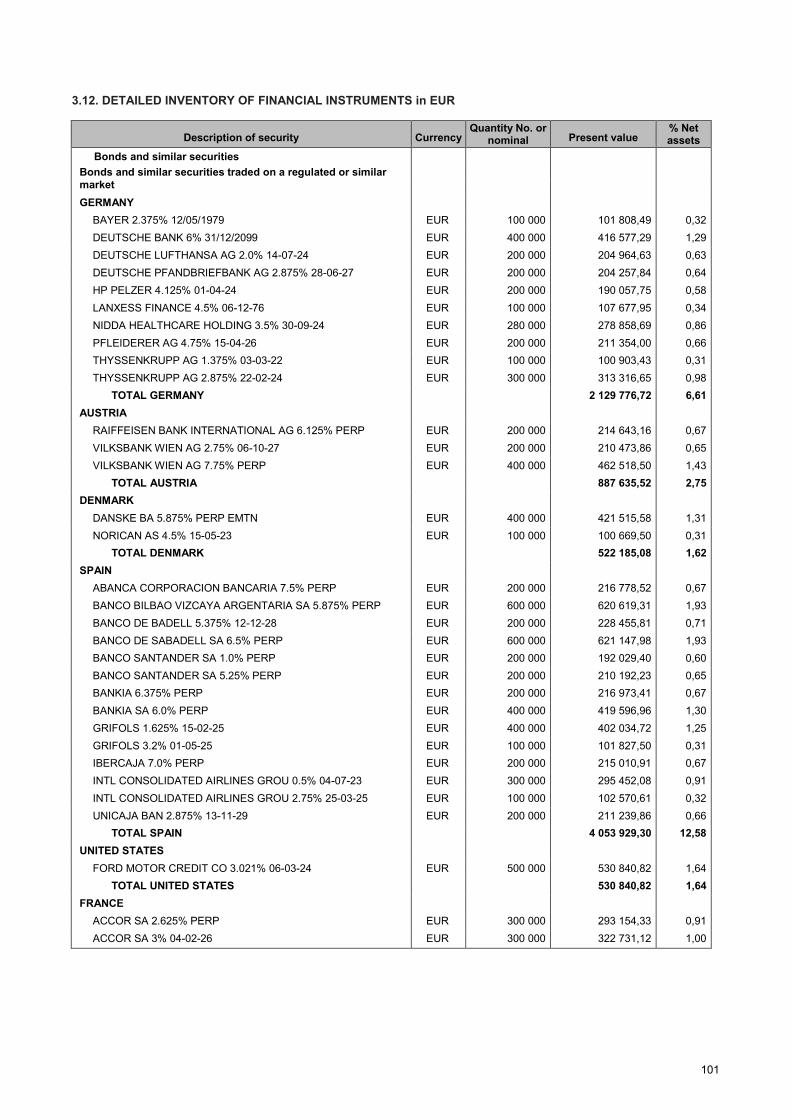
101
3.12. DETAILED INVENTORY OF FINANCIAL INSTRUMENTS in EUR
Description of security Currency Quantity No. or
nominal Present value % Net assets
Bonds and similar securities
Bonds and similar securities traded on a regulated or similar
market
GERMANY
BAYER 2.375% 12/05/1979 EUR 100 000 101 808,49 0,32
DEUTSCHE BANK 6% 31/12/2099 EUR 400 000 416 577,29 1,29
DEUTSCHE LUFTHANSA AG 2.0% 14-07-24 EUR 200 000 204 964,63 0,63
DEUTSCHE PFANDBRIEFBANK AG 2.875% 28-06-27 EUR 200 000 204 257,84 0,64
HP PELZER 4.125% 01-04-24 EUR 200 000 190 057,75 0,58
LANXESS FINANCE 4.5% 06-12-76 EUR 100 000 107 677,95 0,34
NIDDA HEALTHCARE HOLDING 3.5% 30-09-24 EUR 280 000 278 858,69 0,86
PFLEIDERER AG 4.75% 15-04-26 EUR 200 000 211 354,00 0,66
THYSSENKRUPP AG 1.375% 03-03-22 EUR 100 000 100 903,43 0,31
THYSSENKRUPP AG 2.875% 22-02-24 EUR 300 000 313 316,65 0,98
TOTAL GERMANY 2 129 776,72 6,61
AUSTRIA
RAIFFEISEN BANK INTERNATIONAL AG 6.125% PERP EUR 200 000 214 643,16 0,67
VILKSBANK WIEN AG 2.75% 06-10-27 EUR 200 000 210 473,86 0,65
VILKSBANK WIEN AG 7.75% PERP EUR 400 000 462 518,50 1,43
TOTAL AUSTRIA 887 635,52 2,75
DENMARK
DANSKE BA 5.875% PERP EMTN EUR 400 000 421 515,58 1,31
NORICAN AS 4.5% 15-05-23 EUR 100 000 100 669,50 0,31
TOTAL DENMARK 522 185,08 1,62
SPAIN
ABANCA CORPORACION BANCARIA 7.5% PERP EUR 200 000 216 778,52 0,67
BANCO BILBAO VIZCAYA ARGENTARIA SA 5.875% PERP EUR 600 000 620 619,31 1,93
BANCO DE BADELL 5.375% 12-12-28 EUR 200 000 228 455,81 0,71
BANCO DE SABADELL SA 6.5% PERP EUR 600 000 621 147,98 1,93
BANCO SANTANDER SA 1.0% PERP EUR 200 000 192 029,40 0,60
BANCO SANTANDER SA 5.25% PERP EUR 200 000 210 192,23 0,65
BANKIA 6.375% PERP EUR 200 000 216 973,41 0,67
BANKIA SA 6.0% PERP EUR 400 000 419 596,96 1,30
GRIFOLS 1.625% 15-02-25 EUR 400 000 402 034,72 1,25
GRIFOLS 3.2% 01-05-25 EUR 100 000 101 827,50 0,31
IBERCAJA 7.0% PERP EUR 200 000 215 010,91 0,67
INTL CONSOLIDATED AIRLINES GROU 0.5% 04-07-23 EUR 300 000 295 452,08 0,91
INTL CONSOLIDATED AIRLINES GROU 2.75% 25-03-25 EUR 100 000 102 570,61 0,32
UNICAJA BAN 2.875% 13-11-29 EUR 200 000 211 239,86 0,66
TOTAL SPAIN 4 053 929,30 12,58
UNITED STATES
FORD MOTOR CREDIT CO 3.021% 06-03-24 EUR 500 000 530 840,82 1,64
TOTAL UNITED STATES 530 840,82 1,64
FRANCE
ACCOR SA 2.625% PERP EUR 300 000 293 154,33 0,91
ACCOR SA 3% 04-02-26 EUR 300 000 322 731,12 1,00

102
3.12. DETAILED INVENTORY OF FINANCIAL INSTRUMENTS in EUR
Description of security Currency Quantity No. or nominal
Present value % Net assets
AIR FRANCEKLM 3.75% 12-10-22 EUR 400 000 423 411,23 1,32
AIR FR KLM 1.875% 16-01-25 EUR 100 000 96 688,25 0,30
AIR FR KLM 3.0% 01-07-24 EUR 200 000 201 065,64 0,62
BNP PARIBAS FIX PERP EUR 550 000 580 454,12 1,80
BURGER KING FRANCE SAS E3R+5.25% 01-05-23 EUR 100 000 101 332,75 0,31
CASINO 1.865% 13-06-22 EMTN EUR 500 000 501 884,42 1,55
CMA CGM 5.25% 15-01-25 EUR 200 000 207 957,17 0,65
CMA CGM 7.5% 15-01-26 EUR 100 000 112 578,33 0,35
EDF 4.0% PERP EUR 500 000 534 665,00 1,66
ELIOR GROUP SCA 3.75% 15-07-26 EUR 100 000 104 571,42 0,33
ENGIE 3.25% PERP EUR 300 000 330 238,79 1,03
FAURECIA 2.625% 15-06-25 EUR 100 000 102 114,29 0,31
FAURECIA 3.125% 15-06-26 EUR 200 000 206 897,36 0,64
GROUPAMA ASSURANCES MUTUELLES SA 6.375% PERP EUR 100 000 117 195,08 0,37
GROUPE DANONE 1.75% PERP EMTN EUR 200 000 205 958,67 0,63
LA FINANCIERE ATALIAN 4.0% 15-05-24 EUR 100 000 100 045,44 0,31
LOXAM 3.5% 03/05/2023 EUR 200 000 200 590,44 0,62
PARTS EUROPE 6.5% 16-07-25 EUR 250 000 264 814,72 0,82
PICARD GROUPE 3.875% 01-07-26 EUR 200 000 205 420,56 0,64
RENAULT 1.25% 24-06-25 EMTN EUR 200 000 199 098,63 0,62
REXEL 2.75% 15/06/2026 EUR 200 000 206 215,28 0,64
SOLVAY FINANCE 5.425% 31/12/99 EUR 300 000 343 420,03 1,07
SPCM 2.0% 01/02/2026 EUR 200 000 204 711,11 0,64
TEREOS FINANCE GROUPE I 7.5% 30-10-25 EUR 300 000 333 062,50 1,03
UNIBAIL RODAMCO SE 2.125% PERP EUR 500 000 510 016,20 1,58
VALLOUREC 8.5% 30-06-26 EUR 200 000 209 776,89 0,65
TOTAL FRANCE 7 220 069,77 22,40
GREECE
ALPHA BANK 4.25% 13-02-30 EMTN EUR 700 000 716 261,10 2,22
NATL BANK OF GREECE 8.25% 18-07-29 EUR 500 000 577 230,07 1,79
PIRAEUS FINANCIAL 8.75% PERP EUR 300 000 313 802,34 0,98
PIRAEUS FINANCIAL 9.75% 26-06-29 EUR 500 000 562 568,66 1,74
TOTAL GREECE 2 169 862,17 6,73
IRELAND
SMURFIT KAPPA ACQUISITIONS 2.875% 15-01-26 EUR 200 000 222 740,81 0,69
TOTAL IRELAND 222 740,81 0,69
ITALY
AUTO PER L IT 1.625% 12-06-23 EUR 250 000 256 163,84 0,79
BANCA IFIS 4.5% 17-10-27 EMTN EUR 200 000 212 379,45 0,66
BANCO BPM 2.875% 29-06-31 EMTN EUR 100 000 101 134,04 0,32
BANCO BPM 4.25% 01-10-29 EUR 100 000 106 730,93 0,33
BANCO BPM FIX 21-09-27 EUR 400 000 414 987,29 1,28
ENEL 2.5% 24/11/1978 EUR 300 000 319 461,55 0,99
ENI 2.625% PERP EUR 500 000 533 240,65 1,66
FONDIARIA SAI 5.75% 31-12-99 EUR 200 000 224 776,74 0,69
INTE 3.75% PERP EUR 250 000 248 509,32 0,77
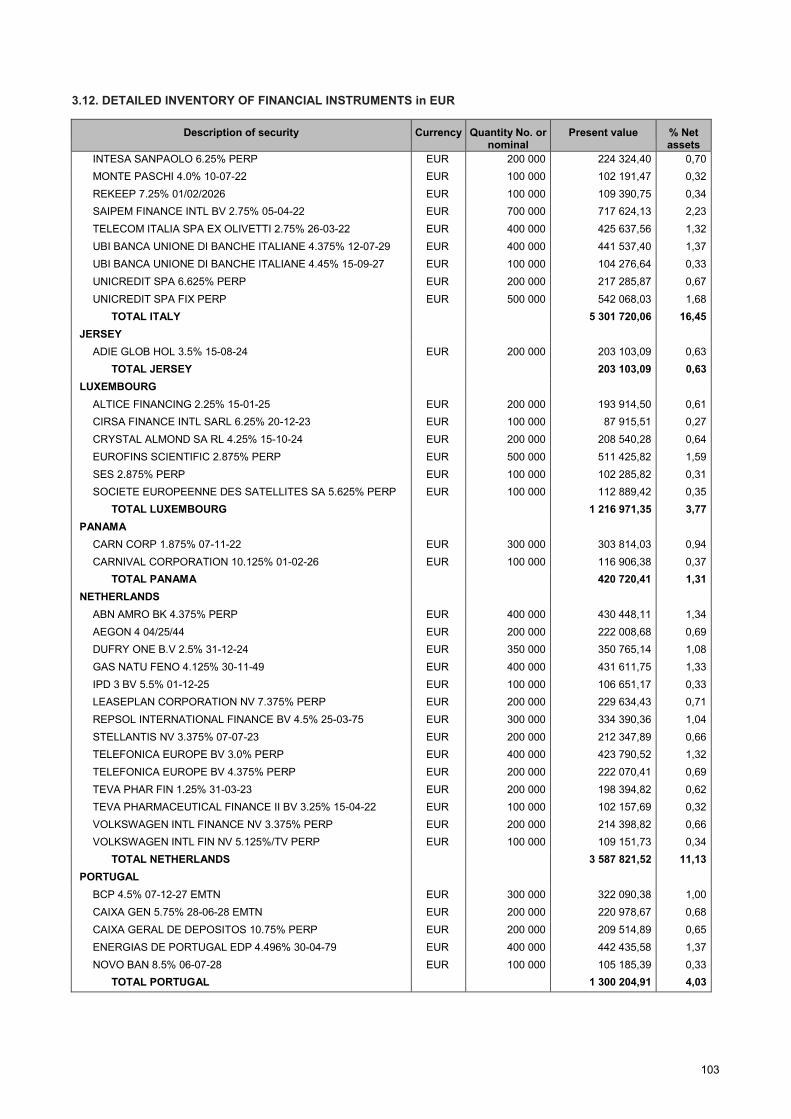
103
3.12. DETAILED INVENTORY OF FINANCIAL INSTRUMENTS in EUR
Description of security Currency Quantity No. or nominal
Present value % Net assets
INTESA SANPAOLO 6.25% PERP EUR 200 000 224 324,40 0,70
MONTE PASCHI 4.0% 10-07-22 EUR 100 000 102 191,47 0,32
REKEEP 7.25% 01/02/2026 EUR 100 000 109 390,75 0,34
SAIPEM FINANCE INTL BV 2.75% 05-04-22 EUR 700 000 717 624,13 2,23
TELECOM ITALIA SPA EX OLIVETTI 2.75% 26-03-22 EUR 400 000 425 637,56 1,32
UBI BANCA UNIONE DI BANCHE ITALIANE 4.375% 12-07-29 EUR 400 000 441 537,40 1,37
UBI BANCA UNIONE DI BANCHE ITALIANE 4.45% 15-09-27 EUR 100 000 104 276,64 0,33
UNICREDIT SPA 6.625% PERP EUR 200 000 217 285,87 0,67
UNICREDIT SPA FIX PERP EUR 500 000 542 068,03 1,68
TOTAL ITALY 5 301 720,06 16,45
JERSEY
ADIE GLOB HOL 3.5% 15-08-24 EUR 200 000 203 103,09 0,63
TOTAL JERSEY 203 103,09 0,63
LUXEMBOURG
ALTICE FINANCING 2.25% 15-01-25 EUR 200 000 193 914,50 0,61
CIRSA FINANCE INTL SARL 6.25% 20-12-23 EUR 100 000 87 915,51 0,27
CRYSTAL ALMOND SA RL 4.25% 15-10-24 EUR 200 000 208 540,28 0,64
EUROFINS SCIENTIFIC 2.875% PERP EUR 500 000 511 425,82 1,59
SES 2.875% PERP EUR 100 000 102 285,82 0,31
SOCIETE EUROPEENNE DES SATELLITES SA 5.625% PERP EUR 100 000 112 889,42 0,35
TOTAL LUXEMBOURG 1 216 971,35 3,77
PANAMA
CARN CORP 1.875% 07-11-22 EUR 300 000 303 814,03 0,94
CARNIVAL CORPORATION 10.125% 01-02-26 EUR 100 000 116 906,38 0,37
TOTAL PANAMA 420 720,41 1,31
NETHERLANDS
ABN AMRO BK 4.375% PERP EUR 400 000 430 448,11 1,34
AEGON 4 04/25/44 EUR 200 000 222 008,68 0,69
DUFRY ONE B.V 2.5% 31-12-24 EUR 350 000 350 765,14 1,08
GAS NATU FENO 4.125% 30-11-49 EUR 400 000 431 611,75 1,33
IPD 3 BV 5.5% 01-12-25 EUR 100 000 106 651,17 0,33
LEASEPLAN CORPORATION NV 7.375% PERP EUR 200 000 229 634,43 0,71
REPSOL INTERNATIONAL FINANCE BV 4.5% 25-03-75 EUR 300 000 334 390,36 1,04
STELLANTIS NV 3.375% 07-07-23 EUR 200 000 212 347,89 0,66
TELEFONICA EUROPE BV 3.0% PERP EUR 400 000 423 790,52 1,32
TELEFONICA EUROPE BV 4.375% PERP EUR 200 000 222 070,41 0,69
TEVA PHAR FIN 1.25% 31-03-23 EUR 200 000 198 394,82 0,62
TEVA PHARMACEUTICAL FINANCE II BV 3.25% 15-04-22 EUR 100 000 102 157,69 0,32
VOLKSWAGEN INTL FINANCE NV 3.375% PERP EUR 200 000 214 398,82 0,66
VOLKSWAGEN INTL FIN NV 5.125%/TV PERP EUR 100 000 109 151,73 0,34
TOTAL NETHERLANDS 3 587 821,52 11,13
PORTUGAL
BCP 4.5% 07-12-27 EMTN EUR 300 000 322 090,38 1,00
CAIXA GEN 5.75% 28-06-28 EMTN EUR 200 000 220 978,67 0,68
CAIXA GERAL DE DEPOSITOS 10.75% PERP EUR 200 000 209 514,89 0,65
ENERGIAS DE PORTUGAL EDP 4.496% 30-04-79 EUR 400 000 442 435,58 1,37
NOVO BAN 8.5% 06-07-28 EUR 100 000 105 185,39 0,33
TOTAL PORTUGAL 1 300 204,91 4,03

104
3.12. DETAILED INVENTORY OF FINANCIAL INSTRUMENTS in EUR
Description of security Currency Quantity No. or nominal
Present value % Net assets
UNITED KINGDOM
HSBC HOLDINGS PLC 5.25% PERP EUR 300 000 310 741,65 0,96
INEOS FINANCE 2.875% 01-05-26 EUR 100 000 102 230,38 0,32
VODAFONE GROUP 3.1% 03-01-79 EUR 200 000 212 765,25 0,66
YULE CATTO AND 3.875% 01-07-25 EUR 200 000 209 311,08 0,65
TOTAL UNITED KINGDOM 835 048,36 2,59
TOTAL Bonds and similar securities traded on a regulated or similar market
30 602 629,89 94,93
TOTAL Bonds and similar securities 30 602 629,89 94,93
Forward financial instruments
Futures contracts
Futures contracts on a regulated or equivalent market
EURO BOBL 1221 EUR -60 55 800,00 0,17
EURO SCHATZ 1221 EUR -50 250,00
TOTAL Futures contracts on a regulated or equivalent market
56 050,00 0,17
TOTAL Futures contracts 56 050,00 0,17
TOTAL Forward financial instruments 56 050,00 0,17
Margin call
CACEIS MARGIN CALL EUR -56 050 -56 050,00 -0,17
TOTAL Margin call -56 050,00 -0,17
Receivables 136 471,83 0,42
Liabilities -84 891,17 -0,26
Financial accounts 1 582 584,63 4,91
Net assets 32 236 795,18 100,00
LAZARD EURO SHORT DURATION HIGH YIELD SRI PD shares
EUR 1,000 1 092,07
LAZARD EURO SHORT DURATION HIGH YIELD SRI EVC shares
EUR 5 000,000 1 099,66
LAZARD EURO SHORT DURATION HIGH YIELD SRI PVC shares
EUR 24 321,921 1 098,48
LAZARD EURO SHORT DURATION HIGH YIELD SRI RC shares
EUR 181,000 110,18
LAZARD EURO SHORT DURATION HIGH YIELD SRI RVC shares
EUR 1,000 110,14

105
ADDITIONAL INFORMATION ON THE TAX REGIME APPLICABLE TO INTEREST PAYMENTS
Breakdown of interest: LAZARD EURO SHORT DURATION HIGH YIELD SRI PD shares
NET OVERALL CURRENCY NET PER UNIT CURRENCY
Revenue subject to non-definitive withholding tax 46,74 EUR 46,74 EUR
Equities eligible for a tax allowance and subject to non-
definitive withholding tax
Other income not eligible for a tax allowance and subject to
non-definitive withholding tax
Non-declarable and non-taxable income
Amounts paid out in relation to capital gains and losses
TOTAL 46,74 EUR 46,74 EUR
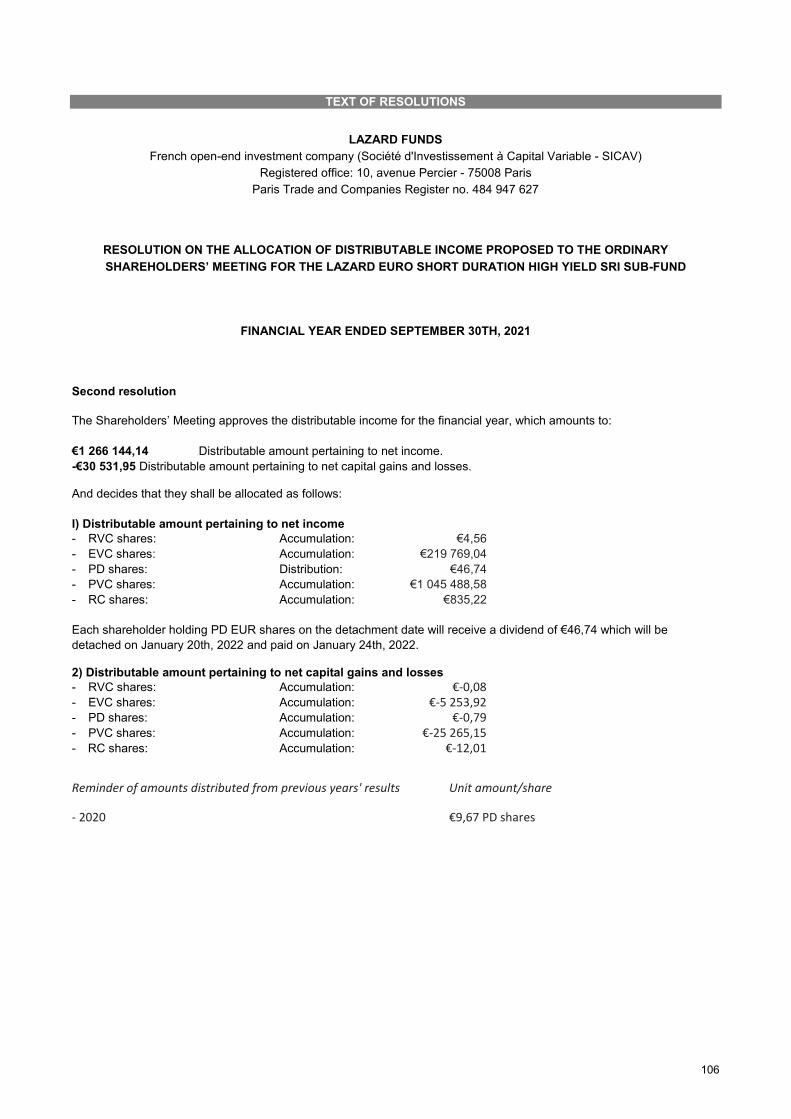
106
TEXT OF RESOLUTIONS
LAZARD FUNDS
French open-end investment company (Société d'Investissement à Capital Variable - SICAV)
Registered office: 10, avenue Percier - 75008 Paris
Paris Trade and Companies Register no. 484 947 627
RESOLUTION ON THE ALLOCATION OF DISTRIBUTABLE INCOME PROPOSED TO THE ORDINARY
SHAREHOLDERS’ MEETING FOR THE LAZARD EURO SHORT DURATION HIGH YIELD SRI SUB-FUND
FINANCIAL YEAR ENDED SEPTEMBER 30TH, 2021
Second resolution
The Shareholders’ Meeting approves the distributable income for the financial year, which amounts to:
€1 266 144,14 Distributable amount pertaining to net income.
-€30 531,95 Distributable amount pertaining to net capital gains and losses.
And decides that they shall be allocated as follows:
I) Distributable amount pertaining to net income
- RVC shares: Accumulation: €4,56
- EVC shares: Accumulation: €219 769,04
- PD shares: Distribution: €46,74
- PVC shares: Accumulation: €1 045 488,58
- RC shares: Accumulation: €835,22
Each shareholder holding PD EUR shares on the detachment date will receive a dividend of €46,74 which will be
detached on January 20th, 2022 and paid on January 24th, 2022.
2) Distributable amount pertaining to net capital gains and losses
- RVC shares: Accumulation: €-0,08
- EVC shares: Accumulation: €-5 253,92
- PD shares: Accumulation: €-0,79
- PVC shares: Accumulation: €-25 265,15
- RC shares: Accumulation: €-12,01
Reminder of amounts distributed from previous years' results Unit amount/share - 2020 €9,67 PD shares