Lateglacial and Holocene environmental changes in Portuguese coastal lagoons 1: the sedimentological...
15
The Holocene 13,3 (2003) pp. 433–446 Lateglacial and Holocene environmental changes in Portuguese coastal lagoons 1: the sedimentological and geochemical records of the Santo Andre ´ coastal area Maria da Conceic ¸a ˜o Freitas, 1 * Ce ´sar Andrade, 1 Fernando Rocha, 2 Colombo Tassinari, 3 Jose ´ Manuel Munha ´, 1 Anabela Cruces, 1 Jesus Vidinha 2 and Carlos Marques da Silva 1 ( 1 Centro de Geologia da Universidade de Lisboa, Bloco C2, 5° Piso, Campo Grande, 1749-016 Lisboa, Portugal; 2 Departamento de Geocie ˆncias, Universidade de Aveiro, 3810-193 Aveiro, Portugal; 3 Universidade de S. Paulo, Instituto de Geocie ˆncias – Centro de Pesquisas Geocronolo ´gicas, S. Paulo, Brasil) Abstract: The sedimentological and geochemical study of a core corresponding to sedimentation in the Santo Andre ´ lowland since 14 000 BP allowed the reconstruction of environmental changes of this area and discussion of the relative importance of local versus global forcing factors responsible for its evolution. The pre-Holocene section of the core represents terrestrial sedimentation in a uviatile environment, contemporaneous of a low sea level and a distal shoreline. Sediment inputs were terrestrial and resulting from intensive weathering and high erosion rate in the adjacent watershed. During the Early Holocene (c. 10 020 to 5380 BP) the sea invaded this lowland and de ned an open marine shallow environment corresponding to a wide gulf which has been disturbed by multiple terrestrial inputs that might have been induced by massive episodes of uvial discharge. The rst symptoms of con nement were noticed close to 5400 BP, and c. 5380 BP a major environmental threshold occurred (possibly re ecting the marked deceleration of the sea-level rise rate) corresponding to the establishment of an ef cient detrital barrier that completely isolated the bay and changed this lowland into a closed coastal lagoon. After 5380 BP, the lagoonal environment evolved as a function of local forcing factors, among which the frequency and ef ciency of exchanges with the ocean predominate: until c. 3570 BP the lagoon was restricted, fed by fresh water and terrestrial sediment inputs; a second episode of lagoonal sedimen- tation lasts until c. 1620 BP, re ecting brackish conditions and increase in marine in uence due to a reduced ef ciency of the barrier. The upper section of the core represents the nal stages of lling of the lagoonal margin by uvial activity. Human settling and intervention in the barrier are possible causes of a short-lived return to brackish conditions recorded in the uppermost sediment unit of the core and of the dramatic increase of the sedimentation rates. Key words: Palaeoenvironmental reconstruction, coastal evolution, Portugal, lagoon, textural proxies, mineral- ogical proxies, chemical proxies, strontium isotopes, Lateglacial, Holocene. Introduction It is widely accepted that most of the present-day European coas- tal lagoons have formed after 7000 BP where estuaries or coastal embayments ooded by the Holocene transgression have become enclosed by detrital barriers, which differentiated as a sequel of the fast decelerating rate of sea-level rise resulting from the melt- *Author for correspondence (e-mail: cfreitas@fc. ul.pt) Ó Arnold 2003 10.1191/0959683603hl636rp ing of the last Pleistocene continental ice. Closing of the shore appears to have been a widespread response to increased stability in littorals free from signi cant postglacial isostatic rebound. This is con rmed by the mid- and late-Holocene geological record of Portuguese coastal lagoons which has been studied during the last decade for palaeoenvironmental reconstruction of that time per- iod; these studies rely on multidisciplinary approaches and the interpretations are based on present-day analogues and compara- tive modelling of the microscale behaviour of these systems
Transcript of Lateglacial and Holocene environmental changes in Portuguese coastal lagoons 1: the sedimentological...

The Holocene 13,3 (2003) pp. 433–446
Lateglacial and Holocene environmentalchanges in Portuguese coastal lagoons 1:the sedimentological and geochemicalrecords of the Santo Andre coastal areaMaria da Conceicao Freitas,1* Cesar Andrade,1 Fernando Rocha,2
Colombo Tassinari,3 Jose Manuel Munha,1 Anabela Cruces,1
Jesus Vidinha2 and Carlos Marques da Silva1
(1Centro de Geologia da Universidade de Lisboa, Bloco C2, 5° Piso, CampoGrande, 1749-016 Lisboa, Portugal; 2Departamento de Geociencias,Universidade de Aveiro, 3810-193 Aveiro, Portugal; 3Universidade de S. Paulo,Instituto de Geociencias – Centro de Pesquisas Geocronologicas, S. Paulo,Brasil)
Abstract: The sedimentological and geochemical study of a core corresponding to sedimentation in the SantoAndre lowland since 14 000 BP allowed the reconstruction of environmental changes of this area and discussionof the relative importance of local versus global forcing factors responsible for its evolution. The pre-Holocenesection of the core represents terrestrial sedimentation in a � uviatile environment, contemporaneous of a lowsea level and a distal shoreline. Sediment inputs were terrestrial and resulting from intensive weathering andhigh erosion rate in the adjacent watershed. During the Early Holocene (c. 10 020 to 5380 BP) the sea invadedthis lowland and de� ned an open marine shallow environment corresponding to a wide gulf which has beendisturbed by multiple terrestrial inputs that might have been induced by massive episodes of � uvial discharge.The � rst symptoms of con� nement were noticed close to 5400 BP, and c. 5380 BP a major environmentalthreshold occurred (possibly re� ecting the marked deceleration of the sea-level rise rate) corresponding to theestablishment of an ef� cient detrital barrier that completely isolated the bay and changed this lowland into aclosed coastal lagoon. After 5380 BP, the lagoonal environment evolved as a function of local forcing factors,among which the frequency and ef� ciency of exchanges with the ocean predominate: until c. 3570 BP thelagoon was restricted, fed by fresh water and terrestrial sediment inputs; a second episode of lagoonal sedimen-tation lasts until c. 1620 BP, re� ecting brackish conditions and increase in marine in� uence due to a reducedef� ciency of the barrier. The upper section of the core represents the � nal stages of � lling of the lagoonalmargin by � uvial activity. Human settling and intervention in the barrier are possible causes of a short-livedreturn to brackish conditions recorded in the uppermost sediment unit of the core and of the dramatic increaseof the sedimentation rates.
Key words: Palaeoenvironmental reconstruction, coastal evolution, Portugal, lagoon, textural proxies, mineral-ogical proxies, chemical proxies, strontium isotopes, Lateglacial, Holocene.
Introduction
It is widely accepted that most of the present-day European coas-tal lagoons have formed after 7000 BP where estuaries or coastalembayments � ooded by the Holocene transgression have becomeenclosed by detrital barriers, which differentiated as a sequel ofthe fast decelerating rate of sea-level rise resulting from the melt-
*Author for correspondence (e-mail: cfreitas@fc. ul.pt)
Ó Arnold 2003 10.1191/0959683603hl636rp
ing of the last Pleistocene continental ice. Closing of the shoreappears to have been a widespread response to increased stabilityin littorals free from signi� cant postglacial isostatic rebound. Thisis con� rmed by the mid- and late-Holocene geological record ofPortuguese coastal lagoons which has been studied during the lastdecade for palaeoenvironmental reconstruction of that time per-iod; these studies rely on multidisciplinary approaches and theinterpretations are based on present-day analogues and compara-tive modelling of the microscale behaviour of these systems

434 The Holocene 13 (2003)
(Freitas et al., 1993; Freitas and Andrade, 1994; Freitas, 1995;Bao et al., 1999). In contrast, the palaeoenvironmentalchanges ofthose lowlands during the Lateglacial and early Holocene are rareand limited in scope (cf. Mateus, 1992; Queiroz and Mateus,1994).
Sea-level data with interest for the Portuguese coast are sparse(Clark et al., 1978; Dias, 1985; 1987) and generally lack adequateresolution or include a high-stand above the present level (c. 2000BP) that has never been demonstrated (Bao et al., 1999). How-ever, the critical change of sea-level rise rate c. 5000 BP is a com-mon feature in this literature.
This paper corresponds to a pilot project and presents a contri-bution to the � rst detailed and multidisciplinary study of a con-tinuous core taken from the lowland of Santo Andre (southwesterncoast of Portugal) that extends from 14 000 BP until present.Future work in this lowland might re� ne the interpretationpresented in this paper. Yet the internal consistency foundbetween distinct environmentally sensitive proxies and coherencewith other reconstructions established in similar environmentsalong the same coast suggest that the main evolutionary stageshere de� ned stand on their own merit despite being supported bythe study of one single core. Due to its geomorphological setting,this area contains a geological record that provides key elementsto the understanding of the post Lateglacial evolution of theSouthwestern Iberian coast. This study aims to reconstruct theenvironmental changes experienced at a local scale and to sortout the relative importance of local versus global forcing factorsas major controls of its evolution using sedimentological and geo-chemical proxies. The palaeoecological approach to this core isexplained in the papers by Cearreta et al. (this issue) and Santosand Goni (this issue).
The study area
The Santo Andre coastal area is located some 80 km south ofLisbon, in the southern half of the Troia-Sines coastal bay(Figure 1A), a high mesotidal coast according to Hayes (1978).This section of the coast is dominated by long-period west-north-western swell and is occasionally disturbed by short-lived butviolent western or southwestern storms. The coast is pronouncedlyarcuate, similar to the equilibrium shape described by Silvester(1974). This explains why the yearly net littoral drift volume issmall in spite of a high wave-energy regime.
The main geomorphologic feature of this area is the SantoAndre coastal lagoon, a closed lagoon according to Nichols andAllen (1981). The lagoon is separated from the ocean by a con-tinuous re� ective sand barrier consisting of multiple sand ridges(de� ning a ridge-and-swale morphology) in its southern section(Figure 1B). These ridges trend obliquely and merge with thepresent-day beach-foredune system, progressively decreasing thewidth and complexity of the barrier towards the north where itreduces to a single detached beach. In this location, the barriermay occasionally breach during storms and a channel has beenarti� cially and regularly cut since at least the seventeenth century,to promote water exchange, prevent eutrophication and drain thetributary alluvial plains, reclaimed for grazing (cf. Cardoso, 1747;Silva, 1869). This is usually carried out during spring tides inEaster and with annual periodicity. The inlet is ephemeral andevolves naturally until complete silting up in a matter of weeks,essentially trough wave-driven cross-shore sediment transfer.
The � ooded surface of the Santo Andre lagoon changesbetween 1.7 and 2.5 km2, as a function of rainfall and drainageinduced by barrier breaching. The average depth and storedvolume of water vary seasonally, the maximum depths (observedin tidal channels close to the barrier) not exceeding 4 m. The sal-inity ranges seasonally between 35‰ during open-inlet periodsand brackish when the lagoon is isolated from the ocean.
This lagoon displays a complex plan shape and consists of a cen-tral main basin and a number of con� ned N–S elongated troughs(locally designated by ‘Pocos’ and associated with the ridge-and-swales) that are connected to the major water body by restrictedchannels (Figure 1B). The lagoon collects � uvial inputs of waterand sediment of two main drainage networks that outlet from theeast and south, through wide alluvial plains extensively chokedwith sediment.
Methods
A continuous 25.45 m long sediment core was taken in June 1998from the alluvial plain of Badoca in a distal location relative tothe tidal inlet (Figure 1B). The coring site was coordinated andconnected to the UTM grid and Portuguese vertical Datum (meansea level – m.s.l.). In this paper positive and negative elevation� gures refer to heights and depths above and below m.s.l. respect-ively. The borehole (LSA – UTM 29SNC18601511, elevation+2.743 m) has been performed using 50 to 75 mm diameters and1 m long Shelby samplers, driven by hydraulic pressure and oper-ated inside a cased borehole. The core reached the basement(locally represented by Miocene sediments) at –21.33 m. Thecoring site has been chosen after a preliminary regional lithostrati-graphic survey consisting of the retrieving and study of a set of23 short cores (maximum length c. 9 m), which were describedin the � eld and sampled for dating purposes.
In the laboratory, the core was opened longitudinally anddescribed macroscopically.Both halves were then subsampled fordating, sedimentological, geochemical and palaeoecological stud-ies. Samples were oven-dried at 60°C and split for further pro-cessing. Organic matter (O.M.) content was determined usingabout 1 g of dried sediment through oxidation with potassium-dichromate followed by titration using iron-sulphate (Standard E-201, LNEC, 1967). Grain-size analysis was undertaken by stan-dard sieving on sediment coarser than 63 mm and the undersizedfraction has been studied using a Fritsch laser particle analyser.Sediment classi� cation follows Larsonneur (1977); the dimen-sional and sorting textural classi� cation of sand follows Friedmanand Sanders (1978). The carbonate content (bioclasts) wasdetermined by weight difference before and after digestion withdiluted hydrochloric acid.
The mineralogical composition of both the � ne-grained fraction(<63 mm) and clayey fraction (<2 mm) was determined in a setof 66 samples using x-ray diffraction, according to the method-ology of Rocha (1993). The correspondentdiffractograms alloweda semi-quantitative interpretation,following criteria recommendedby Schultz (1964) and Thorez (1976).
Thirty-� ve whole rock (dried) sediment samples were analysedby fusion inductively coupled plasma emission/mass spectrometry(ICP/MS) and instrumental neutron activation analysis (ActivationLaboratories Ltd., Canada) for major and several trace elements(Table 1). Out of these, 19 samples were further analysed forstrontium isotopes at the GeochronologicalResearch Center of theUniversity of Sao Paulo (Brasil). Strontium isotopic analysis werecarried out on a multicollector Finnigan-Mat 262 mass spec-trometer using standard methods according to the analytical pro-cedures described by Kawachita (1972); isotopic ratios were nor-malized to 86Sr:88Sr = 0.1194, giving a mean 87Sr:86Sr for NBS987standard of 0.71028 6 0.00006 (2s).
Sediment samples collected for dating consisted of thin (1–2 cm) slices of organic muds and more rarely wood. Samples weredated by standard accelerated mass spectrometry (AMS) 14Cradiometric determination at Beta Analytic Inc., USA. Calibrationof radiocarbon dates was performed according to Vogel et al.(1993), Talma and Vogel (1993) and Stuiver et al. (1993).

Palaeoclimate records Special Issue: Multiproxy palaeoenvironmental reconstruction of a Portuguese lagoonal system 435
Results
The sedimentological and geochemical study of core LSAtogether with the palaeoecological approach (cf. Cearreta et al.,this issue, and Santos and Goni, this issue) allowed the de� nitionof four major lithostratigraphicalunits (units I to IV) resting overMiocene basement.
Texture, calcium carbonate and organic mattercontent
BasementThe basement was sampled between –22.71 and –21.33 m andconsists of a greenish, very compact, micaceous muddy to silty� ne sand (according to Folk, 1974) with few scattered pebbles.No O.M. was detected and the carbonate content is very low(< 3%) (Figure 2). Throughout this section the kaolinite:illite ratio(K:I) is consistently low (Figure 5); the contents in phylosilicate(Phy), opal C/CT and K-feldspar are high, while quartz andplagioclase are low (Figure 4). These characteristics changeabruptly when the sharp surface corresponding to its upper bound-ary gives way to the lower sediments of the Quaternary sectionof the core.
Unit I (–21.33 to –11.51 m)This unit consists of a monotonous series of decimetric layersof sand and muddy sand alternating with mud and sandy mud(Figure 3A). The boundaries separating layers are usually gradualand diffuse. The sandy fraction is generally medium to coarse,moderately to poorly sorted and negatively skewed, suggestingthe presence of small contributionsof coarser lag. Throughout thisunit the clay:silt ratio is variable, most samples falling in class IIIof Pejrup (1988), regardless of the sand content (Figure 3B). Mica� akes (muscovite) and fermented plant remains (more rarelycharcoal) were recognized in small amounts throughout this unit.Bioclasts are present as whole shells and shell debris of bivalvesand gastropods (Figure 2).
Subunit IA (–21.33 to –18.06 m)The coarsest layer of the whole core was found close to the baseof this subunit and consists of poorly sorted, negatively skewedvery coarse to pebbly sand (containing quartz pebbles) restingover a micaceous, reddish, medium sand horizon. Grit or � ne peb-ble clasts of slate are frequently found dispersed (especially
Figure 1 (A) Location of the study area in Portugal and in the Troia-Sines coast. (B) Geomorphological sketch of the Santo Andre area and location of coringsite LSA.
below –18.7 m) within both the sandy and muddy layers. TheO.M. content is less than 1% and bioclasts less than 3% of thetotal sample (Figure 2). The latter are represented by shell debrisof bivalves (essentially of the family Cardiidae) and whole shellsof Parvicardium sp.
Subunit IB (–18.06 to –14.26 m)Within this subunit the sand content and the mean diameter of thesand generally increase upcore. The major textural contrast withthe underlying subunit is the absence of the lithic coarse compo-nents. Bioclasts contribute less than 10% to the total sample(averaging 6%) and are represented by shell debris and wholeshells – Rissoa sp., Corbula gibba, Cerastoderma sp. and undeter-mined Cardiidae, Bivalvia and Gastropoda. The O.M. content isless than 2% of the total sample. Samples correspondent to thisinterval show the higher clay:silt ratio, clustering around 1:1(Figure 3B).
Subunit IC (–14.26 to –11.51 m)It consists of an essentially muddy deposit comparatively enrichedin O.M., containing two thick layers of less organic coarser sedi-ment. The basal contacts of the sand are sharp and the upperboundaries between the sand and the mud gradual. Bioclastsusually exceed 8%, averaging 12% of the total sample and showlarge diversity (Caecum imperforatum, Chrysallida sp., Bela sp.,Nassarius sp., N. mamillatus, Ocinebrina aciculata, Bittium retic-ulatum, B. latreillei, Pusillina sp., P. lineolata, Hyala vitrea,?Jujubinus sp., Hydrobia sp., H. ulvae, Turbonilla sp., Rissoa sp.,Cerastoderma cf. edule, Corbula gibba, Chlamys sp., Parvicard-ium exiguum, Abra alba, Dosinia sp., Tapes cf. decussates, unde-termined Cardiidae, Bivalvia and Gastropoda and gastropod oper-cula. The O.M. content is variable with peak values of about 4.5to 7.5%, generally associated with low sand content (Figure 2).
Unit II (–11.51 to –2.48 m)This unit consists essentially of brown to grey (frequently organic)muds faintly laminated and containing occasional laminae of sandmore frequent in its upper section (Figure 2). Throughout this unitbioclasts are abundant (usually >20%; Figure 2) whole shells(bivalves and gastropods) predominating over shell debris.
Subunit IIA (–11.51 to –8.26 m)This subunit displays a very uniform texture; it is composedalmost exclusively of muds (94–99% silt + clay; Figure 3A) and
436 The Holocene 13 (2003)
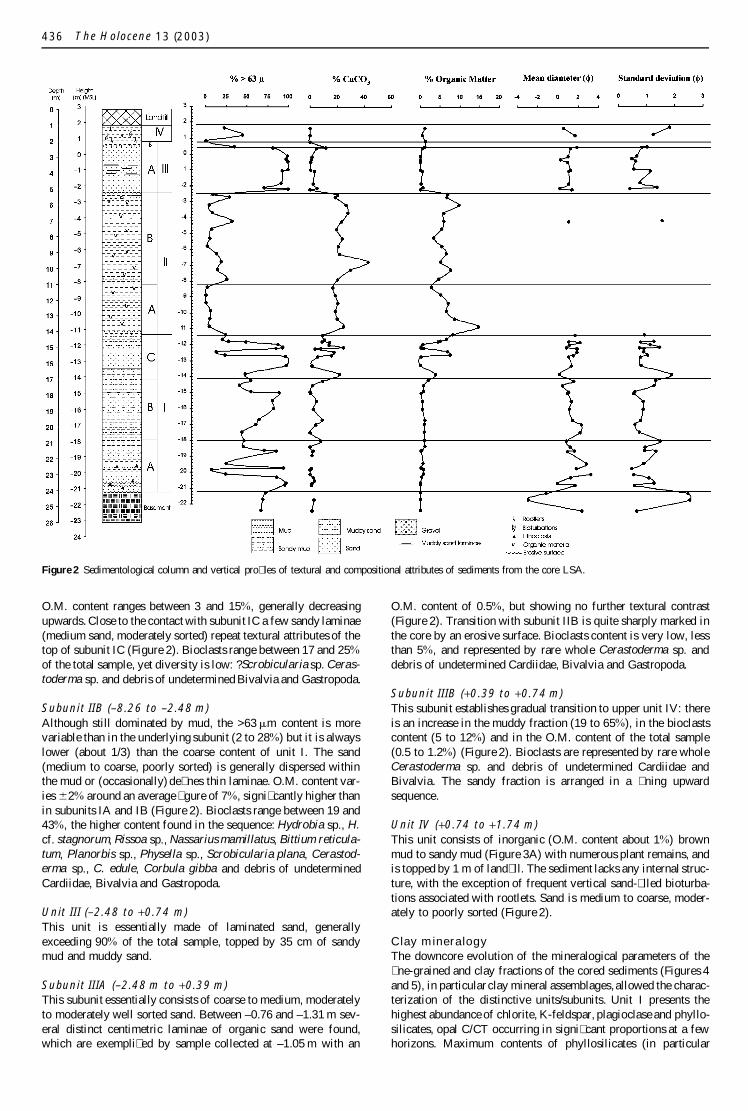
Figure 2 Sedimentological column and vertical pro� les of textural and compositional attributes of sediments from the core LSA.
O.M. content ranges between 3 and 15%, generally decreasingupwards. Close to the contact with subunit IC a few sandy laminae(medium sand, moderately sorted) repeat textural attributes of thetop of subunit IC (Figure 2). Bioclasts range between 17 and 25%
of the total sample, yet diversity is low: ?Scrobicularia sp. Ceras-toderma sp. and debris of undetermined Bivalvia and Gastropoda.
Subunit IIB (–8.26 to –2.48 m)Although still dominated by mud, the >63 mm content is morevariable than in the underlying subunit (2 to 28%) but it is alwayslower (about 1/3) than the coarse content of unit I. The sand(medium to coarse, poorly sorted) is generally dispersed withinthe mud or (occasionally) de� nes thin laminae. O.M. content var-ies 62% around an average � gure of 7%, signi� cantly higher thanin subunits IA and IB (Figure 2). Bioclasts range between 19 and43%, the higher content found in the sequence: Hydrobia sp., H.cf. stagnorum, Rissoa sp., Nassarius mamillatus, Bittium reticula-tum, Planorbis sp., Physella sp., Scrobicularia plana, Cerastod-erma sp., C. edule, Corbula gibba and debris of undeterminedCardiidae, Bivalvia and Gastropoda.
Unit III (–2.48 to +0.74 m)This unit is essentially made of laminated sand, generallyexceeding 90% of the total sample, topped by 35 cm of sandymud and muddy sand.
Subunit IIIA (–2.48 m to +0.39 m)This subunit essentially consists of coarse to medium, moderatelyto moderately well sorted sand. Between –0.76 and –1.31 m sev-eral distinct centimetric laminae of organic sand were found,which are exempli� ed by sample collected at –1.05 m with an
O.M. content of 0.5%, but showing no further textural contrast(Figure 2). Transition with subunit IIB is quite sharply marked inthe core by an erosive surface. Bioclasts content is very low, lessthan 5%, and represented by rare whole Cerastoderma sp. anddebris of undetermined Cardiidae, Bivalvia and Gastropoda.
Subunit IIIB (+0.39 to +0.74 m)This subunit establishes gradual transition to upper unit IV: thereis an increase in the muddy fraction (19 to 65%), in the bioclastscontent (5 to 12%) and in the O.M. content of the total sample(0.5 to 1.2%) (Figure 2). Bioclasts are represented by rare wholeCerastoderma sp. and debris of undetermined Cardiidae andBivalvia. The sandy fraction is arranged in a � ning upwardsequence.
Unit IV (+0.74 to +1.74 m)This unit consists of inorganic (O.M. content about 1%) brownmud to sandy mud (Figure 3A) with numerous plant remains, andis topped by 1 m of land� ll. The sediment lacks any internal struc-ture, with the exception of frequent vertical sand-� lled bioturba-tions associated with rootlets. Sand is medium to coarse, moder-ately to poorly sorted (Figure 2).
Clay mineralogyThe downcore evolution of the mineralogical parameters of the� ne-grained and clay fractions of the cored sediments (Figures 4and 5), in particular clay mineral assemblages, allowed the charac-terization of the distinctive units/subunits. Unit I presents thehighest abundance of chlorite, K-feldspar, plagioclase and phyllo-silicates, opal C/CT occurring in signi� cant proportions at a fewhorizons. Maximum contents of phyllosilicates (in particular

Palaeoclimate records Special Issue: Multiproxy palaeoenvironmental reconstruction of a Portuguese lagoonal system 437
IV
IIIB
IIIA
IIB
IIA
IC
IB
IA
b as ement
I
II
III
IV
20%
50%
80%
A B C DSand
Clay
Silt50% 10%90%
IV
IIIB
IIIA
IIB
IIA
IC
IB
IA
ba s em ent
Sand
Silt Clay
95%
75%
25%
Muddy sand
Mud
Sandy mud
A.
B.
Figure 3 Plots of sediment samples in the diagrams of (A) Larsonneur and(B) Pejrup.
smectite) were observed in subunit IB, while chlorite concentratespreferably in subunit IA. Within subunits IA and IB the K:I ratiois consistently above the average � gure obtained for the wholecore. The proportion of chlorite and smectite drops in subunit IC,while illite clearly increases at the expense of the remnant miner-alogical assemblage. Both pyrite and anhydrite progressivelyincrease in abundance to the top of unit I. Transition to unit II ismarked by the dropping of phyllosilicates and feldspars in whatconcerns the � ne-grained fraction and of smectite and K:I ratioin what concerns the clay fraction; simultaneously an increase ofpyrite is noticed, which exhibits the highest values of the wholecore (particularly in subunit IIB). Transition between subunits IIAand IIB is marked by a dolomitic episode. The K:I ratio dropsfrom bottom to top of subunit IIA and reverses this trend through-out IIB. The smectite:chlorite ratio increases from subunit IIA toIIB. Transition to unit III is marked by an increase of abundanceof phyllosilicates (in particular smectite) and K-feldspar, whilepyrite exhibits a reverse trend. The K:I ratio varies along thisunit but no distinct trend is noticed. In unit IV, phyllosilicates (inparticular chlorite), K-feldspar and pyrite reduce abundance andsmectite keeps the high values of the previous subunit IIB, almostmatching the proportion of kaolinite. The plagioclase content andthe K:I ratio increase. The Kubler crystallinity index (Kubler,1964) displays a quite uniform pro� le along the whole core withthe exception of a positive peak in subunit IIA, meaning lowercrystallinity.
GeochemistryMajor and trace element compositions of the analysed SantoAndre core samples are provided in Table 1. In general, observeddowncore geochemical variations show distinct breaks which cor-respond with the boundaries of the different units or subunits.Downcore Si and Ca concentration changes re� ect variations inrelative proportionsof sand and carbonate components; these vari-ations are better emphasized by normalization relative to Al. Thus,Si:Al ratios re� ect variations in sand content (Figure 6): unit IIshows the lowest values and the highest homogeneity of this ratio,in clear contrast with the adjacent units. Ca:Al (Figure 6) essen-tially mirror the total carbonate content, and the maximum valuesof this ratio correspond to shell-rich laminae. All together, thesethree major elements (Si, Al, Ca) primarily re� ect the lithologicaland to some extent textural heterogeneity found along the core.Sr:Al behaves like Ca:Al (Figure 6), whereas Th and rare earthelements (REE) abundance (Table 1) follow Al concentrations ondisplaying a strong positive correlation (R2
Th = 0.91; R2La = 0.89)
with silt + clay (<63 mm fraction) contents. Shale-normalized(Haskin et al., 1968) REE patterns are relatively unfractionatedand homogeneous throughout unit II ((La/Yb)n = 1.0 – 1.1;Figure 6), in contrast with adjacent units which are more hetero-geneous and variably enriched in LREE (Figure 6 and Table 1).K:Al and Th:Al variations (Figure 6) are similar to those observedfor (La:Yb)n. These features indicate a general congruent behav-iour of large-ion lithophile elements (K, Rb, Th, La), and thatthe observed variations re� ect source heterogeneities for detritalsedimentary inputs into the Santo Andre lagoon.
Geochemical indicators of palaeosalinity (Cl, Br, I, S; Chester,1999; Lopez-Buend‡a et al., 1999) display characteristic concen-tration pro� les (Figure 7), with lower values throughout subunitsIA and IB and units III and IV and higher values in subunits ICto IIB. High Mg:Al values in subunits IC to IIB (Figure 7) areconsistent with Cl, Br, I and S variations. All these geochemicalfeatures provide support to palaeoecological data (Cearreta et al.,this issue; Santos and Goni, this issue) that indicates marinein� uence during deposition of subunits IC to IIB. Enhanced Cu:Pband Zn:Pb ratios are also characteristic of subunits IC to IIB(Figure 7), suggesting non-conservative behaviour and preferen-tial adsorption of Cu and Zn to sediment particles during seawaterin� ux into the Santo Andre lagoon.
Sr isotopic compositions and 87Rb:86Sr ratio for the individualcore samples are presented in Table 2. The 87Sr:86Sr and 87Rb:86Srratios in the analysed core samples range from 0.711157 to0.740434 and 0.84 to 9.9, respectively. 87Sr:86Sr and 87Rb:86Srare positively correlated (R2 = 0.79) with a regressed linear slopecorresponding to 219 6 51 Ma; however, much of this correlationis due to mixing (see below), rather than radioactive decay of87Rb to 87Sr, and the obtained date has no age signi� cance (cf.Faure, 1986). Vertical variation of Sr isotopic composition of coresediments is illustrated in Figure 8 and provides important infor-mation on temporal � uctuation of source materials (e.g., Revelet al., 1996; Asahara et al., 1999). The 87Sr:86Sr ratio clearly dis-criminates between the different units/subunits, with sedimentsfrom subunits IC to IIB and IIIB being in general less radiogenicthan those from subunits IA, IB, IIIA and IV (Figure 8). Thehigher 87Sr:86Sr values > 0.73, which predominantly re� ect deri-vation from long-term Rb/Sr-enriched sources, correspond to sub-units IB and IIIA, whereas the lower 87Sr:86Sr values < 0.715 wereobserved in subunits IC and IIB, re� ecting the in� uence of lessradiogenic material. In order to clarify the evolving nature of sedi-mentary sources and details of mixing processes, 87Sr:86Sr wasplotted against Ca wt% and 1/Sr ppm2 1 in Figure 9. Data in these� gures display the characteristic trends of mixing processes(Langmuir et al., 1978; Faure, 1986), indicating that the main con-tributions to the heterogeneity of sedimentary Sr isotopic compo-sition were dominated by variable mixing of highly radiogenic

438 The Holocene 13 (2003)
Tab
le1
Com
posi
tion
alda
taof
the
LSA
core
dse
dim
ents
Dep
thbe
low
Dep
thre
lativ
eto
Silt+
O.M
.*N
aM
gA
lSi
PS
Cl
KC
aC
uZ
nA
sB
rR
bSr
SbI
La
Yb
PbT
hU
surf
ace
(m)
m.s
.l.(m
)cl
ayw
t%w
t%w
t%w
t%w
t%w
t%w
t%w
t%w
t%w
t%pp
mpp
mpp
mpp
mpp
mpp
mpp
mpp
mpp
mpp
mpp
mpp
mpp
m(%
)
1.04
–1.0
5+ 1
.69
to+ 1
.70
77.2
1.4
0.35
1.64
7.08
29.7
20.
037
0.02
0.02
2.09
2.06
4385
1514
106
108
1.3
nd28
.92.
827
9.3
2.3
1.50
–1.5
1+ 1
.23
to+ 1
.24
55.4
0.8
0.39
1.26
5.23
34.2
20.
026
0.01
nd1.
592.
5629
588.
92.
964
930.
9nd
20.0
2.0
225.
91.
91.
80–1
.81
+ 0.9
3to
+ 0.9
4–
–0.
342.
159.
4425
.38
0.05
00.
02nd
2.95
1.41
6010
817
5.9
156
134
1.4
nd39
.73.
629
10.5
2.7
1.90
–1.9
1+ 0
.83
to+ 0
.84
99.4
1.3
0.36
2.21
9.20
25.2
30.
042
0.05
nd2.
811.
4363
108
147.
716
413
11.
7nd
41.3
3.6
2910
.82.
82.
27–2
.28
+ 0.4
6to
+ 0.4
765
.11.
80.
291.
847.
3027
.87
0.03
40.
24nd
2.58
2.84
4374
129.
115
413
51.
2nd
28.1
2.6
197.
52.
12.
47–2
.48
+ 0.2
6to
+ 0.2
7–
–0.
070.
111.
4043
.69
0.00
70.
070.
011.
060.
353
51.
31.
552
30nd
nd5.
00.
411
2.2
0.8
2.84
–2.8
5–0
.10
to–0
.11
1.5
0.0
0.05
0.02
0.79
45.6
60.
004
0.04
nd0.
70.
402
20.
6nd
2927
0.2
nd3.
50.
26
1.5
0.6
3.33
–3.3
4–0
.59
to–0
.60
––
0.05
0.02
0.86
45.3
80.
005
0.03
nd0.
820.
052
20.
50.
846
130.
2nd
3.4
0.2
81.
3nd
3.70
–3.7
1–0
.96
to–0
.97
0.7
0.0
0.05
0.01
0.75
45.8
80.
004
0.02
nd0.
720.
102
2nd
0.7
3113
0.1
nd2.
80.
26
1.3
nd4.
93–4
.94
–2.1
9to
–2.2
00.
70.
00.
040.
030.
7845
.74
0.00
50.
01nd
0.69
0.06
22
0.7
0.9
2911
0.1
nd3.
40.
26
1.3
0.6
5.43
–5.4
4–2
.69
to–2
.70
––
0.47
0.92
5.51
25.8
50.
028
2.08
0.09
1.87
4.41
3376
6.8
4597
217
0.5
1323
.62.
222
6.5
2.4
6.75
–6.7
6–4
.01
to–4
.02
––
0.48
1.22
5.99
22.4
00.
033
1.87
0.14
1.94
6.01
3980
9.4
4410
728
60.
811
24.4
2.3
216.
82.
27.
43–7
.44
–4.6
9to
–4.7
092
.65.
90.
481.
878.
1721
.26
0.04
02.
080.
142.
562.
4958
114
1630
129
188
1.4
1433
.53.
226
9.2
3.0
8.50
–8.5
1–5
.76
to–5
.77
97.6
5.5
0.55
1.74
8.04
22.1
00.
044
1.59
0.20
2.41
1.32
5912
512
3915
213
31.
17.
431
.63.
131
9.4
2.6
10.0
0–10
.01
–7.2
6to
–7.2
785
.98.
90.
220.
806.
2520
.25
0.03
22.
440.
441.
672.
5033
8511
9310
097
0.8
9.6
21.2
1.9
216.
83.
810
.60–
10.6
1–7
.86
to–7
.87
74.3
6.2
0.43
2.00
7.87
21.5
50.
038
1.87
0.13
2.29
3.22
5210
411
2511
419
21.
06.
730
.82.
824
8.4
3.0
11.1
0–11
.11
–8.3
6to
–8.3
797
.42.
80.
442.
008.
7424
.03
0.04
50.
550.
092.
351.
2269
113
1213
136
991.
16.
037
.03.
430
10.3
3.2
12.5
0–12
.51
–9.7
6to
–9.7
794
.06.
90.
421.
888.
4121
.51
0.04
71.
240.
162.
372.
1861
112
1453
146
142
1.3
1031
.03.
023
8.8
2.4
14.0
9–14
.11
–11.
35to
–11.
3776
.110
.70.
310.
686.
6026
.91
0.02
61.
950.
071.
880.
5728
7234
6611
976
1.1
1323
.72.
232
8.2
9.2
14.3
9–14
.40
–11.
65to
–11.
6679
.58.
20.
321.
377.
7922
.46
0.04
61.
290.
112.
271.
3943
111
1210
814
513
41.
414
29.7
2.6
279.
33.
014
.73–
14.7
4–1
1.99
to–1
2.00
12.8
4.7
0.24
0.22
2.83
36.9
60.
016
0.38
0.02
1.24
4.06
634
7.2
9.6
6722
20.
62.
711
.00.
813
3.7
2.1
14.9
7–14
.98
–12.
23to
–12.
2414
.85.
50.
280.
192.
8440
.82
0.00
90.
440.
011.
410.
686
283.
63.
667
610.
4nd
10.4
0.9
173.
32.
615
.37–
15.3
9–1
2.63
to–1
2.65
76.6
9.8
0.27
0.85
7.75
25.4
50.
027
1.15
0.14
2.08
0.85
3211
623
7312
899
1.8
1629
.32.
840
9.1
8.0
16.0
5–16
.06
–13.
31to
–13.
322.
40.
00.
110.
040.
9943
.70
0.00
70.
18nd
0.86
0.04
28
3.5
0.7
4016
0.3
nd3.
60.
38
1.7
0.7
16.7
0–16
.71
–13.
96to
–13.
9751
.97.
30.
330.
645.
893.
450.
030
0.80
0.04
1.75
3.02
1676
1436
9717
70.
817
22.0
2.0
286.
53.
217
.30–
17.3
1–1
4.56
to–1
4.57
58.7
1.3
0.31
0.49
5.83
33.2
60.
028
0.10
0.03
1.71
0.23
2295
8.4
4.2
9459
1.1
1.5
26.1
2.4
367.
72.
517
.70–
17.7
1–1
4.96
to–1
4.97
45.6
1.9
0.25
0.46
5.36
36.5
00.
009
0.10
0.04
1.72
0.16
2278
1.5
2.3
7455
0.8
nd21
.32.
034
6.6
3.6
17.7
9–17
.80
–15.
05to
–15.
0611
.61.
90.
170.
112.
2343
.16
0.00
50.
120.
011.
110.
024
121.
31.
154
270.
2nd
7.0
0.6
122.
71.
118
.80–
18.8
1–1
6.06
to–1
6.07
18.3
2.7
0.16
0.11
1.80
43.1
40.
007
0.13
0.02
0.99
0.49
417
2.9
0.9
5638
0.3
3.6
7.2
0.5
152.
21.
019
.76–
19.7
7–1
7.02
to–1
7.03
39.0
2.6
0.34
0.37
4.33
37.9
40.
011
0.10
nd1.
880.
1915
536.
1nd
9854
0.9
nd20
.51.
529
5.4
1.6
20.2
4–20
.26
–17.
50to
–17.
5256
.31.
80.
470.
565.
4535
.62
0.01
60.
100.
012.
010.
2121
759.
32.
268
670.
65.
527
.12.
431
8.0
2.6
20.8
9–20
.90
–18.
15to
–18.
1654
.01.
60.
330.
505.
3834
.32
0.02
50.
230.
021.
690.
4321
899.
83.
212
064
1.1
nd25
.12.
536
7.5
2.0
21.4
0–21
.41
–18.
66to
–18.
6729
.51.
10.
250.
303.
4839
.60
0.01
10.
040.
011.
550.
1213
432.
90.
881
420.
7nd
17.1
1.5
215.
00.
822
.84–
22.8
5–2
0.10
to–2
0.11
75.8
1.0
0.62
0.59
6.49
33.1
00.
017
0.12
0.01
2.21
0.24
2481
5.8
nd12
678
1.2
nd38
.73.
140
11.2
3.1
23.6
0–23
.61
–20.
86to
–20.
874.
11.
90.
080.
041.
0944
.81
0.01
2nd
0.01
0.8
0.02
27
0.9
nd38
160.
2nd
5.1
0.4
112.
00.
7
*Rel
ativ
eto
silt+
clay
frac
tion;
–no
tde
term
ined
;nd
unde
rde
tect
ion
limit.

Palaeoclimate records Special Issue: Multiproxy palaeoenvironmental reconstruction of a Portuguese lagoonal system 439
-23
-22
-21
-20
-19
-18
-17
-16
-15
-14
-13
-12
-11
-10
-9
-8
-7
-6
-5
-4
-3
-2
-1
0
1
2
3
IVB
IIIA
A
B
II
A
B
C
I
Basement
Landfill
Height (m)
msl
Chlorite(%)
K-feldspar(%)
Plagioclase(%)
Calcite(%)
Dolomite(%)
Pyrite(%)
Anhydrite(%)
Opal(%)
0 1 2 3 4 0 6 12 18 240 4 8 12 16 0 1 2 3 40 10 20 30 0 4 8 12 0 5 10 0.0 2.5 5.0
Figure 4 Vertical concentration pro� les of selected minerals in the <63 mm fraction.
-23
-22
-21
-20
-19
-18
-17
-16
-15
-14
-13
-12
-11
-10
-9
-8
-7
-6
-5
-4
-3
-2
-1
0
1
2
3
IVB
IIIA
A
B
II
A
B
C
I
Basement
Landfill
Height (m)
msl
Smectite(%)
Illite(%)
Kaolinite(%)
K/I(%)
Kublerindex
0 5 10 15 20 30 60 90 10 30 50 0.0 0.6 1.2 0.2 0.3 0.4 0.5
Figure 5 Vertical concentration pro� les of selected clay minerals, K:I ratio and Kubler’s crystallinity index in the <2 mm fraction.

440 The Holocene 13 (2003)
S i /Al
0 4 0 8 0
Ca /Al
0 .0 0 .5 1 .0 1 .5
Sr /Al(x 1 0 4 )
0 4 0 8 0
-2 2
-2 1
-2 0
-1 9
-1 8
-1 7
-1 6
-1 5
-1 4
-1 3
-1 2
-1 1
-1 0
-9
-8
-7
-6
-5
-4
-3
-2
-1
0
1
2
3
Th/Al(x 10 )
1 2 2
K/Al
0 .2 0 .6 1 .0
(La /Y)
0 .8 1 .3 1 .8
IVB
IIIA
A
B
II
A
B
C
I
Basement
Landfill
msl
Height (m)
4
n
Figure 6 Vertical pro� les of selected elemental ratios dependent on lithological and textural attributes (subscript n indicates normalized values).
S ( %)
0 0 .8 1 .6 2 .4
-2 2
-2 1
-2 0
-1 9
-1 8
-1 7
-1 6
-1 5
-1 4
-1 3
-1 2
-1 1
-1 0
-9
-8
-7
-6
-5
-4
-3
-2
-1
0
1
2
3
Br (ppm )
0 3 0 6 0 9 0
I (ppm )
0 1 0 2 0
Cl (%)
0 0 .2 0 .4
M g/Al
0. 0 0 .1 0 .2 0 .3
Cu /P b
0 1 2 3
Zn/P b
0 2 4 6
IVB
IIIA
A
B
II
A
B
C
I
Basement
Landfill
msl
Height (m)
Figure 7 Vertical pro� les of selected elemental concentrations/ratios indicative of variable marine/terrestrial inputs.

Palaeoclimate records Special Issue: Multiproxy palaeoenvironmental reconstruction of a Portuguese lagoonal system 441
Table 2 87Sr:86Sr and 87Rb:86Sr isotopic ratios of samples from core LSA
Depth relative to m.s.l. Depth below surface (m) Unit/subunit 87Sr:86Sr Error (2s) 87Rb:86Sr(m)
+0.93 to +0.94 1.80 to 1.81 IV 0.719293 0.000027 3.262+0.83 to +0.84 1.90 to 1.91 0.719240 0.000072 3.508
+0.46 to +0.47 2.27 to 2.28 IIIB 0.717663 0.000022 3.196
+0.26 to +0.27 2.47 to 2.48 0.724226 0.000029 4.859–0.10 to –0.11 2.84 to 2.85 IIIA 0.726312 0.000051 3.011–0.59 to –0.60 3.33 to 3.34 0.740434 0.000054 9.931
–2.69 to –2.70 5.43 to 5.44 0.712717 0.000057 1.252–4.01 to –4.02 6.75 to 6.76 0.712631 0.000040 1.047–4.69 to –4.70 7.43 to 7.44 IIB 0.714732 0.000036 1.922–7.26 to –7.27 10.00 to 10.01 0.716421 0.000086 2.888–7.86 to –7.87 10.60 to 10.61 0.715482 0.00005 1.663
–8.36 to –8.37 11.10 to 11.11 0.716281 0.000029 3.848–9.76 to –9.77 12.50 to 12.51 IIA 0.716536 0.000039 2.880–11.35 to –11.37 14.09 to 14.11 0.722999 0.000058 4.389
–11.65 to –11.66 14.39 to 14.40 0.718622 0.000036 3.032–11.99 to –12.00 14.73 to 14.74 0.711157 0.000040 0.845–12.23 to –12.24 14.97 to 14.98 IC 0.721634 0.000022 3.078–12.63 to –12.65 15.37 to 15.39 0.715878 0.000021 3.621–13.96 to –13.97 16.70 to 16.71 0.715102 0.000053 1.535
–14.56 to –14.57 17.30 to 17.31 0.723418 0.000029 4.466–15.05 to –15.06 17.79 to 17.80 IB 0.73247 0.000011 5.611–17.50 to –17.52 20.24 to 20.26 0.725554 0.000015 2.845
–18.15 to –18.16 20.89 to 20.90 0.722847 0.000072 5.255–20.10 to –20.11 22.84 to 22.85 IA 0.724493 0.000051 4.528
(low-Ca, Sr), terrigenous, clay material with relatively unradiog-enic, (high-Ca, Sr), carbonates. Even at low Ca contents(equivalent to <20% of CaCO3; Figure 9A), the carbonate fractiondominates the isotopic composition and concentration of Sr in thesediments. Regression of data points in Figure 9B de� ne twostraight lines with distinct slopes for subunits IA, IB, IIIA, IV andsubunits IC, IIA, IIB, IIIB, respectively; these features suggestthe operation of more than two end-member components in themixing process. Mixing calculations for subunit IC, IIA, IIB andIIIB samples (Figure 9B) indicate that their isotopic compositionsand Sr concentrations comply with the involvement of a seawater-derived carbonate end-member component (87Sr:86Sr = 0.7092,Sr ~ 2000 ppm; Burke et al., 1982), which is consistent with theremaining geochemical evidence (Figure 7). On the other hand,extrapolation of the regression line for subunits IA, IB, IIIA andIV to 1/Sr = 0 requires a carbonate component in these sedimentswith 87Sr: 86Sr ~ 0.718 (Figure 9B), implying derivation from amuch more radiogenic source than that of modern marine carbon-ates. It thus seems that carbonate precipitating during depositionof subunits IA, IB, IIIA and IV acquired Sr from waters withquite higher 87Sr:86Sr than those contemporaneous with the depo-sition of subunits IC, IIA, IIB and IIIB. The former were predomi-nantly riverine waters, deriving their radiogenic Sr from drainageof continental rocks, whereas the latter represent variable mixturesof these waters with less radiogenic seawater � uxes into thelagoon. Together with the highly radiogenic Sr that was carriedin river water terrigeneous (particulate) matter, these two majorsources of Sr (cf. Martin and Maybeck, 1979) should account forthe Santo Andre lagoon sedimentary isotopic budget. Thus, iso-topic heterogeneity of sediments in subunits IA, IB, IIIA and IV(Figure 8) re� ect variations on the relative Sr contents of sus-
pended and dissolved loads in the � uvial input; surely, the higher87Sr:86Sr values in subunits IB (0.73247/–15.05 m) and IIIA(0.740434/–0.59 m) correspond to a large predominance of terrig-eneous sedimentation at these times. In contrast, sediments fromsubunits IC, IIA, IIB and IIIB all seem to have included a signi� -cant proportion of seawater-derived Sr component. The lowest87Sr:86Sr value (0.711157/–11.99 m), close to the top of subunitIC (Figure 8), corresponds to an inversion on the isotopic evol-utionary trend, denoting an increased in� uence of continentalsedimentation or, more probably, a decrease of seawater-derivedSr input into the lagoon; nevertheless, some seawater in� ux seemsto have been sustained throughout most of unit II, reappearingtransiently in subunit IIIB (Figure 8).
The changing sedimentation regime at the transition betweensubunits IC and IIA is coincident with a striking enrichment ofgeochemical indicators of productivity conditions (P, As, Sb, U;Figure 10), which is consistent with a concomitant enhanced pro-duction of organic matter (Figure 2). The congruent behaviour ofall indicators strongly suggests that the Santo Andre lagoon hasdeveloped an optimum environment for biological activity atthese times.
Radiocarbon dating and sedimentation ratesDating results obtained from the LSA and exploration cores aresummarized in Tables 3 and 4, and Figure 11. Datings are instratigraphical order and four samples fall within the interval forwhich calendar calibration is not possible. Error bars correspond-ing to both the 61s age-deviation and absolute elevation error ofeach dated sample are contained within the geometric dot thatrepresents each sample in Figure 11.
Fine-grained (specially organic and clay-rich) sediments usu-

442 The Holocene 13 (2003)
87 Sr :86 S r
0.7
05
0.7
10
0.7
15
0.7
20
0.7
25
0.7
30
0.7
35
0.7
40
0.7
45
-2 2
-2 1
-2 0
-1 9
-1 8
-1 7
-1 6
-1 5
-1 4
-1 3
-1 2
-1 1
-1 0
-9
-8
-7
-6
-5
-4
-3
-2
-1
0
1
2
3
IVB
IIIA
A
B
II
A
B
C
I
Basement
Landfill
msl
Height (m)
Figure 8 Vertical pro� le of 87Sr:86Sr ratio.
0.7 05
0. 71
0.7 15
0. 72
0.7 25
0. 73
0.7 35
0. 74
0.7 45
0 1 2 3 4 5 6
0.7 05
0.71
0.7 15
0.72
0.7 25
0.73
0.7 35
0.74
0.7 45
0.75
0 0.01 0.02 0.03 0.04 0.05 0.06 0.07 0.08 0.0 9 0.1
marine carbonate
Ca (%)
1/Sr
87Sr
:86Sr
87Sr
:86Sr
A.
B.
7
Figure 9 (A) Plot of 87Sr:86Sr versus Ca. (B) Plot of 87Sr:86Sr versus 1/Sr.Solid lines represent mixing (see text). Open squares: samples from subunitsIA, IB, IIIA and unit IV. Crosses: samples from subunits IC, IIA, IIB and IIIB.
S b (p pm )
0 1 2
P (%)
0.00 0.03 0.06
As (p pm )
0 1 2 2 4 3 6
U (p pm )
0 2 4 6 8 1 0
-2 2
-2 1
-2 0
-1 9
-1 8
-1 7
-1 6
-1 5
-1 4
-1 3
-1 2
-1 1
-1 0
-9
-8
-7
-6
-5
-4
-3
-2
-1
0
1
2
3
IVB
IIIA
A
B
II
A
B
C
I
Basement
Landfill
msl
Height (m)
Figure 10 Vertical concentration pro� les of selected elements (productivityindicators).
ally suffer postdepositionalcompression, which affects bed thick-ness and may change the elevations of sample positions and refer-ence horizons. The basement and units I, III and IV consistessentially of coarse clastic sediments (Figure 2) which are vir-tually incompressible. The few interbedded muddy layers foundwithin the different units are thin, contained between permeableboundaries and laterally uncon� ned, suggesting that any effect ofvolume reduction associated with expulsion of pore � uid shouldhave taken place shortly after deposition. In consequence, theelevations of reference samples below –12.65 m may be con-sidered unchanged in what post-depositional compression is con-cerned. This assumption is supported by the downcore pro� le ofbulk dry density which re� ects the major textural contrasts andremains virtually independent of depth.
In contrast, sediments of unit II are essentially muddy and con-tain a non-negligible amount of O.M. The changes in elevationof each reference sample considered within this unit and resultingfrom consolidation were evaluated solving Terzaghi’s com-pression law in order to height, following Paul and Barras (1998).The sample Beta 121075 is located close to the boundary with theunderlying incompressible unit and this accounts for a negligiblecompression effect, estimated at 1–2 cm. Samples Beta 134568and Beta 121074 are virtually indistinguishable in terms of ageand might have been displaced by 30–40 cm in relation to theiroriginal elevation due to consolidation.These effects translate intoreduced impacts in the estimated net sedimentation rates, whichcould increase by 0.2 mm yr2 1 relative to the � gures presentedbelow.
The resulting age-depth pro� le (AMS radiocarbon age model)from core LSA (Figure 11) suggests three different periods inwhat concerns net sedimentation rates, estimated using linearregression. From the base of the core until 10 ka an average rate of1.34 mm yr2 1 was found. Between 10 ka and c. 5.4 ka this � guredropped by one order of magnitude, averaging 0.61 mm yr2 1.After 5.4 ka until present, the sedimentation rate reaches an aver-age of 2.52 mm yr2 1, the maximum value observed in this

Palaeoclimate records Special Issue: Multiproxy palaeoenvironmental reconstruction of a Portuguese lagoonal system 443
Table 3 Radiocarbon dates from core LSA
Lab. code Depth relative to m.s.l. Depth below surface (m) d13C (‰) Date Calibrated age(m) (14C years BP 61s) (1s calibrated results)
Beta-121073 –2.54–2.55 5.28–5.29 –25.9 1620 6 40 Cal. ad 430 (cal. ad 410–465and 475–515)
Beta-121074 –7.22–7.23 9.96–9.97 –24.8 3570 6 50 Cal. bc 1900 (cal. bc 1955–1875and 1805–1795)
Beta-134568 –8.16–8.17 10.90–10.91 –23.4 3570 6 50 Cal. bc 1910 (cal. bc 1965–1880)Beta-121075* –11.66–11.67 14.40–14.41 –28.1 5380 6 50 Cal. bc 4240 (cal. bc 4320–4215
and 4185–4160)Beta-121076 –12.65–12.66 15.39–15.40 –26.1 7210 6 50 Cal. bc 6005 (cal. bc 6045–5980)Beta-121077 –14.49–14.50 17.23–17.24 –29.7 10020 6 50 –Beta-121078 –18.44–18.45 21.18–21.19 –29.6 12440 6 50 –Beta-121079 –19.84–19.85 22.58–22.59 –28.7 14020 6 60 –Beta-121080 –20.16–20.17 22.90–22.91 –29.2 14160 6 60 –
*Wood.
Table 4 Radiocarbon dates from exploration cores
Lab. code Depth relative to m.s.l. Depth below surface d13C (‰) Date Calibrated age(m) (m) (14C years BP 61s) (1s calibrated results)
Beta-117144* –1.24–1.25 2.64–2.65 –27.9 160 6 40 Cal. ad 1680 to 1935Beta-117145 –6.30–6.32 7.30–7.32 –24.6 2150 6 40 Cal. bc 180 (cal. bc 200 to 115)Beta-117146 –6.73–6.75 8.83–8.85 –25.2 3580 6 50 Cal. bc 1910 (cal. bc 1965 to
1880)
*Wood.
0 4 8 12 162 6 10 14
-2 5
-20
-15
-10
-5
0
5
0 42
-10
-5
0
5
msl msl
2.5
2m
m/y
ear
0.6
1mm
/ye
ar
1.3
4m
m/y
ear
16. 5mm/year
2. 15mm/year
Age (ka) Age (ka)
He
igh
t (m
)
Hei
ght
(m)
A. B.
IV
III
II
A
B
I
A
B
C
Basement
Figure 11 Age model of LSA borehole (A) and exploration cores (B). Blackdiamonds: present-day surface sample.
sequence, doubling the rate found in its lower section. This � gurewas used to interpolate an estimated age of c. 350 BP for the topof unit III.
Results obtained from the exploration cores, although scarce,provide useful information (Figure 11B). The average net sedi-mentation rate during the last 3.5 ky matches the � gures found inthe upper section of core LSA. However, the sediment columnaccumulated since 160 6 40 BP (Table 4) corresponds to apresent-day sedimentation rate of 16.5 mm yr2 1, a � gure that
increases by one order of magnitude the highest long-term averagerate found along the whole sequence.
Discussion and palaeoenvironmentalinterpretation
In borehole LSA distinctive units and subunits can be dis-tinguished, showing contrasts in their textural and compositionalattributes, which re� ect the general environmental evolution ofthis lowland since the Lateglacial. In general, boundaries separat-ing lithostratigraphical units are equivalent in the different textu-ral, mineralogical, geochemical and palaeontological properties.
Subunits IA (14160 6 60 to 12440 6 60 BP) and IB(12440 6 60 to 10020 6 50 BP)These subunits record a sedimentation of alternating low and highenergy, the latter episodes corresponding to coarse clastic poorlysorted material; the presence of muscovite, fermented plantremains and charcoal, together with slate pebbles within both thecoarse and � ne-grained layers suggests a terrestrial sedimentationenvironment and a proximal sediment source. The geochemicalproxies con� rm a terrestrial sedimentation environment: the con-tents of marine-borne elements (Cl, Br, I and S) are consistentlyvery low, and source-sensitivelithophile element ratios agree witha continental provenance: La:Yb, Th:Al and K:Al are high,whereas Mg:Al, Cu:Pb and Zn:Pb are low. In addition, the high87Sr:86Sr values clearly indicate a terrestrial environment. In sub-unit IA the abundance of detrital minerals in the <63 mm fractionand of kaolinite in the clayey fraction also suggest a terrestrialsedimentation environment and intensive weathering in the sourcearea. The presence of chlorite may indicate a high erosion rateof the topsoil, exceeding the rates of hydrolysis of the substrate.Transition to subunit IB is possibly marked by a morphoclimatic

444 The Holocene 13 (2003)
change with increasing semi-arid conditions but also some matu-ration of the � uvial network: � ood plains were possibly present,favouring the development of Smectite. Subunits IA and B rep-resent terrestrial sedimentation in � uviatile environment contem-poraneous of a low sea level and a distal shoreline. This is con-� rmed by the complete absence of foraminifera, representativeostracoda, calcareous nannoplankton and diatoms in subunit IAand the scarcity of foraminiferal tests, absence of both representa-tive ostracods and coccoliths in subunit IB (cf. Cearreta et al., thisissue). They correspond to the Bolling-Allerød Interstadial andinclude both the upper sections of the Older Dryas and theYounger Dryas. At this time, the Santo Andre area was located ina lowland, incised in Miocene basement that extended westwardsthrough a wide coastal plain. Regarding mean sea level our dataonly indicate that marine in� uence remain below –14 m duringthis period.
Subunit IC (10020 6 50 to 5380 6 50 BP)This subunit is characterized by a decrease in the slope of thebest-� t regression line in the age model (Figure 11). In general,no signi� cant textural contrast is noticeable in comparison withsubunit IB. However, different sedimentation episodes can be dis-tinguished within this subunit using bioclastic and O.M., mineral-ogical and geochemical signatures. Indeed, values of these attri-butes oscillate in a synchronous way along this subunit and thepositive and negative variations are coherent in their environmen-tal signi� cance: the very base of the subunit (–14.26 to –13.50 m)show high contents of marine borne elements (I, Br, S), bioclastsand O.M., as well as high Mg:Al, Ca:Al and Sr:Al ratios and lowK:Al, Th:Al values. This signature is repeated between –12.70and –12.50 m and above –12.22 m. In between (–13.50 to–12.70 m and –12.50 to –12.22 m) two horizons exhibit elementalratios and contents that perform an opposite behaviour, suggestingepisodes of terrestrial in� uence. The available 87Sr:86Sr data isconsistent with this oscillating sedimentary regime, supporting astrong marine in� uence during deposition of this subunit. Tran-sition from subunit IB to IC is marked by an increase of the Mg:Alratio, suggesting additional inputs of Mg from seawater. Cu:Pband Zn:Pb ratios are quite variable along this subunit and exhibita general upward increasing trend. In the upper half of this subunitpositive and negative oscillations of these ratios perfectly matchthe variations observed in seawater-enriched halogen elements, afeature that is not so evident in its lower half. The relativeincrement of illite in the clay mineral assemblages also suggestsan increasing marine in� uence in this subunit; in its upper sectionthe content in pyrite and opal C/CT suggests a progressively morerestricted environment.
Subunit IC essentially represents sedimentation in an open mar-ine environment, disturbed by two episodes of continental sedi-mentation; its lower boundary corresponds to a sea-level marker.According to Cearreta et al. (this issue) it yielded an abundantand diverse foraminiferal assemblage with a mixture of hyalineand porcellaneousspecies (dominated by Ammonia beccarii, Hay-nesina germanica and Quinqueloculina seminula), an ostracodassemblage of marine littoral or sublittoral species of moderatediversity (dominated by Loxoconcha rhomboidea, Aurila convexa,Aurila arborescens, Carinocythereis whitei, Urocythereis britan-nica, Pontocythere elongata, Pontocythere cf. trigonella) and anassociation of almost exclusively marine planktonic diatoms. TheSanto Andre area would have been an open gulf environmentwhere the proximity of the terrestrial margin allowed temporary� uvial incursions due to minor sea-level oscillations or massive� uvial solid discharges.
Subunits IIA and IIB (5380 6 50 to 1620 6 40 BP)These subunits exhibit a dramatic textural contrast in comparisonwith unit I: the abundance of the >63 mm fraction drops whereas
bioclasts and O.M. contents increase. The average net sedimen-tation rate increases one order of magnitude (averaging2.6 mm yr2 1).
Subunit IIA (5380 6 50 to 3570 6 50 BP)This subunit is extremely uniform in texture, being compatiblewith a low-energy restricted sedimentation environment wherecontinuous deposition of cohesive sediment together with particu-late organic matter de� ned propitious conditions for the settlementof carbonate-shelledbivalves, such as Cerastoderma edule, whoseremnants are frequently preserved as whole shells in the sediment.Si:Al values indicate predominance of clay minerals in the � nefraction. Marine geochemical proxies vary upwards in this subunitsuggesting decreasing marine in� uence, which is however stillmore important than in subunits IA and IB. 87Sr:86Sr values rap-idly increase at the boundary between subunits IC and IIA, sug-gesting development of severe restrictions to major seawater � uxinto the lagoon at this time; however, the 87Sr:86Sr ratio remainssuf� ciently low to be consistent with marine in� uence on thedeposition of subunit IIA. The exclusive presence of the diatomParalia sulcata at this boundary should be an indication of thisisolation event. The increase in carbonates (especially calcite),pyrite and illite in the mineralogical assemblages of both the � neand clayey fractions indicates a restricted environment.
Subunit IIB (3570 6 50 to 1620 6 40 BP)This subunit shows small variations of the relative abundance ofthe <63 mm fraction, which correlates with abundance maxima ofboth the Ca carbonate content and the Ca:Al and Sr:Al ratios;Si:Al ratio remains low and quite uniform throughout this subunit.This suggests a continuity of the background low-energy sedimen-tation punctuated by lag deposition of bioclasts. Geochemical sig-natures of I, Cl, Br, S and Mg:Al indicate a well-de� ned episodeof marine in� uence in the lower half of this subunit (peak valuesat c. –7.3 m); this episode is followed by a trend of decreasing87Sr:86Sr values, con� rming a signi� cant seawater input into thelagoon. In its upper half, the same elemental contents are similarto those found in subunit IIA. Transition from subunits IIA to IIBtranslates into a reversal of the variation trend of the K:I ratiowhich is synchronous with a decrease of the Kubler crystallinityindex of illite, indicating the input of signi� cant amounts ofdegraded illite, probably due to an increase of pluviosity in thesource areas. The abundance of pyrite and calcite in the � ne frac-tion indicates persistence of con� ned environmental conditions.
Unit II represents low-energy sedimentation in a restrictedenvironment. The Santo Andre area became a coastal lagoon inconsequence of the development of an ef� cient detrital barrierc. 5400 BP which translated into the geological record as the sharplower boundary of subunit IIA. Unit II sedimentologicalsignatures re� ect the distal location of the borehole in relation tothe barrier and, above all, the changes on the ef� ciency of thebarrier structure, both as a hydrodynamic � lter and as anisolation/connection element of the lagoonal space in relation withthe ocean through the tidal inlet and overwash. Actually, subunitIIA corresponds to a period of higher ef� ciency of the barrier:water exchange with ocean through the inlet was negligible butoverwash would exist. Sediment input was essentially of terres-trial provenance, added by in situ inputs of O.M. and carbonateshells. This facies may be found in the present day analogues inthe deepest and central areas of Santo Andre and other Portuguesecoastal lagoons during closed inlet episodes. This interpretationis corroborated by the very low foraminiferal and ostracod abun-dance, which indicate modal fresh to slightly brackish water con-ditions punctuated by occasional marine inputs (overwash),expressed by the coccolith content (Cearreta et al., this issue).Subunit IIB re� ects a more permeable barrier (illustrated by anabundant, low-diverse, pyritized foraminiferal assemblage, domi-

Palaeoclimate records Special Issue: Multiproxy palaeoenvironmental reconstruction of a Portuguese lagoonal system 445
nated by H. germanica, A. beccarii and Elphidium oceanensis,and by a very abundant, low-diversity ostracod assemblage, highlydominated by Cyprideis torosa) possibly due to a more frequentbreaching of the barrier and/or permanency of an inlet thatchanged the modal conditions to an essentially brackish environ-ment.
Subunits IIIA and IIIB (1620 6 40 to c. 350 BP)These subunits are quite different in their sedimentological andgeochemical characteristics. In the lower subunit the sedimen-tation environment resumes high-energy conditions and terrigen-ous source indicated by coarse clastic texture, low bioclastic andO.M. contributions to the total sample. Elemental and isotopicgeochemical proxies clearly support terrestrial sources/inputs.This is corroborated by the decrease of the K:I ratio and reappear-ance of smectite. In what concerns palaeoecological content, thelower subunit is barren of coccoliths and contains low foramin-iferal and ostracod abundances (Cearreta et al., this issue). Thetop subunit is exceptionalbecause it represents a short-lived returnto a brackish, low-energy environment; this episode is wellcharacterized by a marked decrease of the 87Sr:86Sr ratio and wasaccompanied by an increase in productivity with expression intotal O.M. and bioclasts. Evaporation of ponded water may beresponsible for the predominantly dolomitic nature of the carbon-ated minerals present in the � ne-grained fraction. Unit III rep-resents marginal lagoonal sedimentation under fresh to brackishwater conditions and almost exclusively fed by terrestrial sedi-ment inputs. It corresponds to the late stages of silting up of thelagoonal basin in the coring area, involving expansion of the pro-grading alluvial plain over the lagoon.
Unit IV (c. 350 BP to present day)This unit was sedimented in a low energy terrigenousenvironment(coarser particles are partly of biogenic nature), as suggested bytextural signature, low O.M. content, low Si:Al ratio and palaeo-ecological signature: it is barren of any foraminifera, representa-tive ostracoda, calcareous nannoplankton and diatoms (Cearretaet al., this issue). The clay fractions show an increase in kaolinitefollowed by an increase in smectite, suggesting a regressive pat-tern of the sedimentary conditions. Cl, I, Br and S contents aresimilar to those of subunit IIIA, whereas 87Sr:86Sr are lowerre� ecting a stronger in� uence of carbonate to the Sr sedimentarybudget. The high values of Zn:Pb and Cu:Pb found in the upper-most section of this unit (reversing the upward decreasing trendof its lower section) might be a consequence of anthropogenicactivity. Unit IV represents the present-day sedimentationenvironment at the coring site: an accreting alluvial plain rela-tively distal of the main channel, � ooded during the rainy seasonwhere sediment laminae are disturbed by bioturbation. The top-most 1 m of land� ll corresponds to a real estate limit and simul-taneously to a small dyke to control � ooding of grazing land.
Conclusions
The sedimentological and geochemical study of the LSA bore-hole, that represents the in� ll of a sector of the Santo Andre coas-tal lowland during the last 14 ka, allows the reconstruction of theenvironmental changes that occurred in this area during this per-iod that translated into contrasting lithostratigraphical units. Thepre-Holocene section of the core represents terrestrial sedimen-tation in a � uviatile environment, contemporaneous of a low sealevel and a distal shoreline. Sediment inputs were terrestrial andresulting from intensive weathering and high erosion rate in theadjacent watershed. During the early Holocene (c. 10020 to 5380BP), the eustatic forcing factor determined coastal changes: thesea invaded this lowland and de� ned an open marine shallow
environment corresponding to a wide gulf which has been dis-turbed by distinct (and apparently distal) terrestrial inputs. Thebase of subunit IC is a clear sea-level marker, whereas the facieschanges observed in this subunit may have been induced by mass-ive episodes of � uvial discharge. To the top, the � rst symptomsof con� nement have been noted, suggesting that incipient barriersmay have formed. C. 5380 BP, a major environmental thresholdis recorded by the establishment of an ef� cient detrital barrier thatcompletely isolated the previous open bay and changed this areato a closed coastal lagoon. The development of this barrier is mostprobably an effect of the marked deceleration of the sea-level riserate that took place at this time. After 5380 BP, the lagoonalenvironment evolved essentially as a function of local forcing fac-tors, among which the frequency and ef� ciency of exchanges withthe ocean (promoted by overwash and mainly by a tidal inlet)were the more important. Until c. 3570 BP the lagoonal environ-ment was quite restricted, dominated by freshwater inputs andterrestrial sediments added by a signi� cant production of organicmatter that promoted rapid silting up of the basin. A second epi-sode of lagoonal sedimentation lasts until c. 1620 BP re� ectingbrackish conditions and increased marine in� uence due to adecrease of the ef� ciency of the barrier. The upper units III andIV represent � nal stages of � lling of the lagoonal margin by � u-vial activity including the progradation of the alluvial fans.Human intervention in the breaching of this barrier is documentedsince the seventeenth century and in similar environments of thePortuguese coast since the � fteenth century, but it is highly prob-able that this procedure might have started earlier. This is a plaus-ible cause of the short-lived return to brackish conditions recordedat subunit IIIB which later fade away due to the inner location ofthe coring site that allowed � uvial facies to take over.
This study indicates that downcore geochemical variations onAl, Ca and Sr primarily re� ect lithological/textural heterogeneitywhereas several elemental/isotopic contents/ratios (namely Cl, Br,I, S, Mg:Al, Cu:Pb, Zn:Pb, Th:Al, K:Al and 87Sr:86Sr) correlatewith variable sediment sources and relative importance ofmarine/terrestrial inputs to the coastal basin. This statement dem-onstrates the signi� cance of the geochemistry as an environmen-tally sensitive proxy of coastal changes.
Acknowledgements
This paper is a contribution to the Research ProjectsPRAXIS/PCNA/T/CTE/12/96 ‘Holocenic evolution of the SWPortuguese coast’ and PRAXIS/PDCTM/P/MAR/ 15231/1999‘Global versus Local Forcing Factors and PalaeoenvironmentalChanges of Estuaries and Lagoons of SW Portugal Since the Late-glacial’ � nanced by the Portuguese FCT (Fundacao para a Cienciae Tecnologia).
References
Asahara, Y., Tanaka, T., Kamioka, H., Nishimura, A. and Yamazaki,T. 1999: Provenance of the north Paci� c sediments and process of sourcematerial transport as derived from Rb-Sr isotopic systematics. ChemicalGeology 158, 271–91.Bao, R., Freitas, M.C. and Andrade, C. 1999: Separating eustatic fromlocal environmental effects: a late-Holocene record of coastal change inAlbufeira lagoon, Portugal. The Holocene 9, 341–52.Burke, W.H., Denison, R.E., Hetherington, E.A., Koepnick, R.B., Nel-son, N.F. and Otto, J.B. 1982: Variation of seawater 87Sr/86Sr throughoutPhanerozoic time. Geology 10, 516–19.Cardoso, L. 1747: Diccionario geogra�co ou noticia historica, volume1. Lisboa: Regia Of� cina Sylviana e Academia Real, 756 pp.Chester, R. 1999: Marine geochemistry. Oxford: Blackwell Science,506 pp.

446 The Holocene 13 (2003)
Clark, J.A., Farrell, W.E. and Peltier, W.R. 1978: Global changes inpostglacial sea level: a numerical calculation. Quaternary Research 9,265–87.Dias, J.M.A. 1985: Registos da migracao da linha de costa nos ultimos18000 anos na plataforma continental Portuguesa setentrional. Actas IReuniao Quaternario Iberico I, 281–95.—— 1987: Dinamica sedimentar e evolucao recente da plataforma conti-nental Portuguesa setentrional. Unpublished PhD dissertation,Departamento de Geologia, Universidade de Lisboa, 471 pp (availablefrom author).Faure, G. 1986: Principles of isotope geochemistry. Chichester: Wiley,589 pp.Folk, R.L. 1974: Petrology of sedimentary rocks. Austin, Texas: HemphillPublishing Co., 184 pp.Freitas, M.C. 1995: A Laguna de Albufeira (Pen‡nsula de Setiuubal).Sedimentologia, Morfologia e Morfodinamica. Unpublished PhD thesis,Departamento de Geologia, Universidade de Lisboa, 337 pp (availablefrom author).Freitas, M.C. and Andrade, C. 1994: Tidal inlet evolution and hydrauliccharacteristics at Albufeira Lagoon. Proceedings LITTORAL’94, 257–71.Freitas, M.C., Andrade, C. and Romariz, C. 1993: Middle and late Hol-ocenic evolution of the Melides barrier (SW Portugal). First results. Stras-bourg: Terra Abstracts, EUG VII, 613–14.Friedman, G. and Sanders, J. 1978: Principles of sedimentology. Chich-ester: Wiley, 792 pp.Haskin, L.A., Haskin, M.A., Frey, F.A. and Wildeman, T.R. 1968:Relative and absolute terrestrial abundances of the rare earths. In Ahrens,L.H., editor, Origin and istribution of the elements, Oxford: Pergamon,889–911.Hayes, M.O. 1978: Barrier island morphology as a function of tide andwave regime. In Leatherman, S.P. editor, Barrier islands. From the Gulfof St Lawrence to the Gulf of Mexico, London: Academic Press, 1–29.Kawachita, K. 1972: O metodo Rb/Sr em rochas sedimentares. Aplicacaopara as Bacias do Parana e Amazonas. Unpublished PhD thesis, InstitutoGeociencias, University of Sao Paulo (Brasil), 111 pp (available fromauthor).Kubler, B. 1964: Les argiles, indicateurs de metamorphisme. Revue Insti-tut Francais de Petrole 19, 1093–112.Langmuir, C.H., Voke, R.D. Jr, Hanson, G.N. and Hart, S.R. 1978:A general mixing equation with applications to Icelandic basalts. EarthPlanetary Science Letters 37, 380–92.Larsonneur, C. 1977: La cartographie des depots meubles sur le plateaucontinental francais: methode mise au point et utilisee en Manche. JournalRecherche Oceanographique 2(2), 33–39.
LNEC 1967: Solos – determinacao do teor em materia organica. Especi-� cacao LNEC E-201, Lisboa: Laboratorio Nacional de EngenhariaCivil, 3 pp.Lopez-Buend‡a, A.M., Bastida, J., Querol, X. and Whateley, M.K.G.1999: Geochemical data as indicators of paleosalinity in coastal organic-rich sediments. Chemical Geology 157, 235–54.Martin, J.M. and Maybeck, M. 1979: Elemental mass balance of materialcarried by major world rivers. Marine Chemistry 7, 173–206.Mateus, J. 1992: Holocene and present-day ecosystems of the Carvalhalregion, Southwest Portugal. PhD dissertation, University of Utrecht,184 pp.Nichols, M. and Allen, G. 1981: Sedimentary processes in coastallagoons. Proceedings of Coastal Lagoon Research, Present and Future.UNESCO Technical Papers in Marine Science 33, 27–80.Paul, M.A. and Barras, B.F. 1998: A geotechnical correction for post-depositional sediment compression: examples from the Forth valley, Scot-land. Journal of Quaternary Science 13, 171–76.Pejrup, M.C. 1988: The triangular diagram used for classi� cation ofestuarine sediments: a new approach. In de Boer, P.L., van Gelder, A. andNio, S.D., editors, Tide-in�uenced sedimentary environments and facies,Dordrecht: D. Reidel, 289–300.Queiroz, P. and Mateus, J. 1994: Preliminary palynological investigationon the Holocene deposits of Lagoa de Albufeira and Lagoa de Melides,Alentejo (Portugal). Revista de Biologia 15, 15–27.Revel, M., Sinko, J.A. and Grousset, F.E. 1996: Sr and Nd isotopes astracers of North Atlantic lithic particles: paleoclimatic implications. Paleo-ceanography 11, 95–113.Rocha, F. 1993: Argilas aplicadas a estudos litoestratigra� cos e paleoam-bientais na Bacia Sedimentar de Aveiro. Unpublished PhD Dissertation,University of Aveiro, 399 pp (available from author).Schultz, L.G. 1964: Quantitative interpretation of mineralogical compo-sition from X-ray and chemical data for the Pierre Shale. US GeologicalSurvey Professional Papers 391–C, 1–31.Silva, A. 1869: Annaes do Municipio de Sant’iago do Cacem. Lisboa:Imprensa Nacional, 280 pp.Silvester, R. 1974: Coastal engineering, volume 2. Oxford: Elsevier,338 pp.Stuiver, M., Long, A., Kra, R.S. and Devine, J.M. 1993: Calibration –1993. Radiocarbon 35.Talma, A.S. and Vogel, J.C. 1993: A simpli� ed approach to calibratingC14 dates. Radiocarbon 35, 317–22.Thorez, J. 1976: Practical identi�cation of clay minerals. Bruxelles: G.Lelotte, 99 pp.Vogel, J.C., Fuls, A., Visser, E. and Becker, B. 1993: Pretoria calibrationcurve for short lived samples. Radiocarbon 35, 73–86.