Sea breeze and coastal processes
14
Breeze and A diurnal coastal air circulation characterized by alternate sea and land breezes constitutes an important yet poorly understood form of ener- gy supply for nearshore and coastal processes in a number of tropical and subtropical coasts. Although a con- siderable amount of literature has been accumulated on the characteris- tics of this mesoscale meteorological phenomenon, little attention has been given to the mechanism of coupling with waves, currents, and strength of winds in a sea breeze C. J. Sonu S. P. Murray S. A. Hsu J. N. Suhayda E. Waddell system, there is a tendency to dis- count its effects on the dynamic response of the coastal processes. The wind speed in a sea breeze is generally on the order of 5 m/sec, but speeds as high as 10 m/sec or those approaching storm intensity are not uncommon [Defant, 19511. In areas where the sea breeze prevails for many months of the year, the cumulative effect of its winds, albeit modest, on coastal processes should reach a significant extent. Owing to the Coriolis effect, sea breeze winds rotate clockwise in the northern hemisphere, each rotation being completed in 24 hours in accordance with the diurnal tempera- ture cycle. Usually, the sea breeze starts between 1000 and 1100 hours, reaches its maximum velocity be- tween about 1300 and 1400 hours, and subsides between 1400 and 2000 hours, after which it is replaced by the nocturnal land breeze [Defant, 19511. The sea breeze fetch over water ranges up to the order of 100 km in tropical regions but remains on the order of 50 km in most subtropi- cal regions. The seaward range of the land breeze, much weaker than the sea breeze because of the terrain roughness and also its stability and lack of convection, seldom exceeds 50 km [Hsu, 19701. The question is, then, How do the dynamic processes on a coast re- spond to this diurnal wind system? More specifically, given this diurnal excitation, What are the amplitude, phase, and frequency characteristics of the responding waves, currents, and beach topography? To answer this question, an extensive field pro- gram, code-named Salis (Sea-&- Land Interaction System), was con- ceived as a multidisciplinary experi- ment (Figure 1). The project was carried out in June and July 1971 on Santa Rosa Island, Florida (30°24'N, 86'45'~), site of a well-developed sea breeze system. The results clearly demonstrated t h a t the sea breeze significantly affected the dynamic processes operating on the coast: 1. Meteorological parameters such as aerodynamic roughness, shear stress, and atmospheric stability ex- hibited definite coupling with the wind speed. A new relationship be- tween the friction velocity and the wind speed at 10 meters was found; this new relationship contrasts with conventional deepwater expressions. The aerodynamic roughness de- pended not only on waves, as was expected, but also on atmospheric stability mainly associated with land breeze. 2. The sea breeze produced a high-frequency peak in the nearshore wave spectrum that dominated the background swell in the afternoon and evening. The response of the wind waves involved amplitude, fre- quency, and direction, whereas that of the swell was primarily limited to amplitude. 3. Nearshore currents responded with a lag of 3-5 hours to the onset of the sea breeze cycle with current amplitudes of up to 25 cm/sec. As a consequence of the proximity of the coast and the surface slope associated with wind setup, these currents flowed essentially parallel to the shoreline and had only minor onshore-offshore components. 4. Wave-induced currents around and inside the inner bar underwent systematic diurnal variations in re*
-
Upload
independent -
Category
Documents
-
view
3 -
download
0
Transcript of Sea breeze and coastal processes

Breeze and
A diurnal coastal air circulation characterized by alternate sea and land breezes constitutes an important yet poorly understood form of ener- gy supply for nearshore and coastal processes in a number of tropical and subtropical coasts. Although a con- siderable amount of literature has been accumulated on the characteris- tics of this mesoscale meteorological phenomenon, little attention has been given to the mechanism of coupling with waves, currents, and
strength of winds in a sea breeze
C. J. Sonu S. P. Murray S. A. Hsu J. N. Suhayda E. Waddell
system, there is a tendency to dis- count its effects on the dynamic response of the coastal processes. The wind speed in a sea breeze is generally on the order of 5 m/sec, but speeds as high as 10 m/sec or those approaching storm intensity are not uncommon [Defant , 19511. In areas where the sea breeze prevails for many months of the year, the cumulative effect of its winds, albeit modest, on coastal processes should reach a significant extent.
Owing to the Coriolis effect, sea breeze winds rotate clockwise in the northern hemisphere, each rotation being completed in 24 hours in accordance with the diurnal tempera- ture cycle. Usually, the sea breeze starts between 1000 and 1100 hours, reaches its maximum velocity be- tween about 1300 and 1400 hours, and subsides between 1400 and 2000 hours, after which it is replaced by the nocturnal land breeze [Defant , 19511. The sea breeze fetch over water ranges up to the order of 100 km in tropical regions but remains on the order of 50 km in most subtropi- cal regions. The seaward range of the land breeze, much weaker than the sea breeze because of the terrain roughness and also its stability and lack of convection, seldom exceeds 50 km [Hsu, 19701.
The question is, then, How do the dynamic processes on a coast re- spond to this diurnal wind system?
More specifically, given this diurnal excitation, What are the amplitude, phase, and frequency characteristics of the responding waves, currents, and beach topography? To answer this question, an extensive field pro- g ram, code-named Salis (Sea-&- Land Interaction System), was con- ceived as a multidisciplinary experi- ment (Figure 1). The project was carried out in June and July 1971 on Santa Rosa Island, Florida (30°24'N, 86 '45 '~ ) , site of a well-developed sea breeze system.
The results clearly demonstrated t h a t the sea breeze significantly a f fec ted t h e dynamic processes operating on the coast:
1. Meteorological parameters such as aerodynamic roughness, shear stress, and atmospheric stability ex- hibited definite coupling with the wind speed. A new relationship be- tween the friction velocity and the wind speed at 10 meters was found; this new relationship contrasts with conventional deepwater expressions. T h e aerodynamic roughness de- pended not only on waves, as was expected, but also on atmospheric stability mainly associated with land breeze.
2. The sea breeze produced a high-frequency peak in the nearshore wave spectrum that dominated the background swell in the afternoon and evening. The response of the wind waves involved amplitude, fre- quency, and direction, whereas that of the swell was primarily limited to amplitude.
3. Nearshore currents responded with a lag of 3-5 hours to the onset of the sea breeze cycle with current amplitudes of up to 25 cm/sec. As a consequence of the proximity of the coast and the surface slope associated wi th wind setup, these currents flowed essentially parallel to the shore l ine and had only minor onshore-offshore components.
4. Wave-induced currents around and inside the inner bar underwent systematic diurnal variations in re*

sponse to offshore wave breaking and incidence angles of the diurnal wave field, changing from closed circula- tions (early afternoon), t o meander- ing currents (late afternoon), t o weakly curved parallel currents (night and early morning).
5. The beach system acted as a low-pass filter to input waves, so that both swash and groundwater fluctua- tions underwen t high-frequency attenuation. The cutoff frequency varied as a function of the combined effects of the tide and diurnal wave field.
6. Topographic response ex- hibited dependence on the scale of topography and excitation fre- quency. Whereas small-scale features such as ripples, megaripples, and beach cusps changed within an hour- ly or shorter time scale, large features such as crescentic bars and rhythmic shorelines on the order of 120 meters in wavelength remained unresponsive for over 3 weeks.
Field Operations Figure 2 shows the deployment of
instruments. The site consisted of a square area measuring 700 meters alongshore and 100 meters landward and 600 meters seaward from the shoreline; it was bounded seaward by the 12-meter depth contour and landward by the 3-meter height con- tour on the dunes. The coastline trended approximately east-west, facing the Gulf of Mexico on the south.
Meteorological and wave instru- ments were deployed between the outer bar and the dune. These instru- ments included a row of five wind towers (1 in Figure 2), each equippec with six fast-response cup anemom eters; a row of five resistance win wave gages (2) parallel t o the win& tower array, two of which were oriented parallel to the coast to ob- tain directional wave spectra; and a two-level thermograph (3) across the air-sea interface to obtain the Richardson number. A 10-meter
A view from the dune showing the 10-meter anemometer towe with a three-level array of hygrometers, a theodolite, and a boat engage( current measurement and drogue operation.
AIR-SEA INTERACTION
W i n d profile & shear stress
distributions over waves (Hsu)
W a v e generation (Suhayda)
Wind-driven currents (Murray)
Bac~!i,qror~tlri clutc~:
ride, w ~ i ' ~ & 11.01er re~nperarl~re
SEA-LAND INTERACTION radiorlotr h~iclget
AIR-LAND INTERACTION W a v e shoaling a n d break ing W i n d profi le & shear
lSuhovdal . . . stress distributions
Wave- induced nearshore currents (Sonu) over beach (Hsu)
Sediment transport a n d beach changes
L of subpl r. The n4
undwater
I
anemometer (4) on the beach dune, a bottom-mounted wave-tide sensor
> - - , . S w a s h a n d beach
( W a d d e l l 8: Sonu (5) (Hydroproducts model 521) at the 12-meter depth, and a microbaro- graph (6) supplied background data. L-- In addition, a specially designed Fig. 1. Lisl l pojects on sea-air-land interactions included in capacitance tide gage (7) [Rector et Project Salk of the project participants are given in a[., 19731 was operated in the surf parenthesis.

Fig. 2. Deployment of instruments.
zone for the purpose of monitoring devoted to combined measurement two trailers (19) placed on the beach tidal fluctuations and setup and set- of swash, beach groundwater, sedi- and the dune. down associated with winds. ment transport, and beach and near-
Current meters were deployed in shore topography. Specially designed Results recognition of the zonation of near- capacitance probes were used to Detailed analysis of the extensive shore currents: wind-driven currents monitor swash and sand level simul- data obtained in the Salis project is seaward of the outer bar, wind- and taneously. Parallel rows of six swash still under way. The present paper wave-driven currents between the probes and groundwater wells ( l3 ) , describes preliminary results and outer and the inner bars, and wave- each equipped with modified capaci- focuses on air-sea interaction, the driven currents around and landward tance probes, were placed normal to coastal current system, and beach of the inner bar. Those current the shoreline. A wave probe and a morphodynamics. meters beyond the outer bar con- beat wave probe (14), installed out- Air-sea interact ion. Figure 3 sisted of two bottom-mounted speed side the shoreline, monitored input illustrates some of the parameters re- and direction sensors (8) (Marine waves and breakers. Any combina- lating to the air flow characteristics Advisers Q-16) and two surface layer tion of these sensors, plus up to three observed during the project. As is speed a n d direction sensors (9) miniature bidirectional current me- shown in Figure 3(a, b), the wind (Marine Advisers Q-1 SR), which were ters ( to measure swash internal veloc- was dominated in general by daily placed along the 9-meter contour. A ities), could be deployed for simul- cycles of sea and land breezes. Maxi- profiling current meter (Marine Ad- taneous analog recordings. mum daily sea breezes typically blew visers Q-15) and an induction sali- from about 3 0 ' ~ of normal to the nometer (10) were operated from a Background data on the land were shoreline and lagged about 2 hours boa t . Specially designed drogues supplied by routine surveys of beach behind the time of maximum heating (1 l), periodically released outside and surf zones and by a three-level of the land. Similar characteristics of the outer bar and between the outer array of hygrometers (15), an evap- the sea breeze and land breeze sys- and inner bars, were tracked by the- orimeter (16), a net radiation record- tem off the Texas coast have been odolites ( 12). er (1 7), and a soil heat flux meter described by Hsu [ 19701 .
Instruments for the sea-land inter- (18). Recorders for wind, wave, and In the lowest turbulent layer of action phase of the Salis project were swash sensors were maintained in the atmosphere over water under

conditions, logarithmic I ~ ~ ~ I ~ ~ ~ ~ ~ ~ ~ ~ ~ I ~ ~ ~ ~ ~ ~ ~ ~ ~ ~ ~ ~ ~ ~ ~ ~ ~ ~
wind velocity distribution with r height has been observed over the sea [Roll, 1965;Ruggles, 19701, in labo- ratory channels [ Wu, 1968; Lai and Shemdin, 197 1 1 , and over nearshore water surfaces [Hsu, 1973bl. The 'general expression for coastal air flow over the water surface during the period of this study should be written as
where Uz is the mean horizontal wind velocity at height Z, U, is the hear velocity and equals (TIP)% (where T is the vertical transport of horizontal momentum and p is the air density), K is the von Karman constant (=0.4), and Z o is the aero- dynamic roughness; L = -cp TO u * ~ / (gkQ) is the Monin-Obukov stability length [Monin and Obukov, 19541, in which g is the gravity acceleration, cp is the specific heat at constant pressure, To is the mean absolute air temperature of the bottom layer, and Q is the heat flux. A constant value of a, = 4.0 was found to provide a good fit t o marine observa- tions [Hoeber, 1969; Miyake et al., 19701. I t has been shown that the term ZIL may be approximated by the Richardson number [Kraus, 19721.
Attention should be paid to the inverse relation between Q and L. Under adiabatic conditions (Q + 01, e.g., in the sea breeze mixed with general onshore gradient winds, (1) reduces to the familiar logarithmic law. In more stable air, e.g., in the .land breeze, the heat flux and Rey- nolds stress approach zero at the same rate, and then the Monin-Obukhov length approaches zero [Businger et al., 197 1 I . As a consequence, if one accepts the limiting value of R i 0.21 as the critical Richardson num- ber [Webb, 1970; Businger et al., 19711, the atmospheric turbulence diminishes and the land breeze flow during the nighttime becomes lami- nar. Under this condition, the U, values should be small, as is indicated in Figure 3(b-d) in association with Figure 3g.
If we now consider only daytime Onshore winds over the water, the analysis of approximately fifteen hundred 15-min w i n d profiles
C
3Or dm &RF Z O N E I
- 3 o 1 g. RICHARDSON NUMBER
20
Fig. 3. (a) Longshore and (b) normal components of the wind in the study area, (c, d) shear velocity U,, (e , f) aerodynamic roughness Zo on the water surfaces of the outer bar and the surf zone, respectively, and (g) Richardson number Ri over the surf zone area.
I
, 1 - , A L
0 N
6 0 - f. SURF Z O N E
having statistically significant loga- tionship [Hsu, 1973bl : r i thmic wind distribution with height, which accounted for about U* = 0 . 3 7 ~ 1 orn2I3 (2 )
90% of the total daytime onshore in which Ul o m is the wind speed in wind measurements, revealed a rela- centimeters per second at a reference
6 / 2 5 6 / 2 6 6 / 2 7 6 / 2 8 6 / 2 9 6 / 3 0 7 / 1 712 713
Ir 40 -
l A , .
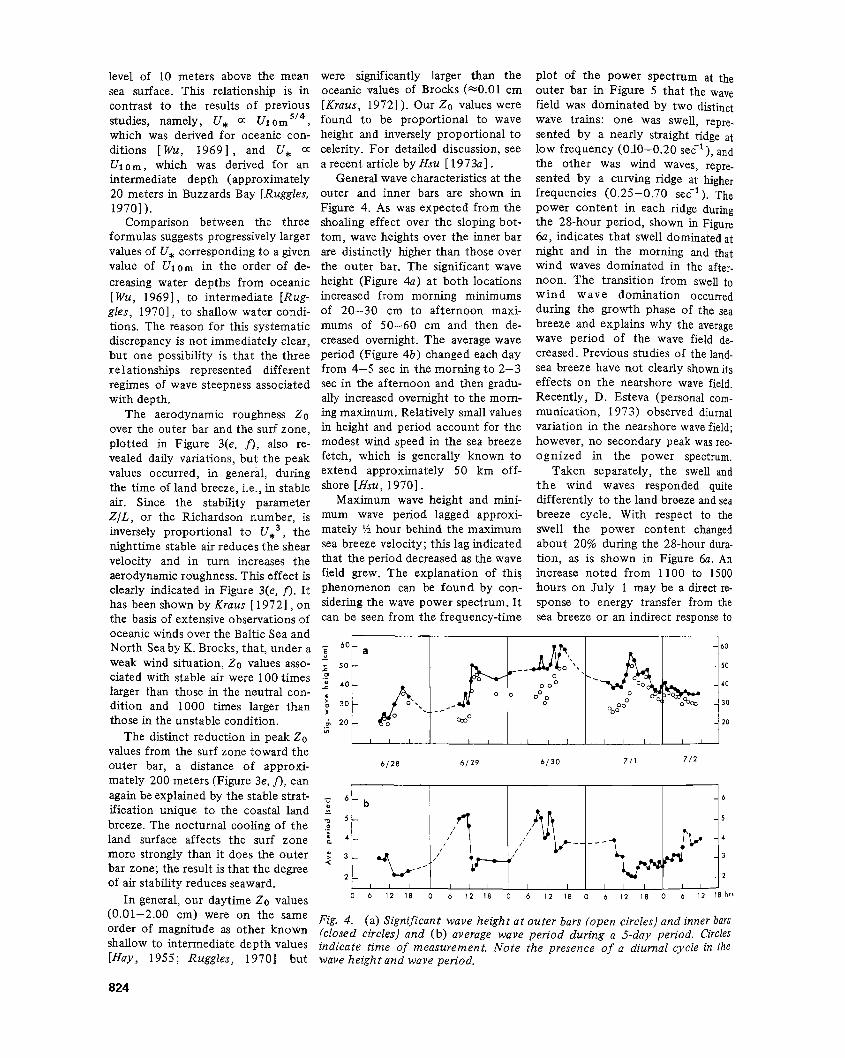
level of 10 meters above the mean were significantly larger than the plot of the power spectrum at the sea surface. This relationship is in oceanic values of Brocks (=0.01 cm outer bar in Figure 5 that the wave contrast to the results of previous [Kraus, 19721 ). Our Zo values were field was dominated by two distinct studies, namely, U , a: u ~ ~ ~ ~ ' ~ , found to be proportional to wave wave trains: one was swell, repre- which was derived for oceanic con- height and inversely proportional to sented by a nearly straight ridge at ditions [ Wu, 19691 , and U , a: celerity. For detailed discussion, see low frequency (0.10-0.20 secl) , and Ul o m , which was derived for an a recent article by Hsu [ 1973al. the other was wind waves, repre- intermediate depth (approximately General wave characteristics at the sented by a curving ridge at higher 20 meters in Buzzards Bay [Ruggles, outer and inner bars are shown in frequencies (0.25-0.70 secl) . The 19701 ). Figure 4. As was expected from the power content in each ridge during
Comparison between the three shoaling effect over the sloping bot- the 28-hour period, shown in Figure formulas suggests progressively larger tom, wave heights over the inner bar 6a, indicates that swell dominated at values of U , corresponding to a given are distinctly higher than those over night and in the morning and that value of Ul o m in the order of de- the outer bar. The significant wave wind waves dominated in the after- creasing water depths from oceanic height (Figure 4a) at both locations noon. The transition from swell to
[Wu , 19691, to intermediate [Rug- increased from morning minimums wind wave domination occurred gles, 19701, to shallow water condi- of 20-30 cm to afternoon maxi- during the growth phase of the sea tions. The reason for this systematic mums of 50-60 cm and then de- breeze and explains why the average discrepancy is not immediately clear, creased overnight. The average wave wave period of the wave field de- but one possibility is that the three period (Figure 4b) changed each day creased. Previous studies of the land- relationskips represented different from 4-5 sec in the morning to 2-3 sea breeze have not clearly shown its regimes of wave steepness associated sec in the afternoon and then gradu- effects on the nearshore wave field. with depth. ally increased overnight to the mom- Recently, D. Esteva (personal com-
The aerodynamic roughess Zo ing maximum. Relatively small values munication, 1973) observed diurnal over the outer bar and the surf zone, in height and period account for the variation in the nearshore wave field; plotted in Figure 3(e, 0, also re- modest wind speed in the sea breeze however, no secondary peak was rec- vealed daily variations, but the fetch, which is generally known to ognized in the power spectrum. values occurred, in general, during extend approximately 50 km off- Taken separately, the swell and
the time of land breeze, i.e., in stable shore [HJu, 19701. t h e wind waves responded quite air. since the stability Maximum wave height and mini- differently to the land breeze and sea Z I L , or the ~ i ~ h ~ ~ d ~ ~ ~ number, is mum wave period lagged approxi- breeze cycle. With respect to the inversely proportional t o ~ , 3 , the mately ?h hour behind the maximum swell the power content changed nighttime stable air reduces the shear sea breeze velocity; this lag indicated about 20% during the 28-hour dura- velocity and in turn increases the that the period decreased as the wave tion, as is shown in Figure 6a. An aerodynamic roughness. l-his effect is field grew. The explanation of this increase noted from 1100 to 1500 clearly indicated in Figure 3(e, n. ~t phenomenon can be found by con- hours on July 1 may be a direct re- has been &own by Kraus [ 19721 , on sidering the wave power spectrum. I t sponse to energy transfer from the the basis of extensive observations of can be seen from the frequency-time sea breeze or an indirect response to oceanic winds over the Baltic Sea and North Sea by K. Brocks, that, under a 60-
weak wind situation, Zo values asso- f 5 0
ciated with stable air were 100 times ,, larger than those in the neutral con- . dition and 1000 times larger than 30
those in the unstable condition. ca 20
The distinct reduction in peak Zo "
60
50
40
- 3 0
20
a -
/\ -
, I I
values from the surf zone toward the 6 / 2 8 6 / 2 9 6 / 3 0 711 712
outer bar, a distance of approxi- mately 200 meters (Figure 3e, f), can
6
:: 2
again be explained by the stable strat- , 6
ification unique to the coastal land 2 P 5 - breeze. The nocturnal cooling of the .;
land surface affects the surf zone : '- more strongly than it does the outer ; 3 bar zone; the result is that the degree of air stability reduces seaward.
o
o 0
\.-.-*-* I+- w0
I I I
In general, our daytime Zo values 0 6 12 18 0 6 1 2 I 8 0 6 12 I 8 0 6 12 18 0 6 12 l a h r '
(0'01-2.00 cm) were On the same Fig. 4. (a) Significant wave height o f outer barf (open circles) and inner bars Order of magnitude as (closed circles) and (b) average wave period during a 5-day period. Circles shallow to intermediate depth values indicate time o f measurement. Note the presence of a diurnal cycle in the [Hay, 1955; RuggEes, 19701 but wave heigk t and wave period.
-"Y '.. OO
o,L?O o 0
I l l
d\ --- o
0 o 0 0 0"
I l l
-
- \/, -
I 1 1
-
-
- %k -
I I
F, , I
i
, / I
I l l
p,,,/i/%
I l l
b , p _ _ - - -
I l l I I _

a rnaserlike interaction with the sea breeze produced wind waves [Lon- guet-Higgins, 1 9691 . The swell period increased from 6 to 7.5 sec during the growth of the sea breeze, decreased slightly as the wind speed weakened, and then remained nearly constant as the wind speed normal to the coast continued to fall. This effect is quite distinctly recognized in Figure 5. The incidence angle of the swell, as determined from two offshore wave staffs [Suhayda and Hecht, 19701 , remained relatively constant at about 3 " ~ and showed no response to the wind. The sea breeze part of the cycle thus seemed to be effective in slightly altering the swell height and period but not the swell direction, although this point needs more analysis for clarification.
In contrast to the swell the wind waves showed large variations in power content, period, and direction throughout the land breeze and sea breeze cycle, as is shown in Figures 5 and 6. The wind waves were strongly coupled with the sea breeze. In the growth phase of the sea breeze the wind wave period increased rapidly from about 1 sec at 1000 hours to 3 sec at 1600 hours (Figure 5), the time of maximum sea breeze. The power content of the wind waves also increased rapidly during this time. At frequencies between 0.45 and 0.70 sec-' an overshoot is ob- served [Barnett and Sutherland, 1968; Mitsuyasu, 19691 inasmuch as the power contents there decrease even during the growth of the sea breeze. As the sea breeze continued to decrease and turned in direction from 1600 to 2100 hours, the wind waves also responded sensitively by decreasing in power content (Figures 5 and 6a) and turning in the same direction (Figure 6b). Residual wind waves persisted after the cessation of the sea breeze, and this phenomenon is akin to the afterglow effect [Munk et al., 19631. Damping of these waves during a short period of the adverse land breeze was not total. The waves only slowly decreased in Power content, so that they were still observable in the power spectrum un- til 1200 hours on July 2, well after the initiation of a new cycle of sea breeze.
Wind-driven currents outside outer bar. A typical record of coast-
0 6 10 14 18 22 2 6 10
H o u r July 1 July 2
Fig. 5. Wave spectrum at the outer bar over a 28-hour period showing the presence o f sea breeze wind waves (as curving ridge) at high frequency and swell (as straight ridge) at low frequency.
a1 currents 3 meters below the sur- face on the 9-meter depth contour is shown in the 2-day hourly plot of vectors in Figure 7. The current vec- tors reveal diurnal pulses of east- going current with speeds of up to 25 cm/sec superimposed on a prevailing west-going current with speeds of 5-10 cm/sec. I t is clear from the fig- ure that these daily pulses are corre- lated with the diurnal wind cycle rather than with the diurnal tide. Fig- ure 6 shows that 3-4 hours after the onset of the southwesterly sea breeze the current abruptly reverses from westerly to easterly; as the sea breeze begins to decelerate in the evening, the current shifts back, with a similar time lag, to the prevailing westward direction.
Ten days of continuous wind and current coverage indicated that both the morning and evening current re- versals occur as a counterclockwise rotation of about 1 hour in duration. During the morning reversal, mea- surements show that currents in the
upper meter of the water are driven slightly onshore by the onshore southwesterly wind. The required seaward return current is apparently p roduc ing t h e counterclockwise sense of rotation at the 3-meter level. This interpretation is supported by the plot of water density ot at the 3-meter level through time (inset in Figure 7). The decrease in density during the phase of strong onshore winds indicates that light surface water has been moved in toward the coast, the heavier water being pushed offshore. The evening counterclock- wise reversal triggered by the deceler- ation of the sea breeze (1800 hours) is produced by the return onshore of the displaced heavier water, as is indi- cated by the increase in ot, shown in the inset in Figure 7. Note that the rebounding of the density ot was later accelerated by the offshore- directed surface stress associated wi th t h e morning land breeze (0600-0830 hours on July 2). Re- sponses of stratified coastal waters to

far more severe wind conditions (20- to 30-knot winds) have been studied by Murray [ 19731 and Longard and Banks [1952].
During the time of the relatively strong southwesterly sea breeze in the late afternoon, extensive observa- tions were conducted on the struc- ture of the east-going current by theodolite tracking of drogues. Fig- ure 8(a, b ) shows changes in the cur-
rent field at a 2.5-hour interval. Figure 8a shows the case at noon on June 25, which is very unusual in that the wind had been blowing steadily from due south for 3 hours. Water in the upper 1.5 meters of the column is driven toward shore, grad- ually curving around to become more parallel to the bottom contour with distance downwind. Although the figure shows the same general on-
6 12 18 0 6 12 18
West
Fig. 6. (a) Power content o f wind wave (broken line) and swell peaks (solid line) over 28 hours at outer bar (see Figure 5 for spectrum); change in relative height o f wind waves and swell is shown. (b) Direction of approach of swell (solid line) and wind waves (broken line) during the 28-hour period.
shore movement below 3 meters, speeds are SO low (<2 cm/sec) that a consideration of the drag force of the wind on the marker pole indicates the current direction to be seawad at these depths.
In Figure 8b, 2% hours later on the same day, the typical well-devel- oped afternoon velocity field is well represented. At this time the wind had been blowing at 5 mlsec out of t h e south-southwest since 1200 hours. Note that, despite the large component of wind stress normal to the shoreline, the water flow is pre- dominantly parallel to the shoreline. This striking pattern is repeated in all o u r observations under moderate weather conditions.
Close inspection of Figure 8b indi- cates a subtle three-tiered flow pat- tern: waters above the 3-meter level move alongshore but slightly on- shore, waters between the 3- and 6-meter levels move offshore at a slight angle, and the deepest waters depart from this pattern and move sharply onshore. Note especially the behavior of the 7.5-meter drogue in Figure 8b.
Analysis of the equations of motion provides considerable insight into the reason that, despite a large onshore component of the wind stress, the water flow is not primarily onshore in the surface layer and off- shore in the bottom layers, as is usually expected from the pioneering studies of Keulegan [ 195 1 ] and Van Dorn [1953]. In these and more recent studies, such as the study by Baines and Knapp [ 19651 , the cur- rents are restricted by vertical side walls that obviously allow only on-
N i current 1 > July 1 July 2
Fig. 7. Hourly averages for the current velocity at 3-meter depth and the local wind velocity. The inset shows the apparent diurnally cyclic behavior o f the water density ot at the 3-meter depth.

shore and offshore velocity compo- nents. It is clear from our observa- tions that the problem of wind- driven currents along an open coast is of an entirely different nature, a three-dimensional problem. In the steady state, the nonlinear field accelerations and the vertical velocity being neglected, the three compo- nents of the equation of motion in homogeneous water can be combined and written as
where u is the current speed in the x , or parallel to the coast, direction; v is the current speed in they , or perpen- dicular to the coast, direction; aftax and atlay are the surface slopes; g is the gravitational acceleration; f is the Coriolis parameter; and K is the eddy viscosity. If the wind is uniform over a wide enough area, then we expect the water slope parallel to the coast atlax to be negligible, and we may expect the following conditions to apply:
1. The bottom stress is given by a quadratic friction law [Bowden et al., 19591 .
2. The stress on the water sur- face is given by a power law depen- dent on wind speed (this paper).
3. The presence of a coast is tak- en into account by setting $,v dz = 0; i.e., there is no net flow perpendic- ular to the coast.
4. Eddy viscosity K is indepen- dent of depth.
Under these constraints the solu- tion of (4) and (5) by Jeffreys [I9231 in the range of variables of the present study does indeed predict currents that flow essentially parallel to the coast. More specifically, the upper one third of the column flows onshore at an angle of -5' to the coastline, whereas the lower two thuds of the column flows offshore at about the same angle but more slowly to achieve the mass balance. I t Seems that within 1 hour after the onset of the wind a slight net move- ment of water toward the coast elevates the water and sets up a sur- face slope directed seaward, which all but balances out the onshore compo- nents of the forces associated with
the eddy stresses. The values of the surface slope under conditions typi- cal of the sea breeze regime predicted by the theory are on the order of
to ; this range is in order with Von Arx's [I9651 deductions for a similar range of current speeds.
Table 1 gives a sample comparison between observed and predicted wind-driven current velocities in 9 meters of water at various wind angles to the coastline. Note especial- ly the dominant effect of the wind angle i n controlling the current
speed. Semiempirical relationships such as Keulegan's 3% rule clearly hold little value for wind drift near the open coast without further modi- fication. The 'surface' current obser- vations are actually taken at a depth of 1.5 meters, but surface dye studies by S.P. Murray (unpublished data, 197 1) at the same depth likewise indi- cate that surface waters move along the coast instead of closely tracking the wind.
Another important aspect of the observations is explained by further
Fig.8. (a) Drogue trajectories at four depth levels at 1200 hours on June 25. Wind has been blowing from due south at 4 mlsec since 0900 hours. (b) Drogue trajectories at five depths at 1430 hours on the same day. Wind has been blowing from the south-southwest since 1200 hours at 5 mlsec. The flow is largely parallel to the coast but exhibits some subtle vertical structure. The increase in longshore surface stress resulting from wind shift has greatly increased the current speeds.

TABLE 1. Observed and Predicted Surface Current Velocities near Coasts
Predicted Current Observed Current
Wind Speed, Direction,* Speed, Direction,* Speed, Direction,* mlsec deg cmlsec deg cm/sec deg
5 90 1.7 85.3 6 7 0 5 75 10.5 8.7 . . . . . . 5 60 15.2 5.2 17 10 5 40 19.5 2.8 ... ... 5 0 22.7 -0.3 . . . . . .
*Direction is measured from parallel to c
modification of (4) and (5). Numeri- cal solution of these equations, as- suming a depth-dependent eddy viscosity (as is assumed in the study by Fjelstad [ 1929]), successfully predicts a three-tiered velocity pro- file with a near-bottom onshore flow, as is demonstrated by the 7.5-meter drogue in Figure 8b. The explanation of larger components of motion in the direction normal to the coast, which seem to occur under more severe wind conditions [Murray, 1970, 197 1 ] , requires further work with the theory.
Currents between the outer and inner bars. Figure 9 shows, on the basis of drogue trajectories during the daytime sea breeze, horizontal velocity distributions at 1 meter below the surface between the outer and inner bars. Depths over the outer and inner bars averaged approximate- ly 4 meters and 1 meter, respectively.
The velocity components normal to the coast were consistently s m d
:oast positive onshore.
(less than about 6 cmlsec) and ex- hibited random scatter throughout the entire zone. The longshore veloc- ity components were larger and ex- hibited a definite trend for offshore dependence, increasing almost lin- early from the inner to the outer bars. This phenomenon is probably attributable to the frictional effect of the coastal boundary, which tends to limit the scale of eddy mixing in accordance with distance to the coastline. Although it is not shown in Figure 9, the longshore velocity c o m p o n e n t fell rapidly seaward beyond the outer bar; this fall indi- cated the presence of a zone of peak longshore velocities near the outer bar. This phenomenon was indepen- dent of wave breaking over the outer bar and appears to result from the longshore wave thrust balanced with the rapid frictional attenuation of incident waves on the steep seaward slope of the outer bar. The longshore thrust under this condition can be
LONGSHORE C O M P O N E N T
. OUTER
. .- . .
@! F . .. ia ": ',
INNER BAR - - -
SHOREWARD COMPONENT
I I I I 20 15 10 5 do -00
VELOCITY, crn /sec
Fig. 9. Longshore and shoreward components o f current velocities between the outer and the inner bars (based on drogue trajectories).
expressed approximately [Longuet- Higgins, 1970a, bl by
in which E is wave energy density, cg is group velocity, C is wave celerity, 8 is incidence angle, and x is positive landward. The first factor, repre- senting the rate of attenuation, and the second factor both contribute to the increase in longshore wave thrust and apparently overpower the ad- verse effect of refraction represented by the third factor on the steep slope of the bar.
Note also in Figure 9 some large values of longshore velocity (distin- guished by circles) immediately out- side the inner bar. These values repre- sent conditions of active breaking over the inner bar and suggest that the current in this region was rein- forced by wave-induced longshore currents inside the surf zone, which arose from characteristic radiation stress distributions associated with breakers [Bowen, 1969; Longuet- Higgins, 19 70a, b ] .
Wave- induced currents. Wave- induced nea r shore circulations responded sensitively to (1) bottom topography in the surf zone, (2) breaker characteristics over the inner bar, and (3) breaker incidence angle. As is shown in Figure 10, the surf zone bottom was typically undula- tory, displaying alternate shoals and depressions at an average spacing of approximately 120 meters. Breakers occur r ing ove r this topography behaved differently along the coast. Waves broke by spilling over the shoals and by plunging over the bar off the depressions. As has beenpre- viously described from observations made elsewhere [Sonu, 197201, be- cause of a longer travel distance of spil l ing b reake r s than that of plunging breakers in the surf zone, wave energy attenuated more rapidly over the shoal than over the depres- sion; the result was a lower wave height at the shoreline inshore of the shoal than inshore of the depression. I t has b e e n demonstrated both theoretically [Bowen, 19671 and ex- perimentally [Sonu, 19721 that, under this condition, both the wave setup and the longshore component of radiation stress are distributed

*eriodically along the surf zone in such a way that the currents are driven from shoals to depressions. Converging currents at the depression turned seaward and thus gave rise to rip currents.
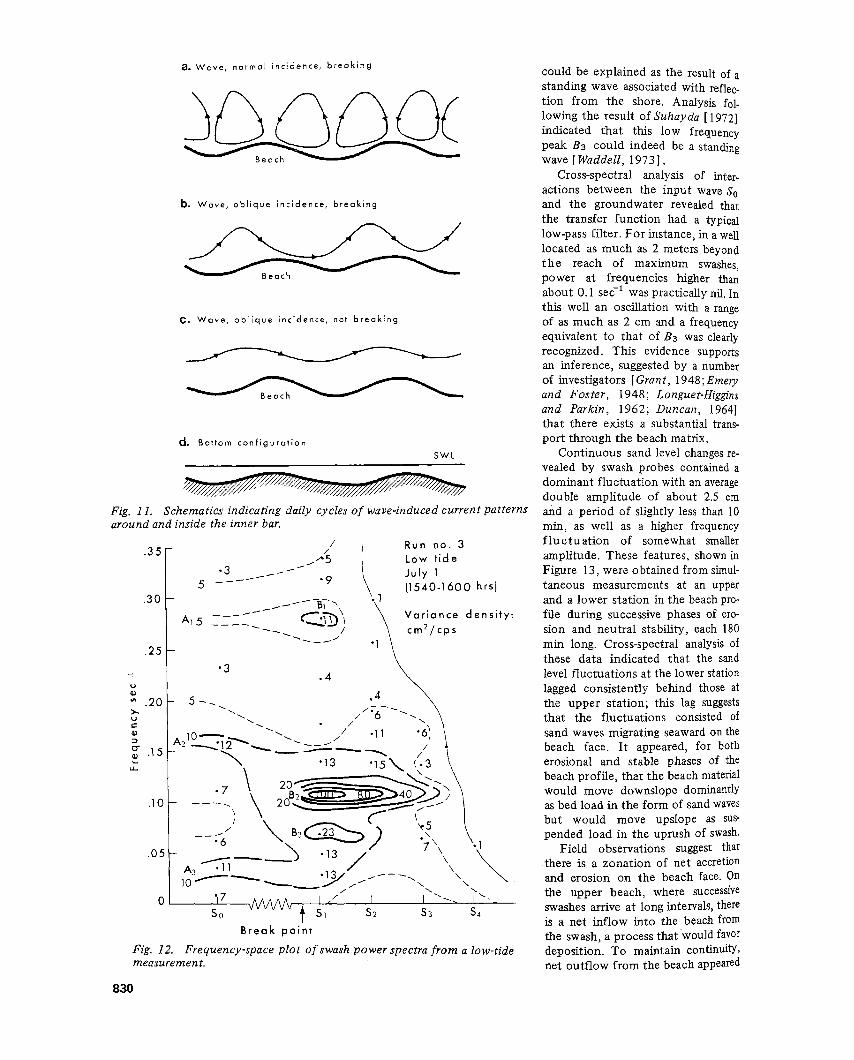
When waves arrived normal to the coast, c losed circulations were formed (Figure 1 la), but, when they arrived at angles, the closed circula- tions were replaced by meandering currents (Figure 1 lb). As the wave characteristics and incidence angles fluctuated in response to diurnal sea breeze and land breeze excitations, the resulting current patterns ex- hibited daily cycles. As the sea breeze grew in intensity early in the day, blowing more or less normal to the coast, closed circulations progres- sively increased their speed (Figure lla). As the wind turned westward later in the day, accompanied by wind waves also arriving at oblique angles to the shore, the closed circu- lations were gradually broken up and replaced by meandering streamlines (Figure 1 lb). As the wave incidence angle further increased, the ampli- tude of meander decreased, and the streamlines tended to be more and more parallel to the coast (Figure llc). At the same time, because the wave heights diminished following deceleration of the sea breeze, the speed of this parallel current itself also decreased and eventually disap- peared as the land breeze caused rapid damping of wind waves in the evening. Modest swells at night, re- duced in height owing to the adverse wind and arriving normal to the coast, maintained weak closed circu- lations until they were reinforced again by a sea breeze the next day, a daily cycle of wave-induced current patterns thus being renewed. Maxi- mum current velocities under these conditions were approximately 30 cmlsec in the rip and 50 cm/sec in the meandering currents.
Swash and beach changes. Figure 12 shows a frequency-space plot of the swash power spectra taken at low tide. Four swash probes, denoted S I - S ~ in ascending order up the beach, were spaced uniformly at 1 meter, and the input wave probe So was located 5 meters seaward from the first swash probe S1. For detailed
June 17, 1971
June 21, 1971 / /;$
- .- o 0 I I I I I I I 'shorel ine
June 30. 1971 /-?
M e t e r s
0
Fig. 10. Undulatory surf zone topographies. Note periodic longshore distn- bution of shoals and depressions at a spacing o f about 120 meters. Also note that over a 2-week period the shoals built up steadily in both the longshore and shoreward directions at the expense o f depressions.
' S h o r e l i n e I I I I I I I I I
discussion, see the study by Waddell [1973].
The swash spectrum contained three peaks (denoted B1, B2, and B3). Of these, the one with the highest frequency B1 was caused by disturbances resulting from collision between uprush and backwash at the lower beach. The principal peak B2 was associated with input swells A2 , which arrived at the shore with little energy loss in the surf zone whereas wind waves were effectively dissi- pated by breaking over the inner bar. Note that peak B2 occurred at a somewhat lower frequency than that of the input swells A2. In general, the swash period did not agree with the input wave period, since the cycle of uprush and backwash was dependent on the beach slope and the wave speed at the shoreline. Moreover, the collision process at the lower beach reduced the number of swashes reaching the upper beach. In
I 0 50 100 150 200 250
general, gentler beach slopes pro- duced a longer swash cycle. Emery and Gale [ 19511, on the basis of photographic evidence, also con- cluded that 'the beach acts as a filter that allows only the larger or longer period waves to pass' up the beach.
The third swash peak Bg repre- sented a gentle oscillation of mean water level at the shoreline, the e f f e c t of which was to enable swashes to accomplish high runups in periodic bursts. This spectral peak had a frequency on the order of 0.02 secl (period of 50 sec), which was somewhat higher than those fre- quencies normally associated with surf bea t s , i .e . , frequencies of
0.02-0.003 seC1 (period of 1-5 min) [Munk, 1949; Tucker, 1950; Longuet-Higgins and Stewart, 1962, 19641. A study by Sonu [ 1972aI pre- viously reported the presence of a similar frequency in the outflow velocities of a rip current, which
a. W a v e , n o r m o l i n c i d e n c e , b r e a k i n g
j) B e a c h
b. W a v e , o b l i q u e i n c i d e n c e , b r e a k i n g
B e a c h
C. W a v e , o b l i q u e i n c i d e n c e , not b r e a k i n g
d. B o t t o m c o n f i g u r a t i o n
S W L
Fig. 1 I . Schematics indicating daily cycles o f wave-induced current patterns around and inside the inner bar.
/ Run n o . 3 " 1
.3 Low t ide
/ . -------- -9 July 1
11540-1600 hrsl
___-- V a r i a n c e dens i ty :
-- . / c m 2 / c p s '.-/'
B r e a k
Fig. 12. Frequency-space plot o f swash power spectra from a low-tide measurement.
could be explained as the result of a standing wave associated with reflec- tion from the shore. Analysis fol- lowing the result of Suhayda [ 19721 indicated that this low frequency peak B3 could indeed be a standing wave [ Waddell, 19731.
Cross-spectral analysis of inter- actions between the input wave So and the groundwater revealed that the transfer function had a typical low-pass filter. For instance, in a well located as much as 2 meters beyond t h e reach of maximum swashes, power at frequencies higher than about 0.1 sec-' was practically nil. In this well an oscillation with a range of as much as 2 cm and a frequency equivalent to that of B3 was clearly recognized. This evidence supports an inference, suggested by a number of investigators [Grant, 1948; Emery and Foster, 1948; Longuet-Higgins and Parkin, 1962; Duncan, 19641 that there exists a substantial trans- port through the beach matrix.
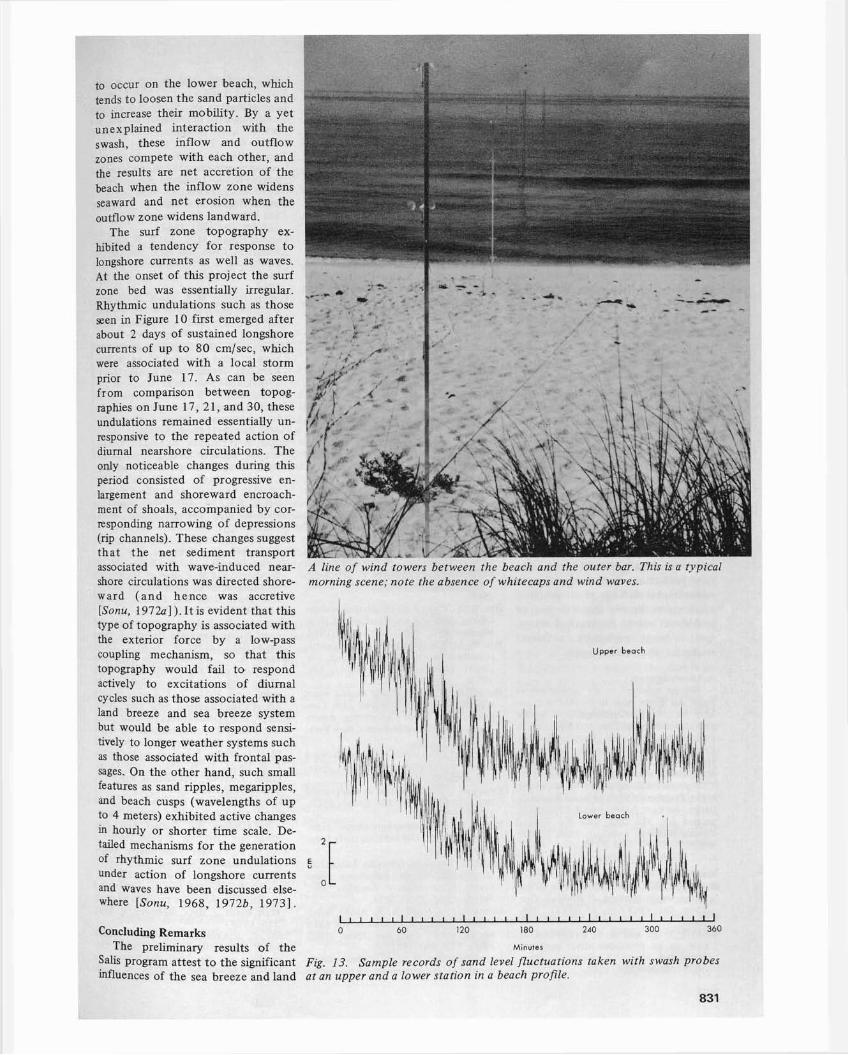
Continuous sand level changes re- vealed by swash probes contained a dominant fluctuation with an average double amplitude of about 2.5 cm and a period of slightly less than 10 min, as well as a higher frequency fluctuation of somewhat smaller amplitude. These features, shown in Figure 13, were obtained from simul- taneous measurements at an upper and a lower station in the beach pro- file during successive phases of ero- sion and neutral stability, each 180 min long. Cross-spectral analysis of these data indicated that the sand level fluctuations at the lower station lagged consistently behind those at the upper station; this lag suggests that the fluctuations consisted of sand waves migrating seaward on the beach face. I t appeared, for both erosional and stable phases of the beach profile, that the beach material would move downslope dominantly as bed load in the form of sand waves but would move upslope as sus- pended load in the uprush of swash.
Field observations suggest that there is a zonation of net accretion and erosion on the beach face. On the upper beach, where successive swashes arrive at long intervals, there is a net inflow into the beach from the swash, a process that would favor deposition. To maintain continuity, net outflow from the beach appeared
to occur on the lower beach, which tends to loosen the sand particles and to increase their mobility. By a yet unexplained interaction with the swash, these inflow and outflow zones compete with each other, and the results are net accretion of the beach when the inflow zone widens seaward and net erosion when the outflow zone widens landward.
The surf zone topography ex- hibited a tendency for response to longshore currents as well as waves. At the onset of this project the surf zone bed was essentially irregular. ,
Rhythmic undulations such as those seen in Figure 10 first emerged after + d
a aC about 2 days of sustained longshore . " currents of up to 80 cm/sec, which . . were associated with a local storm prior to June 17. As can be seen from comparison between topog- raphies on June 17, 2 1, and 30, these undulations remained essentially un- responsive to the repeated action of diurnal nearshore circulations. The only noticeable changes during this period consisted of progressive en- largement and shoreward encroach-
! ment of shoals, accompanied by cor- responding narrowing of depressions (rip channels). These changes suggest that the net sediment transport associated with wave-induced near- shore circulations was directed shore- ward ( and hence was accretive [Sonu, 1972aI ). It is evident that this type of topography is associated with the exterior force by a low-pass coupling mechanism, so that this topography would fail to. respond actively to excitations of diurnal cycles such as those associated with a land breeze and sea breeze system but would be able t o respond sensi- tively to longer weather systems such as those associated with frontal pas- sages. On the other hand, such small features as sand ripples, megaripples, and beach cusps (wavelengths of up to 4 meters) exhibited active changes in hourly or shorter time scale. De- tailed mechanisms for the generation of rhythmic surf zone undulations under action of longshore currents and waves have been discussed else- where [Sonu, 1968, 1972b, 19731.
Concluding Remarks The preliminary results of the
Salis program attest t o the significant influences of the sea breeze and land
A line of wind towers between the beach and the outer bar. This is a typical morning scene; note the absence o f whitecaps and wind waves.
Minutes
Fig. 13. Sample records of sand level fluctuations taken with swash probe at an upper and a lower station in a beach profile.
breeze phenomenon on coastal proc- esses. The processes described in this paper, although they were based on a single experiment, are expected to prevail to various degrees along sub- stantial parts of the coasts of the world, because tropical and subtropi- cal regions, where the sea breeze is known to occur for at least part of the year, occupy about two thirds of the earth's surface. Even in areas of modest sea breeze intensity, such as those investigated in this report, the long-term effect of repetitive sea breeze excitation can be dramatic. A good example is often observed in the rapid recovery of beach profiles after a hurricane along the coasts of the Gulf of Mexico. Extensive eros- ion scarps formed at the dune front by storm waves are usually restored in about a year by sand blown inland by sea breezes with an average speed of no more than 5 m/sec. Responses of considerably greater intensity than those reported in this paper can be expected in areas where the sea breeze is enhanced by such phenom- ena as a cold, nearshore, ocean cur- rent-upwelling system, e.g., on the Peruvian coast. Further knowledge of the coupling mechanisms between the sea breeze and coastal processes will undoubtedly permit more accu- rate prediction of our coastal envi- ronment, including such practical applications as the renewal rate of nearshore water, dispersal of water- and air-borne pollutants, sediment transport, and beach erosion.
Acknowledgments We are indebted to the authorities of
Eglin Air Force base in Florida, particu- larly MI. Marshal Cartledge, who kindly provided the site and support facilities for this study. Norwood Rector, Rodney Fredericks, Bob Montgomery, and Manuel Hernandez-Avila provided indispensable technical assistance throughout the study. This project was supported by the Geog- raphy Programs, Office of Naval Research, under contract N00014-69-A-02 11-0003, project NR 388 002, with the Coastal Studies Institute, Louisiana State Univer- sity.
References Baines, W. D., and D. J. Knapp, Wind
driven water currents, J. Hydraul. Div. Amer. Soc. Civil Eng., 91 (HY2), 205, 1965.
Barnett, T. P., and A. J. Sutherland, A note on an overshoot effect in wind- generated waves, J. Geophys. Res., 73(22), 6879-6885, 1968.
Bowden, K. F., L. A. Fairbairn, and P. Hughes, The distribution of shearing stresses in a tidal current, Geophys. J., 2(4), 288-305, 1959.
Bowen, A. J., Rip currents, Ph.D. disserta- tion, 115 pp., Univ. of Calif. at San Diego, La Jolla, 1967.
Bowen, A. J., The generation of longshore currents on a plane beach, J. Mar. Res., 27, 206-215, 1969.
Businger, J. A., J. C. Wyngaard, Y. Izumi, and E. F. Bradley, Flux-profile relation- ships in the atmospheric surface layer, J. Atmos. Sci., 28(2), 181-189, 1971.
Defant, F., Local winds, Compendium Meteorol. 1951,655-672, 1951.
Duncan, J. R., Jr., The effects of water table and tide cycle on swash-backwash sediment distribution and beach profile development, Mar. Geol., 2 , 186-197, 1964.
Emery, K. O., and J. F. Foster, Water tables in marine beaches, J. Mar. Res., 7 , 644-653,1948.
Emery, K. O., and J. F. Gale, Swash and swash mark, Eos nuns. AGU, 32(1), 31-36,1951.
Fjeldstad, J. E., Ein Beitrag zur Theorie der winderzeugten Meeresstroemungen, Gerlands Beiir. Geophys., 23, 237, 1929.
Grant, U. S., Influence of the water table on beach-aggradation and degradation, J. Mar. Res., 7,655-660, 1948.
Hay, J. S., Some observations of air flow over the sea, Quart. J. Roy. Meteorol. SOC., 81, 307-319, 1955.
Hoeber , H., Wind-, Temperatur- und Feuchteprofile in der wassernahen Luft- schicht iiber dem aquatorialen Atlantik, Sonderdruck aus Meteorologic For- schungsergebnissen, Reihe B, Heft 3, pp. 1 - 26, Gebriider Borntraeger, Berlin, 1969.
Hsu, S. A., Coastal air-circulation system: Observations and empirical model, Mon. Weather Rev., 98(7), 487-509, 1970.
Hsu, S. A., The mechanics of the dynamic roughness at the air-sea interface (ab- stract), Eos E-ans. AGU, 54(4), 316, 1 9 7 3 ~ .
Hsu, S. A., Wind stress on a coastal water surface, Proceedings of the 13th Con- ference on Coastal Engineering, Ameri- can Society of Civil Engineers, New York, in press, 1973b.
Jeffreys, H., The effect of a steady wind on the sea level near a straight shore, Phil. Mag., 46, 114-117, 1923.
Keulegan, G. H., Wid tides in small closed channels, J. Res. Nut. Bur. Stand., 46(5), 358, 1951.
Kraus, E. B., A tmosphere-Ocean Inter- action, 275 pp., Oxford university Press, New York, 1972.
Lai, R. J., and 0. H. Shemdin, Laboratory investigation of air turbulence above simple water waves, J. Geophys. Res., 76(30), 7334-7350, 1971.
Longard, I. R., and R. E. Banks, Wind- induced vertical movement of the water on an open coast, Eos E-ans. AGU, 33(3), 377-380,1952.
Longuet-Higgins, M. S., A nonlinear mech- anism for the generation of sea waves,
Proc. Roy. Soc. London, Ser. A, 311, 371-389,1969.
Longuet-Higgins, M. S., Longshore cur- rents generated by obliquely incident sea waves, 1, J. Geophys. Res., 75(33), 6778-6789,1970a.
Longuet-Higgins, M. S., .Longshore cur- rents generated by obliquely incident sea waves, 2, J. Geophys. Res., 75(33), 6790-6801,1970b.
Longuet-Higgins, M. S., and D. W. Parkin, Sea waves and beach cusps, Geogr. J., 128(22), 194-201,1962.
Longuet-Higgins, M. S., and R. W. Stewart, Radiation stress and mass transport in gravity waves with application to surf beats, J. Fluid Mech., 13, 481-504, 1962.
Longuet-Higgins, M. S., and R. W. Stewart, Radiation stress in water waves, A phyti- cal discussion with applications, Deep Sea Res., 11(4), 529-563, 1964.
Mitsuyasu, H., On the growth of the spec- trum of wind-generated waves, 2, Rep. Res. Inst. Appl. Mech. Kyushu Univ., 17(59), 235-248, 1969.
Miyake, M., R. W. Stewart, and R. W. Burling, Spectra and cospectra of turbu- lence over water, Quart. J. Roy. Mete- orol. SOC., 96, 138-143, 1970.
Monin, A. S., and A. M. Obukhov, Basic laws of turbulent mixing in the ground layer of the atmosphere (in Russian), Geophys . Ins t . Acad. Sci. USSR, 24(151), 163-187, 1954. (Enghsh trans- lation, T-R-174, AF19(604), American Meteorological Society, Boston, Mass., 1956.
Munk, W. H., Surf beats, Eos E-ans. AGU, 30(6), 849-854, 1949.
Munk, W. H. , G. R. Miller, F. E. Snodgrass, and W. F. Barber, Directional recording of swell from distant storms, Phil. Trans. Roy. Soc. London, Ser. A, 225(1062), 505-584, 1963..
Murray, S. P., Bottom currents near the coast during Hurricane Camille, J. Geo- phys. Res., 75(24), 4579-4582, 1970.
Murray, S. P., Turbulence in hurricane- generated coastal currents, Proceedings of the 12th Conference on Coastal Engi- neering, pp. 205 1-2068, American Soci- ety of Civil Engineers, New York, 1971.
Murray, S. P., Observations on wind, tidal, and density-driven currents in the vicin- ity of the Mississippi River delta, in Shelf Sediment Tkansport, edited by D. J. P. Swift, D. B. Duane, and 0. H. Pilkey, Dowden, Hutchinson, and Ross, Stroudsburg, Pa., 1973.
Rector, N. H., R. G. Fredericks, and C. J. Sonu, Capacitance tide gage, J. Water- ways Harbors and Coastal Eng. Div. Amer. Soc. Civil Eng., in press, 1973.
Roll, H. U., Physics of the Marine Atmo- sphere, Intern. Geophys. Ser., V O ~ . 7, 426 pp., Academic, New York, 1965.
Ruggles, K. W., The vertical mean wind profile over the ocean for light to mod- erate winds, J. Appl. Meteorol., 9, 389- 393,1970.
Sonu, C. J., Collective movement of ment in nearshore environments, Pro- ceedinns of the 11th Conference on Coastal Engineering pp. 37 3-399, Amer-

ican Society of Civil Engineers, New Tucker, M. J., Surf beats: Sea waves of 1 Vnrk. 1968. to 5 minutes' period, Proc. Roy. Soc. & - - . - . - .
Sonu, C. J., Field observations of near- London, Ser. A, 202, 565-573; 1950.
shore circulation and meandering cur- Van Dorn, W. G., Wind stress on an artifi-
cial pond, J. Mar. Rer , 12 , 249, 1953. J' Geophys' 77(18)' Von Arx, W. S., Absolute dynamic topog-
3232-3247,1972~. Sonu, C. J., Comment on paper by A. J.
raphy,Limnol. Oceanogr., 10,265-273, 1965.
Bowen and D' L' Inman' 'Edge wave and Waddell, E., The dynamics of swash and crescentic bars" J. Geophys' its implication to beach response, ph.D. 77(33), 6629-6631, 1972b.
Sonu, C. J. , Three-dimensional beach dissertation, 77 pp., La. State Univ., Baton Rouge, 1973.
changes' J' Geol'' 81(1)' 42-631 Webb, E. K., Profile relationships: The log- suhayda, J. N., Experimental study of the linear range and extension to strong
shoaling transformation of waves on a stability, Quart. J. Roy. Meteorol. Soc., sloping bottom, Ph.D. dissertation, 106 96 , 67-90, 1970. pp., Univ. of Calif. at Sam Diego, La Wu, J., Laboratory studies of wind-wave JoUa, 1972. interactions, J. Fluid Mech., 34, 91-122
Suhayda, J. N., and A. Hecht, Laboratory 1968. measurement of wave direction with a WU, J., Wind stress and surface roughness linear array, Ref. 70-34, Scripps Inst. of at air-sea interface, J. Geophys. Res., Oceanogr., La Jolla, Calif., NOV. 1970. 74(2) , 444-455, 1969.
\ 1
Choule J. Sonu formerly Professor and Senior In- vesti~ator at Coastal Studies Institute. Louisiana ~ t a t i University, is presently Senior Engineer at Tetra Tech, Inc.. Pasadena, California. He received his B.S. and M.S. in coastal engineering and Ph.D. in geophysical hydrodynamics (1961) at University of Tokyo and has published extensively on me- chanics of beach changes, nearshore circulations, coastal sediment, and coastal engineering.
Stephen P. Murray is Associate Professor and Sen- ior Investigator at Coastal Studies Institute, Louisi- ana State University. After receiving his Ph.D. in coastal oceanography from University of Chicago (1967). he did further research under a National Science Foundation Postdoctoral Fellowship at the Delft Technological University, the Netherlands, before assuming his present position.
S. A. Hsu is Associate Professor and Senior Invi-' fator at Coastal Studies Institute. Louisiana S - University. He received his Ph.D. in meteorol from University o f Texas in 1969. His primar). search interest is micro- and meso-meteorolog, ... corrstal and shallow-water areas including sea- breeze dynamics, air-sea interaction, eolian sand movement, and atmospheric diffision.
K S I I -
fate ' o u 1 re- v in
Joseph N. Suhayda is Assistant Professor and Sen- ior Investigator at Coastal Studies Institute, Louisi- ana State University. He has a B.S. in physics and received his Ph.D. in physical oceanography, Uni- versity of California (I 972). His research contribu- tions relate to shallow water processes and coastal sediment transport.
Evans Waddell is Visiting Researcher at Coastal El gineering Laboratory, University of Tokyo, und~ the Japanese Government Scholarships Exchanl hogram. He has a B.S. and M.S. in physical geo raphy from University o f Virdnia and a Ph.D. marine sciences fro4 ~buisiana state University P
(1 9 73). ,%%" % ' yri
(continued from p. 81 9 )
IUGG has elected the President, Foreign Secretary, and Executive Director of AGU as the Chairman, Vice Chairman, and Secretary of the USNC. As a consequence, through its offices and facilities, AGU will be rendering a considerable service to the USNC/IUGG. We anticipate that this participation will be to our mutual benefit, since the consider- able involvement of AGU in the USNCJIUGG will help us to continue to pursue our very great interests in 1UGG. At the same time, through jirect representation in the USNC/ IUGG and its subcommittees, other societies are now in a better position to pursue their interests in IUGG also, and that is as it should be.
The Berkner Memorial Fund has now acquired a working capital of $75,000. The first activity under this fund was the symposium on Irregu- larities in the Equatorial Ionosphere at the University of Texas at Dallas on May 14-17, 1973. Quite appro- priately, this first Berkner Memorial Symposium was held in conjunction with the dedication of the Lloyd V. Berkner Hall at the University of Texas at Dallas. Since the initial in- tent of the fund was to fpster inter- national aspects of geophysics, Presi- dent Abelson has asked the AGU Committee on International Partici- pation to create a small subcommit- tee to recommend to the Council of AGU a continuing program for the use of the Berkner Fund. Juan Roederer has accepted the chairman- ship of this subcommittee.
In summary, since geophysics is international in scope, AGU's inter- ests are naturally worldwide. Its members are drawn into internation- al activities in the pursuit of their own professional careers. The society is drawn into the international arena not only through its membership but also through activities of the kind described above. Although there might have been apprehension about what the separation of AGU from NAS and the new relationship of AGU to the USNC/IUGG might do to those interests, the first workings of the new arrangement seem well designed to set those apprehensions to rest.
Homer E. Newell L I Foreign Secretary
833


![The Breeze [See specific item for date] - JMU Scholarly ...](https://static.fdokumen.com/doc/165x107/6317c0771e5d335f8d0a8315/the-breeze-see-specific-item-for-date-jmu-scholarly-.jpg)