Large Scale Gene Expression Profiles of Regenerating Inner Ear Sensory Epithelia
12
Large Scale Gene Expression Profiles of Regenerating Inner Ear Sensory Epithelia R. David Hawkins 1. , Stavros Bashiardes 1. , Kara E. Powder 1 , Samin A. Sajan 1 , Veena Bhonagiri 1 , David M. Alvarado 1 , Judith Speck 2 , Mark E. Warchol 2 , Michael Lovett 1 * 1 Division of Human Genetics, Department of Genetics, Washington University School of Medicine, St. Louis, Missouri, United States of America, 2 Department of Otolaryngology, Washington University School of Medicine, St. Louis, Missouri, United States of America Loss of inner ear sensory hair cells (HC) is a leading cause of human hearing loss and balance disorders. Unlike mammals, many lower vertebrates can regenerate these cells. We used cross-species microarrays to examine this process in the avian inner ear. Specifically, changes in expression of over 1700 transcription factor (TF) genes were investigated in hair cells of auditory and vestibular organs following treatment with two different damaging agents and regeneration in vitro. Multiple components of seven distinct known signaling pathways were clearly identifiable: TGFb, PAX, NOTCH, WNT, NFKappaB, INSULIN/IGF1 and AP1. Numerous components of apoptotic and cell cycle control pathways were differentially expressed, including p27 KIP and TFs that regulate its expression. A comparison of expression trends across tissues and treatments revealed identical patterns of expression that occurred at identical times during regenerative proliferation. Network analysis of the patterns of gene expression in this large dataset also revealed the additional presence of many components (and possible network interactions) of estrogen receptor signaling, circadian rhythm genes and parts of the polycomb complex (among others). Equal numbers of differentially expressed genes were identified that have not yet been placed into any known pathway. Specific time points and tissues also exhibited interesting differences: For example, 45 zinc finger genes were specifically up-regulated at later stages of cochlear regeneration. These results are the first of their kind and should provide the starting point for more detailed investigations of the role of these many pathways in HC recovery, and for a description of their possible interactions. Citation: Hawkins RD, Bashiardes S, Powder KE, Sajan SA, Bhonagiri V, et al (2007) Large Scale Gene Expression Profiles of Regenerating Inner Ear Sensory Epithelia. PLoS ONE 2(6): e525. doi:10.1371/journal.pone.0000525 INTRODUCTION The human cochlea possesses approximately 16,000 sensory hair cells (HCs), which are necessary for normal hearing [1]. These cells are mechanoreceptors that detect sound, head movements and acceleration, and provide input into the auditory and vestibular branches of the eighth cranial nerve. Hair cells in the mammalian ear are produced during a fixed period of embryonic development, and can be lost later in life as a consequence of acoustic trauma, exposure to ototoxic drugs or inner ear infections. The mammalian vestibular organs possess a very limited ability for sensory regeneration [2,3] and the mammalian cochlea is completely unable to regenerate hair cells [4]. As a result, the loss of sensory cells from the mammalian ear can result in permanent deficits in hearing and balance. Such disorders are very common; so-called ‘sensorineural’ hearing loss afflicts about 30 million Americans [1]. Sensory epithelia (SE) in the ears of all vertebrates are populated by two basic cell types: hair cells and supporting cells. The key limitation to regeneration in the mammalian ear is the inability of mammalian supporting cells to proliferate or change phenotype in response to hair cell injury. Several attempts have been made to induce regeneration in the vestibular organs by exposure to exogenous mitogens, but these have had limited success [5] [6]. More recently, viral gene transfer techniques have been used to transfect supporting cells in the damaged cochlea with the gene encoding the Atoh1 transcription factor. This factor, formerly known as Math1, is required for normal hair cell differentiation [7] and also appears to be capable of converting the phenotype of mature supporting cells into replacement hair cells. These new sensory receptors can also re-establish synaptic connections with afferent neurons, leading to a moderate restoration of hearing in a guinea pig model of hearing loss [8] [9]. Unlike mammals, spontaneous regeneration of sensory hair cells has been extensively documented in the hearing and balance organs of non-mammalian vertebrates. The avian inner ear, in particular, has a very robust capacity for sensory regeneration. Death of hair cells quickly triggers renewed proliferation of epithelial supporting cells, and the progeny of these divisions can differentiate as replacement hair cells and supporting cells [10,11]. These observations have led to the hope that understanding the biological basis of sensory regeneration in the avian ear might provide insights into how to induce similar repair in humans. Relatively little is known about the genetic regulatory mechanisms that permit regeneration in the avian ear and this has limited the development of strategies for inducing such regeneration in mammals. Previous studies of the avian regenerative process have identified genes on an individual (and essentially ‘‘candidate gene’’) basis (e.g. DELTA1-[12]; FGFR3-[13]; PROX1-[14]). Academic Editor: Rodolfo Aramayo, Texas A&M University, United States of America Received December 19, 2006; Accepted May 23, 2007; Published June 13, 2007 Copyright: ß 2007 Hawkins et al. This is an open-access article distributed under the terms of the Creative Commons Attribution License, which permits unrestricted use, distribution, and reproduction in any medium, provided the original author and source are credited. Funding: This work was supported by a major grant from the National Organization for Hearing Research Foundation (to ML and MW) and by RO1- DC05632 (ML), R01 DC006283 and P30 DC04665 (MW) and by training grant 5T32HG000045 (supporting DMA) and training grant 5T32GM007067 (supporting KEP). Competing Interests: The authors have declared that no competing interests exist. * To whom correspondence should be addressed. E-mail: [email protected]. edu . These authors contributed equally to this work. PLoS ONE | www.plosone.org 1 June 2007 | Issue 6 | e525
-
Upload
independent -
Category
Documents
-
view
1 -
download
0
Transcript of Large Scale Gene Expression Profiles of Regenerating Inner Ear Sensory Epithelia
Large Scale Gene Expression Profiles of RegeneratingInner Ear Sensory EpitheliaR. David Hawkins1., Stavros Bashiardes1., Kara E. Powder1, Samin A. Sajan1, Veena Bhonagiri1, David M. Alvarado1, Judith Speck2, Mark E.Warchol2, Michael Lovett1*
1 Division of Human Genetics, Department of Genetics, Washington University School of Medicine, St. Louis, Missouri, United States of America,2 Department of Otolaryngology, Washington University School of Medicine, St. Louis, Missouri, United States of America
Loss of inner ear sensory hair cells (HC) is a leading cause of human hearing loss and balance disorders. Unlike mammals, manylower vertebrates can regenerate these cells. We used cross-species microarrays to examine this process in the avian inner ear.Specifically, changes in expression of over 1700 transcription factor (TF) genes were investigated in hair cells of auditory andvestibular organs following treatment with two different damaging agents and regeneration in vitro. Multiple components ofseven distinct known signaling pathways were clearly identifiable: TGFb, PAX, NOTCH, WNT, NFKappaB, INSULIN/IGF1 and AP1.Numerous components of apoptotic and cell cycle control pathways were differentially expressed, including p27KIP and TFsthat regulate its expression. A comparison of expression trends across tissues and treatments revealed identical patterns ofexpression that occurred at identical times during regenerative proliferation. Network analysis of the patterns of geneexpression in this large dataset also revealed the additional presence of many components (and possible network interactions)of estrogen receptor signaling, circadian rhythm genes and parts of the polycomb complex (among others). Equal numbers ofdifferentially expressed genes were identified that have not yet been placed into any known pathway. Specific time points andtissues also exhibited interesting differences: For example, 45 zinc finger genes were specifically up-regulated at later stages ofcochlear regeneration. These results are the first of their kind and should provide the starting point for more detailedinvestigations of the role of these many pathways in HC recovery, and for a description of their possible interactions.
Citation: Hawkins RD, Bashiardes S, Powder KE, Sajan SA, Bhonagiri V, et al (2007) Large Scale Gene Expression Profiles of Regenerating Inner EarSensory Epithelia. PLoS ONE 2(6): e525. doi:10.1371/journal.pone.0000525
INTRODUCTIONThe human cochlea possesses approximately 16,000 sensory hair
cells (HCs), which are necessary for normal hearing [1]. These
cells are mechanoreceptors that detect sound, head movements
and acceleration, and provide input into the auditory and
vestibular branches of the eighth cranial nerve. Hair cells in the
mammalian ear are produced during a fixed period of embryonic
development, and can be lost later in life as a consequence of
acoustic trauma, exposure to ototoxic drugs or inner ear infections.
The mammalian vestibular organs possess a very limited ability for
sensory regeneration [2,3] and the mammalian cochlea is
completely unable to regenerate hair cells [4]. As a result, the
loss of sensory cells from the mammalian ear can result in
permanent deficits in hearing and balance. Such disorders are very
common; so-called ‘sensorineural’ hearing loss afflicts about 30
million Americans [1].
Sensory epithelia (SE) in the ears of all vertebrates are populated
by two basic cell types: hair cells and supporting cells. The key
limitation to regeneration in the mammalian ear is the inability of
mammalian supporting cells to proliferate or change phenotype in
response to hair cell injury. Several attempts have been made to
induce regeneration in the vestibular organs by exposure to
exogenous mitogens, but these have had limited success [5] [6].
More recently, viral gene transfer techniques have been used to
transfect supporting cells in the damaged cochlea with the gene
encoding the Atoh1 transcription factor. This factor, formerly
known as Math1, is required for normal hair cell differentiation [7]
and also appears to be capable of converting the phenotype of
mature supporting cells into replacement hair cells. These new
sensory receptors can also re-establish synaptic connections with
afferent neurons, leading to a moderate restoration of hearing in
a guinea pig model of hearing loss [8] [9].
Unlike mammals, spontaneous regeneration of sensory hair cells
has been extensively documented in the hearing and balance
organs of non-mammalian vertebrates. The avian inner ear, in
particular, has a very robust capacity for sensory regeneration.
Death of hair cells quickly triggers renewed proliferation of
epithelial supporting cells, and the progeny of these divisions can
differentiate as replacement hair cells and supporting cells [10,11].
These observations have led to the hope that understanding the
biological basis of sensory regeneration in the avian ear might
provide insights into how to induce similar repair in humans.
Relatively little is known about the genetic regulatory mechanisms
that permit regeneration in the avian ear and this has limited the
development of strategies for inducing such regeneration in
mammals. Previous studies of the avian regenerative process have
identified genes on an individual (and essentially ‘‘candidate
gene’’) basis (e.g. DELTA1-[12]; FGFR3-[13]; PROX1-[14]).
Academic Editor: Rodolfo Aramayo, Texas A&M University, United States ofAmerica
Received December 19, 2006; Accepted May 23, 2007; Published June 13, 2007
Copyright: � 2007 Hawkins et al. This is an open-access article distributed underthe terms of the Creative Commons Attribution License, which permitsunrestricted use, distribution, and reproduction in any medium, provided theoriginal author and source are credited.
Funding: This work was supported by a major grant from the NationalOrganization for Hearing Research Foundation (to ML and MW) and by RO1-DC05632 (ML), R01 DC006283 and P30 DC04665 (MW) and by training grant5T32HG000045 (supporting DMA) and training grant 5T32GM007067 (supportingKEP).
Competing Interests: The authors have declared that no competing interestsexist.
* To whom correspondence should be addressed. E-mail: [email protected]
. These authors contributed equally to this work.
PLoS ONE | www.plosone.org 1 June 2007 | Issue 6 | e525
In this study we employed two genomic technologies to obtain
a more global picture of gene expression changes during avian hair
cell regeneration. Specifically, we used micro cDNA amplification
methods and custom gene microarrays [15] [16] to interrogate
nearly all identified transcription factor (TF) genes in the SE of the
chick cochlea and utricle during the early phases of regeneration.
We identified activity within known signaling pathways, several of
which have not been previously implicated or explored in SE
regeneration, and we identified many as-yet unexplored genes that
were differentially expressed. We were able to identify treatment,
tissue and time point-specific changes in TF expression. Notably,
a basal set of TFs was present in both sensory tissues at all stages.
We also identified commonalities and tissue-specific differences
between the sensory epithelia of the utricle and cochlea that
resulted from different damage regimes. This is the first study of its
kind to characterize large-scale gene expression profiles during
sensory regeneration. These results now provide the starting point
for a detailed investigation of the role of these genes in HC
recovery, and for a description of their possible interactions.
RESULTS
Study designWe profiled changes in transcription factor expression in SE of the
cochlea and utricle following two distinct forms of in vitro injury: (1)
laser ‘wounding’ of cultured SE or; (2) ototoxic hair cell death
caused by treatment with the aminoglycoside antibiotic neomycin.
In the first case, cultured SE [17] received linear ‘wounds’ with
a pulsed laser microbeam. Creation of the lesion typically required
3–5 min/culture; during this time, control cultures were removed
from the incubator and kept under identical conditions, but did
not receive lesions. Wounded epithelia were allowed to recover for
30 min, 1 hr, 2 hrs or 3 hrs after the lesions. Equal numbers of
lesioned and unlesioned specimens were analyzed at each recovery
time point. For the second injury regimen, utricles or cochleae
were cultured for 24 hr in medium that contained 1 mM
neomycin [18]. A sample of SE was collected immediately after
this treatment; this constituted the 0 hr time point for the
regenerative time course. Other cultures were rinsed and
maintained in neomycin-free medium for an additional 24 or
48 hr. Equal numbers of specimens were cultured under identical
conditions, but did not receive neomycin; these served as time-
matched controls for comparative gene expression profiling.
Hybridizations were conducted on multiple biological samples
(see below). The sampling times for neomycin-lesioned specimens
were chosen based upon previous studies of hair cell death and
supporting cell proliferation, which indicate that S-phase entry by
supporting cells peaks at about 48 hrs after ototoxic injury in vitro
[19]. On the other hand, the laser time points were expected to
provide us with insights into the very early signaling events that
occur after epithelial injury. Our expectation in employing these
two damage regimes was that we might find some degree of
overlap between the two time courses, but that we might also be
able to discern treatment-specific, as well as cochlea- and utricle-
specific, changes in gene expression.
After appropriate survival times, RNA was prepared and
converted into microarray targets by previously described methods
[15]. TF gene expression was then assayed by comparative
hybridization (injured specimens vs. time-matched controls) to
custom transcription factor gene microarrays [16]. These micro-
arrays contained 50 mer oligonucleotide probes, spotted in
duplicate, that interrogate the vast majority of human transcrip-
tion factor genes (plus a few probes to non-TFs such as sonic
hedgehog [SHH]). We used this array as a cross-species profiling
tool to measure the expression of the orthologous chicken TF
genes. We, and others, have previously demonstrated that cross-
species hybridizations can be reliably used on this type of array
platform [15] [20]. The study described here was embarked upon
before the recent publication of the draft chicken genomic DNA
sequence [21] or the availability of commercial chicken gene chips.
With the release of most of the chicken genomic DNA sequence it
is possible to assess sequence identity between our human probes
and their chicken orthologs. An analysis of this type indicates that
,98% of our probes have .70% sequence identity with the
correct chicken ortholog (data not shown). Hybridization strin-
gencies were adjusted to accommodate this degree of identity for
all of the comparative data described in this study. Each time
course was replicated with additional biological samples, including
controls. Every treatment time point and time-matched control
was hybridized to a minimum of four microarrays; two replicates
plus two dye switch experiments. All of our data, array designs and
analysis parameters are available through the NCBI Gene
Expression Omnibus (GEO; http://www.ncbi.nlm.nih.gov/geo/).
Array analysisIn order to quantify gene expression changes, along with
associated statistical confidence limits, all expression data were
analyzed as described below (see Materials and Methods). Briefly,
array data were first normalized by LOWESS, a locally weighted
linear regression model, to compensate for dye effects. Second,
data from the multiple hybridizations for a given time point were
hierarchically clustered, along with data from additional time
points, to assess the similarity and reproducibility of the data across
multiple biological samples and dye switches. T-tests (calculated by
conducting a one sample t-test on the adjusted intensity data of the
entire array of selected hybridizations at each time point) were
performed between samples to assess reproducibility and similar-
ity. The data were also filtered to remove oligonucleotide probes
that fell below a threshold for background intensity. This threshold
was determined by the intensity of controls spots. During the
creation of self-organizing maps (see below), not all genes passed
the filtering steps in both time courses. In these cases we extracted
the missing values from the primary data and ‘‘filled in’’ the values
to construct the patterns of gene expression across all seven time
points. In general the vast majority of TFs showed relatively
modest gene expression fold changes. This may be due to
a compression of the dynamic range in cross-species hybridizations
[15]. Our prior experience in employing this array platform for
cross-species hybridizations indicated that changes as low as 1.2-
fold frequently reflected higher changes when assessed by q-PCR
([15]and see q-PCR below).
Differential gene expression in the four time coursesIn the antibiotic damage regime the 24 and 48 hr time points
reflected gene expression changes within supporting cells, as the
majority of hair cells had been killed by the ototoxic antibiotic
[18,22]. By 48 hrs many of the supporting cells had progressed
into the S-phase of the cell cycle [19]. By contrast, the laser
damage regime resulted in a 100–200 mm-wide ‘wound’ in the
cultured sensory epithelia. The wounds typically closed within 16–
24 hrs of recovery time. The initial phase of wound repair was due
to cell migration, but elevated levels of cell proliferation were also
observed at the wound sites (but not at distant, uninjured regions)
at 16–48 hrs after injury. For the utricle, after the data analysis
steps described above, 143 TFs had passed through the data filters
for differential gene expression (.1.2-fold change at one or more
time point and a p-value of ,0.05) over the three neomycin
Inner Ear Hair Cells
PLoS ONE | www.plosone.org 2 June 2007 | Issue 6 | e525

damage time points (Supplemental Tables S1 and S2). Gene
expression in laser damaged SE was compared to time-matched
controls at 30 min, 1 hr, 2 hrs, and 3 hrs after laser lesions. For
the utricle, a total of 66 TFs were differentially expressed across
the four laser time points (Supplemental Tables S3 and S4).
Analysis of the cochlear treatments revealed a much larger
number of significant changes in TF gene expression than were
found for the utricle. A total of 484 genes were differentially
expressed (.1.2-fold change and p-value of ,0.05) across the
cochlear neomycin time course (Supplemental Tables S5 and S6).
Analysis of the cochlear laser comparisons revealed a total of 217
differentially expressed genes (listed in Supplemental Tables S7 and
S8). Overall, when overlaps between the various lists of genes were
taken into account, a total of 605 TFs accounted for all of the
statistically significant changes in gene expression observed across
the two cochlear time courses, and a total of 188 TF genes were
differentially expressed across the two utricle time courses. It is
possible that these apparent differences in numbers of differentially
expressed genes between the two epithelia, reflect more synchroni-
zation of regenerative signaling events in the cochlea when
compared to undamaged controls. It is notable that the undamaged
avian utricle is in a continual low-level state of hair cell turn-over
[23]. This process may result in asynchronies in gene expression
between injured and uninjured utricles. This might lower apparent
fold-changes or increase variability (leading to higher p-values) when
the damaged utricles are compared to the undamaged (but
constantly regenerating) utricles. It is also possible that the larger
number of expression changes in the cochlea reflects a more robust
regenerative program in this particular sensory epithelia.
Validation of expression changesTo independently verify apparent differences in gene expression
we selected 11 genes that showed modest fold-changes for at least
one time point within at least one of the four regenerative time
courses. The orthologous chicken genes were identified by BLAST
searches and PCR primers were designed for use in qPCR assays
on new biological samples. In most cases these assays were
conducted upon tissues from single time points. However, for three
genes (CTNNB1, KIAA0173 and TRIP15) the genes were tested
across one entire time course (the utricle neomycin time course). A
total of 19 time point/tissue/treatment combinations were tested
overall. The results of these multiple qPCR assays are shown in
Table 1 and compared to the apparent fold-changes observed
from the array analysis. As observed in our previous study with this
type of cross-species array platform [15], these data confirmed the
trends seen in the microarray data and indicated that the
microarray, in general, under-reported the actual levels of changes
that occurred across the four time courses. The only example
showing .15% deviation from this under reporting was the level
of CTNNB1 mRNA in the utricle at 48 hrs after neomycin
damage. In this case, the q-PCR assay reported an increase of 2.3
fold relative to undamaged utricle, whereas the array reported
a 3.1-fold increase.
Comparing and contrasting differential gene
expression across tissues and treatmentsDespite the large differences in the sheer volume of changes in the
two regenerating epithelia, there were interesting underlying
overlaps between the various transcriptional programs. These are
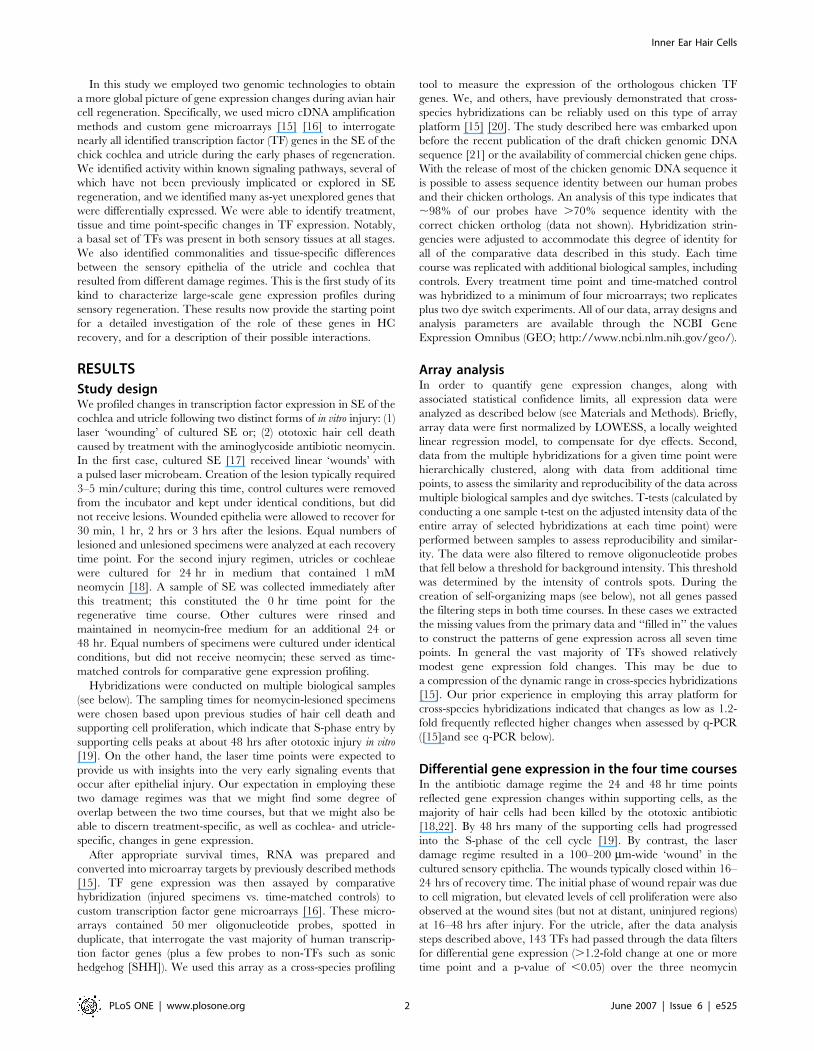
shown in summary form as the Venn diagrams in Figure 1. For
example, a comparison of all changes in gene expression between
both neomycin time courses (utricle and cochlea) revealed 80
shared genes, of which 21 showed identical trends in at least one
identical time point. These time point commonalities are shown in
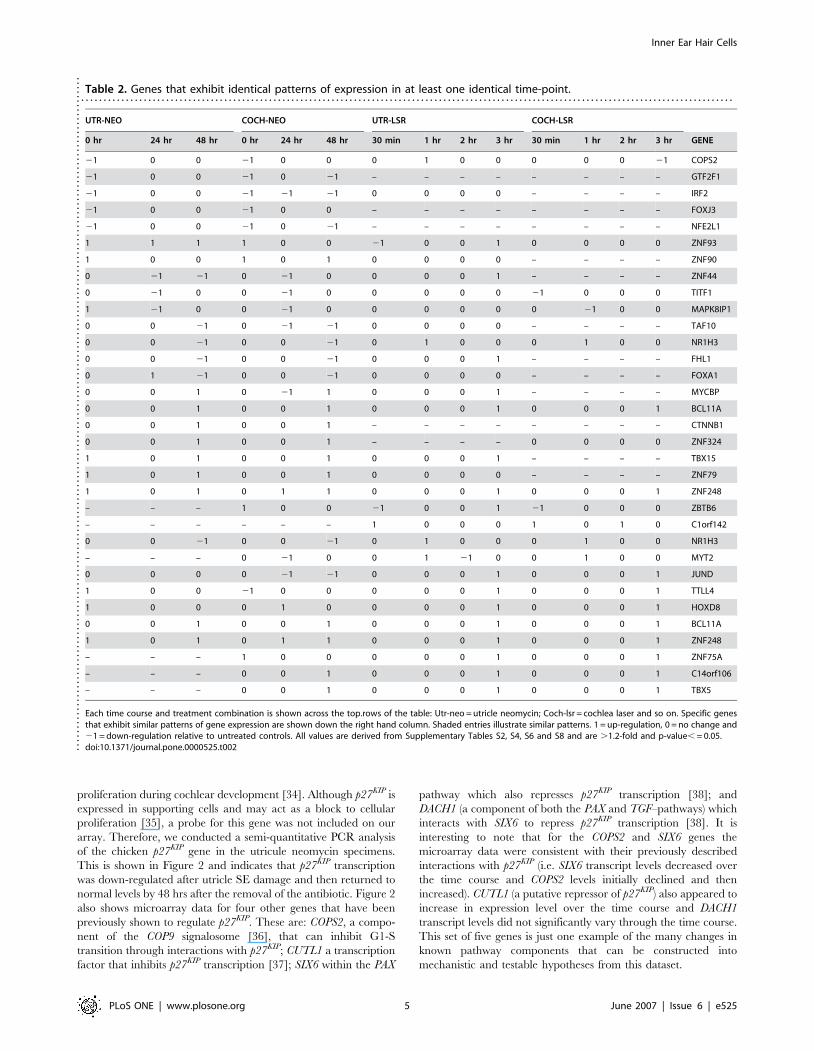
Table 2 and in a more expanded form in Supplementary Table
Table 1. QPCR validation of microarray fold-changes.. . . . . . . . . . . . . . . . . . . . . . . . . . . . . . . . . . . . . . . . . . . . . . . . . . . . . . . . . . . . . . . . . . . . . . . . . . . . . . . . . . . . . . . . . . . . . . . . . . . . . . . . . . . . . . . . . . . . . . . . . . . . . . . . . . . . . . . . . . . . . . . . . .
Tissue Treatment Timepoint Gene Name Array Fold Change QPCR Fold Change
Utricle NEOMYCIN 0 HRS CEBPG 21.55 22.78
Utricle NEOMYCIN 0 HRS CTNNB1 21.27 21.43
Utricle NEOMYCIN 24 HRS CTNNB1 21.12 21.25
Utricle NEOMYCIN 48 HRS CTNNB1 3.09 2.27
Utricle NEOMYCIN 0 HRS KIAA0173 1.36 1.69
Utricle NEOMYCIN 24 HRS KIAA0173 1.07 1.02
Utricle NEOMYCIN 48 HRS KIAA0173 1.29 1.60
Utricle NEOMYCIN 0 HRS TRIP15 21.25 21.60
Utricle NEOMYCIN 24 HRS TRIP15 1.02 1.20
Utricle NEOMYCIN 48 HRS TRIP15 1.41 1.30
Utricle NEOMYCIN 48 HRS BCL11A 1.33 2.22
Utricle NEOMYCIN 48 HRS CUTL1 1.38 1.30
Cochlea NEOMYCIN 0 HRS TRIP15 21.47 21.25
Cochlea NEOMYCIN 48 HRS JUND 21.36 21.66
Cochlea LASER 30 MINS FOS 1.50 12.50
Cochlea LASER 1 HRS NFIL3 1.32 1.8
Cochlea LASER 1 HRS IRLB 1.29 2.5
Cochlea LASER 2 HRS GATA3 21.29 21.42
Cochlea LASER 3 HRS JUND 1.31 2.4
Triplicate qPCR assays were carried out on new biological samples, using PCR primers designed to the orthologous chicken gene sequences. These are compared to theapparent fold-changes observed from the array analysis.doi:10.1371/journal.pone.0000525.t001....
....
....
....
....
....
....
....
....
....
....
....
....
....
....
....
....
....
....
....
....
....
....
Inner Ear Hair Cells
PLoS ONE | www.plosone.org 3 June 2007 | Issue 6 | e525
S9. The largest area of overlap between the cochlea and utricle
was at 48 hrs where 11 genes showed identical patterns of gene
expression (Table 2). Four of these were down-regulated and seven
were up-regulated versus the time-matched controls, but literature
searches and pathway analysis did not reveal any known unifying
functional network that ties these together. Among this group
were; CTNNB1 (a component of canonical WNT signaling [24])
NR1H3 (a.k.a. LXRalpha), an orphan nuclear receptor that is
known to play a role in insulin regulation of cholesterol
homeostasis in hepatocytes [25,26] and; BCL11A (a zinc finger
gene associated with various hematopoietic malignancies [27,28]).
Antibiotic damage in the avian utricle results in a program of cell
division that peaks at 48 hrs after ototoxic injury [29] and returns
to normal levels at 4 days post injury. A recent study [30] also
indicates that markers of hair cell differentiation are expressed in
the SE at .80 hrs after ototoxic injury. Therefore, the pattern of
expression of these 11 genes may mark a period at which the
proliferative program is declining and the differentiation program
is initiating within the regenerating SE.
A similar set of comparisons were conducted on all the
differentially expressed TFs in the laser time courses (Figure 1
and Table 2). These shared 27 differentially expressed genes, of
which 12 showed the same trends for at least one parallel time
point (Table 1). These changes might either reflect laser-specific
responses or be early-acting effects in the common pathway of hair
cell regeneration. It is interesting to note that the 3 hr laser time
points shared two up-regulated genes in common with the 48 hr
neomycin time points (BCL11A and another zinc finger gene,
ZNF248). The last laser time points also showed up-regulation of
five additional genes [JUND, TTLL4 (a.k.a. KIAA0173) HOXD8
and ZNF75A].
A comparison of trends within a given SE (irrespective of the
method of injury) revealed 5 genes (CEBPG, HSF1, LOC51131,
PSMC5 and SSX4) that appear to reflect regenerative responses
specific to the utricle (i.e. they were not differentially expressed in the
regenerating cochlea SE). A similar comparison of trends in the
cochlea identified 90 genes that occurred in both laser and neomycin
lists of differentially expressed genes (Figure 1). In this case, 61 of
these gene expression changes appeared to be specific to the
regenerating cochlea (cf Supplementary Tables S2, S4, S6 and S8).
Among these were two forkhead genes (FOXC1 and FOXH1) three
homeobox genes (HOXA4, HOXC10 and HOXD1) five zinc finger
transcription factor genes (ZFHX1b, ZFP106, ZNF123, ZNF175 and
ZNF258) and three genes from the circadian rhythm pathway (PER1,
PER2 and TIMELESS). Several of these will be discussed in more
detail below. None of these genes has been previously investigated in
the regenerating or developing inner ear.
Notably, we also identified a core group of six genes [BCL11A,
HOXD8, TTLL4, ZNF248 (a.k.a. LOC57209), NR1H3, and COPS2
(a.k.a. TRIP15)] that change their expression levels across all four
treatments and tissue combinations. It should be noted that
although these genes vary across all of the time courses, they do
not necessarily follow exactly parallel patterns of gene expression
across time courses. Thus, COPS2 was initially down regulated in
both neomycin time courses, was up-regulated at 1 hr after laser
treatment in the utricle, but was down-regulated at 3 hrs after
laser treatment in the cochlea. By contrast, some genes such as
BCL11A, appeared quite consistent between the four combina-
tions; BCL11A expression peaked at 3hrs in both laser time courses
and peaked at 48 hrs in both neomycin time courses.
Beyond these various overlaps between treatments and time
courses, the largest group of gene expression changes in each of
the four treatment/time point combinations were specific to just
one SE and one treatment. For example, changes in the expression
of 323 TF genes were specific to cochlea SE that was recovering
from antibiotic damage (Figure 1). Many of these changes (for
example the large group of zinc finger genes mentioned below)
peaked at the 48 hour time point of cochlear SE regeneration.
Identification of known pathways and processes
among the differentially expressed genes.The comparative data listed in Supplementary Tables S1, S2, S3,
S4, S5, S6, S7, S8, S9, S10, S11, S12, S13, S14, S15, S16, S17 and
S18 were manually curated via interrogation of Gene Ontology
databases as well as Medline literature citations. This served to
identify multiple components or ‘‘signatures’’ of seven distinct
signaling pathways within all four regenerative time courses. The
identified pathways were those previously shown to be mediated
by; TGFb, PAX, NOTCH, WNT, NFKappaB, Insulin/IGF1, and AP1
signaling. All of these have been implicated, in one way or
another, in the normal development of the vertebrate inner ear.
These signatures (along with their time course(s) and associated
references to each component) are listed in Supplementary Tables
S10, S11, S12, S13, S14, S15, S16. Again, as with the common
genes described above, even within one identified pathway, the
profiles of changes in each time course were frequently quite
different. Nevertheless, some commonalities could be discerned;
for example, the homeobox gene TITF1/NKX2.1 (a component of
both the TGFb and PAX pathways) which interacts with both
SMAD3 and PAX8 [31–33] showed a similar profile in both
neomycin time courses.
Not surprisingly, an additional grouping of genes fell within a set
that we termed cell cycle/apoptosis genes (listed as Supplementary
Table S17). Of interest among this set of genes were three that
have been implicated in the regulation of p27KIP, a cyclin
dependent kinase inhibitor that is a key regulator of cell
Figure 1. Overlaps between differentially expressed genes in the fourtreatment/time course combinations. These Venn diagrams illustratethe overlaps between genes that were scored as being either up ordown regulated. To be included as an overlap a gene must bedifferentially expressed in at least one time point in both time courses(.1.2-fold and p-value, = 0.05), but the time points or trends do nothave to necessarily match. For a detailed listing of all of the genes in theoverlaps see Supplementary Tables S2, S4, S6 and S8).doi:10.1371/journal.pone.0000525.g001
Inner Ear Hair Cells
PLoS ONE | www.plosone.org 4 June 2007 | Issue 6 | e525
proliferation during cochlear development [34]. Although p27KIP is
expressed in supporting cells and may act as a block to cellular
proliferation [35], a probe for this gene was not included on our
array. Therefore, we conducted a semi-quantitative PCR analysis
of the chicken p27KIP gene in the utricule neomycin specimens.
This is shown in Figure 2 and indicates that p27KIP transcription
was down-regulated after utricle SE damage and then returned to
normal levels by 48 hrs after the removal of the antibiotic. Figure 2
also shows microarray data for four other genes that have been
previously shown to regulate p27KIP. These are: COPS2, a compo-
nent of the COP9 signalosome [36], that can inhibit G1-S
transition through interactions with p27KIP; CUTL1 a transcription
factor that inhibits p27KIP transcription [37]; SIX6 within the PAX
pathway which also represses p27KIP transcription [38]; and
DACH1 (a component of both the PAX and TGF–pathways) which
interacts with SIX6 to repress p27KIP transcription [38]. It is
interesting to note that for the COPS2 and SIX6 genes the
microarray data were consistent with their previously described
interactions with p27KIP (i.e. SIX6 transcript levels decreased over
the time course and COPS2 levels initially declined and then
increased). CUTL1 (a putative repressor of p27KIP) also appeared to
increase in expression level over the time course and DACH1
transcript levels did not significantly vary through the time course.
This set of five genes is just one example of the many changes in
known pathway components that can be constructed into
mechanistic and testable hypotheses from this dataset.
Table 2. Genes that exhibit identical patterns of expression in at least one identical time-point.. . . . . . . . . . . . . . . . . . . . . . . . . . . . . . . . . . . . . . . . . . . . . . . . . . . . . . . . . . . . . . . . . . . . . . . . . . . . . . . . . . . . . . . . . . . . . . . . . . . . . . . . . . . . . . . . . . . . . . . . . . . . . . . . . . . . . . . . . . . . . . . . . .
UTR-NEO COCH-NEO UTR-LSR COCH-LSR
0 hr 24 hr 48 hr 0 hr 24 hr 48 hr 30 min 1 hr 2 hr 3 hr 30 min 1 hr 2 hr 3 hr GENE
21 0 0 21 0 0 0 1 0 0 0 0 0 21 COPS2
21 0 0 21 0 21 – – – – – – – – GTF2F1
21 0 0 21 21 21 0 0 0 0 – – – – IRF2
21 0 0 21 0 0 – – – – – – – – FOXJ3
21 0 0 21 0 21 – – – – – – – – NFE2L1
1 1 1 1 0 0 21 0 0 1 0 0 0 0 ZNF93
1 0 0 1 0 1 0 0 0 0 – – – – ZNF90
0 21 21 0 21 0 0 0 0 1 – – – – ZNF44
0 21 0 0 21 0 0 0 0 0 21 0 0 0 TITF1
1 21 0 0 21 0 0 0 0 0 0 21 0 0 MAPK8IP1
0 0 21 0 21 21 0 0 0 0 – – – – TAF10
0 0 21 0 0 21 0 1 0 0 0 1 0 0 NR1H3
0 0 21 0 0 21 0 0 0 1 – – – – FHL1
0 1 21 0 0 21 0 0 0 0 – – – – FOXA1
0 0 1 0 21 1 0 0 0 1 – – – – MYCBP
0 0 1 0 0 1 0 0 0 1 0 0 0 1 BCL11A
0 0 1 0 0 1 – – – – – – – – CTNNB1
0 0 1 0 0 1 – – – – 0 0 0 0 ZNF324
1 0 1 0 0 1 0 0 0 1 – – – – TBX15
1 0 1 0 0 1 0 0 0 0 – – – – ZNF79
1 0 1 0 1 1 0 0 0 1 0 0 0 1 ZNF248
– – – 1 0 0 21 0 0 1 21 0 0 0 ZBTB6
– – – – – – 1 0 0 0 1 0 1 0 C1orf142
0 0 21 0 0 21 0 1 0 0 0 1 0 0 NR1H3
– – – 0 21 0 0 1 21 0 0 1 0 0 MYT2
0 0 0 0 21 21 0 0 0 1 0 0 0 1 JUND
1 0 0 21 0 0 0 0 0 1 0 0 0 1 TTLL4
1 0 0 0 1 0 0 0 0 1 0 0 0 1 HOXD8
0 0 1 0 0 1 0 0 0 1 0 0 0 1 BCL11A
1 0 1 0 1 1 0 0 0 1 0 0 0 1 ZNF248
– – – 1 0 0 0 0 0 1 0 0 0 1 ZNF75A
– – – 0 0 1 0 0 0 1 0 0 0 1 C14orf106
– – – 0 0 1 0 0 0 1 0 0 0 1 TBX5
Each time course and treatment combination is shown across the top.rows of the table: Utr-neo = utricle neomycin; Coch-lsr = cochlea laser and so on. Specific genesthat exhibit similar patterns of gene expression are shown down the right hand column. Shaded entries illustrate similar patterns. 1 = up-regulation, 0 = no change and21 = down-regulation relative to untreated controls. All values are derived from Supplementary Tables S2, S4, S6 and S8 and are .1.2-fold and p-value, = 0.05.doi:10.1371/journal.pone.0000525.t002..
....
....
....
....
....
....
....
....
....
....
....
....
....
....
....
....
....
....
....
....
....
....
....
....
....
....
....
....
....
....
....
....
....
....
....
....
....
.
Inner Ear Hair Cells
PLoS ONE | www.plosone.org 5 June 2007 | Issue 6 | e525

Clustering with self organizing mapsAs described above, literature/database searches plus manual
curation of the data assisted us in placing a total of 70 known TFs
into possible interactive pathways. However, the vast majority of
the TFs in our set have no known function or correlations with
known pathways. In order to potentially identify these relation-
ships and to better discern possible patterns of co-expression
within these data, we derived self-organizing maps (SOMs) by
combining all differentially expressed genes across both time
courses for each tissue type. This form of unsupervised clustering
([39,40]) produces clusters of genes (with upper and lower limit
bars) that show similar patterns of expression across a time course
or set of treatments. In this case the situation is somewhat artificial,
since in building these graphs we made the arbitrary choice that
the 3 hr laser time point would precede the neomycin zero time
point changes on the X-axis, whereas in reality the laser time
course probably overlaps the early stages (0 hr to 24 hr) of
neomycin recovery. Nevertheless, the purpose of these clusters was
to visualize apparent patterns and potential clusters of genes within
the data. Figure 3A shows a group of 16 SOM centroids (clusters
of genes that show similar patterns of differential expression across
all the time points) constructed using Genecluster 2 [39,40] for the
utricle time courses. Figure 3B shows sixteen centroids for the
cochlea data. The actual names of every gene in each cluster are
listed in Supplementary Tables S18 and S19. Some clusters
exhibited relatively large temporal fluctuations in gene expression
across both time courses. One example of this is centroid 3 in
Figure 3A which includes a total of 14 genes such as CEBPG,
JUND, FOXP1, and HOXA13. By contrast, centroids 8 and 12 in
Figure 3A illustrate genes that show relatively small changes in
expression, except at the 48 hour neomycin time point where they
were all up regulated. These were the predominantly late genes in
the utricle regenerative time course. These two centroids together
comprised 19 genes and included POU4F3 (previously implicated
in hearing loss [41]), CTNNB1 and PPARGC1 (both in the WNT
pathway). At the other end of the spectrum were the 11 genes in
centroids 0 and 4 of Figure 3A that appeared to be activated early
and peak in expression at the first or second laser time point.
Among these are the nuclear hormone receptor NR1I3, which
plays a role in transcriptional activation of genes involved in drug
metabolism [42,43] SIX3, a homeobox gene that regulates PAX6
and SOX2 in the developing eye [44] and LOC51637, a TF of
Figure 2. Gene expression changes in p27Kip and four genes that mayregulate its expression. This diagram shows a combination of semi-quantitative PCR data (for p27Kip) and microarray data for the other fourgenes conducted on the utricle neomycin time courses. Each geneexpression profile is color coded with the key to the right of each figure.The X-axis lists time points and the Y-axis is the log2 fold-change ateach time point. Expression values are derived from SupplementaryTable S2, except for DACH1 which is detectably expressed, but is notsignificantly differentially expressed across the time course.doi:10.1371/journal.pone.0000525.g002
Figure 3. Analysis of the datasets by Self Organizing Maps. All of thedifferentially expressed genes listed in Supplementary Tables S2, S4, S6and S8 were uploaded into Genecluster 2 and 16 centroids per organwere generated. Each box (centroid) in this figure is numbered fromC0–C15 and they reflect common patterns of expression for clusteredgroups of genes within the dataset. The X-axis for each centroidconsists of each time point and runs from the laser 30 min time pointthrough 1 hr, 2 hrs, 3 hrs and then into the neomycin 0 time pointfollowed by the neomycin 24 and 48 hr time points. The Y-axis indicatesexpression level (fold-change). The number in the top left of eachcentroid indicates the number of genes that fall into this cluster of co-expression. The top line indicates the upper boundary of expression forall of these genes and the lower line indicates the lower boundary. Themiddle line is the mean. All of the specific genes that fall into eachcentroid are listed in Supplementary Tables S18 and S19. Figure 3Ashows the clustering for the utricle time points and Figure 3B shows theclustering for cochlea time points. Arrows indicate various patterns orgenes within specific centroids that are described in the text.doi:10.1371/journal.pone.0000525.g003
Inner Ear Hair Cells
PLoS ONE | www.plosone.org 6 June 2007 | Issue 6 | e525
unknown function, that we previously found to be up-regulated in
the chicken utricle [15] relative to the cochlea.
The cochlea regenerative SOMs (16 in total) are shown in
Figure 3B. In this case the predominantly late genes fall into
centroids 11 and 14 and total 118 genes. However, additional
examples of gradual up-regulation occur in centroids 10 and 15
(55 additional genes). Interestingly, of the 118 genes in centroids
11 and 14, a total of 45 are zinc finger transcription factors (as
defined by being either ZF or ZNF family members listed in
Supplementary Table S19). The vast majority of these are of
unknown function and unknown target specificity. If the genes in
centroids 10 and 15 are included, the total number of zinc finger
TFs peaking in expression at the 48Hr time point rises to 61 (35%
of the 173 total genes in these centroids). By contrast, the other
twelve centroids in Figure 3B all together contain 19 zinc finger
transcription factors (4% of a total of 432 genes in these centroids).
Therefore, it appears that a dramatic burst of zinc finger gene
expression occurs specifically at these late stages of regenerartive
proliferation in the cochlear SE. This contrasts with the utricle
SOMs where zinc finger TFs are distributed fairly evenly through
the centroids. In common with the utricle time courses, CTNNB1
peaks at 48 hrs in the cochlear time courses but, unlike in the
utricle, POU4F3 peaks earlier, at the 24Hr time point (in centroid
4 of Figure 3B). The predominately early genes (19 in total) in
Figure 3B are contained within centroid 3. Of interest within this
group are EGR1, which can be induced by IGF signaling [45],
NFIL3 which is a nuclear factor regulated by IL3 [46,47] and
Neurogenin 1, which is involved in fate choice during inner ear
development [47].
Contrasting patterns of TF genes that are detectably
expressedIn addition to using the normalized intensity values to identify
differentially expressed genes, we also used intensity values to
determine which TFs were detectably expressed at any given time
point, irrespective of any fold-change. This is a useful dataset since,
at the level of detection of our microarrays, it defines lists of TFs
that specify the normal functioning of the SE and makes no
distinction between genes that never vary and those that change in
their expression levels. This involved scoring all genes as ‘‘on’’ that
reproducibly exceeded a background intensity level (and likewise
any gene that failed to meet this cutoff was arbitrarily scored as
‘‘off’’). This cut-off was based upon control oligonucleotides that
were imbedded within our arrays and have no known homologous
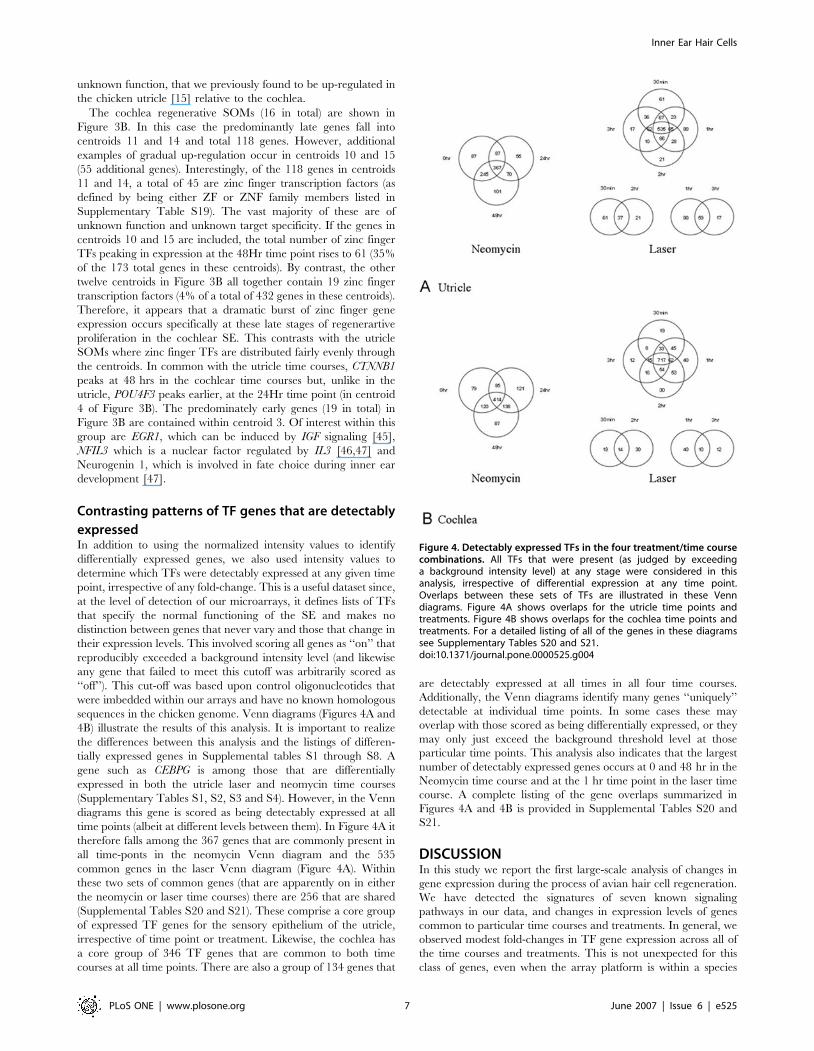
sequences in the chicken genome. Venn diagrams (Figures 4A and
4B) illustrate the results of this analysis. It is important to realize
the differences between this analysis and the listings of differen-
tially expressed genes in Supplemental tables S1 through S8. A
gene such as CEBPG is among those that are differentially
expressed in both the utricle laser and neomycin time courses
(Supplementary Tables S1, S2, S3 and S4). However, in the Venn
diagrams this gene is scored as being detectably expressed at all
time points (albeit at different levels between them). In Figure 4A it
therefore falls among the 367 genes that are commonly present in
all time-ponts in the neomycin Venn diagram and the 535
common genes in the laser Venn diagram (Figure 4A). Within
these two sets of common genes (that are apparently on in either
the neomycin or laser time courses) there are 256 that are shared
(Supplemental Tables S20 and S21). These comprise a core group
of expressed TF genes for the sensory epithelium of the utricle,
irrespective of time point or treatment. Likewise, the cochlea has
a core group of 346 TF genes that are common to both time
courses at all time points. There are also a group of 134 genes that
are detectably expressed at all times in all four time courses.
Additionally, the Venn diagrams identify many genes ‘‘uniquely’’
detectable at individual time points. In some cases these may
overlap with those scored as being differentially expressed, or they
may only just exceed the background threshold level at those
particular time points. This analysis also indicates that the largest
number of detectably expressed genes occurs at 0 and 48 hr in the
Neomycin time course and at the 1 hr time point in the laser time
course. A complete listing of the gene overlaps summarized in
Figures 4A and 4B is provided in Supplemental Tables S20 and
S21.
DISCUSSIONIn this study we report the first large-scale analysis of changes in
gene expression during the process of avian hair cell regeneration.
We have detected the signatures of seven known signaling
pathways in our data, and changes in expression levels of genes
common to particular time courses and treatments. In general, we
observed modest fold-changes in TF gene expression across all of
the time courses and treatments. This is not unexpected for this
class of genes, even when the array platform is within a species
Figure 4. Detectably expressed TFs in the four treatment/time coursecombinations. All TFs that were present (as judged by exceedinga background intensity level) at any stage were considered in thisanalysis, irrespective of differential expression at any time point.Overlaps between these sets of TFs are illustrated in these Venndiagrams. Figure 4A shows overlaps for the utricle time points andtreatments. Figure 4B shows overlaps for the cochlea time points andtreatments. For a detailed listing of all of the genes in these diagramssee Supplementary Tables S20 and S21.doi:10.1371/journal.pone.0000525.g004
Inner Ear Hair Cells
PLoS ONE | www.plosone.org 7 June 2007 | Issue 6 | e525
(rather than the type of cross-species platform used in this study).
For example, in a recent study of gene expression changes of
,25,000 genes in mouse organogenesis (from embryonic day 8.0
to postnatal day 1 [48]), a total of 160 TF genes changed by .1.2-
fold in their expression level. In that particular study, the average
TF change was 1.63-fold and the range was from a 3.66-fold
down-regulation to a 3.63-fold up-regulation. This is remarkably
similar to our observations in the current report and it presumably
reflects the fact that small changes in these potent transcriptional
regulators can have large downstream effects. One should also
consider that some TFs are constitutively expressed and their
activation is mediated by other events, such as phosphorylation
(reviewed in [49]). In that regard, it is interesting to note that in
our experiments we also detected changes in the expression levels
of many of these genes whose protein products are regulated by
phosphorylation events. For example, JUND, CEBPG and CEBPB
are known to be activated by phosphorylation [49,50] and yet we
observed clear and reproducible changes in transcript levels for
many of these types of TF genes.
Most of the changes we observed have not yet been linked into
known networks or pathways. These genes should provide a rich
future source of clues into the genetic programming of avian hair
cell regeneration and SE development in general. Our descriptions
of pathways and trends presented here is just the beginning of
a systems biology approach to this important process. Within our
data set there are numerous examples of individual, differentially
expressed genes that have not previously been implicated in inner
ear development or differentiation. For example, the FOXP1 gene
has previously been implicated in cardiac development [51] but
from our data appears to be rapidly up-regulated early in the
utricle laser time courses (see Supplementary Tables S3 and S4).
We have recently confirmed that this gene is also differentially
expressed during embryonic development of the mouse vestibular
organs that give rise to these SE (Sajan, Warchol and Lovett in
preparation).
There are also changes in particular classes of genes that may
reflect underlying important pathways. One such example is the
change in expression of the Polycomb complex genes EZH1,
EZH2 (enhancer of zeste 1 and 2) CBX1, CBX3, CBX4, CBX6, and
CBX8 (chromobox genes) that occur in the regenerative time
courses in both the cochlea and utricle SE (Supplementary Tables
S1, S2, S3, S4, S5, S6, S7 and S8). These genes are especially
noteworthy because of their roles in controlling cell fate decisions
[52] and in preventing stem cell exhaustion [53] via epigenetic
mechanisms [54–56].
A more global method for interrogating the data presented in
this report is to make use of web-delivered tools to discover
possible networks or canonical pathways. Ingenuity Pathways
Analysis (IPA; IngenuityH Systems, www.ingenuity.com) is one
such set of tools. We uploaded the specific sets of shared genes
(fold-changes and p-values) listed in Supplementary Tables S1, S2,
S3, S4, S5, S6, S7 and S8 into the IPA application. These genes
were then used to generate biological networks developed form
information contained in the Ingenuity Pathways Knowledge Base
(IPKB). All connections within the IPKB are supported by at least
one reference from the literature (see www.ingenuity.com). IPA
also computed a p-value for each generated network derived from
a right-tailed Fisher’s exact test, which indicates the probability
that the focus genes in a network are found together because of
chance alone. A complete description of all of these networks is
beyond the scope of the current study. However, it is interesting to
note that one of the highest scoring networks (p-value of
2.461026) shared between both the cochlea and utricle regener-
ating SE, involves multiple components of estrogen receptor (ER)
signaling. Figure 5A shows an IPA network of these various ER
components (analyzed separately from other differentially expressed
genes). Previous studies have commented on the presence of estrogen
receptor in the developing mammalian inner ear [57], but it is not
clear what endogenous ligand(s) might activate this pathway or
whether this acts via the ligand-independent route [58]. It is known
that ligand–independent activation of ER can be achieved by ER
phosphorylation mediated by various signaling pathways[59].
An additional example of IPA network building involves the
significant enrichment (p-value of 561027) in the cochlear
regenerating epithelia for genes involved in regulation of circadian
rhythm (e.g. BHLHB3, PER1, CREB1, PER2, TIMELESS, CLOCK).
This network has not previously been implicated in sensory epithelia
regeneration or differentiation. These genes are classically thought of
as regulating 24 hour periodicities in gene expression (reviewed in
[60]) although they may play roles in other processes, such as
genotoxic stress [61]. Figure 5B shows an IPA network for the
cochlear differentially expressed genes (in this case, from an analysis
of all differentially expressed cochlear genes). This indicates that both
circadian rhythm and estrogen receptor signaling may converge
within this network. It is also interesting to note that the circadian
rhythm pathway may interact with the aforementioned Polycomb
complex via EZH2 activity, since the mammalian EZH2 gene
product binds to the PER1 and PER2 promoters [62] .
These examples serve to illustrate some of the routes that these
data now open up for the further understanding of this complex
network of interactions. Together these changes in gene expression
lead to the proliferation of supporting cells and the eventual
repopulation of the inner ear hair cells. However, unraveling
which of these candidate genes are necessary and sufficient for the
process will require more direct tests of their effects; such as RNAi
treatments, gene knock-out and gene knock-in technologies in
both the avian and the mammalian inner ear.
MATERIAL AND METHODS
Culture of sensory organs and isolated sensory
epitheliaWhite Leghorn chicks (10–21 days post hatch) were euthanized by
CO2 asphyxiation and decapitated. Cochlea and utricles were
isolated as described previously [15]. Detailed methods for the
preparation of organ cultures and cultures of isolated SE have also
been reported previously (cochlea: [63]; utricle: [18]; isolated
epithelia: [17]).
Ototoxic hair cell injuryCochleae and utricles were placed in small culture wells (Mat-Tek;
1 cm diameter; 1 specimen/well) that contained 100 mm of
Medium-199 (with Earles salts, 25 mM HEPES; 2,200 mg/L
sodium bicarbonate, and 0.69 mM l-glutamine; Invitrogen),
supplemented with 10% fetal bovine serum (FBS; Invitrogen).
Half of the specimens also received 1 mM neomycin sulfate
(Sigma), in order to lesion sensory hair cells [2,18]. Other
specimens were cultured under identical conditions, expect that
they did not receive neomycin; these served as time-matched
controls. Utricles and cochleae were maintained under these
conditions for 24 hours. At this point, some specimens were
harvested as described below; these formed the 0 hr recovery
group. Other specimens were rinsed 36with fresh Medium-199/
10%FBS and maintained in culture for an additional 24 or 48 hr.
After appropriate survival times, specimens were rinsed with fresh
Medium-199 and incubated for 60 min in 500 mg/ml thermolysin
(Sigma; prepared in Medium-199), at 37uC. The sensory organs
were then transferred to chilled Medium-199 and the sensory
Inner Ear Hair Cells
PLoS ONE | www.plosone.org 8 June 2007 | Issue 6 | e525

epithelia (consisting of sheets of hair cells and supporting cells)
were separated from the associated stromal tissue using a 27-gauge
needle. Isolated epithelia were dissolved in 100 ml Trizol and
stored at 280uC until further processing. Each biological sample
consisted of four neomycin-treated and four time-matched control
epithelia at each survival time.
Laser microbeam ablationsSE from the cochlea or utricle were isolated using thermolysin [17],
cut into small pieces, and grown for 7–10 days on fibronectin-coated
wells (Mat-Tek) that contained 50 ml Medium-199/10%FBS. Initial
immunocytochemical studies confirmed the purity of the epithelial
cultures. Cell-cell junctions in the sensory epithelia of the avian
cochlea and utricle are mediated by the adhesion molecule N-
cadherin, while junctions between cells from the surrounding
nonsensory tissue are mediated by E-cadherin [17,64,65]. In-
cubation of epithelial cultures with an antibody directed against
chick N-cadherin (NCD-2; Zymed) resulted in strong immunoreac-
tivity at nearly all cell-cell junctions (Supplementary Figure S1). This
result (which is consistent with previous findings [17]) indicates that
the cultures are almost entirely comprised of cells from the sensory
epithelia and contain very few extrasensory cells.
Once the cultures were semi-confluent, they were lesioned via
laser microsurgery [63]. Individual cultures were placed on the
stage of an inverted microscope (Zeiss Axiovert 135) that was
equipped with a pulsed laser microbeam device (Photonics
Instruments). The beam was focused through a 1006 objective
lens at a place that was coincident with the cultured cells and the
pulse controller was adjusted to run at ,10 pulses/sec. The
specimen was then moved slowly through the beam path, using the
microscope stage manipulators, resulting in the creation of a linear
‘wound’ in the confluent epithelium. Typically, 2–3 wounds were
made in each culture, separated by 100–200 mm. Unlesioned
(control) cultures were also removed from the incubator and were
placed on the side of the microscope stage during the lesioning of
their time-matched counterparts. The lesioned and unlesioned
cultures were then returned to the incubator and maintained for
an additional 30 min, 1 hr, 2 hr, or 3 hr. Four individual lesioned
and unlesioned specimens constituted one biological sample at
each of the four recovery times. RNA from the cultures was
obtained by addition of 100 ml of Trizol (Invitrogen) to each well.
Samples were then stored at 280uC until further processing.
cDNA amplificationIsolation of RNA, cDNA synthesis and amplification were carried
out as previously described [15] with the following modifications:
following the second round of amplification and Sephadex G50
minicolumn purification, cDNA was added to an in vitro
transcription kit (Megascript T7 high yield kit, Ambion) as per
the manufacturers instructions. Run-off RNAs were LiCl pre-
Figure 5. Two examples of Ingenuity gene networks constructedfrom cochlear differentially expressed genes. Genes that showeddifferential expression in both the laser and neomycin cochlear timecourses (listed in Supplementary Tables S6 and S8) were uploaded tothe web-based Ingenuity program (IngenuityH Systems, www.ingenui-ty.com) and the network of interactions shown here was generated.Each interaction is shown according to the following legend and issupported by at least one literature citation (available from theIngenuity website). Figure 5A shows the network of interactions for
r
genes specifically identified within the cochlear neomycin time courseas being part of Estrogen receptor signaling. Figure 5B shows thenetwork of interactions surrounding Circadian rhythm signaling andwas generated by uploading all of the cochlear differentially expressedgenes (rather than a subset as in 5A). Red denotes up-regulation andgreen down-regulation in at least one time point. Genes shown in boldwith no shading vary across a time course (e.g. GTF2H4 in Figure 5A wasup-regulated at 24 hrs and down-regulated at 48 hrs). All other geneswere either not represented on the microarray or were not significantlydifferentially expressed. A key to additional Ingenuity labels is listedbelow.doi:10.1371/journal.pone.0000525.g005
Inner Ear Hair Cells
PLoS ONE | www.plosone.org 9 June 2007 | Issue 6 | e525
cipitated, washed with 75% ethanol, dried and resuspended in
water at a concentration of 0.5–1 mg/ml. The overall yield and
quality of run-off products were assessed by gel electrophoresis.
Target labeling and microarray hybridizationsRun-off RNAs from each sample were used as templates in an oligo
dT12–15 primed cDNA synthesis reaction that included amino-allyl
dUTP (Sigma, 0.2 mM). The cDNA was then either coupled to Cy3
or Cy5 mono ester dyes (Amersham Pharmacia). Labeled cDNA
populations were precipitated and resuspended in 20 ml hybridiza-
tion buffer (50% formamide, 66SSPE, 56Denhart’s, 0.5% SDS.
10% dextran sulfate). Microarray slides were hybridized at 37uC for
12 h and were washed as described in [15].
Microarray DesignThe microarrray employed in this study consisted of 50 mer
oligonucleotides designed to the vast majority of human
transcription factor genes (Messina et al 2004). These probes
were designed from coding regions and have previously been
shown to accurately report on the majority of chicken TFs when
used under appropriate hybridization conditions [15]. The array
also contained probes for a limited number of non-TFs (for
example, sonic hedgehog [SHH]). Oligonucleotides were spotted
in duplicate on glass slides. The array also contained a number of
control 50 mers that have no homolog in the human (or chicken)
genome. These were used to measure array sensitivity and to assess
background correction levels.
At least two biological samples (and frequently three or more)
were analyzed per time point, treatment and tissue. For every time
point to control comparison we conducted at least four separate
microarray hybridizations (two comparisons and two dye
switches). We also compared each experimental time point to
the next experimental time point and control time points to
adjacent control time point hybridizations. A total of 226 array
comparisons were conducted for this study. These data are
available through http://www.ncbi.nlm.nih.gov/geo/with acces-
sion numbers GPL4384, GSE5991, GSE6050, GSE6051 and
GSE6052. These data comply with the ‘‘minimum information
about a microarray experiment’’ (MIAME) requirements.
Data AnalysisMicroarray images were analyzed with the BioDiscovery Imagene
software package. The Cy3 and Cy5 images were computationally
overlaid, aligned and gridded. The intensity of each spot was then
measured by laser scanning. The raw intensity files generated by
Imagene were analyzed by MIDAS2.17 and TMEV2.2 programs
of TIGR software (http://www.tigr.org) and GeneCluster 2.0
(http://www.broad.mit.edu/cancer/software/genecluster2/gc2.
html). Together, these provide functions for normalizing and
analyzing the data. Data were normalized by implementing locally
weighted linear regression (LOWESS). After data adjustment,
Hierarchical Clustering (HCL) of the data was performed using
TIGR TMEV. HCL was implemented to filter out poor
hybridizations. Low intensity filtering was performed to exclude
genes with intensities lower than the specified thresholds. An
arbitrary cut off (usually in the range of 800–1200) was chosen
based on the control spot intensities (see Microarray design above).
This value was also based on the distribution of intensity values of
the array. Approximately 10–20% of the genes were removed in
this way. We next selected genes that followed the same trend in at
least 80% of the replicated hybridizations. The average fold
change was then calculated by averaging the values across the
replicate hybridizations. Since the genes identified by these
methods (as being differentially expressed) did not necessarily
have expression ratios at all the time points (some were filtered out
at one stage, but were retained at another) we manually extracted
the adjusted intensity values at these time points and calculated the
ratios from the corresponding hybridization data. Such ‘‘filled-in’’
expression ratios allowed us to analyze the expression of all the
selected genes across the entire time course for a particular
treatment. P-values were calculated by conducting a one sample t-
test on the adjusted intensity data of the entire array of selected
hybridizations at each time point.
Quantitative PCR (qPCR)Validation of microarray fold changes was assessed by qPCR as
previously described [15] using a Stratagene MX3000P machine.
cGAPDH was used as a control gene to calculate DCt in order to
normalize data. Normalized values were used to calculate DCt to
determine fold changes.
SUPPORTING INFORMATION
Figure S1 Immunoreactivity for N-cadherin in cultures of
isolated epithelial cells from the chick cochlea (A) and utricle (B).
Epithelial cultures were maintained in vitro for seven days, at
which time the specimens were fixed and processed for
immunocytochemical localization of N-cadherin. Labeling for N-
cadherin (green) was observed at nearly all cell-cell junctions,
confirming that the cultured cells originated from the sensory
epithelia of the cochlea or utricle (see text). Cell nuclei were also
labeled with DAPI (blue). Scale bar = 20 mm.
Found at: doi:10.1371/journal.pone.0000525.s001 (2.52 MB
DOC)
Table S1 Utricle Neomycin Differentially Expressed Genes (194
total). This listing shows all genes that exhibited.1.2-fold changes
in expression, irrespective of p-value. For p-value filtered data see
Table S2.
Found at: doi:10.1371/journal.pone.0000525.s002 (0.21 MB
DOC)
Table S2 Utricle Neomycin Differential Expression.1.2-fold
and P, = 0.05
Found at: doi:10.1371/journal.pone.0000525.s003 (0.06 MB
PDF)
Table S3 Utricle Laser Differentially Expressed Genes (261
total). This listing shows all genes that exhibited.1.2-fold changes
in expression, irrespective of P-value. For p-value filtered data see
Table S4.
Found at: doi:10.1371/journal.pone.0000525.s004 (0.36 MB
DOC)
Table S4 Utricle Laser Differential Expression.1.2-fold and
P, = 0.05
Found at: doi:10.1371/journal.pone.0000525.s005 (0.05 MB
PDF)
Table S5 Cochlea Neomycin Differentially Expressed Genes
(533 total). This listing shows all genes that exhibited.1.2-fold
changes in expression, irrespective of P-value. For p-value filtered
data see Table S6
Found at: doi:10.1371/journal.pone.0000525.s006 (0.71 MB
DOC)
Table S6 Cochlea Neomycin Differential Expression.1.2-fold
and P, = 0.05
Found at: doi:10.1371/journal.pone.0000525.s007 (0.10 MB
PDF)
Inner Ear Hair Cells
PLoS ONE | www.plosone.org 10 June 2007 | Issue 6 | e525
Table S7 Cochlea Laser Differentially Expressed Genes (386
genes total). This listing shows all genes that exhibited.1.2-fold
changes in expression, irrespective of P-value. For p-value filtered
data see Table S8.
Found at: doi:10.1371/journal.pone.0000525.s008 (0.53 MB
DOC)
Table S8 Cochlea Laser Differential Expression.1.2-fold and
P, = 0.05
Found at: doi:10.1371/journal.pone.0000525.s009 (0.07 MB
PDF)
Table S9 A listing of genes that exhibit similar patterns of
expression across the four timecourses. utr-neo = utricle neomycin
timecourse , coch-lsr = cochlea laser timecourse and so on. 1 = up-
regulation, 0 = no change and 21 = down-regulation relative to
untreated controls.
Found at: doi:10.1371/journal.pone.0000525.s010 (0.04 MB
PDF)
Table S10 Transforming Growth Factor-Beta Signaling.
CN = Cochlea Neomycin timecourse. CL = Cochlea Laser time-
course. UN = Utricle Neomycin timecourse. UL = Utricle Laser
timecourse.
Found at: doi:10.1371/journal.pone.0000525.s011 (0.03 MB
DOC)
Table S11 The PAX-EYA-SIX pathway. CN = Cochlea Neo-
mycin timecourse. CL = Cochlea Laser timecourse. UN = Utricle
Neomycin timecourse. UL = Utricle Laser timecourse.
Found at: doi:10.1371/journal.pone.0000525.s012 (0.03 MB
DOC)
Table S12 Notch signaling. CN = Cochlea Neomycin time-
course. CL = Cochlea Laser timecourse. UN = Utricle Neomycin
timecourse. UL = Utricle Laser timecourse.
Found at: doi:10.1371/journal.pone.0000525.s013 (0.02 MB
DOC)
Table S13 WNT signaling. CN = Cochlea Neomycin time-
course. CL = Cochlea Laser timecourse. UN = Utricle Neomycin
timecourse. UL = Utricle Laser timecourse.
Found at: doi:10.1371/journal.pone.0000525.s014 (0.03 MB
DOC)
Table S14 NFKappaB. CN = Cochlea Neomycin timecourse.
CL = Cochlea Laser timecourse. UN = Utricle Neomycin time-
course. UL = Utricle Laser timecourse.
Found at: doi:10.1371/journal.pone.0000525.s015 (0.02 MB
DOC)
Table S15 Insulin/IGF signaling. CN = Cochlea Neomycin
timecourse. CL = Cochlea Laser timecourse. UN = Utricle Neo-
mycin timecourse. UL = Utricle Laser timecourse.
Found at: doi:10.1371/journal.pone.0000525.s016 (0.02 MB
DOC)
Table S16 AP-1 Signaling. CN = Cochlea Neomycin time-
course. CL = Cochlea Laser timecourse. UN = Utricle Neomycin
timecourse. UL = Utricle Laser timecourse.
Found at: doi:10.1371/journal.pone.0000525.s017 (0.03 MB
DOC)
Table S17 Cell Cycle/Apoptosis. CN = Cochlea Neomycin
timecourse. CL = Cochlea Laser timecourse. UN = Utricle Neo-
mycin timecourse. UL = Utricle Laser timecourse.
Found at: doi:10.1371/journal.pone.0000525.s018 (0.03 MB
DOC)
Table S18 Utricle Self Organizing Map Centroid Groups shown
in Figure 3A.
Found at: doi:10.1371/journal.pone.0000525.s019 (0.03 MB
DOC)
Table S19 Cochlea Self Organizing Map Centroid Groups
shown in Figure 3B.
Found at: doi:10.1371/journal.pone.0000525.s020 (0.04 MB
DOC)
Table S20 Utricle Detectably Expressed Genes
Found at: doi:10.1371/journal.pone.0000525.s021 (0.23 MB
DOC)
Table S21 Cochlea Detectably Expressed Genes
Found at: doi:10.1371/journal.pone.0000525.s022 (0.23 MB
DOC)
ACKNOWLEDGMENTSOur thanks to Dr. A.M. Bowcock for critical reading of this manuscript.
Author Contributions
Conceived and designed the experiments: ML MW. Performed the
experiments: RH SB KP DA JS. Analyzed the data: ML RH SB KP VB SS
MW. Wrote the paper: ML RH SB SS MW.
REFERENCES1. Hudspeth AJ (1997) How hearing happens. Neuron 19: 947–950.2. Warchol ME, Lambert PR, Goldstein BJ, Forge A, Corwin JT (1993)
Regenerative proliferation in inner ear sensory epithelia from adult guinea pigs
and humans.[see comment]. Science 259: 1619–1622.3. Forge A, Li L, Corwin JT, Nevill G (1993) Ultrastructural evidence for hair cell
regeneration in the mammalian inner ear.[see comment]. Science 259:
1616–1619.4. Roberson DW, Rubel EW (1994) Cell division in the gerbil cochlea after
acoustic trauma. American Journal of Otology 15: 28–34.
5. Yamashita H, Oesterle EC (1995) Induction of cell proliferation in mammalianinner-ear sensory epithelia by transforming growth factor alpha and epidermal
growth factor. Proceedings of the National Academy of Sciences of the United
States of America 92: 3152–3155.6. Oesterle EC, Cunningham DE, Westrum LE, Rubel EW (2003) Ultrastructural
analysis of [3H]thymidine-labeled cells in the rat utricular macula. Journal of
Comparative Neurology 463: 177–195.7. Bermingham NA, Hassan BA, Price SD, Vollrath MA, Ben-Arie N, et al. (1999)
Math1: an essential gene for the generation of inner ear hair cells. Science 284:
1837–1841.8. Kawamoto K, Ishimoto S-I, Minoda R, Brough DE, Raphael Y (2003) Math1
gene transfer generates new cochlear hair cells in mature guinea pigs in vivo.
Journal of Neuroscience 23: 4395–4400.
9. Izumikawa M, Minoda R, Kawamoto K, Abrashkin KA, Swiderski DL, et al.(2005) Auditory hair cell replacement and hearing improvement by Atoh1 gene
therapy in deaf mammals.[see comment]. Nature Medicine 11: 271–276.
10. Corwin JT, Cotanche DA (1988) Regeneration of sensory hair cells after acoustictrauma. Science 240: 1772–1774.
11. Ryals BM, Rubel EW (1988) Hair cell regeneration after acoustic trauma in
adult Coturnix quail. Science 240: 1774–1776.12. Stone JS, Rubel EW (1999) Delta1 expression during avian hair cell
regeneration. Development 126: 961–973.
13. Bermingham-McDonogh O, Stone JS, Reh TA, Rubel EW (2001) FGFR3expression during development and regeneration of the chick inner ear sensory
epithelia. Developmental Biology 238: 247–259.
14. Stone JS, Shang JL, Tomarev S (2004) cProx1 immunoreactivity distinguishesprogenitor cells and predicts hair cell fate during avian hair cell regeneration.
Developmental Dynamics 230: 597–614.
15. Hawkins RD, Bashiardes S, Helms CA, Hu L, Saccone NL, et al. (2003) Geneexpression differences in quiescent versus regenerating hair cells of avian sensory
epithelia: implications for human hearing and balance disorders. Human
Molecular Genetics 12: 1261–1272.16. Messina DN, Glasscock J, Gish W, Lovett M (2004) An ORFeome-based
analysis of human transcription factor genes and the construction of a microarray
to interrogate their expression. Genome Research 14: 2041–2047.
Inner Ear Hair Cells
PLoS ONE | www.plosone.org 11 June 2007 | Issue 6 | e525
17. Warchol ME (2002) Cell density and N-cadherin interactions regulate cell
proliferation in the sensory epithelia of the inner ear. Journal of Neuroscience22: 2607–2616.
18. Warchol ME (1999) Immune cytokines and dexamethasone influence sensory
regeneration in the avian vestibular periphery. Journal of Neurocytology 28:889–900.
19. Matsui JI, Gale JE, Warchol ME (2004) Critical signaling events during theaminoglycoside-induced death of sensory hair cells in vitro. Journal of
Neurobiology 61: 250–266.
20. Renn SCP, Aubin-Horth N, Hofmann HA (2004) Biologically meaningfulexpression profiling across species using heterologous hybridization to a cDNA
microarray. BMC Genomics 5: 42.21. Hillier LW, Miller W, Birney E, Warren W, Hardison RC, et al. (2004)
Sequence and comparative analysis of the chicken genome provide uniqueperspectives on vertebrate evolution.[see comment][erratum appears in Nature.
2005 Feb 17;433(7027):777]. Nature 432: 695–716.
22. Warchol ME (2001) Lectin from Griffonia simplicifolia identifies an immature-appearing subpopulation of sensory hair cells in the avian utricle. Journal of
Neurocytology 30: 253–264.23. Jorgensen JM, Mathiesen C (1988) The avian inner ear. Continuous production
of hair cells in vestibular sensory organs, but not in the auditory papilla.
Naturwissenschaften 75: 319–320.24. Hinck L, Nelson WJ, Papkoff J (1994) Wnt-1 modulates cell-cell adhesion in
mammalian cells by stabilizing beta-catenin binding to the cell adhesion proteincadherin. Journal of Cell Biology 124: 729–741.
25. Ide T, Shimano H, Yoshikawa T, Yahagi N, Amemiya-Kudo M, et al. (2003)Cross-talk between peroxisome proliferator-activated receptor (PPAR) alpha and
liver X receptor (LXR) in nutritional regulation of fatty acid metabolism. II.
LXRs suppress lipid degradation gene promoters through inhibition of PPARsignaling.[see comment]. Molecular Endocrinology 17: 1255–1267.
26. Pawar A, Botolin D, Mangelsdorf DJ, Jump DB (2003) The role of liver Xreceptor-alpha in the fatty acid regulation of hepatic gene expression. Journal of
Biological Chemistry 278: 40736–40743.
27. Medina KL, Singh H (2005) Genetic networks that regulate B lymphopoiesis.Current Opinion in Hematology 12: 203–209.
28. Singh H, Medina KL, Pongubala JMR (2005) Contingent gene regulatorynetworks and B cell fate specification. Proceedings of the National Academy of
Sciences of the United States of America 102: 4949–4953.29. Matsui JI, Oesterle EC, Stone JS, Rubel EW (2000) Characterization of damage
and regeneration in cultured avian utricles. Jaro 1: 46–63.
30. Duncan LJ, Mangiardi DA, Matsui JI, Anderson JK, McLaughlin-Williamson K,et al. (2006) Differential expression of unconventional myosins in apoptotic and
regenerating chick hair cells confirms two regeneration mechanisms. J CompNeurol 499: 691–701.
31. Li C, Zhu N-L, Tan RC, Ballard PL, Derynck R, et al. (2002) Transforming
growth factor-beta inhibits pulmonary surfactant protein B gene transcriptionthrough SMAD3 interactions with NKX2.1 and HNF-3 transcription factors.
Journal of Biological Chemistry 277: 38399–38408.32. Trueba SS, Auge J, Mattei G, Etchevers H, Martinovic J, et al. (2005) PAX8,
TITF1, and FOXE1 gene expression patterns during human development: newinsights into human thyroid development and thyroid dysgenesis-associated
malformations. Journal of Clinical Endocrinology & Metabolism 90: 455–462.
33. Di Palma T, Nitsch R, Mascia A, Nitsch L, Di Lauro R, et al. (2003) The paireddomain-containing factor Pax8 and the homeodomain-containing factor TTF-1
directly interact and synergistically activate transcription. Journal of BiologicalChemistry 278: 3395–3402.
34. Chen P, Segil N (1999) p27(Kip1) links cell proliferation to morphogenesis in the
developing organ of Corti. Development 126: 1581–1590.35. White PM, Doetzlhofer A, Lee YS, Groves AK, Segil N (2006) Mammalian
cochlear supporting cells can divide and trans-differentiate into hair cells. Nature441: 984–987.
36. Yang X, Menon S, Lykke-Andersen K, Tsuge T, Di X, et al. (2002) The COP9
signalosome inhibits p27(kip1) degradation and impedes G1-S phase progressionvia deneddylation of SCF Cul1. Current Biology 12: 667–672.
37. Ledford AW, Brantley JG, Kemeny G, Foreman TL, Quaggin SE, et al. (2002)Deregulated expression of the homeobox gene Cux-1 in transgenic mice results
in downregulation of p27(kip1) expression during nephrogenesis, glomerularabnormalities, and multiorgan hyperplasia. Developmental Biology 245:
157–171.
38. Li X, Perissi V, Liu F, Rose DW, Rosenfeld MG (2002) Tissue-specificregulation of retinal and pituitary precursor cell proliferation. Science 297:
1180–1183.39. Reich M, Ohm K, Angelo M, Tamayo P, Mesirov JP (2004) GeneCluster 2.0: an
advanced toolset for bioarray analysis. Bioinformatics 20: 1797–1798.
40. Tamayo P, Slonim D, Mesirov J, Zhu Q, Kitareewan S, et al. (1999) Interpretingpatterns of gene expression with self-organizing maps: methods and application
to hematopoietic differentiation. Proceedings of the National Academy of
Sciences of the United States of America 96: 2907–2912.
41. Vahava O, Morell R, Lynch ED, Weiss S, Kagan ME, et al. (1998) Mutation intranscription factor POU4F3 associated with inherited progressive hearing loss
in humans.[see comment]. Science 279: 1950–1954.
42. Ikeda S, Kurose K, Jinno H, Sai K, Ozawa S, et al. (2005) Functional analysis of
four naturally occurring variants of human constitutive androstane receptor.Molecular Genetics & Metabolism 86: 314–319.
43. Thompson EE, Kuttab-Boulos H, Krasowski MD, Di Rienzo A (2005)
Functional constraints on the constitutive androstane receptor inferred fromhuman sequence variation and cross-species comparisons. Human Genomics 2:
168–178.
44. Liu W, Lagutin OV, Mende M, Streit A, Oliver G (2006) Six3 activation of Pax6
expression is essential for mammalian lens induction and specification. EMBOJournal 25: 5383–5395.
45. Jhun BH, Haruta T, Meinkoth JL, Leitner W, Draznin B, et al. (1995) Signal
transduction pathways leading to insulin-induced early gene induction. Bio-chemistry 34: 7996–8004.
46. Zhang W, Zhang J, Kornuc M, Kwan K, Frank R, et al. (1995) Molecularcloning and characterization of NF-IL3A, a transcriptional activator of the
human interleukin-3 promoter. Molecular & Cellular Biology 15: 6055–6063.
47. Fritzsch B (2003) Development of inner ear afferent connections: formingprimary neurons and connecting them to the developing sensory epithelia. Brain
Research Bulletin 60: 423–433.
48. Wagner RA, Tabibiazar R, Liao A, Quertermous T (2005) Genome-wide
expression dynamics during mouse embryonic development reveal similarities toDrosophila development. Developmental Biology 288: 595–611.
49. Brivanlou AH, Darnell JE Jr (2002) Signal transduction and the control of gene
expression. Science 295: 813–818.
50. Lacorte JM, Ktistaki E, Beigneux A, Zannis VI, Chambaz J, et al. (1997)
Activation of CAAT enhancer-binding protein delta (C/EBPdelta) by in-terleukin-1 negatively influences apolipoprotein C-III expression. Journal of
Biological Chemistry 272: 23578–23584.
51. Wang B, Weidenfeld J, Lu MM, Maika S, Kuziel WA, et al. (2004) Foxp1
regulates cardiac outflow tract, endocardial cushion morphogenesis and myocyteproliferation and maturation. Development 131: 4477–4487.
52. Bracken AP, Dietrich N, Pasini D, Hansen KH, Helin K (2006) Genome-wide
mapping of Polycomb target genes unravels their roles in cell fate transitions.Genes & Development 20: 1123–1136.
53. Kamminga LM, Bystrykh LV, de Boer A, Houwer S, Douma J, et al. (2006) The
Polycomb group gene Ezh2 prevents hematopoietic stem cell exhaustion. Blood
107: 2170–2179.
54. Vire E, Brenner C, Deplus R, Blanchon L, Fraga M, et al. (2006) The Polycombgroup protein EZH2 directly controls DNA methylation.[see comment]. Nature
439: 871–874.
55. Bernstein E, Duncan EM, Masui O, Gil J, Heard E, et al. (2006) Mouse
polycomb proteins bind differentially to methylated histone H3 and RNA andare enriched in facultative heterochromatin. Molecular & Cellular Biology 26:
2560–2569.
56. Schwartz YB, Pirrotta V (2007) Polycomb silencing mechanisms and themanagement of genomic programmes. Nature Reviews Genetics 8: 9–22.
57. Stenberg AE, Wang H, Fish J 3rd, Schrott-Fischer A, Sahlin L, et al. (2001)Estrogen receptors in the normal adult and developing human inner ear and in
Turner’s syndrome. Hearing Research 157: 87–92.
58. Cvoro A, Tzagarakis-Foster C, Tatomer D, Paruthiyil S, Fox MS, et al. (2006)Distinct roles of unliganded and liganded estrogen receptors in transcriptional
repression. Molecular Cell 21: 555–564.
59. Sommer S, Fuqua SA (2001) Estrogen receptor and breast cancer. Seminars in
Cancer Biology 11: 339–352.
60. Hayes KR, Baggs JE, Hogenesch JB (2005) Circadian clocks are seeing thesystems biology light. Genome Biology 6: 219.
61. Antoch MP, Kondratov RV, Takahashi JS (2005) Circadian clock genes as
modulators of sensitivity to genotoxic stress. Cell Cycle 4: 901–907.
62. Etchegaray J-P, Yang X, DeBruyne JP, Peters AHFM, Weaver DR, et al. (2006)
The polycomb group protein EZH2 is required for mammalian circadian clockfunction. Journal of Biological Chemistry 281: 21209–21215.
63. Warchol ME, Corwin JT (1996) Regenerative proliferation in organ cultures of
the avian cochlea: identification of the initial progenitors and determination of
the latency of the proliferative response. Journal of Neuroscience 16: 5466–5477.
64. Raphael Y, Volk T, Crossin KL, Edelman GM, Geiger B (1988) Themodulation of cell adhesion molecule expression and intercellular junction
formation in the developing avian inner ear. Developmental Biology 128:222–235.
65. Warchol ME (2007) Characterization of supporting cell phenotype in the avian
inner ear: Implications for sensory regeneration. Hearing Research (in press).
Inner Ear Hair Cells
PLoS ONE | www.plosone.org 12 June 2007 | Issue 6 | e525