
Land Classification and Flood Characteristics of the ... - J-Stage
18
699 — — Land Classification and Flood Characteristics of the Pampanga River Basin, Central Luzon, Philippines Naoko NAGUMO * and Hisaya SAWANO * [Received 2 June, 2015; Accepted 7 May, 2016] Abstract The Pampanga River basin, which is the second largest drainage basin on Luzon Island (Republic of the Philippines) , frequently suffers from severe flood events, caused by monsoon rainfall and typhoon strikes. Therefore, the aim of this study is to determine local flood characteristics and potential flood vulnerability, based on the basin's geography (e.g., distribution of topography, land use and past flood records) . Our land classification shows that the basin consists of three major topographic regions: mountain and hill, volcano, and alluvial plain. The mountain and hill region is further divided into topographic units of mountain and hill, and volcano region is subdivided into volcanic slope, volcanic piedmont gentle slope, and volcanic fan. On the other hand, the alluvial plain is divided into fan, terrace, back marsh, swamp, delta, valley plain, natural levee, meander scroll, and former channel. In the upper alluvial plain, the supply of sediments, triggered by the Philippine Fault activities, contributes to a southwestern fan I, fan II and terrace II development on the western side of the Pampanga River. Terrace I and terrace II on the other hand, develop in western direction on the eastern side of the Pampanga River. Owing to the mountains, hills, and volcanoes that surround the alluvial plain, its width is reduced to 20 km at Arayat. As a consequence, floodwaters easily concentrate and stagnate here, creating the two swamps of San Antonio and Candaba. In the lower portion of the alluvial plain, low gradient bed slopes, land subsidence, and tidal intrusion of sea water enhance poor drainage situations. As a result, floodwaters from Candaba Swamp cannot drain efficiently, causing severe floods. The alluvial plain was divided into four zones (I–IV) , based on the flood patterns that were identified by the geographical conditions of the basin. Floods in zone I and zone II located on the western and eastern side of the Pampanga River are smoothly drained. On the other hand, people in the most downstream flood-prone area (zone III and zone IV) receive much benefit from the cyclic floods by stimulating the agricultural and fishery production, but the deep inundation also damages their houses. Nonetheless, some coexist with the floods seemingly without fear, and did not even evacuate during the largest recent flood event of 2011. The population of the basin is still increasing, and flood risks should be reduced through government-initiated actions. Furthermore, in order for the region's inhabitants to take effective measures to fight flooding and sustain flood-adaptive lifestyles, they should be required to understand the local geographical characteristics and regional flood vulnerability. Key words: Pampanga River, land classification, alluvial plain, flood characteristics, flood vulnerability * International Centre for Water Hazard and Risk Management, Public Works Research Institute, Tsukuba, 305-8516, Japan 地学雑誌 Journal of Geography (Chigaku Zasshi) 125 (5)699–716 2016 doi:10.5026/jgeography.125.699
-
Upload
khangminh22 -
Category
Documents
-
view
1 -
download
0
Transcript of Land Classification and Flood Characteristics of the ... - J-Stage

699— —
Land Classification and Flood Characteristics of
the Pampanga River Basin, Central Luzon, Philippines
Naoko NAGUMO* and Hisaya SAWANO*
[Received 2 June, 2015; Accepted 7 May, 2016]
Abstract The Pampanga River basin, which is the second largest drainage basin on Luzon Island (Republic of the Philippines), frequently suffers from severe flood events, caused by monsoon rainfall and typhoon strikes. Therefore, the aim of this study is to determine local flood characteristics and potential flood vulnerability, based on the basin's geography (e.g., distribution of topography, land use and past flood records). Our land classification shows that the basin consists of three major topographic regions: mountain and hill, volcano, and alluvial plain. The mountain and hill region is further divided into topographic units of mountain and hill, and volcano region is subdivided into volcanic slope, volcanic piedmont gentle slope, and volcanic fan. On the other hand, the alluvial plain is divided into fan, terrace, back marsh, swamp, delta, valley plain, natural levee, meander scroll, and former channel. In the upper alluvial plain, the supply of sediments, triggered by the Philippine Fault activities, contributes to a southwestern fan I, fan II and terrace II development on the western side of the Pampanga River. Terrace I and terrace II on the other hand, develop in western direction on the eastern side of the Pampanga River. Owing to the mountains, hills, and volcanoes that surround the alluvial plain, its width is reduced to 20 km at Arayat. As a consequence, floodwaters easily concentrate and stagnate here, creating the two swamps of San Antonio and Candaba. In the lower portion of the alluvial plain, low gradient bed slopes, land subsidence, and tidal intrusion of sea water enhance poor drainage situations. As a result, floodwaters from Candaba Swamp cannot drain efficiently, causing severe floods. The alluvial plain was divided into four zones (I–IV), based on the flood patterns that were identified by the geographical conditions of the basin. Floods in zone I and zone II located on the western and eastern side of the Pampanga River are smoothly drained. On the other hand, people in the most downstream flood-prone area (zone III and zone IV) receive much benefit from the cyclic floods by stimulating the agricultural and fishery production, but the deep inundation also damages their houses. Nonetheless, some coexist with the floods seemingly without fear, and did not even evacuate during the largest recent flood event of 2011. The population of the basin is still increasing, and flood risks should be reduced through government-initiated actions. Furthermore, in order for the region's inhabitants to take effective measures to fight flooding and sustain flood-adaptive lifestyles, they should be required to understand the local geographical characteristics and regional flood vulnerability.
Key words: Pampanga River, land classification, alluvial plain, flood characteristics, flood vulnerability
* International Centre for Water Hazard and Risk Management, Public Works Research Institute, Tsukuba, 305-8516, Japan
地学雑誌 Journal of Geography(Chigaku Zasshi) 125(5)699–716 2016 doi:10.5026/jgeography.125.699
700— —
I.Introduction
Human life in monsoon Asia—the most pop-ulated region in the world—is supported in princi-pal by abundant precipitation and its river activ-ity. Although potential floods, droughts, and sediment disasters are greater in the alluvial low-lands, these areas are extensively populated. Its inhabitants have developed an effective land use that takes into account the river behavior, so that disaster risks are minimized, while simultane-ously maximizing the benefits of the river. Al-though rivers in low-latitude monsoon Asia are influenced by seasonal floods, their courses are unaffected by human interventions. As a conse-quence, people in these areas have adapted to the seasonally variable natural environment, living traditional lifestyles. However, recent population growth, and the increasing frequency and scale of floods in low-latitude monsoon Asia, have resulted in greater flood impacts on its inhabitants (e.g., Hara, 2011; Araya et al., 2013; Nagumo and Kubo, 2013). Re-ducing flood risks, and building a resilient and sustainable society in those flood-prone areas, is therefore a priority. Hence, possible floods should be identified first, based on scientific evidence, and effective flood prevention measures should be executed subsequently. Conducting hydrological simulations is useful for understanding flood frequencies and for esti-mating flood damages quantitatively. However, hydrological simulations can sometimes be confus-ing and unfamiliar for locals, because of variable settings of the models and the uncertainties that accompany such simulations. However, focusing on the geography of alluvial lowlands, by present-ing its characteristics on a map that considers the topographical distribution, elevation, and history of the land, could result in a more comprehensive and helpful method for communicating the re-gion's flood vulnerability. This study targeted the Pampanga River basin in the Central Luzon Plain, Republic of the Philip-pines, which is strongly influenced by seasonal rainfall and typhoons. The purpose of this study is to clarify the characteristics of floods and the
potential flood vulnerability of the basin. Overall, this study presents the geographical results of the basin's land classification and past flood records to divide the study area into four zones (I–IV), by the differences in topographic characteristics and flood patterns based on observations of topograph-ical maps and satellite images, and field surveys including interviews about local flood experiences. The Pampanga River basin is regularly subject-ed to severe floods. It is the second largest river basin on Luzon Island, originating in the Carabal-lo Mountains, and constitutes a major portion of the Central Luzon Plain (Fig. 1). In particular, its most southern part has developed as the hinter-land of Metro Manila, since the beginning of the Spanish period in the late 16th century. This de-velopment was stimulated by the suitability of the plain for extensive agriculture, fishery, and forestry (Larkin, 1972). However, the basin has been threatened by intensified monsoon rainfall, as well as direct tropical typhoon strikes, which now occur almost every rainy season. Reducing flood risks is therefore one of the major concerns for local disaster risk management (e.g., National Disaster Coordinating Council, 2009). For the Pampanga River basin floods, flood damage estimations are conducted with flood damage functions (e.g., Okazumi et al., 2013; Shrestha et al., 2014, 2015). In addition, Siringan and Rodolfo (2003) and Rodolfo and Siringan (2006) discussed impacts of anthropogenic and
sea level rise on the coastal area. Yamashita et al. (2002) also calculated flood and sediment control effects on a natural swamp (Candaba Swamp) in the basin, while land use changes of the plain have been identified from a geographical point of view by Himiyama and Abe (2014). Nonetheless, the manner in which basin topography explains river behavior and flood conditions is not well characterized yet.
II.Regional Settings
The Pampanga River basin is enclosed by the Caraballo, Sierra Madre, and Zambales Moun-tains (Fig. 1), and its main stream measures 265 km in length and drains an area of 10,430 km2, including the sub-basins of the Angat River and

701— —
Pasac River. After flowing into the reservoir cre-ated by multi-purpose Pantabangan Dam in the upper mountains, the river enters the alluvial plain. Here, it traverses in a southwestern direc-tion, and the river collects tributaries, and conse-quently changes its flow direction towards the south at Arayat. Downstream of the Sulipan station, the Angat River, which originates in the Sierra Madre Moun-tains, and supplies the Angat reservoir, merges into the Pampanga River through the Bagbag Riv-er. Finally, the Pampanga River ends in Manila Bay, after partially branching off to the Pasac Riv-er through the Bebe-San Esteban Cut-off Chan-nel. The present Pampanga River mostly has a me-
andering channel through the basin. The bed slope of the channel is more than 1/400 upstream of the Pantabangan Reservoir, and becomes less steep when heading downstream: 1/1000–1/2500 between the confluences with the Coronel River and Penaranda River; 1/2500–1/5000 between the confluences with the Penaranda River and Rio Chico River; 1/5000–1/10,000 between the conflu-ences with the Rio Chico River and Angat River; and finally less than 1/10,000 in its most down-stream part (JICA, 2011). Based on the precipitation pattern, the Luzon Island climate is classified into four types (I–IV). Type I has two distinct seasons: a dry period from November to April and a wet period during the rest of the year. Type II has no dry seasons, and
Fig. 1 Map of the Pampanga River basin. Fault trace distributions are based on studies by Nakata et al. (1990) and Tsutsumi and Perez (2013).

702— —
abundant precipitation from November to Febru-ary. On the other hand, type III has a short dry season, usually from February to April, and type IV has evenly distributed precipitation throughout the year (Philippine Atmospheric, Geophysical and Astronomical Services Administration, 2011). Most of the study area belongs to the type I. Here, the mean annual precipitation of approximately 2000 mm, observed at the Cabanatuan meteoro-logical station, is concentrated between June and October. The mean annual temperature is 28℃ (Fig. 2a) and the hottest month appears in April with a temperature of 31℃. Precipitation rates fluctuate seasonally, which promotes a cyclical change of the river's water level and discharge. In recent years, the maximum difference in dry and rainy season water levels has been 8 m at the Arayat hydrological station (Fig. 2b). Water level at the Sulipan station (Fig. 2c) fluctuates rhyth-mically instead, since the most downstream part of the basin is affected by tidal activities as well. The average and peak discharge between 1947 and 2002 at Arayat station is 220 m3/s and ca. 1700 m3/s, respectively (JICA, 2011). Along the northern end of the alluvial plain, a part of the Philippine Fault extends from north-
west to southeastern direction (Fig. 1). This is one of the major active faults in the Philippines, and it has caused devastating earthquakes, such as the MW 7.7 Central Luzon earthquake in 1990 (e.g., Nakata et al., 1990; Tsutsumi and Perez, 2013). The estimated average horizontal dis-placement rate for the fault is 1.5–5.0 mm/yr. The vertical displacement rate is 0.19–0.63 mm/yr in the northern part, and 1.0–1.3 to 3.5–5.0 mm/yr in the southern part of the fault (Hirano et al., 1986). The active Mt. Pinatubo volcano (1486 m) is situated in the western portion of the basin. Mt. Pinatubo provided a huge volume of volcanic ash fall and pyroclastic flow sediments during its eruption in 1991. Those sediments later formed lahar, which contributed to severe riverbed ag-gradation and flow route changes on the moun-tain slopes. These alterations still contain a risk of triggering additional large floods (e.g., Inoue et al., 1994; Hirose and Inoue, 1999; Inoue and Hirose, 2001; Hirose et al., 2003). Mt. Arayat (1026 m), another volcano, formed by a basaltic and andesitic cone of ca. 9 km in diameter, is located east of Mt. Pinatubo. Mt. Arayat's last eruption dates back to approximately 0.53 Ma
Fig. 2 Average monthly 2013 temperatures at Cabanatuan station (a) provided by the Japan Meteorological Agency, and daily water levels at the Arayat (b) and Sulipan (c) stations from 2010 to 2014, provided by the Philippine Atmospheric, Geo-physical and Astronomical Services Administration. The locations of the observing stations are indicated in Fig. 1.

703— —
(Mines and Geosciences Bureau, 2004; Moriya, 2014). The major geology around the Pampanga River head and eastern mountain ranges consists of Cretaceous to Tertiary metamorphic rocks origi-nating from sedimentary rocks (e.g., shale and sandstone) (JICA, 2011). JICA (1982) reported that the Central Luzon Plain is filled with layers of sediment ranging from the Oligocene to a recent period, with a maximum depth of 6000–7000 m above the basement rock. Regarding relative sea-level changes, Maeda et al. (2009) identified three Holocene high stands on the northern coast of Luzon Island (Cagayan province): at 7.5–6.0 kyr cal BP, 6.0–4.0 kyr cal BP, and 2.8–1.3 kyr cal BP. They concluded that those dates are concordant with ages widely reported around the Philippines. In addition, Gaillard et al. (2005) suggested that the paleo shoreline before the eruption of Mt. Pinatubo in the Buag period (ca. 500 yr BP) was probably located at least 20 km inland, along the eastern margin of Mt. Pinatubo's volcanic areas.
III.Method
Okakawa (1970) mapped the topography of the Central Luzon Plain from a pedological viewpoint, and Haruyama (1990) additionally roughly clas-sified the topography of the plain. Referring to those studies, we conducted a land classification survey, using satellite images and topographic maps for identifying topographic characteristics. We focused on the continuity of surfaces, relative elevations, and land use patterns. Satellite images of Landsat 8 (taken in Febru-ary and March 2014) as well as stereo ALOS PRISM images (taken in February 2007) of the downstream part were analyzed. Google Earth images (taken from 2010 to 2014) were used as a backup in case other images were insufficient. Topographic maps (1:50,000) prepared by the US Army Map Service (i.e., the 712 series produced in 1944, and the 711 series compiled in the early 1950s, reprinted in the 1970s), as well as the NTM series prepared by the National Mapping and Resource Information Authority (NAMRIA) and the JICA in 2007, were also analyzed for flow
route changes and natural conditions of the study area. In March and July 2014, field surveys were con-ducted in the downstream area. These mainly served to interview local residents about flood ex-periences in each rainy season, as well as about the 2011 typhoon Pedring, which caused the larg-est recent flood event in the basin.
IV.Land classifications and past flood situations
1) Distribution of topographic surfaces The Pampanga River basin can be divided topo-graphically into three regions: mountain and hill, volcano, and alluvial plain (Fig. 3; Table 1). The mountain and hill region is subdivided into moun-tain and hill, respectively, and the mountain is further divided into mountain slope and piedmont gentle slope. The volcano region consists of vol-canic slope, volcanic piedmont gentle slope, and volcanic fan. Volcanoes are only found west of the basin, whereas mountain slopes, piedmont gentle slopes, and hills can be found in the basin's north and east. The peak elevation of the northern moun-tain ranges, of around 1700 m in height, descends southward to an elevation of around 200 m. The peak elevation of the eastern mountain ranges descends westward, from around 800 to 100 m, ending in gently undulating hills (lower than 100 m). Furthermore, volcanic slope, volcanic piedmont gentle slope, and volcanic fan are concentrically situated around the peaks of Mt. Pinatubo and Mt. Arayat. The alluvial plain is surrounded by these moun-tain and hill, and covers a diverse set of topo-graphic units: fan, terrace, back marsh, swamp, delta, valley plain, natural levee, meander scroll, and former channel (Table 1). The major topo-graphic units of fan, terrace, back marsh, swamp, and delta are distributed from upstream to down-stream. In the northern mountain ranges, the meandering Pampanga, Taravera, and Baliwag Rivers form narrow valley plains. They subse-quently become braided in the northern end of the alluvial plain, and subsequently exhibit meander-ing characteristics further downstream. In con-

704— —
Fig. 3 Land classification map of the Pampanga River basin and the distribution of recorded maximum inundation depths dur-ing the 2011 flood by typhoons Pedring and Quiel. The locations of cross sections in Fig. 4 (A–A′, B–B′ and C–C′), and the borehole cores in Fig. 6 (a, b, c–c′, d and e) are also indicated. Inundation depths were provided by the Pampanga River Basin Flood Forecasting and Warning Center (2011).

705— —
trast, the meandering tributaries from the east-ern mountain ranges first carve incised valleys in the upstream area, and consequently flow into the alluvial plain. The fan is subdivided into landform units of fan I, II, and III, which are located in the northern part of the alluvial plain. Fan I, with a longitudi-nal incline of 0.14%, is situated between 30 and 50 m a.s.l., and fan II, with a longitudinal incline of 0.34%, is located above 50 m a.s.l. (Fig. 4). Both fan I and fan II progress from the fan top along the Taravera River in southwestern direc-tion, occupying the right bank of the Pampanga River (Fig. 4). In addition, clusters of small fans (fan III) are situated at the mountain edge along the Coronel River, and probably have developed intermittently due to slope failures triggered by Philippine Fault activities. The terrace is further divided into terrace I and II. The higher terrace I is partly located in the
northwestern end of the basin, and progresses in front of the hill on the Pampanga River left bank, between 20 and 40 m a.s.l. Terrace II develops with a longitudinal incline of 0.05–0.10%, gradu-ally descending in elevation in the southwestern direction on the right bank of the Pampanga River, and furthermore spreading westwards across the foot of the hill of the left bank. The back marsh displays a lower and flatter to-pography than the terrace (Fig. 4), expanding along the Rio Chico River. The large swamp of San Antonio is situated at the confluence of the Rio Chico and Pampanga River. Another elongat-ed swamp, Candaba Swamp, is situated at the other side of the Pampanga River. Natural levees and former channels are well developed in the right, rather than the left, bank of the Pampanga River, and natural levees also rest on the volcanic piedmont gentle slope. Valley plains are clearly noticeable along the Pasig-Potrero River, aggraded
Table 1 List of hierarchical topographic surfaces identified by land classification.
Region Topographic unit Landform unit
mountain and hillmountain
mountain slope
piedmont gentle slope
hill
volcano
volcanic slope
volcanic piedmont gentle slope
volcanic fan
alluvial plain
fan
fan I
fan II
fan III
terraceterrace I
terrace II
back marsh
swamp
deltadelta I
delta II
valley plain
natural levee
meander scroll
former channel

706— —
by pyroclastic flow and lahar following the 1991 eruption of Mt. Pinatubo. In the downstream area, the 12 m high “Mega Dike” firmly fixes the river channel, preventing additional floods (Inoue and Hirose, 2001). Continuous meander scrolls are found along the Pampanga, Coronel, Penaranda, Taravera, and Baliwag Rivers, along with their former channels. The Pampanga, Taravera and Baliwag Rivers are relatively lower in altitude than the fan and terrace units, and their present chan-nels flow through the lowest part of the mean-der scrolls. For example, around Cabanatuan (Fig. 1), the meander scroll of the Pampanga Riv-er is terraced, with a maximum relative elevation of 2–4 m against terrace I, and 1–2 m against terrace II. The Taravera River and Baliwag Riv-er meander scrolls are at least 2–3 m lower in elevation than fan I. Those meander scrolls gradually decrease in size downstream, and be-come less distinct as their elevation approaches back marsh and swamp level. The low-lying delta is subdivided into delta I and delta II. Delta I is situated at the foot of Mt. Arayat, at less than 10 m a.s.l., and is used for paddy fields and fish ponds. Delta II is lower at less than 5 m a.s.l. and thus higher in water con-
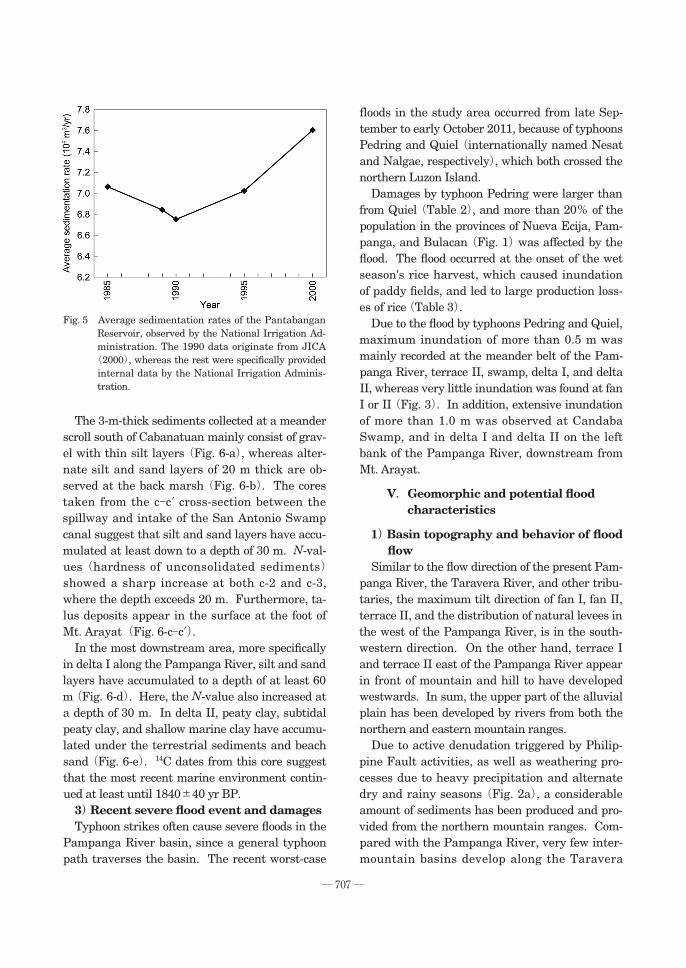
tent compared to delta I, and is considered one of the major fish farming fields in the region. Delta II includes the embayment area of 500 yr BP (Gaillard et al., 2005), as well as braided natural streams, which are artificially embanked to supply and drain the fish-pond routes. 2) Characteristics of alluvial sediments Unlike the river basins of stable continental re-gions in Southeast Asia, Pampanga's northern mountain ranges have an uplift trend due to the Philippine Fault activities (Hirano et al., 1986). Therefore, the northern mountains have been more substantially dissected than the eastern mountains, and they contributed to the develop-ment of many intermountain basins. The ob-served sedimentation rate of the Pantabangan Reservoir was approximately 7×10⁶ m3/yr be-tween 1985 and 2000, and the specific sediment yield during those years reached more than 8×10³ m3/km2/yr over a 829 km2 drainage area (Fig. 5). This is much bigger than that of Japanese rivers, such as the Kurobe River and the Tenryu River, which have the highest sediment yield in Japan (Ashida and Okumura, 1974). Therefore, the denudation rate in the northern mountain ranges appears to be considerably higher than that of the eastern mountain ranges.
Fig. 4 Geomorphic cross section of A–A′, B–B′ and C–C′, based on SRTM 3-arc seconds. The cross sections of the 10-point mov-ing average are also shown. The locations of A–A′, B–B′ and C–C′ are indicated in Fig. 3.
707— —
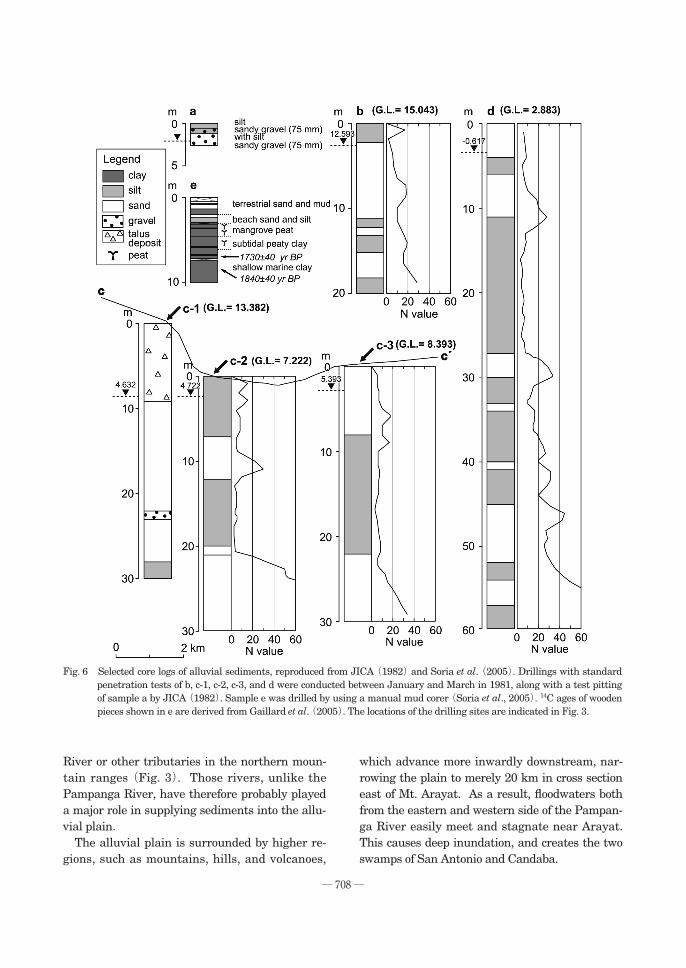
The 3-m-thick sediments collected at a meander scroll south of Cabanatuan mainly consist of grav-el with thin silt layers (Fig. 6-a), whereas alter-nate silt and sand layers of 20 m thick are ob-served at the back marsh (Fig. 6-b). The cores taken from the c–c′ cross-section between the spillway and intake of the San Antonio Swamp canal suggest that silt and sand layers have accu-mulated at least down to a depth of 30 m. N-val-ues (hardness of unconsolidated sediments) showed a sharp increase at both c-2 and c-3, where the depth exceeds 20 m. Furthermore, ta-lus deposits appear in the surface at the foot of Mt. Arayat(Fig. 6-c–c′). In the most downstream area, more specifically in delta I along the Pampanga River, silt and sand layers have accumulated to a depth of at least 60 m (Fig. 6-d). Here, the N-value also increased at a depth of 30 m. In delta II, peaty clay, subtidal peaty clay, and shallow marine clay have accumu-lated under the terrestrial sediments and beach sand (Fig. 6-e). 14C dates from this core suggest that the most recent marine environment contin-ued at least until 1840±40 yr BP. 3) Recent severe flood event and damages Typhoon strikes often cause severe floods in the Pampanga River basin, since a general typhoon path traverses the basin. The recent worst-case
floods in the study area occurred from late Sep-tember to early October 2011, because of typhoons Pedring and Quiel (internationally named Nesat and Nalgae, respectively), which both crossed the northern Luzon Island. Damages by typhoon Pedring were larger than from Quiel (Table 2), and more than 20% of the population in the provinces of Nueva Ecija, Pam-panga, and Bulacan (Fig. 1) was affected by the flood. The flood occurred at the onset of the wet season's rice harvest, which caused inundation of paddy fields, and led to large production loss-es of rice (Table 3). Due to the flood by typhoons Pedring and Quiel, maximum inundation of more than 0.5 m was mainly recorded at the meander belt of the Pam-panga River, terrace II, swamp, delta I, and delta II, whereas very little inundation was found at fan I or II (Fig. 3). In addition, extensive inundation of more than 1.0 m was observed at Candaba Swamp, and in delta I and delta II on the left bank of the Pampanga River, downstream from Mt. Arayat.
V.Geomorphic and potential flood characteristics
1) Basin topography and behavior of flood flow
Similar to the flow direction of the present Pam-panga River, the Taravera River, and other tribu-taries, the maximum tilt direction of fan I, fan II, terrace II, and the distribution of natural levees in the west of the Pampanga River, is in the south-western direction. On the other hand, terrace I and terrace II east of the Pampanga River appear in front of mountain and hill to have developed westwards. In sum, the upper part of the alluvial plain has been developed by rivers from both the northern and eastern mountain ranges. Due to active denudation triggered by Philip-pine Fault activities, as well as weathering pro-cesses due to heavy precipitation and alternate dry and rainy seasons (Fig. 2a), a considerable amount of sediments has been produced and pro-vided from the northern mountain ranges. Com-pared with the Pampanga River, very few inter-mountain basins develop along the Taravera
Fig. 5 Average sedimentation rates of the Pantabangan Reservoir, observed by the National Irrigation Ad-ministration. The 1990 data originate from JICA (2000), whereas the rest were specifically provided internal data by the National Irrigation Adminis-tration.
708— —
River or other tributaries in the northern moun-tain ranges (Fig. 3). Those rivers, unlike the Pampanga River, have therefore probably played a major role in supplying sediments into the allu-vial plain. The alluvial plain is surrounded by higher re-gions, such as mountains, hills, and volcanoes,
which advance more inwardly downstream, nar-rowing the plain to merely 20 km in cross section east of Mt. Arayat. As a result, floodwaters both from the eastern and western side of the Pampan-ga River easily meet and stagnate near Arayat. This causes deep inundation, and creates the two swamps of San Antonio and Candaba.
Fig. 6 Selected core logs of alluvial sediments, reproduced from JICA (1982) and Soria et al. (2005). Drillings with standard penetration tests of b, c-1, c-2, c-3, and d were conducted between January and March in 1981, along with a test pitting of sample a by JICA (1982). Sample e was drilled by using a manual mud corer (Soria et al., 2005). 14C ages of wooden pieces shown in e are derived from Gaillard et al. (2005). The locations of the drilling sites are indicated in Fig. 3.

709— —
Downstream from Arayat, a very gentle bed slope of the Pampanga River (JICA, 2011), as well as the cyclic seawater intrusion, promote pro-longed deep-water inundation (Fig. 2c). The area up to 40 km landward from the sea has also suf-fered from rapid subsidence, at a rate of at least 2.5 cm/yr (Nippon Koei, 2009) (Fig. 7). Siringan and Rodolfo (2003) also observed a typical subsid-ence rate of 2–4 cm/yr by the measurements of water wells protruding due to excessive ground water use. As a consequence, the Pampanga River has been losing its efficient drainage function, and inundation of this area continues throughout the rainy season. 2) Zonings of the alluvial plain and esti-
mated flood patterns Based on the land classification and the worst-case flood situation of 2011, the alluvial plain was divided into four zones (Fig. 3). The flood char-acteristics in each zone are considered as follows. Zone I is located west of the Pampanga River, in
Table 2 Damage to the provinces Pampanga, Bulacan, and Nueva Ecija, as a consequence of the 2011 flood event. Popu-lation estimates from the 2010 census were used for calculating the percentages of affected people. The original data were provided by the Department of Social Welfare and Development.
Date Event ProvinceAffected people
Affected families
Dead Injured MissingAffected people (%)
Partiallydamaged houses
Totally damaged houses
Sep, 2011*Typhoon
Pedring
Nueva Ecija 510,964 107,652 2 3 - 26.1 562 1,420
Pampanga 532,251 111,654 5 - 2 22.7 84 755
Bulacan 584,925 122,544 9 3 - 20.0 839 2,575
Oct, 2011*Typhoon
Quiel
Nueva Ecija 151,444 32,441 1 - - 7.7 98 1,210
Pampanga 18,353 89,651 4 - - 0.8 10 626
Bulacan 68,402 17,372 - - - 2.3 104 485
*as of October 15.
Table 3 Estimated affected area, total damaged area, production losses of palay rice, and the value of these production losses in 2011. The original data were provided by the Bu-reau of Agricultural Statistics.
ProvinceAffected area(Ha)
Totally damaged area(Ha)
Production loss(Mt)
Value of production loss(P'000)
Pampanga 38,072 19,274 107,660 1,607,501
Bulacan 36,713 20,958 94,144 1,520,261
Nueva Ecija 146,500 14,463 195,065 3,278,616
Fig. 7 Land subsidence map of the lower Pamapanga River, based on the Nippon Koei surveys since 1995 (Nippon Koei, 2009). The black dots indicate the locations of major municipal centers in the area.

710— —
the upper alluvial plain, including fan I, fan II, and terrace II, and it develops in a southwestern direction. Although floodwaters are smoothly drained in fan I and II at the early stage of flood events, inundation appears to happen at terrace II, since inundation over 0.5 m was observed dur-ing the 2011 flood, caused by floodwaters from upstream and an expansion of back marsh and swamps in the south. Zone II is situated east of the Pampanga River. It is composed of terrace I and II, and develops westwards. During early flood event stages, flood-waters appear to drain quickly from the upper re-gions to the Pampanga River, and severe inunda-tion occurs mainly at the meander scrolls and riverside areas. Zone III is located at the convergence of zone I and zone II, and includes back marsh, swamps (Candaba and San Antonio), terrace I and II, and delta I. Inundation of more than 1.0 m was ob-served here during the 2011 flood, and Candaba Swamp particularly has a high risk of inundation, absorbing the majority of flood water coming from upstream. Zone IV involves a tidal-affected portion of delta I and II. The area in the east of the Pampanga River has a higher flooding risk than the western side, since inundation of over 1.0 m was observed during 2011 flood in most places, which was exac-erbated by the periodic intrusion of sea water. At the initial stage of a flood event, floodwaters in zone I flow down through the tributaries in the relatively steep fan I and fan II (Fig. 4), after which it soon reaches the back marsh of zone III via terrace II. The back marsh and San Antonio Swamp in zone III are then gradually inundated, and easily fill up to their full capacity by the mid-dle of the rainy season. Furthermore, in zone II, floodwaters pass through in a westward direc-tion to reach the Pampanga River in over a short distance. Therefore, flash flood risk is high in the riverside areas during the initial stage of the rainy season, or soon after heavy precipitation. Floodwaters from zone I and zone II, and from the Pampanga River meet in zone III, and finally flow into the Candaba Swamp by the middle stage of the rainy season. This area shows a very gentle
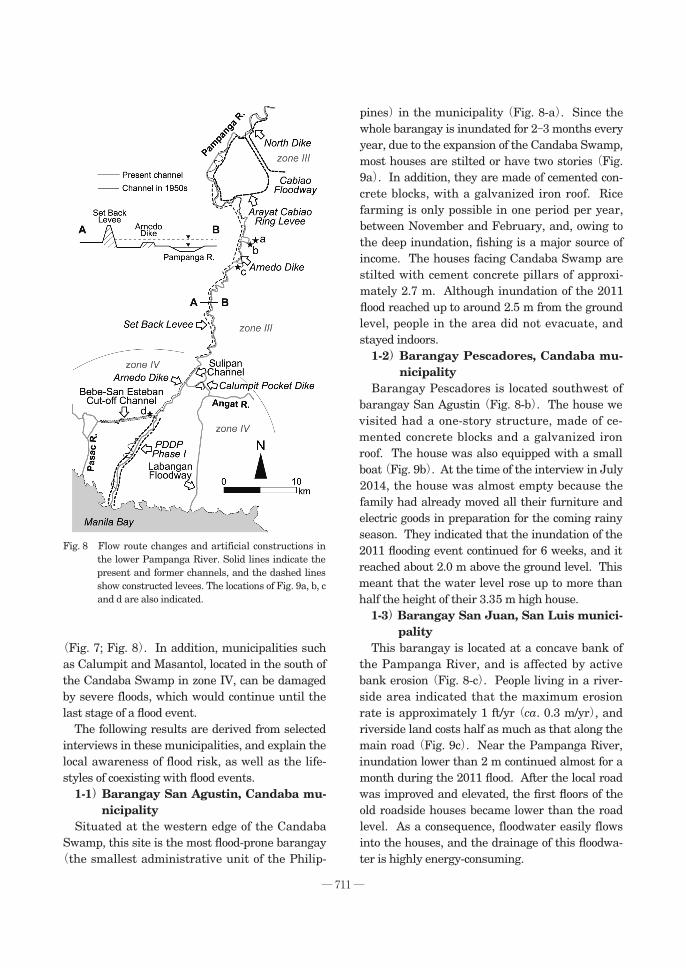
longitudinal profile, and it is flanked by eastern mountain ranges and western volcanic areas. The swamp therefore easily expands by absorbing floodwaters. The inundation depth can increase up to the Pampanga River level. When this hap-pens, the Cabiao Floodway (Fig. 8) plays an im-portant role in steering the floodwater to the Candaba Swamp. The continuous Arnedo Dike, and the higher Set Back Levee nearly 40 km long as the second line of defense also control flood flows, in order to prevent expansion of the swamp towards the populated right bank. Construction of these river improvement structures was guided by the United States between the 1940s and 1970s, and has taken important roles to control the floodwater in the downstream. During the middle to last stage of a flood event, floodwaters from the Candaba Swamp flow south to southwest into zone IV. The low-lying zone IV additionally receives floodwaters from the volcanic slopes of Mt. Pinatubo. Although the latest river improvement project, phase I of the Pampanga Delta Development Project (PDDP) conducted be-tween 1992 and 2002 increased the river's dis-charge capacity near the river mouth (JICA, 2011) (Fig. 8), deep inundation lasts until the fi-nal stage of the flood event. Occasional storm surges, cyclic sea water intrusion, and land subsid-ence effects aggravate flood situations in zone III and zone IV. Therefore, people in zone I and zone II have to beware of relatively strong flood flows or flash floods during the early to middle stages of flood events, whereas people in zone III and zone IV need to understand the risk of deeper and longer inundation during the middle to late flood event stages.
VI.Local lifestyles and future action against floods
1) Examples of local lifestyles coexisting with floods
As discussed so far, zone III and zone IV have a risk of longer and deeper inundation than other areas. In particular, municipalities such as Cand-aba and San Luis in zone III are exposed to ex-pansion of the Candaba Swamp without levees
711— —
(Fig. 7; Fig. 8). In addition, municipalities such as Calumpit and Masantol, located in the south of the Candaba Swamp in zone IV, can be damaged by severe floods, which would continue until the last stage of a flood event. The following results are derived from selected interviews in these municipalities, and explain the local awareness of flood risk, as well as the life-styles of coexisting with flood events. 1-1) Barangay San Agustin, Candaba mu-
nicipality Situated at the western edge of the Candaba Swamp, this site is the most flood-prone barangay (the smallest administrative unit of the Philip-
pines) in the municipality (Fig. 8-a). Since the whole barangay is inundated for 2–3 months every year, due to the expansion of the Candaba Swamp, most houses are stilted or have two stories (Fig. 9a). In addition, they are made of cemented con-crete blocks, with a galvanized iron roof. Rice farming is only possible in one period per year, between November and February, and, owing to the deep inundation, fishing is a major source of income. The houses facing Candaba Swamp are stilted with cement concrete pillars of approxi-mately 2.7 m. Although inundation of the 2011 flood reached up to around 2.5 m from the ground level, people in the area did not evacuate, and stayed indoors. 1-2) Barangay Pescadores, Candaba mu-
nicipality Barangay Pescadores is located southwest of barangay San Agustin (Fig. 8-b). The house we visited had a one-story structure, made of ce-mented concrete blocks and a galvanized iron roof. The house was also equipped with a small boat (Fig. 9b). At the time of the interview in July 2014, the house was almost empty because the family had already moved all their furniture and electric goods in preparation for the coming rainy season. They indicated that the inundation of the 2011 flooding event continued for 6 weeks, and it reached about 2.0 m above the ground level. This meant that the water level rose up to more than half the height of their 3.35 m high house. 1-3) Barangay San Juan, San Luis munici-
pality This barangay is located at a concave bank of the Pampanga River, and is affected by active bank erosion (Fig. 8-c). People living in a river-side area indicated that the maximum erosion rate is approximately 1 ft/yr (ca. 0.3 m/yr), and riverside land costs half as much as that along the main road (Fig. 9c). Near the Pampanga River, inundation lower than 2 m continued almost for a month during the 2011 flood. After the local road was improved and elevated, the first floors of the old roadside houses became lower than the road level. As a consequence, floodwater easily flows into the houses, and the drainage of this floodwa-ter is highly energy-consuming.
Fig. 8 Flow route changes and artificial constructions in the lower Pampanga River. Solid lines indicate the present and former channels, and the dashed lines show constructed levees. The locations of Fig. 9a, b, c and d are also indicated.

712— —
1-4) Barangay Bebe Anac, Masantol mu-nicipality
This barangay is situated around the meeting point of the Pampanga River and the Bebe-San Esteban Cut-off Channel (Fig. 8-d). Floodwaters easily overflow the dike on the both sides of the channel, and consequently head landwards during a large flood event. The area, mostly used for fish-ponds, is not only inundated between June and October (i.e., the rainy season) every year, but also affected by daily floods due to high-tide sea water intrusion (Fig. 9d). 2) Awareness of flood risks and basin de-
velopment As Larkin (1972) noted, the establishment of major municipalities in the province of Pampanga, such as Lubao, Macabebe, Sasmuan, Betis (con-solidated to Guagua), Guagua, Bacolor, Apalit,
Arayat, Candaba, Porac, and Masicu (present-day Mexico) (Fig. 7), dates back to the beginning of the Spanish period. They developed as trade hubs along the water route. Since then, locals have modified the alluvial plain into agricultural fields, and agricultural and urban land use have expanded rapidly since the 1950s (Himiyama and Abe, 2014), resulting in an extensive popula-tion growth (Fig. 10). Unlike in the past, when only a limited number of people lived traditional lifestyles along the riv-erside, more people and assets are now exposed to floods. Therefore, once a flood event occurs in the region, damages and losses will be larger (e.g., Table 3), and the region will need a long time to fully recover from the devastation. Furthermore, floods in populated areas may cause more unex-pected damage, since flood flow here is controlled
Fig. 9 Photographs of local communities in the lower Pampanga River basin. a: Stilt houses at the edge of the Candaba Swamp in barangay San Agustin, Candaba municipality (July, 2014); b: A house in barangay Pescadores, Candaba municipality, which is already emptied out by relocating valuable goods for the coming rainy season (July, 2014); c: Bank erosion ap-proaching a house in barangay San Juan, San Luis municipality (March, 2014); d: Daily inundation by a high tide north of the Bebe-San Esteban Cut-off Channel in barangay Bebe Anac, Masantol municipality (March, 2014). The locations of the barangays can be found in Fig. 8.

713— —
by artificial structures, rather than topographic concavity and convexity. However, our study suggests that the local awareness of inundation is somewhat different from what was expected. Particularly in the lower part of the plain, many local inhabitants did not evacuate during the 2011 flood, but stayed on their roofs for several weeks. In addition, some of them explained that even when the first floor of their houses was mostly inundated, there was no damage. This might be due to the relatively slow flow velocity, which combined with the flat charac-teristics of the plain, causes a gradual inundation. As a consequence, locals usually have plenty of time before heavy inundation occurs, which in-stills a fearlessness of floods. In addition, the in-habitants have been accustomed to cyclic inunda-tion, and have also benefitted from floods through rich fishery yields and other water resources. As discussed above, the alluvial plain of the Pampanga River basin is potentially vulnerable to floods, and the population is still increasing (Fig. 10). To reduce serious risks, while simultaneously coexisting with near-future flood events, govern-ment actions should be initiated to control unnec-essary urban sprawls and excessive ground water use. It is necessary for the locals to understand local geography and possible flood characteristics
of the area, and to be prepared for possible evac-uations. This is especially important for the flood-prone municipalities in the lower alluvial plain of the Pampanga River basin.
VII.Conclusion
We conducted a land classification and field surveys of the Pampanga River basin, and identi-fied zone-specific geographical characteristics and potential flood vulnerabilities. Heavy precipita-tion is concentrated seasonally, and floods are re-tained in the alluvial plain, which is narrowed by the mountain ranges and volcanoes. In addition, the poorly draining topography of the majority of the downstream part of the basin worsens the flood situation. The population of the basin is still increasing, and more people and assets are migrating to the alluvial plain. Continuous river basin manage-ment is therefore essential and extensive flood fighting measures are necessary, on the premise of understanding the local geographic characteristics. Further investigation will focus on the sedimen-tary sequences formed by the interaction between river-mediated sediment input and past sea level changes. This will shed light on the characteris-tics of river behavior in relation to the develop-ment history of the basin, and will contribute to assessing future climate change affected flood risks.
Acknowledgements We express sincere thanks to the members of the Philippine Atmospheric, Geophysical and Astronomical Services Administration (PAGASA) for their kind help and assistance during the field survey. We also thank the members of ICHARM, especially Dr. M. Ohara, Dr. B. Shrestha, and Ms. A. Juarez. We are also grateful to Prof. S. Kubo of Waseda University and Prof. T. Sugai of the University of Tokyo for their valuable comments. This manuscript benefited from constructive reviews by two anonymous reviewers and suggestions by editors.
References
Araya, S., Tsuchiya, K., Hara, Y. and Thaitakoo, D. (2013): Effects of urban development with landform transformation on flooding patterns in peri-urban Bangkok—Case of flood in 2011—. Journal of the City Planning Institute of Japan, 48, 783-788.
Fig. 10 Changes in national and provincial population. The original data and estimated populations of the Philippines in 2030 are sourced from the Philip-pine Statistics Authority. Future populations of the provinces of Bulacan, Pampanga and Nueva Ecija are roughly calculated by using the national popu-lation growth rate.

714— —
Ashida, K. and Okumura, T. (1974): Study on sedimen-tation in reservoirs. Disaster Prevention Research In-stitute Annuals B, 17, 555-570. (in Japanese with English abstract)
Gaillard, J.C., Delfin Jr., F.G., Dizon, E.Z., Larkin, J.A., Paz, V.J., Ramos, E.G., Remotigue, C.T., Rodolfo, K.S., Siringan, F.P., Soria, L.S. and Umbal, J.V. (2005): An-thropogenic dimension of the eruption of Mt. Pinatu-bo (Philippines) between 800 and 500 years BP. L'Anthoropologie, 109, 249-266. (in French with Eng-lish abstract)
Hara, Y. (2011): Flood damage in the eastern fringe of Metro Manila by 2009 tropical storm Ondoy in com-parison with the results of 2001 filed survey. Journal of Rural Planning Association, 30, 207-212. (in Japa-nese with English abstract)
Haruyama, S. (1990): Natural environment and people in the Philippines. Kasen, 123, 123-129. (in Japa-nese)*
Himiyama, Y. and Abe, K. (2014): Land use/cover change in the Central Luzon Plain and its surround-ings in the Philippines since the 1950s. Reports of the Taisetsuzan Institute of Science, 48, 9-26.
Hirano, S., Nakata, T. and Sangawa, A. (1986): Fault topography and Quaternary faulting along the Phil-ippine Fault zone, central Luzon, the Philippines. Journal of Geography (Chigaku Zasshi), 95, 1-23. (in Japanese with English abstract)
Hirose, N. and Inoue, K. (1999): Geomorphological changes and disaster after the eruption in the eastern slopes of Mt. Pinatubo, in central Luzon, Philippines. Transactions, Japanese Geomorphological Union, 20, 431-448. (in Japanese with English abstract)
Hirose, N., Inoue, K., Inoue, Y. and Ohata, H. (2003): Geomorphological changes and disasters after the eruption in the eastern slopes of Mt. Pinatubo, in cen-tral Luzon, Philippines. Nippon Koei Technical Forum, 11, 1-13. (in Japanese with English abstract)
Inoue, K., Ono, H., Watanabe, M., Oishi, M., Hirose, N. and Inoue, Y. (1994): Geomorphological changes after eruption of Mt. Pinatubo and the study on flood/mud-flow control works. Journal of the Japan Society of Erosion Control Engineering, 47(2), 52-62. (in Japa-nese with English abstract)
Inoue, Y. and Hirose, N. (2001): Sedimentation responses to large volumes of volcanic sediments in the eastern river basin of Mt. Pinatubo, Philippines. Annual Jour-nal of Hydraulic Engineering, 45, 709-714. (in Japa-nese with English abstract)
JICA (1982): Feasibility Report on the Pampanga Delta Development Project. Appendixes, Vol.1.
JICA (2000): Dams in the Philippines. National Water Resources Board.
JICA (2011): The Study on Integrated Water Resources Management for Poverty Alleviation and Economic De-velopment in the Pampanga River Basin in Republic of the Philippines, Final Report, Volume II: Main Report.
CTI Engineering International Co., Ltd., in association with Nippon Koei Co., Ltd.
Larkin, J.A. (1972): The Pampangas; Colonial Society in a Philippine Province. University of California Press.
Maeda, Y., Yokoyama, Y., Siringan, F.P. and Quina, G. (2009): Holocene relative sea-level fluctuations recorded in tidal notches along the pacific coast of northern Luzon, Philippines. Journal of Geography (Chigaku Zasshi), 118, 1284-1291. (in Japanese with English abstract)
Mines and Geosciences Bureau (2004): Geology and Mineral Resources of the Philippines, Vol.1 Geology, re-vised edition edited by Aurelio, M.A. and Peña, R.E., Department of Environment and Natural Resources.
Moriya, I. (2014): Evolution and classification of volcanic edifices on the Philippine Islands. Journal of Geogra-phy (Chigaku Zasshi), 123, 89-122. (in Japanese with English abstract)
Nagumo, N. and Kubo, S. (2013): 2011 flooding and flu-vial micro landforms in the Cambodian lower Mekong plain. E-journal GEO, 8, 141-152.
Nakata, T., Tsutsumi, H., Punongbayan, R.S., Rimando, R.E., Daligdig, J. and Daag, A. (1990): Surface faulting associated with the Philippine earthquake of 1990. Journal of Geography (Chigaku Zasshi), 99, 95-112. (in Japanese with English abstract)
National Disaster Coordinating Council (2009): Strength-ening Disaster Risk Reduction in the Philippines: Stra-tegic National Action Plan 2009–2019. Office of Civil Defence.
Nippon Koei (2009): Pinatubo Hazard Urgent Mitiga-tion Project–Phase III. Interim Report for Part II: Mon-itoring and Planning of Non-structure Measure and Institutional Capacity Building (ICAB), Main Report.
Okakawa, N. (1970): Geomorphological analyses of the central plain of Luzon in relation to the characteristics of soil sampling sites. Southeast Asian Studies, 8, 113-122. (in Japanese)
Okazumi, T., Miyamoto, M., Shrestha, B.B. and Gusyev, M. (2013): Uncertainty estimation during the process of flood risk assessment in developing countries—Case study in the Pampanga River basin—. Journal of Di-saster Research, 9, 69-77.
Pampanga River Basin Flood Forecasting and Warning Center (2011): PRFFWC Post-flood Report 2011–2, Event: Typhoons “Pedring” (Nesat) and “Quiel” (Nal-gae), September 26 to October 04, 2011. Philippine Atmospheric, Geophysical and Astronomical Services Administration.
Philippine Atmospheric, Geophysical and Astronomical Services Administration (2011): Climate Change in the Philippines. DOST-PAGASA Climatology and Ag-rometeorology Division.
Rodolfo, K.S. and Siringan, F.P. (2006): Global sea-level rise is recognised, but flooding from anthropogenic land subsidence is ignored around northern Manila Bay, Philippines. Disasters, 30, 118-139.

715— —
Shrestha, B.B., Okazumi, T., Miyamoto, M., Nabesaka, S., Tanaka, S. and Sugiura, A. (2014): Fundamental analysis for flood risk management in the selected riv-er basins of Southeast Asia. Journal of Disaster Re-search, 9, 858-869.
Shrestha, B.B., Okazumi, T., Miyamoto, M. and Sawano, H. (2015): Flood damage assessment in the Pampan-ga River basin of the Philippines. Journal of Flood Risk Management, doi: 10.1111/jfr3.12174.
Siringan, F.P. and Rodolfo, K.S. (2003): Relative sea level changes and worsening floods in the western Pampan-ga Delta: Causes and some possible mitigation mea-sures. Science Diliman, 15(2), 1-12.
Soria, J.L.A., Siringan, F.P. and Rodolfo, K.S. (2005): Compaction rates and paleo-sea levels along the delta complex north of Manila Bay, Luzon Island, Philip-pines. Science Diliman, 17(2), 39-45.
Tsutsumi, H. and Perez, J.S. (2013): Large-scale fault map of the Philippine fault based on aerial photo-graph interpretation. Active Fault Research, 39, 29-37.
Yamashita, N., Ohmoto, T. and Nishino, K. (2002): Func-tions of flood and sediment control effects of Candaba Swamp in Pampanga River basin in the Republic of the Philippines. Advances in River Engineering, 8, 389-394. (in Japanese with English abstract)
* Title etc. translated by N.N.

716— —
フィリピン・ルソン島中部パンパンガ川流域の
地形分類と洪水特性
南 雲 直 子* 澤 野 久 弥*
フィリピン共和国ルソン島で第二の流域面積をもつパンパンガ川流域は雨季の降雨や台風によって深刻な洪水の影響を毎年のように受けており,洪水被害の軽減が重要な課題である。そこで本研究では,地形や土地利用,過去の浸水履歴等に着目して,パンパンガ川流域の洪水特性や地域の洪水脆弱性を明らかにすることを目指した。地形分類図によれば,流域の地形は大きく山地・丘陵,火山,平野に分類され,山地・丘陵は山地,丘陵に,火山は火山斜面,火山山麓緩斜面,火山扇状地に,そして沖積平野は扇状地,段丘,後背湿地,湿地,三角州,谷底低地,自然堤防,メアンダースクロール,旧河道に階層区分された。平野北部のパンパンガ川西側では,フィリピン断層の活動に起因すると考えられる北部山地からの土砂供給によって扇状地と台地が南西方向によく発達する一方,東側では西方向へと台地が発達する。また,平野は山地,丘陵,火山に囲まれており,アラヤット付近で幅 20 km程度まで狭くなるため,上流からの洪水が停滞し,サンアントニオ湿地とカンダバ湿地を形成する。そして平野南部で
は,非常に緩い河川勾配と地盤沈下,潮汐の作用による海水の侵入によって,カンダバ湿地を経て南下してきた洪水が排水されにくく,洪水は深刻化する傾向にある。このような地理的条件から想定される洪水様式をもとに,平野部を zone Iから zone IVに区分した。上流側のパンパンガ川西側及び東側にそれぞれ位置する zone Iと zone II
は比較的排水がはやい。一方,カンダバ湿地付近より南部に位置する洪水脆弱地域(zone III,zone IV)は,農漁業生産において周期的な洪水による恩恵を受けていると同時に,家屋の浸水被害も大きい。しかし,住民は 2011年に発生した近年最大の洪水時であっても自宅から避難しない等,洪水を恐れず,共存しながら生活を営んでいる。今後も平野部では人口増が見込まれることから,行政主導の事前の洪水対策を進めていくと同時に,効果的な対策を進めながら洪水に適応した暮らしが維持できるよう,住民それぞれが地域の地理的環境や洪水脆弱性を理解しておく必要がある。
キーワード:パンパンガ川,地形分類,沖積平野,洪水特性,洪水脆弱性
* 国立研究開発法人土木研究所水災害・リスクマネジメント国際センター


![.Noah's Flood WTJ2004[1]](https://static.fdokumen.com/doc/165x107/631c39e73e8acd997705cf6b/noahs-flood-wtj20041.jpg)


