Lagrangian Sampling for Emerging Contaminants Through an Urban Stream Corridor in Colorado
15
LAGRANGIAN SAMPLING FOR EMERGING CONTAMINANTS THROUGH AN URBAN STREAM CORRIDOR IN COLORADO 1 Juliane B. Brown, William A. Battaglin, and Robert E. Zuellig 2 ABSTRACT: Recent national concerns regarding the environmental occurrence of emerging contaminants (ECs) have catalyzed a series of recent studies. Many ECs are released into the environment through discharges from wastewater treatment plants (WWTPs) and other sources. In 2005, the U.S. Geological Survey and the City of Longmont initiated an investigation of selected ECs in a 13.8-km reach of St. Vrain Creek, Colorado. Seven sites were sampled for ECs following a Lagrangian design; sites were located upstream, downstream, and in the out- fall of the Longmont WWTP, and at the mouths of two tributaries, Left Hand Creek and Boulder Creek (which is influenced by multiple WWTP outfalls). Samples for 61 ECs in 16 chemical use categories were analyzed and 36 were detected in one or more samples. Of these, 16 have known or suspected endocrine-disrupting potential. At and downstream from the WWTP outfall, detergent metabolites, fire retardants, and steroids were detected at the highest concentrations, which commonly exceeded 1 lg ⁄ l in 2005 and 2 lg ⁄ l in 2006. Most individual ECs were measured at concentrations less than 2 lg ⁄ l. The results indicate that outfalls from WWTPs are the largest but may not be the sole source of ECs in St. Vrain Creek. In 2005, high discharge was associated with fewer EC detections, lower total EC concentrations, and smaller EC loads in St. Vrain Creek and its tributaries as com- pared with 2006. EC behavior differed by individual compound, and some differences between sites could be attributed to analytical variability or to other factors such as physical or chemical characteristics or distance from contributing sources. Loads of some ECs, such as diethoxynonylphenol, accumulated or attenuated depend- ing on location, discharge, and distance downstream from the WWTP, whereas others, such as bisphenol A, were largely conservative. The extent to which ECs in St. Vrain Creek affect native fish species and macroinverte- brate communities is unknown, but recent studies have shown that fish respond to very low concentrations of ECs, and further study on the fate and transport of these contaminants in the aquatic environment is warranted. (KEY TERMS: emerging contaminants; St. Vrain Creek; Lagrangian sampling; water quality; wastewater treat- ment plant; urban stream corridor; attenuation; analytical variability.) Brown, Juliane B., William A. Battaglin, and Robert E. Zuellig, 2009. Lagrangian Sampling for Emerging Con- taminants Through an Urban Stream Corridor in Colorado. Journal of the American Water Resources Associa- tion (JAWRA) 45(1):68-82. DOI: 10.1111 ⁄ j.1752-1688.2008.00290.x 1 Paper No. JAWRA-07-0182-P of the Journal of the American Water Resources Association (JAWRA). Received December 19, 2007; accepted August 1, 2008. ª 2008 American Water Resources Association. Discussions are open until August 1, 2009. 2 Respectively, Hydrologist and Research Hydrologist (Brown and Battaglin), U.S. Geological Survey, Colorado Water Science Center, Den- ver Federal Center, MS 415, Lakewood, Colorado 80225; and Aquatic Ecologist (Zuellig), U.S. Geological Survey, Fort Collins Science Center, 2150 Centre Avenue, Building C, Fort Collins, Colorado 80526 (E-Mail ⁄ Brown: [email protected]). JAWRA 68 JOURNAL OF THE AMERICAN WATER RESOURCES ASSOCIATION JOURNAL OF THE AMERICAN WATER RESOURCES ASSOCIATION Vol. 45, No. 1 AMERICAN WATER RESOURCES ASSOCIATION February 2009
Transcript of Lagrangian Sampling for Emerging Contaminants Through an Urban Stream Corridor in Colorado
LAGRANGIAN SAMPLING FOR EMERGING CONTAMINANTS THROUGHAN URBAN STREAM CORRIDOR IN COLORADO1
Juliane B. Brown, William A. Battaglin, and Robert E. Zuellig2
ABSTRACT: Recent national concerns regarding the environmental occurrence of emerging contaminants (ECs)have catalyzed a series of recent studies. Many ECs are released into the environment through discharges fromwastewater treatment plants (WWTPs) and other sources. In 2005, the U.S. Geological Survey and the City ofLongmont initiated an investigation of selected ECs in a 13.8-km reach of St. Vrain Creek, Colorado. Seven siteswere sampled for ECs following a Lagrangian design; sites were located upstream, downstream, and in the out-fall of the Longmont WWTP, and at the mouths of two tributaries, Left Hand Creek and Boulder Creek (whichis influenced by multiple WWTP outfalls). Samples for 61 ECs in 16 chemical use categories were analyzed and36 were detected in one or more samples. Of these, 16 have known or suspected endocrine-disrupting potential.At and downstream from the WWTP outfall, detergent metabolites, fire retardants, and steroids were detectedat the highest concentrations, which commonly exceeded 1 lg ⁄ l in 2005 and 2 lg ⁄ l in 2006. Most individual ECswere measured at concentrations less than 2 lg ⁄ l. The results indicate that outfalls from WWTPs are the largestbut may not be the sole source of ECs in St. Vrain Creek. In 2005, high discharge was associated with fewer ECdetections, lower total EC concentrations, and smaller EC loads in St. Vrain Creek and its tributaries as com-pared with 2006. EC behavior differed by individual compound, and some differences between sites could beattributed to analytical variability or to other factors such as physical or chemical characteristics or distancefrom contributing sources. Loads of some ECs, such as diethoxynonylphenol, accumulated or attenuated depend-ing on location, discharge, and distance downstream from the WWTP, whereas others, such as bisphenol A, werelargely conservative. The extent to which ECs in St. Vrain Creek affect native fish species and macroinverte-brate communities is unknown, but recent studies have shown that fish respond to very low concentrationsof ECs, and further study on the fate and transport of these contaminants in the aquatic environment iswarranted.
(KEY TERMS: emerging contaminants; St. Vrain Creek; Lagrangian sampling; water quality; wastewater treat-ment plant; urban stream corridor; attenuation; analytical variability.)
Brown, Juliane B., William A. Battaglin, and Robert E. Zuellig, 2009. Lagrangian Sampling for Emerging Con-taminants Through an Urban Stream Corridor in Colorado. Journal of the American Water Resources Associa-tion (JAWRA) 45(1):68-82. DOI: 10.1111 ⁄ j.1752-1688.2008.00290.x
1Paper No. JAWRA-07-0182-P of the Journal of the American Water Resources Association (JAWRA). Received December 19, 2007;accepted August 1, 2008. ª 2008 American Water Resources Association. Discussions are open until August 1, 2009.
2Respectively, Hydrologist and Research Hydrologist (Brown and Battaglin), U.S. Geological Survey, Colorado Water Science Center, Den-ver Federal Center, MS 415, Lakewood, Colorado 80225; and Aquatic Ecologist (Zuellig), U.S. Geological Survey, Fort Collins Science Center,2150 Centre Avenue, Building C, Fort Collins, Colorado 80526 (E-Mail ⁄ Brown: [email protected]).
JAWRA 68 JOURNAL OF THE AMERICAN WATER RESOURCES ASSOCIATION
JOURNAL OF THE AMERICAN WATER RESOURCES ASSOCIATION
Vol. 45, No. 1 AMERICAN WATER RESOURCES ASSOCIATION February 2009
INTRODUCTION
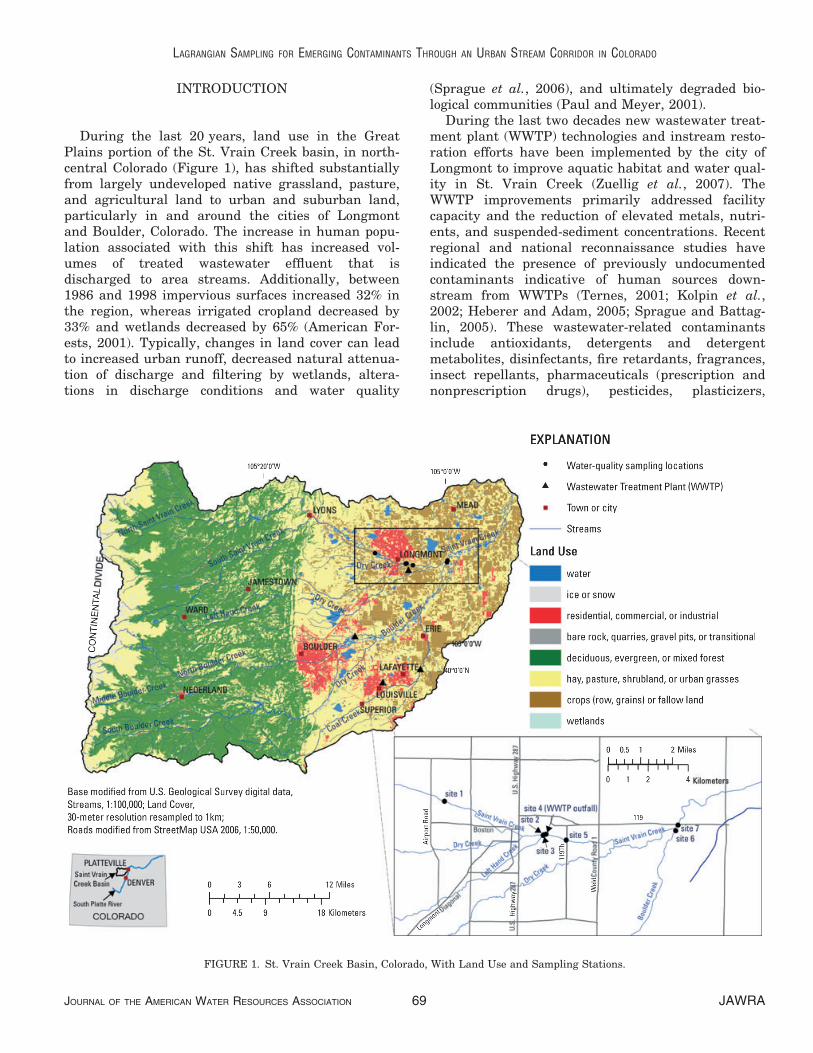
During the last 20 years, land use in the GreatPlains portion of the St. Vrain Creek basin, in north-central Colorado (Figure 1), has shifted substantiallyfrom largely undeveloped native grassland, pasture,and agricultural land to urban and suburban land,particularly in and around the cities of Longmontand Boulder, Colorado. The increase in human popu-lation associated with this shift has increased vol-umes of treated wastewater effluent that isdischarged to area streams. Additionally, between1986 and 1998 impervious surfaces increased 32% inthe region, whereas irrigated cropland decreased by33% and wetlands decreased by 65% (American For-ests, 2001). Typically, changes in land cover can leadto increased urban runoff, decreased natural attenua-tion of discharge and filtering by wetlands, altera-tions in discharge conditions and water quality
(Sprague et al., 2006), and ultimately degraded bio-logical communities (Paul and Meyer, 2001).
During the last two decades new wastewater treat-ment plant (WWTP) technologies and instream resto-ration efforts have been implemented by the city ofLongmont to improve aquatic habitat and water qual-ity in St. Vrain Creek (Zuellig et al., 2007). TheWWTP improvements primarily addressed facilitycapacity and the reduction of elevated metals, nutri-ents, and suspended-sediment concentrations. Recentregional and national reconnaissance studies haveindicated the presence of previously undocumentedcontaminants indicative of human sources down-stream from WWTPs (Ternes, 2001; Kolpin et al.,2002; Heberer and Adam, 2005; Sprague and Battag-lin, 2005). These wastewater-related contaminantsinclude antioxidants, detergents and detergentmetabolites, disinfectants, fire retardants, fragrances,insect repellants, pharmaceuticals (prescription andnonprescription drugs), pesticides, plasticizers,
FIGURE 1. St. Vrain Creek Basin, Colorado, With Land Use and Sampling Stations.
LAGRANGIAN SAMPLING FOR EMERGING CONTAMINANTS THROUGH AN URBAN STREAM CORRIDOR IN COLORADO
JOURNAL OF THE AMERICAN WATER RESOURCES ASSOCIATION 69 JAWRA

polycyclic aromatic hydrocarbons, and steroidal com-pounds and are referred to hereafter as ‘‘emergingcontaminants’’ (ECs). ECs can be released to theaquatic environment through industrial and munici-pal wastewater discharges, storm drains, agriculturaland urban runoff, and individual or multi-facilitysewage disposal systems. Until recently, the extent towhich these contaminants occurred in the aquaticenvironment was not well known and the toxicologi-cal ramifications with regard to humans or wildlifewere largely unknown (Daughton, 2001). However,recent studies have shown that exposure to someECs, even at very low concentrations, can result inendocrine disruption and histological and immunolog-ical alterations in wildlife and humans (Colbornet al., 1993; McLachlan, 2001; Petrovic et al., 2002;Hoger, 2003; Bernet et al., 2004; Hoeger et al., 2004;Arslan et al., 2007). Identifying the occurrence, distri-bution, and fate of ECs in urban streams will aidcommunities in addressing source-control and reduc-tion efforts to safeguard human and aquatic health.
In this paper we describe the occurrence and trans-port of selected ECs in St. Vrain Creek through thecity of Longmont under two different hydrologic con-ditions. Stream samples were collected during thetwo events by using a longitudinal Lagrangian sam-pling design. Dye tracer studies conducted just priorto each sampling event were used to estimate traveltimes during each event. Discharge and field mea-surements were collected and water samples wereanalyzed by the U.S. Geological Survey (USGS)National Water Quality Laboratory (NWQL) for aseries of ECs that are indicative of wastewater byusing methods described in Zaugg et al. (2002).
Study Area and Site Selection
St. Vrain Creek flows east from sources along theeast side of the Continental Divide and eventuallyjoins the South Platte River, in north-central Colo-rado (Figure 1). The main mountainous headwaterstreams, North and South St. Vrain Creeks, are pri-marily forested until they converge downstream nearthe town of Lyons to form St. Vrain Creek. Down-stream from Lyons, St. Vrain Creek primarily flowsthrough grassland, pastures, and agricultural areasand the city of Longmont on its way to the confluencewith the South Platte River.
Seven sites were selected for water-chemistry sam-pling along a 13.8-kilometer (km) reach of the St.Vrain Creek within the city of Longmont: two sitesupstream from the Longmont WWTP outfall (Sites 1and 2); two sites at the mouths of key tributaries,Left Hand Creek and Boulder Creek (Sites 3 and 6);one site at the Longmont WWTP outfall (Site 4); and
two sites on St. Vrain Creek downstream from theWWTP outfall (Sites 5 and 7) (Figure 1). The mostupstream site (Site 1) is located at the western edgeof Longmont just east (downstream) from AirportRoad, and it represents the upstream, primarily non-urban inputs to the creek before it enters the Long-mont area. This site is influenced by the small townof Lyons approximately 13.2 km upstream and thesurrounding agricultural community. Site 2 isapproximately 5.8 km downstream from Site 1 andimmediately upstream from the Longmont WWTPoutfall; it represents inputs from the urban and agri-cultural areas before the input of treated wastewatereffluent. Left Hand Creek (Site 3) is one of the twolargest tributaries entering St. Vrain Creek in thestudy reach. Left Hand Creek enters St. Vrain Creekjust upstream from the Longmont WWTP outfall; it isinfluenced by the upstream communities of James-town and Ward, some historical mining, and subur-ban development and agricultural activities aroundLongmont. Site 4 is the WWTP outfall and the flow iscomposed of treated wastewater effluent from theCity of Longmont Water and Wastewater Depart-ment. Site 5 is approximately 1 km downstream fromthe Longmont WWTP outfall and represents the inte-gration of the WWTP effluent and St. Vrain Creek(tributaries do not intervene between the outfall andthis site). Boulder Creek (Site 6) is the other majortributary and it enters St. Vrain Creek approximately7.5 km downstream from the Longmont WWTP out-fall and is influenced by upstream operations ofBarker Dam, the town of Nederland, historicalmining, and WWTP inflows from the urban areas ofBoulder, Superior, Louisville, Lafayette, and Erie,and by the surrounding suburban and agriculturalland. The WWTP for Boulder is approximately 23 kmupstream from Site 6. Site 7 is just downstream fromthe confluence of Boulder Creek, approximately7.9 km downstream from the Longmont WWTP andapproximately 72.6 km from the confluence with theSouth Platte River.
Data Collection
A Lagrangian sampling design, which follows thesame parcel of water as it moves downstream, wasused for each sampling event (Zuellig et al., 2007).Tracer tests with Rhodamine-WT dye were used todetermine the time-of-travel between sample-collec-tion sites (Kilpatrick and Wilson, 1989). For thisstudy, time-of-travel was defined as ‘‘the amount ofelapsed time for the dye peak to travel between twomonitoring sites’’ (Zuellig et al., 2007). Travel-timeestimates were made 9 and 15 days prior to the dateof sample collection in April 2005 and March 2006,
BROWN, BATTAGLIN, AND ZUELLIG
JAWRA 70 JOURNAL OF THE AMERICAN WATER RESOURCES ASSOCIATION

respectively. Minor adjustments were made to thedye travel-time estimates to account for differences inflow conditions during the times of sample collection(Zuellig et al., 2007). In 2005, under higher flow con-ditions than in 2006, times of travel were estimatedas 345 min between Sites 1 and 2, 65 min betweenSites 2 and 5, and 235 min between Sites 5 and 7. In2006, times of travel were estimated as 825 minbetween Sites 1 and 2, 45 min between Sites 2 and 5,and 290 min between Sites 5 and 7. Stream velocityand travel times can increase or decrease duringlower flow conditions depending on stream channelmorphology. Uncertainty in the estimates of traveltime can be introduced by errors in the measurementof dye concentrations.
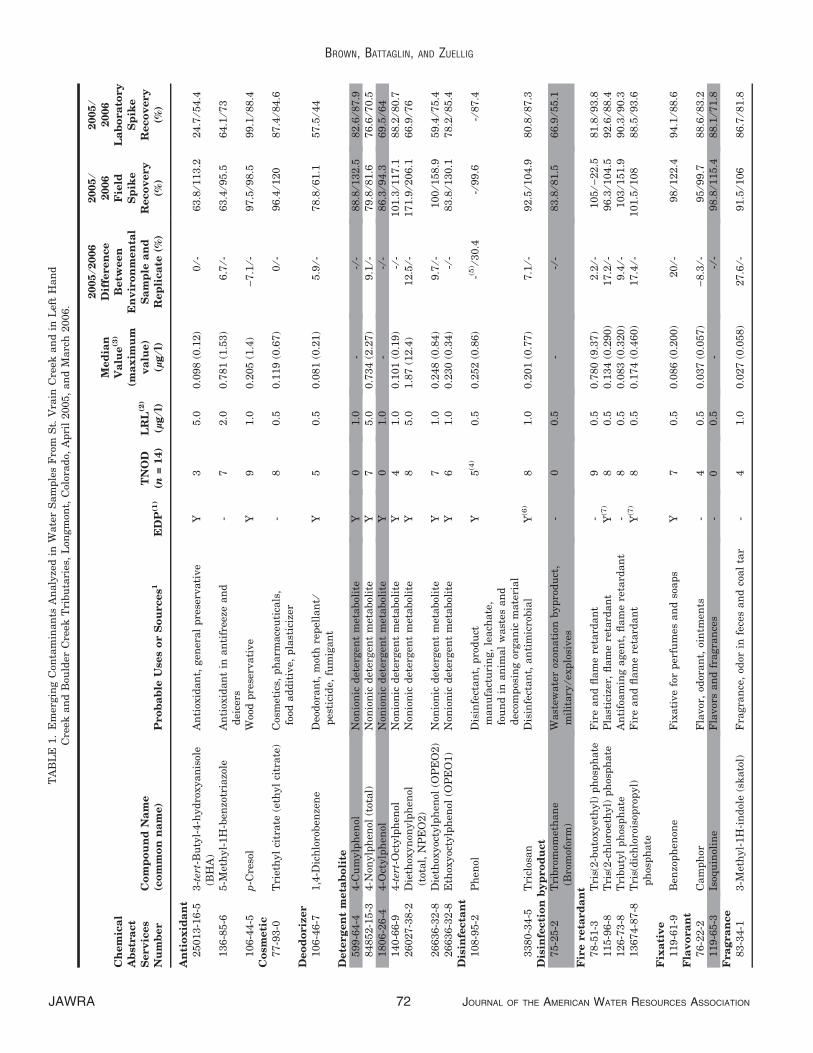
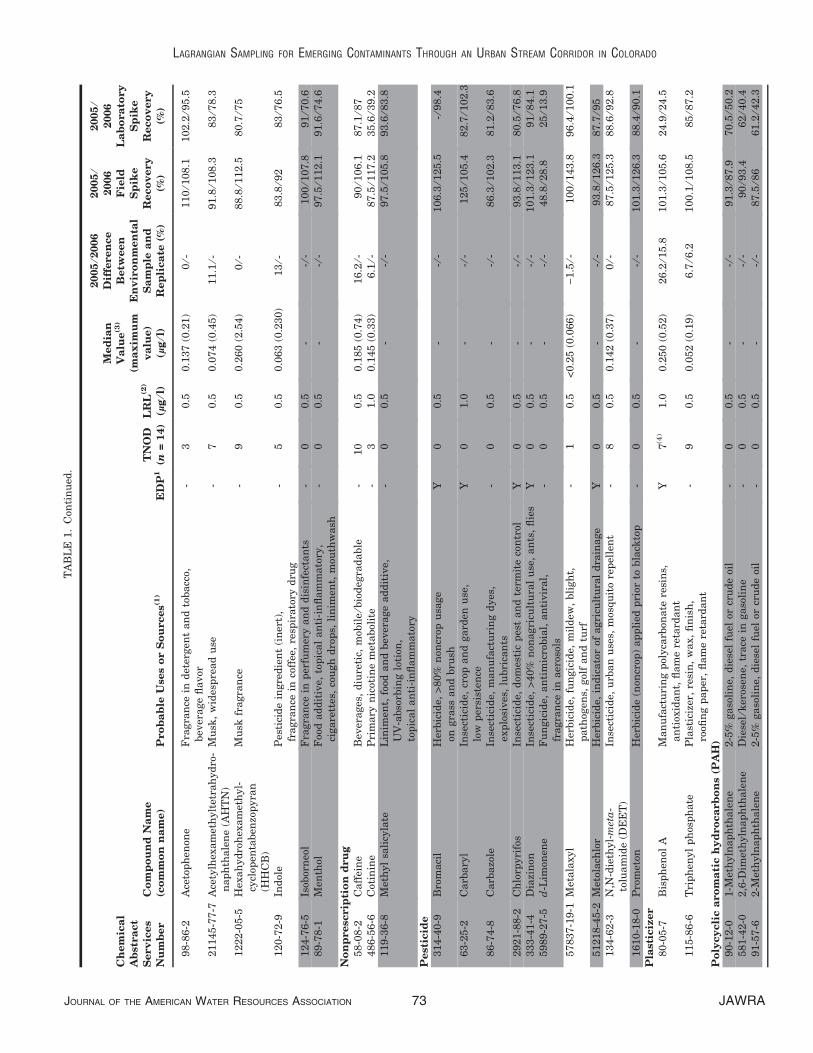
Stream samples analyzed for ECs were collected atspecific times calculated from the travel-time datausing standardized depth- and width-integrating tech-niques and processed and preserved on-site usingmethods described in the USGS National Field Manual(variously dated). Samples were analyzed by the USGSNWQL for 61 ECs (Table 1) according to methodsdescribed in Zaugg et al. (2002). Field measurements,including dissolved oxygen, pH, specific conductance,water temperature, and discharge, were obtained atthe time of sample collection. The complete dataset ispresented in Zuellig et al. (2007). Most of the 61 ECsare commercially synthesized compounds or their deg-radation products, but a few such as phenol, skatol,and the steroids can originate from natural sources.
The analytical results consisted of unqualified con-centrations, E coded (or estimated) concentrations,and nondetections [reported as less than the labora-tory reporting level (LRL) for the particular com-pound]. Estimated concentrations include those thatare below or above the calibration curve, concentra-tions for compounds with average recoveries that areless than 60%, or concentrations of compounds rou-tinely detected in laboratory blanks (Furlong et al.,2001). Both unqualified concentrations and E codedconcentrations are used in the calculation of sum-mary statistics (Table 1) and contaminant loads(Tables 2 and 3).
Quality Control and Quality Assessment
Quality-control samples were collected as part ofthis study, including one field blank, one replicate,and one laboratory spike during each sampling event.In 2005, phenol was detected in the field blank andin 2006 methyl salicylate and naphthalene weredetected in the field blank. All phenol results for2005 and naphthalene results for 2006 were consid-ered contaminated. Results for methyl salicylate anal-yses were qualified as acceptable because all results
were nondetectable and the estimated value in theblank (0.0170 lg ⁄ l) was much smaller than the LRL(<0.5 lg ⁄ l). To facilitate between-year comparisons,no phenol or naphthalene results were further ana-lyzed as part of this study, though the summary dataare included in Table 1 for reference.
In 2005, percent difference between environmentaland replicate samples ranged from 0 to 57.5% withan overall median percent difference of 9.1 for the 31detected ECs, excluding phenol (Table 1). In 2006,percent difference between environmental and repli-cate samples ranged from 6.2 to 30.4% with an over-all median percent difference of 15.8 for the threedetected ECs, excluding naphthalene (Table 1).
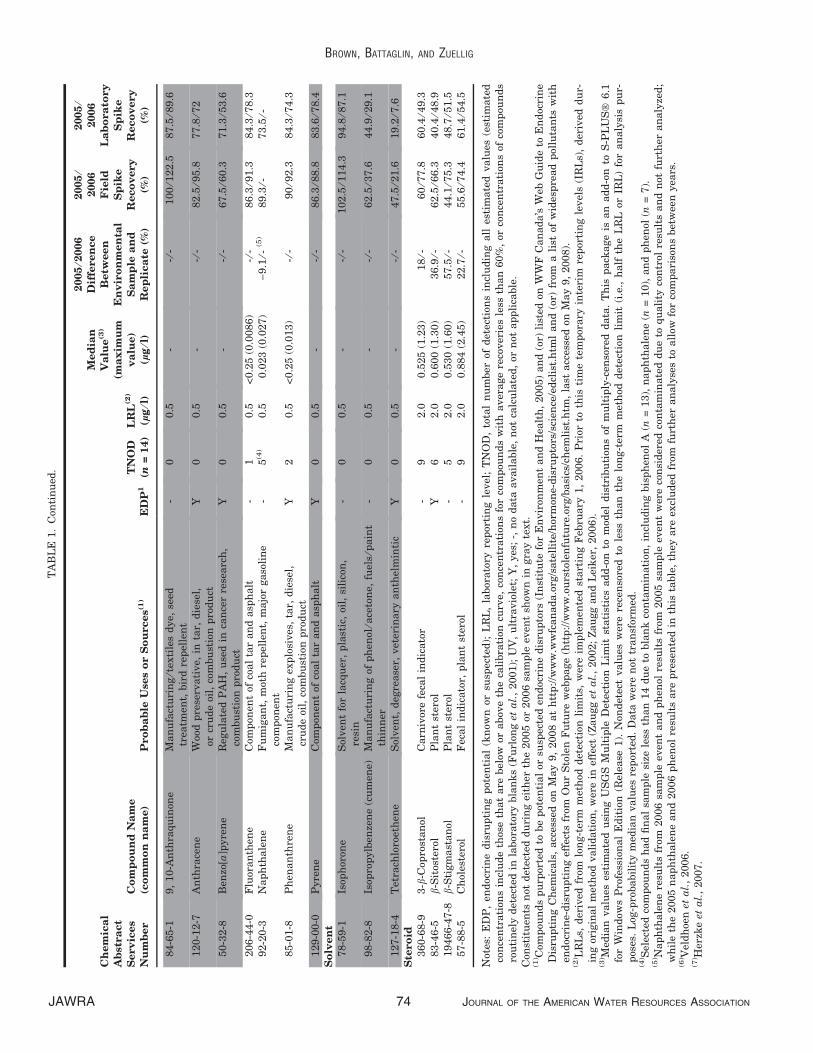
Field and laboratory spike recovery data for the ECsadded to environmental sample water and laboratoryreagent water at known concentrations are shown inTable 1. Percent recoveries are determined by dividingthe measured concentration in the environmental orlaboratory sample by the known concentration in theadded spike solution. Greater than 60% of most con-stituents (57 of 61) were recovered for the field or labo-ratory spikes for one or both sampling events. Onlyfour constituents, b-stigmastanol, d-limonene, isopro-pylbenzene, and tetrachloroethylene, had environmen-tal and laboratory spike recoveries less than 60% forone or both sampling events, indicating generally poorrecovery and increased uncertainty in quantification.Of these four constituents, only b-stigmastanol wasdetected in an environmental sample. For the 2005event, field spike recoveries ranged from 44.1 to171.9% and laboratory recoveries ranged from 19.2 to102.2% with overall mean and median recoveries of75.3 and 82.7%, respectively. For the 2006 event, fieldspike recoveries ranged from )22.5 to 206.1% and thelaboratory recoveries ranged from 7.6 to 102.3% withoverall mean and median recoveries of 72.2 and 78.3%,respectively. The relatively wide range of recoveries isnot atypical for analysis of these types of compounds(Lee et al., 2004).
Differences between paired environmental and rep-licate samples and field and laboratory spike recover-ies could be attributed to analytical variability,contamination in the environmental sample, contami-nation of the spike solution, or variability in recover-ies owing to differences in physical or chemicalproperties of the ECs (Zaugg and Leiker, 2006).
RESULTS
Of the 61 ECs analyzed for, 36 were detected inone or more samples (Table 1); two of these ECs(naphthalene and phenol) were excluded from further
LAGRANGIAN SAMPLING FOR EMERGING CONTAMINANTS THROUGH AN URBAN STREAM CORRIDOR IN COLORADO
JOURNAL OF THE AMERICAN WATER RESOURCES ASSOCIATION 71 JAWRA
TA
BL
E1.
Em
ergin
gC
onta
min
an
tsA
naly
zed
inW
ate
rS
am
ple
sF
rom
St.
Vra
inC
reek
an
din
Lef
tH
an
dC
reek
an
dB
ould
erC
reek
Tri
bu
tari
es,
Lon
gm
ont,
Col
orad
o,A
pri
l2005,
an
dM
arc
h2006.
Ch
em
ica
lA
bst
ra
ct
Serv
ices
Nu
mb
er
Co
mp
ou
nd
Na
me
(co
mm
on
na
me)
Pro
ba
ble
Use
so
rS
ou
rces1
ED
P(1
)T
NO
D(n
=14)
LR
L(2
)
(lg
⁄l)
Med
ian
Va
lue
(3)
(ma
xim
um
va
lue)
(lg
⁄l)
2005
⁄2006
Dif
feren
ce
Betw
een
En
vir
on
men
tal
Sa
mp
lea
nd
Rep
lica
te(%
)
2005
⁄2006
Fie
ldS
pik
eR
eco
very
(%)
2005
⁄2006
La
bo
ra
tory
Sp
ike
Reco
very
(%)
An
tio
xid
an
t25013-1
6-5
3-t
ert-
Bu
tyl-
4-h
yd
roxyan
isol
e(B
HA
)A
nti
oxid
an
t,gen
eral
pre
serv
ati
ve
Y3
5.0
0.0
98
(0.1
2)
0⁄-
63.8
⁄113.2
24.7
⁄54.4
136-8
5-6
5-M
eth
yl-
1H
-ben
zotr
iazo
leA
nti
oxid
an
tin
an
tifr
eeze
an
dd
eice
rs-
72.0
0.7
81
(1.5
3)
6.7
⁄-63.4
⁄95.5
64.1
⁄73
106-4
4-5
p-C
reso
lW
ood
pre
serv
ati
ve
Y9
1.0
0.2
05
(1.4
))
7.1
⁄-97.5
⁄98.5
99.1
⁄88.4
Co
smeti
c77-9
3-0
Tri
eth
yl
citr
ate
(eth
yl
citr
ate
)C
osm
etic
s,p
harm
ace
uti
cals
,fo
odad
dit
ive,
pla
stic
izer
-8
0.5
0.1
19
(0.6
7)
0⁄-
96.4
⁄120
87.4
⁄84.6
Deo
do
riz
er
106-4
6-7
1,4
-Dic
hlo
roben
zen
eD
eod
oran
t,m
oth
rep
ella
nt
⁄p
esti
cid
e,fu
mig
an
tY
50.5
0.0
81
(0.2
1)
5.9
⁄-78.8
⁄61.1
57.5
⁄44
Dete
rg
en
tm
eta
bo
lite
599-6
4-4
4-C
um
ylp
hen
olN
onio
nic
det
ergen
tm
etabol
ite
Y0
1.0
--
⁄-88.8
⁄132.5
82.6
⁄87.9
84852-1
5-3
4-N
onylp
hen
ol(t
otal)
Non
ion
icd
eter
gen
tm
etabol
ite
Y7
5.0
0.7
34
(2.2
7)
9.1
⁄-79.8
⁄81.6
76.6
⁄70.5
1806-2
6-4
4-O
ctylp
hen
olN
onio
nic
det
ergen
tm
etabol
ite
Y0
1.0
--
⁄ -86.3
⁄94.3
69.5
⁄64
140-6
6-9
4-t
ert-
Oct
ylp
hen
olN
onio
nic
det
ergen
tm
etabol
ite
Y4
1.0
0.1
01
(0.1
9)
-⁄-
101.3
⁄117.1
88.2
⁄80.7
26027-3
8-2
Die
thox
yn
onylp
hen
ol(t
otal,
NP
EO
2)
Non
ion
icd
eter
gen
tm
etabol
ite
Y8
5.0
1.8
7(1
2.4
)12.5
⁄-171.9
⁄206.1
66.9
⁄76
26636-3
2-8
Die
thox
yoc
tylp
hen
ol(O
PE
O2)
Non
ion
icd
eter
gen
tm
etabol
ite
Y7
1.0
0.2
48
(0.8
4)
9.7
⁄-100
⁄158.9
59.4
⁄75.4
26636-3
2-8
Eth
oxyoc
tylp
hen
ol(O
PE
O1)
Non
ion
icd
eter
gen
tm
etabol
ite
Y6
1.0
0.2
30
(0.3
4)
-⁄-
83.8
⁄130.1
78.2
⁄85.4
Dis
infe
cta
nt
108-9
5-2
Ph
enol
Dis
infe
ctan
t,p
rod
uct
man
ufa
ctu
rin
g,
leach
ate
,fo
un
din
an
imal
wast
esan
dd
ecom
pos
ing
organ
icm
ate
rial
Y5
(4)
0.5
0.2
52
(0.8
6)
-(5)⁄3
0.4
-⁄9
9.6
-⁄8
7.4
3380-3
4-5
Tri
clos
an
Dis
infe
ctan
t,an
tim
icro
bia
lY
(6)
81.0
0.2
01
(0.7
7)
7.1
⁄-92.5
⁄104.9
80.8
⁄87.3
Dis
infe
cti
on
by
pro
du
ct
75-2
5-2
Tri
bro
mom
eth
an
e(B
rom
ofor
m)
Wast
ewate
roz
onati
onbyp
rod
uct
,m
ilit
ary
⁄exp
losi
ves
-0
0.5
--
⁄-83.8
⁄81.5
66.9
⁄55.1
Fir
ereta
rd
an
t78-5
1-3
Tri
s(2-b
uto
xyet
hyl)
ph
osp
hate
Fir
ean
dfl
am
ere
tard
an
t-
90.5
0.7
80
(9.3
7)
2.2
⁄-105
⁄)22.5
81.8
⁄93.8
115-9
6-8
Tri
s(2-c
hlo
roet
hyl)
ph
osp
hate
Pla
stic
izer
,fl
am
ere
tard
an
tY
(7)
80.5
0.1
34
(0.2
90)
17.2
⁄-96.3
⁄104.5
92.6
⁄88.4
126-7
3-8
Tri
bu
tyl
ph
osp
hate
An
tifo
am
ing
agen
t,fl
am
ere
tard
an
t-
80.5
0.0
83
(0.3
20)
9.4
⁄-103
⁄151.9
90.3
⁄90.3
13674-8
7-8
Tri
s(d
ich
loro
isop
rop
yl)
ph
osp
hate
Fir
ean
dfl
am
ere
tard
an
tY
(7)
80.5
0.1
74
(0.4
60)
17.4
⁄-101.5
⁄108
88.5
⁄93.6
Fix
ati
ve
119-6
1-9
Ben
zop
hen
one
Fix
ati
ve
for
per
fum
esan
dso
ap
sY
70.5
0.0
86
(0.2
00)
20
⁄-98
⁄122.4
94.1
⁄88.6
Fla
vo
ra
nt
76-2
2-2
Cam
ph
orF
lavor
,od
oran
t,oi
ntm
ents
-4
0.5
0.0
37
(0.0
57)
)8.3
⁄-95
⁄99.7
88.6
⁄83.2
119-6
5-3
Isoq
uin
olin
eF
lavor
san
dfr
agra
nce
s-
00.5
--
⁄-98.8
⁄115.4
88.1
⁄71.8
Fra
gra
nce
83-3
4-1
3-M
eth
yl-
1H
-in
dol
e(s
kato
l)F
ragra
nce
,od
orin
fece
san
dco
al
tar
-4
1.0
0.0
27
(0.0
58)
27.6
⁄-91.5
⁄106
86.7
⁄81.8
BROWN, BATTAGLIN, AND ZUELLIG
JAWRA 72 JOURNAL OF THE AMERICAN WATER RESOURCES ASSOCIATION
TA
BL
E1.
Con
tin
ued
.
Ch
em
ica
lA
bst
ra
ct
Serv
ices
Nu
mb
er
Co
mp
ou
nd
Na
me
(co
mm
on
na
me)
Pro
ba
ble
Use
so
rS
ou
rces(1
)E
DP
1T
NO
D(n
=14)
LR
L(2
)
(lg
⁄l)
Med
ian
Va
lue
(3)
(ma
xim
um
va
lue)
(lg
⁄l)
2005
⁄2006
Dif
feren
ce
Betw
een
En
vir
on
men
tal
Sa
mp
lea
nd
Rep
lica
te(%
)
2005
⁄2006
Fie
ldS
pik
eR
eco
very
(%)
2005
⁄2006
La
bo
ra
tory
Sp
ike
Reco
very
(%)
98-8
6-2
Ace
top
hen
one
Fra
gra
nce
ind
eter
gen
tan
dto
bacc
o,bev
erage
flavor
-3
0.5
0.1
37
(0.2
1)
0⁄-
110
⁄108.1
102.2
⁄95.5
21145-7
7-7
Ace
tylh
exam
eth
ylt
etra
hyd
ro-
nap
hth
ale
ne
(AH
TN
)M
usk
,w
ides
pre
ad
use
-7
0.5
0.0
74
(0.4
5)
11.1
⁄-91.8
⁄108.3
83
⁄78.3
1222-0
5-5
Hex
ah
yd
roh
exam
eth
yl-
cycl
open
taben
zop
yra
n(H
HC
B)
Mu
skfr
agra
nce
-9
0.5
0.2
60
(2.5
4)
0⁄-
88.8
⁄112.5
80.7
⁄75
120-7
2-9
Ind
ole
Pes
tici
de
ingre
die
nt
(in
ert)
,fr
agra
nce
inco
ffee
,re
spir
ato
ryd
rug
-5
0.5
0.0
63
(0.2
30)
13
⁄-83.8
⁄92
83
⁄76.5
124-7
6-5
Isob
orn
eol
Fra
gra
nce
inp
erfu
mer
yan
dd
isin
fect
an
ts-
00.5
--
⁄-100
⁄107.8
91
⁄70.6
89-7
8-1
Men
thol
Foo
dad
dit
ive,
top
ical
an
ti-i
nfl
am
mato
ry,
cigare
ttes
,co
ugh
dro
ps,
lin
imen
t,m
outh
wash
-0
0.5
--
⁄-97.5
⁄112.1
91.6
⁄74.6
No
np
resc
rip
tio
nd
ru
g58-0
8-2
Caff
ein
eB
ever
ages
,d
iure
tic,
mob
ile
⁄bio
deg
rad
able
-10
0.5
0.1
85
(0.7
4)
16.2
⁄-90
⁄106.1
87.1
⁄87
486-5
6-6
Cot
inin
eP
rim
ary
nic
otin
em
etabol
ite
-3
1.0
0.1
45
(0.3
3)
6.1
⁄-87.5
⁄117.2
35.6
⁄39.2
119-3
6-8
Met
hyl
sali
cyla
teL
inim
ent,
food
an
dbev
erage
ad
dit
ive,
UV
-abso
rbin
glo
tion
,to
pic
al
an
ti-i
nfl
am
mato
ry
-0
0.5
--
⁄-97.5
⁄105.8
93.6
⁄83.8
Pest
icid
e314-4
0-9
Bro
maci
lH
erbic
ide,
>80%
non
crop
usa
ge
ongra
ssan
dbru
shY
00.5
--
⁄-106.3
⁄125.5
-⁄9
8.4
63-2
5-2
Carb
ary
lIn
sect
icid
e,cr
opan
dgard
enu
se,
low
per
sist
ence
Y0
1.0
--
⁄-125
⁄105.4
82.7
⁄102.3
86-7
4-8
Carb
azo
leIn
sect
icid
e,m
an
ufa
ctu
rin
gd
yes
,ex
plo
sives
,lu
bri
can
ts-
00.5
--
⁄-86.3
⁄102.3
81.2
⁄83.6
2921-8
8-2
Ch
lorp
yri
fos
Inse
ctic
ide,
dom
esti
cp
est
an
dte
rmit
eco
ntr
olY
00.5
--
⁄-93.8
⁄113.1
80.5
⁄76.8
333-4
1-4
Dia
zin
onIn
sect
icid
e,>
40%
non
agri
cult
ura
lu
se,
an
ts,
flie
sY
00.5
--
⁄-101.3
⁄123.1
91
⁄84.1
5989-2
7-5
d-L
imon
ene
Fu
ngic
ide,
an
tim
icro
bia
l,an
tivir
al,
fragra
nce
inaer
osol
s-
00.5
--
⁄-48.8
⁄28.8
25
⁄13.9
57837-1
9-1
Met
ala
xyl
Her
bic
ide,
fun
gic
ide,
mil
dew
,bli
gh
t,p
ath
ogen
s,gol
fan
dtu
rf-
10.5
<0.2
5(0
.066)
)1.5
⁄-100
⁄143.8
96.4
⁄100.1
51218-4
5-2
Met
olach
lor
Her
bic
ide,
ind
icato
rof
agri
cult
ura
ld
rain
age
Y0
0.5
--
⁄-93.8
⁄126.3
87.7
⁄95
134-6
2-3
N,N
-die
thyl-
met
a-
tolu
am
ide
(DE
ET
)In
sect
icid
e,u
rban
use
s,m
osqu
ito
rep
elle
nt
-8
0.5
0.1
42
(0.3
7)
0⁄-
87.5
⁄125.3
88.6
⁄92.8
1610-1
8-0
Pro
met
onH
erbic
ide
(non
crop
)ap
pli
edp
rior
tobla
ckto
p-
00.5
--
⁄-101.3
⁄126.3
88.4
⁄90.1
Pla
stic
izer
80-0
5-7
Bis
ph
enol
AM
an
ufa
ctu
rin
gp
olyca
rbon
ate
resi
ns,
an
tiox
idan
t,fl
am
ere
tard
an
tY
7(4
)1.0
0.2
50
(0.5
2)
26.2
⁄15.8
101.3
⁄105.6
24.9
⁄24.5
115-8
6-6
Tri
ph
enyl
ph
osp
hate
Pla
stic
izer
,re
sin
,w
ax,
fin
ish
,ro
ofin
gp
ap
er,
flam
ere
tard
an
t-
90.5
0.0
52
(0.1
9)
6.7
⁄6.2
100.1
⁄108.5
85
⁄87.2
Po
lycy
cli
ca
ro
ma
tic
hy
dro
ca
rb
on
s(P
AH
)90-1
2-0
1-M
eth
yln
ap
hth
ale
ne
2-5
%gaso
lin
e,d
iese
lfu
elor
cru
de
oil
-0
0.5
--
⁄-91.3
⁄87.9
70.5
⁄50.2
581-4
2-0
2,6
-Dim
eth
yln
ap
hth
ale
ne
Die
sel⁄
ker
osen
e,tr
ace
ingaso
lin
e-
00.5
--
⁄-90
⁄93.4
62
⁄40.4
91-5
7-6
2-M
eth
yln
ap
hth
ale
ne
2-5
%gaso
lin
e,d
iese
lfu
elor
cru
de
oil
-0
0.5
--
⁄-87.5
⁄86
61.2
⁄42.3
LAGRANGIAN SAMPLING FOR EMERGING CONTAMINANTS THROUGH AN URBAN STREAM CORRIDOR IN COLORADO
JOURNAL OF THE AMERICAN WATER RESOURCES ASSOCIATION 73 JAWRA
TA
BL
E1.
Con
tin
ued
.
Ch
em
ica
lA
bst
ra
ct
Serv
ices
Nu
mb
er
Co
mp
ou
nd
Na
me
(co
mm
on
na
me)
Pro
ba
ble
Use
so
rS
ou
rces(1
)E
DP
1T
NO
D(n
=14)
LR
L(2
)
(lg
⁄l)
Med
ian
Va
lue
(3)
(ma
xim
um
va
lue)
(lg
⁄l)
2005
⁄2006
Dif
feren
ce
Betw
een
En
vir
on
men
tal
Sa
mp
lea
nd
Rep
lica
te(%
)
2005
⁄2006
Fie
ldS
pik
eR
eco
very
(%)
2005
⁄2006
La
bo
ra
tory
Sp
ike
Reco
very
(%)
84-6
5-1
9,
10-A
nth
raqu
inon
eM
an
ufa
ctu
rin
g⁄t
exti
les
dye,
seed
trea
tmen
t,bir
dre
pel
len
t-
00.5
--
⁄-100
⁄122.5
87.5
⁄89.6
120-1
2-7
An
thra
cen
eW
ood
pre
serv
ati
ve,
inta
r,d
iese
l,or
cru
de
oil,
com
bu
stio
np
rod
uct
Y0
0.5
--
⁄-82.5
⁄95.8
77.8
⁄72
50-3
2-8
Ben
zo[a
]pyre
ne
Reg
ula
ted
PA
H,
use
din
can
cer
rese
arc
h,
com
bu
stio
np
rod
uct
Y0
0.5
--
⁄-67.5
⁄60.3
71.3
⁄53.6
206-4
4-0
Flu
oran
then
eC
omp
onen
tof
coal
tar
an
dasp
halt
-1
0.5
<0.2
5(0
.0086)
-⁄-
86.3
⁄91.3
84.3
⁄78.3
92-2
0-3
Nap
hth
ale
ne
Fu
mig
an
t,m
oth
rep
elle
nt,
majo
rgaso
lin
eco
mp
onen
t-
5(4
)0.5
0.0
23
(0.0
27)
)9.1
⁄-(5
)89.3
⁄-73.5
⁄-
85-0
1-8
Ph
enan
thre
ne
Man
ufa
ctu
rin
gex
plo
sives
,ta
r,d
iese
l,cr
ud
eoi
l,co
mbu
stio
np
rod
uct
Y2
0.5
<0.2
5(0
.013)
-⁄-
90
⁄92.3
84.3
⁄74.3
129-0
0-0
Pyre
ne
Com
pon
ent
ofco
al
tar
an
dasp
halt
Y0
0.5
--
⁄-86.3
⁄88.8
83.6
⁄78.4
So
lven
t78-5
9-1
Isop
hor
one
Sol
ven
tfo
rla
cqu
er,
pla
stic
,oi
l,si
lico
n,
resi
n-
00.5
--
⁄-102.5
⁄114.3
94.8
⁄87.1
98-8
2-8
Isop
rop
ylb
enze
ne
(cu
men
e)M
an
ufa
ctu
rin
gof
ph
enol
⁄ace
ton
e,fu
els
⁄pain
tth
inn
er-
00.5
--
⁄-62.5
⁄37.6
44.9
⁄29.1
127-1
8-4
Tet
rach
loro
eth
ene
Sol
ven
t,d
egre
ase
r,vet
erin
ary
an
thel
min
tic
Y0
0.5
--
⁄-47.5
⁄21.6
19.2
⁄7.6
Ste
ro
id360-6
8-9
3-b
-Cop
rost
an
olC
arn
ivor
efe
cal
ind
icato
r-
92.0
0.5
25
(1.2
3)
18
⁄-60
⁄77.8
60.4
⁄49.3
83-4
6-5
b-S
itos
tero
lP
lan
tst
erol
Y6
2.0
0.6
00
(1.3
0)
36.9
⁄-62.5
⁄66.3
40.4
⁄48.9
19466-4
7-8
b-S
tigm
ast
an
olP
lan
tst
erol
-5
2.0
0.5
30
(1.6
0)
57.5
⁄-44.1
⁄75.3
48.7
⁄51.5
57-8
8-5
Ch
oles
tero
lF
ecal
ind
icato
r,p
lan
tst
erol
-9
2.0
0.8
84
(2.4
5)
22.7
⁄-55.6
⁄74.4
61.4
⁄54.5
Not
es:
ED
P,
end
ocri
ne
dis
rup
tin
gp
oten
tial
(kn
own
orsu
spec
ted
);L
RL
,la
bor
ato
ryre
por
tin
gle
vel
;T
NO
D,
tota
ln
um
ber
ofd
etec
tion
sin
clu
din
gall
esti
mate
dvalu
es(e
stim
ate
dco
nce
ntr
ati
ons
incl
ud
eth
ose
that
are
bel
owor
abov
eth
eca
libra
tion
curv
e,co
nce
ntr
ati
ons
for
com
pou
nd
sw
ith
aver
age
reco
ver
ies
less
than
60%
,or
con
cen
trati
ons
ofco
mp
oun
ds
rou
tin
ely
det
ecte
din
labor
ato
rybla
nk
s(F
url
ong
eta
l.,
2001);
UV
,u
ltra
vio
let;
Y,
yes
;-,
no
data
avail
able
,n
otca
lcu
late
d,
orn
otap
pli
cable
.C
onst
itu
ents
not
det
ecte
dd
uri
ng
eith
erth
e2005
or2006
sam
ple
even
tsh
own
ingra
yte
xt.
(1) C
omp
oun
ds
pu
rpor
ted
tobe
pot
enti
al
orsu
spec
ted
end
ocri
ne
dis
rup
tors
(In
stit
ute
for
En
vir
onm
ent
an
dH
ealt
h,
2005)
an
d(o
r)li
sted
onW
WF
Can
ad
a’s
Web
Gu
ide
toE
nd
ocri
ne
Dis
rup
tin
gC
hem
icals
,acc
esse
don
May
9,
2008
at
htt
p://w
ww
.ww
fcan
ad
a.o
rg/s
ate
llit
e/h
orm
one-
dis
rup
tors
/sci
ence
/ed
clis
t.h
tml
an
d(o
r)fr
oma
list
ofw
ides
pre
ad
pol
luta
nts
wit
hen
doc
rin
e-d
isru
pti
ng
effe
cts
from
Ou
rS
tole
nF
utu
rew
ebp
age
(htt
p://w
ww
.ou
rsto
len
futu
re.o
rg/b
asi
cs/c
hem
list
.htm
,la
stacc
esse
don
May
9,
2008).
(2) L
RL
s,d
eriv
edfr
omlo
ng-t
erm
met
hod
det
ecti
onli
mit
s,w
ere
imp
lem
ente
dst
art
ing
Feb
ruary
1,
2006.
Pri
orto
this
tim
ete
mp
orary
inte
rim
rep
orti
ng
level
s(I
RL
s),
der
ived
du
r-in
gor
igin
al
met
hod
vali
dati
on,
wer
ein
effe
ct(Z
au
gg
eta
l.,
2002;
Zau
gg
an
dL
eik
er,
2006).
(3) M
edia
nvalu
eses
tim
ate
du
sin
gU
SG
SM
ult
iple
Det
ecti
onL
imit
stati
stic
sad
d-o
nto
mod
eld
istr
ibu
tion
sof
mu
ltip
ly-c
enso
red
data
.T
his
pack
age
isan
ad
d-o
nto
S-P
LU
S�
6.1
for
Win
dow
sP
rofe
ssio
nal
Ed
itio
n(R
elea
se1).
Non
det
ect
valu
esw
ere
rece
nso
red
tole
ssth
an
the
lon
g-t
erm
met
hod
det
ecti
onli
mit
(i.e
.,h
alf
the
LR
Lor
IRL
)fo
ran
aly
sis
pu
r-p
oses
.L
og-p
robabil
ity
med
ian
valu
esre
por
ted
.D
ata
wer
en
ottr
an
sfor
med
.(4
) Sel
ecte
dco
mp
oun
ds
had
fin
al
sam
ple
size
less
than
14
du
eto
bla
nk
con
tam
inati
on,
incl
ud
ing
bis
ph
enol
A(n
=13),
nap
hth
ale
ne
(n=
10),
an
dp
hen
ol(n
=7).
(5) N
ap
hth
ale
ne
resu
lts
from
2006
sam
ple
even
tan
dp
hen
olre
sult
sfr
om2005
sam
ple
even
tw
ere
con
sid
ered
con
tam
inate
dd
ue
toqu
ali
tyco
ntr
olre
sult
san
dn
otfu
rth
eran
aly
zed
;w
hil
eth
e2005
nap
hth
ale
ne
an
d2006
ph
enol
resu
lts
are
pre
sen
ted
inth
ista
ble
,th
eyare
excl
ud
edfr
omfu
rth
eran
aly
ses
toall
owfo
rco
mp
ari
son
sbet
wee
nyea
rs.
(6) V
eld
hoe
net
al.
,2006.
(7) H
erzk
eet
al.
,2007.
BROWN, BATTAGLIN, AND ZUELLIG
JAWRA 74 JOURNAL OF THE AMERICAN WATER RESOURCES ASSOCIATION

analysis due to blank contamination in one of the twoyears of sampling. Twenty-five ECs were not detectedat any of the sites during either sampling event. Thenumber of detections was slightly higher for the 2006event, which was sampled at a lower flow than the2005 event (Table 2, Figure 2). Measured dischargefrom the WWTP outfall and Left Hand Creek was notsubstantially different between sampling events; how-ever, the measured discharges in 2005 on St. VrainCreek and Boulder Creek were two to ten times ashigh as in 2006. Concentrations of detected ECs weregenerally low in St. Vrain Creek and Left HandCreek upstream from the WWTP outfall, highest inthe WWTP outfall, and generally decreased down-stream from the WWTP outfall, although an increasein concentrations at Site 7 (downstream fromthe Boulder Creek inflow) was observed for someconstituents.
Patterns of detection and concentrations of ECsand chemical use categories upstream and down-stream from the Longmont WWTP, at the outfall,and from the two sampled tributaries varied consider-ably by location, year, and discharge (Figures 2 and3). For example, in 2005 only one nonprescriptiondrug, caffeine, was detected upstream from theWWTP outfall, whereas in 2006, 12 ECs in nine cate-gories were detected upstream from the WWTP out-fall. At the WWTP outfall (Site 4), 30 ECs in 13categories were detected in 2005, and 31 ECs in 13categories were detected in 2006. All but three of theECs in the WWTP outfall (ethoxyoctylphenol, metal-axyl, and 4-tert-octylphenol) were found in bothyears. Downstream from the WWTP outfall at Site 5,20 ECs in 12 categories were detected in 2005, and31 ECs in 14 categories were detected in 2006. Fur-ther downstream at Site 6 (Boulder Creek), 19 ECs in10 categories were detected in 2005, and 23 ECs in11 categories were detected in 2006. At Site 7 (the
furthest downstream), 21 ECs in 11 categories weredetected in 2005, and 26 ECs in 13 categories weredetected in 2006.
At the WWTP outfall (Site 4) detergent metabo-lites, fire retardants, steroids, fragrances, and antiox-idants were the five most frequently detected ECcategories in both years (Figure 2). Of the 36 ECsdetected during one or both sample events, 16 havebeen identified as having known or suspected endo-crine-disrupting potential (Table 1). In both years,detergent metabolites, fire retardants, and steroidswere detected at the highest concentrations at Sites4, 5, 6, and 7 (Figure 3). Total concentrations forthese three categories at these four sites frequentlyexceeded 1 lg ⁄ l in 2005 and always exceeded 2 lg ⁄ lin 2006. Most individual ECs were measured at con-centrations less than 2 lg ⁄ l; the exceptions werediethoxynonylphenol (12.4 lg ⁄ l), tris(2-butoxyethyl)phosphate (9.37 lg ⁄ l), hexahydrohexamethyl-cyclo-pentabenzopyran (2.54 lg ⁄ l), cholesterol (2.45 lg ⁄ l),and 4-nonylphenol (2.27 lg ⁄ l) (Table 1; Figure 3).Sixty-five to 71% of the analytical results from thetwo sampling events were reported to be below theLRL.
Estimates of total measured EC concentrations(and load) are not specifically relevant to toxicity butmay be associated with or related to potential for eco-system effects. These quantities also are useful forsite-to-site and year-to-year comparisons. Total mea-sured concentrations of ECs were greater for the2006 sampling event than for the 2005 event at allsites (Table 2). During the 2006 event, there was alarger relative reduction (42%) in total concentrationbetween Site 5, the first site downstream from theWWTP outfall, and Site 7, the most downstream site,than the reduction that occurred in 2005 (23%). Thedifferences in relative reductions between 2005and 2006 could be related to the frequencies of
TABLE 2. Summary of Number of Detections, Discharge, Total Concentration, and Total Load ofDetected Wastewater-Related Contaminants by Sample Event, St. Vrain Creek and Tributaries
Left Hand Creek and Boulder Creek, Near Longmont, Colorado, April 2005 and March 2006.
Site No.
2005 2006
NOD1Discharge
(m3 ⁄ s)
TotalConcentration1
(lg ⁄ l)
TotalLoad1,2
(g ⁄ day) NOD1Discharge
(m3 ⁄ s)
TotalConcentration1
(lg ⁄ l)
TotalLoad1,2
(g ⁄ day)
1 0 1.20 0 0 2 0.12 0.219 2.272 1 1.55 0.06 7.8 9 0.25 2.84 61.13 (Tributary) 0 0.13 0 0 1 0.12 0.03 0.34 (WWTP) 30 0.38 29.3 967 31 0.35 41.4 1,2555 20 2.12 6.12 1,123 31 0.76 23.4 1,5286 (Tributary) 19 2.46 6.54 1,392 23 1.29 13.7 1,5287 21 4.39 4.72 1,791 26 2.08 13.5 2,414
Notes: NOD, number of detections; WWTP, wastewater treatment plant.1Excludes phenol and naphthalene from both years.2Loads computed for detected compounds only (excludes all nondetected data, includes estimated data).
LAGRANGIAN SAMPLING FOR EMERGING CONTAMINANTS THROUGH AN URBAN STREAM CORRIDOR IN COLORADO
JOURNAL OF THE AMERICAN WATER RESOURCES ASSOCIATION 75 JAWRA
TA
BL
E3.
Mass
Bala
nce
Su
mm
ary
ofD
etec
ted
Em
ergin
gC
onta
min
an
tsby
Sam
ple
Even
t,S
t.V
rain
Cre
ekan
dT
ribu
tari
esL
eft
Han
dC
reek
an
dB
ould
erC
reek
,N
ear
Lon
gm
ont,
Col
orad
o,A
pri
l2005,
an
dM
arc
h2006.
Co
mp
ou
nd
Na
me
(co
mm
on
na
me)
2005
Accu
mu
late
dL
oa
db
yS
ites
(g⁄d
ay
)2006
Accu
mu
late
dL
oa
db
yS
ites
(g⁄d
ay
)
Lo
gK
ow
(Lo
gP
)
Sit
es
2+
3+
4S
ite
5
%D
iffe
ren
ce
Sit
es
5+
6S
ite
7
%D
iffe
ren
ce
Sit
es
2+
3+
4S
ite
5
%D
iffe
ren
ce
Sit
es
5+
6S
ite
7
%D
iffe
ren
ce
Accu
mu
late
dD
isch
arg
e(m
3⁄s
)2.0
62.1
24.5
84.3
90.7
20.7
62.0
52.0
8
An
tio
xid
an
t3-t
ert-
Bu
tyl-
4-h
yd
roxyan
isol
e(B
HA
)3.3
0<
-fl<
<-
3.6
14.8
534.3
›4.8
5<
-fl3.5
5-M
eth
yl-
1H
-ben
zotr
iazo
le49.5
125
153
›125
243
94.4
›46.4
77.1
66.2
›169
128
)24.3
fl1.7
1p
-Cre
sol
46.2
47.7
3.2
5›
69.0
45.5
)34.1
fl30.3
15.8
)47.9
fl33.1
39.3
18.7
›1.9
4C
osm
eti
cT
riet
hyl
citr
ate
(eth
yl
citr
ate
)11.9
14.5
21.8
›28.8
26.2
)9.0
3fl
20.4
19.6
)3.9
2fl
33.6
24.8
)26.2
fl0.3
3D
eo
do
riz
er
1,4
-Dic
hlo
roben
zen
e5.6
25.5
1)
1.9
6fl
5.5
1<
-fl6.2
86.3
61.2
7›
6.3
62.0
6)
67.6
fl3.4
4D
ete
rg
en
tm
eta
bo
lite
4-N
onylp
hen
ol(t
otal)
36.3
75.2
107
›169
186
10.1
›68.9
119
72.7
›119
116
)2.5
2fl
5.9
24-t
ert-
Oct
ylp
hen
ol<
<-
<<
-5.7
06.7
318.1
›16.5
13.1
)20.6
fl5.2
8D
ieth
oxyn
onylp
hen
ol(t
otal,
NP
EO
2)
238
294
23.5
›656
<-fl
402
445
10.7
›767
481
)37.3
fl-
Die
thox
yoc
tylp
hen
ol(O
PE
O2)
10.2
<-fl
38.3
37.9
)1.0
4fl
25.6
28.9
12.9
›57.1
43.6
)23.6
fl-
Eth
oxyoc
tylp
hen
ol(O
PE
O1)
<<
-49.0
60.7
23.9
›9.9
214.2
43.1
›52.2
39.1
)25.1
fl-
Dis
infe
cta
nt
Tri
clos
an
18.5
18.4
)0.5
4fl
50.3
45.5
)9.5
fl23.4
30.8
31.6
›52.3
38.4
)26.6
fl4.7
6F
ire
reta
rd
an
tT
ris(
2-b
uto
xyet
hyl)
ph
osp
hate
149
147
)1.3
4fl
326
288
)11.7
fl290
339
16.9
›834
705
)15.5
fl3.7
5T
ris(
2-c
hlo
roet
hyl)
ph
osp
hate
9.5
812.5
30.5
›35.9
37.9
5.5
7›
8.3
712.0
43.4
›29.9
24.4
)18.4
fl1.4
4T
ribu
tyl
ph
osp
hate
10.6
15.0
41.5
›23.4
21.2
)9.4
0fl
5.5
28.1
748.0
›16.3
15.0
)7.9
8fl
4.0
0T
ris(
dic
hlo
rois
opro
pyl)
ph
osp
hate
15.2
23.9
57.2
›39.8
37.2
)6.5
3fl
10.6
16.1
51.9
›39.2
33.7
)14.0
fl3.6
5F
ixa
tiv
eB
enzo
ph
enon
e6.6
16.6
10.0
M6.6
121.2
221
›5.8
66.6
012.6
›15.1
14.7
)2.6
5fl
3.1
8F
lav
ora
nt
Cam
ph
or1.1
9<
-fl<
<-
1.7
42.6
250.6
›2.6
23.5
937.0
›2.3
8F
ra
gra
nce
3-M
eth
yl-
1H
-in
dol
e(s
kato
l)1.9
2<
-fl<
10.6
-›0.8
10
0.8
36
3.2
1›
0.8
36
<-fl
2.6
0A
ceto
ph
enon
e3.9
6<
-fl<
<-
6.4
07.6
419.4
›7.6
4<
-fl1.5
8A
cety
lhex
am
eth
ylt
etra
hyd
ro-
nap
hth
ale
ne
(AH
TN
)11.9
12.1
1.6
8›
20.6
17.4
)15.5
fl13.6
15.9
16.9
›15.9
12.9
)18.9
fl5.7
0
Hex
ah
yd
roh
exam
eth
yl-
cycl
open
taben
zop
yra
n(H
HC
B)
69.4
78.9
13.7
›130
106
)18.5
fl77.4
93.4
20.7
›132
83.6
)36.7
fl5.9
0
Ind
ole
7.6
06.6
1)
13.0
fl6.6
1<
-fl3.2
83.6
411.0
›7.6
6<
-fl2.1
4N
on
presc
rip
tio
nd
ru
gC
aff
ein
e32.2
36.7
14.0
›75.0
64.5
)14.0
fl19.2
21.0
9.3
8›
57.2
50.2
)12.2
fl)
0.0
7C
otin
ine
10.9
<-fl
<<
-4.1
65.2
526.2
›5.2
5<
-fl0.0
7P
est
icid
eM
etala
xyl
2.1
8<
-fl<
<-
<<
-<
<-
1.6
5N
,N-d
ieth
yl-
met
a-t
olu
am
ide
(DE
ET
)12.2
22.0
80.3
›45.4
41.7
)8.1
5fl
10.3
12.9
25.2
›28.0
26.9
)3.9
3fl
2.1
8P
last
iciz
er
Bis
ph
enol
A4.2
9<
-fl<
<-
20.9
21.9
4.8
›50.6
50.4
)0.4
0fl
3.3
2T
rip
hen
yl
ph
osp
hate
4.9
57.5
251.9
›13.5
11.0
)18.5
fl5.8
68.1
038.2
›13.4
10.0
)25.4
fl4.5
9P
oly
cy
cli
ca
ro
ma
tic
hy
dro
ca
rb
on
s(P
AH
)
BROWN, BATTAGLIN, AND ZUELLIG
JAWRA 76 JOURNAL OF THE AMERICAN WATER RESOURCES ASSOCIATION
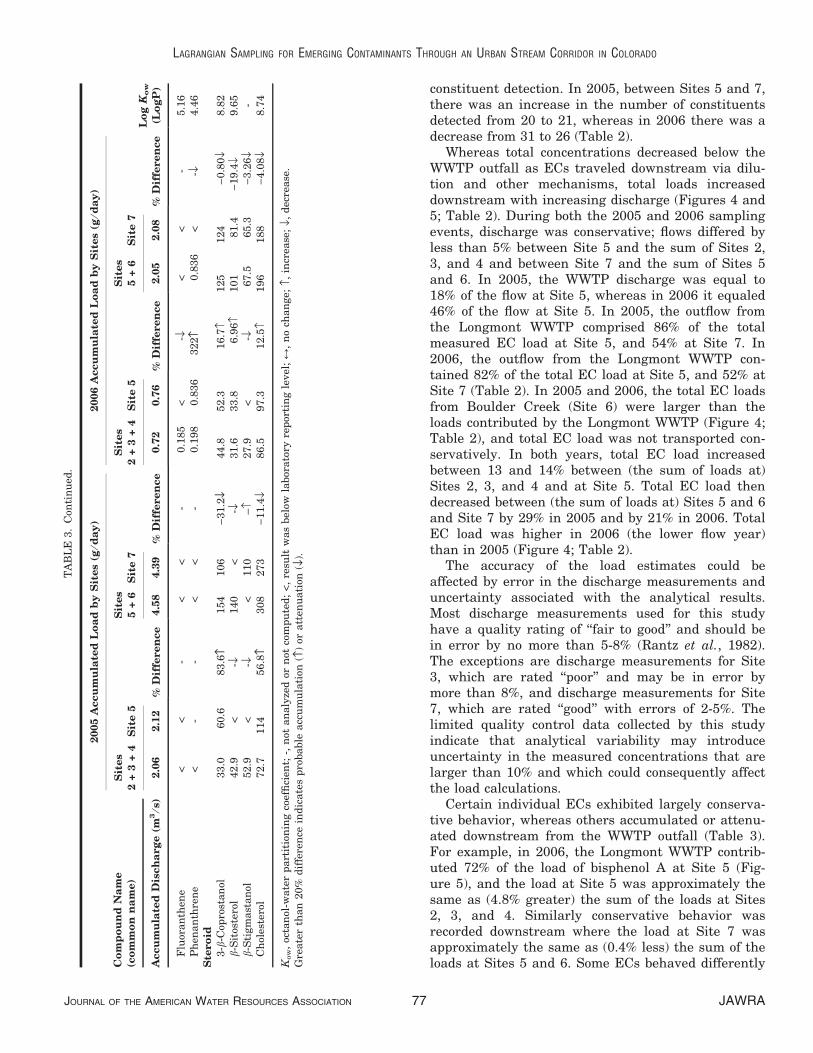
constituent detection. In 2005, between Sites 5 and 7,there was an increase in the number of constituentsdetected from 20 to 21, whereas in 2006 there was adecrease from 31 to 26 (Table 2).
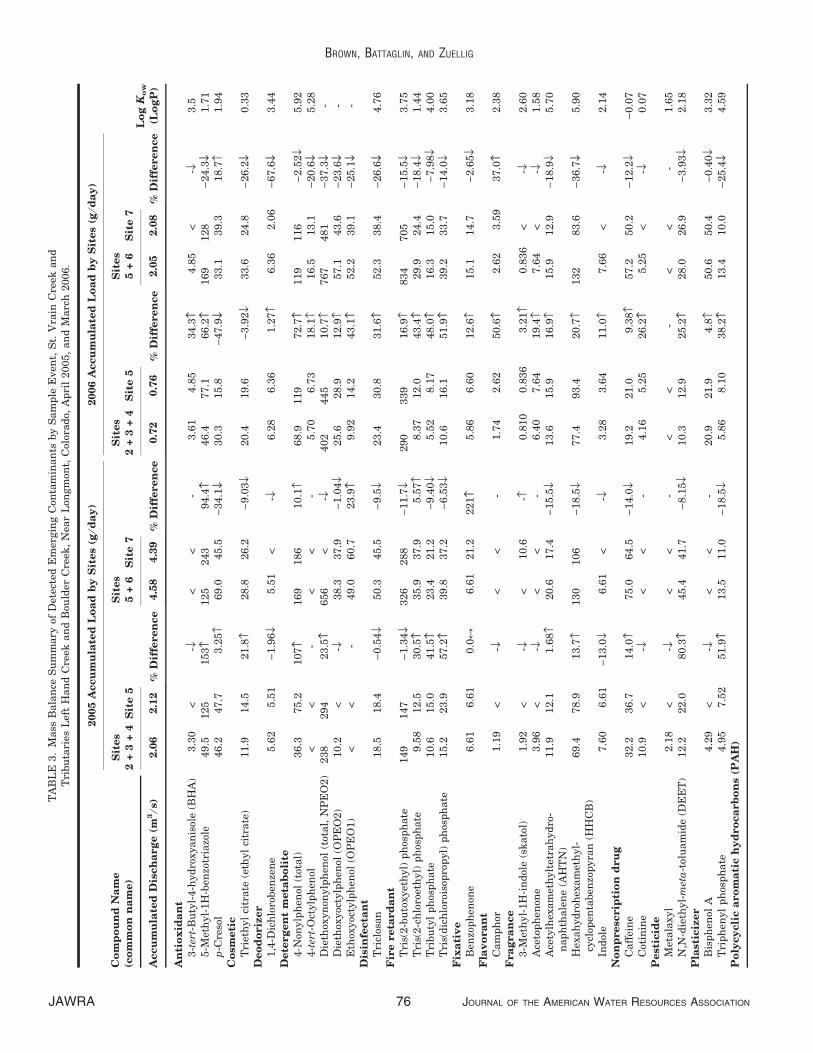
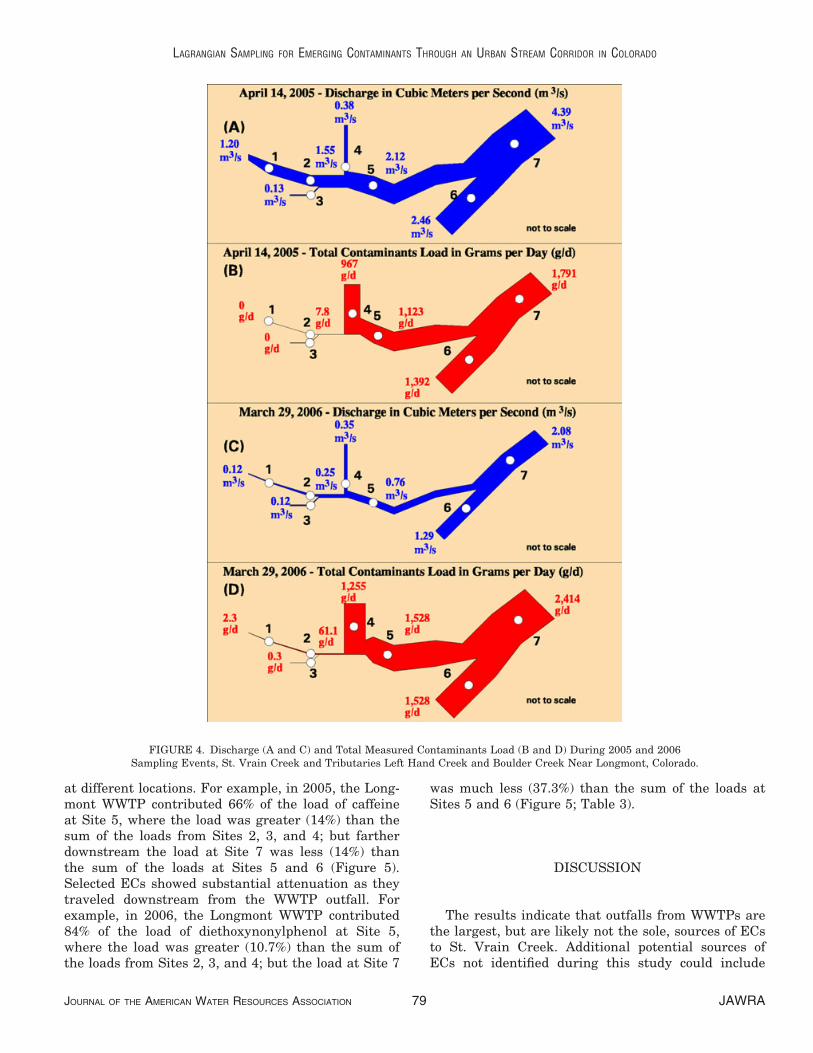
Whereas total concentrations decreased below theWWTP outfall as ECs traveled downstream via dilu-tion and other mechanisms, total loads increaseddownstream with increasing discharge (Figures 4 and5; Table 2). During both the 2005 and 2006 samplingevents, discharge was conservative; flows differed byless than 5% between Site 5 and the sum of Sites 2,3, and 4 and between Site 7 and the sum of Sites 5and 6. In 2005, the WWTP discharge was equal to18% of the flow at Site 5, whereas in 2006 it equaled46% of the flow at Site 5. In 2005, the outflow fromthe Longmont WWTP comprised 86% of the totalmeasured EC load at Site 5, and 54% at Site 7. In2006, the outflow from the Longmont WWTP con-tained 82% of the total EC load at Site 5, and 52% atSite 7 (Table 2). In 2005 and 2006, the total EC loadsfrom Boulder Creek (Site 6) were larger than theloads contributed by the Longmont WWTP (Figure 4;Table 2), and total EC load was not transported con-servatively. In both years, total EC load increasedbetween 13 and 14% between (the sum of loads at)Sites 2, 3, and 4 and at Site 5. Total EC load thendecreased between (the sum of loads at) Sites 5 and 6and Site 7 by 29% in 2005 and by 21% in 2006. TotalEC load was higher in 2006 (the lower flow year)than in 2005 (Figure 4; Table 2).
The accuracy of the load estimates could beaffected by error in the discharge measurements anduncertainty associated with the analytical results.Most discharge measurements used for this studyhave a quality rating of ‘‘fair to good’’ and should bein error by no more than 5-8% (Rantz et al., 1982).The exceptions are discharge measurements for Site3, which are rated ‘‘poor’’ and may be in error bymore than 8%, and discharge measurements for Site7, which are rated ‘‘good’’ with errors of 2-5%. Thelimited quality control data collected by this studyindicate that analytical variability may introduceuncertainty in the measured concentrations that arelarger than 10% and which could consequently affectthe load calculations.
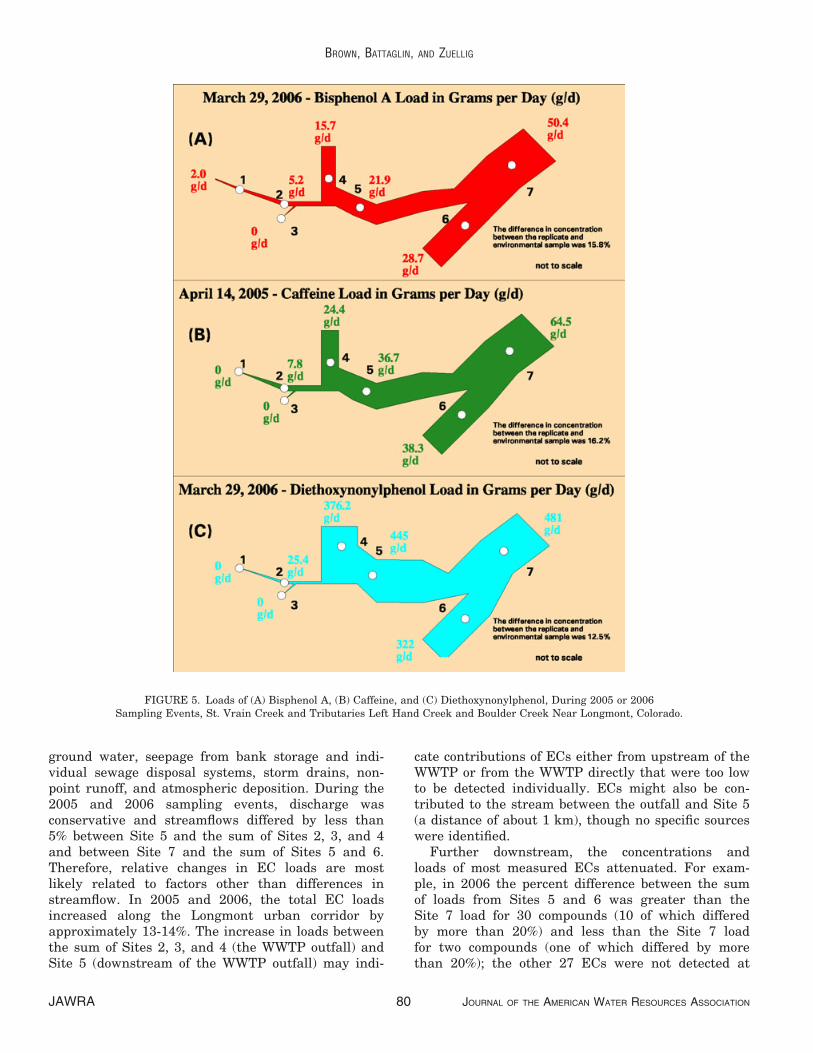
Certain individual ECs exhibited largely conserva-tive behavior, whereas others accumulated or attenu-ated downstream from the WWTP outfall (Table 3).For example, in 2006, the Longmont WWTP contrib-uted 72% of the load of bisphenol A at Site 5 (Fig-ure 5), and the load at Site 5 was approximately thesame as (4.8% greater) the sum of the loads at Sites2, 3, and 4. Similarly conservative behavior wasrecorded downstream where the load at Site 7 wasapproximately the same as (0.4% less) the sum of theloads at Sites 5 and 6. Some ECs behaved differently
TA
BL
E3.
Con
tin
ued
.
Co
mp
ou
nd
Na
me
(co
mm
on
na
me)
2005
Accu
mu
late
dL
oa
db
yS
ites
(g⁄d
ay
)2006
Accu
mu
late
dL
oa
db
yS
ites
(g⁄d
ay
)
Lo
gK
ow
(Lo
gP
)
Sit
es
2+
3+
4S
ite
5
%D
iffe
ren
ce
Sit
es
5+
6S
ite
7
%D
iffe
ren
ce
Sit
es
2+
3+
4S
ite
5
%D
iffe
ren
ce
Sit
es
5+
6S
ite
7
%D
iffe
ren
ce
Accu
mu
late
dD
isch
arg
e(m
3⁄s
)2.0
62.1
24.5
84.3
90.7
20.7
62.0
52.0
8
Flu
oran
then
e<
<-
<<
-0.1
85
<-fl
<<
-5.1
6P
hen
an
thre
ne
<-
-<
<-
0.1
98
0.8
36
322
›0.8
36
<-fl
4.4
6S
tero
id3-b
-Cop
rost
an
ol33.0
60.6
83.6
›154
106
)31.2
fl44.8
52.3
16.7
›125
124
)0.8
0fl
8.8
2b-
Sit
oste
rol
42.9
<-fl
140
<-fl
31.6
33.8
6.9
6›
101
81.4
)19.4
fl9.6
5b-
Sti
gm
ast
an
ol52.9
<-fl
<110
–›
27.9
<-fl
67.5
65.3
)3.2
6fl
-C
hol
este
rol
72.7
114
56.8
›308
273
)11.4
fl86.5
97.3
12.5
›196
188
)4.0
8fl
8.7
4
Kow
,oc
tan
ol-w
ate
rp
art
itio
nin
gco
effi
cien
t;-,
not
an
aly
zed
orn
otco
mp
ute
d;
<,
resu
ltw
as
bel
owla
bor
ato
ryre
por
tin
gle
vel
;M
,n
och
an
ge;
›,in
crea
se;
fl,d
ecre
ase
.G
reate
rth
an
20%
dif
fere
nce
ind
icate
sp
robable
acc
um
ula
tion
( ›)
oratt
enu
ati
on(fl
).
LAGRANGIAN SAMPLING FOR EMERGING CONTAMINANTS THROUGH AN URBAN STREAM CORRIDOR IN COLORADO
JOURNAL OF THE AMERICAN WATER RESOURCES ASSOCIATION 77 JAWRA
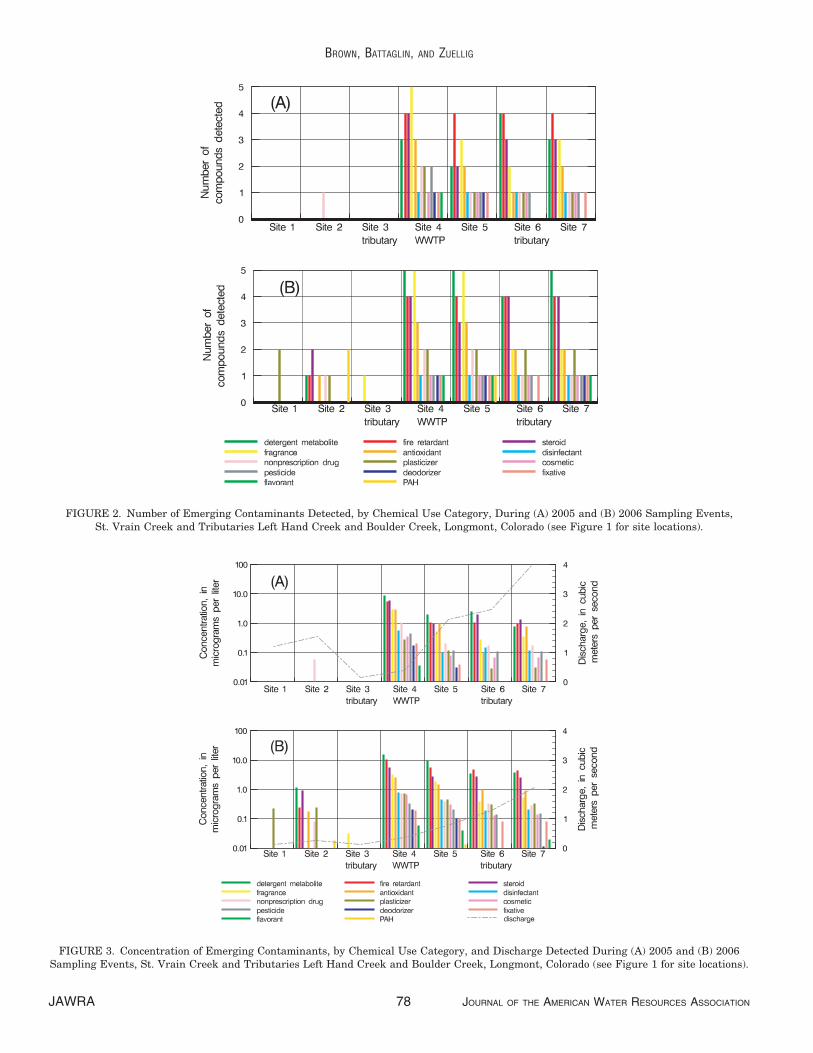
FIGURE 2. Number of Emerging Contaminants Detected, by Chemical Use Category, During (A) 2005 and (B) 2006 Sampling Events,St. Vrain Creek and Tributaries Left Hand Creek and Boulder Creek, Longmont, Colorado (see Figure 1 for site locations).
FIGURE 3. Concentration of Emerging Contaminants, by Chemical Use Category, and Discharge Detected During (A) 2005 and (B) 2006Sampling Events, St. Vrain Creek and Tributaries Left Hand Creek and Boulder Creek, Longmont, Colorado (see Figure 1 for site locations).
BROWN, BATTAGLIN, AND ZUELLIG
JAWRA 78 JOURNAL OF THE AMERICAN WATER RESOURCES ASSOCIATION
at different locations. For example, in 2005, the Long-mont WWTP contributed 66% of the load of caffeineat Site 5, where the load was greater (14%) than thesum of the loads from Sites 2, 3, and 4; but fartherdownstream the load at Site 7 was less (14%) thanthe sum of the loads at Sites 5 and 6 (Figure 5).Selected ECs showed substantial attenuation as theytraveled downstream from the WWTP outfall. Forexample, in 2006, the Longmont WWTP contributed84% of the load of diethoxynonylphenol at Site 5,where the load was greater (10.7%) than the sum ofthe loads from Sites 2, 3, and 4; but the load at Site 7
was much less (37.3%) than the sum of the loads atSites 5 and 6 (Figure 5; Table 3).
DISCUSSION
The results indicate that outfalls from WWTPs arethe largest, but are likely not the sole, sources of ECsto St. Vrain Creek. Additional potential sources ofECs not identified during this study could include
FIGURE 4. Discharge (A and C) and Total Measured Contaminants Load (B and D) During 2005 and 2006Sampling Events, St. Vrain Creek and Tributaries Left Hand Creek and Boulder Creek Near Longmont, Colorado.
LAGRANGIAN SAMPLING FOR EMERGING CONTAMINANTS THROUGH AN URBAN STREAM CORRIDOR IN COLORADO
JOURNAL OF THE AMERICAN WATER RESOURCES ASSOCIATION 79 JAWRA
ground water, seepage from bank storage and indi-vidual sewage disposal systems, storm drains, non-point runoff, and atmospheric deposition. During the2005 and 2006 sampling events, discharge wasconservative and streamflows differed by less than5% between Site 5 and the sum of Sites 2, 3, and 4and between Site 7 and the sum of Sites 5 and 6.Therefore, relative changes in EC loads are mostlikely related to factors other than differences instreamflow. In 2005 and 2006, the total EC loadsincreased along the Longmont urban corridor byapproximately 13-14%. The increase in loads betweenthe sum of Sites 2, 3, and 4 (the WWTP outfall) andSite 5 (downstream of the WWTP outfall) may indi-
cate contributions of ECs either from upstream of theWWTP or from the WWTP directly that were too lowto be detected individually. ECs might also be con-tributed to the stream between the outfall and Site 5(a distance of about 1 km), though no specific sourceswere identified.
Further downstream, the concentrations andloads of most measured ECs attenuated. For exam-ple, in 2006 the percent difference between the sumof loads from Sites 5 and 6 was greater than theSite 7 load for 30 compounds (10 of which differedby more than 20%) and less than the Site 7 loadfor two compounds (one of which differed by morethan 20%); the other 27 ECs were not detected at
FIGURE 5. Loads of (A) Bisphenol A, (B) Caffeine, and (C) Diethoxynonylphenol, During 2005 or 2006Sampling Events, St. Vrain Creek and Tributaries Left Hand Creek and Boulder Creek Near Longmont, Colorado.
BROWN, BATTAGLIN, AND ZUELLIG
JAWRA 80 JOURNAL OF THE AMERICAN WATER RESOURCES ASSOCIATION
all three sites and naphthalene and phenol wereexcluded. In 2005, the percent difference betweenthe sum of loads from Sites 5 and 6 was greaterthan the Site 7 load for 18 compounds (two ofwhich differed by more than 20%) and less thanthe Site 7 load for seven compounds (three of whichdiffered by more than 20%); the other 34 ECs werenot detected at all three sites and naphthalene andphenol were excluded (Table 3). The amount ofattenuation (percent difference between the sum ofloads from Sites 5 and 6 and the Site 7 load) wasgreater in 2005 (29%) than in 2006 (21%), eventhough 2006 had lower flow conditions and corre-spondingly slower travel times that would promotedegradation, volatilization, biological uptake, oradsorption. This apparent decrease in attenuationin 2006 may be the result of reduced dilution bythe stream resulting in more frequent detection ofECs downstream from the WWTP outfall. Total con-centration and total load of ECs were higher atSite 7 in 2006 than in 2005, even though dischargewas 53% less. Physical and chemical characteristicssuch as stream temperature, that could affect howcontaminants behave as they travel downstream,varied by compound. Additionally, partitioning tosediment may result in attenuation of selected ECs.ECs, such as the steroids, have relatively high octa-nol-water partitioning coefficients (Kow) and wouldbe expected to adsorb to sediments, whereas others,like the nonprescription drugs caffeine and cotinine,have very low Kow values and would be expected toremain in solution (Table 3). However, a consistentpattern between Kow values and attenuation oraccumulation of ECs was not found in this study.Analytical variability may have influenced theobserved differences in loads, as some contaminantsthat were detected at relatively high concentrationssuch as b-stigmastanol have relatively poor analyti-cal reproducibility (Table 1).
Substantial attenuation of many wastewater-derived contaminants in a large effluent-dominatedriver was noted by Fono et al. (2006), but in that sys-tem, travel times were measured in days rather thanminutes. In the studied portion of St. Vrain Creek,there was evidence of various levels of attenuationfor most ECs (Figures 4 and 5; Table 3). In St. VrainCreek, the amount of attenuation observed was notsufficient to prevent aquatic biota from being exposedcontinuously to a wide range of ECs downstreamfrom the Longmont WWTP and in Boulder Creeknear the confluence with St. Vrain Creek (Table 3).St. Vrain Creek harbors native fish species andmacroinvertebrate communities that have declined orare absent in other parts of the South Platte RiverBasin (Zuellig et al., 2007). The extent to which ECsin St. Vrain Creek affects these organisms is
unknown, but recent studies have shown that fishcan respond to very low concentrations of someorganic or estrogenic contaminants (Brian et al.,2007; Quiros et al., 2007).
ACKNOWLEDGMENTS
The authors acknowledge those from the USGS and from theCity of Longmont who helped with field work. Additionally, com-ments provided by Jennifer L. Flynn, Betty Palcsak, and Allan D.Druliner (USGS Colorado Water Science Center), Lori Sprague(USGS National Water Quality Assessment Program), and CalvinYoungberg (City of Longmont Water and Wastewater Department)were greatly appreciated.
LITERATURE CITED
American Forests, 2001. Regional Ecosystem Analysis for Metropol-itan Denver and Cities of the Northern Front Range, Colorado:Calculating the Value of Nature. April 2001 American ForestsReport. American Forests, Washington, D.C., 12 pp.
Arslan, O.C., H. Parlak, R. Oral, and S. Katalay, 2007. The Effectsof Nonylphenol and Octylphenol on Embryonic Development ofSea Urchin (Paracentrotus lividus). Archives of EnvironmentalContamination and Toxicology 53:214-219.
Bernet, D., H. Schmidt-Posthaus, T. Wahli, and P. Burkhardt-Holm, 2004. Evaluation of Two Monitoring Approaches toAssess Effects of Waste Water Disposal on Histological Altera-tions in Fish. Hydrobiologia 524:53-66.
Brian, J.V., C.A. Harris, M. Scholze, A. Kortenkamp, P. Booy, M.Lamoree, G. Pojana, N. Jonkers, A. Marcomini, and J. Sumpter,2007. Evidence of Estrogenic Mixture Effects on the Reproduc-tive Performance of Fish. Environmental Science & Technology41:337-344.
Colborn, T., F.S. vom Saal, and A.M. Soto, 1993. DevelopmentalEffects of Endocrine-Disrupting Chemicals in Wildlife andHumans. Environmental Health Perspectives 101:378-384.
Daughton, C.G., 2001. Pharmaceuticals and Personal Care Prod-ucts in the Environment: Overarching Issues and Overview. In:Pharmaceuticals and Personal Care Products in the Environ-ment: Scientific and Regulatory Issues, C.G. Daughton and T.L.Jones-Lepp (Editors). American Chemical Society, Washington,D.C., ACS Symposium Series 791, pp. 2-38.
Fono, L.J., E.P. Kolodziej, and D.L. Sedlak, 2006. Attenuation ofWastewater-Derived Contaminants in an Effluent-DominatedRiver. Environmental Science & Technology 40:7257-7262.
Furlong, E.T., B.D. Anderson, S.L. Werner, P.P. Soliven, L.J.Coffey, and M.R. Burkhardt, 2001. Methods of Analysis bythe U.S. Geological Survey National Water Quality Labora-tory—Determination of Pesticides in Water by GraphitizedCarbon-Based Solid-Phase Extraction and High-PerformanceLiquid Chromatography ⁄ Mass Spectrometry. U.S. GeologicalSurvey Water-Resources Investigations Report 01-4134,Reston, Virginia, 73 pp.
Heberer, T. and M. Adam, 2005. Occurrence, Fate, and Removal ofPharmaceutical Residues in the Aquatic Environment: AnExtended Review of Recent Research Data. In: Hot Spot Pollu-tants: Pharmaceutical in the Environment, D.R. Dietrich, S.Webb, and T. Petry (Editors). Elsevier Inc., Amsterdam, TheNetherlands, pp. 11-36.
Herzke, D., M. Schlabach, E. Mauiussen, H. Uggerud, D. Herzke,M. Schlabach, E. Mariussen, H. Uggerud, and E. Heimstad,
LAGRANGIAN SAMPLING FOR EMERGING CONTAMINANTS THROUGH AN URBAN STREAM CORRIDOR IN COLORADO
JOURNAL OF THE AMERICAN WATER RESOURCES ASSOCIATION 81 JAWRA
2007. A Literature Survey on Selected Chemical Compounds:Literature Survey of Polyfluorinated Organic Compounds, Phos-phor Containing Flame Retardants, 3-Nitrobenzanthrone,Organic Tin Compounds, Platinum and Silver. Oslo, Norway,Statens forurensningstilsyn, Norwegian Pollution ControlAuthority TA-2238 ⁄ 2007. http://www.sft.no/publikasjoner/2238/ta2238.pdf, accessed December 2007.
Hoeger, B., B. Koellner, G. Kotterba, M.R. van den Huevel, B. Hitz-feld, and D.R. Dietrich, 2004. Influence of Chronic Exposure toTreated Sewage Effluent on the Distribution of White Blood CellPopulations in Rainbow Trout (Oncorhynchus mykiss) Spleen.Toxicological Sciences 82:97-105.
Hoger, B., 2003. Effects of Sewage Treatment Plant Effluent on theImmune System of Rainbow Trout (Oncorhynchus Mykiss). Dis-sertation, Universitat Konstanz, Konstanz, Germany.
Institute for Environment and Health, 2005. Chemicals Purportedto be Endocrine Disrupters: A Compilation of Published Lists.IEH Web Report W20, MRC Institute for Environment andHealth, Leicester, United Kingdom, http://www.le.ac.uk/ieh/,accessed December 2007.
Kilpatrick, F.A. and J.F. Wilson, Jr., 1989. Measurement of Timeof Travel in Streams by dye Tracing. U.S. Geological SurveyTechniques of Water-Resources Investigations, Reston, Virginia,Book 3, Chap. A9, 27 pp.
Kolpin, D.W., E.T. Furlong, M.T. Meyer, E.M. Thurman, S.D.Zaugg, L.B. Barber, and H.T. Buxton, 2002. Pharmaceuticals,Hormones, and Other Organic Wastewater Contaminants inU.S. Streams, 1999-2000: A National Reconnaissance. Environ-mental Science & Technology 36:1202-1211.
Lee, K.E., L.B. Barber, E.T. Furlong, J.D. Cahill, D.W. Kolpin,M.T. Meyer, and S.D. Zaugg, 2004. Presence and Distribution ofOrganic Wastewater Compounds in Wastewater, Surface,Ground, and Drinking Waters, Minnesota, 2000-02. U.S. Geolog-ical Survey Scientific Investigation Report 2004-5138, Reston,Virginia, 47 pp.
McLachlan, J.A., 2001. Environmental Signaling: What Embryosand Evolution Teach U.S. About Endocrine Disrupting Chemi-cals. Endocrine Reviews 22:319-341.
Paul, M.J. and J.L. Meyer, 2001. Streams in the Urban Landscape.Annual Review of Ecology and Systematics 32:333-365.
Petrovic, M., M. Sole, M.J. Lopez de Alda, and D. Barcelo, 2002.Endocrine Disruptors in Sewage Treatment Plants, ReceivingRiver Waters, and Sediments: Integration of Chemical Analysisand Biological Effects in Feral Carp. Environmental Science &Technology 21:2146-2156.
Quiros, L., S. Jarque, R. Lackner, P. Fernandez, J. Grimalt, and B.Pina, 2007. Physiological Response to Persistent Organic Pollu-tants in Fish From Mountain Lakes: Analysis of Cyp1A GeneExpression in Natural Populations of Salmo Trutta. Environ-mental Science & Technology 41:5154-5160.
Rantz, S.E., et al., 1982. Measurement and Computation of Stream-flow: Volume 2. Computation of Discharge. U.S. Geological Sur-vey Water-Supply paper 2175, Washington, D.C., pp. 284-631.
Sprague, L.A. and W.A. Battaglin, 2005. Wastewater Chemicals inColorado’s Streams and Ground Water. U.S. Geological SurveyFact Sheet 2004-3217, Reston, Virginia, 4 pp.
Sprague, L.A., R.E. Zuellig, and J.A. Dupree, 2006. Effects ofUrbanization on Stream Ecosystems in the South Platte RiverBasin, Colorado and Wyoming, Chap A of Effects of Urbaniza-tion on Stream Ecosystems in Six Metropolitan Areas of theUnited States. U.S. Geological Survey Scientific InvestigationsReport 2006-5101-A, Reston, Virginia, 139 pp.
Ternes, T., 2001. Pharmaceuticals and Metabolites as Contami-nants of the Aquatic Environment. In: Pharmaceuticals andPersonal Care Products in the Environment: Scientific and Reg-ulatory Issues, C.G. Daughton and T.L. Jones-Lepp, (Editors).
American Chemical Society, Washington, D.C., ACS SymposiumSeries 791, pp. 39-54.
U.S. Geological Survey, variously dated. National Field Manualfor the Collection of Water-Quality Data. U.S. Geological Sur-vey Techniques of Water-Resources Investigations, Book 9,Chaps. A1-A9, Reston, Virginia. http://water.usgs.gov/owq/FieldManual/, accessed December 2008.
Veldhoen, N., R.C. Skirrow, H. Osachoff, H. Wigmore, D.J. Clap-son, M.P. Gunderson, G.V. Aggelen, and C.C. Helbing, 2006.The Bactericidal Agent Triclosan Modulates Thyroid Hormone-Associated Gene Expression and Disrupts PostembryonicAnuran Development. Aquatic Toxicology 80:217-227.
Zaugg, S.D. and T.J. Leiker, 2006. Review of Method Performanceand Improvements for Determining Wastewater Compounds(Schedule 1433). U.S. Geological Survey National Water QualityLaboratory Technical Memorandum 2006.01, 26 pp. http://nwql.usgs.gov/Public/tech_memos/nwql.2006-01.pdf, accessedDecember 2007
Zaugg, S.D., S.G. Smith, M.P. Schroeder, L.B. Barber, and M.R.Burkhardt, 2002. Methods of Analysis by the U.S. GeologicalSurvey National Water Quality Laboratory – Determinationof Wastewater Compounds by Polystyrene-DivinylbenzeneSolid-Phase Extraction and Capillary-Column Gas Chromato-graphy ⁄ Mass Spectrometry. U.S. Geological Survey Water-Resources Investigations Report 01-4186, Reston, Virginia, 37 pp.
Zuellig, R.E., L.A. Sprague, J.A. Collins, and O.N. Cox, 2007. Aqua-tic Communities and Selected Water Chemistry in St. VrainCreek Near the City of Longmont, Colorado, Wastewater-Treat-ment Plant, 2005 and 2006. U.S. Geological Survey Data SeriesDS 253, Reston, Virginia, 30 pp.
BROWN, BATTAGLIN, AND ZUELLIG
JAWRA 82 JOURNAL OF THE AMERICAN WATER RESOURCES ASSOCIATION