LABORATORY - UNT Digital Library
460
©ml ORNUTM-13219 OAK RIDGE NATIONAL LABORATORY LO C KH M K D MA H TTi^ Propulsion System Materials Program Semiannual Progress Report for April 1995 Through September 1995 Prepared for U.S. Department of Energy Assistant Secretary for Energy Efficiency and Renewable Energy Office of Transportation Technologies MANAGED BY LOCKHEED MARTIN ENERGY SYSTEMS, INC. FOR THE UNITED STATES DEPARTMENT OF ENERGY UCN-13S73 (38 M5) DISTRIBUTION OF THIS DOCUMENT IS UNLIMITED
-
Upload
khangminh22 -
Category
Documents
-
view
0 -
download
0
Transcript of LABORATORY - UNT Digital Library

©ml ORNUTM-13219
OAK RIDGE NATIONAL LABORATORY LO C KH M K D MA H TTi^
Propulsion System Materials Program Semiannual Progress Report for April 1995 Through
September 1995
Prepared for U.S. Department of Energy
Assistant Secretary for Energy Efficiency and Renewable Energy
Office of Transportation Technologies
MANAGED BY LOCKHEED MARTIN ENERGY SYSTEMS, INC. FOR THE UNITED STATES DEPARTMENT OF ENERGY
UCN-13S73 (38 M5) DISTRIBUTION OF THIS DOCUMENT IS UNLIMITED

This report has been reproduced directly from the best available copy.
Available to DOE and DOE contractors from the Office of Scientific and Technical Information, P.O. Box 62, Oak Ridge, TN 37831; prices available from (423) 576-8401, FTS 626-8401.
Available to the public from the National Technical Information Service, U.S. Department of Commerce, 5285 Port Royal Rd., Springfield, VA 22161.
This report was prepared as an account of work sponsored by an agency of the United States Government. Neither the United States Government nor any agency thereof, nor any of their employees, makes any warranty, express or implied, or assumes any legal liability or responsibility for the accuracy, completeness, or usefulness of any information, apparatus, product, or process disclosed, or represents that its use would not infringe privately owned rights. Reference herein to any specific commercial product, process, or service by trade name, trademark, manufacturer, or otherwise, does not necessarily constitute or imply its endorsement, recommendation, or favoring by the United States Government or any agency thereof. The views and opinions of authors expressed herein do not necessarily state or reflect those of the United States Government or any agency thereof.
ORNUTM-13219
Metals and Ceramics Division
PROPULSION SYSTEM MATERIALS PROGRAM SEMIANNUAL PROGRESS REPORT FOR
APRIL 1995 THROUGH SEPTEMBER 1995
D. R. Johnson Program Manager
Date Published: April 1996
NOTICE: This document contains information of a preliminary nature. It is subject to revision or correction and therefore does not represent a final report.
Prepared for U.S. Department of Energy
Assistant Secretary for Energy Efficiency and Renewable Energy Office of Transportation Technologies
EE 51 05 00 0
Prepared by the OAK RIDGE NATIONAL LABORATORY Oak Ridge, Tennessee 37831-6285
managed by LOCKHEED MARTIN ENERGY RESEARCH CORP.
for the U.S. DEPARTMENT OF ENERGY
under Contract DE-AC05-96OR22464

REPORTS PREVIOUSLY ISSUED
ORNL/TM-9325 ORNL/TM-9466 ORNL/TM-9497 ORNL/TM-9673 ORNL/IM-9947 ORNL/TM-10079 ORNL/TM-10308 ORNL/TM-10469 ORNL/TM-10705 ORNL/TM-10838 ORNL/TM-11116 ORNL/TM-11239 ORNL/TM-11489 ORNL/TM-11586 ORNL/TM-11719 ORNL/TM-11859 ORNL/TM-11984 ORNL/TM-12133 ORNL/TM-12363 ORNL/TM-12428 ORNL/TM-12674 ORNL/TM-12778 ORNL/TM-12924 ORNL/TM-13046
Period Period Period Period Period Period Period Period Period Period Period Period Period Period Period Period Period Period Period Period Period Period Period Period
March 1983-September 1983 October 1983-March 1984 April 1984-September 1984 October 1984-March 1985 April 1985-September 1985 October 1985-March 1986 April 1986-September 1986 October 1986-March 1987 April 1987-September 1987 October 1987-March 1988 April 1988-September 1988 October 1988-March 1989 April 1989-September 1989 October 1989-March 1990 April 1990-September 1990 October 1990-March 1991 April 1991-September 1991 October 1991-March 1992 April 1992-September 1992 October 1992-March 1993 April 1993-September 1993 October 1993-March 1994 April 1994-September 1994 October 1994-March 1995
Research sponsored by the U.S. Department of Energy, Assistant Secretary for Energy Efficiency and Renewable Energy, Office of Transportation Technologies, as part of the Propulsion System Materials Program, under contract DE-AC05-96OR22464 with Lockheed Martin Energy Research Corp.
II

DISCLAIMER
Portions of this document may be illegible in electronic image products. Images are produced from the best available original document.


CONTENTS
SUMMARY 1
0.0 PROGRAM MANAGEMENT AND COORDINATION 3
1.0 MATERIALS AND PROCESSING 5
INTRODUCTION 5
1.1 MONOLITHICS 7
1.1.2 Silicon Nitride 7
Characterization of Attrition Milled Silicon
Nitride Powder (NIST) 7
Microwave Sintering of Silicon Nitride (ORNL) 10
Development of a Low Cost Silicon Nitride Powder (The Dow Chemical Company) 28 Cost Effective Sintering of Silicon Nitride
Ceramics (SIU-C) 40
1.1.4 Processing of Monolithics 48
Improved Processing (ORNL) 48
1.2 CERAMIC COMPOSITES 54
1.2.2 Silicon Nitride Matrix 54
Optimization of Mechanical Properties of Silicon Nitride Ceramics (University of Michigan) 54 Microstructure Optimization of SRBSN (University of Michigan) 57
Characterization of Grain Boundary Phases in Silicon Nitride Ceramics (University of Michigan) 63
Microstructure Design of S/3A/4 (University of Michigan) 66
i i i

Development of Silicon Nitride Ceramic Materials with Elongated Grain Microstructures Exhibiting High Fracture Toughness Phase II (AlliedSignal Inc.) 69
1.2.3 Oxide Matrix 74
Dispersion-Toughened Ceramic Composite (ORNL) 74
1.2.4 Low Expansion Materials 87
Characterization and Testing of Low-Expansion Ceramic Materials (ORNL) 87
Development of NZP Ceramic-Based "Cast-in-Place"
Diesel Engine Port Liners (LoTEC, Inc.) 92
1.3 THERMAL AND WEAR COATINGS 111
Fabrication and Testing of Corrosion-Resistant Coatings (ORNL) 111 Development of Adherent Coatings to Reduce Contact
Stress Damage of Ceramics (Boston University) 120
1.4 JOINING 126
1.4.1 Ceramic-Metal Joints 126
Joining of Ceramics for Heat Engine Applications
(ORNL) 126
1.5 CERAMIC MACHINING 129
Cost-Effective Ceramic Machining (ORNL) 129
Cost-Effective Method for Determining the Grindability of Ceramics (Chand Kare Technical Ceramics, Inc.) 134 High-Speed, Low-Damage Grinding of Advanced Ceramics (Eaton Manufacturing Technologies Center) 146
i v
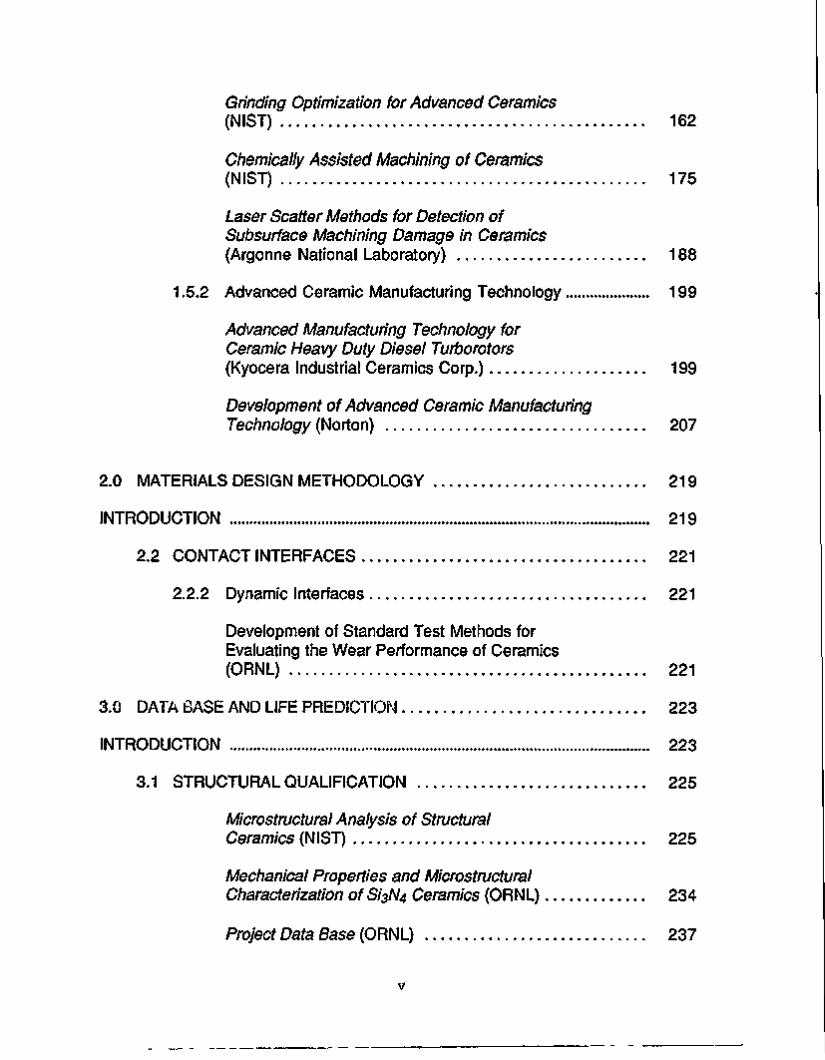
Grinding Optimization for Advanced Ceramics (NIST) 162
Chemically Assisted Machining of Ceramics (NIST) 175
Laser Scatter Methods for Detection of Subsurface Machining Damage in Ceramics (Argonne National Laboratory) 188
1.5.2 Advanced Ceramic Manufacturing Technology 199
Advanced Manufacturing Technology for Ceramic Heavy Duty Diesel Turborotors (Kyocera Industrial Ceramics Corp.) 199
Development of Advanced Ceramic Manufacturing Technology (Norton) 207
2.0 MATERIALS DESIGN METHODOLOGY 219
INTRODUCTION 219
2.2 CONTACT INTERFACES 221
2.2.2 Dynamic Interfaces 221
Development of Standard Test Methods for Evaluating the Wear Performance of Ceramics (ORNL) 221
3.0 DATA BASE AND LIFE PREDICTION 223
INTRODUCTION 223
3.1 STRUCTURAL QUALIFICATION 225
Microstructural Analysis of Structural Ceramics (NIST) 225
Mechanical Properties and Microstructural Characterization of S/3A/4 Ceramics (ORNL) 234
Project Data Base (ORNL) 237
V
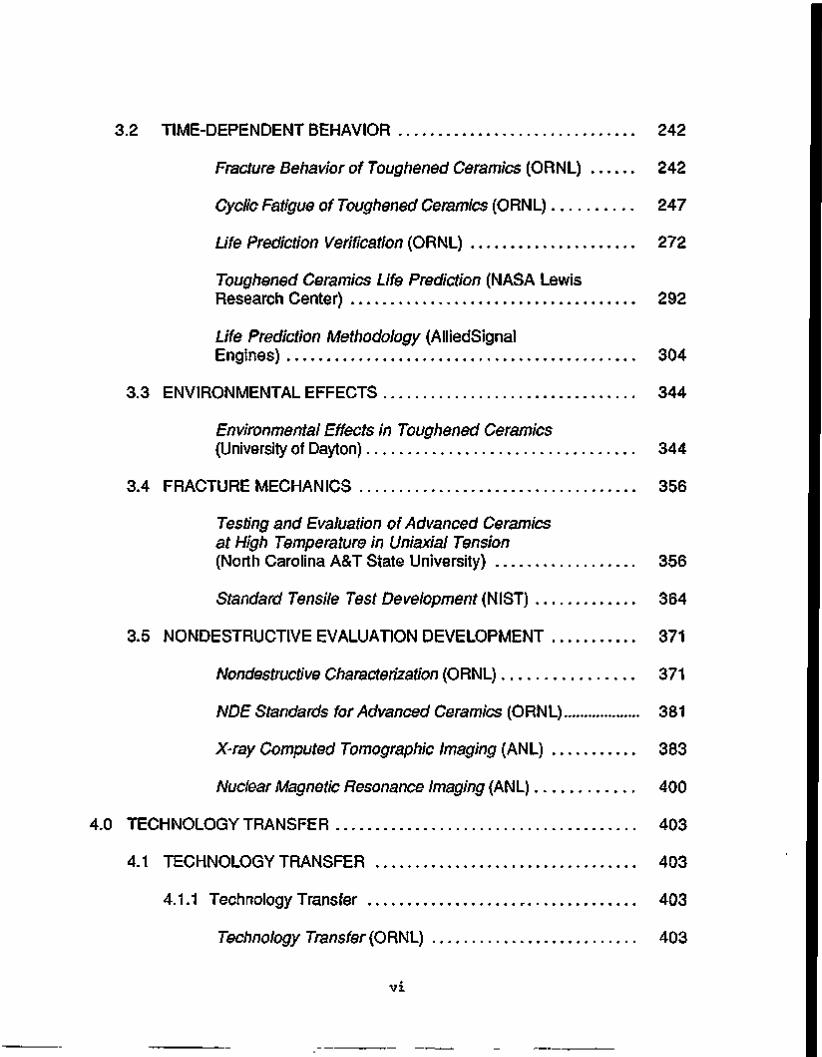
3.2 TIME-DEPENDENT BEHAVIOR 242
Fracture Behavior of Toughened Ceramics (ORNL) 242
Cyclic Fatigue of Toughened Ceramics (ORNL) 247
Life Prediction Verification (ORNL) 272
Toughened Ceramics Life Prediction (NASA Lewis Research Center) 292
Life Prediction Methodology (AlliedSignal
Engines) 304
3.3 ENVIRONMENTAL EFFECTS 344
Environmental Effects in Toughened Ceramics
(University of Dayton) 344
3.4 FRACTURE MECHANICS 356
Testing and Evaluation of Advanced Ceramics at High Temperature in Uniaxial Tension
(North Carolina A&T State University) 356
Standard Tensile Test Development (NIST) 364
3.5 NONDESTRUCTIVE EVALUATION DEVELOPMENT 371
Nondestructive Characterization (ORNL) 371
NDE Standards for Advanced Ceramics (ORNL) 381
X-ray Computed Tomographic Imaging (ANL) 383
Nuclear Magnetic Resonance Imaging (ANL) 400
4.0 TECHNOLOGY TRANSFER 403 4.1 TECHNOLOGY TRANSFER 403
4.1.1 Technology Transfer 403
Technology Transfer (ORNL) 403 v i

IEA ANNEX II Management (ORNL) 404
Characterization of Ceramic Powders (NIST) 410
Ceramic Mechanical Property Test Method Development (NIST) 413
v i i


PROPULSION SYSTEM MATERIALS PROGRAM SEMIANNUAL PROGRESS REPORT
FOR APRIL 1995 THROUGH SEPTEMBER 1995
SUMMARY
The Propulsion System Materials Program was originally developed by the Department of Energy's Office of Transportation Systems (OTS) in Energy Efficiency and Renewable Energy. This program, part of the OTS's Materials Development Program, was developed to meet the ceramic technology requirements of the OTS's automotive technology programs.
Significant accomplishments in fabricating ceramic components for the Department of Energy (DOE), National Aeronautics and Space Administration (NASA), and Department of Defense (DoD) advanced heat engine programs have provided evidence that the operation of ceramic parts in high-temperature engine environments is feasible. However, these programs have also demonstrated that additional research is needed in materials and processing development, design methodology, and data base and life prediction before industry will have a sufficient technology base from which to produce reliable cost-effective ceramic engine components commercially.
An assessment of needs was completed, and a five-year program plan was developed with extensive input from private industry. In July 1990, the original plan was updated through the estimated completion of development in 1993. The original objective of the program was to develop the industrial technology base required for reliable ceramics for application in advanced automotive heat engines.
During the course of the Propulsion System Materials Program, remarkable progress has been made in the development of reliable structural ceramics. However, further work is needed to reduce the cost of ceramics to facilitate their commercial introduction, especially in the highly cost-sensitive automotive market. To this end, the direction of the Propulsion System Materials Program is now shifting toward reducing the cost of ceramics to facilitate commercial introduction of ceramic components for near-term engine applications. In response to extensive input from industry, the plan is to extend the engine types which were previously supported (advanced gas turbine and low-heat-rejection diesel engines) to include near-term (5-10 years) applications in conventional automobile and diesel truck engines. To facilitate the rapid transfer of this technology to U.S. industry, the major portion of the work is being done in the ceramic industry, with technological support from government laboratories, other industrial laboratories, and universities.
A systematic approach to reducing the cost of components is envisioned. The work elements are as follows: economic cost modeling, ceramic machining, powder synthesis, alternative forming and densification processes, yield improvement, system design studies, standards development, low-expansion ceramics, and testing and data base development.
l

2
This program is managed by ORNL for the Office of Transportation Technologies and is closely coordinated with complementary ceramics tasks funded by other DOE offices, NASA, DoD, and industry. A joint DOE and NASA technical plan has been established, with DOE focus on automotive applications and NASA focus on aerospace applications. A common work breakdown structure (WBS) was developed to facilitate coordination. The work described in this report is organized according to the following WBS project elements:
0.0 Program Management and Coordination
1.0 Materials and Processing
1.1 Monolithics 1.2 Ceramic Composites 1.3 Thermal and Wear Coatings 1.4 Joining 1.5 Ceramic Machining
2.0 Materials Design Methodology
2.1 Modeling 2.2 Contact Interfaces 2.3 New Concepts
3.0 Data Base and Life Prediction
3.1 Structural Qualification 3.2 Time-Dependent Behavior 3.3 Environmental Effects 3.4 Fracture Mechanics 3.5 Nondestructive Evaluation Development
4.0 Technology Transfer
4.1 Technology Transfer
This report includes contributions from all currently active program participants. The contributions are arranged according to the work breakdown structure outline.

3
0.0 PROGRAM MANAGEMENT AND COORDINATION
D. R. Johnson Oak Ridge National Laboratory
Objective/scope
This task includes the technical management of the program in accordance with the program plans and management plan approved by the Department of Energy (DOE) Oak Ridge Operations Office, and the Office of Transportation Technologies. This task includes preparation of annual field work proposals, initiation and management of subcontracts and interagency agreements, and management of ORNL technical tasks. Monthly management reports and bimonthly reports are provided to DOE; highlights and semiannual technical reports are provided to DOE and program participants. In addition, the program is coordinated with interfacing programs sponsored by other DOE offices and federal agencies, including the National Aeronautics and Space Administration (NASA) and the Department of Defense (DoD). This coordination is accomplished by participation in DOE and NASA joint management meetings, annual interagency heat engine ceramics coordination meetings, DOE contractor coordination meetings, and DOE Energy Materials Coordinating Committee (EMaCC) meetings, as well as special coordination meetings.


5
1.0 MATERIALS AND PROCESSING
INTRODUCTION
This portion of the program is identified as program element 1.0 within the work breakdown structure (WBS). It contains five subelements: (1) Monolithics, (2) Ceramic Composites, (3) Thermal and Wear Coatings, (4) Joining, and (5) Ceramic Machining. Ceramic research conducted within the Monolithics subelement currently includes work activities on low cost SJ3N4 powder, green state ceramic fabrication, characterization, and densification, and on structural, mechanical, and physical properties of these ceramics. Research conducted within the Ceramic Composites subelement currently includes silicon nitride and oxide-based composites, and low expansion materials. Research conducted in the Thermal and Wear Coatings subelement is currently limited to oxide-based coatings and involves coating synthesis, characterization, and determination of the mechanical and physical properties of the coatings. Research conducted in the Joining subelement currently includes studies of processes to produce strong, stable joints between zirconia ceramics and iron-base alloys. As part of an expanded effort to reduce the cost of ceramic components, a new initiative in cost effective machining has been started.
A major objective of the research in the Materials and Processing program element is to systematically advance the understanding of the relationships between ceramic raw materials such as powders and reactant gases, the processing variables involved in producing the ceramic materials, and the resultant microstructures and physical and mechanical properties of the ceramic materials. Success in meeting this objective will provide U.S. companies with new or improved ways for producing economical, highly reliable ceramic components for advanced heat engines.

7
1.1 MONOLITHICS
1.1.2 Silicon Nitride
Characterization of Attrition Milled Silicon Nitride Powder S. G. Malghan, P. T. Pei and D. B. Minor (National Institute of Standards and Technology)
Objective/Scope
Currently, the starting materials in the manufacture of silicon nitride ceramic components are fine powders. These fine sized powders tend to form agglomerates due to the Van der Waals attractive forces. For improved reliability in the manufacture of ceramic components, the agglomerates in the powders should be eliminated since they form defects. In addition, the powders should have an appropriate range of size distribution and specific surface area for achieving a near-theoretical density of the ceramic after densification. These.factors necessitate the use of powder milling as one of the major powder processing unit operations. Therefore, milling of powders is an integral unit operation in the manufacture of silicon nitride components for advanced energy applications. The production and use of these powders require the use of efficient milling techniques and understanding of characteristics of the milled powders in a given environment. High energy attrition milling appears to offer significant advantages over conventional tumbling and vibratory mills.
The major objectives of this project are: 1. establish repeatability of particle size distribution and other relevant characteristics of slurries milled in a high energy agitation mill (HEAM); 2. determine processing and densification characteristics of powders milled in HEAM; and 3. compare properties of powder, and resulting ceramic obtained by milling in the HEAM vs. vibratory ball mill in a collaborative project with Norton Company.
Technical Progress
The primary activity during this period was completion of repair of the milling system, and conduct a milling tests on Dow's silicon nitride powder.
We milled the silicon nitride powder from Dow Chemical Company with a goal to establish the behavior of this powder in the high energy agitation ball mill (HEAM). It appears that the mill had developed a leak in the mechanical seal system during the last test. However, we were unaware of the leak. It became clear during the samples analysis time that the slurry was diluted by leakage of water from the mechanical seal of the cooling system. As a result, not only the slurry density but also its particle size distribution was affected. Therefore, we decided to discard the data of the first test.
In the next test, dispersion and milling parameters were kept at the same level as for the Ube powder. Electroacoustic data has shown that the pHiep of this powder is in the range of pH 2 to 3, and it was not significantly affected by the presence of Daxad-32, polymethacrylate, as a dispersant. Concentration of Daxad-32 was maintained at 650 ppm based on the total weight of powder. The initial solids concentration, before beginning of the milling test was 62% by weight and increased to

8
76% when the milling was terminated at 80 min. Yttria (4% by weight) was added between the 20th and 32nd min of milling time. The mill was operated at 2800 rpm and the slurry flow rate was maintained at 250 cm3/min. The resulting samples were analyzed for particle size distribution and specific surface area by laser light scattering and BET gas adsorption, respectively. Overall, the data showed that the final particle size distribution was too small, resulting in the final specific surface area of 19.5 m2/g.
The particle size distribution and specific surface area data showed the following:
* Bimodal size distribution of the initial powder gradually became monomodal.
* Most of the size reduction took place in the first 20 min during which period the coarsest particles in the 2 micrometers range were size reduced. This type of size reduction behavior has been observed with other powders.
* Excessive quantity of very small size daughter fragments, finer than 0.5 micrometer, produced by the size reduction of coarse particles appears to be the reason for larger than desired surface area of the 80 min milled powder.
* The rate of increase of the surface area was linear with the milling time.
The major difference between the two powders—Ube and Dow—is their behavior in water. The Ube powder exhibited a significant shift in the pHiep. In addition, the concentration of Daxad had no effect on the level of dispersion. These data lead us to conclude that the adsorption of Daxad on this silicon nitride powder was negligible. Therefore, another dispersant containing an ammonium alcohol was experimented. The adsorption data on ube powder of this dispersant showed that though a small amount was adsorbed, the pH of the slurry was in excess of 10.8. The probable reason for this dispersant's effectiveness was the enhanced electrostatic interactions between the particles at high pH.
For some powders, we have observed improved dispersion when using the ammonium alcohol-based dispersant. In this test, we observed no significant differences during milling, except a strong odor of ammonia in the initial period. The ammonia odor is expected because at pH greater than 10.0, the solubility of ammonia in silicon nitride slurries is severely limited. Therefore, the combination of ammonia from silicon nitride slurries and that from the dispersant is the cause of this increased odor of ammonia. The milling kinetics data and the resulting solids loading in the final slurry showed very little differences from those using ammonium methacrylate as a dispersant. One significant difference was in the final green body density and strength. Both were comparatively low, though the starting density of the slurry had 75% weight solids. Additional tests are planned to provide improved dispersion and resultant improvements in green density.

9
Status of Milestones
On schedule
Communications/Visits
Dr. Naito, JFCC, Japan, visited NIST to discuss IEA Subtask 8 data.
Publications
1. Reports on Data Compilation and Data Comments to Subtask 8 Technical Leaders, September 1995.

10
W.B.S. ELEMENT 1.1.2.4 MICROWAVE SINTERING OF SILICON NITRIDE
J. O. Kiggans, T. N. Tiegs, C. C. Davisson, J. M. Snodgrass, and D. L. Barker Oak Ridge National Laboratory
Oak Ridge, TN 37831 Stan Morrow and Stan Forrester
Y-12 Development Division Oak Ridge, TN 37831
Objective/Scope
The objective of this research element is to identify those aspects of microwave processing of silicon nitride that might (1) accelerate densification, (2) permit sintering to high density with much lower levels of sintering aids, (3) lower the sintering temperature, or (4) produce unique microstructures. The investigation of microstructure development is being performed on dense silicon nitride materials annealed in the microwave furnace. The sintering of silicon nitride involves two approaches. The first approach comprises heating of silicon nitride and sialon powder compositions in the 2.45- or 28-GHz units. The second approach uses reaction-bonded silicon nitride as the starting material and is done entirely in the 2.45-GHz microwave furnace.
Technical Highlights
Golden Technologies CRADA
This work is being performed as part of a CRADA arrangement with Golden Technologies. The objective of this CRADA is to investigate the use of microwave heating for the nitridation of silicon clevis pin preforms fabricated by Golden Technologies, Inc. More specifically, a larger goal has been established of demonstrating the microwave nitridation of 100 to 200 parts. Several activities have been undertaken during this time period to achieve this goal: TGA analysis of clevis pin preforms were performed to determine their nitridation behavior in nitrogen; weight gain experiments involving silicon preforms were done in a graphite furnace to determine their nitridation behavior in N2 - 4 vol. % H2; microwave nitridation trials were performed; and x-ray diffraction analysis was performed on clevis pin RBSN processed by microwave and conventional heating.
The TGA study of clevis pin samples was undertaken in order to establish the temperature versus weight gain relationship for nitridation. The TGA study was performed using a TA Instruments SDT 2960 Simultaneous DTA-TGA. Data was collected for clevis pin and for comparison, bucket tappet and TM-145 silicon preforms. Flowing nitrogen was used for nitridation, since N2 - 4 vol. % H2, the preferred gas, could not be used with the Type "S" thermocouples (reaction problem). Fig. 1 is a graph showing the measured conversion of silicon to silicon nitride, as a function of temperature. The data in this graph is interpreted by drawing a vertical line between the data point on the percent conversion curve to the corresponding temperature (dotted line). The data indicate that the clevis pin material started nitriding at between 1000 to 1100°C and nitridation was complete at approximately 1400°C. The TM-145 sample and bucket tappet sample did not show significant nitridation until around 1250°C and were nitrided to approximately 95 % completion at 1450°C. The large difference in the nitridation behavior of the clevis pin and the other two sample types was due to the higher iron content of the clevis pin samples and possibly other compositional differences. The effect of various chemicals on silicon nitridation has been cited in the literature.

11
A series of nitridation runs in were performed in a graphite furnace, in order to obtain the percent silicon conversion for the clevis pin and other comparison samples in N2 - 4 vol. % H2. The nitridation setup has been described in previous bimonthly reports. Fig. 2 shows that the percent conversion as a function of temperature for the clevis pin, TM-145, and bucket tappet samples. The nitridation of the clevis pins in N2 - 4 vol. % H2 was approximately 40 % complete at 1200°C and was 95% complete by 1275°C. The nitridation of the TM-145 and bucket tappet samples was just starting at 1200°C, and was near completion at 1400°C. The absence of data points for the temperatures below 1200°C makes a comparison with TGA data at the start of the nitridation difficult, however this data does indicate that the addition of H2 appeared to lower the temperature at which conversion was complete for all samples. The effect of H2 additions on nitridation has been cited in the literature.
X-ray diffraction analysis was performed on selected samples to compare the a-silicon nitride content of materials produced by conventional and microwave heating. Table 1 is a compilation of the data. High a-silicon nitride values were obtained for clevis pin samples which v/ere nitrided by microwave heating to a final temperature of 1300°C in nitrogen and in N2 - 4 vol. % H2. The slightly higher a-silicon nitride content obtained for the sample processed in hydrogen was expected, based on previous work on the effect of H2 on nitridation. A comparable a-silicon nitride content was obtained from a clevis pin preform processed to 1350°C in a graphite furnace in N2 - 4 vol. % H2. This appears to support belief that conventional and microwave processing follow the same nitridation routes. Clevis pin samples processed in a graphite furnace to 1450°C in N2 and in N2 - 4 vol. % H2 showed much lower a-silicon nitride contents, since the a silicon nitride is converted to P-silicon nitride as the sintering aids are converted to liquid phase at a temperature between 1350 and 1450°C.
In the previous semiannual period, several microwave insulation packaging setups were tested for the nitridion of clevis pins provided by Golden Technologies. The most promising setup for microwave processing of the clevis pins was a Si3N4-SiC crucible surrounded by a 2.5 cm thick rigid alumina fiberboard box. Two groups of 36 clevis pins were successfully nitrided using very fast heating cycles (<10 h) in this insulation arrangement. During the present semiannual period several experiments were done to test several factors concerning microwave nitridation of clevis pin preforms: effect of sample number; the effect of sample spacing, touching versus spaced; the effect of alternative crucible construction; and the effect of lower H2 content in the nitriding gas.
A summary of the results from various test runs made during this reporting period are presented in Table 2. Test 1 was a scaleup run to 100 test parts using the same insulation arrangement which had shown success in previous tests with 36 samples. In test 1 some sample melting occurred. Fig. 3 shows the temperature profile of test 1 including the thermal runaway which occurred. The same experiment was repeated, test 2, with the same results. The reason for the uneven processing in tests 1 and 2 is believed due to the much larger amount of heat released for 100 versus 36 samples. An alternative insulation setup, to the one used for test 1 and 2, was then built (Fig. 4) as a possible solution to the problem. This crucible arrangement consisted of Si3N4-SiC side panels for the side walls of the crucible and microwave-transparent hot-pressed BN setter plates for the top and bottom of the inner crucible. The BN top and bottom were added to absorb the excess heat released during nitridation. Tests 3 and 4 were performed to test this new crucible. Results of these tests in Table 2 show that both the exterior samples (samples 1-20, Fig. 4) and the interior samples (samples 21-36, Fig. 4) showed comparable nitridation. There was very minor distortion in a few of the exterior samples due to the fact that the crucible wall was cooler than the interior samples. Also, there was a problem with poor temperature control by the "Micristar" controller. Test 5 was performed to test the effect of
12
reducing the amount of hydrogen on nitridation cycle. Good weight gain results were obtained in this test, indicating that lower amounts of hydrogen can be used, however the temperature oscillation still persisted. Test 6 was performed to test the effect of lowering the peak nitridation temperature to 1200°C, to avoid the controller problem. A lower average weight gain and a larger statistical deviation of weight gain values was obtained when the 1200 °C endpoint was used. It appears that a peak temperature above 1200 °C is necessary for complete nitridation of all samples. It is possible that a longer hold at 1200°C might dampen the sudden nitridation that occurs above 1200°C. Figure 5 is a plot of the temperature profile for test 6, which shows that the temperature of the exterior samples (1-20), as measured by a two-color pyrometer, initially lagged the temperature of the interior samples (21-36), as measured by a thermocouple, by up to 100 °C at 1100 °C and then moved closer as the temperature rose to 1200 °C. As with conventional nitrogen studies have shown, a peak temperature of 1300 °C is necessary for complete nitridation of all samples to occur. Test 7 was a scale-up to 100 clevis pins using microwave heating in a larger Si3N4-SiC-BN crucible, with the sample, edge to edge spacing at 0.5 cm, as was used in tests 3 and 4. Very good weight values and statistical deviation were obtained in this test, however as in previous tests, there was a problem with power control and also a slight warping of a few exterior samples. A photo of the RBSN clevis pins produced in this run is shown in Fig. 6. Test 8 was performed to see if increasing the packing density of samples (samples touching) would lead to better temperature control. Table 2 shows that a much better statistical deviation was obtained for this tight pack arrangement, but unfortunately there was partial sintering of some interior samples, as well as the problems with temperature control.
The results from the 8 tests have been used to determine the proper composition of sample crucibles, the proper spacing of samples, and the proper nitriding gas for microwave nitridation. Crucible containing 60 wt % and 80 wt % SiC have been prepared for future nitridation tests. Gas containing at least 1 vol. % H2 will be used, and sample spacing will be held at least 0.7 cm. The problem of inadequate microwave power control, which was experienced in some runs, will be addressed through the use of a state-of-the -art "Yokagowa" PID controller.
Scaleup Microwave Nitridation - Sintering Studies
Four microwave nitridation and sintering scaleup experiments were completed during the reporting period, two in the 500 liter ORNL microwave furnace, and two in the Y-12 furnace. These experiments included several sub-tasks: the fabrication of new crucible materials; the preparation of large numbers of silicon preforms; completion of the nitridation and sintering runs; and the characterization of the final SRBSN products.
Three groups of samples were used for the scaleup trials at ORNL and Y-12: gelcast TM-150 silicon preforms (same composition as TM-141), gelcast TM-145 preforms, and bucket tappet samples. The methods for gelcasting silicon preforms using the isopropanol solvent system have been discussed in the previous semiannual report, 1995. The compositions of the gelcast preforms are noted in Table 3. Milled TM-145 powder was gelcast in a 25 cm by 10 cm by 1.25 cm aluminum mold (Fig. 7). Milled TM-150 powder was cast in plastic culture dishes, which were 3 cm in diameter. The gelcast silicon preforms were then isopressed at 138 MPa pressure, heated in air to 550 °C for binder removal. The TM-145 gelcast slabs were then cut into 1.25 cm by 1.25 cm by 3.3 cm rectangular samples. Approximately 375 gelcast samples, having a density of 1.60 g/cm3, were produced for the scaleup experiments. Bucket tappets were purchased from the Cremer Forschungsinstitut of Germany and were used as received.
13
Two microwave scaleup experiments involving the nitridation and sintering of silicon preforms were performed in the 500 liter ORNL furnace. In experiment 1, 72 TM-150 gelcast silicon preforms, 3 cm diameter by 1 cm thick, were processed in a microwave insulation setup similar to ones described in previous reports (Aug.-Sept., 1994). In experiment 2, 108, TM-145 silicon preforms, 3 cm tall by 1.25 cm thick by 1.25 cm width, were processed using a microwave package described in the June - July, 1995 bimonthly (double fiberboard box). Both crucibles utilized hot-pressed BN setter plates and a 17 cm by 17 cm by 17 cm, inner crucible composed of sintered plates of the composition, Si3N4 - 4.2 wt % - Y2O3 - 0.8 wt % Si02- The final sintering condition for both runs was 1775°C for 2 h. Two additional microwave scaleup experiments involving the nitridation and sintering of silicon preforms were performed in the 4000 L, Y-12 microwave furnace. A hybrid-heating crucible was used for these nitridation and sintering trials. The top and bottom of the crucible was constructed of gelcast sintered plates of the composition, S13N4 - 4.2 wt % - Y2O3 - 0.8 wt % Si02, the side walls of the crucible were composed of sintered plates of the composition S13N4 - 4.2 wt % Y2O3 - 0.8 wt % Si02 -5 wt % SiC, and 25 cm wide by 30 cm long by 0.7 cm thick, BN setter plates were utilized. The overall interior dimensions of the sample crucible were 25 cm by 31 cm by 18 cm. Insulation of the samples and crucible were accomplished via the standard Si3N4 - BN powder bed and and fiberboard box setup. A new fiber board product, Rath type KVS144 (rated to 1400°C) was used for the construction of the outer box. In the first experiment, experiment 3, 90 silicon bucket tappets were processed. In the second experiment, experiment 4,230 rectangular gelcast silicon bars were processed. Fig. 8 shows the silicon preforms as placed in each of the three sample layers in experiments 3 and 4. The final sintering condition for both runs was 1765°C for 2 h. A slightly lower sintering temperature was chosen (normally 1800°C) because of the uncertainty of the temperature measurement in the large package. Densities for all samples in these two scaleup runs were determined using the alcohol immersion density technique. Three sintered samples were removed from each of the three layers of the samples in experiment 2. These samples were sliced into three equal parts, which were ground and polished. The polished samples were tested for hardness and indent toughness.
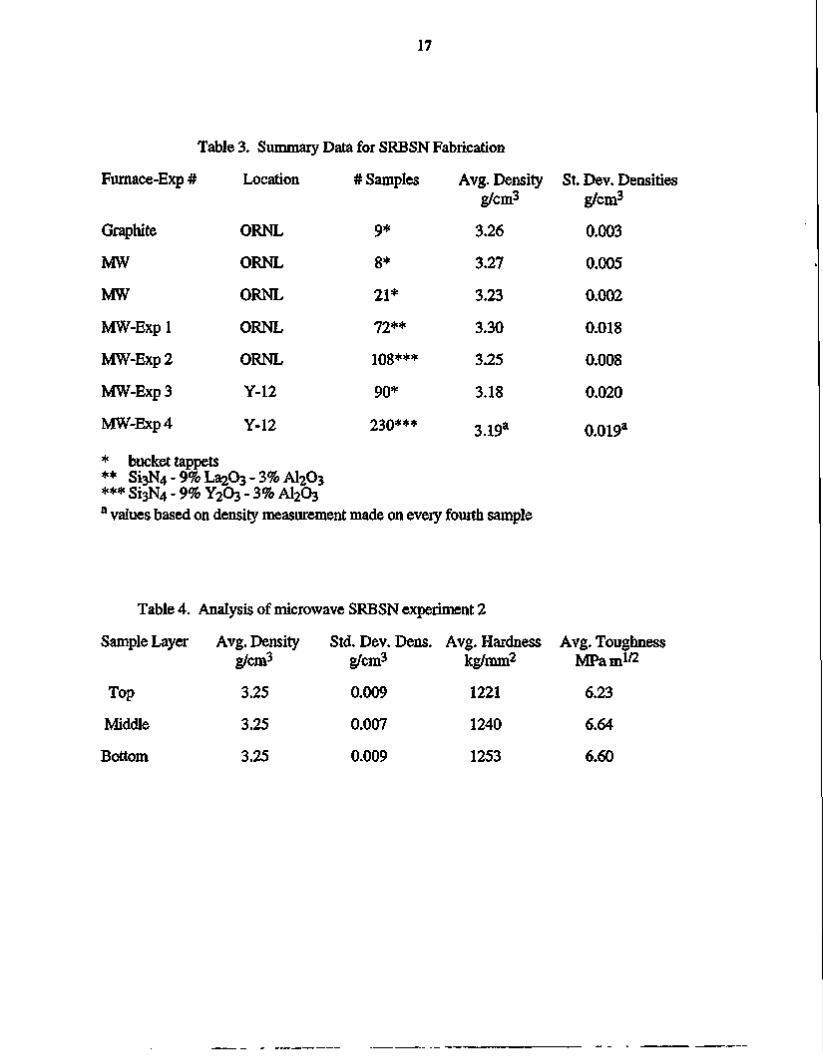
A summary of the average densities and statistical deviations for the 4 experiments are shown in Table 3, along with data from nitridation and sintering runs done in previous studies. An examination of the samples from experiments 1 and 2 indicated that the microwave heating uniformity appeared to be quite good, however the data in Table 3 indicates that the standard deviations were higher than scaleup experiments involving fewer samples. Since no large scale conventional experiments could be performed (lack of available samples) it is difficult to make statements as to whether microwave heating is more or less uniform than conventional heating. However, in the experiments where similar numbers of samples were processed, the standard deviations between the microwave and conventional heated materials were similar. Table 4 gives an additional breakdown of the densities of three sample layers of experiment 2, as well as the hardness and toughness values. These data show that there was good uniformity in the densities, hardness values, and toughness values for samples in all three layers of samples in experiment 2. Analysis of the data for experiments 3 and 4 performed at the larger microwave furnace at Y-12 shows that the statistical deviations of the 90 sample bucket tappet (experiment 3) and 230 sample gelcast pieces (experiment 4) were very comparable to the 72 sample run made at ORNL. It is possible that if the samples had been processed at 1800°C, higher densities and a lower standard deviation might have been achieved. There was slight warping in few of the thin bucket tappet samples of experiment 3, which were located along the outer periphery of the sample crucible. The warping of some buckets was probably due to a slightly lower temperature along the inner edge of the crucible. There was no sample warping of samples in the second Y-12 experiment. It was interesting to note that although the sample crucible used in experiments 3 and 4 was about

14
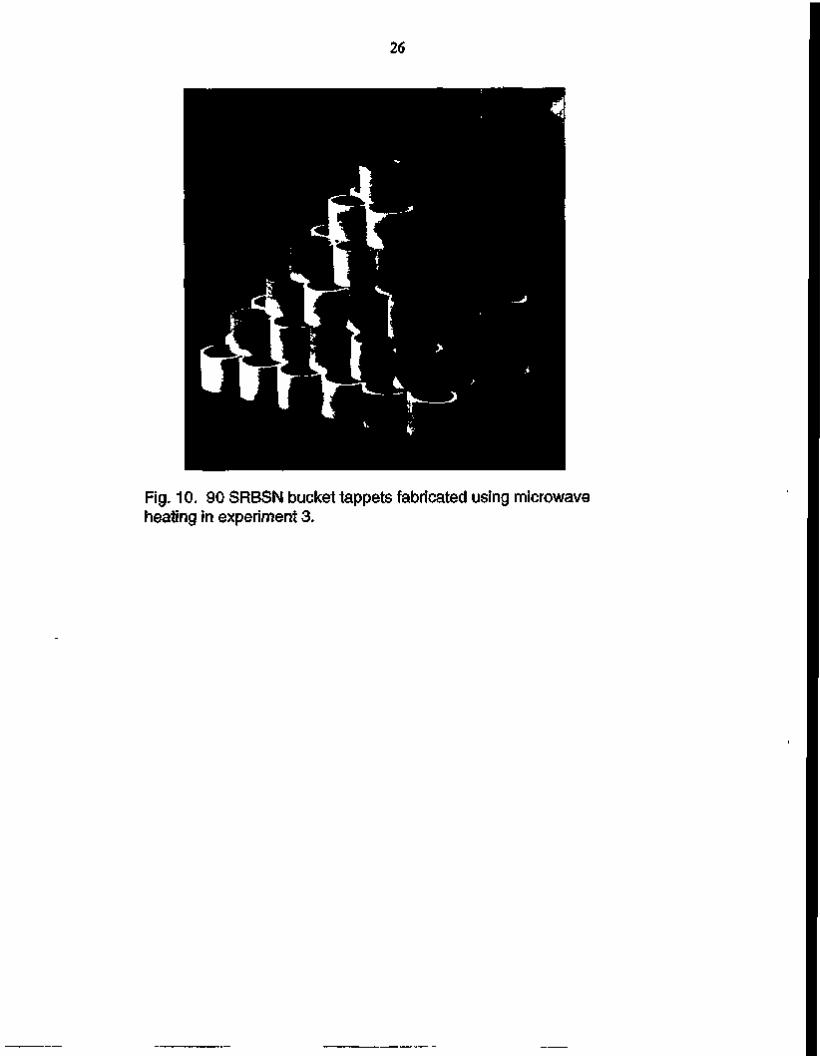
2 times that of the largest experiments performed at ORNL, the peak power used was similar, approximately 6 kW. Fig. 9 shows the microwave power - temperature curves for experiment 4. The low power use in the Y-12 experiment was due to the higher efficiency of microwave absorption at higher loads, and due to the thicker exterior fiberboard casket. The final run of 230 silicon parts met the milestone of 200 parts to be processed at the Y-12 facility. Fig. 10 and 11 are photos of the groups of SRBSN parts fabricated in experiments 3 and 4, respectively.
Semi-annual summary statements
Several statements are in order to summarize what has been learned to date from the Golden CRADA on the scaleup of the nitridation of silicon preforms and from the Ceramic Technology Milestone 112408 involving the scaleup of the nitridation and sintering of silicon preforms using microwave heating: Microwave heating shows promise for scaleup. Both silicon and RBSN do not suffer from "dielectric runaway," which plagues other ceramic-microwave systems. Microwave heating is attractive because it is one of the few ways to sinter SRBSN in a non-carbon environment. Microwave nitridation is a more attractive process than microwave sintering, because of the much more simple sample packaging used for nitridation (no powder insulation), and because the power required is less than half that required sintering. Microwave sintering of SRBSN is not viable for materials containing large amounts of contaminants, which may volatilize and migrate into the surrounding microwave insulation (rendering them useless) at temperatures above 1400°C. For both microwave nitridation and sintering processes, either special "hybrid-heating" crucibles must be used, or supplemental conventional heat must be provided to achieve uniform temperatures.
Status of Milestones
Milestone 112408 completed Oct. 4,1995, and the results have been reported in the Aug. -Sept., 1995 bimonthly.
Problems Encountered
None
Publications
Kiggans, J. O., Nunn, S. D., Tiegs, T. N., Davisson, C. C, Coffey, D. W., and Maria, J-P., "Gelcasting of Preforms for the Production of Sintered Reaction-Bonded Silicon Nitride" to be published in MPIF 4th International Conference on Powder Metallurgy in Aerospace, Defense, and Demanding Applications Proceedings (1995).
Kiggans, J. O., Tiegs, T. N., Lin, H. T., and Holcombe, C. E., "The Utilization of Microwave Heating for the Fabrication of Sintered Reaction-Bonded Silicon Nitride," pp. 59-63 in 30th Microwave Power Symposium Proceedings. International Microwave Power Institute, Manassas, VA, 1995.
Nunn, S. D., Kiggans, J. O. Jr., Simpson, R. E., and Maria, J. P., "Gelcasting of Silicon Compositions for SRBSN," to be published in the proceedings of the annual meeting of the American Ceramics Society, 1995.

15
Maria, J-P., Kiggans, J. O., Tiegs, T. N., and Nunn, S. D., "Gelcasting of Reaction-Bonded Silicon Nitride To Improve Mechanical Properties," to be published in the proceedings of 19th Annual Cocoa Beach Conference (1995).
Communications/Visits/Travel
Travel by J. O. Kiggans for the presentation of a paper, "Gelcasting of Preforms for the Production of Sintered Reaction-Boded Silicon Nitride" at the 4th International Conference on Powder Metallurgy in Aerospace, Defense, and Demanding Applications, May 8-10, 1995, in Anaheim, California.
Travel by J. O. Kiggans for the presentation of a paper, "The Utilization of Microwave Heating for the Fabrication of Sintered-Reaction Bonded Silicon Nitride" at the 30th Microwave Power Symposium, July 9-12,1995, in Denver, Colorado.
Travel to Golden Technologies in Golden, Colo, on July 13, 1995. The visit included a tour of the facility where SRBSN clevis pins are manufactured. Techniques for preparation of silicon powders and green bodies were discussed, as well as methods used for nitridation and sintering of these silicon parts.
Visit by T. N. Tiegs to Golden Technologies in Golden, Colo, on Sept. 14-15,1995. The visit included a tour of the facility where SRBSN clevis pins are manufactured, and discussions on the progress of the CRADA with Golden Technologies. Clevis pin samples which had previously nitrided by microwave heating at ORNL were given to Gary Garvey for sintering at their facility.

16
Table 1. OC-S13N4 content of clevis pin samples nitrided by microwave and conventional heating.
Temp. (°C) 1300 1300
1350
1450 1450
Furnace microwave microwave
graphite
graphite graphite
Atmosphere N2-4H2
N2
N2-4H2
N2-4H2 N2
cc-Si3N4 Content (%) 90 87
87
58 9
Table 2. Summary of experimental test conditions and results for nitridation of clevis pins using microwave heating.
Test #
1
2
3
4
5
6
7
8
Sample Total
100
100
36
36
36
36
100
60
Crucible Type
Si3N4-SiC
Si3N4-SiC
Si3N4-SiC-BN Si3N4-SiC-BN Si3N4-SiC-BN Si3N4-SiC-BN Si3N4-SiC-BN Si3N4-SiC-BN
Nitriding Gas
N2-4 vol % H2
N2-4 vol % H2
N2-4 vol % H2
N2-4 vol % H2
N2-O.8 vol % H 2
N2-O.8 vol %H2
N2-O.8 vol %H2
N 2-O.8 vol % H 2
Run Time (h) /
Temp. (°C)
8 / 1300
8 / 1300
11 / 1300
11 / 1300
11 / 1300
10 / 1200
18 / 1300
16 / 1300
Avg. % Wt. Gain Total
Samples ND
ND
43.33
42.98
43.49
41.75
44.18
43.85
Avg. % Wt. Gain
Exterior Samples
ND
ND
43.26
43.02
43.50
41.69
44.18
43.91
Avg. % Wt. Gain
Interior Samples
ND
ND
43.43
42.93
43.49
41.83
43.74
43.80
Standard Deviation of Total Avg. Wt. Gain
ND
ND
0.23
0.26
0.14
1.29
0.32
0.08
17
Table 3. Summary Data for SRBSN Fabrication
Furnace-Exp #
Graphite
MW
MW
MW-Exp 1
MW-Exp2
MW-Exp 3
MW-Exp 4
Location
ORNL
ORNL
ORNL
ORNL
ORNL
Y-12
Y-12
# Samples
9*
8*
21*
72**
108***
90*
230***
Avg. Density g/cm3
3.26
3.27
3.23
3.30
3.25
3.18
3.19a
St. Dev. Densities g/cm3
0.003
0.005
0.002
0.018
0.008
0.020
0.019a
* bucket tappets ** Si3N4 - 9% La203 - 3% A1203 *** S13N4 - 9% Y2O3 - 3% A1203 a values based on density measurement made on every fourth sample
Table 4. Analysis of microwave SRBSN experiment 2
Sample Layer Avg. Density Std. Dev. Dens. Avg. Hardness Avg. Toughness g/cm3 g/cm3 kg/mm2 MPam1/2
Top
Middle
Bottom
3.25
3.25
3.25
0.009
0.007
0.009
1221
1240
1253
6.23
6.64
6.60

18
1500
5~ iooo -
2 3
0 Q. £ I® 500
0 F»A , f■
100
80
60 O o < CD
40 | =5
A — Clevis Pin • — Bucket Tappet -m—TM145
20
Ll l l I l l l 0
0 50 100 Time
150 200
Figure 1. TGA analysis of silicon preforms.

19
O o p
2 Q. E |2
1500 I—i—i—n—|—i—i—i—i—[~~t—i—i—i—|—i—n—i—|—i—i—i—r-|—i—i—i—i—|—i—i—i—i—r
1000 -
500
Temp
_ i
Clevis Pin
Bucket Tappet
TM-145
0 * ■ 0
1 I l _ l I I L_l I l—I L
I 100
J I l—I I I I I I I I L
80
- 60
- 40
- 20
0 100 200 300 400 500 600 700
Time (min.) Figure 2. Percent Si-Si3N4 conversion for samples nitrided in a graphite furnace in N2 - 4 vol. % H2.
2000 -1—1—1—1—1—n—1—1—1—1—1—r - Thermal Runaway
0
T—1—1—1—|—1—1—1—r
-I ' ' ' I I I I I I I I I I I L. 0 100 200 300
Time (min) 400 500
Figure 3. Temperature profile obtained for test 1.

20
Top View
R S S S S S S S S S S i ^ ^
I
I OOOO'U d'o"cro*o ao'crao crcTc? 0'020'
sssssssssssssssssssssssssssssssssssss^^
Cross Section View
Alumina Fiberboard
Si3N4-SiC Boards
BN Setter Plate
Clevis Pin
Thermocouple with BN Sheath
Pyrometer Sight Hole
Alumina Fiberboard
BNTop
Si3N4-SiC Boards
Clevis Pin
Thermocouple with BN Sheath
BN Setter Plate
Figure 4. Alternate microwave package for processing sihcon clevis pins

21
1400 1200
I I I I | 1 I 1 1 | i n i i i n T T I n r n I I I I I n n ^
S 1000 o o 2 t a a. £ 0 H 0 g- 400 P. E (0 CO
800 600
200
e—e-
D H □'
■e— Interior Sample Temperature e— Exterior Sample Temperature
0 f i i i i 1 1 i i i i i ■ ■ i i ■ ■ t i i i i i i i i i i i i
0 100 200 300 400 500 600 700 Time (min)
Figure 5. Temperature profile for test 6

22
Fig. 6. Insulation package and 100 RBSN clevis pins following nitridation using microwave heating.

23
Fig. 7. Gelcast TM-145 silicon preform and mold used for casting it.

24
Fig. 8. Microwave insulation packages (a) and (b) showing layers of silicon preforms, as loaded for microwave heating experiments 3 and 4, respectively.

25
e—Temperature °C | MW Power (watts) I
2000 —'—l—l—r—l—r~r~'—"""I—r~r
1 5 0 0 "
1 0 0 0 - -
500
0
- i — i — i — i — | — i — i — i — i — g
1000 1500 Time (Min)
Fig. 9. Microwave power - temperature curves for experiment 4 in the scaleup of SRBSN using microwave heating.
26
Fig. 10. 90 SRBSN bucket tappets fabricated using microwave heating in experiment 3.

27
Fig. 11. 230 SRBSN parts fabricated using microwave heating in experiment 4.
28
W.B.S. Element 1.1.2.5 Development of a Low Cost Silicon Nitride Powder
D.F. Carroll, C.L. Conner, and G. A. Eisman,
The Dow Chemical Company Midland, MI 48667
SEMI-ANNUAL REPORT: April - September - 1995
OBJECTIVE/SCOPE
The objective of this program is to further advance the carbothermal nitridation process for producing silicon nitride powder developed during Phase I of the contract. This phase of the effort is focusing on identifying and demonstrating issues relating to the overall cost of manufacturing the powder. Specifically, the process which was demonstrated at the pilot plant level for the production of a high quality silicon nitride powder will be evaluated, modified, and refined as appropriate in order to reduce the overall costs. The tasks of this program are designed to: 1) determine the feasibility of using low cost raw materials and their impact on the final product quality; 2) reduce the processing costs; and 3) characterize, process, fabricate MORtest specimens, and evaluate the mechanical properties of the lower cost powder. Results of the sintering studies will be used to modify the sintering model developed under Phase I.
OVERVIEW
In order to meet the objectives of the program, the period from April through September focused on synthesis trials utilizing low cost raw materials, reformulated feeds, and a modified precursor preparation process. During this reporting period a total of 45 synthesis trials were performed. Although a large number of runs were carried out during this period, reactor power supply electrical problems developed and resulted in significant downtime. The unit was repaired and became fully operational by the end of August. During the period when synthesis trials were disrupted, the effort focused on feed preparation and analysis of the product produced prior to the shutdown. In addition to powder synthesis, a significant effort was also put forth in determining and modifying powder processing procedures which were developed in Phase I for densification of the powder. As a result, the sintering package developed during Phase I has been modified so as to incorporate the new powder.

29
TECHNICAL PROGRESS
Task 1.0 Low Cost Raw Materials
The first attempts to synthesize silicon nitride with alternative raw materials by the carbothermal process developed during Phase I were initiated at the onset of this reporting period. At first, the effort focused on an alternative for the silica used during Phase I while latter efforts investigated the synthesis of silicon nitride prepared with both the newly identified lower cost silica source and an alternative for one of the proprietary additives. Due to the fact that different raw materials will exhibit different handling properties, at the beginning of this period the feed preparation procedures had to be revisited from what had been developed under Phase I. Therefore, a number of precursors were prepared, analyzed, and evaluated to determine how well the feed components would mix and perform in the Dow process.
In addition to powder handling differences, the reactivity of the new starting material components had to be evaluated. Once it was determined that the feed components were intimately and randomly mixed in the precursor granule, a series of reactor runs had to be carried out whereby the reaction conditions had to be reconfirmed. Although it was anticipated that differences in reactor temperature would not be significant, some refinement of the heat schedule had to be made. This was addressed in a short series of synthesis runs. In addition to temperature, reaction time and flow rate also had to be reevaluated. The analysis of the product carried out to determine the effect of the reaction conditions on the powder included the determination of residual oxygen and carbon concentrations (via combustion analysis methods), the measurement of the surface area (via BET), particle size and particle size distribution (laser light scattering), and by observing the morphology of the crystallites via scanning and transmission electron microscopy (SEM & TEM). As a natural consequence of using TEM, the silicon carbide produced in the Dow process could also be analyzed. Once the reaction conditions were fine tuned and the properties found to be desirable, the powder was further evaluated by how it performed in greenware fabrication, sintering, and mechanical property testing (see below under Tasks 3 & 4).
Another aspect of the development of a powder utilizing new raw materials is the effect of reactor charge, or sample quantity, on both the time to complete the reaction as well as the effect on product quality. In order to assess the effect of the size of the reactor charge on the product, a number of runs were carried out whereby the precursor quantity was varied. Another critical aspect of this task was to determine the degree of reactivity as a function of location within the reactor core. In this evaluation, key properties such as residual oxygen and carbon were mapped within the reactor sample assembly itself. The results of the trials used to evaluate the reactor charge size are reported below in Table I. As above, it was determined that the best way to evaluate this effect was by looking at residual oxygen and carbon. During this test, the reactor conditions such as temperature, time, and flow rate were fixed. As can be seen from the results presented in Table I, all reaction charges of sizes up to 900 grams were completely converted. Further increases in reaction charge were not attempted.

30
Table I Reactor Charge vs. Residual Oxygen & Carbon
Trial #
1 2 3 4 5 6
Reactor Charge (grams)
227 454 563 681 794 908
Residual Oxygen (wt%)
1.53 1.58 1.43 1.57 1.55 1.51
Residual Carbon (wt%)
1.12 0.94 0.81 0.98 0.78 0.79
Reactor Modifications
During this period, a minor (proprietary) modification was made to the reactor internals in an effort to improve the distribution of feed gases through the sample assembly and therefore the charge. By making this change, the new gas flow pattern would ensure a more evenly distributed source of fresh nitrogen to the reacting precursor and therefore impact the ratio of nitrogen to carbon monoxide.
Powder Synthesis Trials
The powder properties generated in the program within this period are reported below in Table II along with the 2 kg delivered to MMES, the final powder deliverable under Phase I, and the powder specifications of the contract. Due to the large number of runs carried out during this period, only selected trials are listed. As is evident from the data, the synthesis results are fairly reproducible and similar (in properties) to the powder developed in Phase I. Although not reported in Table n, the metal impurity level was measured on selected synthesis products. In general, the iron level was measured to be approximately 250 ppm whereas the Al was measured at 450 -550 ppm. Both numbers are consistent with starting material purity. During the period though, it became evident that the Al content had increased to approximately 1100 ppm. After an investigation, it was determined that the higher Al content was a result of a mixing arm coming in contact with its container. Once corrected, the aluminum content returned to expected levels. Except for the aluminum and a slightly higher carbon level, the Phase II powder properties for material produced to date falls well within the specifications of the contract. The carbon specification is based on free carbon, not the carbon of silicon carbide as is produced in this process.
Differences do exist between the Phase I and II powders. Such differences include a lower surface area, larger particle size, as well as the previously mentioned higher metallic impurities. Even though this powder is not milled to reduce the agglomerates, the overall size of the fundamental crystallite is slightly larger in the Phase II powder. This is evident from the SEM presented in Figure 1 below. This increase in particle size would also

31
explain the drop in surface area of the unmilled powder. The drop from approximately 8 -9 m^/g for the unmilled Phase I powder to ~ 6 m^/g for the larger Phase II powder is not unexpected considering the raw materials in use. It is anticipated that further optimization of the process will impact some of these properties.
Table H Characteristics of Silicon Nitride Powder
From Phase II Feed -
Run Property
Oxygen (wt.%) Carbon (wt.%)
Surface Area (m2/g)+ % Alpha
30
1.28
0.85
5.60
>95
35
1.39
0.87
5.64
>95
45
1.54
1.15
6.14
>95
51
1.55
1.19
6.15
>95
55
1.60
0.83
>95
60
1.43
0.81
>95
66
1.37
0.78
5.80
>95
70
1.50
0.74
5.68
>95
75
1.53
0.84
5.86
>95
80
1.61
—
5.98
>95
85
1.57
0.75
5.80
>95
2kg Deliverable
1.5
0.75
5.85
>95
Phase I Powder
1.91
0.47
9.6
>95
Phase I Goals <2.5
<0.6
5-10
>90 + Powder was not de-agglomerated % alpha: estimated by x-ray diffraction
Reactor Power Supply Failure
As mentioned above, during the month of June, the reactor power supply failed and resulted in considerable downtime. The failure was the result of a series of blown power transistors which had to be replaced. Once corrected the unit ran for a number of runs until the problem resurfaced. The unit was sent back to the manufacturer for refurbishing and testing. Since its reinstallation, the unit has been fully operational.
Task 2.0 Reduction of Processing Costs
The focus of this task is to evaluate the process to produce silicon nitride developed during Phase I with the ultimate objective being to reduce the processing costs. As reported in previous bimonthlies, the first attempts focused on the pre-processing unit operations during which the feed composition is blended, mixed, and granulated. The second aspect of this effort is to reduce the carbon levels determined during Phase I. To date, experiments have been initiated to address both concepts. For the former, precursor preparation unit operations continue to be evaluated with the principal emphasis on the pre-mixing of the raw materials. Rather than utilizing a ball mill for the initial mixing, the material is processed by dry mixing in a Hobart mill. The material is then processed in a similar fashion to that developed earlier. The overall product mix and homogeneity of the precursor has been evaluated and shown not to be affected.
32
The second aspect of this task is to evaluate the effect of carbon content in the feed on reactivity as well as on the product. By lowering the carbon content in the feed, significant gains can be realized in cost reduction as well as throughput of the process. Tests have been carried out whereby the carbon level in the feed.has been controlled. Although not detailed in the list of runs (Table II), the trials tabulated include two different carbon levels. As mentioned previously, the overall results are consistent and little direct evidence exists to suggest the powder is impacted negatively by the above changes.
Task 3.0 Powder Evaluation and Part Fabrication
The main objective of this task is to characterize the low cost powders produced in Tasks 1.0 and 2.0 and provide feedback on the powders' ability to be pressureless sintered into components with good mechanical properties. A second aspect of Task 3.0 is to make adjustments to the sintering composition and schedule so that the low cost powder developed in Phase JJ can be pressureless sintered into components with maximum density, strength and fracture toughness.
Reactor Qualification
During the first month of Phase JJ, a new reactor facility was brought on line to produce the low cost silicon nitride powder. The initial reactor experiments were carried out with the raw materials used in Phase I so that the operating conditions could be defined for making high quality silicon nitride powder. Once the operating conditions were developed, the silicon nitride powder was evaluated using the sintering package developed in Phase I of this program. The results of this evaluation were compared to the sintered properties of components made with the same sintering package and Phase I powder. Using the recommended Y203/A1203 sintering composition, the silicon nitride powder was attritted in water and then slip cast into greenware approximately 2" x 2" in size. No noticeable differences were observed in the slip casting behavior of the silicon nitride powder produced in the new reactor. The slip cast greenware was then pressureless sintered to an average density of 98.9% of theoretical density using a two-step sintering cycle. This sintered density was found to equal the densities of components made with Phase I powder. These sintered components were submitted to Task 4.0 for mechanical property evaluation. With the new reactor on-line and capable of making high quality powder, the effort focus on the production of a lower cost silicon nitride powder as defined by Tasks 1.0 and 2.0 of this program.
Powder Evaluation
One of the first low cost silicon nitride powders produced in Task 1.0 was evaluated with the sintering package defined in Phase I to determine how the densification behavior varied from Phase I powder. This particular powder was made with low cost raw material silica A, additive 4B and excess carbon level Q2. The oxygen content, carbon content and surface area of this powder was measured to be 1.47 wt.%, 0.67 wt.% and -5-6 m2/g, respectively. The powder was evaluated using the following sintering composition: 87.93

33
vol.% Si3N4,4.77 vol.% Y2O3,2.55 vol.% AI2O3 and 4.78 vol.% Si02- The powder was first attritted in water, slip cast into greenware and pressureless sintered in a batch type furnace using a schedule that contained a 1600°C soak followed by a 1700°C soak for 10 hours. The sintered density of the component fabricated with Phase JJ powder was measured to be -96% of theoretical density. In comparison, a component made with Phase I powder was sintered to -99.0% of theoretical density. The lower sinterability of the Phase JJ powder is most likely due to the lower surface area and/or higher residual carbon (i.e., SiC) of the powder.
Sintering Package Development
One of the goals of Task 3.0 was to develop a sintering package for our carbothermal silicon nitride powder that would be amenable to "fast" sintering cycles using a batch type furnace. The information gained from this study should provide a baseline for those who would like to pressureless sintered the low cost silicon nitride powder in a continuous furnace environment. The definition of a "fast" sintering cycle is a schedule where the total time under heat-up and soak is limited to ~3 to 5 hrs. The length of the cool down cycle is limited by natural cool down of the furnace (~2-3 hours in length). The initial work under this task was to examine the best Y2O3/AI2O3 ratio and glass content for a "fast" sintering schedule that utilized a 1675°C, 1.5 hr soak. This evaluation was conducted on Phase I carbothermal powder to first establish a baseline while the production of Phase JJ silicon nitride powder was brought on line. The results indicated that with this short sintering cycle, Phase I powder could be easily sintered to -96% density when the Y2O3/AI2O3 ratio was between 2.5 and 3.6. For Y2O3/AI2O3 ratios within this range, the highest densities for this sintering cycle were obtained when the glass content was -11.4 volume %. This initial composition and glass content will be used as a starting point for developing a sintering package for Phase JJ powder.
A lot of Phase II silicon nitride powder was produced so that the "fast" sintering cycle could be developed. This particular powder was made with low cost raw material silica A, additive 4B and excess carbon level Q2 and had an oxygen and carbon content of 1.52 wt.% and 0.70 wt.%, respectively. Greenware was slip-cast with this powder using a sintering composition of 88.65 wt.% Si3N4, 8.11 wt.% Y203 and 3.25 wt. % A1203. Initial temperature/time profiles were conducted to determine which conditions would achieve densification and provide maximum a to P transformation for a total heatup and soak time of 3-5 hrs. The greenware plates were sintered in a BN crucible under flowing nitrogen gas without the use of a surrounding powder bed. Figure 2 summarizes the initial density results for the various temperature and time profiles. The results indicated that the highest density was obtained at 1675°C after a 1 hour hold. Higher sintering temperatures or longer sintering times resulted in a slight decrease in the final sintered density. This result suggests a maximum in the sintered density as a function of temperature and time.
When using a "fast" sintering cycle at relatively low temperatures, it is necessary to ensure that full alpha to beta transformation has occurred in the densified part in order to obtain maximum mechanical performance. In Figure 2, the weight percentage of beta silicon nitride as a function of the sintering conditions is also shown for the densified components.

34
For the component sintered at 1675°C for 1 hour, a beta silicon nitride content of-57% was measured. Higher sintering temperatures and longer sintering times were needed to complete the a to P transformation. Since these conditions are detrimental to density, the following sintering schedule was developed as a compromise to reach maximum density and beta silicon nitride content. Figure 3 is a schematic representation of the suggested sintering cycle. This sintering cycle contains an initial soak at a high temperature to achieve initial densification followed by a lower temperature soak to maximize the alpha to beta transformation. The second lower soak is at a temperature that is not detrimental to densification.
In order to develop the proposed sintering format described in Figure 3, carbothermal silicon nitride plates (2" x 2") were cast using Phase JJ powder and a formulation of 88.71 wt.% Si3N4,7.76 wt.% Y203 and 3.53 wt. % A1203. These plates were then sintered using the conditions shown in Figure 4. The density of these sintered plates were measured to be 97.7% of theoretical with a beta silicon nitride content of 70 wt.%. These densified plates were then machined into test specimens to characterize the mechanical properties. The results of the mechanical property measurements are summarized in Task 4.
In order to try an improve the sintered density of our Phase II powder, the "fast" sintering cycle was further investigated to determine the conditions which would yield maximum density and beta silicon nitride content. The results of this study indicated that, within the limits specified by the "fast" sintering cycle, the highest densities and beta silicon nitride contents that were obtained in a sintered component made with Phase JJ powder were -97% and 80 wt.%, respectively. Current work is underway to determine the maximum density and beta silicon content which can be achieved at longer sintering times and higher temperatures using a conventional batch sintering cycle. It appears from this work that it may be very difficult to achieve greater than 99% density with Phase JJ powder using pressureless sintering conditions. With a surface area of-5-6 m2/g, overpressure sintering conditions may be required to fully density our current Phase U powder. This result is not surprising since most commercial silicon nitride powders with similar surface areas also require pressure-assisted densification methods to achieve full density.
To determine if an increase in glass content could improve the pressureless sintered density of components made with Phase II powder, a study was initiated where the amount of glass in the sintering formulation was varied from a total of 10.5 to 12.3 volume%. The oxygen content from the silicon nitride powder was assumed to be in the form of Si02 and taken into consideration during calculation of the glass content. This study also varied the Y203/A1203 ratio in the sintering formulation so that the effect of glass content and composition on the sintered density and alpha/beta transformation of Phase JJ powder could be determined. The Y203/A1203 weight ratio was varied from 1.5 to 3.0. The Phase JJ silicon nitride powder used for this evaluation had an oxygen and carbon content of 1.46 and 0.80 wt.%, respectively. These formulations were slip cast to produce greenware with green densities ranging from 58 to 60%. The components were sintered at 1610 and 1640°C with a soak time of 2.5 and 4.5 hours. Higher sintered

35
temperatures were not investigated since they yielded a decrease in density. The results of this study are summarized in Figure 5. The increase in glass content was found to improved the sintered density slightly but not above 97-97.5% of theoretical density. Unless the glass contents is increased further to excessive levels, it appears that the maximum sintered density for our current Phase JJ powder has been achieved for this rapid sintering schedule and Y203/A1203 formulation. It is expected that an increase in the surface area of the Phase JJ powder would improve the densification behavior under these conditions. Other trends which were observed in this study and summarized in Figure 5 are as follows:
-an increase in glass content had a minimal an effect on the degree of alpha to beta transformation.
-the degree of alpha to beta transformation was higher for glass compositions with a lower Y203/A1203 ratio.
-the degree of alpha to beta transformation increased at the higher sintering temperature and time (1640°C, 4.5 hrs).
-the lower Y203/A1203 ratio yielded higher sintered densities at sintering conditions of 1610°C, 2hrs.
-at 1640°C, 4.5 hrs, the Y203/A1203 ratio of 3.0 yielded the highest sintered densities.
Task 4.0 Part Fabrication and Mechanical Property Characterization
The effort under this task is directed toward the production of slip cast greenware and sintered parts to meet our deliverables (25 MOR specimens ) to MMES at the end of 7 and 12 month of the contract. This task will also characterize the mechanical property specimens fabricated in Task 3.0 in order to determine the average fracture strength and Weibull modulus.
The mechanical properties of the material made during qualification of the new reactor were characterized by measuring the 4 point bend room temperature strength. This material was made from carbothermal silicon nitride powder produced in our new reactor facility using raw material precursor leftover from Phase I. The results of the mechanical property measurements showed that the average strength and Weibull modulus of the component was 535 ± 95 MPa and 5, respectively. These mechanical property results were significantly lower than components fabricated during Phase I. Fractography analysis indicated that the main fracture origin were due to inhomogeneous greenware. Even though there was no major difference in slip properties with this powder, the characteristics of the greenware were obviously different from Phase I. A program was initiated to eliminate this type of defect from our greenware when using Phase JJ powder.
The first part deliverable during Phase JJ required 25 MOR bars to be sent to MMES at the end of the 7 month of the contract. The specimens used for this deliverable were machined from sintered plates with a density of 97.7%. These plates were sintered with the fast schedule describe in Task 3. A total of 32 four-point bend flexure specimens were

36
machined from the material. Seven of these specimens were broken in-house to determine the average room temperature fracture strength. The remaining twenty-five specimens were delivered to MMES as part of our 7 month deliverable. The average fracture stress of this material was measured to be 730 ± 80 MPa. Fracture surface analysis revealed the major flaw to be localized porosity. It is believed that improvements in sintered density would minimize this defect and increase the overall fracture strength of the material.
Figure 1. Scanning Electron Micrograph of Phase JJ Powder

37
1 2 3
Time (hrs)
Figure 2. Percent of theoretical density and beta silicon nitride content for components sintered at different temperatures and times.
Time
Figure 3. Schematic representation showing recommended sintering schedule for Phase II carbothermal silicon nitride powder. The recommended sintering schedule simulates a "fast" sintering cycle.

38
1675
1650
O 1625
oS 1600 o. E I 1575
1550 •
RT 0 1 2 3 4 5 6 7
Time (hrs)
Figure 4. Sintering schedule utilized for a 88.71 wt.% Si3N4, 7.76 wt.% Y203 and 3.53 wt.% A1203 formulation.
"■■ 1 1
1630°C
A 7 • /
i i — ■ i
1615°C
' '
97.8%
P =70%
•
T=1610°C
t = 2.5 hr t = 4.5 hr CO o
• ■ = > .
C CD CD
£°
97
9 0
io<r
40
^
I H ^ i
1.5
^
i r
3.0 1.5 ~~r3.0
Y203 /Al203 Weight Ratio
T =1640°C
t = 2.5 hr t = 4.5 hr CB O 9 7
CD CD
9 0
100"
W 5 4 0 "
* « * <
T" T
! • ! *
■ * * * ,
X 1 ' 1 3.0 1.5 3.0 1.5
Y203/AI203 Weight Ratio
Figure 5. The % theoretical densttity and the % betasilicon nitride for sintered components made with Phase II powder as a function of the Y203/A1203 ratio in the sintering package. The results are shown for components made with a total glass content of 10.5 vol.% (solid lines) and 12.3 vol.% dashed lines). The components were sintered at 1610 and 1640°C for 2.5 and 4.5 hours, respectively.

39
STATUS OF MILESTONES All milestones are on schedule. During this period 2 kg of powder and 25 MOR test specimens were sent to MMES as dictated by the deliverable schedule.
PUBLICATIONS A presentation was made at the 1995 Annual American Ceramic Society Meeting held in Cincinnati, Ohio in April.
COMMUNICATION/TRAVEL/OTHER Dr. C.L. Conner visited AlliedSignal Ceramic Components in May. Drs. G. A. Eisman, D. F. Carroll, and C.L. Conner attended the 1995 Annual American Ceramic Society Meeting held in Cincinnati, Ohio (April). Professor Stephan Danforth of Rutgers University was sent 1 kg of Phase I powder. Dr. Michael Hoffmann of the University of Karisruhe (formerly of the Max Planck Institute) was sent a kilogram of Phase I powder. AlliedSignal was supplied 20 kg of Phase I powder for further assessment.

40
Cost Effective Sintering of Silicon Nitride Ceramics (SIU-Q-D. E. Wittmer, Southern Illinois University, Carbondale, TL 62901
Objective/Scope
The purpose of this work is to investigate the potential of cost effective sintering of Si3N4 through the development of continuous sintering techniques and the use of lower cost Si3N4 powders and sintering aids.
Technical Highlights
Task 1. Refine Economic Model and Design for Chosen Furnace
Configuration
This task was completed as reported in a previous semiannual report.
Task 2. Continue evaluation of sintering parameters on properties of selected Si3N4 compositions
Continuous Sintering
A total of 66 billets (approximately 100 g each) were continuously sintered at Centorr/Vacuum Industries in the Model 44-BF prototype furnace at 1775°C for 90 min. These sintering trials served the purpose of proof testing the tungsten hot zone prior to shipment of the furnace to SIU-C. SigN^ test bars representing the A2Y6, A4Y6 and A2Y8 formulations, prepared with both Ube E-10 and Dow Chemical Co. silicon nitride powders, were machined from these billets. Room temperature four-point flexural strength and fracture toughness, oxidation resistance, and elevated temperature four-point flexural (fast fracture) strength were measured. The results of this work form the basis of a Master's thesis and will be discussed in more detail as part of Task 3.
After installation of the Model 44-BF belt furnace at SIU-C, 60 additional billets were continuously sintered to both qualify the furnace after delivery and installation were completed and to observe the effects of turbomilling and sintering parameters on the sinterability of the Dow Chemical Co., Shin-Etsu, and Ube E-10 8*3^ powders. The details of the turbomilling time and sintering conditions, along with the bulk density results will also be presented and discussed in more detail in Task 3.
Continuous sintering of H. C. Starck M-l 1 powder (a gratis sample provided by H. C. Starck) in the A4Y6 formulation is presently being completed. Variables for these milling runs were milling media type (silicon nitride or YTZ) and dispersion technique (pH control or dispersant with pH control).
41
Improved Processing
Four lots of H. C. Starck M-l 1 powder (a gratis sample provided by H. C. Starck) in the A2Y8 formulation were processed by mrbomilling and pressure filtration. Variables for these milling runs were milling media type (silicon nitride or YTZ) and dispersion technique (pH control or dispersant with pH control). The dispersant utilized was Rohm and Haas-Duramax D-3007 which is an acrylic copolymer with low sodium content. Disks have been pressure cast, dried and isopressed and are currently being continuously sintered in the Model 44-BF belt furnace. Density, four-point flexural strength, elevated temperature strength and microstructure will be compared with the same formulation using the other silicon nitride powders.
Elevated temperature, four-point flexural strength, and fracture toughness continue to be measured for A2Y6, A2Y8 and A4Y6 processed using Ube E-10 powder. For the A4Y6, solids loading (30 and 40 vol.%) and mrbomilling processing temperature (10 and 20 °C) were the variables investigated. For the A2Y6 and A2Y8 formulations, processing was completed at 30 vol.% and 10°C. The properties of all formulations continue to be measured as test bars are generated from the continuous sintering runs.
In general, processing at the lower solids content and the lower processing temperature has produced stronger material at room temperature and elevated temperature. Also, the A2Y8 formulation has consistently displayed the greatest high-temperature flexural strength (730 MPa at 1000°C and 330 MPa at 1350°C), compared with the A2Y6 and the A4Y6 formulations.
Fracture toughness by the strength method was also completed for the A4Y6-E10 formulations; solids loading (30 and 40 vol.%) and turbomilling processing temperature (10 and 20°C). The lower solids content and the lower processing temperature appeared to produce marginally higher fracture toughness; however additional testing is planned to produce more statistically significant data.
Task 3. Continue Evaluation of Low Cost Si3N4 Powder
The goal of this task is to evaluate silicon nitride powders which are potentially more cost effective than Ube E-10, but which can be processed to produce properties similar to those obtained for Ube E-10 or used in applications which are not as demanding. To this end, we have been evaluating the Dow powder produced by carbothermal reduction, the Shin-Etsu SN10-DW powder produced by nitridation of Si, and the H.C. Starck M-l 1 powder, also produced by nitridation of Si.
In previously reported work, A2Y6, A2Y8 and A4Y6 formulations were prepared from the Dow Chemical Co. silicon nitride powders. The same formulations were prepared, using Ube E-10 silicon nitride powder, for comparison of the room temperature and high temperature properties. As reported in Task 2, billets of all formulations were sintered continuously at 1750°C for 90 min in the same sintering runs to produce consistent sintering conditions for each test billet. Table I is a summary of the room

42
temperature and elevated temperature properties measured as an average of 3 test bars per test condition.
Table I. Results for Ube and Dow Si3N^ formulations that were continuously sintered at 1750°C for 90 min.
Comp.-Powder
*
A2Y6-U
A2Y6-D
A4Y6-U
A4Y6-D
A2Y8-U
A2Y8-D
Density % of TD
96.4
87.7
99.3
90.3
96.1
92.7
Four-Point Flexural Strength
RoomT
1068
698
881
712
1088
889
850°C
792
622
755
709
747
821
1000°C
707
476
578
506
730
689
1200°C
622
478
551
437
641
633
1350°C
253
253
251
187
329
390
K I C (MPa-m1/2)
6.5
5.8
6.2
5.7
6.7
6.2
* The -U and -D extensions to the compositions indicate the use of either Ube or Dow S13N4 powder, respectively, in the formulations.
The following conclusions were made with regard to the observed results:
Billets prepared from Ube E-10 had significantly higher density for all formulations. Because equivalent density was not obtained for formulations prepared with both Ube and Dow powders, the direct comparison of properties is not justified. Room temperature strength and fracture toughness values were higher for formulations prepared with Ube E-10, with the A2Y8 formulation having higher strength and fracture toughness.
Elevated temperature strength was higher for formulations prepared with Ube E-10, except for the A2Y8 formulation at 1350°C.

43
It is expected that the properties of the formulations prepared from the Dow powder can be improved significantly if densification can be improved. The primary differences between Ube and Dow powders are: surface area, carbon content and oxygen content (amount and location). It was believed that with more intensive turbomilling and the use of a thermal pretreatment that the densification behavior of formulations prepared with the Dow powder could be improved.
To determine the effect of increased milling time of the sinterability of the Dow powder in the A4Y6 formulation turbomilling was conducted for 2, 4, 6 and 8 hours. The billets were continuously sintered in the belt furnace for several times and temperatures to observe the effect of turbomilling time on sinterability. The results of density as a function of turbomilling time and sintering conditions are given in Table JJ. These results show that increasing the turbomilling time did not lead to enhanced densification as hoped, with the densities being significantly lower than obtained for the other two powders for the same sintering conditions. Also, the Dow formulations had higher density at lower sintering temperature and time (1700°C and 60 min) and the density did not increase with temperature and/or time as is usually observed for other Si3N4*s. The use of low sintering temperatures, presintering and/or seeding will be investigated to determine if the densification can be improved.
The gratis sample of Shin-Etsu 8 1 3 ^ (a potential low cost powder) in the A4Y6 formulation was continuously sintered during this reporting period for three time/temperatures. The results are also given in Table JJ. This powder in the A4Y6 formulation has similar sinterability to the results previously obtained for Ube E-10, but it has much higher green density (67% compared with 59%). Additional sintering trials are currently taking place and billets will be machined into test bars to measure the room temperature and elevated temperature properties.
The densities obtained for the Ube E-10 formulations were also significantly lower than obtained in previous work. There is some indication that these differences are caused by this being a "new" lot of powder purchased from Ube recently. Some additional milling and sintering trials are underway to determine if these differences are due to the powder or processing. This should be completed during the next reporting period.
Task 4. Design and Construct Prototype Belt Furnace
Construction of the prototype belt furnace by Centorr/Vacuum Industries, Inc. (CVT), Nashua, NH was completed and the furnace was proof tested at CVI prior to delivery and installation at SIU-C. Since installation, the Model 44-BF belt furnace (with the tungsten hot zone installed) has been in operation for a total of 172 hours of high-temperature operation (35 sintering runs) without any problems with the furnace. Potential problems which may arise due to power outages have been corrected by the installation of a gas bypass line and an additional cooling water/drain line. Discussions are underway with gas vendors for the installation of a bulk liquid nitrogen supply.

44
Addition of bulk supply will eliminate delivery and quality issues and reduce the cost of process gas.
In addition to the materials formulated and processed at SIU-C, materials have been received from Golden Technologies Company (GTC), Norton Advanced Ceramics (NAC) and Allied Signal Inc. (ASI) for continuous sintering in the new belt furnace.
Several continuous sintering runs have been completed on GTC SRBSN. Many of the specimens of SRBSN from GTC were sintered to full density under a range of continuous sintering conditions. Based on these preliminary results, SIU-C and GTC will continue to investigate continuous sintering of GTC sihcon nitride under a Memorandum of Agreement. The goal of this work will be to determine the economics of continuous sintering for pilot production scale quantities of sihcon nitride parts and will provide the basis of Master thesis.
As part of the NAC ACMT contract, the belt furnace has been used successfully to continuously sinter several sihcon nitride parts. Additional materials are expected shortly for sintering in the belt furnace under a collaborative program with NAC. The details are presently being discussed.
The results for the ASI materials were encouraging and additional materials have been requested to complete sufficient validation of continuous sintering for ASI sihcon nitride. Following validation, the intent in to develop a collaborative program with ASI through a Memorandum of Agreement or a Memorandum of Understanding for sintering a much larger number of parts.
Status of Milestones
1. Refine Economic Model and Design for Chosen Completed Furnace Configuration
2. Continue Evaluation of Sintering Parameters On Schedule on Properties of Selected Si3N4 Compositions Continuing
3. Continue Evaluation of Low Cost Si3N4 Powders On Schedule Continuing
4. Design and construct prototype belt furnace Completed
45
Communications/Visits/Travel
D. E. Wittmer to Annual American Ceramic Society Conference and Exposition Cincinnati, OH May 1-4, 1995.
C. W. Miller, Jr. to SIU-C to finalize furnace installation, June 5-8, 1995.
D. E. Wittmer to Golden Technologies Company, Inc. to discuss results of continuous sintering of SRBSN and future collaborative efforts between GTC and SIU-C.
D. E. Wittmer completed and signed a Memorandum of Understanding with GTC and is awaiting approval and signature of GTC.
Problems Encountered
Isopress was down for 3 weeks waiting for repair parts which has delayed final processing of M-l 1 compositions. The isopress has been repaired and work is continuing.
Publications
B. E. Rodely, "Effect of Powder Source on Properties of Si3N4 at Ambient and Elevated Temperatures," Master of Science Thesis, Southern Illinois University at Carbondale, College of Engineering, August, 1995.
D. E. Wittmer , B. E. Rodely, V. A. Knapp, and S. P. Etherton, Southern Illinois University, Carbondale, JL and C. W. Miller, Jr., Centorr/Vacuum Industries, Inc., Nashua, NH, "Comparison of Properties for Formulations Prepared From Two Sihcon Nitride Powders," Abstract of paper to be presented at the 1996 Conference on Composites and Advanced Materials, Cocoa Beach, FL, January, 1996. To be published in Ceramic Engineering and Science Proceedings.
Presentations
None
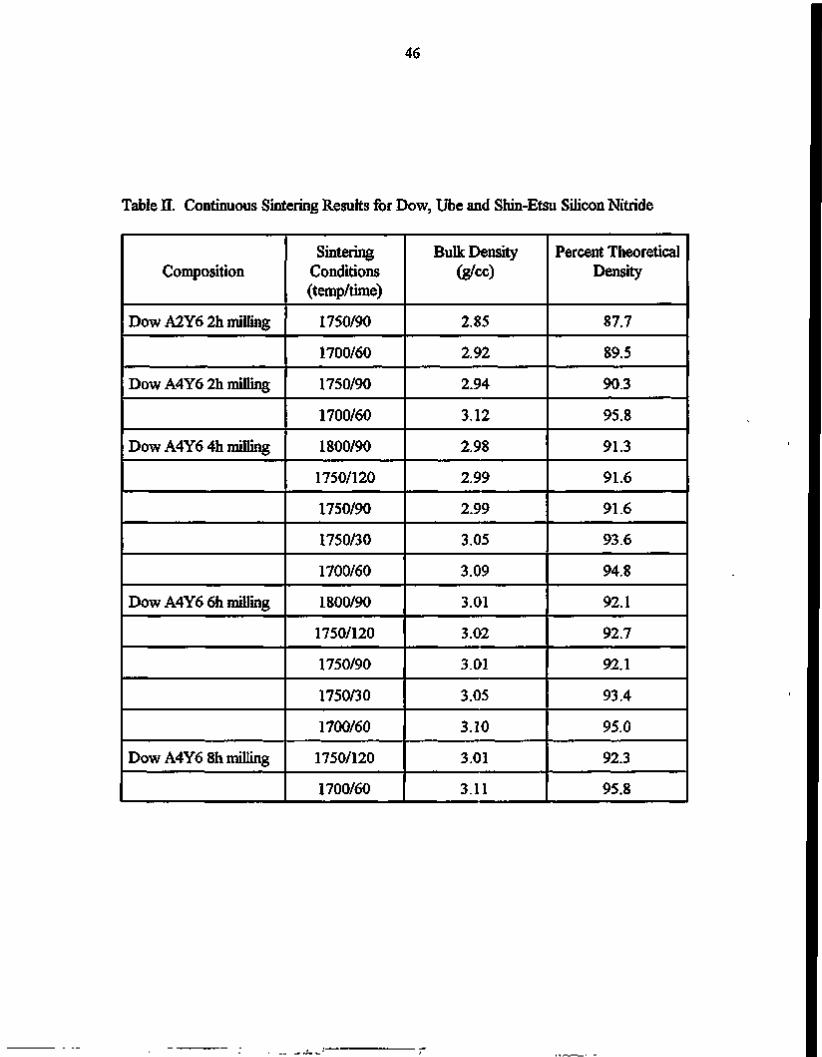
46
Table U. Continuous Sintering Results for Dow, Ube and Shin-Etsu Sihcon Nitride
Composition
Dow A2Y6 2h milling
Dow A4Y6 2h milling
Dow A4Y6 4h milling
Dow A4Y6 6h milling
Dow A4Y6 8h milling
Sintering Conditions (temp/time)
1750/90
1700/60
1750/90
1700/60
1800/90
1750/120
1750/90
1750/30
1700/60
1800/90
1750/120
1750/90
1750/30
1700/60
1750/120
1700/60
Bulk Density (g/cc)
2.85
2.92
2.94
3.12
2.98
2.99
2.99
3.05
3.09
3.01
3.02
3.01
3.05
3.10
3.01
3.11
Percent Theoretical Density
87.7
89.5
90.3
95.8
91.3
91.6
91.6
93.6
94.8
92.1
92.7
92.1
93.4
95.0
92.3
95.8

47
Table JJ. Continuous Sintering Results for Dow, Ube and Shin-Etsu Sihcon Nitride (continued).
Ube A2Y6 2h milling
Ube A4Y6 2h milling
Ube A2Y8 2h milling
Shin-Etsu A4Y6
2 h milling
1750/90
1750/30
1700/60
1750/90
1750/30
1700/60
1800/90
1750/120
1750/90
1750/30
1700/60
1800/90
1750/90
1750/30
3.13
2.88
2.84
3.17
3.09
3.08
3.17
3.06
3.03
3.04
3.04
3.23
3.16
3.08
96.4
88.5
87.2
97.3
94.7
94.4
96.8
93.4
92.3
92.8
92.9
99.1
97.1
94.4

48 1.1.4 Processing of Monolithics
W.B.S. ELEMENT 1.1.4.2 IMPROVED PROCESSING
S. D. Nunn, O. O. Omatete, and C. A. Walls Oak Ridge National Laboratory
Objective/Scope
To determine and develop the reliability of selected advanced ceramic processing methods. This program is to be conducted on a scale that will permit the potential for manufacturing use of candidate processes to be evaluated. The emphasis is on silicon nitride. Issues of practicality; safety, hygiene, and environmental issues; and in-process testing methods are to be addressed in addition to technical feasibility. The methodology includes selection of candidate processes and evaluation of their range of applicability to various kinds of commercially available ceramic powders.
Technical Highlights
I. Silicon Nitride Gelcasting - Dow Powder (C. A. Walls)
Dow Chemical Co. is developing a low-cost silicon nitride powder under W. B. S. Element 1.1.2.5 of the Ceramic Technology Project. As part of the evaluation of this powder, we will be conducting experiments to characterize its behavior in gelcasting.
Continued sintering studies with gelcast Dow phase 1 materials to improve density and sintering characteristics has yielded some success. Four samples fired in separate runs utilizing two 1800° C sintering schedules gave parts with fired densities in the range of 96 percent of theoretical density. Both of the firing schedules incorporated low temperature soaks as recommended by Dow and density improvements were seen (Table 1) for both of the low temperature soak levels we tried. AH parts survived with no warpage, cracking, or distortion. As with previous firings we noted no improvement in properties between the gelcast parts and the gelcast/isopressed parts. In all of this material five weight percent yttrium oxide and five weight percent aluminum oxide were used as the sintering aids.
Table 1. Gelcast phase 1 sintered densities
Sample #
1790°C.2hr #2 #4
1700°C.2hr #2 #4
1700°C.4hr #2 #4
1750°C. 4hr #2 #4
1800°C. 2hr #1 #3
1800°C. 2hr #1 #3
Part History
as gelcast aelcast/isopressed
as gelcast aelcast/isopressed
as gelcast aelcast/isopressed
as gelcast aelcast/isopressed
as gelcast aelcast/isopressed
as gelcast aelcast/isopressed
Green Bulk q/cc
1.60 1.74
1.60 1.74
1.60 1.74
1.60 1.74
1.61 1.78
1.61 1.78
Fired Immersion
a/cc
3.02 2.93
3.03 3.05
3.12 3.11
3.05 2.97
3.15 3.14
3.14 3.13
%of Theoretical
%
91.50 88.60
92.00 92.40
94.40 94.30
92.30 90.00
9 6 . 4 0 9 6 . 2 0
9 6 . 3 0 9 6 . 0 0
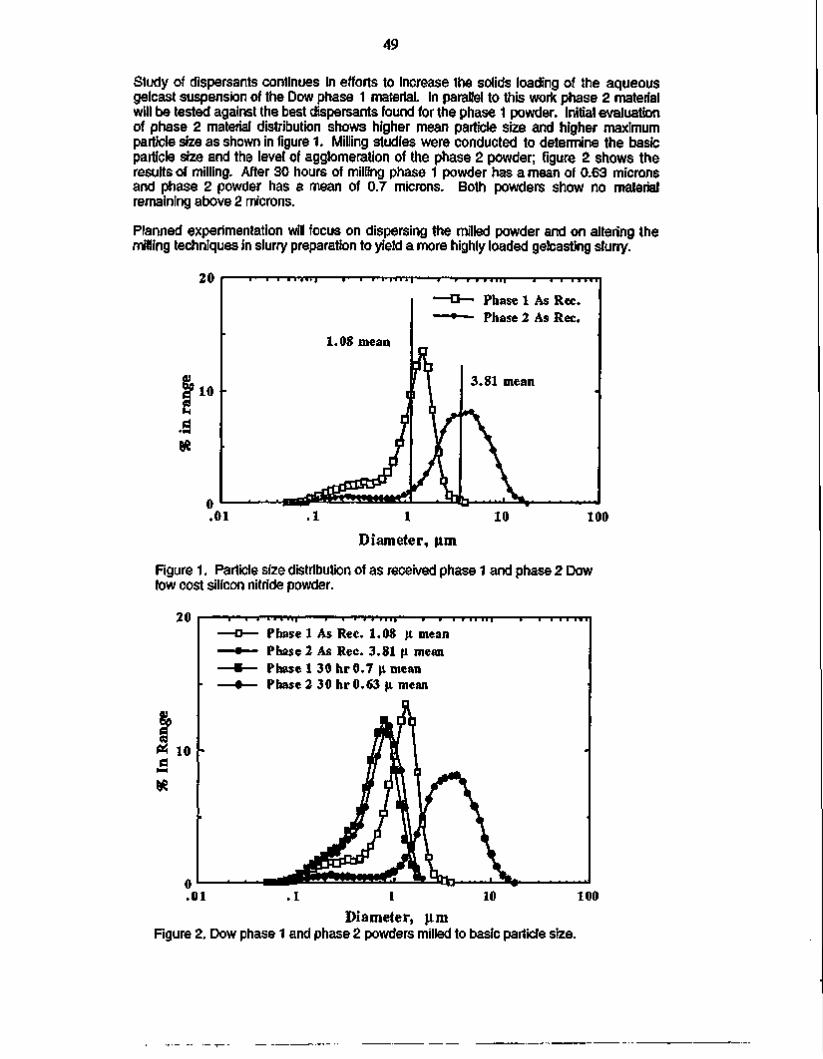
49
Study of dispersants continues in efforts to increase the solids loading of the aqueous gelcast suspension of the Dow phase 1 material. In parallel to this work phase 2 material will be tested against the best dispersants found for the phase 1 powder. Initial evaluation of phase 2 material distribution shows higher mean particle size and higher maximum particle size as shown in figure 1. Milling studies were conducted to determine the basic particle size and the level of agglomeration of the phase 2 powder; figure 2 shows the results of milling. After 30 hours of milling phase 1 powder has a mean of 0.63 microns and phase 2 powder has a mean of 0.7 microns. Both powders show no material remaining above 2 microns.
Planned experimentation will focus on dispersing the milled powder and on altering the milling techniques in slurry preparation to yield a more highly loaded gelcasting slurry.
20
10
■ i—i—111 i i i i i J 11 H I
1.08 mean
Phase 1 As Rec. Phase 2 As Rec.
3.81 mean
.01 100 Diameter, u,m
Figure 1. Particle size distribution of as received phase 1 and phase 2 Dow low cost silicon nitride powder.
20
« 10
o
■ i—111 H I — i — i — 1 1 1 1 1 I I i i—1111
a— Phase 1 As Rec. 1.08 u mean •— Phase 2 As Rec. 3.81 u mean •9— Phase 1 30 hr 0.7 u mean •— Phase 2 30 hr 0.63 u mean
.01 .1 1 10 100 Diameter, u,m
Figure 2. Dow phase 1 and phase 2 powders milled to basic particle size.

50
II. SRBSN Gelcasting (S. D. Nunn)
Evaluation was begun on the preparation of large SRBSN gelcasting batches (1 kg) using ball milling instead of attrition milling. The SRBSN compositions were prepared using the alcohol-based gelcasting system. It was found that batches containing 50 vol. % solids could be readily prepared by this method. Castings from the slum'es include plates of varying thickness (0.2, 0.25, and 1.0 in.) for determination of the effect of green density and sample thickness on the degree of nitridation under constant processing conditions.
Samples were isopressed to vary the green density of the silicon compact before the nitriding heat treatment. Green density can have a significant effect on the nitridation kinetics if the volume expansion of the silicon near the surface of the sample limits the nitrogen from access to the unreacted silicon at the interior of the sample. The results of comparison testing are shown in Table 2.
The effect of sample thickness on the degree of nitridation was also compared. Samples having thicknesses of 0.2, 0.5, and 1.0 in. were gelcast and nitrided. The results, shown in Table 3, indicate only a slight decrease in nitridation rate for the thickest samples. This lack of dependence on thickness is believed to be due to the uniform open pore structure which exists in the gelcast materials allowing easy diffusion of the nitrogen gas to the interior of the samples.
With the completion of these tests and the physical property measurement tests reported in the previous semiannual report, the requirements for Milestone 114212 have been completed on schedule.
Table 2. Comparison of the effect of isostatic on nitridation of silicon compacts.
Sample Number 1 2 3 4
Isostatic Pressing Pressure (psi) 0
5,000 10,000 20,000
Table 3. Comparison of the effect of sample thickness on
Sample Number 1 2 3
Sample Thickness (in.) 0.2 0.5 1.0
Percent Nitridation (%) 87 85 83 79
nitridation of silicon compacts.
Percent Nitridation (%) 87 89 83
III. Drying of Gelcast Green Bodies (O. O. Omatete)
It was reported earlier that "the data indicated very little loss of moisture from the plates held at 50°C and 92 % relative humidity for 10 h." The cause of this anomaly has been found. At 50°C and 92 % relative humidity, there was condensation on top of the chamber and around the plate protecting the balance on top of the chamber. This condensate dropped back onto the plates and formed a pool of water there. Thus, the moisture was re-adsorbed and there was no loss at those conditions. Three modifications of the schedule have been designed to overcome this condensation problem. These are shown in Table 4. In addition, the chamber was modified.

51
Table 4: Three Schedules for Drying Gelcast Parts
Schedule I Segment Rel Humidity Temp. °C Time, h Next Segment
1 92 25 0.5 2
2 92 25 10 3
3 75 25 1 4
4 75 25 10 5
5 50 25 1 6
6 50 25 10 7
7 50 25 1 7
Schedule II Segment Rel Humidity Temp. °C Time, h Next Segment
10 92 25 0.5 11
11 92 35 1
12
12 92 35 10 13
13 75 35 1
14
14 75 35 10 15
15 50 35 1
16
16 50 35 10 17
17 50 25 1
18
18 50 25 1
18
Schedule III Segment Rel Humidity Temp. °C Time, h Next Segment
20 92 25 0.5 21
21 92 35 1
22
22 92 35 10 23
23 75 35 1
24
24 75 35 10 25
25 50 35 1
26
26 50 50 1
27
27 50 50 10 28
28 50 25 1
29
29 50 25 1
29
Thirteen runs have been completed on the drying of two thicknesses of alumina plates. Table 5 shows the details of the runs. It shows the premix solution used, the age of the slurry and the mass of water lost. More importantly, it shows the drying program schedule used in the runs: schedule I at 25°C, schedule II at 35°C and schedule II at 35°C and 50°C, respectively.
Table 5: Details of the Drying of Gelcast Alumina Plates
Run Number
1 5 3 7 6 11 9
2 10 8 13 12
Program Schedule
I I II II II III III
I I II II III
Size of plate
.5" x 4" x 4"
.5"x4"x4"
.5" x 4" x 4"
.5"x4"x4"
.5"x4"x4"
.5" x 4" x 4"
.5"x4"x4"
1"x4"x4" 1"x4"x4" 1"x4"x4" 1"x4"x4" 1"x4"x4"
Premix
MAM/MBAM MAM/PEG
MAM/MBAM MAM/MBAM MAM/PEG
MAM/MBAM MAM/PEG
MAM/MBAM MAM/PEG
MAM/MBAM MAM/PEG
MAM/MBAM
Age of slurry [days]
4 days 7 days 15 days 1 day
10 days 4 days 5 days
8 days 8 days 5 days 2 days 11 days
Wet Mass [g]
330.0 336.7 332.5 331.9 336.5 331.1 329.0
683.8 662.0 675.7 666.5 665.9
Dry Mass [g]
283.1 290.7 285.6 284.2 294.9 283.7 285.4
583.2 593.5 579.5 594.2 584.0
% of H20 Lost
98.0 94.1 97.3 98.9
85.2-cond 98.8 91.4
101.4 71.3 98.3
74.8-crack 84.9

52
The 0.5" thick plates were all dried, losing over 90 % of the initial water content irrespective of the drying schedule except for run #6 where there was some condensation on the plate. At the 1.0" thick, plates gelcast in the MAM/PEG system only lost about 75% of their water content; one plate even cracked. The plates in the MAM/MBAM premix lost higher percentage of their water, although this has to be confirmed as the experimentation continues. The effect of the different schedules is yet to be seen.
The 0.5" plates from runs 1, 3, 5 and 7 were dried successfully without any cracking. However, their strengths have not been measured.
IV. Golden Technologies CRADA (S. D. Nunn)
A CRADA has been signed with Golden Technologies to evaluate the gelcasting of aluminum titanate to form exhaust port liners. The work plan includes development of an appropriate gelcasting slurry, casting of simple test shapes for firing and characterization, and casting of a more complex shape to demonstrate the process for the intended application.
With the determination of milling and firing conditions for obtaining high density aluminum titanate material completed, the final requirement for this project was the preparation of tubular gelcast samples for evaluation by Golden Technologies. After discussion with the principal investigator at Golden, it was determined that the most desirable tube dimensions would be about 1.25 in. outer diameter, 0.125 in. wall thickness, and 6.0 in. long. An appropriate mold was prepared and the aluminum titanate tubes were gelcast. After drying, five tubes were shipped to Golden for final evaluation of the use of the gelcasting process for fabricating these components.
V. Green Machining of Gelcast Ceramics (S. D. Nunn)
A new project has been initiated to study the green machining characteristics of gelcast ceramics. The machinable nature of gelcast materials was demonstrated more than two years ago, however, limited facilities were available for an in-depth evaluation. Recently, a computer controlled, 3-axis milling machine was acquired for the purpose of studying green machining and rapid prototyping. A CAD system on the computer is used to define part geometry. The file generated by the CAD system is then converted to code to drive the milling machine and produce the component. The software is also capable of recognizing certain file formats generated by other CAD systems and utilizing these files to generate the machine control code.
Preliminary evaluation runs have shown that the gelcast materials can be machined at very rapid speeds without damaging the ceramic green body. In tests of a gelcast alumina plate, a 0.25 in. diameter carbide tool was able to cut a 0.125 in. deep groove at speeds ranging from 20 to 150 in./min. without chipping or cracking the plate. In other tests, complex shapes have been machined with excellent surface finishes. Additional hardware components to rotate the workpiece while it is being milled have been received and are presently being installed on the system. These components will allow the use of simplified machining methods for producing axially symmetric parts. They will also give added capabilities for machining screw threads and forming complex 3-dimensional shapes. Evaluation of the capabilities and limitations of the milling machine and the green ceramics are in progress.
Tests are also underway to assess the capability of the CAM software to convert CAD files prepared using AutoCAD to machine code to drive the milling machine. New software has been received to convert scanned file formats to the necessary machine driver code on the 3-axis milling machine. File conversion will greatly enhance the flexibility of the system and eliminate the need to redraw files.

53
Status of Milestones
Milestone 114212 was completed on schedule.
Publications and Presentations
J-P. Maria, J. O. Kiggans, Jr., T. N. Tiegs, and S. D. Nunn, "Gelcasting of Sintered Reaction-Bonded Silicon Nitride for Improved Mechanical Properties," Ceram. Eng. Sci. Proc, 16 [5] 1071-76 (1995).
S. D. Nunn, J. O. Kiggans, Jr., R. E. Simpson, II, and J-P. Maria, "Gelcasting of Silicon Compositions for SRBSN," Paper SXIX-62-95, presented at the 97th Annual Meeting of the American Ceramic Society, Cincinnati, OH, April 30 - May 3,1995.
C. A. Walls, D. L. Barker, M. A. Janney, S. D. Nunn, and O. O. Omatete, "Gelcasting: A Net Shape Forming Process," Poster SXIXP-16-95, presented at the 97th Annual Meeting of the American Ceramic Society, Cincinnati, OH, April 30 - May 3,1995.
D. L. Barker, M. A. Janney, S. D. Nunn, O. O. Omatete, and C. A. Walls, "Green Body Strength and Machining Characteristics of Gelcast Alumina," Poster SXIXP-18-95, presented at the 97th Annual Meeting of the American Ceramic Society, Cincinnati, OH, April 30 - May 3, 1995.

54 1.2 CERAMIC COMPONENTS
1.2.2 Silicon Nitride Matrix
Optimization of Silicon Nitride Ceramics
K. J. Lee and T. Y. Tien
Objective/Scope
Silicon nitride ceramics with fiber-like |3-Si3N4 grains will have higher fracture strength and toughness and better creep resistance. The fiber-like structure can be obtained by sintering the silicon nitride ceramics at high temperature under a nitrogen over-pressure. The mechanical properties can further be improved by controlling the size and the aspect ratio of the fiber like P-Si3N4 grains and the composition and nature of the grain boundary phase(s). In order to develop processing methods to optimize strength, toughness and creep resistance of monolithic silicon nitride ceramics, it is first necessary to have an accurate and reliable method to access the microstructure of the acicular P-Si3N4 grains. The major goal of this project is to evaluate and then assure the way of measuring grain sizes by comparing two different methods used by the group in Max-Planck-Institut of Materials Research in Germany and by the group in Michigan.
Technical Highlights
Samples were obtained from the group in Max-Planck-Institut. Compositions of all the samples are 85.81 wt% S13N4, 10.64 wt% Y2O3, and 3.55 wt% AI2O3. Samples were sintered at 1900°C under 10 MPa N2 pressure for 10 min, 1 hr, 3 hr, and 6 hr. There are two series of samples with only difference being their starting powders. One is Ube-series which has a high oc-Si3N4 content (Ube E10), and the other is Denka-series with high (5-Si3N4 content (Denka SP). They are designated as sample ID: MP1-0, MP1-1, MP1-3, and MP1-6, respectively for Ube-series. Samples using Denka-series powders were designated as sample ID: MP2-0, MP2-1, MP2-3, and MP2-6, respectively.
The major goal of this investigation is to compare and evaluate the methods for measuring the size of the silicon nitride grains: Method 1 using SEM micrographs of individually disintegrated grains to measure grain sizes directly. Method 2 using SEM micrographs of polished section and then applying the statistical interpretation of 2-dimensional pictures to obtain final grain sizes and aspect ratio.
Method 1 has been carried out following usual procedure. Samples were chemically etched in KOH:NaOH and then they were ultrasonically vibrated to disintegrate the grains. Loose grains were collected on the filter paper for microscopic examination. Digital tablet was used for measuring the size of grains in SEM micrographs. Approximately near 1000 individual grains for each sample were measured. All the results were shown in Table 1. A typical size distribution in length direction is given in Figure 1 for both series. Log normal distribution was observed for all sintered specimens.
It was observed that the size (length) distribution became flat and broader as sintering time increased for the samples from Denka-series (P-rich) while the opposite was true for the samples from Ube-series (cc-rich). Also the shape of distribution is narrower in Denka-series (P-rich) than Ube-series (a-rich). It can be explained by the fact that the nucleation of P particles in Ube-series (a-rich) takes place whereas only the growth of P grains happens in Denka-series (P-rich).
Method 1 has been carried out at Max-Planck-Institut and results will be compared in next report.

55
Status of Milestones On schedule
Communications/Visit/Travel None
Problems Encountered None
Table 1. Results of grain size measurements by Method 1
Sample ID
MP1-0 MP1-1 MPl-3 MP1-6 MP2-0 MP2-1 MP2-3 MP2-6
Length (L)
4.63 5.20 6.79 8.29 2.57 4.09 6.99 6.62
Average Sizes( Jim) Width (W)
0.71 0.84 1.09 l!39 0.63 0.87 1.14 1.24
Aspect Ratio (AR)
6.71 6.29 6.24 5.96 4.11 4.66 5.94 5.82

56
& ft
25
20
15
10
5
0
—
T 1 1 1
(a) Ube
j i i L|
I I I I I 1 series
JL
w |L_i i i i L
i i
is.
_ l L
— I — i — T — i — i — i — i — _ _ A/ro i n ' n
| i i i rjrn
5 il C
O VO
■I i—
l i—
l i—
l
1 ■
1
1 i 1
1 | 1 1 1 1 fT
T
. . . I , , M | 3 ^ J L i—i— 1 0.5 0
log(L/L) 0.5
30
o c cr e
T 1 1 1 1 1 1 1 1 p "- (b) Denkaseries
T—i—r—i—i—i—r—;
—#MP20 A MP21 3 —■»— MP23 B MP26 J"
0.5 0 log(L/L)
Figure 1(a) and (b). Typical size distribution in length direction.
57
Microstructure Optimization of SRBSN L.H. Qi, S.F. Kuang and T.Y. Tien
Objective/Scope
Sintered reaction bonded silicon nitride is one of the most cost effective method for producing silicon nitride ceramics in large quantities. This method involves the nitridation of the starting metallic silicon particle compacts and post nitridation sintering. The purpose of this project is to develop a process to produce SRBSN with minimum defects. This investigation is to obtain green compacts with uniform pore distribution. Nitridation process will also be optimized to produce uniform microstructure. Post nitridation sintering will also be studied to develop desirable morphology of the B-Si3N4 grains.
Technical Highlights:
In order to obtain the SRBSN with uniform microstructure and good properties, it is believed that green compacts of metallic silicon powders with narrow pore size distribution should be used. In previous work, we have reported the silicon powder with three groups of particle size distribution (A,B,C) were prepared. In this period, the effect of particle size distribution on the procedure of casting process and nitridation procedure were studied.
1. Optimization of pressure casting process
All slurries used in this study has 20vol%Si solid content using IPA plusl[g(k-30)%gSi] as their organic solvents. The initial pressure used was 40 psi and followed by an increase in pressure of 5 psi minute. The maximum pressure used was 90 psi. Two processes to prepare slurry were studied to obtain slurry with better solid distribution (see Fig.l).
The filtration rate of slurry made with process (1) was higher than that of slurry made with process (2) under the same pressure casting condition. The green cake made with process (2) shows an obvious dividing line after drying. These results indicate that the solvent used could not stabilize the sihcon powders, therefore it is believed that sedimentation experiment should be repeated to obtain finer powder separation.. These results also proved that changing the milling time in process(l) will affect the pressure casting time. Pressure casting time of 10 minutes gives the best pore size distribution in the green cake. If the pressure casting time is too short, such as 1 or 2 minutes, the density of cake will be low and pore size will be large (see Fig2).
2. Comparison of the pore size distribution of intruded compacts.
The green cake were placed in an open alundum crucible and nitrided in a graphite-element furnace under a flowing atmosphere of N2. The following heating schedule was used:
10°C/min. 0.5°C/min. 0.5°C/min. 0.5°C/min. 10°C/min.
To To To To To
900OC 1200°C 1350°C 1450°C
20°C
hold lhr. hold lhr. hold lhr. end.

58
The density of the green cake made from powder A, B and C was 92.7%, 97.6% and 91% respectively in the same nitriding condition. Lower the green density of the cake (powder B with narrow particle size distribution) can be intruded with the highest rate.
Their pore size distribution was measured and are shown in Fig 4. These results show that after nitration, the pore size of the nitride cake become small, but their pore size distribution become wider relative to the green cake.
Status of Milestones On schedule
Communications/Visits/Travel None
Problems Encountered None
Publications None
Process 1
Supersonic disperse Milling Pressure casting
Process 2
Supersonic disperse Milling Supersonic disperse Pressure casting
Fig.l Slurries Preperation for pressure casting

59
° « E
Inceremental pore volume per gram% 0 20 40 60 80 100
I T — r i
6 .3 .
a •a o
mm
T i—i—i—j—i—i—r^
Powder A PC time=2min. Powder A PC time=10min.
9.5,9 P . . . I . . . I
PC time=2min:. PC time=10min:
daverage=07001 urn daverage=0.4730 \im
_i i_
Density =1.50g/cc Density =1.57g/cc
(A)
Incremental pore volume per gram% 20 40 60 80 100
°0°8?
S 3 i<
(D
2 o
rn—i—i—|—i—i—i—j—i—i—i—j—i—i—i—|—i—i—r^
Powder B PC time=2min. Powder B PC time=10min.
♦ r i
9 .59 F * . ■ ■ I ■ i ■ I ■ ■ ■ I i ■
PC time=2min: daverage= 14913 urn Density =1.3288g/cc PC time=10min: da v e r a g e=0.2820 urn Density =1.6055g/cc
(B)
Fig.2 The effect of Presure Casting time on pore size distribution of green cakes

60
14rrr .1 i i i | i i i i | i i i i | i i i i | i i i i | i i i i |
o >
M
12 r !0r 8 r 6 h 4
2
0
2 ' ■ ' ' ' ■ ■ '
j i 0 ' D
xD
powder A and process (1) —© powder A and process (2) — ■ — powder B and process (1) □ powder B and process (2)
I . ■ ■ ■ i i ■ ■ i i . ~ . i i ■ ■ ■ i i . ■"
10 0 10 20 30 40 50 60 P.C. Time (min.)
Fig.3 The effect of preparing process of slurry on filter rate during pressure casting

61
Differential volume per gram% Maximum Differential volume=1.1976 cc/g um O 10 20 30 40 50 60 70
E
£ E CO
b o
Q .
"CD E eg
Q
o Q_
0.006 0.00767 0.00981
0.0125 0.016
0.0205 0.0262 0.0336 0.0429 0.0549 0.0702 0.0897 0.115 0.147 0.188
0.24 0.307 0.392 0.502 0.642
0.82 1.05 1.34
Median pore diameter (volume)=0.1535 um Median pore diameter (volume)=0.4730 um (before nitride)
(A) Using silicon powder A
Differential volume per gram % Maximum Differential volume= 1.8068cc/g um
10 20 30 40 50 60 70 80 0.006
0.00767 0.00981 0.0125
0.016 0.0205 0.0262 0.0336 0.0429 0.0549 0.0702 0.0897
0.115 0.147 0.188
0.24 0.307 0.392 0.502 0.642
0.82 1.05 1.34
Median pore diameter (volume) = 0.1933 um Median pore diameter (volume) = 0.8020 um (Before nitride)
(B) Using silicon powder B
Fig. 4 The pore size distribution of the nitriding cake made from different silicon powders

62
£ E
b a> o
CL
Differential volume per gram% Maximum differential volume = 1.3625 cc/g um
40 60 80 100 0.006
0.00767 0.00981
0.0125 0.016
0.0205 0.0262 0.0336 0.0429 0.0549 0.0702 0.0897
0.115 0.147 0.188 0.24
0.307 0.392 0.502 0.642
0.82 1.05 1.34 ■ ■ ■ ■ ■ ■ ■ ■ ■ ■ ■ ■ ■ ■ ■ ■ ■ ■ ■ ■ ■
Median pore diameter (volume)= 0.1410 um Median pore diameter (volume)= 0.2036 um (Before nitride)
(C) Using silicon powder C
Fig.4 The pore size distribution of the nitriding cake made from different silicon powders (cont)
63
Characterization of Grain Boundary Phases in Silicon Nitride Ceramics
I. M. Peterson and T. Y. Tien
Objective/Scope
The objective of this investigation is to develop silicon nitride ceramics with high flexural strength, high fracture toughness and superior creep resistance. The fiber-like structure of the |3-Si3N4 grains can be obtained by sintering the silicon nitride ceramics at high temperature under high nitrogen pressure. The composition of the sintering additives will affect the microstructural development, grain boundary characteristics, and hence, the mechanical properties. The goal of this project is to synthesize and characterize the grain boundary phase and to understand the relationships between the nature of the grain boundary phase and the properties of silicon nitride ceramics. It is believed that with a thorough understanding of these relationships, ceramics with optimum mechanical properties can be obtained.
In previous reports, the boundary phases were synthesized separately and their properties were studied. The thermal expansion mismatch stresses between the grain boundary phase and the silicon nitride influenced the fracture toughness of the ceramic. However, the influence of thermal expansion mismatch stresses on the flexure strength of the ceramic was not known. In this report, the results of preliminary flexure strength tests are presented. The thermal expansion mismatch stress does not have a large effect on the flexure strength.
Technical Highlights
Two sets of silicon nitride powder batches were made. The first set contained silicon nitride with 4.2 wt % AI2O3,, 4.9 wt % Si02 and 1.65 wt % MgO. The second batch contained silicon nitride with 3.9 wt % AI2O3,4.6 wt % S1O2 and 7.6 wt % BaC03. The powder batches were attrition milled for three hours with silicon nitride media and isopropyl alcohol.
The powder was uniaxially cold pressed under 17 MPa into pellets which were 52 mm x 26 mm by 5.3 mm. The pellets were then isostatically cold pressed at 275 MPa. The pellets were sintered under 10 atmospheres of nitrogen for 3 hours at 1640°C, followed by three hours at 1840°C, followed by three hours at 1640°C. The specimens sintered to full density, but the shrinkage was non-uniform. The pellets were machined into 5 size A 4-pt bend specimens as described in MIL STD 1942A, without chamfered edges, and broken in 4-pt bending according to the standard. The fracture surfaces were examined using the SEM.
The shrinkage of the Mg-containing pellets was 26 % in the length direction, 24 % in the width direction and 12 % in the thickness direction. The shrinkage of the Ba-containing pellets was 26% in the length direction, 26 % in the width direction and 16% in the thickness direction. The fracture strengths of both the Mg-containing samples and the Ba-containing samples are shown in Figure 1. The wide distribution in fracture strengths is probably due to machining damage at the unchamfered edges of the sample. Both compositions showed an average fracture strength of about 840 MPa. SEM examination of the fracture surfaces revealed both intergranular and transgranular fracture.

64
These experiments demonstrate that the use of barium aluminosilicate sintering aids increased the fracture toughness of silicon nitride without decreasing the strength of the ceramic.
Status of Milestones On schedule
Communications/Visits/Travel None
Problems Encountered None
Publications I. M. Peterson and T. Y. Tien, Journal of the American Ceramic Society, 78 [7] 1977-79
I. M. Peterson and T. Y. Tien, Journal of the American Ceramic Society, 78 [9] 2345-52

65
1100
CO Q- 1000 I -
JC B 900 h" c CD
800 -
i i i i I i i i i i i i i i i i i i i Mgp
o oo CD i _ =3
§ 700 f- n4
gQO ' ' ■' ' i ■ ' ' ' ' ■ ' ' ' i ' ' ■ ' ' ' ' ' ■i■ o ' '
3 3.5 4 4.5 5 5.5 6
i i i i I i i i BaO
o
o
Thermal Expansion Coefficient of Grain Boundary Phase (x 10
6/°C)
Figure 1. The thermal expansion coefficient of the grain boundary phase does not exhibit a large effect on the flexure strength of silicon nitride
66
Microstructure Design of SS3N4 S. F. Kuang and T. Y. Tien
Objective/Scope
Liquid-phase sintering technique is most often used for the densification of S13N4 materials. The presence of the remaining grain boundary phase after sintering will degrade the high temperature properties of these materials. a'-pV- SiAlON composites can be developed through transient liquid phase sintering which will not contain liquid phase after densification.. In this process, the transient liquid is completely reacted and transformed into a'-SiAlON solid phase.
The objective of this task is to design a material, which could form sufficient liquid during densification and part of this liquid will be consumed after the densification. Part of the liquid will remain after densification which will help to develop of desirable P -Si3N4 morphology.
Technical Highlights:
Phases 2Si3N4»La203 and Si3N4.Nd203(s.s.) are compatible with (a'+P')-Sialon. Both of these compounds have good oxidation resistant at high temperature. Two systems were chosen for these studies: (1) the Si3N4-AlN-Nd203 system, we changed the content of A1N while keeping the Si3N4/Nd203 ratio constant. (2) the Si3N4-AlN-Nd203-La203 system, we changed the content of grain boundary phase Si3N4»La203 while keeping the oc'/P' ratio constant. Relationship between composition, densification process, microstructure and mechanical properties of samples will be studied. In this report, density, phase composition after sintering and microstructure development of sample in system (1) will be reported.
1. Density
Four compositions (see table 1 in June 1995's bimonthly report) were hot pressed at 1780C under 1 ATM nitrogen with holding time of 0.5, 1, 2 and 4 hours. Pressure was released after 1 hour and followed by holding without pressure. Densities of samples are shown in table 1. All of compositions, except composition A, reached full density within 30 minutes. Sample A is the only composition, which does not contain A1N. Composition A which does not contain liquid after sintering makes the densificaiton difficult.
2. Phase composition
Fired samples were pulverized and analyzed with X-ray diffraction. Results are shown in Table 1. Sample A with holding time of 30 minutes contains unreacted a-Si3N4. H-phase (Nd5(Si04)3N) was crystallized during cooling which is because of the exist of the oxidation layer on the surface of S13N4 starting powder. The same reason caused the crystallization of K-phase (NdSi02N) from sample B. Fl-phase is oxygen-richer than K-phase.
It is interesting to point out that a' / P' ratio decreased with increasing of holding time at 1780C. It is known that oc'-Sialon is stable at higher temperature and unstable at lower temperature. Our results showed that even at high temperature oc'-Sialon is not stable after

67
long holding time. This character of a'-Sialon makes it possible for us to adjust microstructure of a'-P'-Sialon composites through changing the holding time.
3. Microstructure
SEM micrographs of samples sintered at 1780C with holding time of 2 hours are shown in Fig. 1. Sample A contains only p-Si3N4 and has a homogenous microstructure. a'-Sialon grain size decreased with increasing of a'/ P'-Sialon ratio, i.e. decreased from sample B to D. Aspect ratio of p'-Sialon seems increased at first with increasing of a'/ P' ratio and then decreased. Sample B has the largest grain size. Excellent mechanical property is expected from sample C, whose microstructure contains high aspect ratio of P'-Sialon and fine grains of a'-Sialon.
Status of Milestones none
Communications/Visits/Travel None
Problems Encountered None
Publications None
Table 1. Density of sample and phase composition and a'/P' ration according to X-ray analyze
Sampl e
A
B
C
D
Holding time at 1780-C
0.5h lh 2h 4h
0.5h lh 2h 4h
0.5h lh 2h 4h
0.5h lh 2h 4h
Density (g/cm3)
3.22 3.28 3.27 3.27 3.27 3.27 3.27 3.27 3.26 3.26 3.26 3.26 3.26 3.26 3.26 3.26
Phase composition
a+3 B
3 + H B + H a'+B' a'+B'
B' B' + K a'+B' a'+B* a'+B' a'+B' a'+B' a'+B' a'+B' a'+B'
a'/(a'+p') (theoretical)
0 0 0 0
0.14 0.14 0.14 0.14 0.29 0.29 0.29 0.29 0.40 0.40 0.40 0.40
a7(a'+P') (experimental)
0 0 0 0
0.19 0.15
0 0
0.45 0.38 0.15 0.03 0.47 0.40 0.28 0.07

68
K-phase: NdSi02N H-phase: Nd5(Si04)3N
6.0 |xm
(Sample A, X 5000)
6.0 Jim
(Sample B,X 5000)
6.0 (im
(Sample C, X 5000)
6.0 (J.m
(Sample D,X 5000)
Fig 1. SEM micrograph of a'-Sialon plus P'-Sialon two-phase material. Samples being hot-pressed at 1780 C for 2hrs.

69
Development of Silicon Nitride Ceramic Materials With Elongated Grain Microstructures Exhibiting High Fracture Toughness, Phase II H. Yeh, J. Wimmer, C-W Li, and J. Goldaker (AlliedSignal Inc.) Objective/Scope
Under Phase I, an in situ reinforced (ISR) silicon nitride material (AS800) with elongated grain microstructure has been developed. It was accomplished through composition and processing optimization of a material which had initially been developed at AlliedSignal. The objective of this follow-on effort (Phase U) is to expand the AS800 material property database to meet the requirements for heat engine applications and to build on Phase I results to further improve material properties and processing. To accomplish this objective, a three-task effort shall be conducted over a two-year period. The technical effort was initiated in March 1994.
The AS800 material developed under Phase I (crystallized Composition 2) shall be the baseline for Phase U. Based on the property values measured under Phase I, AS800 is suitable for heat engine applications. However, in order for the material to be considered for these applications, a more comprehensive data base is required for life prediction and other design needs. A typical test matrix recommended by an engine company shall be conducted under Task l~Expanded Characterization of AS800. The test matrix includes more comprehensive testing of mechanical and thermal properties from room temperature to 2500°F. In addition, an established cyclic oxidation durability test will also be conducted to determine the long-term durability of the material in a simulated gas turbine environment. Most of the tests shall be performed on the baseline material using fully machined test bars, which represent the bulk properties of the material.
For net-shape formed components, the as-processed surface properties are critical. Due to its rougher surface texture and the exposure to the sintering environment, the as-processed surface properties of a silicon nitride part are known to be inferior to the bulk properties. Under Task 2~As-Processed Material Surface Property Improvement, the baseline material surface property shall be characterized and then various techniques shall be investigated to improve the as-processed surface properties.
Although AS800 is densified by a relatively economical technique (gas pressure sintering), compared to glass encapsulation HTP or hot-pressing, there is a need to further reduce the cost of densification. The densification process developed under Phase I was primarily aimed at achieving the property goals, without addressing fabrication cost reduction issues. Under Task 3—Lower Cost Fabrication, the green processing procedures and the densification process shall be scaled up and further optimized to reduce the cost without degrading the properties.

70
TASK 1--EXPANDED CHARACTERIZATION OF AS800
The objective of this task is to conduct a comprehensive test matrix of mechanical properties for crystallized Composition 2 after demonstration of a reproducible process. The test matrix includes tensile, flexural strengths, tensile stress rupture, and toughness from RT through 2500°F, and cyclic oxidation durability test in a simulated engine environment. In addition, elastic and thermal properties from RT through 2500°F shall be measured.
All the required property results were reported in the last two bi-monthly reports except the tensile stress rupture, which were completed during this reporting period. Table 1 summarizes the tensile stress rupture results. Both tensile fast fracture strength and tensile stress rupture testings were conducted at University of Dayton Research Institute (UDRI) and a detailed discussion of the results can be found in their report in this issue of "Ceramic Technology Project Semiannual Progress Report".
Table 1 - Tensile Stress Rupture Test Results
Specimen I.D.
170-2-10 170-2-11 170-2-12 170-2-14 330-1-19 460-2-20 350-1-14 353-1-7
460-2-18 460-2-19 172-2-6 172-2-7 172-2-8 172-2-9
330-1-20 462-2-28 462-2-30 462-2-29 462-2-26 462-2-27 519-1-15 519-3-23
Temp (°F/°C)
2200/1204 2200/1204 2200/1204 2200/1204 2200/1204 2200/1204 2200/1204 2200/1204 2200/1204 2200/1204 2300/1260 2300/1260 2300/1260 2300/1260 2300/1260 2300/1260 2300/1260 2300/1260 2300/1260 2300/1260 2300/1260 2400/1316
Applied Stress (ksi/MPa) 45.7/315 45.7/315 45.7/315 45.7/315 45.7/315 34.4/237 34.4/237 34.4/237 45.7/315 45.7/315 42.2/291 42.2/291 42.2/291 42.2/291 31.6/218 42.2/291 31.6/218 31.6/218 42.2/291 42.2/291 21.2/146 20.2/139
Life (hour)
100 0.02 0.3 0.1 0.3 100 100 27.4 19.7 14.7 DL DL DL DL 0.2 1
26.3 5.2
37.5 1.7 100 12.5
Fracture Origin
Surface Volume Surface Volume Surface
Volume @ 493 MPa Volume® 494 @ EG
? Volume
Volume w/SCG Surface Surface Surface Surface Surface Volume Volume
Volume w/SCG ? w/SCG ? w/SCG
Load raised to 219 Mpa, failed 0.7 h -
Note: DL = Failed during loading; EG = Elongated grain; SCG = Slow crack growth
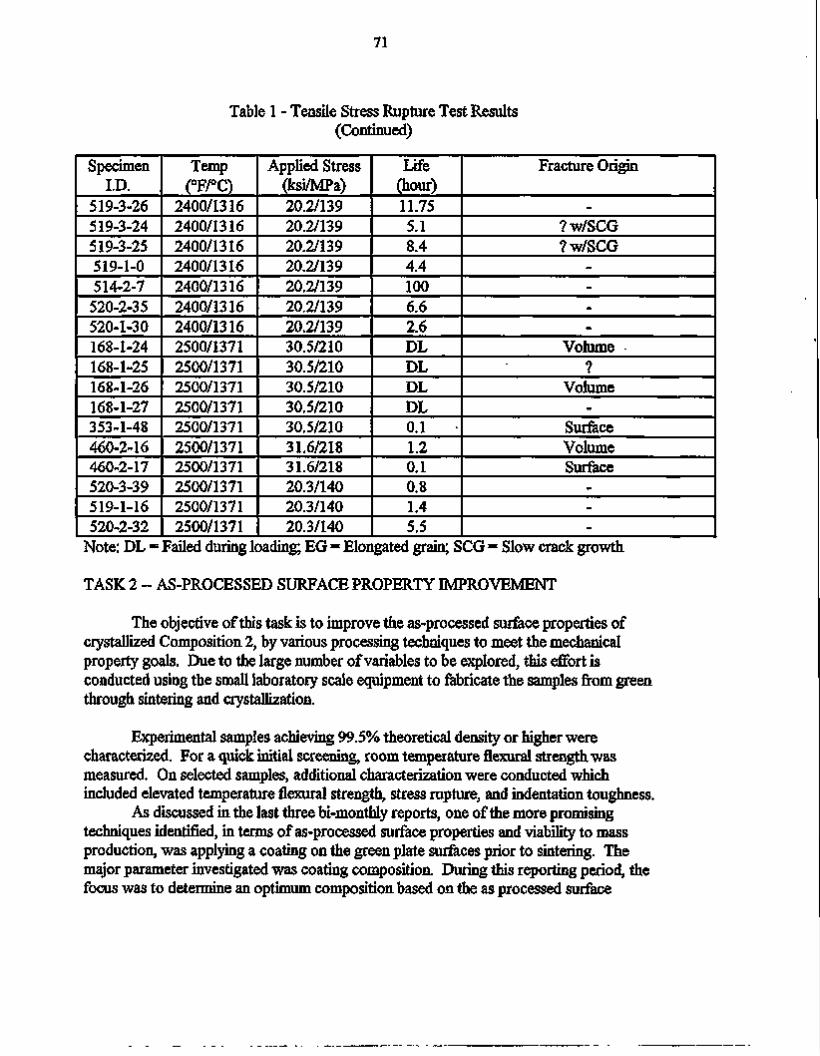
71
Table 1 - Tensile Stress Rupture Test Results (Continued)
Specimen I.D.
519-3-26 519-3-24 519-3-25 519-1-0 514-2-7
520-2-35 520-1-30 168-1-24 168-1-25 168-1-26 168-1-27 353-1-48 460-2-16 460-2-17 520-3-39 519-1-16 520-2-32
Temp (°F/°C)
2400/1316 2400/1316 2400/1316 2400/1316 2400/1316 2400/1316 2400/1316 2500/1371 2500/1371 2500/1371 2500/1371 2500/1371 2500/1371 2500/1371 2500/1371 2500/1371 2500/1371
Applied Stress (ksi/MPa) 20.2/139 20.2/139 20.2/139 20.2/139 20.2/139 20.2/139 20.2/139 30.5/210 30.5/210 30.5/210 30.5/210 30.5/210 31.6/218 31.6/218 20.3/140 20.3/140 20.3/140
Life (hour) 11.75 5.1 8.4 4.4 100 6.6 2.6 DL DL DL DL 0.1 1.2 0.1 0.8 1.4 5.5
Fracture Origin
-
? w/SCG ? w/SCG
-
-
-
-
Volume ■ ?
Volume -
Surface Volume Surface
-
-
-
Note: DL = Failed during loading; EG = Elongated grain; SCG = Slow crack growth
TASK 2 - AS-PROCESSED SURFACE PROPERTY IMPROVEMENT
The objective of this task is to improve the as-processed surface properties of crystallized Composition 2, by various processing techniques to meet the mechanical property goals. Due to the large number of variables to be explored, this effort is conducted using the small laboratory scale equipment to fabricate the samples from green through sintering and crystallization.
Experimental samples achieving 99.5% theoretical density or higher were characterized. For a quick initial screening, room temperature flexural strength was measured. On selected samples, additional characterization were conducted which included elevated temperature flexural strength, stress rupture, and indentation toughness.
As discussed in the last three bi-monthly reports, one of the more promising techniques identified, in terms of as-processed surface properties and viability to mass production, was applying a coating on the green plate surfaces prior to sintering. The major parameter investigated was coating composition. During this reporting period, the focus was to determine an optimum composition based on the as processed surface

72
properties. Table 2 lists the strength results measured to date. Two coating compositions (A and B) were repeated to evaluate reproducibility.
Table 2: As-processed Surface Strength
Sample
SN572
SN579
SN578
SN575
SN577
SN586
Coating Composition
A
A
B
B
C
D
25°C
104.4±5.1 (10)*
108.0±9.5 (15)
105.1±9.8 (10)
112.3±6.3 (20)
101.7±4.5 (3)
95.1±7.3 (10)
1200°C
83.3±7.2 (3)
74.7±9.4 (3)
76.2±5.3 (3)
71.2 ±11.8 (2)
80.1± 4.8 (2)
95.4 (1)
1300°C
67.8±6.7 (3)
70.1± 2.7 (2)
NA
71.4 ±3.6 (2)
73.9±7.5 (3)
77.8±5.4 (2)
1370°C
70.1±3.4 (3)
70.7±5.8(3)
NA
61.2±4.6(2)
67.7±11.7 (3)
75.9±4.1 (2) * (n), where n is number of test bars measured.
Note that the room temperature strengths coating compositions investigated are very close, suggesting that the room temperature strength is less sensitive to coating composition. However, the elevated temperature strength is more sensitive to coating composition, although only a small number of test bars were tested at each temperature for each sample. Also, the overall strengths of samples coated with composition A coating (samples SN572 and SN579) appear to be higher and more reproducible than the other two. Preliminary 4-point bend stress rupture testing of one of the Composition A sample (SN579) indicates that its as-processed surface could survive > 100 hours under 65 ksi at 1200°C and under 45 ksi at 1300°C, respectively, which are approaching to the goals of 70 ksi and 50 ksi, respectively. One test bar from SN586 (Composition D coating) has been stress-rupture tested at 1300°C under 55 ksi and survived 100 hours. Based on the results, an optimized composition has been selected and two plates have been fabricated. These two plates are now being machined into the required number of test bars for the test matrix to compare with the property goals. The results will be reported in the next report, and this will conclude this task.
TASK 3 - LOWER COST FABRICATION
The objective of this task is to lower the fabrication cost by scaling up the green forming process (primarily milling/slip preparation process) and the sintering/crystallization process from laboratory scale to production scale. Milling/slip preparation process will be scaled up by a factor of six (6) or more; sintering capacity will be increased by a factor of ten (10) or more from a small size furnace to a new production size furnace.

73
The results to date have successfully demonstrated that the slip preparation/milling procedure can be scaled up by a factor of six (6), and plates of various sizes can be consistently sintered in a production furnace, with ten (10) times capacity of the baseline furnace, to full density (> 99.5% theoretical) with similar strengths, reported in previous reports. To evaluate process reproducibility in the scaled up process, a processing matrix has been conducted. The variables included in the matrix are : powder lot (Lots I and n, both within the established powder specification), presintering run (Runs A and B), sintering run payload (Runs L, low, and H, high), and crucible (or part) location in sintering (Locations 1,2, 3, 4 and 5, from bottom to top of the sintering furnace). The processing matrix has been completed through sintering, and all sintered plates have been crystallized in one run using the standard thermal cycle. The responses for the processing matrix include material density and properties. All crystallized plates achieved the required >99.5% theoretical density. Therefore the responses for the processing matrix will only be material properties. Strength properties will be used to evaluate the response. Flexural test bars are in the process of being machined for both room temperature and elevated temperature testing to be conducted in the next reporting period.
Powder Lot
Pre-Sintering Run
Sintering Run Payload
Crucible Location
1 5 Slip Batches
A
L
1 2 3 4
H
1 2 3 4
B
L
1 2 3 4
H
1 2 3 4
II 5 Slip Batches
A
L
1 2 3 4
H
1 2 3 4
B
L
1 2 3 4
H
1 2 3 4
Figure 1 - Processing Matrix
Communications/Visits/Travel
None
Problems Encountered
None Publications
None

74 1.2.3 Oxide Matr ix
W.B.S. ELEMENT 1.2.3.1 DISPERSION TOUGHENED CERAMIC COMPOSITE
T. N. Tiegs, F. C. Montgomery, P. A. Menchhofer, D. L. Barker and D. W. Coffey Oak Ridge National Laboratory
Oak Ridge, TN 37831
Objective/Scope
Initially this work involved development and characterization of SiC whisker-reinforced ceramic composites for improved mechanical performance. To date, most of the efforts involving SiC whisker-reinforced alumina, mullite, sihcon nitride, and sialon have been completed. In addition, studies of whisker-growth processes were initiated to improve the mechanical properties of SiC whiskers by reducing their flaw sizes and, thereby, improving the mechanical properties of the composites. Currently, in-situ acicular grain growth is being investigated to improve fracture toughness of silicon nitride materials.
Technical Highlights
In-Situ Toughening of Silicon Nitride by Microstructure Development
Characterization and Modification of As-Fabricated Surfaces Formed During Gas Pressure Sintering (GPS) - In the previous years, studies were done to reduce surface reactions layers during densification and to optimize the GPS process for silicon nitride. These processing techniques developed were used to fabricate silicon nitride materials to maximize the mechanical properties of the as-sintered surfaces. The studies included control of the sintering parameters to maximize bulk properties and minimizing the surface reaction layer. To further reduce the need for machining, investigations of the relationships between green machining, bisque machining and final machining on the mechanical properties were performed. In addition, the effects of post-sintering surface treatments, such as oxidation, inert gas heat-treatment and abrasive cleaning (blasting, vibratory agitation and rotary tumbling) were studied. For each of the conditions, two compositions of silicon nitride with different intergranular phases were tested. These compositions are Si3N4-6% Y203-2% AI2O3, and Si3N4-Sr2La4Yb4(Si04)602 (at 8 equivalent % oxygen).
Because a number variables were to be studied, a Taguchi experimental array was formulated to assess the impact of each of the surface processing variables on the final properties after gas-pressure sintering. The experimental array with the variables is shown in Table 1. The green body surface were tested under four conditions: as-cast (smooth), as-cast (rough), machined (coarse grit) and machined (fine grit). All of the samples were formed using gel-casting with a solids loading of -43 vol. % and then isopressed to a green density of -52 %. The as-cast (smooth) surfaces were cast against glass plates, while the as-cast (rough) surfaces were cast against 60 grit sand paper. The machined surfaces used gel-cast and isopressed specimens and then ground with either a 220 grit diamond wheel (smooth) or a 40 grit alumina wheel (rough). Approximately 1-2 mm were removed during the green machining process. The effect of machining after bisque firing was assessed by firing the samples to ~1400°C to slightly sinter the samples and give them some strength. Machining at this stage w s done with a 220 grit diamond wheel. During sintering, the surfaces was eithei exposed to the nhjogen gas atmosphere inside of the sintering crucible or had a SiC setter plate adjacent to the test surface. Post-sintering surface treatments consisted of either a grit tumble operation, sandblasting or diamond wheel machining. Post-sintering thermal treatments using either oxidizing or inert gas atmospheres were examined. In addition, the effect of a thermal shock treatment was determined.

75
After the samples had been fabricated through the 'green' and bisque-fired stages, the as-fabricated surfaces were characterized for surface roughness using a laser profilometer. The results are summarized in Table 2. The values of Pv, indicate the variance about the mean and the Rt values are a measure of the difference in the peak-to-valley of the surface roughness. As shown, the 'green' surface roughness is lowest for the as-fabricated materials where the casting was done against a glass plate and roughest for the as-fabricated where the casting was done against a roughened surface. Three dimensional plots of the different types of surfaces are shown in Figs. 1-4. The machining grooves are clearly visible along the length of the specimens.
The samples were fabricated by gas-pressure sintering. In previous years, studies have shown that surface reactions occur during sintering and that these reactions can cause weight changes as the material densities. Table 3 shows the change in weight caused by the sintering process and the final density of the test samples prepared for this study. The samples sintered using Y2O3-AI2O3 as a sintering aid have a higher average density when SiC was used as the setter material than when BN was used. Additionally, when setting on BN during sintering, the weight loss and the final density both were dependent on the position of the sample within the crucible.
After sintering, the test surfaces were again characterized by measuring surface roughness parameters using a laser profilometer. Table 4 shows the effects that densification and post-sintering processing have on the surface roughness.. Roughness measurements on the Si3N4-SrLa4Yb4(Si04)602 samples are not yet complete. The Si3N4-6 %Y203-2% A1203 samples are being used to develop the procedures for the surface treatments. To simulate the scouring action obtained by tumbling, the appropriate samples were placed in individual bottles which were slightly larger than the width of the samples. The bottles were filled about half full with 2 - 2.4 mm B4C grit and rolled on a standard laboratory mill roller. Grit blasting was accomplished using 240 grit SiC powder.
The sintering process increased the surface roughness of the samples except for the rough cast samples which were not machined before sintering. The roughness of samples setting on SiC plates increased from about 1 (im to about 2 (im (Ra,c = 0.8 mm). The roughness of samples setting on BN increased to about 1.5 |tm, but, as explained below, the base roughness was obscured by the formation of a thick coating. Microscopic examination of the samples showed that the some porosity developed in the Si3N4-6% Y203~2% A1203 samples mainly in areas where the samples were not contacting the setter. For example, TRSN-52-21, and TRSN-52-22 were sintered with the test surface resting on the BN setter. The opposite surface, which was exposed to the furnace atmosphere, developed -50 (im diameter holes (shown in Figure 5) which increased the maximum peak-to-valley distance (Rj in Table 4) of the surface to about 70 urn.
The Si3N4-6% Y203-2% A1203 surfaces which contacted BN plates during GPS generally were covered with a soft, white, adherent coating after sintering. This coating could easily be removed by grit blasting, but could not be removed by gentle brushing. When the coating was relatively thick, the surface roughness on the coating was substantially smoother than the underlying surface. This is evident from Table 4 when comparing the as-sintered roughness of sample TRSN-52-10 with the roughness of its grit-blasted surface. Figure 6 is a photograph of the grit blasted surface of TRSN-52-4 taken at 20x through a stereo microscope. Figure 6 shows the demarcation between an area which had been setting on BN during sintering, and an area that had not rested on the setter. The roughened surface caused by cc ntact w'th the setter is clearly evident.

76
Initial results on the mechanical properties for the various surface treatments are shown in Table 5 for the samples of the Si3N4-6% Y203-2% AI2O3 composition. The post-sintering surface treatments are still under way.
Cooperative Research and Development Agreement (Materials and Electrochemical Research Corp.) -
The Cooperative Research and Development Agreement (CRADA) with Materials and Electrochemical Research Corp. (MER) is currently in progress. Materials were made with different starting OE/B-SI3N4 ratios and with the addition of sintering aids as coatings instead of powders. Additional samples have been sintered by GPS using the optimum densification parameters developed for high toughness materials in the ORNL program. The densification results are shown in Table 6. These samples are currently being machined into test bars for mechanical property testing.
As shown, high densities were achieved for all of the samples fabricated at ORNL and containing up to 50% B-S13N4. The lowest densities were observed for samples containing the Shin-etsu B-S13N4 and the material with the Y203-Si02 plus the B-Si3N4. The materials from MER containing the B-Si3N4 powder from Shin-etsu also showed low densities.
Status of Milestones
Milestone 123116, Development of high toughness silicon nitride with optimized as-sintered surface properties was not completed. Some additional data to complete the test matrix is required and will be done in the next reporting period
Communications/Visits/Travel
Travel by T. N. Tiegs and F. C. Montgomery on April 30-May 3, 1995 to the American Ceramic Society Annual Meeting in Cincinnati, OH.
Problems Encountered
Problems with the temperature control and pressure regulation valve on the gas pressure sintering furnace has caused some delay in fabrication of the samples for CRADA with MER Corp.
Publications
None.
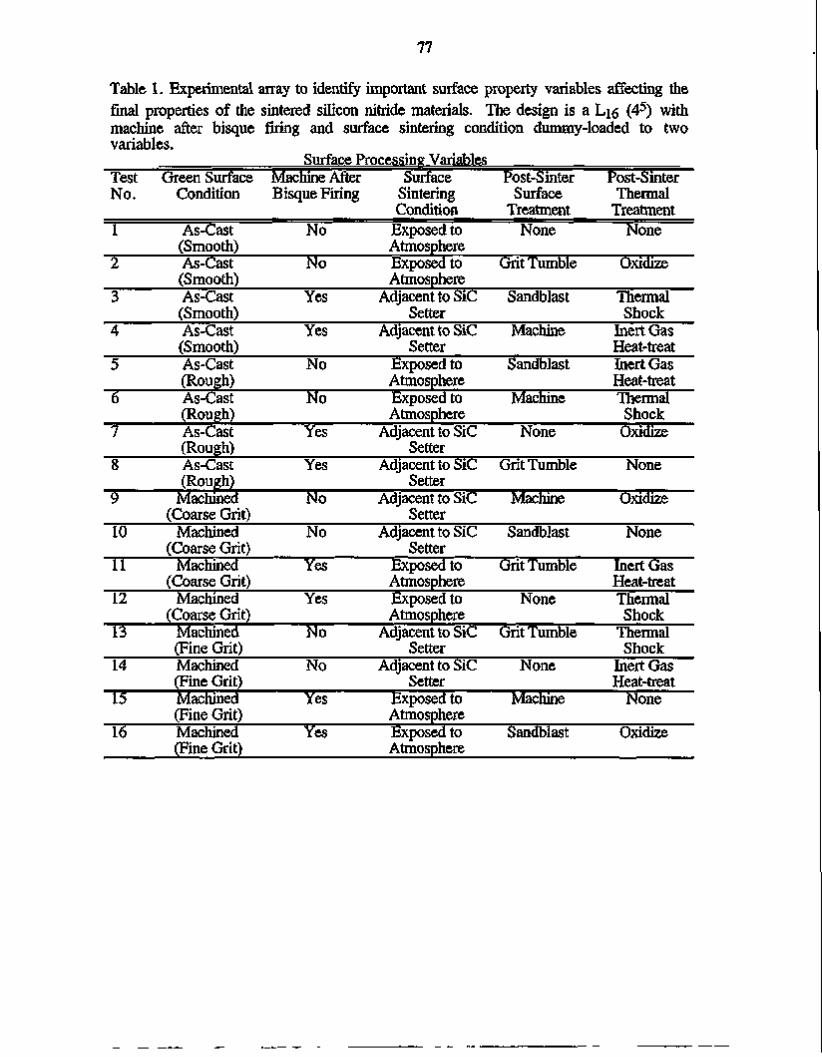
77
Table 1. Experimental array to identify important surface property variables affecting the final properties of the sintered silicon nitride materials. The design is a Li6 (45) with machine after bisque firing and surface sintering condition dummy-loaded to two variables.
Surface Processing Variables Test No.
1
2
3
4
5
6
7
8
9
10
11
12
13
14
15
16
Green Surface Condition
As-Cast (Smooth) As-Cast (Smooth) As-Cast (Smooth) As-Cast (Smooth) As-Cast (Rough) As-Cast (Rough) As-Cast (Rough) As-Cast (Rough)
Machined (Coarse Grit)
Machined (Coarse Grit)
Machined (Coarse Grit)
Machined (Coarse Grit)
Machined (Fine Grit) Machined (Fine Grit) Machined (Fine Grit) Machined (Fine Grit)
Machine After Bisque Firing
No
No
Yes
Yes
No
No
Yes
Yes
No
No
Yes
Yes
No
No
Yes
Yes
Surface Sintering Condition
Exposed to Atmosphere Exposed to Atmosphere
Adjacent to SiC Setter
Adjacent to SiC Setter
Exposed to Atmosphere Exposed to Atmosphere
Adjacent to SiC Setter
Adjacent to SiC Setter
Adjacent to SiC Setter
Adjacent to SiC Setter
Exposed to Atmosphere Exposed to Atmosphere
Adjacent to SiC Setter
Adjacent to SiC Setter
Exposed to Atmosphere Exposed to Atmosphere
Post-Sinter Surface
Treatment None
Grit Tumble
Sandblast
Machine
Sandblast
Machine
None
Grit Tumble
Machine
Sandblast
Grit Tumble
None
Grit Tumble
None
Machine
Sandblast
Post-Sinter Thermal
Treatment None
Oxidize
Thermal Shock
Inert Gas Heat-treat Inert Gas Heat-treat Thermal Shock Oxidize
None
Oxidize
None
Inert Gas Heat-treat Thermal Shock
Thermal Shock
Inert Gas Heat-treat
None
Oxidize

78
Table 2. Summary of results on surface roughness of sihcon nitride specimens prior to gas-pressure-sintering.
Sample ID
TRSN-52-21 TRSN-52-22 TRSN-52-J TRSN-52-19 TRSN-52-14 TRSN-52-9 TRSN-52-3 TRSN-52-10 TRSN-52-I TRSN-52-G TRSN-52-F
TRSN-53-E TRSN-53-13 TRSN-53-K TRSN-53-17 TRSN-53-20 TRSN-53-C TRSN-53-F TRSN-53-H TRSN-53-J TRSN-53-I TRSN-53-B
Sintering Aid Type
Y203-A1203 Y203-A1203 Y203-A1203 Y203-A1203
Y203-A1203
Y203-A1203
Y203-A1203
Y203-A1203
Y203-A1203
Y203-A1203
Y203-A1203
Yb203-SrCO rLal203
Yb203-SrC03-Lal203
Yb203-SrC03-Lal203
Yb203-SrC03-Lal203
Yb2O rSrC03-Lal203
Yb203-SrC03-Lal203
Yb2O rSrC03-Lal203
Yb203-SrC03-LaI203
Yb203-SrC03-Lal203
Yb203-SrC03-Lal203
Yb203-SrC03-Lal203
Green Surface Condition
as-cast smooth as-cast smooth as-cast smooth as-cast rough as-cast rough
fine grit* fine grit* fine grit*
coarse grit* coarse grit* coarse grit*
as-cast smooth as-cast smooth as-cast smooth as-cast rough as-cast rough
fine grit* fine grit* fine grit*
coarse grit* coarse grit* coarse grit*
Surface Roughness of Green Surface
Ra(nm) Rt((nm) 0.86±0.24 0.80±0.14
— 52.3+6.3 51.717.2 1.02±0.06 1.1610.09
— 2.29+0.44 1.71±0.25
—
0.68+0.07 0.61+0.11
— 51.1+3.3 51.3±3.1 1.2010.12 1.26+0.21
— 2.61+0.26 2.53±0.22
-
9.0414.20 7.8611.75
— 364127 394147 10.5+1.5 12.714.9
-19.311.8 16.612.7
—
7.5811.61 7.2012.24
— 396143 363+26 13.012.8 13.112.2
-22.212.5 22.611.5
-
Surface Roughness of Bisque Fired Surface
Ra(um) Rt((nm)
0.7810.07 0.84+0.19
~ ~
51.6+9.6 1.1310.45 1.0810.09
— 2.31+0.31 1.64+0.25
—
0.7510.04 — —
52.6+2.9 53.512.9 1.1110.11 1.26+0.19
— 2.62+0.28
— ~
9.8612.85 8.1911.27
— —
387158 13.2110.9 11.8+2.3
— 20.312.4 17.214.2
—
7.7010.73 — —
447191 388136 12.8+1.7 12.311.5
-22.312.9
--
Surface Roughness After Machining of Bisque Fired
Surface Ra(iim) Rt((nm)
1.1210.06 1.1710.06
1.2310.07
1.23+0.07
1.2710.10 1.0610.05
1.2710.09
1.2010.09
10.710.5 11.110.9
11.210.8
11.611.3
12.411.1 9.9810.66
13.211.9
10.810.8
*Machined surface.

79
Table 3. Weight changes and density after sintering.
Sample ID
TRSN-52-3(a) TRSN-52-I TRSN-52-9 TRSN-52-J TRSN-52-G TRSN-52-2 TRSN-52-19 TRSN-52-20 TRSN-52-10 TRSN-52-F TRSN-52-D TRSN-52-14 TRSN-52-K TRSN-52-4 TRSN-52-H TRSN-52-21 TRSN-52-22 TRSN-53-J(b) TRSN-53-K TRSN-53-G TRSN-53-G1 TRSN-53-17 TRSN-53-I TRSN-53-I1 TRSN-53-D TRSN-53-D1 TRSN-53-F TRSN-53-16 TRSN-53-20 TRSN-53-14 TRSN-53-14B TRSN-53-C TRSN-53-E TRSN-53-B TRSN-53-13 TRSN-53-H TRSN-53-A TRSN-53-18 TRSN-53-15
Setter Type SiC SiC SiC SiC SiC SiC SiC SiC BN BN BN BN BN BN BN BN BN SiC SiC SiC SiC SiC SiC SiC SiC SiC SiC SiC BN BN BN BN BN BN BN BN BN BN BN
Position in
Crucible(c)
1 1 2 2 3 3 4 4 1 1 2 2 2 3 3 4 4 1 1 2 2 2 3 3 3 3 4 4 1 1 1 2 2 3 3 4 4 5 5
Weight Loss (%)
-3.3% -3.8% -3.3% -4.1% -3.2% -4.8% -4.5% -4.5% -2.5% -2.6% -2.3% -1.8% -2.1% -3.1% -3.0% -4.0% -3.8% -2.2% -3.0% -2.3% -3.0% -4.1% -1.8% -1.6% -3.0% -2.8% -4.2% -4.8% -1.0% -1.3% -1.7% -3.5% -1.8% -1.8% -1.5% -3.4% -2.1% -3.9% -2.5%
Sintered Density
(g/cm3)
3.25 3.23 3.25 3.25 3.25 3.25 3.23 3.23 3.19 3.19 3.19 3.19 3.20 3.23 3.22 3.24 3.24 3.54 3.53 3.53
3.53 3.51 3.52 3.53 3.53 3.54 3.54 3.49 3.53 3.53 3.53 3.53 3.53 3.52 3.50 3.51 3.54 3.52
(% T. D.)
99.6% 99.2% 99.7% 99.6% 99.6% 99.7% 99.1% 99.0% 97.9% 97.9% 97.9% 97.9% 98.1% 99.1% 98.8% 99.4% 99.4% 100.0% 100.0% 99.6%
99.8% 99.6% 99.9% 99.9% 100.0% 99.6% 99.8% 98.5% 99.4% 99.4% 99.6% 99.4% 99.4% 99.4% 98.2% 99.0% 99.7% 99.08%
Average
99.5%
98.5%
99.8%
99.2%
Std. Dev.
0.3%
0.7%
0.2%
0.5%
(a) TRSN-52 Samples: Sintering Aid Y203-A1203 (b) TRSN-53 Samples: Sintering Aid Yb203-SrC03-La203 (c) Position numbers identify the sample layer from the bottom of each crucible

Table 4. Summary of Surface Roughness Measurements after Processing and Post-Sintering Surface Treatments
Sample ID TRSN-52-210" TRSN-52-21 TRSN-52-21 TRSN-52-22 TRSN-52-22 TRSN-52-J TRSN-52-2 TRSN-52-14 TRSN-52-K TRSN-52-19 TRSN-52-20 TRSN-52-I TRSN-52-G TRSN-52-H TRSN-52-F TRSN-52-9 TRSN-52-3 TRSN-52-10 TRSN-52-10 TRSN-52-4 TRSN-52-4
TRSN-53-E"" TRSN-53-13 TRSN-53-K TRSN-53-18 TRSN-53-D.E TRSN-53-20 TRSN-53-14 TRSN-53-15 TRSN-53-16 TRSN-53-17 TRSN-53-I,Il TRSN-53-J TRSN-53-B TRSN-53-A TRSN-53-F
Location of Measurement
white coating backside
backside
white coating
white coating
1
Green Surface smooth cast smooth cast smooth cast smooth cast smooth cast smooth cast smooth cast rough cast rough cast rough cast rough cast
coarse grit(c)
coarse grit(c)
coarse grit(c>
coarse grit(c)
fine grit<c)
fine grit<c)
fine grit<c)
fine grit(c)
fine grit(c)
fine grit(c)
smooth cast smooth cast smooth cast smooth cast smooth cast rough cast rough cast rough cast rough cast rough cast
coarse grit<c)
coarse grit(c)
coarse grit(c)
coarse grit(c)
fine gritCc)
Sintering Setter
Material
BN BN
none BN
none SiC SiC BN BN SiC SiC SiC SiC BN BN SiC SiC BN BN BN BN
BN BN SiC SiC SiC BN BN BN SiC SiC SiC SiC BN BN SiC
Surface Roughness After Maching of Bisque Fired
Surface Ra(um) Rt(um)
na(c) na(c)
na<" na«> na(c) na(c> na(e) na(e)
na(c) na(e)
1.1210.06 10.710.5 nm<'> nm<d> na(e) na(c)
na<° na(c)
1.1710.06 11.110.9 nm» nm» na<c) na(e> na<° na(c)
nm«» nm(d» 1.2310.07 11.611.3
na(c) na(e)
na(c) naw
1.2310.07 11.210.8
nm(d) nmMI
none none
12710.10 12.411.1 none none yes yes
none none none none none none yes yes
1.0610.05 9.9810.66 none none none none
1.2010.09 10.810.8 yes yes
none none
Surface Roughness As-Sintered
Ra(um) Rt(um) 2.4810.63 26.217.2 2.2611.76 19.9114.0 4.8111.69 68.4123.9 2.4810.24 28.414.9 5.6710.75 72.8110.5 2.0710.60 21.213.7
-49.2110.5 360.175 48.813.3 332137 2.1510.29 22.413.1 2.2210.42 24.414.2 3.0610.25 30.813.4
-2.9710.99 37.017.9 1.6010.16 16.412.8 2.0710.24 21.813.9 3.8610.65 36.316.8
-1.4010.11 13.312.1 2.0510.13 22.913.8 3.1910.75 28.517.1
2.4410.86 34.1110.6
3.611.1 40.1110.6
38.512.9 321152
3.511.4 35.1114.0 3.311.3 28.715.4
2.40+0.16 24.711.9 1.4810.10 15.910.7 1.4610.08 14.611.5
Surface Roughness Tumbled 4 hr
Ra(um) Rt(um)
1.8210.28 18.614.0
2.2910.79 23.016.1
3.8711.23 32.318.2 2.0110.62 23.4110.5
Surface Roughness Tumbled 23.5 hr
Ra(um) Rt(um)
1.7810.15 20.113.4 5.1510.68 73.6113.8
2.6110.94 26.117.5
4.9911.04 45.418.8 2.0910.59 20.815.2
Surface Roughness Grit Blasted
Ra(um) Rt(um)
1.5610.36 16.813.1
52.417.5 368126
72810.66 59.718.9 1.4110.06 15.211.9 3.3711.21 29218.4
00 o

TRSN-53-C TRSN-53-H
TRSN-53-G.G1
fine grit'" fine grit'" fine grit'"
BN BN
yes yes 1.2710.09 13.211.9
none none
1.5310.11 15.211.4
60 TRSN-52 Samples: Sintering Aid Y2OrAI20, w TRSN-53 Samples: Sintering Aid Yb20j-SrC03-La203
'" Machined Surface *" nm - machined after bisque fire, but surface roughness was not measur '" na - surface was not machined after bisque fire
ed

Table 5. Initial results from Taguchi experimental array to identify important surface property variables affecting the final properties of the sintered silicon nitride materials.
Surface Processing Variables Surface Processing Properties Test No.
1 2 3 4 5 6 7 8 9
10
11
12
13
14
15
16
Green Surface Condition
As-Cast (Smooth) As-Cast (Smooth) As-Cast (Smooth) As-Cast (Smooth) As-Cast (Rough) As-Cast (Rough) As-Cast (Rough) As-Cast (Rough)
Machined (Coarse Grit) Machined
(Coarse Grit) Machined
(Coarse Grit) Machined
(Coarse Grit) Machined (Fine Grit) Machined (Fine Grit) Machined (Fine Grit) Machined (Fine Grit)
Machine After Bisque
Firing No No Yes Yes No No Yes Yes No
No
Yes
Yes
No
No
Yes
Yes
Surface Sintering Condition
Exposed to Atmosphere Exposed to Atmosphere Adjacent to SiC Setter Adjacent to SiC Setter Exposed to Atmosphere Exposed to Atmosphere Adjacent to SiC Setter Adjacent to SiC Setter Adjacent to SiC Setter
Adjacent to SiC Setter
Exposed to Atmosphere
Exposed to Atmosphere
Adjacent to SiC Setter
Adjacent to SiC Setter
Exposed to Atmosphere
Exposed to Atmosphere
Post-Sinter Surface
Treatment None
Grit Tumble Sandblast Machine Sandblast Machine
None Grit Tumble
Machine
Sandblast
Grit Tumble
None
Grit Tumble
None
Machine
Sandblast
Post-Sinter Thermal Treatment
None Oxidize
Thermal Shock Inert Gas Heattreat Inert Gas Heattreat
Thermal Shock Oxidize None
Oxidize
None
Inert Gas Heattreat
Thermal Shock
Thermal Shock
Inert Gas Heattreat
None
Oxidize
Processed Surface Strength
(MPa) 455+13
545±61
681+29
454±93
472+56
529+16
404+67
620+21
Indented Strength (MPa)
346+22
329±4
333±45
280+53
348+17
368+34
185±4
351+5
Fracture Toughness (MPaVm) 8.2+0.3
7.9+0.1
8.0+0.7
7.010.9
8.3+0.2
8.310.4
5.110.1
8.310.1

83
Table 6. Summary of results on densification of samples from CRADA with MER Corp. gas pressure sintered at 1900°C/1950°C.
Sample No.
MR-1 MR-2 MR-3 MR-4 MR-5 MR-6 MR-7 MR-8 MR-9 MR-10 MR-11 MR-12
MC-1 MC-2 MC-3 MC-4 MC-5 MC-6 MC-7 MC-8 MC-9 MC-10
Weight Loss (%)
5.4 4.5 4.1 4.3 3.7 4.3 2.7 3.4 1.3 2.0 4.8 4.2
3.4 2.4 4.2 4.5 1.1 1.1 1.6 0.6 2.5 2.1
Density (g/cm3)
3.50 3.53 3.54 3.53 3.54 3.31 3.52 3.51 3.22 3.11 3.52 3.50
3.22 3.22 2.81 2.66 3.18 3.18 3.15 3.23 3.05 3.16
Density (% T. D.)
99.5 100.3 100.5 100.4 100.5 94.0 99.9 99.6 96.1 92.9 100.0 99.4
98.1 98.3 85.7 81.2 97.0 97.9 97.0 96.4 91.0 94.4
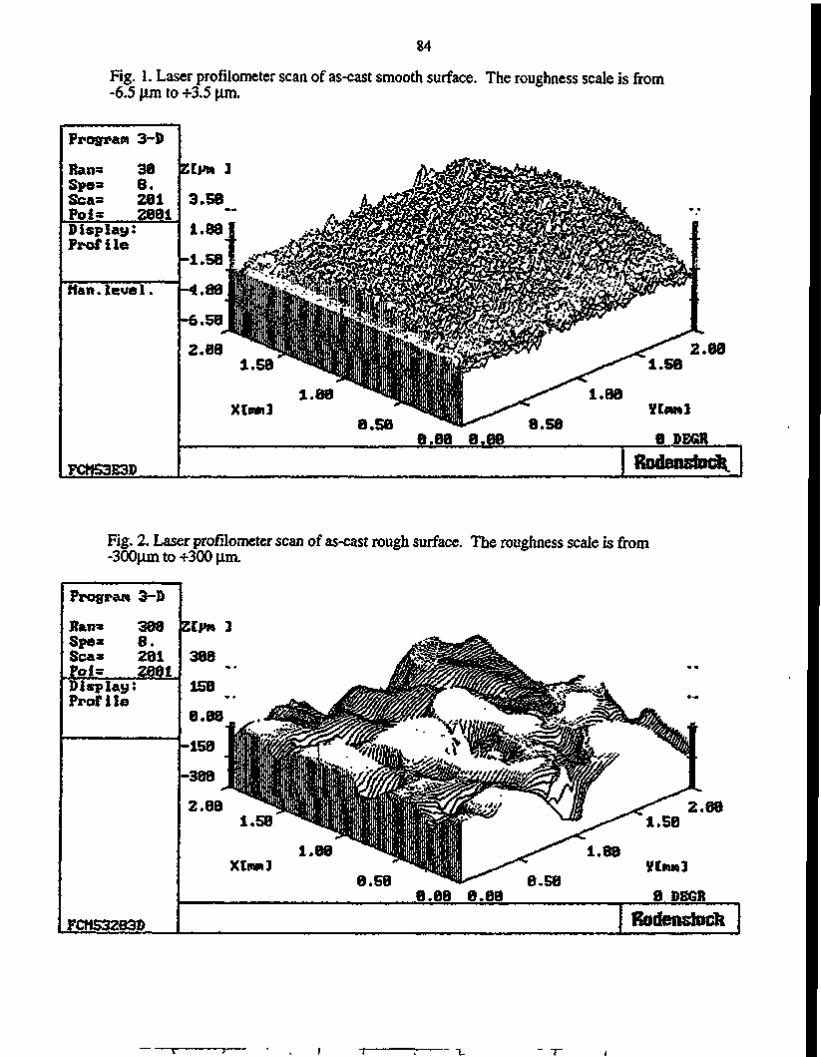
84
Fig. 1. Laser profilometer scan of as-cast smooth surface. The roughness scale is from -6.5 um to +3.5 um.
Fig. 2. Laser profilometer scan of as-cast rough surface. The roughness scale is from -300um to +300 um.

85
Fig. 3. Laser profilometer scan of machined (fine grit) surface. The roughness scale is from -5 um to +25 um. The peak in the corner represents an unground section.
Program 3-D
Ran= 30 Spe= 8 .
f ca= 201
ot= 2881 ) i splay.' r o f i l e
•CM53F3D
0.80
1.88
2.88 2.88
VCttrtJ
188DEGR Rodertstocfc
Fig. 4. Laser profilometer scan of machined (coarse grit) surface. The roughness scale is from -10 um to +20 um.
Prograw 3-D Ban= 30 Spe= 8. Sca= 201 Poi= 2081 Display: Profile
Auto.level.
FCH53J3D 8.88 8.80
2.88
Rodensfoch
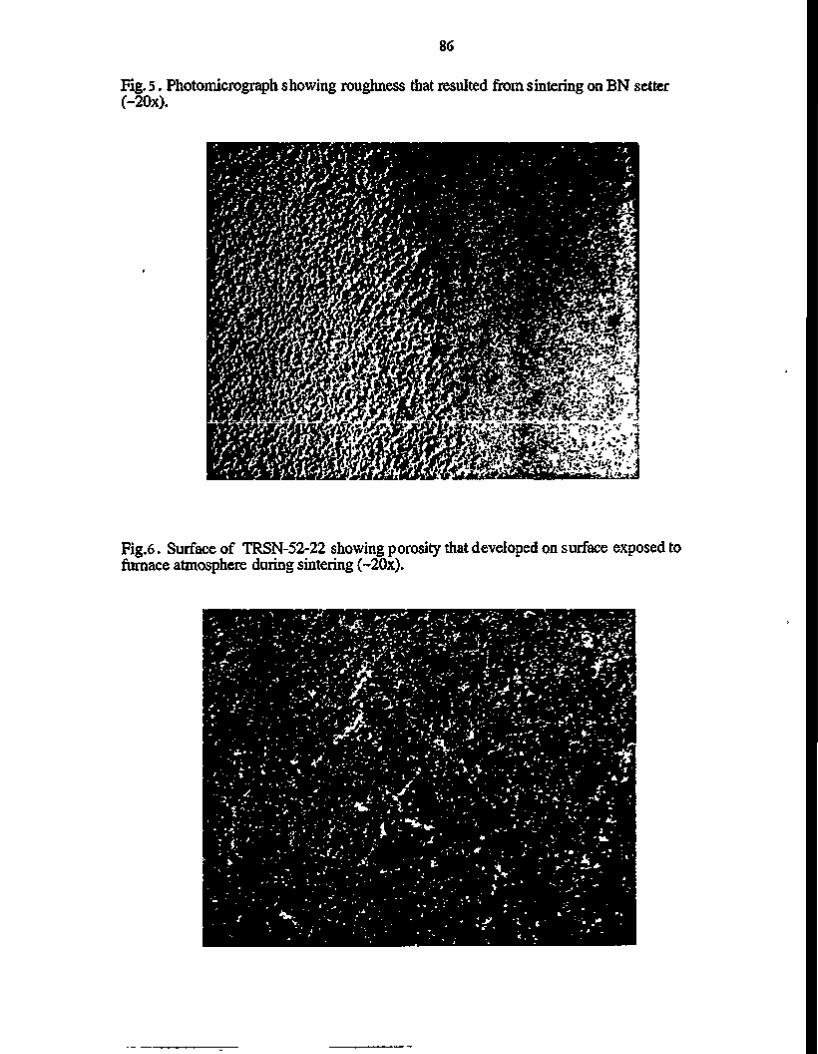
86
Fig. 5. Photomicrograph showing roughness that resulted from sintering on BN setter (~20x).
Fig.6. Surface of TRSN-52-22 showing porosity that developed on surface exposed to furnace atmosphere during sintering (~20x).

87
1.2.4 Low Expansion Materials
W. B. S. Element 1.2.4.3 CHARACTERIZATION AND TESTING OF LOW EXPANSION CERAMIC MATERIALS
S. Shanmugham andD. P. Stinton
Objective/Scope
Insulated exhaust portliners are needed in advanced diesel engines to increase engine fuel efficiency by increasing the combustion temperatures and reducing the combustion heat that is lost through the head and into the water cooling system. Low expansion materials have potential for this application due to their very low thermal conductivity, extraordinary thermal shock resistance, and reduction of attachment stresses. Thermal shock resistance is critical because the shape of the portliners requires that they be cast into the metallic cylinder head. Functioning exhaust portliners are inaccessible after they are cast into cylinder heads and hence, must not require maintenance for the life of the head (~ 1 million miles). Contracts have been placed with Golden Technologies, Inc., formerly Coors Ceramic Co., and LoTEC, Inc., to develop cost effective processes for the fabrication of portliners. Coors is investigating A ^ T i O s and Cai_xMgxZr4P6024, while LoTEC is investigating Bai+xZr4P6-2xSi2x024 (BaZPS) and Cai-xSrxZr4P6024-ORNL is assisting Golden Technologies and LoTEC with the characterization and evaluation of their compositions.
Technical Highlights
A systematic investigation of the mechanical and thermal properties of BaZPS ceramics as a function of composition (Si at%) and grain size has been initiated. Five compositions (x=0, 0.175, 0.25, 0.375, and 0.500) were synthesized from stoichiometric proportions of the reagent grade oxides using a solid-state reaction method and were sintered at 1600°C for 3000 minutes. To determine the influence of the grain size, three compositions (x=0, 0.175 and 0.500) were additionally sintered for 30 and 300 minutes to result in smaller grain sized samples. In this semi-annual report, the hardness results of the BaZPS compositions, the high temperature flexural strength of the BaZPS compositions (x=0, 0.175 and 0.5) as a function of grain size and the phase transition behavior of BaZPS with x=0.25 are presented.

88
The hardness testing was conducted on a Tukon Series 200 hardness tester (Wilson Instruments, Inc.) and the BaZPS samples used were 12 x 4 x 3 mm. The samples were mounted with the 12 x 4 mm side facing the die and epoxy was poured over it and allowed to set for 16 h. The specimens were then removed from the die and an identification mark was engraved. The samples were ground parallel using a 200 grit, resinoid bonded diamond grinding wheel on a surface grinder. The samples were rough polished using a 6 nm diamond paste on a wire mesh cloth followed by rough polishing utilizing a 6|xm diamond paste on a perforated cloth. Final polishing was carried out in two steps. First, the samples were polished using a 3 urn diamond paste on a texmet cloth. Then, the sample was polished using a 0.5 um diamond paste on a nylon cloth to obtain an optical surface finish.
The hardness indentations were made using a Knoop indenter with loads of 50-300 gms at a constant loading time of 10 sec. The diagonal of the indentations were measured using a VIA-110 video hardness measurement system, which is attached to the hardness tester. The Knoops hardness was then calculated using the standard formula.
The high temperature flexural strength of the BaZPS compositions were determined using a specially designed flexure test system capable of separately testing up to three specimens concurrently in series. The testing was carried out using a four-point bend fixture with 40 mm and 20 mm as outer and inner spans, respectively. Three specimens of each of the compositions were tested at 200°C, 600°C, and 1000°C. The furnace was ramped to the desired test temperature and the sample soaked for 5 minutes, and tested using the series option.
BaZPS with x=0.25 (BS25) sintered for 3000 min was ground into a fine powder. Differential scanning calorimetry (DSC, Stanton Redcroft Instruments) runs were conducted in a platinum crucible for the BS25 powder with sapphire as the reference material. The DSC furnace was ramped at 50°C/min between 25°C and 1300°C in air and the data was collected and stored by an automated data collection system.
The hardness test results for the BaZPS compositions are summarized in Table 1. The hardness increased with increasing Si content to x=0.375 and then decreased sharply for x=0.5. Among the

89
BaZPS compositions, BaZPS with x=0.375 showed the highest hardness value (7.61 GPa). At lower loads, the indentation dimensions varied between 30 and 75 um, and between 89 and 190 um for higher loads. Also, the hardness values decreased with increase in indentation loads for all the BaZPS compositions.
Table 1 Hardness results for the BaZPS compositions
BaZPS composition
Load (g)-> 0 0.175 0.250 0.375 0.500
Hardness (GPa)
50 4.42±0.10 4.65+0.16 5.30+0.09 7.61±0.26 3.18±0.19
100 4.12±0.04 4.30±0.18 4.65±0.13 5.55±0.15 2.72±0.04
200 3.4510.08 4.1110.10 4.1210.06 5.0310.10 2.4610.04
300 3.2910.10 3.6610.12 3.7310.04 5.1910.06 2.4110.06
The grain sizes of the three BaZPS compositions were determined from optical micrographs of etched specimens and the results summarized in Table 2 are an average obtained from five micrographs with standard deviation less than 5%.
Table 2 Grain size measurements of the BaZPS compositions
BaZPS composition Sintering time (min)—> x=0 (BSO) X=0.175 (BS17) X=0.5 (BS50)
Grain size (\i m)
30
1.83 1.64 1.36
300
2.70 2.42 1.91
3000
5.08 4.16 2.67
The high temperature flexural strengths of the BaZPS compositions are summarized in Table 3. The flexural strength of the BSO compositions varied between 41 and 122 MPa. Among the BSO compositions, the BSO sintered for 3000 minutes had the lowest strength at all the temperatures. Flexural strength of the BS17 compositions with different grain sizes did not vary significantly with temperature. Similar trend was observed in the BS50 compositions. Among the three BaZPS compositions studied, BS50 had the lowest strength.

90
Table 3 High Temperature flexural strength results for the BaZPS compositions
Composition (grain size in |im)
BSO (1.83) BSO (2.70) BSO (5.08) BS17 (1.64) BS17 (2.42) BS17 (4.16) BS50 (1.36) BS50 (1.91) BS50 (2.67)
Flexural Strength (MPa)
Test Temperature 25°C
79.115.3 61.811.1 55.314.9 78.012.3 84.9111.2 84.6112.2 54.014.0 36.015.4 49.617.6
200°C 81.4110.6 74.315.9 66.012.4 76.6116.2 94.0115.3 84.212.3 48.414.2 43.311.4 45.111.8
600°C 92.519.10 80.314.7 41.4114.4 67.4125.2 79.7116.7 79.319.6 56.816.3 56.511.3 50.913.5
1000°C 95.2111.0 122.7114.0 83.0134.7 93.715.5 96.619.3 95.211.5 55.815.8 56.511.3 50.913.5
The DSC curve for BS25 showed a broad endothermic peak betweem 540 and 740°C (peaking at 620°C), thus suggesting that it exhibits a phase transition.
Reference
None
Milestones
On Schedule
Communications /Visits/Travel
D. P. Stinton attended a meeting at Chrysler Technical Center on High Temperature Catalyst Support in Detroit, Michigan and discussed low expansion ceramics at Cummins in Columbus, Ohio during February 22-24,1995. D. P. Stinton traveled to Salt Lake City, April 18th and 19th to discuss recent progress in the low-expansion ceramics contract with Santosh Limaye of LoTEC and Bob Schultz of DOE. D. P. Stinton visited Jack Sibold and Bob Weaver of Golden Technologies Corporation on April 20th to discuss an extension of their low-expansion ceramics contract.

91
D. P. Stinton traveled to Virginia Polytechnic Institute, April 24th and 25th to discuss the development of low-cost processing of NZP powders with Jesse Brown and Gary Pickerell. D. P. Stinton attended the Annual Meeting of the American Ceramic Society in Cincinnati, May 1st to 3rd. Participants in the low-expansion ceramics project met to discuss recent developments at Golden Technologies Corporation and LoTEC.
Problems Encountered
None
92
Development of NZP Ceramic Based "Cast-in-Place" Diesel Engine Port Liners Rama Nageswaran, Jian Zheng, and Santosh Y. Limaye (LoTEC, Inc.).
Objective/Scope
The overall objective of this research is to develop sodium-zirconium-phosphate (NZP) ceramic based "cast-in-place" diesel engine port liners. Specific objectives are: (1) Development and optimization of the overall insulation system, (2) Refinement of the compliant layer formation process around the ceramic insulation system, (3) Development and adaptation of cost-effective powder and material fabrication processes, and (4) Creation of database of high temperature properties (stability in diesel exhaust environment, thermal cycling, thermal shock etc.).
Technical Progress
The list below summarizes work completed or started during the last six-month period, beginning March 1995 and ending October 1995, of this Phase II program. Detailed description of progress in each area succeeds the following list:
(!) Characterized mechanical or thermo-mechanical properties such as elastic modulus, flexure strength, and compressive strength, and thermal shock resistance of the CS-50 ceramic;
(H) Optimized the strain tolerance properties of the compliant layer for successful metal casting with the BS and CS tubes;
(IH) Performed finite element analysis (FEA) of cast-in-place BS-25 and CS-50 straight tube port liners with and without compliant layer and, in addition, optimized the thickness of the compliant layer;
(TV) Conducted metal casting trials with straight tube BS-25 and CS-50 ceramics with and without compliant layer to (i) verify results of FEA and (ii) demonstrate successful casting of composite port liners based on such NZP ceramics;
(V) Improved crystallinity of the BZP and CZP powders resulting from low cost Self-Propagating Chemical Decomposition (SCD) method.
Characterization of Mechanical Properties of CS-50::
Elastic modulus as a function of temperature was evaluated using an ultrasonic measurement technique at Penn State University. In this procedure, a bar sample of the CS-

93
50 ceramic is suspended in a furnace by two sapphire threads acting as ultrasonic waveguides, connected to two transducers, one acting as a source and the other as receiver. The temperature is raised slowly to 1325°C and the resonance frequency noted at 100°C intervals. The Young's modulus is then calculated from:
„ 0.94645 Cmf2 ,„ E = ^ (1)
In Equation (1), C is a constant that depends upon the Poisson's ratio, D, specimen thickness, t, and length, 1; and m is the mass; f is the flexural resonance frequency; and W is the width.
Figure 1 represents a plot of the elastic modulus of CS-50 as a function of temperature. It can be noted that the modulus is almost constant between room temperature and 1200°C during heat up, while there is a very small deviation from constancy during cool down. Clearly, this result is indicative of the high degree of isotropy of the CS-50 material. For this calculation CS-50's Poisson's was assumed to be 0.23.
Compressive Strength of CS-50 was measured in unconfined compression tests on l"x 2" long cylinders at an outside facility. During the testing, axial and transverse strains were monitored using strain gauges. Poisson's ratio was calculated from the ratio of lateral to axial strains from the linear portion of the strain-strain curves. These values are tabulated in Table 1.
Thermal shock resistance tests were conducted on CS-50 bar samples by cyclically quenching from high temperature to a bath of ice water for between 1 and 50 cycles. The upper limit thermal shock temperature, Th, for the test was estimated using the following equation for thermal shock parameter [1]:
of (1 - u) AT = fK (2)
r Ecc where, ATf, represents the temperature difference of quench (that could initiate fracture at the surface); Cf, E, u, and a are the fracture stress, elastic modulus, Poisson's ratio, and the coefficient of thermal expansion, respectively, of the material. Using the fracture strength in flexure and values of other properties listed in Table 2 for CS-50, the thermal shock parameter was estimated to be ~ 311.5°C. From this calculation, Th for the test was set at 400°C. To confirm if this estimate was reasonable, several bar samples were quenched into ice water from high temperatures ranging from 1200°C to 500°C. All quenched samples either cracked or showed significant degradation strength compared to the normal samples.

94
Samples thermal-shock cycled between 400°C and 0°C were tested for their (residual) flexure strengths in four-point bending. Ten samples each were cycled for 1, 10, and 50 cycles. Figure 3 is a bar chart of the residual strengths measured on the thermally-shocked samples. The residual strength after 1 thermal shock cycle is approximately 60% that of as-sintered samples. However, there is not much drop in strength upon further thermal shock cycling even up to 50 cycles. The lower thermal shock performance of CS-50 as compared to BS-25 is not surprising considering its higher thermal expansion coefficient.
Optimization of Strain Tolerance of Compliant Layer:
The role of the compliant layer in increasing the survivability of the cast-in-place NZP ceramic port liner has been adequately demonstrated during past work on this program. To improve manufacturability and reliability-in-service of the port liner, the compliant layer properties have to be adequately optimized. One of the approaches, proposed in Phase I, is to reduce the elastic modulus of the compliant layer without compromising its strength properties. Effectively, this results in a material with high strain-to-failure. Two different methods of reducing elastic modulus of the compliant layer viz. (i) reduction of the sintering temperature (sintering method) and (ii) introduction of artificial porosity (pore former method) were used. Both methods affect the elastic modulus via the nature, amount, and distribution of porosity in the material.
For actual measurements of elastic modulus and flexure strength due to each of these processing methods, 10 bar specimens (3 x 4 x 50 mm) of the compliant layer material were fabricated and tested. Results of these studies indicate that reduction of sintering temperature (sintering method) provides good strain tolerance characteristics - relatively high strength and low modulus - to the compliant layer. Strain tolerance was maximum at a particular sintering temperature. Also, failure strains resulting from the sintering approach were uniformly higher than those from the pore-former approach. These results have been summarized in the plot of Figure 2.
Finite Element based optimization of Cast-in-place Port liners :
Finite Element Analysis was conducted for the following straight tube cast-in-place NZP ceramic based Port liners. The intent of the analysis was to predict the outcome of metal casting trials involving BS-25 and CS-50 ceramics with and without a compliant layer. In addition, the analysis was used to study the effect of using BS-25 and CS-50 ceramics with lower elastic moduli (and higher strain-to-failure) on the shrinkage stresses.
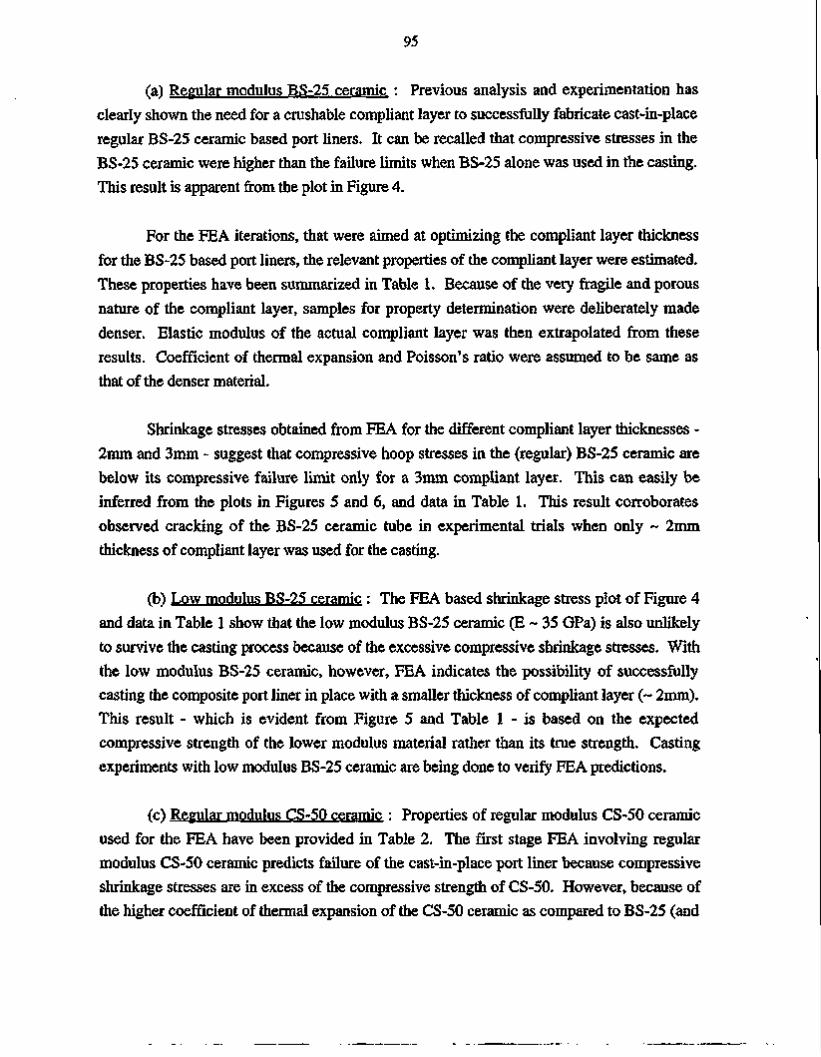
95
(a) Regular modulus BS-25 ceramic : Previous analysis and experimentation has clearly shown the need for a crushable compliant layer to successfully fabricate cast-in-place regular BS-25 ceramic based port liners. It can be recalled that compressive stresses in the BS-25 ceramic were higher than the failure limits when BS-25 alone was used in the casting. This result is apparent from the plot in Figure 4.
For the FEA iterations, that were aimed at optimizing the compliant layer thickness for the BS-25 based port liners, the relevant properties of the compliant layer were estimated. These properties have been summarized in Table 1. Because of the very fragile and porous nature of the compliant layer, samples for property determination were deliberately made denser. Elastic modulus of the actual compliant layer was then extrapolated from these results. Coefficient of thermal expansion and Poisson's ratio were assumed to be same as that of the denser material.
Shrinkage stresses obtained from FEA for the different compliant layer thicknesses -2mm and 3mm - suggest that compressive hoop stresses in the (regular) BS-25 ceramic are below its compressive failure limit only for a 3mm compliant layer. This can easily be inferred from the plots in Figures 5 and 6, and data in Table 1. This result corroborates observed cracking of the BS-25 ceramic tube in experimental trials when only ~ 2mm thickness of compliant layer was used for the casting.
(b) Low modulus BS-25 ceramic : The FEA based shrinkage stress plot of Figure 4 and data in Table 1 show that the low modulus BS-25 ceramic (E ~ 35 GPa) is also unlikely to survive the casting process because of the excessive compressive shrinkage stresses. With the low modulus BS-25 ceramic, however, FEA indicates the possibility of successfully casting the composite port liner in place with a smaller thickness of compliant layer (~ 2mm). This result - which is evident from Figure 5 and Table 1 - is based on the expected compressive strength of the lower modulus material rather than its true strength. Casting experiments with low modulus BS-25 ceramic are being done to verify FEA predictions.
(c) Regular modulus CS-50 ceramic : Properties of regular modulus CS-50 ceramic used for the FEA have been provided in Table 2. The first stage FEA involving regular modulus CS-50 ceramic predicts failure of the cast-in-place port liner because compressive shrinkage stresses are in excess of the compressive strength of CS-50. However, because of the higher coefficient of thermal expansion of the CS-50 ceramic as compared to BS-25 (and

96
lower CTE mismatch with gray-iron), compressive shrinkage stresses in CS-50 are lower after complete cooling of the composite. Figure 7 shows a plot of these FE analysis results.
For the second stage of FEA, a crushable compliant layer was introduced between the CS-50 ceramic and gray iron to induce reduction of the shrinkage stresses. The compliant layer material used in this model was almost the same as that used for BS-25; properties of which are included in Table 2. Results of the second stage FEA involving CS-50 with the compliant layer indicate that a 2 mm thick layer is clearly sufficient to keep shrinkage stresses in CS-50 within failure limits (max. compressive stress of 340 MPa vs compressive strength of 390 MPa). This result is evident from Figure 8.
(d) Low modulus CS-50 ceramic : As with BS-25, the chosen low modulus CS-50 ceramic has a higher strain-to-failure than regular CS-50. FEA for metal casting with this low modulus material suggested that: (i) compressive failure is imminent if this ceramic is used as is and (ii) failure can be avoided by using a compliant layer approx. 1mm thick in around the low modulus CS-50. These can be inferred from the shrinkage stress plots in Figures 7 and 9 and data in Table 2 corresponding to the low-modulus CS-50. As with BS-25, the compressive strength of the low modulus CS-50 material is not a measured value; rather it is an approximate value. A 1 mm thick compliant layer represents the best situation for cast-in-place port liners where rattling during operation of the diesel engine could pose a problem. (Rattling can lead to progressive degradation of such composite port liners because of lack of microstructural bonding between its different components.)
Metal Casting Trials with BS-25 and CS-50 Ceramics :
BS-25 Ceramic: Metal casting trials were performed using regular modulus BS-25 straight tubes having approximately 2 and 3 mm thick compliant layers to verify results of previous trials which suggested that a 2 mm thick compliant layer was inadequate for fail safe casting. Cracks could be seen in the BS-25 port liner tubes with just 2 mm thick compliant layer. As with the earlier trials, the strain-tolerant compliant layer material was deliberately made highly porous and crushable.
Result of the repeat metal casting experiments on BS-25 tubes with the 2 and 3 mm thick compliant layers again indicated that the latter was better for enhancing the survivability of the cast-in-place BS-25 port liners. These results are clear from the camera snap-shot of Figure 10. Arguably, the thicker the compliant layer the lesser will be the

97
compressive stresses in the ceramic. On the other hand, the compliant layer cannot be made very thick because of the likelihood of debonding the ceramic tube from the surrounding metal during rattling in actual service. For this reason, it is important to optimize the thickness of the compliant layer as much as possible using predictions from FEA.
CS-50 Ceramic: Casting trials were also performed using regular modulus CS-50 straight tubes with and without compliant layer to verify results of FEA. As predicted by the model, cast-in-place CS-50 tubes seemed to crack excessively in a manner of compressive failure. However, an interesting feature of the cast part was the presence of metal (gray-iron) in the interior of the CS-50 tube and away from the ends. Metal appeared to have penetrated across the wall (almost perpendicular to it) of the ceramic tube. This situation is possible only if the cracks had formed in the ceramic at the instant the molten metal was poured around the ceramic. Such can easily be the case considering the relatively low thermal shock resistance of CS-50 as compared to that of BS-25. These experimental results will be verified with a few more metal casting trials.
In addition, the finite difference heat transfer model used for metal casting with BS-25 will be employed for CS-50 also to predict the failure due to thermal gradient stresses arising from contact of hot metal with the exterior of the cold ceramic tube. Despite the possibility of thermal gradient stress type failure, it is very likely that CS-50 ceramic fails due to both thermal gradient and shrinkage stresses when molten gray iron is cast around it.
Metal casting experiments with CS-50 tubes having 1.5,2, and 3 mm thick compliant layers resulted in successful cast port liners (see picture in Fig. 11). This result falls in line with the FEA predictions. It is inferred, at this point, that the role of the crushable compliant layer in the case of CS-50 might be two-fold: (i) reduction of thermal gradients across the CS-50 tube at the instant of casting and (ii) absorption of the shrinkage stresses during cooling of the gray iron around the ceramic. Again, these results will be further verified in future casting trials and also by heat-transfer modeling. (X-ray computer tomographs in further support of these observations and results will be presented in future reports.)
Low Cost Synthesis of NZP powders (SCD Method) :
During previous SCD experiments, reactant powders containing different amounts of urea and ammonium nitrate and stoichiometric amounts of other precursors were heated in wide necked pyrex beakers at a rate of 10°C/min to 500°C and held at 500°C for 5 minutes,

98
followed by cooling in air. The resulting crystallinity of the various BZP and CZP phases were qualified using X-ray analysis. In order to enhance crystallinity of BZP and CZP phases,, the SCD based powders were heated to 800°C for 8 hrs to initiate further reaction. The as-heat treated powders were again X-rayed. Some amount of each powder was placed on glass plates and subjected to X-ray analysis to determine peak heights, and thereby, obtain a rough measure of crystalHnity.
Results of these tests and analysis for CZP , BZP, CS50 and BS25 revealed that (i) a large amount of urea is necessary for the reaction to attain completion, especially for BZP and (ii) when lesser amounts of urea are present, the post-combustion heat treatment results in greater crystallinity of the powders. More detailed studies to improve crystallinity of the powders are being carried out.
Status of milestones : Program on schedule.
Communications/Visits/Travel: None.
Problems Encountered: None.
Publications: None.
References: 1. W. D. Kingery, H. K. Bowen, and D. R. Uhlmann, Introduction to Ceramics,
Second Edition (1976); John Wiley & Sons., New York.
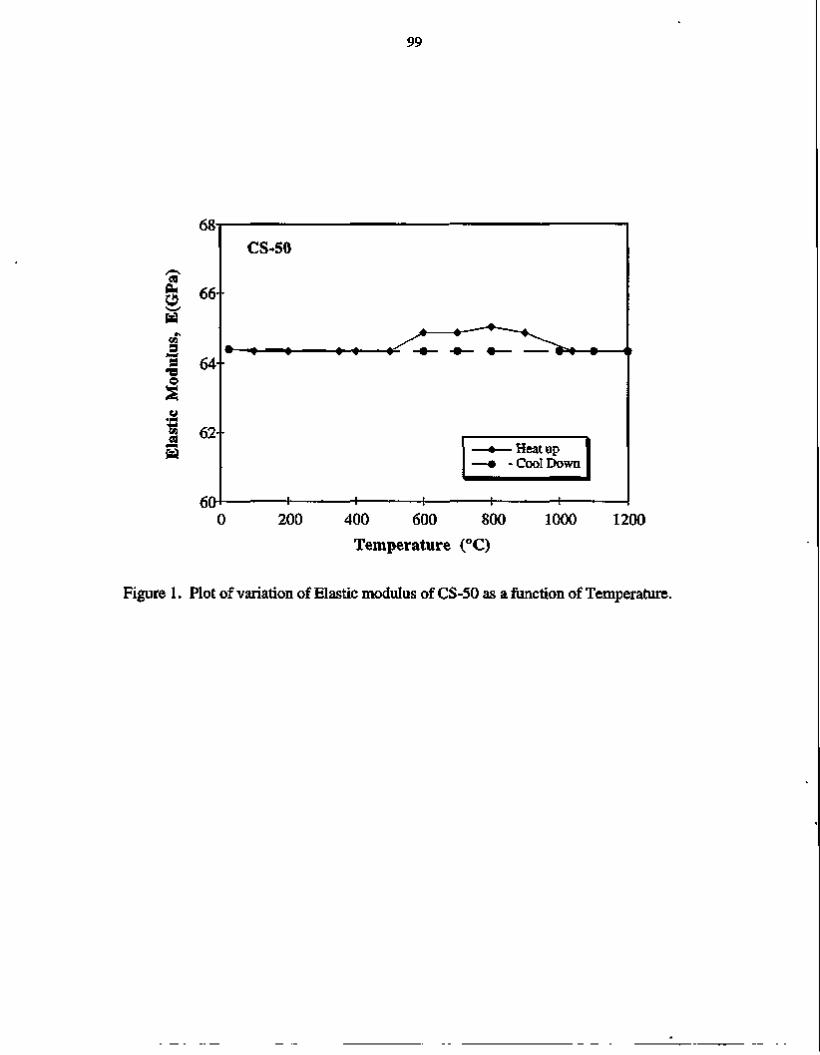
99
O
"3 O
CO CS
68
66
64
62
60
CS50
' \— 1—
H^T
' 1
— ♦ — Heat up — • Cool Down
1 ' 1
0 200 400 600 800 Temperature (°C)
1000 1200
Figure 1. Plot of variation of Elastic modulus of CS50 as a function of Temperature.
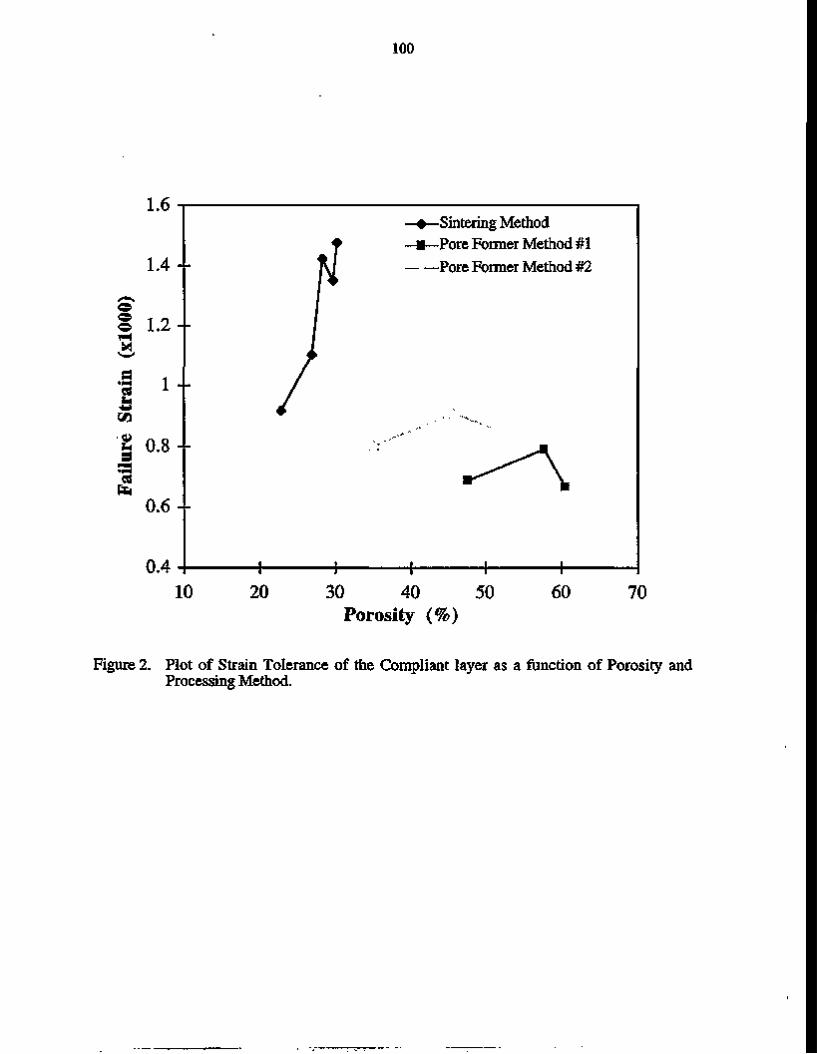
100
03 fa
1.6
1.4
o § 1.2
•■* l 03 l ^ U
<»
"g 0.8 3
Sintering Method Pore Former Method #l Pore Former Method #2
0 . 6
0.4 10 20 30 40
Porosity (%) 50 60 70
Figure 2. Plot of Strain Tolerance of the Compliant layer as a function of Porosity and Processing Method.
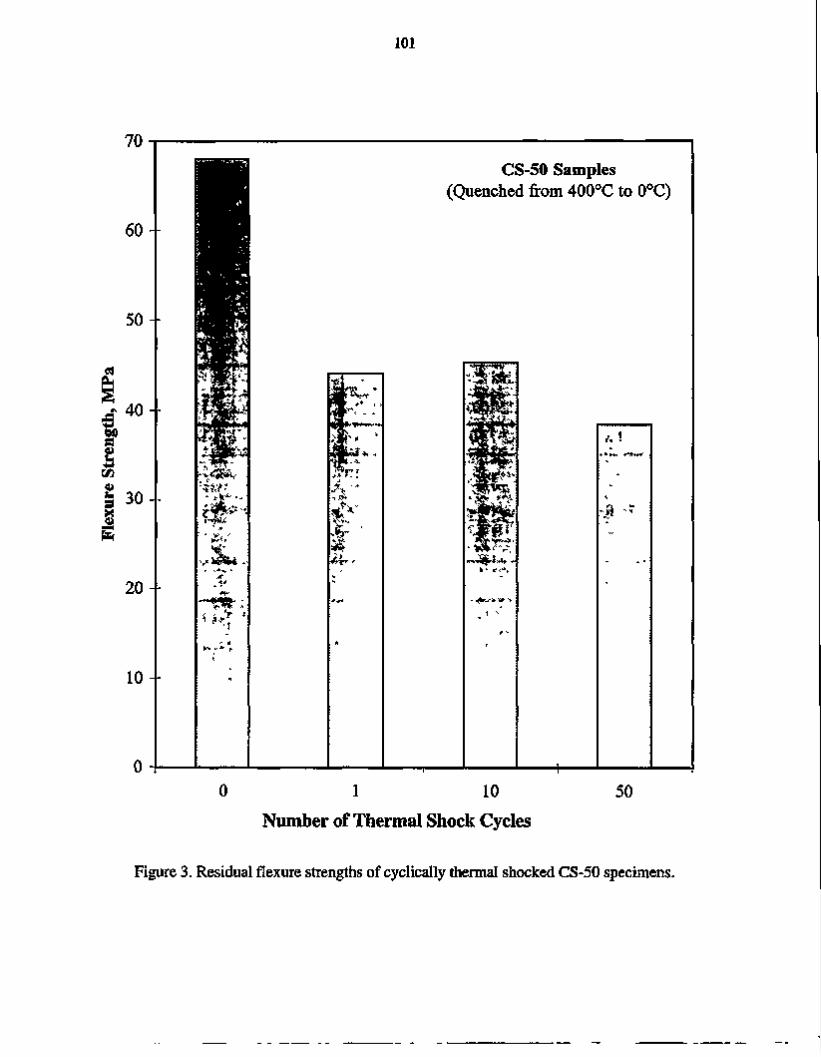
101
70
60
5 0 -
cs
^ 4 0 ft a u
t/5 £ 30
fe
2 0 -
10
0
T *
CS-50 Samples (Quenched from 400°C to 0°C)
Sr^V #'*&wJ
0 1 10 Number of Thermal Shock Cycles
50
Figure 3. Residual flexure strengths of cyclically thermal shocked CS-50 specimens.

102
TABLE 1: Relevant Material Properties for FEA of Cast-in-place BS-25 Port Liners with and without Compliant Layer.
PROPERTY
Density (gm/cc)
Modulus (GPa)
Poisson's Ratio
Thermal Expansion (xlO-6per°C)
Strength (MPa):
Compressive
Flexural
MATERIAL
BS-25 (REGULAR)
3.50
70.0
0.24
1.0
-400.0
75.0
BS-25 (LOW MOD)
2.50
35.0
0.24
1.0
-300
50.0
COMPLIANT LAYER
-1.0
-0.5
0.24
1.0
-
2.0
GRAY IRON
7.0
172.0
0.28
12.1
>1000.0
-460.0
TABLE 2: Relevant Material Properties for FEA of Cast-in-place CS-50 Port Liners with and without Compliant Layer.
PROPERTY
Density (gm/cc)
Modulus (GPa)
Poisson's Ratio
Thermal Expansion (xlO-6per°C)
Strength (MPa):
Compressive
Flexural
MATERIAL
CS-50 (REGULAR)
3.30
65.0
0.19
3.0
-390.0*
75.0
CS-50 (LOW MOD)
2.55
50.0
0.19
3.0
-325.0
50.0
COMPLIANT LAYER
-1.0
-0.5
0.24
1.0
2.0
GRAY IRON
7.0
172.0
0.28
12.1
>1000.0
-460.0
* Average of two tests.

450
-300--
.5 -450--
-600--
' — - — — J l \ BS-25
(LOW MOD) '/ /
I I
BS-25 -75a =—■ -
-900
Gray Iron
FEA Based Stresses (Complete Cooling)
Radial, Six (MPa) - Axial, Szz (MPa) Hoop, Stt (MPa)
0.025 0.027 0.029 0.031 0.033 Radial Distance, r(m)
0.035 0.037
Figure 4. Finite Element based Shrinkage Stresses in the BS-25+ Gray Iron cast-in-place Port liner after Complete Cooling.

CS 0<
<U tn tfl <U hi
♦ J CO V exi
a "S CO
300
200
100
0
100
200
300
400
500
600
B S 2 5 / / (LOW MODy,
+
Compliant L a y e r ( 2 m m )
Gray Iron
FEA Based Stresses (Complete Cooling)
Radial, Sir (MPa) Axial, Szz (MPa) Hoop, Stt (MPa)
■+ 4 ■+
0.025 0.027 0.029 0.031 0.033 0.035
Radial Distance, r(m)
0.037 0.039
Figure 5. Finite Element based Shrinkage Stresses in the BS25+ 2mm Compliant Layer castinplace Port liner after Complete Cooling.

CO <u « a 'u
JS CO
200-
100-
S -100-1-in en <U
-200--
-300--
-400--
-5004
Ii
II Jl
BS-25
/ -0L
7 Ij Compliant /' Layer / (3mm)
Gray Iron /
FEA Based Stresses (Complete Cooling)
Radial, Srr (MPa) — - Axial, Szz (MPa) - - Hoop, Stt (MPa)
0.026 0.028 0.03 0.032 0.034 0.036 Radial Distance, r(m)
0.038 0.04
Figure 6. Finite Element based Shrinkage Stresses in the BS-25+ 3mm Compliant Layer cast-in-place Port liner after Complete Cooling.

450-
300-
150--
PH
8 -150^ <U
u 55 -300--0) Ml a .5 -450-CO
/I CS-50 / ' /
(LOW MOD)^ j
■;
CS-50 /
-600-- -
-750--
-900-
Gray Iron
M ^
FEA Based Stresses (Complete Cooling)
• Radial, SIT (MPa)
■ Axial, Szz (MPa)
■ Hoop, Stt (MPa)
-t- -+-0.025 0.027 0.029 0.031 0.033
Radial Distance, r(m) 0.035 0.037
Figure 7. Finite Element based shrinkage stresses in CS-50+Gray Iron cast-in-place Port liner after Complete Cooling.

en
cu I i
CO <U WO «
c CO
300
200
100
Compliant Layer (2mm)
// ^ ^
Gray Iron
/ ^ .
■100"
200"
300
400
500
6001
/
/
/ CS50 7 / FEA Based Stresses
(Complete Cooling)
Radial, Srr (MPa) Axial, Szz (MPa) Hoop, Stt (MPa)
+ + t
0.025 0.027 0.029 0.031 0.033 0.035
Radial Distance, r(m)
0.037 0.039
Figure 8. Finite Element based shrinkage stresses in CS50+2mm Compliant layer castinplace Port liner after Complete Cooling.
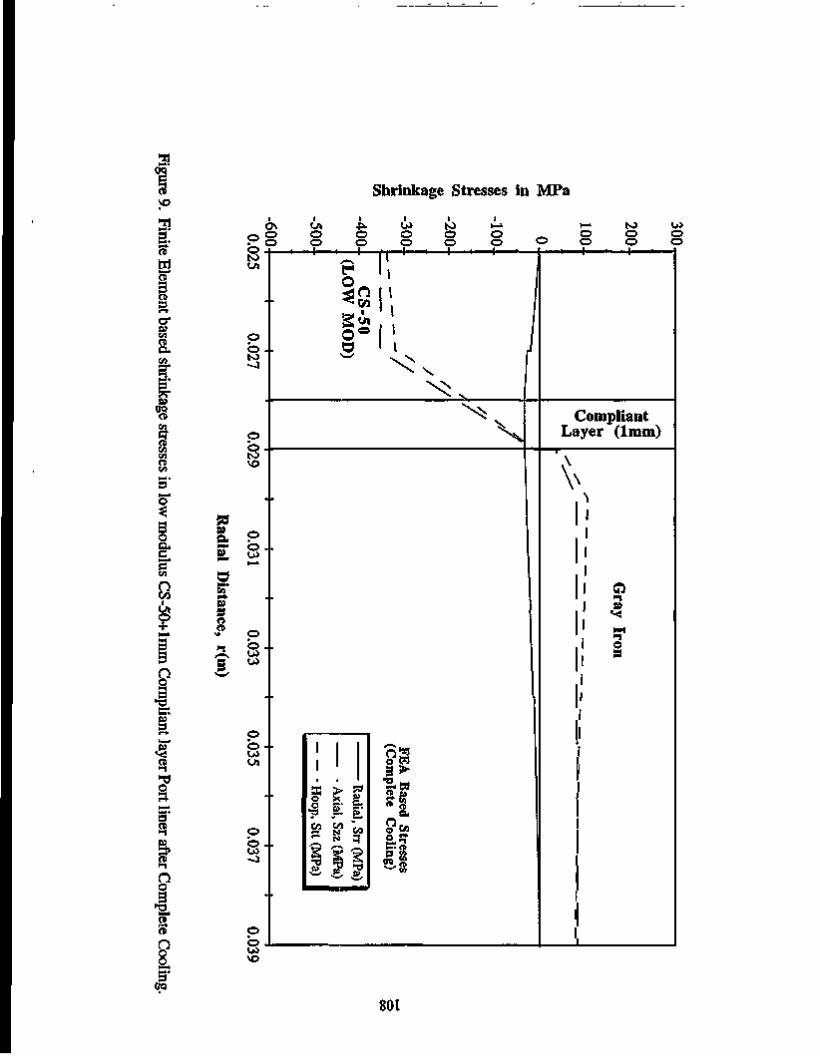
3 Shrinkage Stresses in MPa
w ciT cs j3
cr en CD P.
&3 OP CD CO
en CO CD CO
ON
O to
o © to - J
© b to
S. P
85 s »• c *j © 4-
o o J*, o o o o
to o o o o
o
o
o VO
r o
o o -i—
to o o -4—
o o
3° CO
N \
v \ _x.
^ V.
o o
co
3 J-X
s> co N N
t » CJ
? d .1 » 00
4 £ >• a
s •**
ST '""'
O Cft en n> a » era 5S
Compliant Layer (1mm)
^
O as
i—i -i © 9
801

109
Figure 10. Camera shot of cast-in-place BS-25 ceramic based port liners with and without compliant layer. (Even a 2 mm compliant layer is not sufficient to prevent cracking of regular BS-25 due to shrinkage stresses).

no
Figure 11. Camera shot of cast-in-place CS-50 ceramic based port liners with and without comphant layer. (Penetration of iron slivers across the wall of the CS-50 tube suggests thermal shock cracking right at the instant of molten iron pouring.)

Ill
1.3 THERMAL AND WEAR COATINGS
FABRICATION AND TESTING OF CORROSION-RESISTANT COATINGS
W.Y. Lee, DP. Stinton, K.M. Cooley, and Y.W. Bae Oak Ridge National Laboratory
Obiective/Scope
Hot corrosion of SiC and Si3N4 components in gas turbine engines is potentially a serious problem. The outer surfaces of SiC and Si3N4 parts oxidize at high temperatures to form Si02 which inhibits further oxidation. However, sodium which is present in high-temperature combustion atmospheres reacts with the Si02 layer, such that it is no longer protective. The objective of this program is to develop a coating that will protect the underlying SiC or SJ3N4 from sodium corrosion and provide simultaneous oxidation protection. To evaluate the behavior of potential materials such as stabilized Zr02 or Hf02, Ti02, AI203»Ti02, 3AI203»2Si02 (mullite), and Ta205 in sodium-containing atmospheres, the corrosion resistance of hot-pressed samples of these materials have been evaluated. A chemical vapor deposition (CVD) process will be developed for the application of the most promising coatings. The effects of the combustion environment upon coating characteristics such as microstructure, strength, adherence, and other properties will also be evaluated.
Technical Progress
In this reporting period, the feasibility of using crystalline mullite prepared by chemical vapor deposition (CVD) as a corrosion-resistant coating has been addressed. Mullite is considered because it is one of a very few materials which exhibit relatively similar expansion characteristics relative to SJ3N4 while also showing resistance to Na2S04-induced corrosion. Note that mullite's coefficient of thermal expansion (CTE) is higher than that of SJ3N4 (-5.7 x10"6 versus -3.0x10'6 K"1). Since CVD is an atomistic growth process, it can be used to produce high quality coating microstructures that are relatively free of structural defects such as porosity and splat boundaries typically found in plasma sprayed materials. For achieving long-term stability, a dense microstructure is usually preferred so as to inhibit salt penetration through the coating. Previously, Lee et al. [1,2] showed that mullite (3AI203»2Si02) coatings prepared by air plasma spray were relatively effective in protecting SiC/SiC composite substrates from hot corrosion. The mullite coatings, if crystalline as-deposited, were found to exhibit excellent adherence during cyclic oxidation. It was also observed that a small amount of Na penetrated through the plasma sprayed coatings during 40-h burner-rig tests [1].
In this study, hot isostatically pressed Si3N4 (GN10, AlliedSignal, Torrance, CA) was used as the substrate material. This material mainly consists of elongated 0.3 to 5 pirn p-Si3N4 grains along with grain boundary phases and impurities such as a-Si3N4, Y5(Si04)3N, Y4Si207N2, Ca, and Sr [3]. The Si3N4 specimens (2.0 cm x 0.4 cm x 0.3 cm) were uniformly coated at Boston University with CVD mullite using a hot-wall reactor at a deposition temperature of 950°C. The coating method, which utilizes AICI3, SiCU, C02, and H2 as precursors, is described in detail elsewhere [4]. The specimens were typically loaded with about 5 mg/cm2 of Na2S04 using a procedure described

112
elsewhere [5]. The Na2S04-loaded specimens were placed on an Al203 holder and exposed to a flowing oxygen environment in a quartz tube heated to 1000°C by a resistance furnace. The flow rate of oxygen was 200 cm3/min at STP, and was controlled using a mass flow meter. The use of an oxygen environment results in the formation of a basic molten salt (i.e., high Na20 activity), thus facilitating the reaction of Na20 with Si02 [6,7]. The temperature was measured and constantly monitored using an optical pyrometer and a thermocouple.
The corroded specimens were mounted in epoxy and polished using kerosene as a lubricant to examine corrosion products and resulting surface microstructures. A Hitachi S-800 field emission scanning electron microscope (SEM), a Scintag V X-ray diffractometer (XRD), a JEOL Superprobe 733 electron microprobe analyzer (EMPA), and a Hitachi HF-2000 transmission electron microscope (TEM) equipped with an energy dispersive spectrometer (EDS) were used for morphology characterization and phase identification. Cross-section TEM specimens were prepared by gluing coating surfaces together and cutting slices with a thickness of -300 urn perpendicular to the interface using a slow speed saw. Each slice was mechanically thinned to -75 urn, dimpled across the center of the interface to -20 urn, and ion milled to perforation at liquid nitrogen temperature.
Two SJ3N4 specimens coated with CVD mullite were prepared. The coating, which was about 10 urn thick, was uniform in visual appearance and color. The as-deposited surface was highly faceted and well-coalesced as shown in Figure 1. The size of surface facets was in the range of about 1 to 10 urn. The coating did not contain voids or porosity detectable to optical microscopy. The XRD pattern in Figure 2 suggested that the coating was crystalline mullite and somewhat textured. TEM and electron diffraction analyses on selected areas of one of the as-deposited specimens indicated that the coating mainly consisted of columnar mullite grains. These columns were mostly oriented perpendicular to the substrate. Interestingly, the presence of a microcrystalline layer was also observed between the columnar mullite and the SJ3N4 substrate surface. This intermediate region contained Si, Al, and O, and was several microns thick. Although its electron diffraction pattern could not be indexed for exact phase determination, an EDS analysis suggested that the Si content in this region was substantially higher than that measured for the columnar mullite. Any strong reaction between the coating and Si3N4 substrate during processing might be precluded as a possible reason for the formation of the microcrystalline layer, since the initial microstructure and composition of the underlying SJ3N4 substrate surface were found to be intact by TEM even after the coating was applied. More work is needed to discern whether the formation of the intermediate region is due to substrate or processing related effects.
The coated specimens were exposed to the Na2S04+02 atmosphere for 100 h at 1000°C. The weight of the coated samples did not change substantially after corrosion and washing (+0.2 mg/cm2 and +0.1 mg/cm2, respectively, in reference to the weight of the coated specimens before corrosion). The XRD patterns shown in Figure 2 indicate that the crystal structure of the coating surface remained unchanged after corrosion. Also, the surface of the corroded samples was not visually affected by corrosion. However, at a microscopic level, it was observed that the sharp edges of the faceted surface features observed for the as-deposited coating were somewhat eroded by the

113
corrosion treatment. In addition, there was evidence that minor reactions occurred on some isolated areas of the coating surface. These localized regions which looked "glassy" by optical microscopy represented less than several percent of the total surface area of the coated specimens. The presence of microcracks was observed within or originating from the "glassy" areas. Further characterization with TEM and electron diffraction revealed that these "glassy" surface regions could be as thick as about 0.5 jim, and contained small amounts of Na and Al, as shown in Figure 3. These results suggested that the "glassy" regions were basically amorphous silica with Na and Al impurities.
Figure 4 shows a back-scattered electron image along with X-ray elemental maps of the cross-section of the coated specimens after corrosion. It was evident from this qualitative analysis that the coating was relatively stable at both Na2S04/mullite and Si3N4/mullite interfaces except for the presence of a small amount of Na observed at the Na2S04 interface. For comparison, an uncoated SJ3N4 sample reacted significantly with Na2S04 when it was exposed to the same corrosion conditions. The presence of Na is typically observed to a depth of -20 urn below the initial substrate surface. Yttrium migrates to the substrate surface through grain boundaries, resulting in the formation of an yttrium depleted zone of -10 um. This type of surface interaction of SJ3N4 materials with corrosive environments has been previously described by other investigators [6,8]. Figure 4 clearly shows that there was no apparent migration of yttrium to the substrate-coating interface. In a more detailed EDS analysis, Na was not found within the mullite grains, but a trace amount of Na was detected on grain boundaries to a depth of about 1 urn below the coating surface. This observation indicated that the diffusion of Na preferentially took place along the grain boundaries during the 100-h test duration. It was also found from the TEM study that the remainder of the coating as well as the underlying Si3N4 substrate were not affected either microstructurally or compositionally by the corrosion exposure.
In summary, the coating was effective in preserving and therefore protecting the surface microstructure of the underlying SJ3N4 substrates, although some minor changes were observed as a function of coating depth. Therefore, it seems that the use of the CVD mullite coating for protecting SJ3N4 materials is feasible. For at least the 100 h duration tested in this study, the interaction between the coating and Na2S04 was not substantial except for some localized reaction observed on the coating surface. More encouragingly, the coating was able to preserve the surface microstructure and composition of the SbN4 substrate. However, a small degree of Na penetration through mullite grain boundaries was observed to a depth of about 1 urn, but its significance to long-term coating durability is not certain at this point. The determination of the corrosion kinetics will require data at several exposure times. In this way, the effectiveness of the coating over extended time periods can be properly assessed. From a processing point of view, controlling the composition and uniformity of the CVD mullite coating should be assessed. Burner-rig tests which are accompanied by post-corrosion strength measurements [9] are also needed.
Status of Milestones
On schedule.
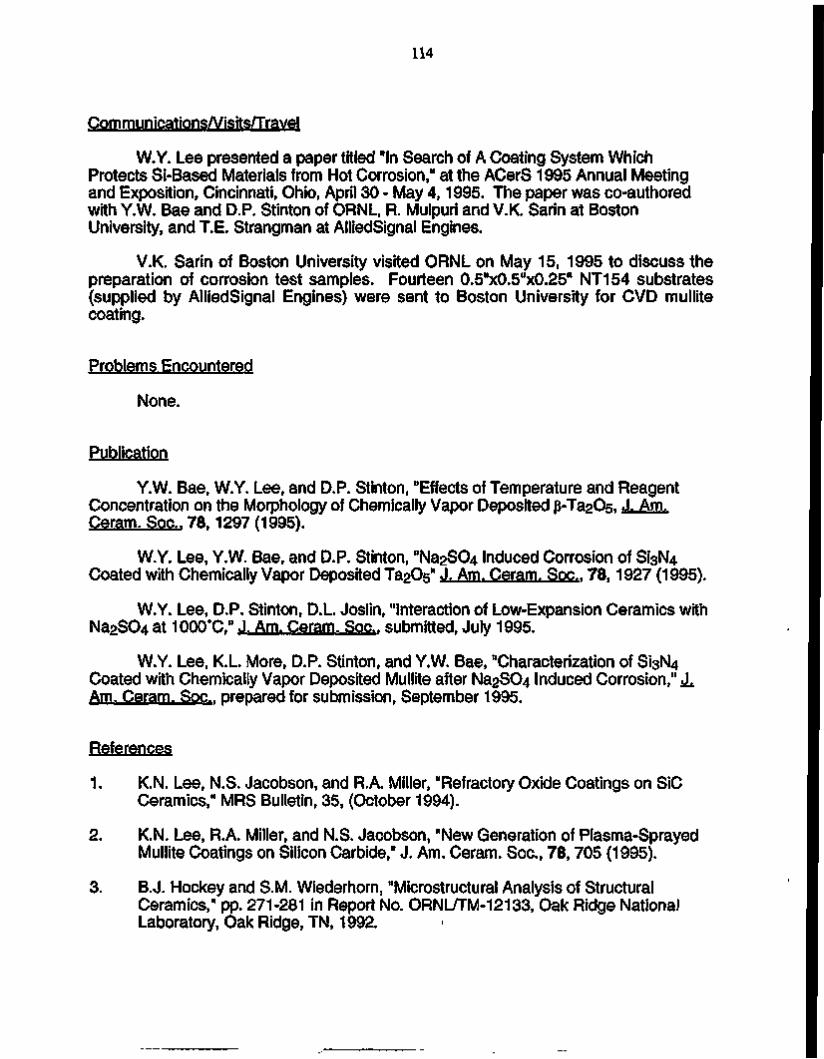
114
CommunicationsA/isits/Travel
W.Y. Lee presented a paper titled "In Search of A Coating System Which Protects Si-Based Materials from Hot Corrosion," at the ACerS 1995 Annual Meeting and Exposition, Cincinnati, Ohio, April 30 - May 4,1995. The paper was co-authored with Y.W. Bae and D.P. Stinton of ORNL, R. Mulpuri and V.K. Sarin at Boston University, and T.E. Strangman at AlliedSignal Engines.
V.K. Sarin of Boston University visited ORNL on May 15, 1995 to discuss the preparation of corrosion test samples. Fourteen 0.5"x0.5"x0.25" NT154 substrates (supplied by AlliedSignal Engines) were sent to Boston University for CVD mullite coating.
Problems Encountered
None.
Publication
Y.W. Bae, W.Y. Lee, and D.P. Stinton, "Effects of Temperature and Reagent Concentration on the Morphology of Chemically Vapor Deposited p-Ta2Os, J. Am. Ceram. Soc. 78, 1297 (1995).
W.Y. Lee, Y.W. Bae, and D.P. Stinton, "Na2S04 Induced Corrosion of Si3N4 Coated with Chemically Vapor Deposited Ta205n J. Am. Ceram. Soc. 78,1927 (1995).
W.Y. Lee, D.P. Stinton, D.L. Joslin, "Interaction of Low-Expansion Ceramics with Na2S04 at 1000°C," J. Am. Ceram. Soc. submitted, July 1995.
W.Y. Lee, K.L. More, D.P. Stinton, and Y.W. Bae, "Characterization of Si3N4 Coated with Chemically Vapor Deposited Mullite after Na2S04 Induced Corrosion," *L Am. Ceram. Soc. prepared for submission, September 1995.
References
1. K.N. Lee, N.S. Jacobson, and R.A. Miller, "Refractory Oxide Coatings on SiC Ceramics," MRS Bulletin, 35, (October 1994).
2. K.N. Lee, R.A. Miller, and N.S. Jacobson, "New Generation of Plasma-Sprayed Mullite Coatings on Silicon Carbide," J. Am. Ceram. Soc, 78, 705 (1995).
3. B.J. Hockey and S.M. Wiederhom, "Microstructural Analysis of Structural Ceramics," pp. 271-281 in Report No. ORNUTM-12133, Oak Ridge National Laboratory, Oak Ridge, TN, 1992.

115
R. Mulpuri and V. Sarin, "Thermodynamic Analysis of CVD Mullite Coatings," Ceram. Eng. Sci. Proc, 16,401 (July-August 1995).
W.Y. Lee, Y.W. Bae, and D.P. Stinton, "Na2S04 Induced Corrosion of SJ3N4 Coated with Chemically Vapor Deposited Ta205," J. Am. Ceram. Soc, 78,1927 (1995).
N.S. Jacobson and D.S. Fox, "Molten-Salt Corrosion of Silicon Nitride: II, Sodium Sulfate," J. Am. Ceram. Soc, 71,139 (1988).
N.S. Jacobson, "Corrosion of Silicon-Based Ceramics in Combustion Environments," J. Am. Ceram. Soc, 76, 3 (1993).
D.R. Clarke, "Thermodynamic Mechanism for Cation Diffusion through an Intergranular Phase: Application to Environmental Reactions with Nitrogen Ceramics," pp.421-426 in Progress in Nitrogen Ceramics, edited by F.L. Riley, Martinus Nijhoff Publishers, The Hague, The Netherlands, 1983.
T.E. Strangman and D.S. Fox, "Resistance of Silicon Nitride Turbine Components to Erosion and Hot Corrosion/Oxidation Attack," p. 36-1 in Proceedings of Advisory Group for Aerospace and Research & Development Svmposium on Erosion. Corrosion, and Foreign Obiect Damage Effects in Gas Turbines. Printed by Canada Communication Group, Quebec, Canada, November 1994.
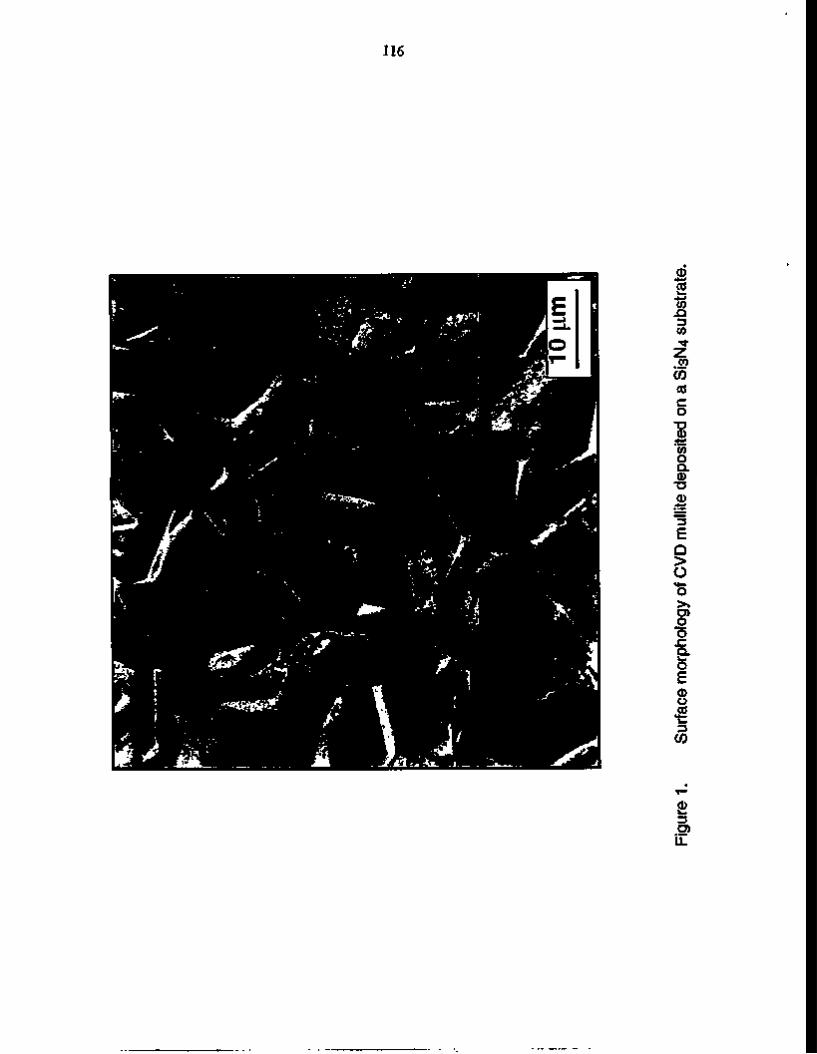
116
"*??>•.
46^"*is ,,/?>*
0
I w .o 3 (/>
2 CO
CO (0 c o
T3 0)
'55 O D. <D
TJ 0)
" 5 E Q > O o >% D) O O x: Q. O E © o CO
t CO
2 3
L L

117
CO
c
o - M X) o
> -
CO
z
Ld >
Ld or
s: S i ,N . substrate 3 4
m: mul l i te
(b)
(°)
\Z\~J U m I s
t
IAJ UJ
V m
10 15 20 25 30 35
2 THETA (degree)
JL^^ m l
J L ^ ^
40 45
Figure 2. XRD patterns of CVD mullite coated on a Si3N4 substrate: (a) as-deposited and (b) after hot corrosion.
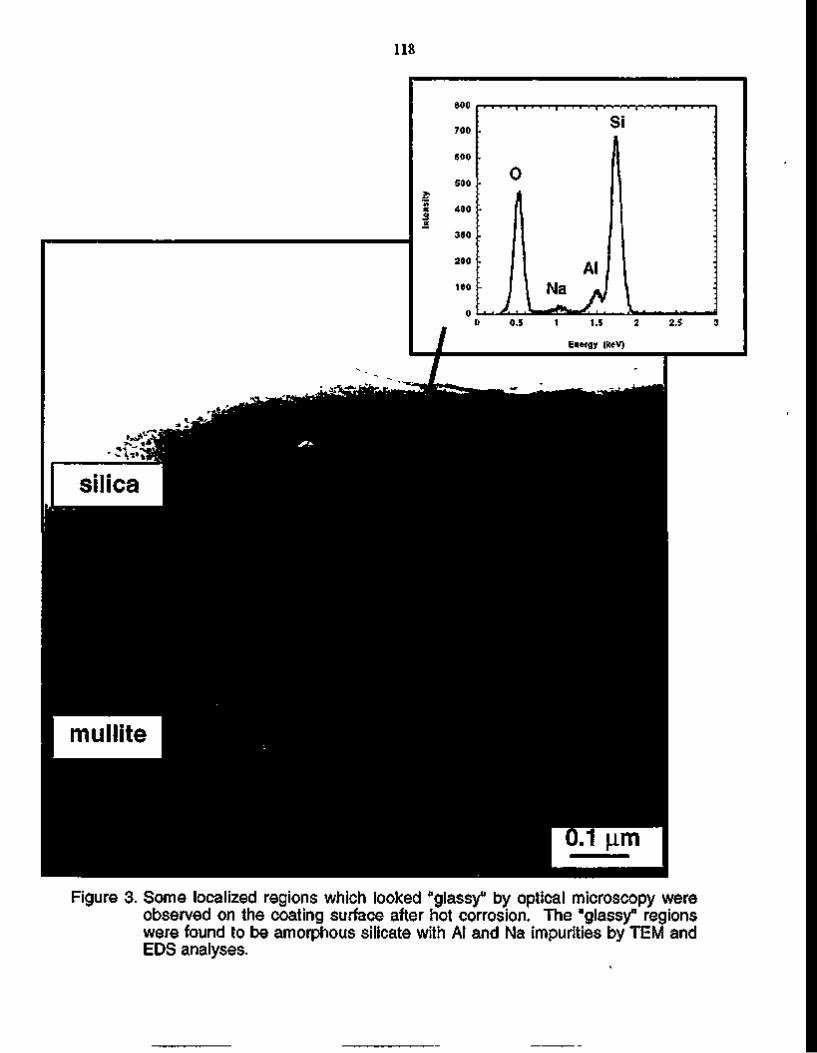
118
Figure 3. Some localized regions which looked "glassy" by optical microscopy were observed on the coating surface after hot corrosion. The "glassy" regions were found to be amorphous silicate with Al and Na impurities by TEM and EDS analyses.

vo
Figure 4. Backscattered electron image and x-ray elemental maps of the cross-
section of a mullite coated SJ3N4 substrate after hot corrosion.
120
Development of Adherent Coatings to Reduce (Contact Stress Damage of Ceramics V.K.Sarin
Boston University, Department of Manufacturing Engineering 44 Cummington Street, Boston, MA 02215
Objective/Scope
The development of oxidation/corrosion resistant, high toughness, adherent coating configurations for silicon based ceramic substrates for use in advanced gas turbine engines.
Technical Progress
Additional thermodynamic analysis was performed on the AICI3-SICI4-CO2-H2 system for the chemical vapor deposition of mullite. The effect of changes in hydrogen concentration and the effects of using alternative halides was studied. A comprehensive thermodynamic analysis on the CVD formation of mullite was reported in an earlier bimonthly report.
Effect of Changing Hydrogen Concentration
Hydrogen concentration was increased from 500 moles (figure 1) to 1000 moles at the 1000 °C and 75 torr condition. The resultant phase diagram is as shown in Figure 2. No major changes were observed in the region near the high CO2 concentration. However, the region where SiC+Si02+Si composite phase forms is larger, and so is the SiC+Si02 region. The region over which Si02+C forms is smaller, and the mullite+Si02+C region is slightly larger. When the hydrogen concentration was reduced to 250 moles, the opposite effects were observed. Figure 3 shows the CVD ternary phase diagram in this condition.

121
Mullite+Al203 region still remains more or less the same but the mullite+Si02 and the mullite+Si02+C region are now smaller. The Si02 and Si02+C regions are larger than they were in the H2:500 moles condition. Also the SiC containing phases are now smaller as expected.
Effect of Using Alternative Halides
AlBr? and SiBr̂ .
In this calculation, AICI3 and SiCU were replaced with ALBr3 and SiBr4 at the 1000 °C and 75 torr condition. The results of the analysis are presented in the CVD phase diagram in figure 4. The resulting phases are approximately the same as when AICI3 and SICI4 were used (figure 1) near the high CO2 concentrations. The mullite+Al203 region is now smaller than before. The SiC+Si02+C region is approximately the same size as when AICI3 and SiCLt were used. SiC+Si02 region is now much larger, and Si02+C region starts to appear at lower CO2 concentrations than before, however, the overall region is smaller than before.
AUfo and S1F4
When AICI3 and SiCLj were replaced with AIF3 and S1F4, a completely different phase diagram emerges. The phase diagram is as shown in figure 5. A halide phase AIF3 is observed at low CO2 concentrations and high AIF3 concentrations. This indicates that at low oxygen concentrations, A1F3 does not react with the available hydrogen in order to form HF and Al as a deposit. A large region of pure AI2O3 is also observed in the diagram. Mullite is mostly observed along the SiCl4-C02 line, and is again seen as a line compound, but formed over a much narrower range of reactant concentrations. There was also a region near the high CO2 concentration where no solid phases were formed.
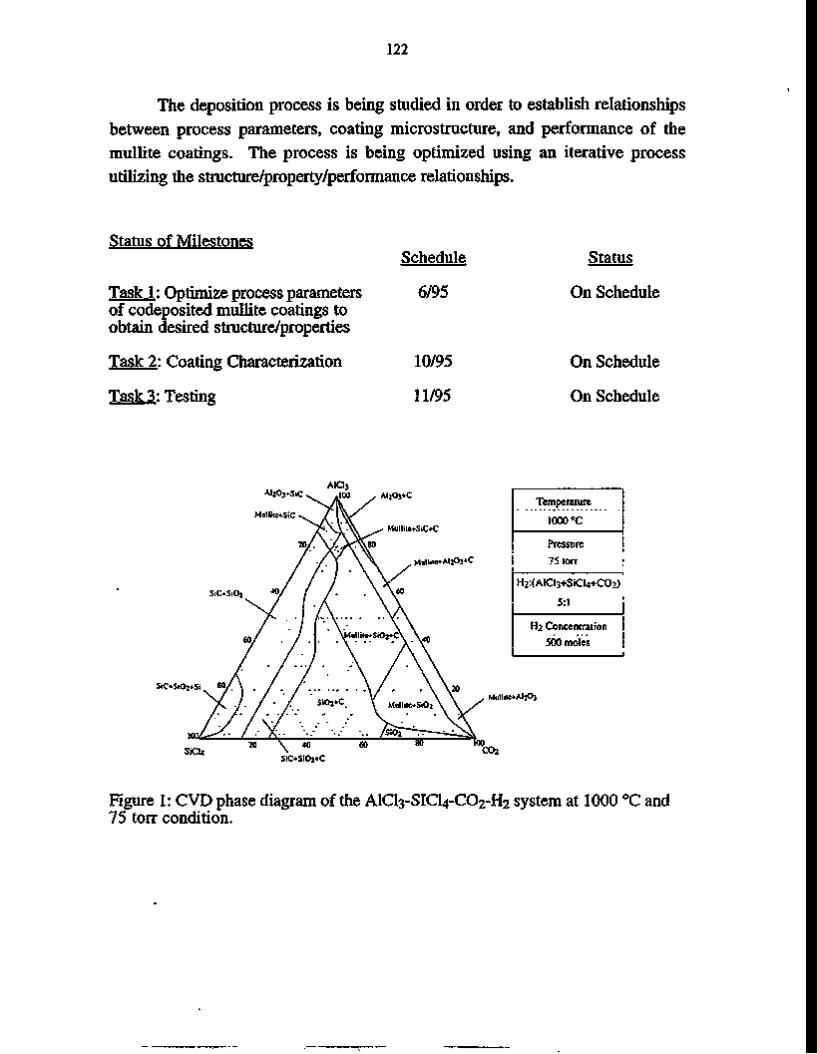
122
The deposition process is being studied in order to establish relationships between process parameters, coating microstructure, and performance of the mullite coatings. The process is being optimized using an iterative process utilizing the structure/property/performance relationships.
Status of Milestones
Task 1: Optimize process parameters of codeposited mullite coatings to obtain desired structure/properties
Task 2: Coating Characterization
Task 3: Testing
Schedule
6/95
10/95
11/95
Status
On Schedule
On Schedule
On Schedule
AIQ 3 AI203*SlC ^ .100 ,
MulliB+SiC v . / 1 VC
20/ V/ycj\8o
S1OS102 io/ i f - ■
60/ . / . \MulHle+S
•*si02*si m / \ / . / , ■ ■ A
p^. . / . / ■ / S1O2+C Y
inn / S- - / ■' X •
sicu N
SiOSi02
60
♦C
AI2O3+C
^ Mullite+SiC+C
Mulliw*
\ 6 0
°2+x\40
MullitcSiOj \
/ S i O i ^ 80
Al203<
, Mullite
100 COz
Temperature
1000°C
Pressure
75 torr
H2:(AICl3+SiCl4+C02)
5: .
H2 Concentration
500 moles
.A1203
Figure 1: CVD phase diagram of the AICI3SICI4CO2H2 system at 1000 °C and 75 torr condition.

123
SiC+Si(>2+SiN
SiC!4
AfeOj+SiC
Mullite+SiC
Mulln=<SiC+SlOr j o /
SiC+SK>2 y /
6 0 /
8 0 / / /
>/ A/
AIC13 .100 AI2QJ+C
* \ A ^ ^Mulli«nAfeO)+SiC
/ V \ u o
( . \ V 0 .MuIliunAfcQjtC
Mullit«Si02+C Y Y
/ \ \ \ ■ \ Mullite*
• SiOJtC \ J Ma'liitwSiQz \ V^
20 V l O 60
SiC+Si024C
80 100
co2
Temperature
1000°C
Pressure 75 torr
H2:(AlCl3fSiCl4(<:Oi
5:1
H2 Concentration 1000 moles
UzOi
Figure 2: CVD phase diagram of the AICI3SICI4CO2H2 system at 1000 °C and 75 torr condition with 1000 moles of hydrogen.
S.C+
SiC+Si02+Si 8 ° /
S1CI4
MulliteiAlft+SiC+C 1 0 0 AI1O3+C
MulliteiSiC+SiCb / I V S / '
;?£ \ \ ^ MulluctSi02«C
20/ \ / O r \ 8 o / • X ; \ ' \ Mullne*M20]4C
5,02 / / / / A \ / \ / \' / \ \ Mullite*Si02
60/ . / / • • Y • s(x0
H 20 \
.S1O2+C I • \ • ■ \ Y °
/ S'°2 ^ ^ ^ ^ \ \ 40 60 8 0
5.C+S.02+C
Mullnc*1
100
co2
Temperature
1000 °C
Pressure 75 torr
Hj^AlCb+SiCLjfCCy
5:1
H2 Concentration
250 moles
U&i
Figure 3: CVD phase diagram of the AICI3SICI4CO2H2 system at 1000 °C and 75 torr condition with 250 moles of hydrogen.

124
SiC*Si02+Si v
S1CI4
AICI3 A(203+SiC^ 100 .AI2O3+C
Mullite4SiC+Si02 ^ / 1 \ o ^ ;>£\V \k ^Mullilc+SiC+C
20/ X/wCxv80
/ ' . \ ' / \ \ . MulliUMAIjOj+C
4 0 / ■ ,' / " . ' \ \ \ 60
/ SiCiSid^ \ A / / \ \
7 )■.: '</'//> \ ■ / : . > \ \ M
/C "•/■' ■ '/•■'/■' ' x / MiiililMSiQi \ \ i . /■ ■"■/ •"•/ .'"'Si02tC ^>^/"" '"■ ^ T
20 \ 40
SiC+Si02+C
60 80
MulliteHAfcOj
100 C 0 2
Temperature
1000 °C
Pressure 75 torr
H2:(AICl34SiCl4fC02)
5:1
H2 Concentration
500 moles
Halides
AlBr3and SiBr4
Figure 4: CVD phase diagram of the AlBr3SrBr4C02H2 system at 1000 °C and 75 torr condition.
AIF3+Afc)3+C.
AIF3+Afe03+SiC+C\ *°/
AIJ034C. / ^
AfcPj+SiC. ^ / ' • . /
Mullite4AtP3+C / V / '
MulIitMAfeOj+SiC+C/*/ / V / / .
A)203+SiC+SL / S c \ / " \ /
Mu!Iile+SL / X / \ / V " / *
SiCU V ° \ \ \
/ £ ■ . / AIF3+A&03 \
\ V ]••■' 'W^
' ■ ' • ' .
• /~wL
Mull[t«SI02
\ 4 0
\
\ w
'~r.- \ AfeQ)
'.
\ MulliteiAbiPs
60
\ 4 0
\ 8 0 \
\ M
S 100
co2 No Solid Phases
Temperature
1000°C
Pressure 75 torr
H^AlCljfSiCl^Oi) 5:1
H2 Concentration
500 moles
Halides
AlF3and SiF4
SiC+Si02+C SiC+Si02 S1O2
Figure 5: CVD phase diagram of the AIF3SIF4CO2H2 system at 1000 °C and 75 torr condition.

125
Problems Encountered
GN-10 grade S13N4 billets were bought directly from Allied Signal. These billets were cut, ground and polished to 3x4 mm cross-sections as per Oak Ridge specifications for mullite deposition at BU and testing at ORNL. However, due to limitations in funding, this task could not be completed, and the costs involved had to be borne by us.
Credits
Research sponsored by the U.S. Department of Energy, Assistant Secretary for Energy Efficiency and Renewable Energy, Office of Transportation Technologies, as part of the Ceramic Technology Project of the Propulsion System Materials Program, under contract DE-AC05-84OR21400 with Martin Marietta Energy Systems, Inc.

126 1.4 JOINING
1.4.1 Ceramic-Metal Joints
WBS Element 1.4.1 JOINING OF CERAMICS FOR HEAT ENGINE APPLICATIONS
M. L. Santella
Objective/Scope
The objective of this task is to develop strong reliable joints containing ceramic components for applications in advanced heat engines. The overall emphasis of this task is on studying the brazing characteristics of advanced ceramics such as silicon nitride, silicon carbide and partially stabilized zirconia. The techniques of direct brazing with metallic and nonmetallic filler materials are being used. Vapor coatings are being used where appropriate to circumvent wetting problems associated with braze filler metals. The planned activities during FY 1995 will emphasize the use of structural analysis software to design joints for engine components such as valves and shaft attachments. The objective of this effort with be to identify material combinations and processing that would be feasible for these components, and to produce prototype parts whenever possible.
Technical Highlights
Ceramic-to-metal brazing: During this reporting period further analyses were completed on the brazed Ti alloy stem/Zr02 head engine valve, a brazed Ta stem/Si3N4 head valve, and designs for a ceramic-to-metal shaft attachment were evaluated. Three configurations of the Ti alloy stem/Zr02 head engine valve were analyzed: (1) a cylindrical Zr02 disk was used rather than a part shaped like a valve head; (2) the brazing temperature was increased to 975°C; and, (3) the situation where the joint area was completely filled with braze filler metal was considered. These additional cases were done to reflect the processing actually used to make the first Ti/Zr02 valve. The alteration in the shape of the Zr02 part did not result in any significant change in the residual stress distribution in the brazed joint. Increasing the brazing temperature to 975°C with the Zr02 disk did not alter the deformations compared with the original configuration, but it did result in lower predicted values of maximum principal stress (residual stress). Presumably, this was caused by the higher brazing temperature permitting plasticity in both the filler metal and the Ti alloy to accommodate more residual strain. This would have the effect of reducing residual stresses in the brazed valve. Lastly, altering the filler metal layer from selectively to completely filling the joint area resulted in a larger volume of the Zr02 being stressed, but the magnitude of the predicted stresses was very low. Based on this analysis, variation in joint filling would not be expected to result in unacceptably high residual stresses.
Materials needed to produce two additional Ti/Zr02 valves was committed for machining. The objective in making these valves is to begin optimizing the joint design and processing. Also, materials were prepared to make Ti/Zr02 coupons for testing of joint strength.
Also, an analysis was done on a valve configured with a S13N4 head and a Ta shaft. Tantalum was selected for the shaft because of its relatively low coefficient of thermal expansion of 6.32 x 10"6/°C at room temperature, and its relatively low yield strength and good ductility. These results indicated that for a brazing temperature of 870°C the entire S13N4 part experienced positive residual stresses (maximum principal stresses) upon cooling to room temperature. A relatively large volume of the Si3N4 valve head was predicted to be under residual stresses in the range of 130 MPa, with smaller volumes experiencing stresses near 430 MPa. The extent and magnitude of residual stresses in this configuration are such that it would be impractical to produce prototypes. A least one additional analysis will be run for a valve configured with a Si3N4 head and a Mo stem when the property data file for Mo is available.

127
A design for a SisN /̂metal shaft coupling was finalized and a finite element model was constructed for analysis. This finite element model required a full three-dimensional analysis because the shaft is configured such that the economies of an axisymmetric analysis cannot be used. For the initial analysis trials, the main metal shaft was a heat-resistant alloy, Incoloy 909. Initial trials indicated that there were no significant problems with the construction of the model, but completing the analyses required exceptionally long run times. Techniques for simplifying the model or our approach to the analysis are now being considered. Also, it is anticipated that a coupling between Si3N4 and the primary metal shaft alloy will ultimately require the use of a transition material to accommodate residual stresses. Consequently, property data files are being assembled for several refractory metals, including Mo, Nb, and Ta. These alloy were selected because of their desirable combinations of thermal expansion behavior and mechanical properties.
A experiment was completed to examine the effects of chemical reactions that occur during brazing on the properties of Si3N4. The experiment was design to support work done previously at GTE Laboratories. It consisted of first vapor coating the tensile surface of 20 PY6 Si3N4 flexure bars (3 x 4 x 50 mm) with a 3-um-layer of Ti, followed by vacuum brazing the bars to nickel coupons with a Au-5Pd-2Ni wt% filler metal. The bars where then detached from the Ni coupons by dissolving the filler metal in aqua regia. These 'brazed' bars were then four-point bend tested at room temperature along with a set of 20 control test bars. The data sets were analyzed with the CARES program and are plotted in Fig. 1. Compared to the control group, the brazed test bars had much lower average strength and Weibull modulus. The data suggest that chemical reactions that occur during brazing can dramatically reduce the strength of sintered Si3N4 independently of other factors such as residual stresses. Analysis of the data and specimens is continuing.
Status of Milestones
On schedule
Publications
None
Unpublished work
An invention disclosure entitled, "Engine poppet valve with a ceramic head bonded to a metal stem," was filed with the Department of Energy.

128
Four point bend test of PY6 bars 100
- I 1—I—I I I 1 1 1 1 I I 1 I I 11 I I—I—I I I 1 ■!
3
U.
CO Si o
m = 5.8 CT0 = 440 MPa
Room temperature tests o - Control □ - Brazed surfaces
10
m = 12.9 a 0 = 1012 MPa
_i ■ ' i i i I I I M I
10 100
Strength, MPa
1000
Fig. 1. Weibull plot of results from four-point bend testing of PY6 Si3N4 test bars.

129
1.5 CERAMIC MACHINING
W.B.S. Element 1.5.0.0
COST-EFFECTIVE CERAMIC MACHINING
P. J. Blau Oak Ridge National Laboratory
Objective/Scope
The objective of this effort is to develop, in conjunction with U. S. industry, advanced technologies and the associated scientific and economic concepts necessary to reduce the costs associated with the machining of structural ceramics; especially, as related to the use of these materials in energy-efficient, low-emissions transportation systems. This effort consists of subcontracts to industry and in-house research at Oak Ridge National Laboratory, Argonne National Laboratory, and the National Institute of Standards and Technology. Progress reports for other than the ORNL in-house research portion of this work may be found elsewhere in this publication. The four subtasks in this effort are:
1. Technology Assessment and Future Needs 2. Advanced Machining Methods Development 3. Ceramic Machinability and Related Performance 4. Structure and Surface Quality of Machined Ceramics
ORNL in-house activities are aimed at two technical areas: (1) investigating the effects of machining practices on the durability of ceramics for valve and valve seat applications and (2) understanding and characterizing the detailed nature of machining-induced surface and sub-surface damage and their evolution in advanced ceramic materials using a range of analytical tools. The latter includes such methods as non-contact surface profiling, atomic force microscopy of ground surfaces, and scanning acoustic microscopy to detect subsurface flaws.
Technical Highlights
a. Annotated Bibliography of Grinding Wheel Characterization is Completed. An annotated bibliography of nearly 100 publications dealing with the characterization of the structure, properties, and performance of grinding wheels has been prepared by Robert W. McClung, Consultant to ORNL. The new report contains nine subsections on such topics as the non-destructive examination of wheels, wheel wear measuring methods, wheel property measuring methods, wheel surface texture, and in-process monitoring of wheel behavior. The report will be published by ORNL.
b. Study of Electrolytic In-Process Wheel Dressing Completed. Dr. B. P. Bandyopadhyay, University of N. Dakota, rejoined the laboratory of Prof. Ohmuri of the Institute of Physical and Chemical Research (RIKEN), Tokyo, Japan, to study the effects of grinding with and without ELID, the effects of ELID on the form and surface finish the part, and the effects of ELID on grinding ratio (i.e., ratio of the stock material removed to the amount of abrasive consumed). A draft report was delivered to ORNL and is currently under review for publication as an ORNL subcontract Report.
c. Development of a Next-Generation Grinding Wheel for Ceramics: Initiation of Phase II. As discussed in the previous semi-annual'report, three groups of St. Gobain / Norton Company teamed up to develop a new grinding wheel optimized for cylindrical
130
grinding of silicon nitride parts such as poppet valves. The fifteen month effort began in September of 1993 and resulted in the delivery of a final report and six specimen grinding wheels for third-party evaluation. Some of the evaluations are being performed at ORNL on a new Ded-Tru™ grinding fixture which permits a surface grinder to be modified to conduct centerless-type operations. Distribution of the final report is expected within the next month. A follow-on, Phase n effort to scale up (to 14" (356 mm) diameter) and production-test the wheels has been initiated. Part of the effort involves evaluating the new wheel at higher speeds and modifying its construction, if necessary to meet those additional demands. Independent evaluations of the scaled-up wheel are also part of Phase II.
d. Three New Subcontracts Initiated. Three new Cost-Effective Ceramic Machining-related subcontracts have been initiated. They are:
Cost Modeling Analysis of Fabrication Approaches for Silicon Nitride Components (AlliedSignal Ceramic Components and California Polytechnic University - Pomona)
The Effect of Machine Stiffness on the Grinding of Silicon Nitride (University of Connecticut - Storrs)
Next Generation Spindle for High-Speed Centerless Grinding of Advanced Ceramics (Eaton Corporation and Weldon Machine Tool Company)
Details of these new efforts will be incorporated as separate sections in future Ceramic Technology Project periodic reports.
e . Annual Project Review Held. A total of 51 people attended the Annual Cost-Effective Ceramic Machining (CECM) Project Review held on Wednesday, September 20,1995. Figure 1 shows the titles, speakers, and schedule for the presentations. The last three presentations were included for the purpose of information and are not CECM-funded projects. Attendees were asked to critique and comment on the various projects. Overall, comments on the annual project review were positive and complimentary. Survey results related to individual projects will be provided as feedback to the presenters of those projects. Some of the attendees noted that it may have been advisable to allow more time for both presentations and discussions. The possibility of extending future reviews to one and one-half days is being considered as a result.
In addition to the formal presentations, C. Guo of Chand Kare Technical Ceramics displayed two prototype compact grindability testing machines which were developed under subcontract. One of the machines will be delivered to ORNL for use in the Machining and Inspection Research User Center. The other will be retained at CKTC. The machine uses small flexure bar-shaped specimens to obtain a relative grindability number which can be used to quickly screen new ceramics for their grinding behavior, as correlated to production grinding machines.
A report on the annual project review is being prepared for publication in the Ceramic Technology Newsletter.
Future Plans
An agreement has been reached to work jointly in the area of machining damage analysis with Dr. Kristin Breder, ORNL, who is coordinating U.S. efforts in the International Energy Agency (IEA) project on ceramic properties. Various subsurface damage assessment techniques will be applied at ORNL and ANL to GS-44 materials v/hich have been ground under IEA conditions. Coupons of GS-44 are being prepared for study. Additional high-speed tests will
131
also be performed on the materials to assess the effects of rapid material removal rates on surface quality. This project is being coordinated with the help of Dr. David Richerson, Consultant, of Salt Lake City, UT.
Dr. Elmer Zanoria who is completing a post-doctoral appointment at Georgia Institute of Technology will join the CECM in-house effort in November 1995. His work will focus both on slip effects on repetitive impact testing and ground surface structural characterization.
Status of Milestones
On schedule.
Communications/Visitors/Travel
CECM Principal Investigators visited Oak Ridge to present summaries of their projects on September 20,1995, at the Annual CECM Project Review.
Problems encountered
Late delivery of the centerless grinding fixture delayed in-house evaluation of the Norton advanced grinding wheels. This fixture is only now being installed on the instrumented Harig Grinder in the High Temperature Materials Laboratory at ORNL.
Publications/Presentations
1) L. Wei, H. H. K. Xu, and S. Jahanmir (1995) Evaluation of Thermal Wave Imaging for Detection of Machining Damage in Ceramics, NIST Report NISTIR 5645, National Institute of Standards and Technology, Gaithersburg, MD, 49 pp.
2) J. A. Kovach and S. Malkin (1995) High-Speed, Low-Damage Grinding of Advanced Ceramics Phase I, ORNL report ORNL/Sub/92-SL807/l, Oak Ridge National Laboratory, Oak Ridge, TN, 115 pp.
3) J. Kovach, M. Laurich and B. Zhu (1995) "High-Speed, Low-Damage Grinding of Silicon Nitride," Abrasives Magazine, August/September, pp. 15-20.
4) B. P. Bandyopadhyay (1995) Application of Electrolytic In-Process Dressing (ELID) for High Efficiency Grinding of Ceramic Parts, ORNL Subcontract Report, to be published.
5) R. W. McClung (1995) Characterization of Grinding Wheels: An Annotated Bibliography, ORNL Report, to be published.

132
Exhibit 1 (page 1)
C E C M A n n u a l P r o j e c t R e v i e w - F i n a l P r o g r a m (September 20, 1995)
I. Introductions
Background of the CECM Effort P. J. Blau, ORNL
Ceramic Technology Project Update
D. R. Johnson, ORNL
II. Technology Assessment
ELID Grinding of Ceramics - Research in Japan B. P. Bandyopadhyay, University of North Dakota
Review of Ceramic Machining Methods and Markets in Europe E. L. Long, ORNL
III. Advanced Machining Methods Development
Innovative Grinding Wheel Design for Machining Ceramics R. Licht, St. Gobain - Norton Company
Development of High-Speed Grinding Methods for Ceramic Parts - Phase II J. Kovach, Eaton Corporation and S. Malkin, U. of Massachusetts
Development of a High-Speed Center less Grinding Spindle J. Kovach, Eaton Corporation and J. Flinchbaugh, Weldon Machine Tool Company
Findings of the NIST Grinding Optimization Studies & Ceramic Machining Database S. Jahanmir and L. K. Ives, NIST
Chemically-Assisted Ceramic Grinding S. M. Hsu, NIST
Cost Analysis: Near-Net-Shape Processes vs. Ceramic Machining R. Walecki, AlliedSignal Ceramic Components
Effects of Machine Stiffness on Ground Ceramic Part Quality B. Zhang, University of Connecticut
(IV. Ceramic Machinability and Related Performance
Development of a Grindability Test for Ceramics R. Chand and C. Guo, Chand Kare Technical Ceramics
(continued)

133
Exhibit 1 (page 2)
V. Structure and Surface Quality of Machined Ceramics
Laser Light-Scattering and Dye Penetrant Studies S. Ahuja and W. Ellingson, Argonne National Laboratory
In-House Research on Surface Quality and Performance in Machined Ceramics P. J. Blau, ORNL
VI. Update on Cost-Effective Machining of Ceramics-Related Programs
Update on International Energy Agency (IEA) Machining Studies K. Breder, ORNL
Update on Defense Programs Machining CRADAs T.O.Morris, ORNL/Y-12
Update on the HTML User Program in Machining S. McSpadden, ORNL

134
COST-EFFECTIVE METHOD FOR DETERMINING THE GRINDABILITY OF CERAMICS
Changsheng Guo, Ph.D. Ronald H. Chand Natesh Krishnan
Chand Kare Technical Ceramics, Inc. 2 Coppage Drive
Worcester, MA 01603-1252
Objective/Scope
The objective of this program is to develop a cost-effective method to determine the grindability of ceramics leading to cost-effective methods for machining such ceramics. In this first phase of activity, Chand Kare Technical Ceramics is engaged in directing its efforts towards review of literature related to ceramic grinding, development of a variable definition of grindability, design of grindability test experiments, and design of a ceramics grindability test system (CGTS). The grindability study underway also includes establishment of correlation between the grindability number and the conventional grinding practices.
Technical Highlights
The technical progress to date is summarized by activities in the attached Milestone Schedule. The remainder of this section describes activity from April 1 to September 30, 1995.
Development of the Final CGTS
The fabrication of the final prototype of the ceramic grindability test system has been completed. The finished machine was exhibited at the annual ceramic machining workshop on September 20, 1995. The earlier version of the test system was also exhibited at the workshop. Both test systems will be exhibited at the Annual Automobile Contractor's Coordination Meeting from October 23 to 27, 1995 in the Ritz Calton Hotel, Dearborn, Michigan. Figures 1 and 2 are photographs of the final ceramic grindability test system, which has the following features:
• Fully computerized to eliminate operators influence. • Grinding with diamond belt to eliminate influence of wheel dressing. • Standard MOR bars as test specimen for cost-effectiveness. • Computer controlled force and speed adjustment for various ceramics. • In-process automatic gaging of material removal rate with analogue and
digital read out.
After the exhibition, the CGTS will then be delivered to Oak Ridge National Laboratory.

135
Grindability Test
During the last period of time, additional grindability tests were conducted for six more silicon nitride ceramics and one more silicon carbide ceramics. The mechanical properties of those seven ceramics are listed in Table 1 (Materials 13-18) together with other ceramics tested before. For Materials 14 to 18, a batch of MOR bars were manufactured and their flexural strengths were measured by Oak Ridge National Laboratory. Some samples from the same batch used to measure the flexural strength were used to measure their grindability. The measured grindability is listed in the last collum of Table 1. As discussed in the definition of grindability in the previous reports, the physical meaning the grindability is the material removal rate obtained under unit force and unit belt speed.
In Figure 3, grindabilities of various ceramics are plotted. It can be seen that the easiest material tested (Material 12, aluminum oxide) has a grindability more than 26 times of the most difficult material tested (Material 15, silicon nitride - I). If silicon nitride ceramics are compared, the easiest material tested (Material 18, silicon nitride - L) has a grindability about 5 times of the most difficult material tested (Material 15, silicon nitride -I). However, their mechanical properties are not so much different. The grindabilities of
the silicon nitride ceramics tested are plotted in Figure 4.
Grindability and Mechanical Properties A. Correlation between grindability and flexural strength
Extensive grindability tests have been conducted for various ceramics. Some of those tested ceramics have very similar mechanical properties, and others have very different ones (see Table 1). Therefore, it is interesting to know whether a correlation exists between grindability and mechanical properties such as hardness, flexural strength, and fracture toughness. Grindability is plotted versus flexural strength in Figure 5 for all the ceramics tested. These results seem to indicate that grindability generally decreases with flexural strength. However, more tests are needed to further prove this. In Figure 6, only silicon nitride ceramics are compared. From this graph, it is hard to accept the above prenminary conclusion.
B. Correlation between grindability and hardness
Any correlation between grindability and hardness is also of interest to both material manufacturers and ceramic machining factories. Grindabilities are plotted versus hardness (Vickers scale) in Figure 7 for all the ceramics tested. No simple correlation could be found between grindability and hardness. Silicon carbide ceramics tested are much harder than silicon nitride ceramics tested. But silicon carbide ceramics generally have higher grindabilities than silicon nitride ceramics. This may be due to their lower flexural strength and low fracture toughness. The results for silicon nitride are given in Figure 8.

136
C. Correlation between grindability and fracture toughness
Fracture toughness is another important mechanical properties of ceramics. Correlation between grindability and fracture toughness is also investigated. There seems no simple correlation between grindability and fracture toughness as indicated in Figures 9 and 10.
Based on the grindability test conducted for various ceramics, there seems no simple correlation between grindability and mechanical properties such as flexural strength, hardness, and fracture toughness. Grindability is a comprehensive parameter which cannot be replaced by any other mechanical properties commonly evaluated. It should be evaluated together with hardness, flexural strength, fracture toughness and other mechanical properties during the material development stage.
Grindabiilty and Microstructure
In the previous section, correlation between grindability and mechanical properties (hardness, flexural strength and fracture toughness) were studied. No simple correlation was found between grindability and mechanical property for the 18 ceramics tested. More ceramic materials need to be tested in order to further support the preliminary conclusion. In order to find out factors determining the ceramic grindability, microstructure of some of the ceramics tested were studied. The as-ground surfaces were observed under a scanning electron microscope. Those surfaces were also observed after they were etched for one hour in a hydrofluoric solution (49% HF).
In Figure 11, the SEM photographs of the as ground surfaces of Materials 3,4,8 and 10 are given. It can be seen that the material is removed by both ductile flow (plastic deformation) and brittle fracture. However, the percentage of brittle fracture depends on the material. Material 10 (silicon carbide) shows much higher brittle fracture than Material 8 (silicon nitride). It should be noted that big holes (about 15 fim) were observed on the surface of Material 3. They do not look like holes caused by grinding rather inherent with the material itself. This is under further investigation.
Status of Milestones
Completed.
Communications/Visits/Travel
On June 14,1995, Ronald Chand and Changsheng Guo visited Oak Ridge National Laboratory and discussed the project progress and the design of the test machine with Dr. Peter Blau and Mr. Eanest Long.
From August 20-23, 1995, Changsheng Guo attended the International Symposium on Advanced Ceramics for Structural and Triobological Applications in Vancouver, B.C. On August 22, 1995, he presented a paper titled "Characterization of Ceramics from the

137
Machining View Point." This paper was authored by Changsheng Guo and Ronald H. Chand.
From September 12-14, 1995, Changsheng Guo attended the 1st International Machining and Grinding Conference in Dearborn, Michigan. He presented a paper titled "Grindability of Ceramics" at the ceramic session. This paper was authored by Changsheng Guo and Ronald H. Chand.
On September 20,1995, Ronald H. Chand, Changsheng Guo and Keith P. Costello attended the machining workshop at Oak Ridge National Laboratory. Ronald H. Chand and Changsheng Guo did a presentation about the project. The second prototype CGTS and the final CGTS were also exhibited at the workshop.
Problems Encountered
None.
Publications
Guo, C. and Chand, R.H., 1995, "Grindability of Ceramics," Proceeding of the 1st International Machining and Grinding Conference, SME, MR95-168, Dearborn, MI, pp. 123-136.
Guo, C. and Chand, R.H., 1995, "Characterization of Ceramics from the Machining View Point,"Proceedingsof'the International Symposium on Advanced Ceramics for Structural and Triobological Applications, Vancouver, British Columbia, Canada, pp.413-424.
Guo, C. and Chand, R.H., 1996, "Precision Machining of Technical Ceramics," Ceramic Technology International, pp.49-52.

Table 1 Summary of materials tested
Number
1 2
3
4
5
6
7
8
9
10
11
12
13
14
15
16
17
18
Material
Si3N4 - A Si3N4 - B
Si3N4 - C
Zr02 - A
Zr02 - B
Si3N4 - D
Si3N4 - E
Si3N4 - F
Si3N4 - G
SiC-A
SiC-B
A1203
SiC-C
Si3N4 - H
Si3N4 -1
Si3N4 - J
Si3N4 - K
Si,N, - L
Hardness HV
1860 1500
1500
1200
1200
1500
1500
1460
1670
2500
2800
1360
1550
1460
1610
1420
1540
1550
Strength (MPa)
590 620
620
630
630
620
620
1050
983
595
460
310
655
1027
891
849
756
566
Elastic modulus GPa
276 172-241
172-241
207-241
207-241
172-241
172-241
310
306
466
410 -
455
310
310
300
319
320
Passon ratio
0.28 0.22
0.22
0.31
0.31
0.22
0.22 -
-
0.21
0.14
-
0.14 -
0.27
0.28
0.28
0.28
Fracture toughness
5.70 6.60
6.60
8-12
8-12
6.60
6.60
8.25
6.50
2.70
4.60
-
5.2
8.25
6.4
6.7
6.9
6-7.5
Grindability Gc (10-4
mm3/m N)
24.3 18.5
17.1
37.9
37.0
22.9
22.2
21.2
18.2
70.2
87.7
181.3
91.8
19.6
6.9
15.5
23.7
34.3

139
Figure 1 Photograph of the ceramic grindability test system
Figure 2 Photograph of part of the CGTS

140
20
215
E E
o 1 0
Of
TJ 5 c 0
■ i Silicon nitride □ Zirconia EH Silicon carbide ■ Aluminum oxide
III Mil 0 3 6 9 12 15
Material number Figure 3 grindability of various ceramics
18
6 9 12 15 18 Material number
Figure 4 grindability of tested silicon nitride ceramics

141
20
16
2 S 12
2 8 CD°
j c
5
■ silicon nitride A zirconia a silicon carbide # aluminum oxide
□ D
"I
200 400 600 800 1000 1200 Strength (MPa)
Figure 5 grindability and flexural strength
CD
Z 3 E
03
E E
« ° 2
o CD >. XI CO ■? 1
■ 1
■ ■
500 600 700 800 900 1000 1100 Strength (MPa)
Figure 6 grindability and strength (silicon nitride)

142 20
16
E 12
2 8
£ 1 4
5
■ silicon nitride ♦ zirconia • silicon carbide *■ aluminum oxide
• •
1000 1500 2000 2500 3000
Hardness (HV)
Figure 7 grindability and hardness
* * ■
Z 3 E
c5~ E E >»* » o 2 i —
o CD £ 2 « j
■a 1 c
n
■ ■
■
1
■ ■
■
■
1400 1500 1600 1700 1800 1900
Hardness (HV)
Figure 8 grindability and hardness (silicon nitride)

143
10
8
E E
CO
o
6
0 „ CD 4
CO
'
•
. • ■ silicon nitride
A zirconia • silicon carbide
■
■i ■ ■
■ i . . . i . . . i . . . i
0 2 4 6 8 10
Fracture toughness (MPa m1'2)
Figure 9 grindability and fracture toughness
12
■
■
■ ■
■
■
Z 3 E
% E
c o
°2 o
CD >» 3 co A
S
5 6 7 8 9
Fracture toughness (MPa m1'2)
Figure 10 Grindability and fracture toughness (silicon nitride)

144
(a) Material 3
(b) Material 4 Figure 11 SEM photograph of the as-ground surfaces

145
(c) Material 8
(d) Material 10
Figure 11 SEM photograph of the as ground surfaces (cont)

146
Hiah-Speed. Low-Damage Grinding of Advanced Ceramics
Joseph A. Kovach Eaton Manufacturing Technologies Center Willoughby Hills, Ohio 44094
Stephen Malkin University of Massachusetts Amherst, Mass. 01003
Objective/Scope
The overall objective of the High Speed Low Damage (HSLD) grinding project is to develop a single step, roughing-finishing process suitable for producing high-quality advanced ceramic components at high material removal rates and at substantially lower cost than traditional, multi-stage grinding processes. Initial implications from Phase I have suggested that HSLD grinding of Si3N4 is technically feasible. Accordingly, to achieve the overall program objective, the Phase II effort is focused on:
1.0 Continued expansion of the existing HSLD science base,
2.0 Further development of the enabling HSLD technologies required for successful production implementation, and
3.0 Economic analysis of the HSLD production cost drivers.
Technical Progress
This semiannual report summarizes technical progress achieved during the period from April 1,1995 through September 30,1995. The report describes activities at the University of Massachusetts and the Eaton Manufacturing Technologies Center. A technical overview is presented in the following areas:
1. HSLD MOR Strength Evaluation and Fractography Analysis 2. Ceramic Grinding Mechanism Analysis 3. Infrared Detector System for Temperature Measurements 4. Hydrodynamic Forces in Grinding of Ceramics 5. Centerless Grinding - Simulation & High Speed Testing 6. High-Speed Grinding with Diamond Belts 7. Advanced Wheel Dressing Concepts

147
1.0 HSLD MOR Strength Evaluation and Fractography Analysis
Building upon the MOR test data presented in the previous semi-annual report, Eaton has completed a detailed MOR specimen fractography study of the MOR bars ground using a very coarse 120 grit wheel. This analysis was conducted to determine whether the measured fracture strength was a true indication of the material properties, or if low fracture strength was the result of edge crack effects, from specimen preparation, handling damage or unusual microstructural features (voids, inclusions, etc.). The fractography was carried out with optical and scanning electron microscopy (SEM).
Based on the fractographic analysis, a substantial number of specimens were removed from the MOR strength analysis, and a revised Weibull analysis was completed. Tables 1 & 2 list the test conditions, as well as the original and revised MOR strength data, along with the revised Weibull statistics based on the fractographic analysis. Also shown are the number of samples removed from the analysis for different failure modes. The high fall-out levels for the condition C samples indicated a problem in the chamfering operation after the grinding tests had been completed. Examination showed the chamfers on the tensile side of the MOR bars had large areas of fragmentation and pull out. The chamfer chipping is being investigated. Of the remaining samples, the optical and SEM examination clearly showed that the grinding grooves did initiate MOR fractures at the tensile surface.
Recognize that the new smaller sample size for each grinding condition (based on the samples eliminated by fractographic analysis) makes it more difficult to draw sweeping conclusions regarding the effects of grinding conditions on MOR strength. It does appear, however, that the average (63.2% failure) strengths for these extremely coarse (120 grit) grinding conditions did not change substantially after fractographic analysis. The samples ground under conditions A, B and D had very similar strength.
On the other hand, Condition C, which utilized the higher material removal rate and faster wheel speed, still displayed a lower average strength (see Table 2). The revised data also tends to indicate that when using a very coarse 120 grit wheel, lower material removal rates may provide a better Weibull modulus. Based on these examinations, it appears as if the 120 grit plated wheel was far too coarse to provide damage free components, even while operating at high wheel speeds.
In addition to the above fractography analyses, the characteristics of the ground surface that controlled the strength were also evaluated using several techniques. Atomic Force Microscopy (AFM) examinations were carried out with a Park Scientific unit at Case Western Reserve University. The original intent of this effort was to characterize the ground surface, using AFM as a very precise profilometer. AFM had the potential to provide the height and shape of the grinding grooves, show a profile of the grinding grooves and compare the surface fragmentation from different grinding conditions. However, the grinding groove depth and relative porosity levels were often beyond the travel limits of the AFM probe head, and ended up giving incomplete data.

148
While early evaluations using Scanning Acoustic Microscope (SAM) showed promise for detecting subsurface cracks, the surface roughness of the as-ground workpiece ultimately made most of the SAM analysis inconclusive. The relatively rough as-ground surface produced a great deal of surface waves that interfered with the subsurface return signal. More importantly, however, the rough surface produced reflections that would obscure any subsurface features. As a relatively new technique for grinding damage assessment, SAM requires an experienced operator to interpret rather confusing images of as-ground S/RBSN surfaces.
As follow-on efforts, additional HSLD tests are being setup at Eaton/MTC to fully characterize process removal rates and resulting affects on component quality. Unlike the previous test series (which utilized coarse plated wheels), the focus of this test series will be on industrializable processes using dressable wheels. To date, Beck Universal 170 and 320 grit high-temperature resin bonded wheels have been received. High speed Beck vit-bonded wheels are also due in shortly. In addition, a special high speed graphite fiber reinforced 170 grit vitrified bond wheel has been received from Noritake. A custom high speed hub has also been designed and is being built for the new Noritake wheel. All workpiece test material has been received (Allied Signal GS-44, Ceradyne Ceralloy 147-3, Kyocera SN-220, and Eaton S/RBSN).
2.0 Ceramic Grinding Mechanism Analysis
In a related effort, the University of Massachusetts (UMass) has been investigating the mechanisms of ceramic grinding to determine how the surface and sub-surface grinding damage, described above, is generated. In addition, the efforts are also aimed at identifying how the specific grinding energy is quantitatively balanced with respect to the energy consumed during material removal process. To date, UMass has conducted 54 additional experimental tests over a wide range of grinding conditions. Power and forces were measured and the results were analyzed using the "scratched surface parameter" described below. In addition, the ground surface and grinding debris were analyzed by scanning electron microscopy (SEM) for the following three cases:
Depth of Cut (mm) Work Speed (mm/s) Wheel Speed (m/s) Case I 0.038 200 10 Case II 0.0216 100 30 Caselll 0.00508 5 40
Ground surfaces were initially generated and analyzed using a low wheel speed Vs of 10 m/s, workspeed Vw of 200 mm/sec, and depth of cut a of 0.025 mm. From those observations, it was suggested that the mechanism of material removal is mainly caused by fracturing associated with lateral cracking. In ail cases, the surfaces generated by grinding appear to be covered with a smooth smeared layer, which can hide subsurface damage. Because the layer was chemically attacked by HF, it was assumed to be amorphous (glassy).

149
Hydrofluoric acid( 49% HF) was used to etch the ground surface for 1 hour at 100 °C to remove the smeared (amorphous) layer. The grooves generated by abrasive grains were clearly observed after etching, which suggests that the deformation also extends beneath the smeared surface layer. This deformation, between the smeared layer and the original material beneath it, could account for much of the grinding energy input. What is important to note, however, is that little difference was observed between the etched surfaces for Cases I, II, and III at magnifications up to 2000X.
The smeared layer observed after grinding may be formed by reaction of Si3N4 with oxygen: Si3N4 + 302 = 3Si02 + 2N2
This silicate oxidization layer would be glassy (amorphous), unlike the original crystalline ceramic structure. This oxidization process may be influenced by friction, water vapor, and temperature. The formation of the smeared layer will receive further study.
Scratched Surface Parameter
As of yet, no grinding model has been developed which can fully account for the forces and specific energy seen during the grinding of structural ceramics. From the observation of grinding debris and the ground surface, it appears that material is mainly removed by brittle fracture. The magnitude of the specific fracture energy can be roughly estimated from the fracture surface energy and size of particles. The magnitude of the specific fracture energy estimated in this way (10* J/mm3) is three or four orders of magnitude less than the measured specific grinding energy (10 ~100 J/mm3). Therefore the fractured surface energy is negligible compared to the specific grinding energy.
From the observation of ground surfaces, it would appear that deformation associated with the smeared surface generated by successive contact with grains might play an important role in the energy consumption. With this in mind, a new parameter was developed which is the scratched surface area. For a single undeformed chip with a trapezoidal cross-section, the scratched surface area would comprise the bottom surface and two side surfaces.
For simplicity, it is assumed that the scratch width bs is proportional to the undeformed chip thickness h:
bs = rh 1
where r is a geometrical constant, and that the angle 0 of the trapezoidal cross section can be obtained from a scratch test. The maximum undeformed chip thickness hm is obtained as
C(r-tanQ) vs de
where C is the number of cutting points per unit area on the wheel surface and de is the equivalent wheel diameter.

150
For this uncut chip geometry, the area of the bottom surface Sb is obtained as product of average width of the bottom surface ba and the contact length lc
Sb = bJc = (r-2taaB)hJc = (r-2tanej(y)Zc
or
(r-2tan9j ^,1/2,^14,1 J « [C(r-\3XiB)]'u v,
The area of the two side surfaces Ss is similarly obtained as
cos8[C(r-tznB)]m v* 5
Therefore the total scratched surface St produced by single grain after one complete pass is equal to the sum of Ss and S t Now the rate at which the scratched surface area is produced, Sw, can be obtained as:
Sw=Cbs, vs 6
where b is the grinding width. Assuming that the grinding power is proportional to Sw and combining Eqs.(4,5,& 6) leads to an expression for the power per unit width:
„ [r +-^—(i -sine;; HT - [C]m n *„m (™s)m(a)3l4(dj14
b [(r-tanQ)] -j
The specific grinding energy and tangential grinding force can also be obtained from Eq.(7). The specific energy is:
F,vs ^ [r+2(l-smQ)/co&] vs j ' 2 dej'4
aVwb * [(r-taaB)/C]m vw a Q
and the force per unit width is
1/2 Ft [r+2(l-sxnB)/cosB],vw / " ^l4 Il4
T ~ [(r-^)icr {~,} {f (de) 9

151
If the same wheel and workpiece is used (C, r, 6, and da constant), the only dependent variables should be a, vw, and vs. In case of different wheels, C and de can be considered as dependent variables with the assumption that the parameters r and 6 are independent.
It can be seen that a proportional relationship between the power per unit width and the scratched surface parameter would imply a constant energy per unit contact area between the abrasive grains and the workpiece. Consequently, the measured power and forces were plotted against the scratched surface parameter. The present results in Figure 1 show two straight-line regions over the range covered by these test conditions. A proportional relationship with a smaller slope at very low values of the scratched surface parameter is followed by a straight line with a much steeper slope covering most of the grinding conditions of practical interest. Cases I, II and III for observation of ground surface and grinding debris are marked in this figure. The corresponding specific tangential and normal forces also displayed a similar trend. Additional experiments must be conducted to further define the grinding behavior. Models are being developed to quantitatively account for these experimental results.
3.0 Infrared Detector System for Temperature Measurements
In addition to analyzing the mechanically generated surfaces, the consequences of thermally induced surface effects are also being investigated. Recognize that high temperatures generated in high speed grinding of ceramics may significantly affect the grinding mechanisms and resulting surface quality. It has been suggested that elevated grinding zone temperatures could inhibit fracture and thereby promote a non-detrimental ductile mode of grinding. However, grinding with high wheel speeds may also adversely affect the process. Excess heating could substantially reduce the useful life of a grinding wheel. The objective of this work is to develop a thermal model to predict the grinding zone temperature based on the energy partition to the workpiece, which can be estimated by matching the measured temperature response to analytically computed values.
A two-color infrared detector with an optical fiber is used to measure the workpiece subsurface temperature in this investigation. Currently, the UMass infrared pyrometry system requires a hole drilled into the bottom of the workpiece for optical fiber insertion. In order to get good system response, the bottom of the blind hole must be in close proximity to the workpiece surface. It can be expected that the temperatures at the bottom of the hole are higher than the temperatures with no hole because the removal of the material from the workpiece reduces its ability to conduct heat. No analytical solutions are available for the temperature field of a solid containing a hole, subjected to a moving heat source. Therefore, a finite element analysis (FEA) was employed to gain insight into this temperature distribution. From the FEA analysis, it was concluded that the measurement error caused by a 1 mm hole is significant, which could induce as high as 34% overestimation at a depth of 0.5 mm below the ground surface. A smaller hole should be recommended for future experiments, although it will be more difficult to instrument the workpiece.

152
Using the approach described above, it was found that the energy partition for wet grinding is 16 to 24%, and for dry grinding 59%. This difference in energy partition suggested that the grinding fluid plays an important role in cooling the grinding zone. It was also found that the grinding zone temperature for wet grinding with 400 grit size wheel can exceed the film boiling point of water (130 °C under one atmosphere pressure). Thus the cooling mechanism at the workpiece could be different from the one using conventional grinding wheels.
One possible cause for the difference in energy partition is that high fluid pressure in the workzone can suppress film boiling of the fluid, thus enhancing the cooling effectiveness of the fluid at the workpiece. In this case, the burn-out heat flux will depend on the fluid pressure which in turn depends on the wheel grit size, the wheelspeed, and the wheel surface condition. Another possibility to account for the high energy partition in the dry grinding case could be build up of the workpiece material on the wheel surface. By adding a thin layer of silicon nitride to the diamond grain, the finite element analysis showed a significant increase in the energy partition to the workpiece. Microscopic examination will be conducted to observe the wheel surface conditions after both wet and dry grinding tests.
4.0 Hydrodynamic Forces in Grinding of Ceramics
Grinding of structural ceramics at high removal rates with minimal surface damage may be achieved by using high wheel speeds. However, high wheel speeds coupled with relatively non-porous diamond wheels and copious fluid application, can result in significant hydrodynamic forces between the wheel and the workpiece. UMass has developed a hydrodynamic analysis to quantitatively account for these fluid related forces. In general, it was found that significant hydrodynamic forces are generated at the converging inlet to the grinding zone. These forces act in addition to those associated with actual grinding and the direct impingement of the applied fluid.
From an analytical perspective, the initial model was based on an assumption that both the grinding wheel and workpiece are perfectly smooth, thereby allowing for simple hydrodynamic modeling using the following relationships:
FV = (FVs - Fv0)b = A*(vs - v0)f(h0) (1)
where: Fy = hydrodynamic force per unit width of the specimen vs = wheel speed, vo = lowest velocity, b == workpiece width H = dynamic viscosity, and f(h0) = b[12((Q - Q0)/(vs - v0)) j'Q JJ $dx - j£#fc] (2)
where: Q = fluid flow passing under the wheel h = separation height between wheel & work (h=0 while grinding)

153
As expected, however, a significant difference between the analytical and experimental results was observed. To compensate for this difference an empirical correction factor he was used to account for the wheel roughness. In essence this approach suggests that the hydrodynamic thickness is increased by an amount he equal to the peak-to-valley wheel roughness. The influence of he can be discussed more conveniently by dividing equation (1) by v s - v 0 which leads to:
(Fvs - FVQV (vs - v0) = n f(ho) (3)
For example to compute the theoretical force at an experimentally set gap thickness of 25 ^m, a gap thickness of ho = 25+ 20^m was used. Repeating the analysis with h(x) replaced by h(x)+hc, or ho replaced by ho+hc, and plotting according to equation 3 gives results as shown in Figure 2. Although there is some systematic deviation, the data fall reasonably close to the same straight line.
The slope of the straight line in Figure 2, obtained from least square fitting of the data, implies a dynamic viscosity of n = 0.00485 N-s/m2. The kinematic viscosity of the soluble oil used in the experiments was quoted by the supplier as 350 Saybolt Universal Seconds at 25 °C, which worked out to be approximately 80 centistokes. Using a simple law of mixtures, a 5% solution of this oil in water (kinematic viscosity, 1 centistoke) would imply a kinematic viscosity of 5 centistokes corresponding to a viscosity of 0.005 N-s/m2. This is remarkably close to the implied viscosity corresponding to the slope in Figure 2.
For the case of actual grinding, there is no set gap thickness for ho = 0. The value of he depends on the characteristics of the grinding wheel. For he = 20/im the calculated hydrodynamic forces agree very well with the measured values for the 400 grit wheel and for he = 40^m for the 120 grit wheel. These values of he correspond to the measured peak-to-valley roughnesses for the respective wheels. This seems to indicate that equations (1) or (3) can be used to predict the hydrodynamic force for situations both with and without any set gap thickness ho.
5.0 Centeriess Grinding - Simulation & High Speed Testing
This part of the work is concerned with simulation of the centeriess grinding process on a PC. The simulation program consists of two major parts. Part 1 performs a static analysis of the process under various setup conditions to predict whether or not the workpiece will spin. Part 2 performs a kinematic simulation of the process for both conventional above center grinding and below center grinding. The simulation has been useful in troubleshooting high material removal rate centeriess grinding processes, particularly with respect to minimizing induced lobing.
High speed centeriess grinding tests, using a Ded-Tru table mounted centeriess grinding fixture, have been initiated at Eaton MTC. A 400 grit diamond resin bonded wheel is being used to grind 0.5" diameter S/RBSN cylinders at wheel speeds up to 15,000 SFM.

154
Grinding power, part roundness, straightness and surface finish are being measured to determine limiting material removal rates.
Initial tests, using vendor recommended setup conditions and wheelspeeds of 5,000 and 10,000 SFM, have resulted in unacceptable five lobed parts. While the Ded-Tru is grinding in a vertical plane, (i.e. the grinding wheel is above the regulating wheel) it is basically an "above center" centeriess grinding process. Therefore, to identify an improved geometric setup, additional centeriess grinding simulations were conducted. For the existing regulating wheel (4.25 inches in diameter), grinding wheel (12 inches in diameter), and work support angle (30 degrees), the center height was varied from 0.1 to 0.16 inches. As simulated and verified experimentally, 5-lobe parts are generated when a typical 2-lobed incoming part is used.
Additional simulations showed that if the grinding wheel diameter is reduced to 9.8 inches or less, a stable setup can be found. In many cases, however, this is not very practical. Moreover, the workpiece must be placed very far above center, which would increase the tendency for spinning — particularly with ceramic components. Alternatively, the simulation program was then run using various values of workpiece center height, and workrest blade angles. It was found that the lobbing can be significantly reduced using a workrest blade angle of 45 degrees (see Fig. 3). This is a significant finding and will be verified experimentally. Workrest blade angle modifications are now underway.
6.0 High-Speed Grinding with Diamond Belts
In an effort to reduce ceramic finishing costs, alternative roughing processes utilizing diamond belts were investigated at Eaton/MTC. From a equipment capitalization perspective it is important to realize that typical precision centeriess grinders cost approximately 10 times as much as throughfeed centeriess abrasive belt machines. Additionally, current stock envelopes on as-fired cylindrical parts can average from 0.020 to 0.030 inches on the diameter. Traditionally, removing this amount of stock can be a time consuming process requiring multiple-stage processes using a bank of centeriess grinders. Problems also arise when rough grinding silicon nitride blanks using high stiffness centeriess grinding machines. The "hard" out-of-round blanks can jam in the workzone, damaging the part and possibly the wheel. Also, with minimal machine compliance, the rounding correction performance can be actually degenerate under certain geometric setup conditions.
As an alternative solution, a high compliance belt grinding approach was tried. S/RBSN cylinders were ground on a through-feed belt grinder to determine potential material removal rates as well as impact on part quality. The belt grinder was attractive due to its cost, throughput rates and inherent compliance. A 3M flexible diamond belt (220 grit, metal bond) was run at 5,000 SFM under wet conditions (using Cincinnati 1011 coolant) to "grind' S/RBSN workpieces, fed one at a time.

155
Parts were reduced on average from a rough OD of 0.532 inch to 0.491 inch in two passes across the four inch wide belt. At 3.5 seconds per pass, approximately .040 inch can be removed from the diameter in seven seconds. For comparison, a 15 HP ultra-stiff centeriess grinder has been shown to have a maximum stock removal of 0.004 inch for every two second pass. To remove 0.040 inch of stock would take 20 seconds, nearly three times longer than the belt grinder.
During testing, the "grinding" load was determined by measuring motor amperage. The belt was held against the part with the motor drawing approximately one amp. Average results with the 220 grit diamond belt are:
Diameter (inch) 0.491
Taper (inch) 0.003
Surface Finish (R„, minch)
54
Roundness (inch)
0.0006
Straightness (inch)
0.0024
From a material removal/quality perspective, the attractiveness of belt grinding is its compliance. For these tests, a 50 durometer polyurethane feed roll and a 50 durometer rubber contact wheel were used. With this level of compliance, irregularities in the part do not dramatically increase the grinding forces. Also, provided the setup geometry is correct, roundness correction can be accelerated. However, the part is much more susceptible to taper. Perhaps a stiffer contact wheel or running a gang of parts instead of one at a time would reduce the amount of taper.
As the above results indicate, the 220 grit belt appears to be quite effective for rough stock removal; but too coarse to achieve the desired finish surface quality. As such, a finishing operation on a rigid centeriess grinder should be employed to achieve final size and tolerance. Subsequent polishing operations, using belt techniques, may again prove to be the most cost effective means of achieving a fine surface finish.
7.0 Advanced Wheel Dressing Concepts
Several methods were investigated to determine their relative effectiveness for truing and conditioning resin and metal bond diamond grinding wheels. In an effort to gain some practical insight into the ELID process under HSLD grinding conditions, the EATON corporation conducted a series of high speed O.D. cutoff grinding tests. Cylindrical S/RBSN samples (0.531" diameter) were cutoff at four different removal rates using a 100 grit metal bonded diamond wheel (Regal MD 100 N 100 M, 0.035" wide) operating at 25,000 ft/rnin.
In these preliminary tests, conventional stick dressing was compared to the ELID process in terms of resulting grinding forces, specific energy, dressing time, and workpiece surface finish. Note that unlike conventional stationary cutoff operations, the workpiece specimens in these tests were rotating (1100 RPM = 150 SFM peripheral velocity) to reduce the arc length of contact. By minimizing the arc length of contact the propensity for burnout is reduced, thus allowing for higher removal rates.

156
To initially dress the wheel conventional stick dressing v/as performed using a 220 grit aluminum oxide dressing stick. The wheel, rotating at 30,000 RPM (23,500 ft/rnin), was plunged into the stick at a rate of 0.000 007 in/rev. With this process, over half an hour was required to open the wheel. A similar amount of dressing time was also required between tests to fully open the metal bonded wheel.
For comparison, the ELID tests were also conducted using a wheel speed of 23,500 SFM (30,000 RPM). In these initial tests, stainless steel electrodes (SS41) were used in the ELID dressing head. A 60 volt DC potential was placed across the electrodes. The wheel was plunged into the electrode at 0.000 000 3 in/rev to a total depth of .000 15 in. and subsequently traversed across the electrode at this depth for 1.25 inches at a rate of 0.0003 in/rev. At the end of the stroke the wheel was then plunged again and traversed back to the starting point. One pass (plunge and traverse) required seven seconds. With this process a completely dull wheel could be fully conditioned in less than ten minutes. Note that between slicing tests only 30 passes, or three and a half minutes, was needed to fully recondition the wheel.
In all cases the ELID dressed wheel operated at a lower power than the conventionally dressed wheel. In addition, the specific grinding energy required for the ELID dressed wheel was about 60% (see Figure 4) of that needed for the stick dressed wheel, thereby indicating a much more open wheel had been produced. Interestingly, the normal forces were about the same with either dressing method. It is felt that the diamond penetration force would not be considerably affected by the soft surrounding bond. Conversely, from a tangential force standpoint (which is also proportional to power and specific energy) a more open wheel will reduce the amount of rubbing while providing increased chip clearance.
Also interesting was how the resulting surface finish remained relatively constant using ELID while the stick dressed wheel tended to produce a rougher finish as the removal rate was increased. This tends to indicate a more consistent dress was obtained using the ELID method. It was also noted that after grinding with the stick dressed wheel, the diamonds appeared quite dull with considerably more bond smearing than when dressing with ELID. The ELID process apparently opened up the wheel better than sticking, reducing the magnitude rubbing that occurred with the stick dressed wheel.
Status of Milestones
As of September 30,1995 the hydrodynamic force model, centeriess grinding stability simulation, and burnout prediction model for creep feed grinding have been completed. In addition, several Phase II milestones are nearing completion at this point; including energy partitioning at conventional wheel speeds and construction of a robust two-color precision pyrometry system.

157 Publications
1) "Measurement of Hydrodynamic Forces in Grinding" by M. Ganesan, Transactions of the North American Manufacturing Research Institution, Vol. XXIII, May, 24-26,1995.
2) "Energy Partition to the Workpiece for Grinding of Ceramics," by B. Zhu, C. Guo, J.E. Sunderland, and S. Malkin, Annals of the CIRP, Vol, 45/1,1995, pp 267-271, presented by S. Malkin at the CIRP Annual Convention, Enschede, Holland, August 21-26,1995
3) "High-Speed, Low-Damage Grinding of Silicon Nitride", Kovach, J., et al., Abrasives Magazine, August/September Issue, 1995, pp. 15-20.
S/RBSN Grinding Conditions
Grinding condition
Unground
A
B
C
D
Combined
Grinding conditions Materia)
removal rate Wheet speed sg in / min sfm
N/A
0.125
1.0
1.0
0.125
N/A
5000
5000
25000
25000
Feed rate in / min
50
100
100
50
Depth of cut inches
0.0025
0.010
0.010
0.0025
Number of
passes
4
1
1
4
Table 1
S/RBSN Flexural Strength & Fractography
Grinding condition
Unground
A
B
c
D
Combinec
Weibull statistics All data*
Average Strenqth"
65.329
55.463
54.847
45.299
53.112
52.521
Weibull modulus'"
13.34
8.45
7.76
8.69
11.22
7.89
Data validated bv factoaraohv Average
Strength"
N/A
54.278
56.768
48,432
53,612
53.973
Valid data
14
13
8
21
56
Weibull modulus*"
N/A
11.73
5.95
7.02
10.42
8.38
Strength at 0.1% failure (psi: Acorox)
38.000
30.000
17.000
17.000
27.000
24.000
Fractoqranhic analysis MOR bar failure modes
for each anndina condition Grinding I Inciusioni Chamferl Pore
14
13
8
21
56
9
9
3
5
26
7
5
18
4
34
0
3
1
0
4 • 30 data pointt m grmdng tests: 7 + histoncal data for Dasebne " (eta) Determined at 632% prooability of failure — (beta) slope of rank regresaon line
Table 2

158
400
300
E E v. (0
200
100
Case I
Case II
200 400 600 800
( vwvs )1 / 2( a )3 / 4( d e )1 /4 , [ mm2/s I
1000
Figure 1 A plot of specific power versus scratched surface parameter

159
.75
.5 -
E (0
o > .25 >
LL
I ■ 1 1 1 1 1
hc = 20 pm Slope = 0.00485
.
•
-
•
•
* * +y
V / A
/
/
• +
* /
■
A
•
+ ■ *
m
A
•
+ y
ft
*
■ A
+
• /
/
/ m
A
•
vs=48 m/s . v8=40 m/s vs=32 m/s ' vs=24 m/s vs=16 m/s .
•
50 100 150
f(h0) [m] Figure 2 Theoretical values of the forces obtained with a correction factor.

160
90 0.4
180
150 /
210 \ \
120 . ^ —
2 4 0 ^ - ^ _ _ _
0.3
0.1/
- ^ 6 0
30
\ S / / 330
- ^ 3 0 0
0
270
Figure 3 Workpiece profiles for blade angle of 45 degrees

7,000,000
6,000,000
5,000,000 E> 2 «£ 4,000,000 UJ ~ o Q S Z 3,000,000 o —' W 2,000,000
1,000,000
0 0.25
Comparison of Stick vs. ELID Dressing 100 Grit Diamond Metal Bonded Wheel
Specific Energy vs. Material Removal Rate
■Stick •ELID
+ 0.50 0.75
Material Removal Rate (in2/min)
1.00
Wheel 100 grit diamond metal bond (MD 100 N 100 M) 3 Inch OD x 0.035 Inch wide V8 = 25,000 ft/min
Material S/RBSN cylinders 0.532 inch OD Vw = 150 ft/min
Figure 4

162
Grinding Optimization for Advanced Ceramics Lewis K. Ives, Said Jahanmir, Venkata S. Nagarajan, and Mario Cellarosi (National Institute of Standards and Technology)
Objective/Scope
The overall objective of this project is to develop guidelines and recommendations for grinding optimization of advanced structural ceramics to achieve minimum cost and maximum reliability. The following steps are being taken to achieve the objective: conduct grinding experiments jointly with industrial participants, determine effect of grinding parameters on machining damage and strength, elucidate mechanisms of material removal and damage formation, evaluate several damage detection techniques, and transfer data and information to industry in computerized database format.
Background
The goal of the ceramic machining program at NIST is to provide measurement methods, data, and mechanistic information needed by industry to develop innovative cost-effective methods for machining advanced structural ceramics. Research projects are carried out jointly with industry and academic institutions under the auspices of the Ceramic Machining Consortium. At the present, the Consortium has twenty-one members: Ceradyne, Inc.; Cercom, Inc.; Cincinnati Milacron, Inc.; Dow Chemical Company; Eaton Corporation; Ford Motor Company; General Electric Company; General Motors Corporation; Georgia Institute of Technology; Landis Company*; Lehigh University*; Norton Company; Stevens Institute of Technology; Torrington Company; Tower Oil and Technology Company; University of Connecticut; University of Delaware*; University of Maryland; University of Massachusetts*; University of Rochester; and West Advanced Ceramics, Inc. (The new members are marked by an asterisk.) Consortium members participate in the research projects by providing materials, testing services, advice, and other in-kind contributions. Funding for the projects, in addition to the DOE - Ceramic Technology Project, is provided by the Ceramics Division and the Standard Reference Data Program of NIST.
Technical progress
This report will focus on the results of a project that was undertaken in conjunction with the NIST Ceramics Machining Consortium to determine the grindability of three different commercially available silicon nitride ceramics. The project is one of several projects that are currently being conducted at NIST to investigate and characterize the grinding response of advanced ceramics.

163
Materials and test procedure
The main objectives of the project are to determine the influence of selected grinding conditions on flexure strength, surface roughness, and wear behavior of the three chosen ceramics. Of particular interest is the assessment of machining damage at relatively high removal rates. Information on the response at high removal rates is especially important with respect to optimizing the grinding process. A short list of properties of the three silicon nitrides is given in Table 1. Two of the silicon nitride materials, the sintered reaction bonded silicon nitride (SRBSN) and the sintered silicon nitride (SSN), are relatively high strength, structural ceramics, while the third material, a reaction bonded silicon nitride (RBSN), is a lower strength, low cost ceramic.
Table 1. Materials and properties.
MATERIAL
SINTERING AIDS DENSITY (g/cm3)
POROSITY
ALPHA TO BETA RATIO
GRAIN SIZE LENGTH x WIDTH (um)
ELASTIC MODULUS (GPa)
FRACTURE STRENGTH (MPa)
FRACTURE TOUGHNESS, kIC
(MPaVm) VICKERS HARDNESS
(GPa)
RBSN
—
2.36
20%
7.7: 1
1-2 x 0.5-1
200
205
2.5
6.8 ± 0.7
SRBSN
AL203 & Y203
3.22
<1%
ALL BETA
6-8 x 1-3
300
674
6
—
SSN
(N.A.)
*3.20 —
ALL BETA
**0.3 -1.3
306
668
*"6.8
14.2±1
* >99% Theoretical density **grains have 1:4 aspect ratio ***Chevron notch test
Eight industry affiliated consortium members participated in the experiment to determine the grinding response of the selected silicon nitrides. Grinding was done either in-house by the participant or by an independent contractor chosen by the participant. The only restriction was that the grinding be done by eight different and independent facilities.

164
A factorial design of experiments approach was employed for the project. This was done in order to maintain the required number of specimens and associated grinding and measurement effort within reasonable limits, and at the same time insure that a statistically sound outcome would result.
The grinding parameters were separated into three categories. These were 1) parameters selected for variation given in Table 2, each participant was assigned specific sets of varied parameters; 2) fixed parameters such as the wheel type, cross-feed and coolant type, all participants used the same fixed parameters; and 3) unspecified parameters, examples of such parameters are size and make of the grinding machine, machine stiffness, and the skill and experience of the operator.
Table 2. Varied grinding parameters
PARAMETER
TABLE SPEED
DOWN FEED
WHEEL GRIT SIZE
GRINDING DIRECTION
1
0.025 m/s
0.050 mm
140/170
Longitudinal
2
0.125 m/s
0.125 mm
80/100
Transverse
The specimens that were subjected to grinding were four-point bend flexure test specimens. These specimens not only allowed the determination of the effect of grinding conditions on flexure strength but the same specimens, or pieces thereof, could be used for roughness measurements, wear studies and other investigations, as desired, to assess grinding effects.
For each of the first three parameters—table speed, down feed, and grit size—two levels of severity were selected. A comparatively mild condition, column 1 in Table 2, and a condition of substantially greater severity, column 2 in Table 2. The actual choice of values for each condition was based on earlier screening studies. In terms of specific removal rate, the smallest value was 1.25 mm3/s per mm of wheel width and the largest value was 15.6 mm3/s per mm of wheel width.
All combinations of the parameters listed in Table 2 were evaluated. A factorial design of experiments approach was used resulting in the assignment of four different grinding conditions to each of the eight participants for each of the three materials. Each combination of conditions was duplicated by two different participants to allow an assessment of reproducibility. Thirty specimens were ground for each condition, a

165
sufficiently large number to provide a sound statistical evaluation. The thirty specimens were ground independently in groups of fifteen so that the results for each set of fifteen specimens could be used to assess experimental repeatability.
Flexure tests were carried out at NIST using the procedure described in ASTM Standard CI 16190. In order to establish the origin of the failures, fractographic examinations were conducted on all specimens by means of optical microscopy and on selected specimens by means of SEM. Weibull statistics using the maximum likelihood method was employed to determine the characteristic strength and Weibull modulus.
Surface roughness measurements were made with a stylus type profilometer instrument.
A Falex blockonring test machine was employed to conduct sliding wear tests. Small sections of the broken flexure bar specimens were used as the blocks. The rings were carburized 4620 steel bearing cups with a surface hardness of 58 63 HRC A 10W30 SH/CD motor oil was employed as the lubricant. All tests were conducted at a normal load of 670 N and sliding speed of 0.55 m/s.
Flexure test results
Flexure test results are summarized in Fig. la and b. Values for the grinding parameters such as table speed (T.S.), identified by the numbers 1 and 2, are given in Table 2. The grinding conditions are arranged on the xaxis according to increasing grit
800
700
600
fe 500
£<C0H g | 300
200
100
*4:
5 o
O { p _ _ ft o
T ave. SRBSN
ave. SSN
_ . . © .
0 □ A
RBSN SRBSN SSN
ave. RBSN
T.S. DF. Grit
1 1 1
1 2 1
1 2 1 2 1 1 2 2 2 1 2 1 GRINDING CONDITION
2 1 2
2 2 2
GRINDING CONDITIONS
(a) (b)
Fig. 1 Effect of grinding conditions on characteristic strength (a) longitudinal direction, (b) transverse direction.depthofcut.

166
Thus T.S. = 1, D.F. = 1 Grit = 1 corresponds to the smallest grit-depth-of-cut and T.S. = 2, D.F. = 2, Grit = 2, corresponds to the largest grit-depth-of-cut. The largest grit-depth-of-cut is approximately a factor of six greater than the smallest grit-depth-of-cut. The amount of damage or the severity of the process is expected to increase with increasing grit-depth-of-cut.
Figure la shows the influence of grinding conditions on characteristic strength for specimens ground in the longitudinal direction. For reference, characteristic strength values are also plotted for specimens ground according to the conditions specified in ASTM Standard C1161 (320 grit wheel and down feed of <0.003 mm for the final 0.060 mm of stock removal) which is designed to minimize the effect of grinding damage on flexure strength. Although the quantitative statistical analysis of the data which is currently under way has not yet been completed, visual examination of the results indicates that when grinding is in the longitudinal direction, i.e. parallel to the tensile axis of the flexure specimen, the grinding conditions used in this study have little or no effect on characteristic strength.
When grinding is done in the transverse direction, i.e. perpendicular to the tensile axis of the flexure specimen, the characteristic strength is apparently reduced by 25-30% for all conditions, Fig. lb. However, in most cases in the amount of reduction does not appear to change much from one condition to the next. Possible exceptions are that the larger grit size appears to result in a greater reduction in characteristic strength for the SSN and SRBSN materials, and the most severe grinding condition results in a noticeably lower characteristic strength for the RBSN material. It appears that within this range of grinding conditions, the characteristic strength, at least for the SSN and SRBSN materials, does not decrease significantly with increasing grit-depth-of-cut. For the SSN and SRBSN materials most of the reduction in characteristic strength apparently occurs at grit-depth-of-cut values less than that associated with the least severe condition employed in this study.
An important observation concerns the amount of scatter in the data and in particular the margin of difference between characteristic strength values obtained for two different participants using the same grinding conditions. In several instances that difference in reproducibility is as large as any effect that might be associated with the different grinding conditions. This suggest that factors other than the varied parameters can have a significant influence on damage. Factors that are likely to be important in this regard are the dressing of the grinding wheel, the trueness and balance of the wheel, and the machine stiffness. In future work a systematic study is planned to evaluate the influence of such factors.
Surface roughness results
A survey of surface roughness values obtained for all grinding conditions based on two or three measurements per condition indicated that the effect of grinding condition for a given material was not large.
A detailed evaluation of arithmetic roughness (Ra ) values for the three silicon nitride materials was carried out for specimens ground under the least severe and most
167
severe conditions. The least severe condition comprises parameters (table speed, down feed, and grit size) listed in column 1 of Table 2 and will be designated (111). The most severe condition consists of parameters given in column 2 in Table 2 and will be designated (222). Grinding direction, the last parameter in Table 2, should have no influence on surface roughness. As noted previously, the least severe condition (111) corresponds to a grit depth of cut that is a factor of about six less than the most severe condition (222). A stylus profilometer was used for the roughness measurements; three traces were made on each specimen. A statistical analysis was then carried out to assess the repeatability and reproducibility of the results.
The results of the surface roughness measurements are shown in Fig. 2 for the three silicon nitride materials. For each grinding condition, sixty specimens were measured, thirty specimens form each of the two different participants that were assigned that condition. Grinding for each condition was performed in two groups of 15 specimens denoted by A and B in the figure. In each graph, the heights of the bars represent the mean value of 45 measurements, and the error bars indicate the standard deviation. The identifying numbers designate the participating consortium member and the test. Visual inspection of the bar graphs suggests that: (1) in most cases there is only a small difference between the Ra values for each A and B set and for each participant; (2) surface roughness increases as the severity of grinding is increased; and (3) the roughness of RBSN is generally higher than the other two silicon nitrides ground under identical conditions. It should be noted, however, for SRBSN ground under the mild condition, there is a large difference in the results obtained by the two participants and for one participant between the two fifteen specimen sets (5-7A and 5-7B). Also, for the RBSN ground under the severe condition, there is a noticeable difference between the average Ra values obtained for the two participants, but the large uncertainties associated with the results suggests that the difference is not statistically significant.
In order to compare these results, the coefficient of variation, i.e. the ratio of the standard deviation to the mean, was calculated for each data set. The coefficient of variation within each laboratory and in-between laboratories were taken as the measure of the repeatability and reproducibility, respectively. If a value less than 0.15 is taken as an indication of acceptable repeatability and/or reproducibility, the results show that both the repeatability and reproducibility were acceptable, with the exception of SRBSN ground under the mild condition. In that case, not only was the coefficient of variation for the results of the two participants large indicating poor reproducibility, but also on account of the large difference between the 5-7A and 5-7B sets the repeatability was poor. As was noted in the discussion of the flexure test results, it is clear that in the case of surface roughness there are also factors, perhaps associated with differences in the grinding machines or conditioning of the grinding wheel, that can have an effect that is nearly as large as that associated with the intentionally varied parameters.
In the future, similar detailed evaluations will be carried out on the three materials for other grinding conditions. Also to be included will be the evaluation of additional roughness characterization parameters.

168
E
a:
a. 8
0.7
0.6-
0 .5-
0.4
0.3
8 0.2
0.1
0.0
Grinding Conditions
[111]
SRBSN
1222)
i - T - U> U> <0<D N N
(a) (b)
E
a. S
W N to tp
(c)
Figure 2. Surface roughness results for (a) RBSN, (b) SRBSN and (c) SSN specimens ground under the least severe (111) and the most severe (222) conditions.

169
Wear results
Wear tests were conducted on SRBSN specimens ground under the two extreme conditions, (111) and (222). For comparison, tests were also performed on specimens thathad been prepared by polishing. Sufficient material was removed during polishing to eliminate damage introduced during the grinding of the original surface. Wear tests on the ground surfaces were conducted both with sliding parallel to the grinding direction and perpendicular to the grinding direction as illustrated schematically in Fig. 3. Wear volume both for the SRBSN blocks and the steel rings was determined from the average cross-sectional area of the respective wear tracks. The average cross-sectional area was determined from profile traces taken across the wear tracks. Three wear tests were carried out for each condition.
Figure 3. Schematic illustration of the two orientations used for wear testing.
Surface roughness values for specimens measured prior to wear testing are given in Table 3. As expected, the roughness of the ground surfaces is significantly greater than that of the polished surface, and the roughness of the surface subjected to the most severe
Table 3. Ra roughness of SRBSN wear test specimens.
POLISHED
<0.05 jam
GROUND CONDITION (111)
0.15 ± 0.01 um
GROUND CONDITION (222)
0.23 ± 0.01 jim

170
grinding condition is greater than that of the surface prepared by the least severe grinding condition.
The friction force was monitored during the wear test. The average steady state values of the friction coefficients for the different surface conditions and sliding directions are as shown in Fig. 4. It is seen that the steady state value of the friction coefficient is about 0.13, independent of the surface condition and the direction of sliding with respect to the grinding direction. This relatively high friction coefficient value is indicative of a condition of boundary lubrication.
Wear results for the SRBSN specimens prepared under different conditions are shown in Fig. 5. Clearly, the wear rate obtained for the polished surface is smaller than that for the ground surfaces. Although there is a fairly large standard deviation associated
0.20
0.15
£ o.io o
T3
0.05
0.00
a: H £ **■ Sj ^ o *- ^ CM ?j
Figure 4. Coefficient of friction for SRBSN sliding on steel for different surface conditions. Here, -PL indicates sliding parallel to the grinding direction and -PR perpendicular to the grinding direction.
with the data, it also appears that the wear rate is greater for the most severe grinding condition than for the least severe condition. Sliding direction does not seem to have a significant effect for the least severe grinding condition; but for the most severe grinding condition, the wear rate is higher when sliding is parallel to the grinding direction. It is thought that this difference may be related to the influence of surface topography on the efficiency of lubrication, although an effect associated with the anisotropy of the grinding induced surface damage can not be ruled out.

171
It should be noted that the maximum depth of the wear scars on the ground specimens was less than the observed depth of the grinding induced subsurface damage zone. For the SRBSN material and two grinding conditions used, that depth was about 10 nm. For continued sliding, resulting in a scar depth that exceeds the thickness of the damage zone, the wear rate would be expected to diminish, and the effect of different grinding conditions on wear rate would also be expected to decrease.
E 35 -
E 30 -
£ 2 0 -
CN CM
Figure 5. Wear rate of SRBSN against steel for different surface conditions.
The wear rates for the steel rings are shown in Fig. 6. The standard deviation for the measurements is relatively large; however, the results suggest that the wear rate of the rings increases as the severity of grinding of the blocks is increased (probably because the surface roughness of the blocks is increased). The wear test results also show that for a given test the wear rate of the steel ring is at least one order of magnitude higher than that of the mating SRBSN block .
Database
A suitable structure and format for the planned Ceramic Machinability Database has been developed. The aim is to provide a database that is appropriate for design

172
applications, tooling selection and machine tool setup, and that can be used to select appropriate grinding conditions both at the production and small shop application levels. In addition to the data generated at NIST in collaboration with the Consortium members, the data in recent publications were examined and collected for inclusion in the database. However, collection of data from the literature is not a simple matter. A very important issue is accuracy and applicability of the data. Also, a decision must be made as to the minimum amount of information required for the published data to be acceptable, because
800 -j
700 -
600 -E
" l 500 -
* 400-
cs £ 300 -CO
I 200 -
100 -
0 - -
Figure 6. Wear rate of steel used against SRBSN samples with different surface conditions.
sufficient information must be provided to describe the material, grinding conditions, and grinding response (e. g., surface roughness, strength, grinding forces). In addition, the units and terminology used in many papers are inconsistent, and much of the data is presented in a graphical form, which could introduce error in extraction into numerical form. At the present, these issues are still being considered.
Preliminary to entering the data in the database, data has been assembled in a spread-sheet. Approximately 60 key fields of information pertaining to the grinding of ceramics have been identified. The fields are divided into material identification, material
T3 CD
O
a.
on Q. £
_ l
a. CM CM CM
D_ CM CM CM
173
properties, process description, process parameters, process output, and references/comments. Approximately 300 publications were examined for completeness and applicability to the format of the database. From these publications, about 20 were selected and the data were added to the spreadsheet. This constitutes about 250 records (i.e., rows of data). This effort is still continuing, and it anticipated that the finished database will contain about 500 records including those from published literature, the data being generated in this project, other data from NIST research. Also, NIST is a one of the participating members of the DOE led IEA machining project. When available for release, the IEA project results will be a valuable source of well characterized grinding data for inclusion in the Database.
Conclusions
The results, although at this time lack the full support of a quantitative statistical evaluation, indicate for the materials under study that quite aggressive grinding conditions have little or no effect on characteristic strength when grinding is parallel to the tensile axis. It is likely that this result will also hold true for may other silicon nitrides having similar microstructures, but not necessarily all silicon nitrides.
Not unexpectedly, however, when grinding was perpendicular, or transverse, to the tensile stress axis, a reduction of 25-30% in characteristic strength was observed. An important finding was that, within the range of grinding conditions studied, this reduction in strength was not significantly influenced by fairly large changes in grinding condition. Under carefully controlled laboratory conditions, with grinding done by a single machine and the expected reduction in data scatter, it is likely that the effects of different grinding conditions could be observed. In other studies at NIST it has been shown by using appropriate grinding conditions and finer grit wheels that flexure strength values in transverse grinding approach those for longitudinal grinding.
Within the range of grinding conditions studied, the influence of grinding condition on surface roughness was small but could be distinguished when the least severe condition was compared with the most severe condition. In this case, the least severe condition resulted in a smaller roughness value than the most severe condition.
Utilizing a block and ring test under boundary lubrication conditions, the wear rate for SRBSN surfaces ground under the most severe condition was marginally higher than it was for surfaces ground under the least severe condition. For surfaces ground under the most severe condition it also appeared that the wear rate was greater when sliding was parallel to the grinding direction than when sliding was perpendicular to the grinding direction. In these experiments it was also shown that the wear rate for a polished surfaces was less than for ground surfaces.
With respect to practical applications, the results point out the importance of considering the relationship of the grinding direction to the directions of the principal stress axes that may be experienced by the part being manufactured. Orienting the grinding direction parallel to the axis of greatest tensile stress could offer a considerable benefit, since this could allow more aggressive grinding and higher removal rates than would normally be employed. Finally, the fact that grinding was carried out under
174
conditions that are typical of those found in existing industrial and commercial machining facility lends credibility to the use of the data in that kind of environment.
Status of Milestones
1. Evaluate the test results on fracture strength and surface roughness and develop guidelines for grinding optimization of selected materials (12/1/94 completed)
2. Issue a final report on evaluation of machining damage by thermal wave and ultrasonic techniques (2/1/95 completed)
3. Select three other types of ceramics for the next phase of the project and arrange for the billets from consortium members (4/1/95 completed)
4. Add recent data to the database and arrange for testing of the prototype by the consortium members (8/1/95 completed)
Publications
1. L. Wei, H. H. Xu, and S. Jahanmir, "Evaluation of Thermal Wave Imaging for the Detection of Machining Damage in Ceramics," NISTIR 5645, National Institute of Standards and Technology, March 1995.
2. T. Strakna, S. Jahanmir, R. Allor, and K. Kumar, "Effect of Grinding on Strength of Silicon Nitride," Technical Papers of the North American Manufacturing Research Institution, Society of Manufacturing Engineers, pp. 85-90, 1995. (Paper No. MR95-138).
3. T. Strakna, S. Jahanmir, R. Allor, and K. Kumar, "Influence of Grinding Direction on Fracture Strength of Silicon Nitride," Machining of Advanced Materials, S. Jain and D.C.H.Yang (Eds.) AMD-Vol. 208, pp. 53-64, American Society of Mechanical Engineers, 1995. Also accepted for publication in./ Eng. Materials and Technology.
4. H. H. Xu, L. Wei, and S. Jahanmir, "Effect of Grain Size on Grinding Damage in Alumina," accepted for publication in the Journal of the American Ceramic Society.

175
Chemically Assisted Machining of Ceramics WBS Element 1.5.0.3 (SC-G) S.M.Hsu, Y.Wang, R.S.Gates and T.N.Ying (National Institute of Standards and Technology)
Ohjective/Scope
The machining of ceramics is very difficult and costly because ceramics are hard, wear-resistant, and chemically stable, even at high temperature. The ceramics industry has identified the lack of a rapid low cost ceramic machining technology as a major barrier for widespread use of ceramics. Current machining technology is slow and labor intensive. Residual surface damage is a primary concern. This project aims to increase the macWning rate of ceramics by using chemical reactions at the interface. The chemical reactions at the interface produce a reaction layer that may function in several ways. It may behave as a lubricating layer, barrier film, passive protective film reducing the wear of the diamond, or it may reduce the contact stresses, therefore minimizing the surface damage. Si3N4 is the main material of focus.
The project involves several subtasks including:
1. Develop a bench test simulation to allow screening of chemistries under well-controlled conditions.
2. Identify new chemistries that can significantly improve the macWning rate of ceramics, especially for silicon nitrides.
3. Provide understanding on the working mechanisms of the chemistries identified and develop correlations with the surface quality of the machined surface.
4. Establish limits of performance and applicability of the chemistry on different material compositions and processes. Establish optimum machining conditions for each chemistry/material combination.
5. Examine the environmental impact of the chemistry and work with industrial partners to optimize the chemistry and validate the concepts and methodology in industrial practice.
Technical Highlights
Previously, we have discussed the development a wheel-print method by which the wear of the diamond wheel can be measured and the G ratio (volume of silicon nitride material removed/volume of diamond wheel worn) can be calculated. This technique was used to evaluate the relative grinding performance of a commercial fluid and several experimental fluids using a surface grinder. We also reported that a vertical grinder loaned to us by Kennemetal was set up and instrumented to evaluate developed coolants using a test procedure designed to measure the material removal rate and G ratio for this configuration. Testing has continued using the vertical

176
grinder to demonstrate the improvement in grinding rate and G ratio for our experimental grinding coolants. We have also examined the performance of an experimental fluid for grinding cemented tungsten carbide using a metal-bonded diamond wheel on the vertical grinder. An experimental coolant formulation has been optimized in preparation for a field trial by Kennemetal. A 100 gallon sample of the experimental fluid was blended and sent to them for testing.
The vertical grinder lent by Kennemetal, and instrumented to measure wear and friction during operation, is shown schematically in Figure 1. Sensors mounted on the sample holder allow continuous monitoring of applied normal force (Q, tangential (friction) force (ft), and sample displacement (wear) during a test. An example of the type of data obtained with this apparatus is shown in Figure 2 for a commercial coolant with silicon nitride. Initially, material removal rates are high. Grinding rates quickly diminish to low values. In contrast, an experimental coolant (Figure 3) maintains higher grinding rates throughout the test. The experimental coolant removes silicon nitride approximately four times faster than the commercial coolant under the conditions of this test.
The G ratio is defined as the ratio of volume of material removed by grinding / volume of diamond wheel worn. Wear of the diamond wheel is estimated by taking a print of the diamond grinding wheel before and after a test. By measuring the amount of wear using a surface profilometer, the G ratio is calculated. The experimental coolant has a G ratio of approximately 40, a factor of five increase over the commercial fluid (G ratio = 8).
Based on the positive results demonstrated by our experiments, Kennemetal has offered to conduct field trials using our most promising coolant. Besides needing a large quantity of coolant (100 gallons), several other practical aspects must be considered for use and handling of a coolant. Viscosity, volatility, flammability, corrosion potential, and foaming tendencies are all important to the successful operation of a coolant in field use. In addition, health and safety aspects must be evaluated. The ability to support biological growth (bacteria and fungi) is an important practical consideration for long term storage and use of a coolant; therefore, biocides are often used to inhibit growth. The experimental fluids used for our tests originally did not have biocides or corrosion inhibitors and were not optimized for these practical considerations. The issue of corrosion inhibitors is especially important since these compounds are often surface active and could have antagonistic interactions with the surface active chemistries of our coolants. We set out to optimize the coolant formulation to have the desirable properties of a practical coolant, and still maintain the chemically enhanced machining rate for silicon nitride ceramics. We also evaluated the sensitivity of the experimental coolant to water contamination.
Effect of Water Contamination
The issue of grinding performance of the experimental fluid over a long time is important. A sample of the experimental grinding fluid was used, stored for one month, and reevaluated. The results of the tests are summarized in Table 1. The initial grinding experiment removed 277 mm3
silicon nitride during the test. The same fluid, after one month, removed 288 mm3 silicon nitride

177
from a similar sample. The results suggest that the grinding ability of the experimental fluid is stable over time.
Table 1. Grinding Performance of Experimental Fluid with Time
Fluid
Experimental Fluid, new
Same Fluid, after one month
Volume of Silicon Nitride Removed, mm3
277
288
Another important practical aspect of a coolant is the sensitivity to water contaminants. Previous results suggested that water can have a detrimental effect on the wear of diamond and therefore reduce the grinding rates for silicon nitride. The fluid developed at NIST is thought to function, in part, by protecting the diamond surface from chemical attack by water. A grinding experiment was therefore conducted using the experimental coolant intentionally contaminated with 10% water-based coolant. This simulated a worst-case scenario that might occur during a changeover from a water-based commercial fluid to the experimental fluid without a coolant flushing procedure. The results, summarized in Table 2, indicate that the water contamination did not immediately affect the grinding performance of the experimental fluid. Another grinding test was conducted after one month. The amount of silicon nitride removed during this test had decreased to 230 mm, a change of approximately 17%.
Table 2. Grinding Performance of Experimental Fluid Contaminated with Water-Based Coolant
Fluid
Experimental Fluid, new
Experimental Fluid, contaminated with approximately 10% water-based coolant
Same Fluid, used, after one month
Volume of Silicon Nitride Removed, mm3
277
280
230
While the performance of the experimental fluid is still much higher than the commercial fluid, the results indicate that avoiding contamination of the experimental grinding fluid with an aqueous-based coolant would be desirable. As a result, we will provide sufficient test fluid for Kennemetal to flush the system before field evaluation.

178 Coolant Development
The coolants evaluated on our bench scale were formulated with pure paraffinic compound diluents. On a large industrial scale, the use of these compounds is not economical; therefore, other alternative base fluids were sought for the large scale blend of the experimental coolant. Additives such as corrosion inhibitors and biocides were also evaluated for their effect on the chemically assisted macWning of silicon nitride ceramics. The corrosive nature of the coolant was also evaluated both with and without corrosion inhibitors.
Ten base fluids with appropriate characteristics (viscosity, volatility etc.) were studied as potential diluents for the field trial. These included paraffinic light oils, hydrotreated stocks, polyalfaolefins (PAO's), and naphthenic oils. Tests were conducted using the diamond wheel cutting apparatus used in our previous screenings and also the surface grinding apparatus. A suitable diluent was selected based on these results and sufficient quantity was obtained for a 100 gallon blend of experimental coolant.
If coolants are used over a long time, bacteria and fungus may grow and thrive. This poses not only a possible health hazard, but also could clog the coolant delivery system, resulting in considerable down time of the equipment. Coolants are therefore normally formulated with a biocide to prevent the development and growth of fungi and bacteria. Most biocides used in coolants contain significant amounts (« 20%) of water. It has already been demonstrated that water can decrease the effectiveness of the experimental coolant over a long time; therefore, we did not want to add it to the formulation intentionally. A biocide was obtained that contained only 1 % to 2% water. It was formulated into our experimental coolant at the high end of the treat rate recommended by the manufacturer to evaluate the effect of the biocide on grinding performance. A series of grinding tests conducted on the formulation containing the biocide reduced the grinding rate by approximately 15%. In order to reduce the effect of the biocide on grinding performance, it was treated with a molecular sieve to remove water, and reformulated at one third the previous concentration in the experimental fluid. This treat rate is still well within the manufacturers recommended treat rates for this biocide.
The issue of corrosion was addressed using cut pieces from an actual metalbonded wheel supplied by Kennemetal. A simple laboratory corrosion screening procedure was used to evaluate the corrosion tendencies of the coolant on the wheel. The screening procedure was based on industrial feedback. A sample of a metalbonded diamond wheel was cut into coupons and polished. Samples of NIST coolant were formulated with a corrosion inhibitor at 0, 0.5, 1.0, and
£»—C%-Ctf. 1 * — 1 _ * E C I ^ . . , ^ . ■<..,1 U « . « U U , . . W . A . A „ ^ 1 W U « — d ^ o A / l — i » » — ± l - » - a — X I X G n C r».«wvlrtt»+ A v n n a a / 1 */v n
182
Commerical coolant
150

183
Developed coolant
150
120
90
<D O u o 60
30
0
10
k8
16
M
0
Time (second)
Figure 3. Vertical grinding data for silicon nitride ceramics using the NIST experimental coolant.

184
Figure 4. SEM micrograph of a metal-bonded diamond grinding wheel cross section (cut and polished) after dipping in NIST coolant and exposure to laboratory atmosphere for 30 days. Marker in lower right corner is 100 /j.m.

185
Material: WC, Grinding Speed: 25 m/s, Normal Load: 40 N
6 -
o 'S. Q jo
CO 2 -
0
Contact area 5 x 5 mm'
Contact area 5 x 10 mm'
NIST Coolant
0 15 30
Time (second)
45 60
Figure 5. Comparison of grinding performance as a function of time for two coolants.

186
350 Material: WC, Grinding Speed: 25 m/s, Normal Load: 40 N
300 -
250
a •i 200 > is 3 150 -I T3 > I 100
50 -
0
NIST Coolant Commercial Coolant
10
Contact Area (x 5 mm )
Figure 6. The influence of contact area on material removal for two coolants.

187
50 Material:WC, Grinding Speed: 25m/s
a o > B o 0)
40
30 -I o >
1 20
T3 0) > 1 10 -
0
NIST Coolant Commercial Coolant
Contact area 5x10 mm2
m
Contact area 5 x 5 mm'
20 40
Normal Load (N)
Figure 7. The influence of contact area on "G ratio" for two coolants.

188
Laser Scatter Methods for Detecting Subsurface Machining Damage in Ceramics — Sanjay Ahuja, William A. Ellingson, George A. Forster (Argonne National Laboratory), Michael H. Haselkorn, and Charles J. Anderson (Caterpillar Inc.)
Objective/scope
The primary objective of this program is to develop a laser scattering procedure that would provide a direct (near-real-time) indication of changes in the subsurface (and surface) during macWning. These changes include machining-induced damage (such as median crack formation) and surface roughness. A second objective is to evaluate dye penetrant technology as an off-line indicator of surface-breaking cracks. The laser program is being executed in three steps. The first is evaluating optimization of the laser scattering procedure to examine specimens machined by innovative techniques. The second step will involve correlation of the laser scattering results with mechanical properties in "real" machined ceramic specimens. The final step will be to develop a prototype instrument to be evaluated for on-line implementation in a production environment. The investigation into dye penetrants for surface-defect detection is being conducted in three steps: review of literature, off-site visits to appropriate current users (e.g., Norton) and vendors (e.g., Sherwin, Inc.), and laboratory experiments.
Technical progress
A1. Laser Scattering
The repaired motor for the translations stages of the laser scatter inspection system (for increased inspection speed) was received and installed. Software was modified to improve sensitivity to median crack damage, which is most critical in machining damage. So far, software had been written so that the specimen could be scanned and consequent row images could be acquired. After acquisition of pixels in one row from left to right, the next row was imaged again from left to right. This had the major drawback that there was a momentary lapse in data acquisition time when a "carriage return" was conducted and the laser positioned at the beginning of the next row. In this period and the upcoming reporting period, software modification is being continued to speed up the acquisition. Software was modified to continuously scan the specimen such that if the previous row was imaged from left to right, the next row was efficiently imaged from right to left and there was no lapse in acquisition time. This has improved the speed of acquisition considerably. Although the current system allows inspection speeds 90 times greater than the previous version of the system, continuing modification of the system software should improve these speeds even further. Effort is also being focused upon acquiring a high-speed low resolution row of the image and then scanning the same row multiply to convert it into a high resolution image format.
Two etched specimen scans were obtained from UT using the elastic optical scattering.and are shown in Fig. 5. Fig. 1(a) shows the ratio image and Fig. 1(b) shows the sum image of the
April 1995 - September 1995

189
side 940W of an etched specimen. The etchant used was HF and HNO3 in the proportion of 97:3. The specimen was etched for 2 hours. The scans shown in Figs. 1(c) and (d) were 6.5x33mm at 50(im resolution. Figure 1(c) shows the ratio image and Fig. 1(d) shows the sum images of side 560 of the etched specimen. Lateral cracks are most visible in the "sum" images and median cracks are most visible in the"ratio" images.
££L xsd -;.= *
(a) (b) (c) (d) Figure 1. Elastic Optical scattering on the etched (HF: HNO3) specimen, (a) and (b) correspond to
the "sum" images and (c) and (d) correspond to the "ratio" images.
April 1995 - September 1995
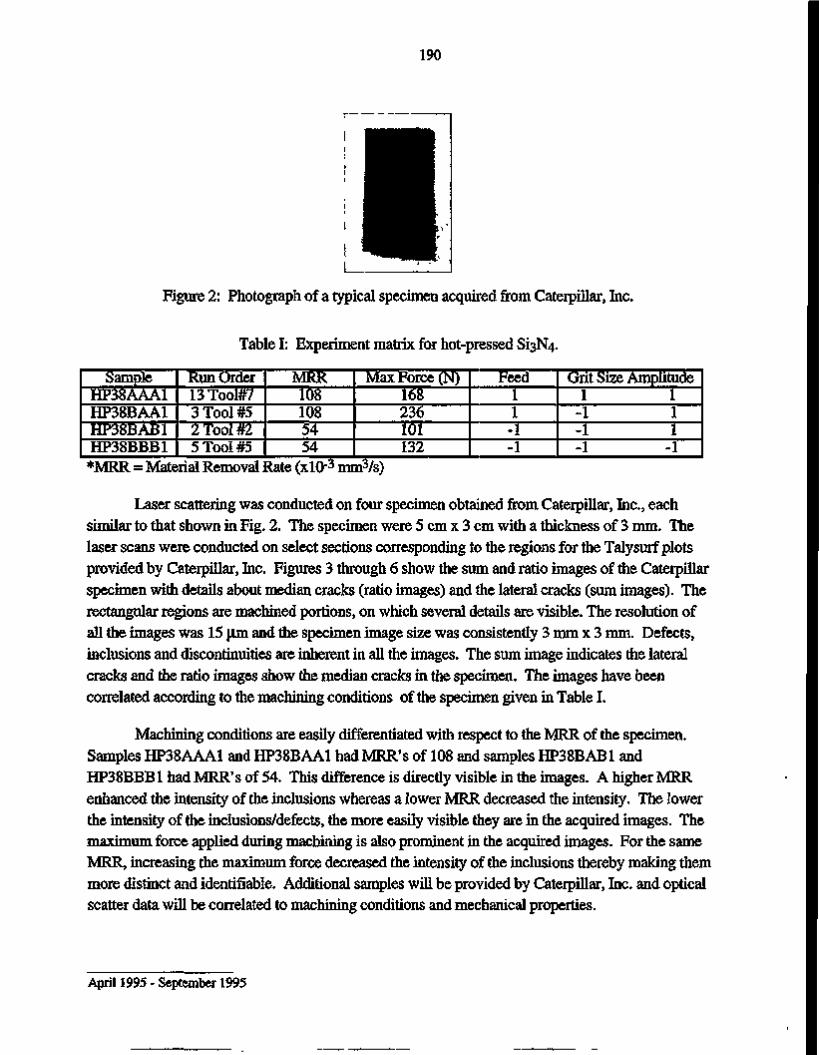
190
Figure 2: Photograph of a typical specimen acquired from Caterpillar, Inc.
Table I: Experiment matrix for hot-pressed S13N4.
Sample HP38AAA1 HP38BAA1 HP38BAB1 HP38BBB1 *MRR = Mate
Run Order 13 Tool#7 3 Tool #5 2 Tool #2 5 Tool #5
rial Removal
MRR 108 108 54 54
Max Force (N) 168 236 101 132
Rate (xlO-3 mm3/s)
Feed 1 1
-1 -1
Grit Size Amplitude 1 1
-1 1 -1 1 -1 -1
Laser scattering was conducted on four specimen obtained from Caterpillar, Inc., each similar to that shown in Fig. 2. The specimen were 5 cm x 3 cm with a thickness of 3 mm. The laser scans were conducted on select sections corresponding to the regions for the Talysurf plots provided by Caterpillar, Inc. Figures 3 through 6 show the sum and ratio images of the Caterpillar specimen with details about median cracks (ratio images) and the lateral cracks (sum images). The rectangular regions are machined portions, on which several details are visible. The resolution of all the images was 15 um and the specimen image size was consistently 3 mm x 3 mm. Defects, inclusions and discontinuities are inherent in all the images. The sum image indicates the lateral cracks and the ratio images show the median cracks in the specimen. The images have been correlated according to the machining conditions of the specimen given in Table I.
Machining conditions are easily differentiated with respect to the MRR of the specimen. Samples HP38AAA1 and HP38BAA1 had MRR's of 108 and samples HP38BAB1 and HP38BBB1 had MRR's of 54. This difference is directly visible in the images. A higher MRR enhanced the intensity of the inclusions whereas a lower MRR decreased the intensity. The lower the intensity of the inclusions/defects, the more easily visible they are in the acquired images. The maximum force applied during macWning is also prominent in the acquired images. For the same MRR, increasing the maximum force decreased the intensity of the inclusions thereby making them more distinct and identifiable. Additional samples will be provided by Caterpillar, Inc. and optical scatter data will be correlated to machining conditions and mechanical properties.
April 1995 - September 1995

191
RATIO
SUM
Figure 3: HP38AAA1 specimen. Sum and Ratio Images. 3 mm x 3 mm scans at 15 jxm resolution.
April 1995 - September 1995

192
RATIO
SUM
Figure 4: HP38BAA1 specimen. Sum and Ratio Images. 3 mm x 3 mm scans at 15 um resolution.
April 1995 - September 1995

193
RATIO
SUM
Figure 5: HP38B AB 1 specimen. Sum and Ratio Images. 3 mm x 3 mm scans at 15 um resolution.
April 1995 - September 1995

194
RATIO
SUM
Figure 6: HP38BBB2 specimen. Sum and Ratio Images. 3 mm x 3 mm scans at 15 um resolution.
A2. Automation for on-line inspection
April 1995 - September 1995

195
Future efforts are being focused on altering system magnification to improve sensitivity to lower penetration materials. In addition, alternative detection schemes are being examined to focus on specifically oriented median cracks to verify improved sensitivity. Development continues in trying to improve system speed with the current detection hardware. A third detector is being installed which will capture all specular reflections and help in separating the two components, surface and subsurface detection more precisely while giving an in situ depth of the defects.
A3. System Modification
The current laser scatter technique has proven capable of detecting subsurface (and surface) machining damage. A system modification has been implemented to improve sensitivity to subsurface median cracks without sacrificing lateral crack detection. In addition, future efforts will improve acquisition speed (by using point detectors rather than the CCD array of the current setup). Hardware for the modified system, which uses an imaging system rather than the Fourier arrangement, has been installed. For improved detection speed, the system's translation stages are being upgraded for greater velocity capabilities. The translational stages were modified to include an additional degree of freedom for increased capability in analyzing spherical specimen. Further, a motorized stage has been developed for on-line detection of subsurface defects. This stage consists of a computer-controlled highly sensitive motor driven shaft held by a bearing on the other side for minimal frictional forces and located on one of the X-Y-Z translational stages. When the laser beam is incident on a section of the shaft rotating at a high speed, acquisition is being made instantaneous and will depend upon rotation speed rather than the translational movement of the specimen under study.
B. Dye Penetrant
B1. Facility Upgrade
The new Newport-Klinger Motion Control stage received for the dye penetrant laboratory allows automated data acquisition and automated pattern recognition work has been initiated.
B2. Report
The final report for Phase I has been submitted.
B 3. Technology Transfer
The development of the initial aspects of the dye penetrant work were successfully transferred in the last period. Solar Turbines, Inc., as part of the Ceramics in Stationary Gas
April 1995 - September 1995

196
Turbine Project (CSGT), requested the information which was provided after discussion with the ORNL program manager of this project
FY 1996
Technical progress for this year will include two major concentrations. First, results of flat plate laser scatter analysis (which will continue into FY 1995) will be correlated with mechanical properties, as measured by Caterpillar. Because of the large number of possible parameters which the laser scattering technique can measure, the inspection process will be refined to determine those parameters with the greatest correlation. Second, upon determining which parameters will be of interest, the laser scatter inspection system will be modified to measure only those parameters, thereby accelerating component inspection. Future effort will focus on altering system magnification to improve sensitivity to lower penetration materials. In addition, alternative detection schemes will be examined to focus on specifically oriented median cracks to see whether this can also improve sensitivity.
In our continued work in dye penetrants, we intend to compare ASTM Level 4 high-sensitivity fluorescent penetrants for their ability to detect microcracks on various microstructure materials containing various surface machining conditions. Once we have established the exact protocol to use, i.e., time in ultrasonic cleaner, time in oven, setting time of penetrant, and best optical magnification, we will then begin to determine if automated digital imaging methods can be used to inspect components.
FY 1997
Technical progress for this year will be an extension of the technology to further modify the laser scattering system. This will involve using a tunable dye laser to increase the capability of the system. The dye laser will allow varied wavelengths of the laser beam leading to varied intensities and characterization of different microstructures in the realm of the laser scattering process. The applications of the laser scattering process will be in analyzing carbides, nitrides, and other hard materials.
FY 1998
Technical progress for this year will be concentrated on ceramic matrix composites. The main issue in the fabrication of particulate ceramic matrix composites by melt processing techniques is that of uniform distribution of particles in the solid matrix. A uniform distribution can only be achieved by controlling the particle behavior at the solid/liquid interface during solidification. In this work, an attempt will be made to extend the current understanding of particle/interface interaction. There is extensive ambiguity in quality consistency in incorporating ceramic particles in the ceramic matrix. Laser scattering of ceramic matrix composites will allow greater confidence in the quality of the composite with respect to less or no agglomeration, porosity, oxide gas entrapment, and therefore no defects. The tunable dye laser will be applied to study sub-surface defects to the order of millimeters and the technology will be implemented in to industry.
April 1995 - September 1995

197
Status of Milestones
Milestone 150701 complete. Milestone 150702 (Correlate Argonne National Laboratory (ANL) laser scatter results with Caterpillar (CAT) mechanical properties) has begun by receipt of specimen from Caterpillar, Inc. Communication continues with CAT on the delivery of additional specimens. All other ANL milestones are on or ahead of schedule.
Communications/Visits/Travel
Mark Vanroode and Bill Brentnall of Solar Turbines, Inc. visited Argonne National Laboratory.
W. A. Ellingson was invited to present the dye penetrant work to the ARPA Ceramic Program Review, Annapolis, MD, Aug. 29, 1995.
S. Ahuja presented a paper entitled "Development of Novel Laser Scattering Methods for In Situ Flaw and Damage Detection" to the Cost-Effective MacWning of Ceramic Workshop 1995, Oak Ridge National Laboratory, Oak Ridge, TN, September 1995.
W. A. Ellingson and S. Ahuja attended the Automotive Technology Development Contractor's Coordination Meeting, Dearborn, MI, October 24-27,1995.
Problems Encountered
The computer motion controller and a motor of the translational stages underwent repair and have been reinstalled in the system.
Publications
W. A. Ellingson, J. P. Singh, E. A. Sivers, J. B. Stuckey, D. Christopher, S. L. Dieckman, S. Ahuja, and D. Singh, "Development of NonDestructive Evaluation Methods and Prediction of Effects of Flaws on the Fracture Behavior of Structural Ceramics", Invited Paper, Proceedings of the Ninth Annual Conference on Fossil Energy Materials, Oak Ridge National Laboratory, Oak Ridge TN, May 16-18, 1995.
April 1995 - September 1995

198
Milestone Schedule
Determine optical properties of SiAlON and GS-44 for optimum optical detection parameters (polarization, wavelength, angle of incidence, etc.). Completed Feb. 28, 1994
Conduct exploratory studies of dye penetrant on machined surfaces. Completed May 31,1994
Submit report on dye penetrants. Completed Dec. 1,1994
Correlate laser scatter analysis (ANL) of contoured specimens with mechanical properties, residual stress measurements, and mechanical surface roughness measurements (CAT). Feb. 29, 1996
Develop a protocol to use the dye penetrant technology April 30,1996
Correlate laser scatter results (ANL) with mechanical properties (CAT) May. 28, 1996
Install and demonstrate prototype laser
scatter device. Aug. 31, 1996
Submit topical report on dye penetrants. Sept. 15, 1996
Modify the laser system with a tunable dye laser to increase applications March 30,1997 Complete study of carbides, nitrides and other advanced ceramic materials Sept. 30, 1997
Complete study of ceramic matrix composites and transfer technology in to industry. Sept. 30, 1998
April 1995 - September 1995

199
1.5.2 Advanced Ceramic Manufacturing Technology
W.B.S. 1.5.2.0 Advanced Manufacturing Technology for Ceramic Heavy Duty Diesel Turborotors
E. Kraft, Kyocera Industrial Ceramics Corp. S. Roby, Schwitzer U.S., Inc. J. McCornack, Caterpillar, Inc.
Objective / Scope
The objective of this program is to develop the cost effective manufacturing technology required for ceramic turbine rotors for use in turbochargers for heavy duty diesel truck and bus applications. A team, led by Kyocera (KICC, the ceramic component manufacturer) and including Schwitzer U.S., Inc. (the turbocharger manufacturer) and Caterpillar, Inc. (the diesel engine manufacturer) will develop and demonstrate production readiness for reliable, cost affordable turbochargers with ceramic turborotors. Program goals include a nominal order of magnitude reduction in cost over the present cost for small quantities, and process capability for critical component attributes which is adequate for the performance and reliability specifications of the application. Silicon nitride, SN 235, is the material of choice for this application. Program goals are to be achieved utilizing Kyocera's production proven Hybrid Molding, gas pressure sintering and cylindrical grinding processes. Yield, quality and cycle time improvements will be achieved through process modeling, statistical process control and intelligent processing.
Technical Highlights
Task 1 Component Design and Specification
Discussion has continued at Schwitzer and Caterpillar on final selection of the application and turbocharger model and design for production. Caterpillar has selected a new version of the 3176 engine, to be released in 1996, for application of the ceramic turborotor. This new version incorporates the most advanced engine control technology as well as other improved design features. Discussions are also being held between Schwitzer and Kyocera regarding design details for reduced manufacturing cost. Effort is now beginning on design of a rotor for this application, and will be followed by design of the mold for the second process demonstration. Design discussions regarding fixturing for shaft attachment trials by friction welding has also begun.
Task 2 Component Manufacturing Technology Development
Task 2.1 Cost Model
Following the processing of three rotor lots in the first process demonstration, the cost model was again revised to reflect this learning in the baseline prototype case. A base case, three cases reflecting cost reduction scenarios, and a case combining all three cost reductions were constructed. Three observations can be made from these case studies: 1. For producing prototype rotors, the material cost is relatively small. 2. The cost is very sensitive to the number of lots produced, and how they may be combined in some
unit operations. 3. As process yield improves, inspection cost becomes the dominant cost.
Model configuration for full production has also been completed. Data and estimates for production of up to 1500 rotors per month has been collected, entered and analyzed. Comparison of prototype and production cost are shown in Figure 1 for all operations excluding rotor/shaft attachment. In each scenario, a base case and an improved case are shown. For production, the improvements identified to date represent a 40% reduction in cost from the production base case, and a 93.6% reduction from the prototype base case. As a result of analysis of the production base case, four
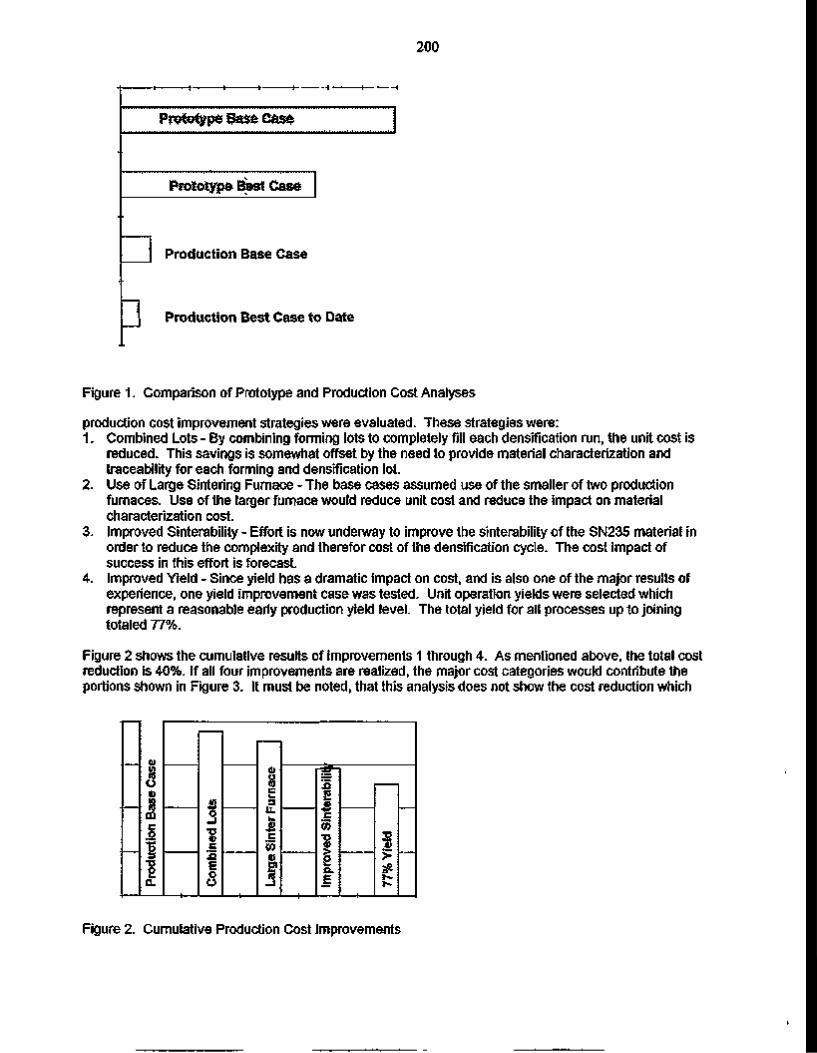
200
Prototype 8ai$e C&sfe
Prototype Best Case
Production Base Case
Production Best Case to Date
Figure 1. Comparison of Prototype and Production Cost Analyses
production cost improvement strategies were evaluated. These strategies were: 1. Combined Lots By combining forming lots to completely fill each densification run, the unit cost is
reduced. This savings is somewhat offset by the need to provide material characterization and traceability for each forming and densification lot.
2. Use of Large Sintering Furnace The base cases assumed use of the smaller of two production furnaces. Use of the larger furnace would reduce unit cost and reduce the impact on material characterization cost.
3. Improved Sinterability Effort is now underway to improve the sinterability of the SN235 material in order to reduce the complexity and therefor cost of the densification cycle. The cost impact of success in this effort is forecast.
4. Improved Yield Since yield has a dramatic impact on cost, and is also one of the major results of experience, one yield improvement case was tested. Unit operation yields were selected which represent a reasonable early production yield level. The total yield for all processes up to joining totaled 77%.
Figure 2 shows the cumulative results of improvements 1 through 4. As mentioned above, the total cost reduction is 40%. If all four improvements are realized, the major cost categories would contribute the portions shown in Figure 3. It must be noted, that this analysis does not show the cost reduction which
U) :5 0) to ra 03 e .2 "5 3 T5 2
tfl O _ l •a o> c XI E o o
o «o c 3 UL
c W m E? <3 _ i
2 w S JZ. W
t g a. E
■D
>
Figure 2. Cumulative Production Cost improvements

201
would result from the reduced inspections permitted by the forming improvements being investigated. The large portion of cost contributed by inspection was forecast early in this program, and is the reason for the heavy emphasis on forming process understanding and control. The second largest contributor in this figure is grinding. This estimate includes the assumption of a new machine tool for flexible manufacturing of rotor components. While the specifications for this machine have not been established, the costs are based on experience with other production situations. The relatively high cost of raw materials shown in this analysis has led to a new effort in evaluation of alternative sources.
Raw Material Forming
Figure 3. Major Cost Contributions in Ceramic Rotor Production
Since ceramic rotor cost and joining cost are relatively independent, these are being analyzed separately. Production cost for the joining operations is estimated at 10 to 15% of the "Best Case to Date" shown above. While this represents a reduction of cost of 85% of the prototype cost, it would still represent a substantial portion of the target cost.
As a result of these analyses, major cost objectives confirmed or established at this point in the program are as follows: I. Raw material cost reduction - Evaluate alternate, lower cost sources. II. Improved yield in forming - Process modeling and control; in-process sensors. III. Reduced dewax and sinter cost
A. Implement reduced dewax cycle time B. Improve sinterability through improved raw material mixing C. Reduce sintering cycle time through process control
IV. Reduce grinding cost - Develop new machine specification; reduce grinding steps; reduce grinding stock.
V. Reduce inspection Cost - Reduced x-ray inspection due to low ppm voids; rationalize inspections and tests to eliminate duplicate assurances of quality.
Task 2.2 Environmental Safety and Health
All air emissions questions from the air pollution control agency have been addressed; no emissions issues related to this program remain. Solid waste disposal testing on sintered rotors has been conducted. Leachate, solvent scan and fish toxicity testing was conducted with satisfactory results. This concludes all testing required and planned for this program. Continuing activities will include periodic voluntary visits by State safety and industrial hygiene consultants, and assessments of plant emission control capacities as activity expands.
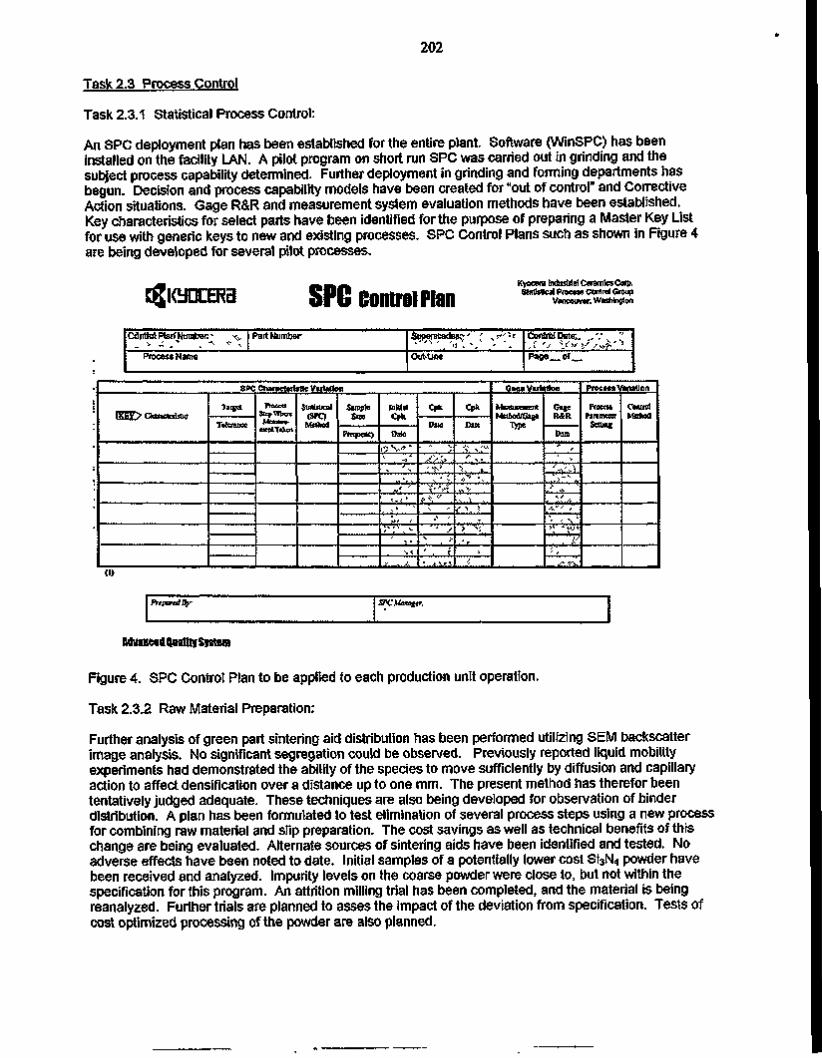
202
Task 2.3 Process Control
Task 2.3.1 Statistical Process Control:
An SPC deployment plan has been established for the entire plant. Software (WinSPC) has been installed on the facility LAN. A pilot program on short run SPC was carried out in grinding and the subject process capability determined. Further deployment in grinding and forming departments has begun. Decision and process capability models have been created for "out of control" and Corrective Action situations. Gage R&R and measurement system evaluation methods have been established. Key characteristics for select parts have been identified for the purpose of preparing a Master Key List for use with generic keys to new and existing processes. SPC Control Plans such as shown in Figure 4 are being developed for several pilot processes.
$i<yni:ERa SPC Control Plan Kyocera Industrial Ceramics Corp. Statistical Process Control Group
Vancouver, Washington
CdnttolPlanTNumban ^v Part Number
Process Name
Superscedss^"' { ..r '/<
OutLine
ConlfolOate;, ,'; "
Page of
SPC Characteristic Variation
IKEY> Characteristic Target
Tolerance Step When Measure
ment Taken
Statistical tSPQ
Method
Sample Size
FrcqnctK>
Initial Cptt
Dale
i') Nv* *
.,'.'. • ^'-\
;*;\ >. ' ,.
\ . t
,.?.„,.■../*,„
Cpk
Date
/> U ■ " ■ > '
v ' . ' i "
* V
<■' '
' ' s s >
; « , ^ t
Cpk
Date
' 'v •?* •" ^ ,
>, «"» K
v , V
•A A v
<..\.>. . > \
I
Gape Variation
Measurement Method/Gage
Type
Gage R&R
Date ■ " ,
' y
"r'A ">" N , . ,
, "A./, /..v/ ,"
><• •<<>. >/
',', _ . . ^ . . &
Process Variation
Parameter Setting
Control Method
(J)
Prepared By SPC Manager.
fltJvanceU Quality System
Figure 4. SPC Control Plan to be applied to each production unit operation.
Task 2.3.2 Raw Material Preparation:
Further analysis of green part sintering aid distribution has been performed utilizing SEM backscatter image analysis. No significant segregation could be observed. Previously reported liquid mobility experiments had demonstrated the ability of the species to move sufficiently by diffusion and capillary action to affect densification over a distance up to one mm. The present method has therefor been tentatively judged adequate. These techniques are also being developed for observation of binder distribution. A plan has been formulated to test elimination of several process steps using a new process for combining raw material and slip preparation. The cost savings as well as technical benefits of this change are being evaluated. Alternate sources of sintering aids have been identified and tested. No adverse effects have been noted to date. Initial samples of a potentially lower cost Si3N4 powder have been received and analyzed. Impurity levels on the coarse powder were close to, but not within the specification for this program. An attrition milling trial has been completed, and the material is being reanalyzed. Further trials are planned to asses the impact of the deviation from specification. Tests of cost optimized processing of the powder are also planned.

203
Task 2.3.3 Slip Preparation:
Domestic sources of binder system constituents are being investigated in order to reduce cost and improve delivery. One lot of test plates using these binders was hybrid molded using forming parameters with the standard procedure. Visual and x-ray examination of the green plates showed a high yield, comparable with that using binders from the standard vendors. Initial tests were inconclusive due to an insufficient database on the conventional materials to permit accurate statistical analysis. An additional lot of material will be made using the domestic binders, and one using the conventional binders. MOR testing on these lots will provide the additional data required. Using the slip constituent analyses, and slip property analyses previously performed, modified slips were prepared for further process demonstration lots. The objective of these modifications was reduced viscosity and improved green strength. Modification of the solids content and binder system composition provided three levels of viscosity and an improved green strength. Results are reported below under Task 4.
Task 2.3.4 Forming:
Work on creating an analytical model of the hybrid molding process has progressed in the following subtasks, with Technalysis, Inc. as subcontractor for the FEM model development.
Subtask 3. 3-D Filling Analysis - The forming conditions used in the previously reported experimental forming trials were used in an additional model analysis. Initially, this analysis did not show the lack of blade fill observed experimentally. Since a method of obtaining useful measurement of the mold-slip heat transfer coefficient has not been found, sequentially higher coefficients were used until correlation with experiment was obtained. The resulting analysis showed incomplete blade fill similar to that observed experimentally.
Subtask 4. Solidification Analysis - The solidification fronts for the case corresponding to incomplete blade fill were then studied. In addition to confirming solidification prior to blade fill, the model also indicates the possibility of a solidification defect in the center of the hub. This defect was subsequently observed by x-ray NDE in a small percentage of the rotors formed. The conditions under which this defect occurs are being investigated.
Subtask 5. Model Iteration - All tasks for development of the process model have been completed. The model is being used to forecast results of forming trials using operating parameters from the process demonstration. Mold filling has been simulated for two values of forming pressure, with two variations in molding hardware configuration. These hardware configuration changes were made in an attempt to correct the lack of blade tip filling. According to this simulation, one change reduced mold fill time by a factor of five, but did not produce filling of the blade tips. The simulations did, however, show combinations of configuration and operating parameters which eliminated or minimized other forming defects.
The model was next used to perform a non-isothermal filling analysis using data on forming conditions utilized in the process demonstration. The analysis gave results consistent with experimental results on conditions required to avoid the backface voids caused by a filling "fountain effect" seen in previous simulations. In addition, this simulation showed the sequence of filling and solidification leading to incomplete blade fill. Figure 5 shows the progression at three time steps. Solidification at the hub between blades is evident. In addition, the sequence illustrates initial solidification in the thin exducer portion of the blade while filling is still occurring, leading to "choking" of the material flow.
The model was next improved with the inclusion of data on temperature dependence of slip viscosity and thermal conductivity which was received during this period. The non-isothermal filling analysis was repeated to verify the mold-cavity interface heat transfer coefficient. Fill time was affected by this refinement due to the higher viscosity on cooling. The amount of non-filling remained approximately the same, validating the heat transfer coefficient.

204
.1 Figure 5 Time steps in non-isothermal filling.
Task 2.3.5 Drying: Effort on this operation has been postponed due to it's low contribution to cost.
Task 2.3.6 Binder Removal Investigation:
Seven lots of parts have been processed as reported in Task 4, using the baseline profile. No yield loss was observed, confirming capability of the baseline process. Using data from earlier in-situ analysis, a reduced cycle time profile has been devised. Parts from the same lots have been set aside and an evaluation run scheduled.
Task 2.3.7 Sintering Investigation:
Effort in sintering during this period was focused on processing parts according to the standard procedure for the initial process demonstration. No significant problems due to sintering were encountered requiring investigation. Efforts to simulate the production process in a laboratory furnace were unsuccessful due to scaling factors. Indications of improved properties during some slip preparation and forming trials suggests that improved sinterability may result from modifications to the raw material mixing and slip preparation processes. Future experiments are planned to explore the effect of such modifications on sinterability and resultant mechanical properties.
Task 2.3.8 Grinding:
Data from grinding trials on rotors from the initial lots of the process demonstration showed that no significant barriers exist to achieving dimensional or surface finish requirements. Cost reduction is planned through use of formed wheels, grinding parameter changes and reduced rework through experience. Cost reduction opportunities identified to date are expected to reduce grinding time by over 74%. Effort on confirmation of the cost reductions identified will be conducted during the second process demonstration. Discussions have continued on additional cost reduction through identification and specification of alternate machine tools, and elimination of grinding operations.
Milestone 3 was "Implementation of in-process dressing and dimensional inspection". It has been found that electrolytic in-process dressing (ELID), while very effective for flat grinding wheels, is not practical and therefor cost effective for formed grinding wheels. Since it has been determined that significant cost reduction is available through use of formed wheels, application of ELID has been canceled. The use of in-process dimensional inspection is still a viable cost reduction strategy. However, selection of the best measurement tools and methods has been postponed until the alternate machine tools are specified, and operations to be eliminated finalized. These operations will be determined during the design phase of the second process iteration.
Task 2.4 Intelligent Processing
Since it has been confirmed that bubble detection in slip preparation is unnecessary, work on ultrasonic bubble detection is concentrated on its application in the hybrid molding machine at a location just before

205
the slip enters the mold. Sonoscan has acquired a Waveform Digitizer in order to automatically acquire data and perform spectrum analysis on the captured waveform. The board offers high resolution waveform capture at high speeds, with a signal bandwidth from dc to 30 Mhz. Research on frequency dependent scattering loss has been conducted. The 1/4 wavelength cutoff frequency of strong frequencydependent scattering loss has been confirmed using 50 and 100 um glass beads in water and oil. The transducers used were 5 Mhz for 100 um beads and 10 Mhz for 50 um beads.
As previously reported, the absorption attenuation of ultrasound propagating in hybrid molding slip is a 1.55 power of the frequency. The absorption attenuation has been calculated for the case of a 100 um void, using a 5 Mhz transducer, and a propagation distance appropriate for application to the injection portion of the hybrid molding machine. The required input filter and acoustic pump, and receiver gain were determined which would bring the signal to a manageable level.
The center frequency of the acoustic transducer was selected to be 3.5 Mhz with a 10dB bandwidth of about 5 Mhz in order to be able to detect 100 um bubbles. With the high attenuation measured in this material, the propagation distance of ultrasound is limited to 1/2 inch maximum. To maintain flow and pressure in the molding system, a rectangular cross section pipe of appropriate width and depth was designed to incorporate a 5 element cascade transducer. The elements will be adhered to a MACOR delay line with a cooling device to protect the transducers from overheating. The electronic boards have been modified to match the designed transducer, with a center frequency of 3.5 Mhz. The gated RF card was modified to provide gate position and width adjustment. A software program was developed to evaluate the Waveform Digitizer. Difficulty in translating source code is being resolved.
A Signatec DA 60 waveform digitizer was tested for frequency resolution using a fluid suspension of 50 um glass beads. Resolution of 0.977 Mhz per pixel was judged as too coarse for the requirements of this application. A custom board was then modified and similarly tested, using a Hewlett Packard 8591E portable spectrum analyzer for comparison. The custom card achieved 0.244 Mhz/pixel, which was judged adequate pending further evaluation. In addition, the data processing time was superior to the HP unit. The stability and reliability of the custom board was then tested by repeated analysis of a similar suspension. The five analyses gave essentially identical results, and the noise level was below 0.03 dB. This board was therefor judged as meeting specification.
In order to detect and measure bubbles in the hybrid molding slip, it is necessary to have a transducer with a wide band width. However, the severe attenuation in this slip at high frequencies limits the useful range of band widths. Available transducers have narrow band widths so that a new transducer needed to be designed. Separate transducers in the 1 to 10 Mhz range were used to acquire and analyze spectrum information on a simulated slip using 100 um glass beads. The data, Figure 6, shows a noticeable increase in scattering loss at a quarter wavelength around 110 um, which confirms the underlying principle. A lithium niobate transducer was then designed with a fundamental frequency around 3.5 Mhz, a third harmonic at 10.5 Mhz, and a fifth at 17.5 Mhz. Testing of this transducer, with a MACOR delay line confirmed the expected increase in scattering loss at quarter wavelength.
" W w m w / w w / W v ' A w ^ swss VWW v*Mf* f f f r r, > f
<> * <■ -'>•■ a * wv v* ■«
Figure 6. Combined signals of a transducer array confirms the principle of increased scattering loss at a quarter wavelength equal to the bubble size.

206
Task 3 Inspection and Test
The rotor inspection plan has been completed and established as a controlled process. The procedures for ultrasonic inspection of the electron beam weld have been qualified at both internal and vendor facilities. Likewise, the technique for ultrasonic inspection of the braze joint has been established. Techniques for rotor inspection using fluorescent penetrant, x-ray radiography, ultrasonics and coordinate measurement machine techniques have been established. Inspection of rotors produced in the process control and process demonstration tasks is now routine. Metallographic examination of the weld heat affected zone has shown no microstructural degradation, so that continuing inspection is not required. Push and cantilever bend test fixtures and techniques have been established for testing of braze joint strength, and testing of braze joint strength has confirmed the reliability of the ultrasonic inspection.
Task 4 Process Demonstration
Three lots of rotors were processed to completion, including binder removal, sintering and grinding of a limited number of rotors. All rotors in these three preliminary lots contained one or more defects, including incomplete blade fill, inclusions, voids, knit lines and two types of cracks. The predominant crack is associated with the backface knit line previously discussed as being caused by a "fountain effect" in molding at high fill rates as predicted by the Technalysis model. A corrective action plan was developed to address all defects, and additional forming trials conducted. Control methods were established for all defects except incomplete blade fill. Two additional approaches to blade fill were devised, and four additional lots of rotors were processed to test these approaches. Two lots with reduced viscosity were formed, and the forming parameters for complete blade fill identified. The fourth lot utilized a slip formulated for increased green strength to allow a more robust process. 90% blade fill was achieved with this slip, and a wider range of operating parameters demonstrated with no other forming defects. One concern identified during this investigation was the fired strength of parts formed with these modified slips. Test bars were therefor cut from three of these lots and tested at room temperature and 950°C. Results from this limited testing indicate that strengths are at least as high as baseline material. A final lot was formed which incorporated all advances in slip composition and forming parameters. Forming conditions were identified which produced approximately 95% blade fill. Use of conditions which produced complete blade fill unfortunately produced one or more of the other defects previously encountered. The information produced in this process demonstration will be used to design the rotor and mold for the second process demonstration. It is expected that this rotor will have blades of sufficient thickness to avoid the fill problem.
While the braze and electron beam weld processes used in production rotor fabrication have proven reliability, concern for cost has prompted a further evaluation of alternatives to the present weld. Candidate processes are lower cost electron beam welding techniques, laser welding and friction welding. Discussion with experts and potential vendors for these processes has begun.
Status of Milestones
Milestone 1, Design Package, was completed and submitted on time. The design package was approved. Milestone 2, Process Improvement Goals, has been submitted based on the initial process demonstration effort. Milestone 3, Implementation of Grinding Process Control, has been deferred as discussed in Task 2.3.8; a redefinition and completion date for this milestone is pending.

207
W.B.S. Element 1.5.2.1 DEVELOPMENT OF
ADVANCED CERAMIC MANUFACTURING TECHNOLOGY
E. Bright, C. Burk, J . Eckalbar, T.P. Leo B.J. McEntire - Norton Advanced Ceramics R. Begin, Y. Kalish - Detroit Diesel Corporation
M. Hauptman, L.E. Mains - Deco Technologies, Inc. M. Tricard, J. Picone, R. Ramanath - Norton World Grinding Technology Center
C. Miller - Centorr/Vacuum Industries V.K. Pujari, W.T. Collins, R.L. Yeckley - Saint-Gobain/Norton Industrial Ceramics Corp.
T. Zahrah, S.D. Hollo - MATSYS J. Busch, A.E. Mascarin - Ibis Associates
D. Wittmer - Wittmer Consultants
Report Prepared by Eric Bright
Saint-Gobain/Norton Industrial Ceramics Corporation Norton Advanced Ceramics
10 Airport Park Road East Granby, CT 06026
Objective/Scope
The objectives of this program are to design, develop, and demonstrate advanced manufacturing technology for the production of ceramic exhaust valves for a diesel engine. The ceramic material for this program is Norton Advanced Ceramic's NT451 SiAION, and the component to be developed and tested is the exhaust valve for DDC's Series 149 engine. Specific objectives are to: (1) Reduce manufacturing cost by at least an order of magnitude over current levels; (2) Develop and demonstrate process capability values (Cpk) of 1.4 or greater for all critical component attributes; and (3) Validate the performance, durability, and reliability of this ceramic valve in rig and engine testing.
Technical Highlights
Task 1 - Component Design and Specification.
Task 1a - Preliminary Design.
During the previous reporting period, NAC utilized its standard axial-pull proof test apparatus to purposely fail a total of 11 finished NT451 SiAION Series 149 valves. The purpose of this activity was to determine the actual failure load and geometric location, and to compare these results to the specified proof test load and FEA modeling results. A summary of the valve axial pull testing data is provided in Table I. Over 50 % (6 of 11) of these valves broke at the base of the lock at loads ranging from 3,530 lbs to 4,275 lbs. The nature of the fracture surfaces for these valves indicated failure from a bending load.

208
As correlated by the degree of uniformity of copper witness marks on the ceramic valves, it is believed that the DDC-supplied two-piece copper-coated locks did not always load the stems in a uniform manner.
NAC designed and fabricated an alternate lock design in an attempt to eliminate the bending failure mode and increase the break load. This lock design incorporated a more contact area on the stem and tighter dimensional control. A total of 11 additional finished valves were axial-pull tested to failure. A summary of these results is provided in Table II. The modified lock design reduced the frequency of breakage at the base of the lock by a factor of two, and increased the average break load from 4,000 ± 424 lbs to 5220 ± 879 lbs. This lock design is being reviewed by DDC, and will be considered for use in the final valve design. A detailed assessment of the benefit of this lock design versus the additional cost will be made.
Task 1b- Final Design Analysis.
No Activity to Report.
Task 2 - Component Manufacturing Technology Development.
Task 2a - Environmental Safety and Health.
No Activity to Report.
Task 2b-- Process Cost Modeling.
NAC is developing a Technical Cost Model for SiAION Series 149 exhaust valves in conjunction with IBIS Associates. During the reporting period, IBIS completed work under their Task 1 which included development and documentation of the base cost model. This effort involved expanding the cost model to incorporate valve grinding sub-operations. Data for three valve grinding process options was built into the model, including: (1) The current prototype machining process; (2) A centeriess grinding based approach; and (3) Peel or Junker Quickpoint grinding. A preliminary cost sensitivity analysis was performed using the expanded model. Results of the preliminary cost analyses were presented at NAC's ACMT Semi-Annual review meeting in July. Three separate sensitivity analyses were presented including: (1) A comparison of the two production ceramic valve grinding scenarios; (2) A learning curve analysis to estimate the impact of a combination of process improvements when valves are fabricated on a production scale; and (3) A comparison of various process options with different amounts of grinding stock and process yields.
Ibis continued work under their Task 2 (Cost and Sensitivity Analysis) and Task 3 (Ongoing Analysis and Support). The focus of Task 2 is on: (1) Incorporation of continuous sintering into the model; (2) Refinement of the learning curve analysis to estimate the effect of production quantities; (3) Revision of the preliminary cost estimates for centeriess grinding of valves based on inputs from Deco Technologies; and (4) Refinement of the stock removal versus process yield cost sensitivity analysis. All of the inputs for these analyses was collected and verified during the reporting period.
Task 2c - Process Control
Raw Material Selection - Based on sintering trials performed in the previous reporting

209
period and updated pricing information, NAC has selected and placed an order for a low cost silicon nitride raw material for use in the balance of the ACMT effort.
Milling and Spray Drying Process Control - Efforts are in progress to optimize the spray-drying process step using a low cost silicon nitride raw material selected in the previous reporting period. Work is focused on assessing various binder additions to the aqueous suspension. Five powder mixes each containing a different commercially available binder were prepared. These binders were selected from two types of binders systems - soluble versus emulsion. A fixed amount of each of the five binders was added to a milled silicon nitride slurry along with a dispersant and plasticizer. The dispersant and plasticizer type and quantity were held constant for all five slurries. Spray drying parameters (air inlet temperature, slurry feed rate, and atomizer rpm) were specified for each binder system based on prior experimentation. Characteristics of binderized spray dried powder from each treatment are summarized in Table III. Binder B exhibited acceptable flowability and high green strength. However, fracture surfaces of disks CIP'ed at 24 Ksi with this mix revealed inter-granular fracture of the spray dried agglomerates. This characteristic is undesirable as it is an indication that the spray dried agglomerates are too hard and remain as defects in the sintered part. The results of this experiment led to screening and selection of a lower T0 formulation of binder B. This binder, when used in conjunction with the optimized milling process, produced high green strength as well as trans-granular fracture in CIP'ed parts (ie, no relics of spray dried agglomerates).
Continuous Sintering - Development of continuous sintering continued during the reporting period in conjunction with Centorr/Vacuum Industries (CVI) and Wittmer Consultants. The CVI/Wittmer team is performing work under their Sub-task 1.2 (Dimensional Control); Sub-task 1.3 (Continuous Sintering Optimization); and Task 2 (Continuous Furnace Design Study for SiAION Exhaust Valves). Under the continuous sintering optimization sub-task, the CVI/Wittmer team is developing a continuous sintering cycle for NAC's low cost silicon nitride, designated NT551. This material, developed under an internally-funded R&D program, utilizes a low cost silicon nitride raw material and a lower overall amount of sintering aid. During the reporting period, test billets of NT551 silicon nitride were processed through eight continuous sintering treatments. The highest density achieved in this sintering matrix was approximately 97% of theoretical. Weight loss during sintering was excessive for all of the treatments, indicating the possibility that one or more of the sintering aid constituents went through a decomposition reaction. A subsequent batch of NT551 silicon nitride test billets was fabricated, presintered, and processed through the same matrix of continuous sintering treatments. In this case, several time-belt speed combinations were identified which resulted in densities greater than 99% of theoretical.
Machining - Work is ongoing in the development of a cost effective machining process for valves. This activity is being performed in conjunction with Norton's World Grinding Technology Center (WGTC) and Deco Technologies.
Work at the WGTC has focused on (1) Development of a centeriess plunge grinding approach for ceramic valves; and (2) Assessment of various alternative valve grinding technologies. The centeriess grinding approach was evaluated on a DedTru centeriess simulation device mounted on the table of an Elb Super Brilliant surface grinder in consignment in the World Grinding Technology Center. A schematic of this test setup is shown in Figure 1. Half-inch long parts (cut from the stem sections of valve blanks received from NAC) were successfully centerless-ground with this DedTru device. Based on these initial results, a total of 15 8" x %n x 3" wheels were ordered and received from

210
Norton Superabraisives - 11 for rough grinding and 4 four finish grinding. A test procedure was defined for the rough grinding operations with three different plunge feeds: Vw = 10, 20 and 30 mm/minute corresponding to material removal rates of 2.5, 5 and 8 mm3/second per mm of wheel width. Power, normal and tangential forces, surface finish and wheel wear were monitored for these screening tests. Results of these centeriess grinding simulation tests were summarized in previous reports. Two wheel types from the rough grinding screening experiment and two wheel types from the finish grinding screening experiment were selected for evaluation in larger-scale centeriess grinding trials. These four wheels were fabricated during the reporting period.
A Super-Tec centeriess grinder was acquired by the WGTC for use in larger-scale centeriess grinding trials. The purpose of this larger-scale centeriess grinding study is to: (1) Identify the optimum wheel specifications for centeriess grinding of valves; (2) Determine the machine tool stiffness and power required to operate at high MRR for full-length valves; and (2) Develop the appropriate truing and dressing procedures. The Super-Tec centeriess grinder was dismantled during the reporting period and found to be an unsuitable machine tool. A Norton No. 3 centeriess grinder was identified as an alternate.
Efforts at Deco Technologies are focused on applying the centeriess grinding technology being developed at the WGTC to full-size components. During the reporting period, Deco purchased a used Lidkoping centeriess grinder for performing ceramic valve grinding trials. A process routing for centeriess grinding Series 149 exhaust valves was finalized, including detailed wheel specifications for each grinding operation. A total of three centeriess grinding wheels for rough and finish stem, underhead, and head grinding were ordered from Norton Superabraisives Division with assistance from WGTC personnel.
In parallel to the centeriess grinding development activity, several alternative grinding technologies are being assessed by the WGTC and Deco. WGTC and Deco have completed a review of ceramic valve grinding processes offered by Studer, Junker, Micron, and other machine tool builders. A Studer S40 high speed CNC grinder has been received on consignment at the World Grinding Technology Center. High speed CNC profile grinding of NT451 SiAION valves has been successfully demonstrated on this Studer S40 machine. A diamond MSL grinding wheel rotating at 150 m/s was used for rough profile grinding in these preliminary valve grinding trials. Conventional speed grinding was utilized for the finish profile unit operation using a 320 grit vitrified bond wheel. The cycle time of the initial demonstration of Studer high-speed grinding was less than 3X NAC's current prototype grinding process. An additional reduction in process cycle time is expected once the Studer high-speed grinding process is optimized. Upon completion of optimizing this valve grinding process, a demonstration run of 30 valves will be performed on the Studer machine.
NAC and Junker finalized plans to carry out a ceramic valve grinding demonstration for the Series 149 design at Junker's facility in Nordrach, Germany. During the reporting period, a batch of 35 Series 149 NT451 SiAION valve blanks were fabricated and sent to Junker for grinding trials to be completed in October.
Task 2d - Intelligent Processing
NAC is working in conjunction with its research and development group located at SGNICC's Northboro, MA Research and Development Center (NRDC) and MATSYS (formerly part of BDM Federal Inc.) to develop intelligent processing methodologies for
211
ceramic valve manufacturing. The objectives of this effort are to: (1) Develop, implement, and demonstrate an intelligent control system for milling and spray drying of silicon nitride powder; and (2) Adapt existing consolidation models to the valve dry-bag iso-pressing. The objectives of the ICS effort for spray drying are to establish intelligent, closed-loop control of the spray drying process in order to produce dried spherical silicon nitride agglomerates with: 1) a controllable mean size, 2) narrow size distribution, 3) high CIP density (i.e., minimize agglomerate hardness and the occurrence of dimpled or doughnut-shaped agglomerates and internal voids), 4) high flowability, and 5) high yield.
Milling - The milling ICS was designed to monitor slurry characteristics in real-time and make appropriate adjustments to keep the process in control. This ICS was designed to monitor and adjust process variables such as pH, temperature, viscosity and percent solids on-line, with automated feedback. Surface area and particle size distribution are monitored manually, with adjustments made in real time. During the reporting period, all of the individual IPC modules were assembled and demonstrated. The specific on-line sensors (pH meter, viscosity meter, and level controller) were tested for range and accuracy. This activity was performed in preparation for a demonstration of the complete ICS system for milling and spray drying as part of NAC's ACMT Semi-Annual review meeting in July.
Slurry-ICP equipment was setup for automated sampling and analysis of slip composition and impurity levels. Operation of this instrument required the determination of the following factors: (1) Appropriate concentration level of slurry which will not clog the nebulizer; (2) Incident plasma power; (3) Plasma observation height; (4) Nebulization flow rate; and (5) Sample up-take rate. A designed experiment was performed which varied these variables at 5 levels and resulted in settings which optimized the signal intensity, S/N ratio, R (= slurry/solution intensity) and the objective factor (OF). Follow on work was performed to establish a calibration curve using artificial standards to determine slurry concentration levels. Based on the constraints of complex sample preparation requirements, it was decided not to pursue development of on-line slurry-ICP as part of the milling ICS.
Spray Drying Process Model - In order to identify the relationships between spray drying input and output variables, MATSYS developed mathematical models for droplet generation and droplet drying. The microscopic drying model described in previous reports was adapted to spray drying of spherical droplets. The drying process is modeled using conservation of mass and energy. The current model takes into account the migration of liquid to the droplet surface by capillary action, vapor phase diffusion of the evaporated solvent through the tortuous pores of the agglomerate, and convection of the vapor phase products form the droplet surface by the surrounding hot air. The microscopic drying model is being linked to the macroscopic process variables of the spray drying process, such as the slurry flowrate, the inlet and outlet temperature, and the ambient and outlet humidity. The linked model will be validated using the results of experimental trials being conducted at the NRDC. The validated model will be used to develop the fuzzy logic rules for controlling moisture content, agglomerate hardness, and possibly agglomerate shape.
Spray Drying Intelligent Control System (ICS) - In fulfillment of NAC's ACMT Milestone No. 3, MATSYS and NRDC personnel completed the selection and specification of the control hardware for the spray drying ICS. This control hardware included: (1) A digital temperature controller for the spray dryer inlet air temperature; (2) A digital peristaltic pump, (3) A motor drive for the atomizer with a closed-loop motor speed controller; and (4) A non-contact infrared moisture sensor; and (5) Several input/output boards and other

212
equipment. The control hardware was set-up and debugged by MATSYS using an off-line simulator prior to installation on the NRDC spray dryer.
MATSYS completed design of the graphical user interface and data acquisition system for the spray drying ICS. This control software has been acquired by NRDC as well. After reviewing several PC-based industrial control and automation software packages, MATSYS selected FIX DMACS Version 5.0 by Intellution, Inc. as the software platform for implementation of the spray drying intelligent control system. During the reporting period, MATSYS integrated the IPC hardware with the FIX DMACS graphical data acquisition interface. Communication between the IPC software and the inlet temperature controller, atomizer speed controller, and humidity sensor was demonstrated. An illustration of the customized graphical user interface for NAC's spray drying ICS is shown in Figure 2.
An experimental matrix was performed to establish cause/effect relationships between spray dryer settings and spray dried powder characteristics. During this series of experiments, the revised ICS hardware and software was utilized and determined to be capable of controlling the spray drying process. Air inlet temperature, slurry feed rate, and atomizer rpm were varied to assess their effect on spray dried powder flowability and pressability. A summary of the spray drying conditions and powder characteristics is provided in Table IV. An IR sensor was used to measure the moisture content of spray dried powder as it collected in the chamber bucket. To calibrate the on-line IR moisture sensor, powder moisture content was measured off-line using a weight loss technique. The data in Table IV indicates that a lower inlet temperature and slower atomizer speed produce spray dried powder with improved flowability and pressability. Dimpled agglomerates were found in samples of spray dried powder from all of the treatments.
Process Model for Dry-Bag Iso-Pressing - Current process valve blanks formed by dry-bag iso-pressing (CIP) exhibit distortions such as narrowing of the stem near the valve underhead radius, "elephant's feet" at the end of the stem, and chipping around the valve head. In addition, density and stress gradients exist within the CIP'ed part which contribute to warpage during the presinter and sintering operations. The dimensional distortions and density and stress gradients make it necessary to fabricate the pressed blank significantly larger than required. At present, the formed blank to finished part weight ratio is 2.75. Presintering and single-point green machining are required to remove stock from the oversized pressed blank. NAC envisions CIP'ing followed immediately by automated single pass green machining or green grinding as a more cost effective for producing near net shape valve blanks. This approach can be employed only if the CIP'ed blanks are produced with less stock. NAC has established the following process performance goals for valve blanks: (1) A finished part weight ratio of ^ 1.8; and (2) A reduction in fired blank stem total indicated runout (TIR) by least a factor of two over the current process.
To achieve these goals, MAYSYS utilized their PDT™ and PROSIM™ process simulation tools to guide design of the dry-bag tooling and pressing schedule. MATSYS performed a PROSIM™ simulation of the dry-bag isopressing operation for the current blank geometry and process conditions. PROSIM™ was used to predict the shape of the valve blank after pressing. As summarized in previous reports, the modeled versus actual valve blank geometry was found to be in close agreement. Starting with the current dry-bag geometry, MATSYS in conjunction with NAC performed several iterative simulations of the dry-bag geometry to arrive at an improved tool design. A new dry-bag design was finalized using this process to reduce excess material in the valve head and shoulder area. In

213
addition, the PROSIM™ simulation for this new dry-bag geometry predicts reduced density and stress gradients in the pressed blank. NAC incorporated minor geometry modifications to the modeled design, and ordered this revised design dry-bag tool. This revised design tool was fabricated and delivered to NAC through a subcontracted effort with Elastomers Inc. Valve blank pressing trials were conducted with this new tool. This revised design tool eliminated chipping on the head OD and reduced the pressed part weight by greater than 20% (formed blank to finished part ratio = 2.18). However, necking down of the of the stem diameter near the head was not reduced. A subsequent dry-bag tool design iteration is planned using actual versus predicted geometry obtained from this new design. The goal for this next iteration is to eliminate the necking down of the stem so that additional stock can be removed from the pressed blank.
Task 3 - Inspection and Testing
A total of 160 (80 30° seat angle, 80 45° seat angle) finished NT451 SiAION Series 149 valves were received at DDC. Vacuum checking of the 30° seat angle ceramic valves was performed in accordance with DDC specification 67T-2 "Intake and Exhaust Valve Sealing Test Procedure". All 80 of these valves passed this specification. NAC's dimensional inspection data for all of the valves was received by DDC and reviewed as part of receiving inspection.
A complete package of raw data generated from NAC's testing in accordance with DDC specification 15T-4/S149 "Engineering Product Approval Requirements for Experimental SiAION Exhaust Valve" was received by DDC. Except for fracture toughness, a review of mechanical and physical properties, grain size, aspect ratio, porosity, phase assemblage, and proof test data for each batch of valves indicated compliance with the DDC material specification.
A total of 27 of the 30° seat angle valves delivered to DDC were forwarded to ORNL for fatigue testing.
A 6V-149 overhead fixture was assembled with fourteen 30° seat angle ceramic valves, eight 45° seat angle ceramic valves, and two production metal valves. The seat inserts were checked for runout and repaired as necessary to remain within a specification of 0.002". Valve guide ID's were measured and recorded for this test. Initial testing at 1,900 rpm for 100 hours was completed with no valve failures. Additional overspeed tests at 2,100 rpm, 2,500 rpm and 3,000 rpm were performed. The overspeed tests at 2,100 rpm and 2,500 rpm were suspended after 200 hours with no failures. The 3,000 rpm test ended at 23 hours with breakage in a total of five of the 16 valves tested. The following observations were made upon inspection of the failed valves:
(1) Two failure modes were present - Two of the five failures were in the stem just above the underhead radius, and three of the five failures were in the lock groove.
(2) A higher percentage of 45° seat angle valves failed (3/8) compared to the 30° seat angle design (2/14). None of the 30° seat angle valves failed in the stem.
(3) Visual examination of the three valves that failed in the lock groove revealed severe chipping at the lock groove-stem OD intersection (tip side only). These were the only valves that exhibited this chipping. Visual examination of the copper coated locks for these components showed contact with the ceramic valve only in two narrow regions 180° apart, which coincided with the seams in the two piece lock. This observation provides evidence that the locks distorted to the point where contact stresses

214
became high enough to induce chipping and eventual breakage of the valve through the lock groove.
Despite these failures, DDC's minimum overspeed testing requirement of 20 hours at 3,000 rpm was met. Completion of the overspeed fixture testing was performed in fulfillment of NAC's ACMT Milestone No. 4. Engine durability testing of these preliminary design valves, an activity beyond the scope of the Milestone No. 4 requirements, is planned to start in January 1996.
Task 4 - Process Demonstration.
Task 4a - During the previous reporting period, a total of 200 preliminary design valves were fabricated -100 with a 30° seat angle; and 100 with a 45° seat angle. All of these valves were inspected and delivered in fulfillment of NAC's ACMT Milestone No. 2 as follows:
- 160 to DDC (80 with a 30° seat angle; and 80 with a 45° seat angle. - 40 to ORNL (22 with a 30° seat angle; and 18 with a 45° seat angle.
All of these valve were processed through axial pull proof testing using a proof test load of 3,000 lbs.
NAC has completed an analysis of the manufacturing data for these valves to determine: (1) The current actual process capability for each critical component attribute; (2) The actual process yields by process step; and (3) Actual variable costs by process step. These data are being used to: (1) Establish absolute goals for the Task 4b production process demonstration; (2) Validate the Process Cost Model being developed by IBIS; and (3) Guide production process development efforts.
Task 4b.
No Activity to Report.
Status of Milestones
Milestone No.'s 2, 3, 4 were completed during the reporting period.
Communications/Visits/Travel
5/2/95- DEWittmer (Wittmer Consultants), EBright (NAC), RYeckley (SGNICC), VPujari (SGNICC), MAbouaf (SGNICC), and GBGranger (SGNICC) met at the American Ceramic Society meeting to discuss continuous sintering results and program plans.
5/?/95- Steve Hollo of MATSYS visited NRDC for performing experiments on the spray-dryer.
5/30/95 - EObert (Machinetech), FZiermann (Machinetech), visited EBright, JEckalbar, and CBurk at NAC to present and review Junker's machine tool proposal.
5/31/95 - BBenoit (Deco), RBurrell (Deco), EBright (NAC), JEckalbar (NAC), MTricard (WGTC) met at the WGTC to review centeriess grinding simulation tests and program plans.

215
7/13/95- CMiller (Centorr/Vacuum Industries), DEWittmer (Wittmer Consultants), EBright (NAC), and RYeckley (SGNICC) met at Centorr/Vacuum Industries to discuss continuous sintering results and to update program plans.
7/18/95 - All participants attended NAC's ACMT Semi-Annual Review Meeting, Northboro Research and Development Center, Northboro, MA.
7/19/95 - BBenoit (Deco), LMains (Deco), VKPujari (SGNICC), EBright (NAC), JEckalbar (NAC), MTricard (WGTC) met at the WGTC to review plans for valve grinding trials. 1 7/19/95 - 7/20/95 - VKPujari (SGNICC) visited SHollo (MATSYS) at BDM, Arlington, VA to plan the logistics of integrating the spray drying IPC system at the NRDC.
8/2/95 - JPicone (WGTC) and MHauptman (Deco) met at Altman in Chicago to examine the Lidkoping centeriess grinder as a candidate machine tool for ceramic valve grinding trials.
9/12/95 - JPicone (WGTC) visited and LMains (Deco) and MHauptman (Deco) at Deco Technologies in Detroit to discuss centeriess grinding wheel specifications.
9/25/95 - EBright (NAC) met with MTricard (WGTC) at the WGTC to review plans for ceramic valve grinding development.
9/5-9/15/95 - SHollo (MATSYS) visited VKPujari (SGNICC) and WTCollins (SGNICC) at the NRDC to install process control hardware and conducts tests of the spray drying ICS.
Problems Encountered
A main bearing failure on the Series 149 overhead fixture caused a two week delay in testing.
Publications
NAC participated in preparing and article for the ORNL newsletter regarding the ACMT program. EBright submitted a technical paper entitled "Advanced Ceramic Manufacturing of SiAION Exhaust Valves" for presentation and publication at the 1996 SAE Exposition, Detroit, Ml, February 26-29, 1996. MTricard from the WGTC made a presentation at the NIST Ceramic Machining Consortium in Gaithersburg, MD on September 27, 1995 regarding ceramic valve grinding development under the ACMT.
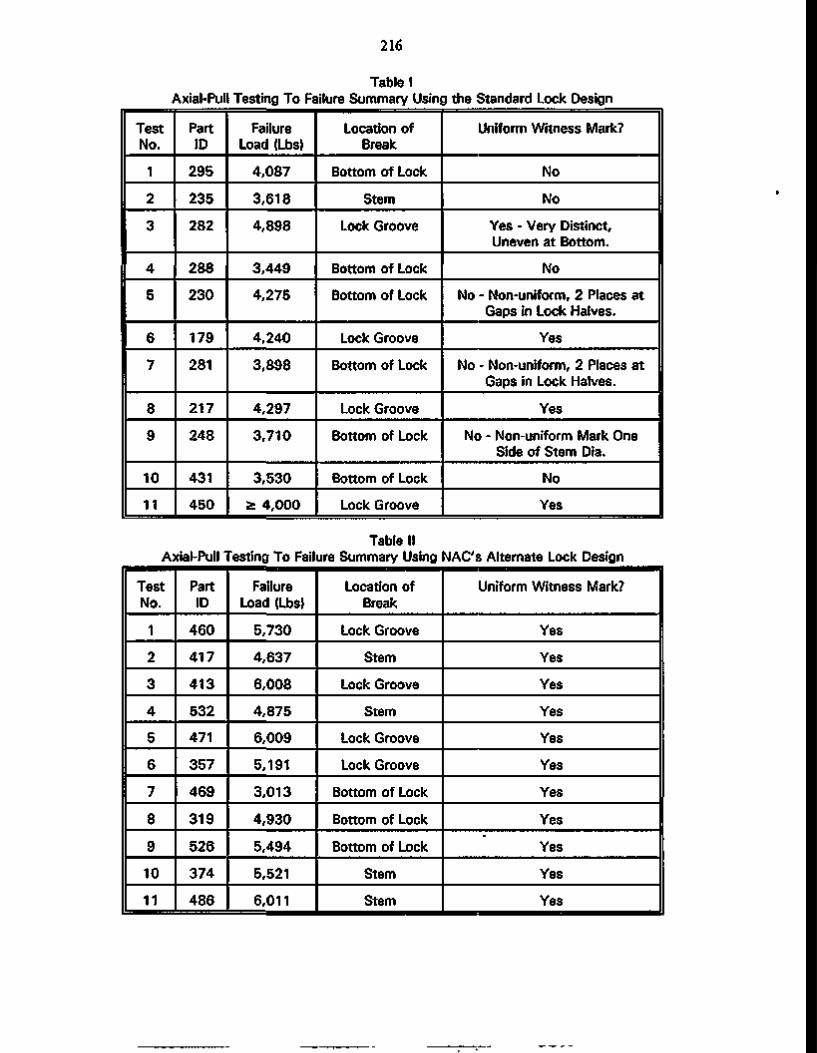
216
Table I Axial-Pull Testing To Failure Summary Using the Standard Lock Design
Test No.
1
2
3
4
5
6
7
8
9
10
11
Part ID
295
235
282
288
230
179
281
217
248
431
450
Failure Load (Lbs)
4,087
3,618
4,898
3,449
4,275
4,240
3,898
4,297
3,710
3,530
2= 4,000
Location of Break
Bottom of Lock
Stem
Lock Groove
Bottom of Lock
Bottom of Lock
Lock Groove
Bottom of Lock
Lock Groove
Bottom of Lock
Bottom of Lock
Lock Groove
Uniform Witness Mark?
No
No
Yes - Very Distinct, Uneven at Bottom.
No
No - Non-uniform, 2 Places at Gaps in Lock Halves.
Yes
No - Non-uniform, 2 Places at Gaps in Lock Halves.
Yes
No - Non-uniform Mark One Side of Stem Dia.
No
Yes
Table II Axial-Pull Testing To Failure Summary Using NAC's Alternate Lock Design
Test No.
1
2
3
4
5
6
7
8
9
10
11
Part ID
460
417
413
532
471
357
469
319
526
374
486
Failure Load (Lbs)
5,730
4,637
6,008
4,875
6,009
5,191
3,013
4,930
5,494
5,521
6,011
Location of Break
Lock Groove
Stem
Lock Groove
Stem
Lock Groove
Lock Groove
Bottom of Lock
Bottom of Lock
Bottom of Lock
Stem
Stem
Uniform Witness Mark?
Yes
Yes
Yes
Yes
Yes
Yes
Yes
Yes
Yes
Yes
Yes

217
Figure 1 Schematic of Centeriess Grinding Simulation Test Setup at the WGTC.
Workblo.de
Nor ton hydraulic t ru ing device
DEDTRU
Dynamometer
Diamond wheel mounted on ELB
Spr ing l oaded f i n g e r
Ceramic
Regu la t i ng wheel
Steel Plate ELB Table
Figure 2 Customized Graphical User Interface for the Spray Drying ICS System.

Table III Characteristics of Spray Dried Powder from Binder Screening Experiment
Binder Type
A
B
C
D
E
Loose Packing Density (g/cc)
.91
.95
.95
.94
.98
Powder Flowability by Hall Flow Meter
(sec/25 cc)
38
43
44
43
53
Moisture Content
(Weight %)
1.8
1.5
1.0
1.0
1.4
CIP Density (g/cc)
2.110
2.147
2.129
2.115
2.170
Diametrical Compression
Strength (psi)
216
250
176
176
121
Characteristics of Fracture Surface
Smooth Trans-granular
Rough Inter-granular
Rough Inter-granular
Rough Inter-granular
Smooth Trans-granular
Table IV Results of Spray Drying ICS Cause/Effect Screening Experiment
Run No.
1
2
3
4
5
6
7
Inlet Temp.
T,
T,
T2
T2
T3
T3
T4
Slurry Feed Rate
0-1
0-2
Qi
Q2
Q2
Q2
Q2
Atomizer rpm
W,
W,
W,
w. W,
w2
w2
Powder Flowability
by Hall Flow Meter (sec/25 cc)
44.5
41.8
42.9
42.0
42.2
37.4
37.6
Loose Packing Density (g/cc)
.95
.95
.95
.97
.98
.98
.99
Moisture Content
(Weight %)
.16
.21
N/A
.28
N/A
.36
.89
CIP Density (g/cc)
2.025
2.038
2.030
2.035
2.040
2.045
2.042
Qualitative Assessment of
Agglomerate Shape Dimpled Particles
Present?
Yes
Yes
Yes
Yes
Yes
Yes
Yes

219
2.0 MATERIALS DESIGN METHODOLOGY
INTRODUCTION
This portion of the program is identified as program element 2 within the work breakdown structure (WBS). It contains three subelements: (1) Modeling, (2) Contact Interfaces, and (3) New Concepts. The sub-elements include macromodeling and micromodeling of ceramic micro-structures, properties of static and dynamic interfaces between ceramics and between ceramics and alloys, and advanced statistical and design approaches for describing mechanical behavior and for employing ceramics in structural design.
The major objectives of research in Materials Design Methodology elements include determining analytical techniques for predicting structural ceramic mechanical behavior from mechanical properties and microstructure, tribological behavior at high temperatures, and improved methods for describing the fracture statistics of structural ceramics. Success in meeting these objectives will provide U.S. companies with methods for optimizing mechanical properties through microstructural control, for predicting and controlling interfacial bonding and minimizing interfacial friction, and for developing a properly descriptive statistical data base for their structural ceramics.


221
2.2 CONTACT INTERFACES
2.2.2 Dynamic Interfaces Development of Standard Test Methods for
Evaluating the Wear Performance of Ceramics P. J. Blau
Oak Ridge National Laboratory
Objective/Scope
The goal of this effort is to improve consistency in reporting ceramic wear data by helping to develop a standard test method for quantitatively determining the wear resistance of structural ceramics, in reciprocating sliding, a type of motion which is experienced by several types of automotive and truck engine wear parts. ORNL is working with ASTM Committee G-2 on "Wear and Erosion." In 1990, P. J. Blau was appointed chairman of a newly-established Task Group G02.40.07 "Reciprocating Sliding Wear Testing," within the G-2 committee. This report describes the continuing activities of the Task Group as work proceeds toward standardization.
Technical Highlights
A number of changes, both editorial and technical, resulted from the late spring 1995 ballot, including a change in the title of the standard to "Standard Test Method for Linearly-Reciprocating Ball-on-Flat Sliding Wear." A revised ballot (version 1.7) was completed and submitted for reballoting at the subcommittee and main committee level (concurrent ballot). There were three negative votes on the ballot due to the accidental omission of a paragraph in printing. This omission was corrected administratively in a separate mailing to the voters and the negatives were subsequently withdrawn. Thus, the reciprocating wear test for ceramics is expected to become available as a published ASTM standard test method within the next year.
Future Plans
We plan to participate in the November 9-10, 1995, ASTM G-2 committee meeting in Norfolk, Virginia. The final tally of ballots will be presented and the editorial changes to the final draft will be noted. A research report, which is required by ASTM for interlaboratory projects performed during the development of a new standard test method, is being prepared for submission.
Status of Milestones
222211 Address comments on the joint subcommittee /main committee ballot. December 1994 (Completed).
222212 Resubmit revised ballot and address final comments. June 1995 (Completed)
222213 Revise and resubmit draft for main and subcommittee ballot. November 1995. (Completed)
222214 Write and submit an ASTM Research Report. March 1996.
Communications/Visits/Travel
None. Publications/Presentations
None.


223
3.0 DATA BASE AND LIFE PREDICTION
INTRODUCTION
This portion of the program is identified as program element 3 within the work breakdown structure (WBS). It contains five subelements, including (1) Structural Qualification, (2) Time-Dependent Behavior, (3) Environmental Effects, (4) Fracture Mechanics, and (5) Nondestructive Evaluation (NDE) Development. Work in the Structural Qualification sub-element includes proof testing, correlations with NDE results and microstructure, and application to components. Work in the Time-Dependent Behavior subelement includes studies of fatigue and creep in structural ceramics at high temperatures. Research in the Environmental Effects subelement includes study of the long-term effects of oxidation, corrosion, and erosion on the mechanical properties and microstructures of structural ceramics. Work in the Fracture Mechanics subelement includes development of techniques for measuring the tensile strength and creep resistance of ceramic materials at high temperatures, and testing ceramic materials at high temperatures under uniaxial tension. Work in the NDE Development subelement is directed at identifying approaches for quantitative determination of conditions in ceramics that affect their structural performance.
Major objectives of research in the Data Base and Life Prediction program element are understanding and application of predictive models for structural ceramic mechanical reliability, measurement techniques for long-term mechanical property behavior in structural ceramics, and physical understanding of time-dependent mechanical failure. Success in meeting these objectives will provide U.S. companies with the tools needed for accurately predicting the mechanical reliability of ceramic heat engine components, including the effects of applied stress, time, temperature, and atmosphere on the critical ceramic properties.


225
3.1 STRUCTURAL QUALIFICATION Microstructural Analysis of Structural Ceramics B. J. Hockey and S. M. Wiederhorn (National Institute of Standards and Technology)
Objective/Sgope
The objective of this part of the program is to identify mechanisms of failure in structural ceramics subjected to mechanical loads at elevated test temperatures. Of particular interest is the damage that accumulates in structural ceramics as a consequence of high temperature exposure to stresses normally present in heat engines.
Design criteria for the use of ceramics at low temperature differ from those at high temperature. At low temperature ceramics are elastic and brittle; failure is controlled by a distribution of flaws arising from processing or machining operations, and the largest flaw determines the strength or lifetime of a component. By contrast, at high temperature where ceramics are viscoelastic, failure occurs as a consequence of accumulated, or distributed damage in the form of small cavities or cracks that are generated by the creep process. This damage effectively reduces the cross-section of the component and increases the stress that must be supported. Such increases in stress are autocatalytic, since they increase the rate of damage and eventually lead to failure as a consequence of loss in cross section. When this happens, the individual flaw loses its importance as a determinant of component lifetime. Lifetime now depends on the total amount of damage that has occurred as a consequence of the creep process. The total damage is now the important factor controlling lifetime.
Recent studies of high temperature failure of the non-oxide ceramics intended for use for heat engines indicates that for long term usage, damage accumulation will be the primary cause of specimen failure. Mechanical defects, if present in these materials, are healed or removed by high temperature exposure so that they have little influence on long term lifetime at elevated temperature. In this situation, lifetime can be determined by characterizing the damage and the rate of damage accumulation in the material at elevated temperatures. In ceramic materials such as silicon nitride and SiAION, such characterization required high resolution analyses because of the fine grain size of these materials: hence the need for transmission electron microscopy as an adjunct to the mechanical testing of ceramics for high temperature applications is apparent.
In this project, the creep and creep-rupture behavior of several ceramic materials will be correlated with microstructural damage that occurs as a function of creep strain and rupture time. Materials to be studied include: SiAION; hot-pressed silicon nitride; sintered silicon carbide. This project will be coordinated with WBS 3.4.1.3, Tensile Creep Testing, with the ultimate goal of developing a test methodology for assuring the reliability of structural ceramics for high temperature applications.

226
Technical Highlights Microstructural analysis studies related to the tensile creep
behavior of SN-88 silicon nitride were continued and additional results on the characterization of microstructure and creep damage were obtained. TEM examination has revealed that SN-88 contains a wide range of silicon nitride grain sizes of both folocky and whisker-like morphology. While most grain sizes are from 0.1 to 3 microns, SN-88 also contains a significant fraction of whisker-shaped grains of 10 microns or more in length. SN-88 also contains a relatively high volume fraction an intergranular second phase, whose composition is consistent with ytteria and ytterbia being the primary sintering aid additives. The second phase is distributed within multi-grain junctions of varying shape and sizes (roughly, 10 nm to over 2 microns), where it is largely crystalline, and also within interfaces separating adjacent grains. In general, the interphase at two-grain interfaces varied in width, both from interface to interface and also along the same interface from about 1 nm and glassy to tens of nanometers and largely crystalline. SEM and optical examination of samples crept in tension at 1200 C. to over 1% strain, 1300 C. to over 2% strain, and at 1400 C. to over 4 and 5% strain revealed the presence of surface cracks, whose distribution, density, and lengths appeared to increase with increased strain. At all temperatures, the morphology of these cracks suggested plastic blunting restricted their growth; consistent with this, the cracks (other than those_ responsible for failure) rarely extended more than 300 microns into the test sample interior. TEM examination of the same set of samples revealed that, for this material, creep cavities form almost exclusively within the second phase situated at multi-grain junctions. AT 1300 C. and above, the sizes of these interstitial cavities scales with the multi-grain junction size and ranges from roughly 0.1 to over 2 microns. At 1200 C., cavities rarely exceeded about 300 nm in size and were often contained within crystalline second phase remaining within the multi-grain junction, suggesting that the transport of second phase required for cavity growth is limited at this temperature. Unlike all other grades of silicon nitride investigated in this project, SN-88 exhibited limited evidence for cavitation at narrow, two-grain interfaces. Even at 1400 C. cavity growth along narrow interfaces appears to occur ' only along small interface segments connecting neighboring multi-grain junctions. Nevertheless, such limited interfacial growth can lead to the linking-up if interstitial cavities to form larger cavities of crack-like morphology.
Experimental Technique
The results of this study were obtained primarily by analytical transmission electron microscopy (ATEM). During this period, ATEM was used to examine thin sections obtained from the near-surface and interior of SN-88 silicon nitride after tensile creep tests at 1200 C. to 1.1% strain, 1300 C. to 2.1% strain, and 1400 C. to 4.2% strain. Additional results were also obtained on another sample tested at 1400 C. to over 5% strain. Initially, optical and scanning electron microscopy was used to examine the external surfaces after removal of the oxide "scale". All samples were tested to failure under the tensile

227
test task of this project (WBS 3.4.1.3). Standard ceramographic techniques were used to prepare TEM specimen from the gauge sections of tensile test samples.
Results and Discussion
During the past six months, studies relating to the tensile creep of SN-88 silicon nitride were continued and additional results on the microstructure and on creep damage were obtained. Based on tensile creep data (Task 2), the creep behavior of this material differs from that of other grades of silicon nitride studied under this project. In particular, SN-88 exhibits large strains to failure, typically ranging from 1 to 5% depending on stress and temperature, whereas the other grades tend to fail at strains of 1% or less. Interest in this material, thus, relates to it's inherent "plasticity" or, alternatively, it's high temperature toughness. Evidence for such implied toughness is obtained from examination the external surfaces of crept samples after polishing to remove the oxide scale. These observations have shown that creep results in distributions of surface cracks, whose size and density tend to increase with increasing strain. Although most of these tensile cracks originate at the corners of the square cross-sectioned test samples, their formation is not restricted to these sites. As illustrated in Figure 1, all exhibit relatively large crack opening displacements, indicative of blunting by plastic deformation. Consistent with this implied behavior, these cracks are not found to extend further than approximately 200 to 300 microns into the interior of the samples. The underlying mechanisms for such crack blunting/toughening cannot as yet be explained.
More detailed examination of crept samples by TEM has, however, provided results that allow a general description of the microstructure and of creep damage in SN-88. As indicated above, results to date have been obtained from both near-surface and interior sections from two samples crept at 1400 C to strains of 4 and over 5%, one sample crept at 1300 C. to over 2% strain, and one sample crept at 1200 C. to about 1% strain. Based on these samples, SN-88 is found to consist of beta-silicon nitride grains of both blocky and acicular shapes having a wide range of sizes. While most of the blocky grains range in dimensions from about 100 nm to 3 or 4 microns, SN-88 also contains acicular shaped grains of 10 or more microns in length. Relative to other grades of silicon nitride (notably, NT-154), SN-88 contains a relatively high volume fraction of an intergranular second phase. While not thoroughly analyzed, the composition of this intergranular phase is consistent with the addition of YbA and Y203 as sintering aids. Much of this second phase is contained within multi-grain junctions, interstitial to the silicon nitride grains, which vary in size from about 10 nm to over two microns. In crept samples, the second phase contained in these interstitial pockets is largely crystalline. As in all other grades of silicon nitride, there is evidence of an apparently glassy interphase (presumably of Yb-Y-Si-O-N composition) at all crystalline two-grain interfaces. Although still under investigation, the widths of two-grain interfaces separating adjacent silicon nitride grains can be described as variable. Based on initial high resolution studies, many of these interfaces appear to contain a glassy interphase

228
having a thickness of about 1 nm or less. However, as illustrated in Figure 2, many others are either uniformly wider (up to about 100 nm wide) or exhibit an abrupt change from the minimum width to widths of tens of nanometers. In all cases, these wider interfaces contain the crystalline second phase. Apparently, the development of uniformly narrow two-grain interfaces has been attained, possibly due to the large volume fraction of second phase present in this material. Finally, microstructural examination has also revealed the presence of widely distributed grains of SiC and (apparently) MoSi2 of 1 to 2 microns in size. Other than exhibiting oxidation, these impurity grains due not appear to contribute to creep damage.
As in past efforts, an emphasis was placed on characterizing cavitation damage that accumulates during creep and leads to failure. For SN-88, creep cavities were found to be almost exclusively within the second phase situated interstitial to the silicon nitride grains, i.e.,within the multi-grain junctions of varying sizes and shapes. While the density of these cavities appeared to increase with strain, this result could not be established quantitatively. For creep temperatures of 1300 and 1400 C., the sizes of these interstitial cavities tended to scale with the sizes of the multi-grain junctions and thus ranged in dimensions from 10 nm to upwards of 2 microns. As illustrated in Figure 3, the complete cavitation of material not only from individual sites but neighboring sites suggests rapid cavity growth by transport of the second phase at these temperatures. In contrast, creep at 1200 C. resulted in smaller cavities which, as seen in Figure 4, were often contained within the crystalline second phase at multi-grain junctions. As cavity density rather than size is normally found to be more strongly related to strain, the presence of contained cavities at 1200 C. more likely relate to restricted cavity growth by transport.
Unlike all other grades of silicon nitride examined during the course of this project, tensile creep has not been found to result in what can be clearly defined as interfacial cavitation in SN-88. For these other materials, tensile creep at these temperatures typically results in either crack-like cavities or discrete, lenticular shaped cavities within the narrow interfaces separating adjacent silicon nitride grains. At best initial high resolution studies have suggested interfacial widening, from about 1 to 2 nm, occurs at selected, tensile-oriented interfaces. Moreover, creep of SN-88 is found to result in crack-like cavities, such as seen in Figure 5. In these cases, however, closer inspection invariably reveals that the crack-like cavity morphology is due to the linking-up of neighboring multi-grain cavities. As such, interfacial cavity growth in SN-88 appears limited to the final stage of interstitial cavity consolidation. At present, no definitive explanation can be given for the lack of interfacial cavitation within narrow two-grain interfaces of grain size dimensions in this material.

229
Figure 1. Surface cracks produced in SN-88 silicon nitride during tensile creep. Sample was tested at 1300 C to a failure strain of 2.1%.
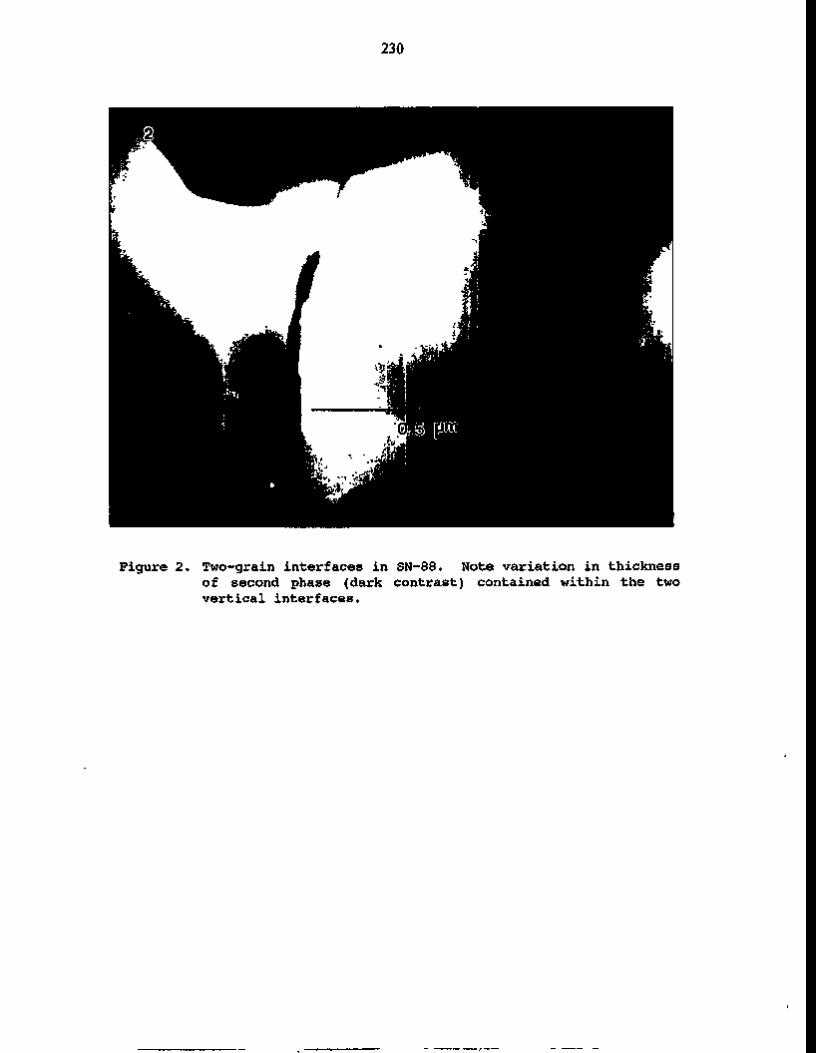
230
Figure 2. Two-grain interfaces in SN-88. Note variation in thickness of second phase (dark contrast) contained within the two vertical interfaces.

231
Figure 3. Interstitial cavities produced in SN-88 during tensile creep at 1300 C. At 1300 C. and above, cavity growth results in the complete transport of the second phase normally contained within such multi-grain junctions.

232
Figure 4. Interstitial cavities produced in SN-88 after tensile creep at 1200 C. At 1200 C., diffusive growth of cavities is limited and results in incomplete cavitation of the second phase contained within multi-grain junctions.

233
Figure 5. Crack-like cavity morphology in SN-88 due to the linking of neighboring multi-grain cavities.
Status of Milestones
On schedule
Publications
None

234
Mechanical Properties and Microstructural Characterization of Si3Nyj Ceramics K. L. More and L. F. Allard (Oak Ridge National Laboratory)
OBJECTIVE/SCOPE
The objective of the research is to use analytical and high resolution electron microscopy to characterize the microstructures of several silicon nitride materials. This report will focus on the analysis of a self-reinforced silicon nitride ceramic, GS-44, manufactured by AlliedSignal, Garrett Ceramic Components.
TECHNICAL HIGHLIGHTS
Silicon Nitride Ceramics:
Several GS-44 tensile rods, exposed to pre-test heat treatments and creep tested under similar conditions, have been received from Ken Liu, Oak Ridge National Laboratory, for microstructural evaluation to determine differences in observed creep behavior between the samples. The GS-44 was exposed to either of two treatments prior to the tensile creep experiments and compared to the as-sintered material; microwave annealed at 1200°C, 1300°C, 1400°C, 1500°C, or 1600°C for 10 h (some combinations of temperatures were also used) or furnace annealed at 1200°C for 100 h. Each specimen was subsequently creep tested in tension at 1200°C and 100 MPa. In general, the higher temperature microwave anneals (temperature range 1400°C-1600°C) resulted in poor creep behavior as compared to the lower temperature microwave annealed GS-44 (1100°C and 1200°C, or a combination of these temperatures). Also, the lower temperature microwave annealed GS-44 showed improved creep resistance over the as-sintered and furnace annealed material. Thus, to determine the reason for these observed differences in creep behavior, a complete microstructural evaluation using several techniques (including X-ray diffraction, scanning electron microscopy, and transmission electron microscopy) of the samples is underway.

235
A New Catalyst Research Initiative
As a part of the Ceramic Technology Program we have begun to study emission catalysts for use in heavy duty transport and automobiles. The optimization of currently available catalysts and the development of new ones requires a detailed understanding of the effects of both microstructure and composition on function. With the development of new analytical tools (high resolution electron microscopy, electron holography, Z-contrast microscopy, advanced surface analysis, etc.) that permit direct characterization of materials at the atomic level, a materials science approach to catalysis research has emerged. Correlations derived between the catalytic activity and selectivity, and the catalyst electronic character, lattice structure and surface morphology, for example, have advanced catalysis from an art to a "near" science. In the latter part of FY-1995 we began to re-direct a portion of the funding in the Ceramic Technology Project to apply to both commercial and experimental catalysts modern techniques of catalyst characterization by direct imaging methods, particularly using field emission electron microscopes. Our efforts have concentrated on the direct characterization of catalytic materials at the atomic and near atomic level, utilizing our strengths in electron microscopy and related imaging techniques, to conduct research that will advance the reputation of this laboratory in the field of catalytic science.
The initial efforts in FY 1995 were aimed at determining the major issues in catalyst characterization as viewed by catalyst manufacturers and end users. Alliances were established with numerous industry and university researchers; these have resulted in a number of research initiatives with companies like AlliedSignal, Ford Research, W.R. Grace etc., in several areas of catalyst research, concentrating in the area of automotive catalysts. We also have begun collaborations with several internationally recognized professors in this field (University of Delaware, University of New Mexico etc.), who are providing input to our flegling effort. Early research in association with several of our contacts resulted in 5 papers and 4 posters presented at the North American Catalysis Society meeting in June.
As a result of several industry requests, we have undertaken the construction of a reaction system that will permit catalyst specimens for TEM observation to be treated under high temperature and atmospheric pressure of chosen gas compositions, then
236
transferred into the TEM without exposure to the atmosphere. This requires a special design of specimen holder that permits the TEM grid supporting the catalyst specimen to be encapsulated and surrounded by an inert atmosphere during the few seconds required for the transfer from the reaction chamber to the microscope. Unlike some commercially available systems, the unique design of this specimen holder ensures that the resolution of the electron microscope will not be compromised.
STATUS OF MILESTONES
Program on schedule.
COMMUNICATIONS/VISITS/TRAVEL 1. K.L. More, A.A. Wereszcak, M.K. Ferber, and R. Yeckley, "A Kinetic Study of the Formation of Voids in a Silicon Nitride Ceramic During High Temperature Creep Deformation," presented at the 96th Meeting of The American Ceramic Society, Indianapolis, IN, April 24-28, 1994. 2. TA. Nolan, K.L. More, L.F. Allard, M.K. Ferber, and D.W Coffey, "Microstructural Characterization of Silicon Nitride Intended for Use in Reciprocating Engines," presented at The 96th Meeting of The American Ceramic Society, Indianapolis, IN, April 24-28, 1994.
PROBLEMS ENCOUNTERED
None
PUBLICATIONS
1. K.L. More, D.A. Koester, and R.F. Davis, "Microstructural Characterization of a Creep-Deformed SiC Whisker-Reinforced Si3N4 Composite," Ultramicroscopy, 37 (1991) 263. 2. K.L More, D.A. Koester, and R.F. Davis, "The Role of Interfaces in the Creep-Deformation of a SiC Whisker-Reinforced Si3N4 Composite," in Electron Microscopy 1990, 4, L.D. Peachey and D.B. Williams, eds., San Francisco Press, San Francisco, CA.

237
Project Database B. L. Keyes (Oak Ridge National Laboratory)
Objective/scope
The objective of this task is to develop a comprehensive computer database containing the experimental data on properties of ceramic materials generated in the total effort. This computer system should provide a convenient and efficient mechanism for the compilation and distribution of the large amounts of data involved. The database will be available in electronic form to all project participants. In addition, periodic hard copy summaries of the data, including graphical representation and tabulation of raw data, will be issued to provide convenient information sources for project participants.
Technical highlights
The CTP database presently contains 14110 records on 27 types of tests on 927 materials, including 781 ceramics, 13 lubricants, 102 coatings and 31 other materials. About 3500 records cover associated information (test backgrounds, test and material notes, etc.) A detailed description can be found in Table 1.
Efforts to integrate existing graphic images into FoxPro™ files on the Macintosh system began during this period. Images of test specimens, set-up diagrams, and processing flow charts were integrated into the DRAWINGS file so that the picture captions and other details would be readily available to the user. Prior to this effort, the images were stored in Kodak's Shoebox, making linking to the FoxPro files more difficult. Adding the images greatly increased the size of the file, to over nine megabytes from a pre-image-inclusion size of well under one megabyte. To facilitate data transfer, a separate copy of DRAWINGS was created without the images, so that the information would still fit on a floppy disk. DRAWINGS with images will be added to the data set that will be available on the World Wide Web soon. Other images, such as micrographs, creep curves, and other data plots, will be added in the future.
Database personnel met with local World Wide Web information providers in June to discuss possible ways to make the CTP database accessible through the web. The chosen method will place the database on ORNL's new NT-based FoxPro server. Data updates, gateway interfaces (CGI's), text-based help and tutorial files, and file maintenance will be provided by CTP database personnel. John Munro from Instrumentation and Controls Division, Gloria Caton from Health Research Sciences Division, and Amy Shippy from Computing and Telecommunications Division, all ORNL, have provided excellent help in this effort.
Only approved sets of data, usually everything stored on a specific material, will be available on the WWW-accessible database initially, with more information to be added at least semiannually. NT-154 and GTE PY6 have been chosen as the first materials to be available. The initial version will be very stripped-down to get the information online, with more capabilities to be made afterwards. Enhanced graphics will be a major priority in future releases. Some provisions for on-screen summations, basic math functions, and maximum-likelihood Weibull calculations are also on the list of capabilities under consideration.
Computer hardware problems that surfaced in later summer have caused a delay in making the
238
database accessible through the World Wide Web. The local NT-based Web server for FoxPro databases was not ready until early August. Windows 95™ , needed to develop and test the interface between the database and the Web, required more space and memory (RAM) than the present PC system has available. The Bernoulli™ 150 megabyte drives have not been working properly. A larger hard disk will be needed to hold the space-hungry software upgrades Windows uses. These problems were not discovered until Windows 95 was released in late summer, after which funding was insufficient to cover the cost. When funding is approved for the next fiscal year, these problems will be fixed.
The Macintosh used to process graphics for the database was upgraded from a Ilex to a PowerPC 9500/120 during this period. Since the processor for this new machine is so new, some of the existing software has caused problems. Many upgrades have been ordered, and some received, but a few snags still exist. Fortunately, the speed of the 9500 permits a quick reboot, a process performed often recently. The one gigabyte hard disk and speedy image processing has been a tremendous help, regardless of the other problems yet to conquer.
Database personnel are gleaning as much information from a variety of sources on writing interfaces to the Web from FoxPro databases. A local seminar on the PERL language offered the most encouragement. Much has been gained, via Web surfing and document viewing, from seeing how others have handled similar situations. Actual interface construction will begin once the PC system upgrade is complete and the Bernoulli drives are once again working properly and reliably, since those drives are required to back up the system.
Other plans call for data input to resume while awaiting the system upgrade, since the present system works with the DOS version of FoxPro 2.6. Creation of new files on grinding tests, updates to test background descriptions, and revision of locally-created batch-codes to include date information are all on the list of tasks to do. More data plots, creep curve information, micrographs, test and specimen details and other graphics will be added to external files (non-FoxPro, for now, due to space considerations). Database personnel are also looking for a user-friendly way to quickly access the graphics pertaining to a specific test; the problem is in the quantity of graphics that may be involved and the type of computer being used.
Part of this reporting period was spent completing the CTP database summary report. Original plans to produce a summary covering all of the major materials stored in the database were scraped when the stack of data tables alone grew to an enormous height. The revised content will cover major silicon nitrides only, including some recently released AS800 data. As in previous data summary reports, comparative graphs will accompany the usual test data plots and Weibull analyses. That report should be in review soon.
Database personnel are again requesting that any participant in the Ceramic Technology Project who has test data (especially from recent tests) to please send a copy to the database administrator at Oak Ridge National Laboratory. Graphic images as photographs or data files are also requested, alsong with some background information about each one (such as material, microscope type and power/magnification, responsible facility and person, etc.). Data are acceptable on disk or hard copy. Please identify the format (Lotus, WordPerfect, etc.) and platform(PC or Macintosh) in which the data are recorded if on a disk. Data in reasonable quantities may be sent via e-mail to "[email protected]". All sources will be noted and preserved in the database.

239
Work on standards for ASTM Committee E-49 have been suspended until the catch-up work on the database is completed.
Communications/Visits/Travel
The CTP Database was sent to four requestors during this period. BLP Keyes met with local WWW information providers to discuss access methods and attended training sessions on creating World Wide Web pages and writing interfaces for the Web. Database personnel provided Robert Schulz with a copy of CTPVIEW, including a special boot program to facilitate loading on his machine.
Problems Encountered
Software required to work on the Web-FoxPro interface demand more resources than the present system can provide, so the Web-accessible database has been temporarily delayed. Problems with other computer hardware have also been a nuisance.
Status of Milestones
Efforts to get a subset of the database on the World Wide Web have been hampered by space-consuming software upgrades required to create the interface for the database, and by hardware poltergeists .
Publications
None.

TABLE 1. CTP DATABASE SUMMARY AS OF SEPTEMBER 30,1995
Material Class
Brazed Specimens Creep MOR 4 Shear Str. Toughness Torsion Tor. Fatigue
Cyclic Density Dynamic Elasticity Fatigue Fatigue
Alumina Alumina + reinforcing fibers Alumina + Zirconia Mullite Mullite + reinforcing fibers SiAION Silicon Carbide Silicon Nitride Silicon Nitride + reinforcing fibers Zirconia Zirconia + reinforcing fibers
15 10
77
241
12 48
58
15 448
43
Alumina Alumina + reinforcing fibers Alumina + Zirconia Mullite Mullite + reinforcing fibers SiAION Silicon Carbide Silicon Nitride Silicon Nitride + reinforcing fibers Zirconia Zirconia + reinforcing fibers Other
39 39
1 12
38 158 56 377
2
4
27 116
24
39
10
239
418 145 7 4 20 52 414 2414 164 1615
2 61
38 63 3
31 62
31 61
28
17 51
51
10 64 38 158
23 309 14
11
15 135 74 119
Other
Totals 318 118 43
6
21 7 448 144
4
286 355 384
Material Class
Fracture Toughness
Hardness Interrupted Fatigue
MOR 3 Pt Bend
MOR 4 Pt Bend
Notched Creep
Oxidation Rate
Poisson's Ratio
Shear Modulus
Stress Rupture
13
13 251
17
3
to o
Totals 722 210 239 20 5316 38 66 93 93 297
(CONTINUED)

TABLE 1. CTP DATABASE SUMMARY AS OF SEPTEMBER 30,1995
Material Class
Specific Heat
Tensile Thermal Thermal Thermal Thermal Thermal Conductivity Contraction Diffusivity Expansion Shock
Torsion Material Chemistry Char.
Alumina Alumina + reinforcing fibers Alumina + Zirconia Mullite Mullite + reinforcing fibers SiAION Silicon Carbide Silicon Nitride Silicon Nitride + reinforcing fibers Zirconia Zirconia + reinforcing fibers Other
22 9
15 11
86 589
16
16 39
8 6
24 9
23 20
23 17
1 4 21
23 58 14
2 6
40
25 95 2 2
33 3 77
391 66 49 5 39
14
68 8
44
17
Totals 31 717 102 23 66 161 787 151
Material Class
Wear Coatings Lubricants X-Ray Micro-resistance Diffraction graphs
Alumina-based Alumina + reinforcing fibers SiAION Silicon Carbide Silicon Nitride Silicon Nitride + reinforcing fibers Chromia-based Zirconia-based Enamels Other
9 1
3 22
98 13 5
126
3
20 16 10 53
Totals 277 102 Grand Total(characterization data not including text records) Grand Total (test data only)
17 49
4 5 4 68
261 38
72
13
13 138
23
411 1602 10610
242 3.2 TIME-DEPENDENT BEHAVIOR
W.B.S. ELEMENT 3.2.1.3 FRACTURE BEHAVIOR OF TOUGHENED CERAMICS
H. T. Lin and P. F. Becher
Objective /Scope
Ceramics with reinforcing microstructures and ceramic composites offer important advantages for heat engine applications. Chief among these is the improved fracture toughness that can be achieved by appropriate design of microstructural and material parameters. Previous studies show that these materials often exhibit substantial improvement in damage , thermal shock, and slow crack growth resistances. However, design of such systems must also consider those factors influencing their performance at elevated temperatures.
In response to these needs, studies are conducted to determine the mechanical properties, (e.g., creep, delayed failure, strength, and toughness) at elevated temperatures for these toughened ceramics. Particular emphasis is placed on understanding how microstructure and composition influence the mechanical performance at elevated temperatures and the stability of these properties for extended periods at these temperatures. The knowledge gained from these studies provides input on how to modify materials to optimize their mechanical properties for the temperature ranges of interest.
Technical Highlights
The long-term mechanical reliability of silicon nitride ceramics at elevated temperatures is mainly governed by the time-dependent deformation processes such as slow crack growth (SCG) and/or creep. The dominant degradation processes depend upon the applied stress levels and test temperature and may also be closely related to the test environment. Previous fatigue studies1'2 have indicated that oxidizing environments can promote either SCG or creep process in silicon nitride ceramics at elevated temperatures as compared to the inert environments (i.e., argon and nitrogen). In addition, tensile creep results reported by Kossowsky et al.3 showed that the Norton HS-130A specimens (with 0.4 wt% MgO additive) tested in helium atmosphere exhibited lower creep rates but with shorter lifetimes than those tested in air. Furthermore, tensile creep studies conducted by Wereszczak et al.4 (in WBS Element 3.2.1.6 Life Prediction Verification) on a Norton NCX-5102 silicon nitride (4 wt% Y2O3) showed that the specimens tested in argon exhibited higher creep rates and shorter lifetimes than those tested in air. These results suggest that the fatigue and creep responses of silicon nitride ceramics are greatly influenced by the testing environments and sintering aid systems.
Tensile creep studies were, therefore, conducted in nitrogen (N2) and in air on (1) gas-pressure sintered (GPS) silicon nitride and (2) hot isostatically pressed (HIP) silicon nitride to elucidate environmental effects on the creep rate and controlling mechanism. The GPS silicon nitride ceramics contained additive mixtures of 5 vol% Yb2O3-0.5 vol% Al203 (designated SN5YbAI) and 10 vol% Yb2O3-0.5 vol% Al203 (designated SNIOYbAI). A post annealing at 1250°C for 12 h was carried out to

243
convert the intergranular amorphous phase in these two GPS silicon nitride ceramics to crystalline phase(s). On the other hand, the silicon nitride (designated as NT164, Saint-Gobain/Norton Industrial Ceramics) was hot isostatically pressed (HIPed) with 4 wt% Y203 additive and then post-annealed to crystallize the secondary phase(s). Small dog-bone type tensile creep specimens were employed in the present study and the creep displacements were continuously monitored using an optical-based laser extensometer.
1. Gas-pressure sintered silicon nitride ceramics
Figure 1 shows the creep rate versus applied stress curves for both GPS SN5YbAI and SNIOYbAI materials tested at 1300°C in air or in N2 atmosphere. The data show that the creep rates obtained in N2 for the both SN5YbAI and SNIOYbAI materials are at least four times lower than those tested in air at 1300°C under the stress levels employed. This illustrates that the creep rates of both the SNIOYbAI and SN5YbAI materials are accelerated when conducting the tests in an air environment. In addition, the SNIOYbAI material exhibits lower creep rates (about ten times) as compared with the SN5YbAI material tested in air or in N2 environments. Furthermore, the slopes of the creep rate versus applied stress curves in air and in N2 show that the SNIOYbAI material exhibits a stress exponent of ~ 6, which is lower than the exponents obtained for the SN5YbAI material (9.8 and 12). The high stress exponent obtained in tension with Si3N4 materials is generally attributed to the accumulated creep damage, i.e., cavitation. The lifetime versus applied stress curves for both the SNIOYbAI and SN5YbAI in air or N2 are shown in Fig. 2. For both GPS silicon nitride materials the specimens tested in N2 generally exhibit lifetimes that are four to ten times longer than those tested in air. In addition, the SNIOYbAI material reveals a 10-fold longer life than the SNSYbAI material under the same test environment. The higher creep rates and shorter lifetimes for both the SN5YbAI and SNIOYbAI materials tested in air at 1300°C could be a consequence of oxidation reactions and formation of additional amorphous intergranular phase(s). The difference in creep response at 1300°C between SN5YbAI and SNIOYbAI may be due to variation in the glassy phase content and the difference in oxidation reaction. Detailed electron microscopy studies are in progress to understand the changes in microstructural characteristics and compositions associated with the creep in these two test environments.
2. Hot isostatically pressed silicon nitride
Figure 3 shows the creep strain versus time curves for Norton NT164 tested at 1430°C and at an applied stress of 100 MPa in air or N2 atmosphere. The creep curve in N2 exhibited primary and secondary creep stages, whereas the one in air revealed primary, secondary, and tertiary creep stages. In addition, the specimen tested in N2 exhibited lower creep rate and longer life as compared with the one tested in air (as shown in Fig. 3), consistent with the results obtained for GPS silicon nitride materials as mentioned in the above (Figs. 1 and 2). It is apparent that the air environment (oxidation reaction) promoted the creep deformation process, thus shortening the creep life of silicon nitride ceramics. Additional creep tests under different applied stress levels and temperatures are in progress to understand the creep controlling mechanisms as a function of test environment.

244
Status of Milestones
Milestone No. 321317: "Evaluation of static fatigue and creep behavior of gas-pressure-sintering Si3N4 ceramics" was completed.
Milestone No. 32119: "Complete characterization of the effects of material parameters and oxidation process on the transition from slow crack growth to creep failure process in Si3N4 ceramics" was completed.
Milestone No. 321320: "Complete evaluation of the effect of an oxidizing, moist environment on the lifetime of candidate engine valve materials" will be delayed to March 1996 due to the difficulty to obtain the candidate SiAION valve materials.
Publications
1. H. T. Lin, J. O. Kiggans, and T. N. Tiegs, "High Temperature Deformation and Fracture Processes in Sintered Reaction-Bonded Silicon Nitride," submitted to J. Mater. Sci.
References
1. A. A. Wereszczak, etal., "Role of Oxidation in the Time-Dependent Failure Behavior of Hot Isostatically Pressed Silicon Nitride at 1370°C," J. Am. Ceram. Soc. 76 [11] 2919-22 (1993).
2. Y. Shigegaki, et al., "High Temperature Fatigue Properties of Silicon Nitride in Nitrogen Atmosphere," pp. 461-466 in Mat. Res. Soc. Symp. Proc. Vol. 287, Silicon Nitride Ceramics-Scientific and Technology Advances (1993).
3. R. Kossowsky, D. G. Miller, and E. S. Diaz, 'Tensile and Creep Strength of Hot-Pressed Si3N4," J. Mater. Sci. 10 (1975) 983-997.
4. A. A. Wereszczak, T. P. Kirkland, H. Cai, and M. K. Ferber, "Life Prediction Verification," pp. 55-61 in Ceramic Technology Project Bimonthly Technical Progress Report, August-September 1994, ORNL/CF-94/218, October 31, 1994.
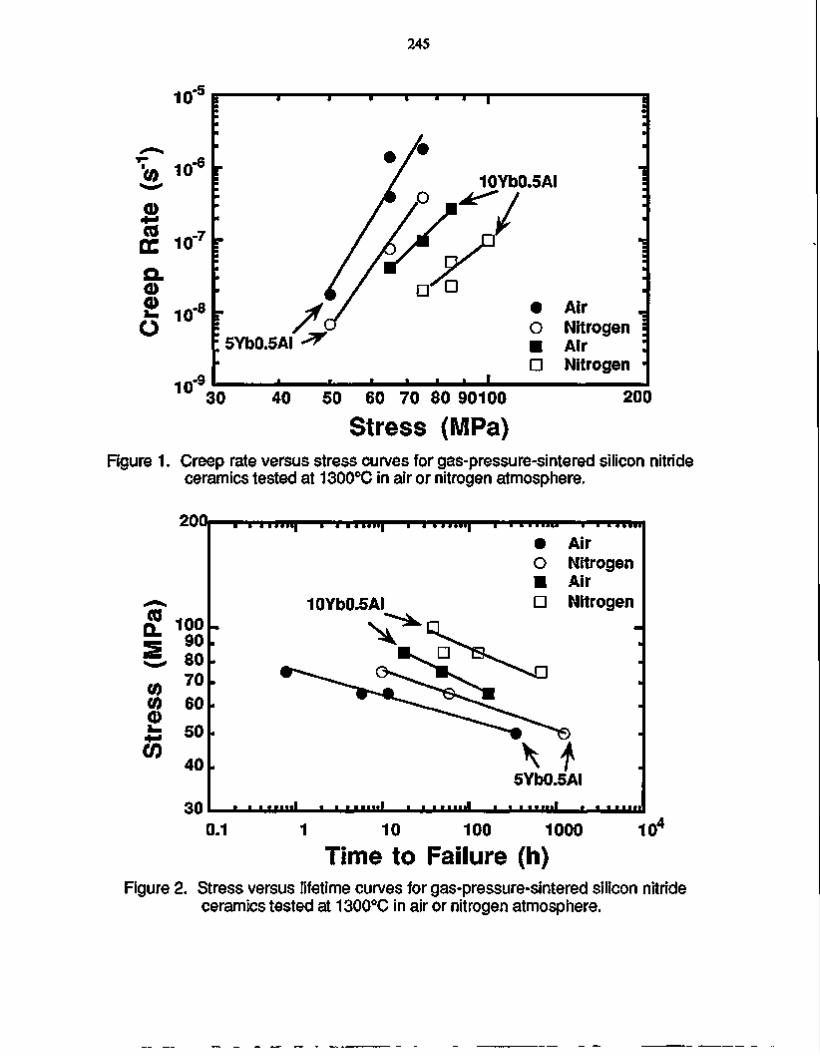
CO
CD
10'5E
10"
r£ 107
CD CD .p » 10
8
O
10"
245
i i i i |
10Yb0.5AI
■ i i i L
• Air O Nitrogen ■ Air □ Nitrogen
30 40 50 60 70 80 90100
Stress (MPa) 200
Figure 1. Creep rate versus stress curves for gaspressuresintered silicon nitride ceramics tested at 1300°C in air or nitrogen atmosphere.
200
S. 100L *= 901. ^ 80
CO 7 0
CO 60 CD
40 L
30
I I i i n i i | i i i i i i i q i i i i i i n j i i i n u n i i i I I I I I I • Air O Nitrogen ■ Air
10Yb0.5AI □ Nitrogen
5Yb0.5AI . . . . . . . . i . . . . . . . . i . . . . . . . . i . . . . . . . . i . . . . . . . .
0.1 1 10 100 1000 10^
Time to Failure (h) Figure 2. Stress versus lifetime curves for gaspressuresintered silicon nitride
ceramics tested at 1300°C in air or nitrogen atmosphere.

246
I I I J I I I : Norton NT164 ' Silicon Nitride
' I ■ ■ ■ I ' ■ ' I
X in Air 2.14x10"
8s""
J
in Nitrogen
5.93x10"9s"
1
0 * ■ ■ « ' ■ ■ ■ ' ■ ■ ■ ' ■ ■ ■ ' ■ ■ ■ ' * 200 400 600 800 1000
Time (h) Figure 3. Creep strain versus time curves for Norton NT164 tested at 1430°C
in air or nitrogen atmosphere.

247 Cyclic Fatigue of Toughened Ceramics K. C Liu, C. O. Stevens, and C R. Brinkman (Oak Ridge National Laboratory)
Obi ective/Scope The objective of this task is multifold:
1. To develop, design, fabricate, and demonstrate the capability of performing cyclic fatigue in tension-tension/compression and static fatigue testing in uniaxial tension/compression on candidate structural ceramics at elevated temperatures. Significant progress has been made in several areas on the experimental front (such as specimen/grip alignment, specimen heating, and high-temperature extensometry), including recent introduction of new testing capabilities in fully reversed tension-compression cyclic fatigue and compressive creep in the uniaxial mode.
2. To develop baseline information on cyclic fatigue behavior of candidate ceramics and, in turn, to establish a design database.
3. To develop creep and creep-rupture databases for advanced heat-engines design applications in the 1150 to 1370°C range.
4. To evaluate and refine existing constitutive models based on the information generated above.
5. To develop new constitutive models to facilitate design analyses of high-temperature structural components and improve their reliability.
Technical Highlights
Cyclic fatigue of GS-44 Si?N, at 1200°C The objective of the tests described in this section is to
determine cyclic fatigue behavior and the influence of cyclic waveform on the fatigue of Si3N4 ceramics. The waveforms shown in Fig. 1 were used to control cyclic fatigue testing in: (a) fully reversed tension-compression (T/C) mode with R-ratio (= min./max. stress amplitude) = -1, (b) tension-tension (T/T) mode with R = 0.1, and (c) compression-compression (C/C) mode with R = 0. A small R-ratio was used to prevent the load-train backlash during T/T fatigue loading. Hourglass-shaped (HG) specimens (Fig. 2a) were used in all three modes of fatigue testing and buttonhead (BH) specimens (Fig. 2b) in T/T mode testing only.
Results obtained from a series of previous tests on GN-10 Si3N4 at 1200°C indicated that T/T mode loading was more deleterious compared to T/C mode loading. Since T/T fatigue tests were performed on both HG and BH specimens using two different test machines, the influence of machine bias was rather remote. However, results obtained from fatigue tests of GS-44 Si3N4, shown in Fig. 3,

248 do not support the same finding conclusively because the T/T fatigue data generated from HG specimens (filled circles) do not agree well with those of BH specimens (filled squares). Material variation was suspected to be the cause of the discrepancy, since HG specimens were fabricated from a tile and BH specimens from another. To reconcile the differences, three HG specimens and two BH specimens are currently being fabricated from a single tile for further testing.
An exploratory fatigue test was performed on a specimen (HG-10) in C/C mode using the triangular waveform with R = 0 (Fig. lc) . Because it was a pilot test, a cyclic stress amplitude of -300 MPa was used as a starting point. The stress amplitude was increased intermittently in steps of -20 MPa each time the specimen completed -50,000 to -200,000 cycles without specimen failure. During the testing, acoustic emission (AE) was monitored continuously. Finally, the test was discontinued after the specimen completed -150,000 cycles at -600 MPa with a total of -3,690,000 cycles accumulated. The test was discontinued to prevent the specimen from buckling although no imminent failure was noticed. It is of interesting to note that no AE signals with amplitude in excess of a preset value of 45 db were detected through the entire period of testing on this specimen, suggesting that little or no fatigue damage may have been done to the specimen under C/C loading. Test results for specimen HG-10 (unfilled diamonds) are plotted in Fig. 3, in which the numbers refer to specimen numbers; filled symbols indicate rupture at the test condition indicated and unfilled symbols indicate no specimen failure when the teste condition was changed. The unfilled symbols with an arrow indicate the last test condition when the tests were discontinued. Two fatigue curve were drawn visually using the upper one to approximate the fatigue behavior of the material under T/C loading and the lower one as a lower bound to bracket the three square data.
A second fatigue test (specimen HG-12) was performed from the beginning with a stress amplitude of -600 MPa in C/C mode. The test was discontinued after completing 50,000 cycles because no AE signals were detected as was the case observed in the pilot test discussed previously. A lack of AE signals being detected during the course of testing led to an optimistic assumption that no fatigue damage had been done to the test specimen. With the assumption that the specimen remained in the unadulterated condition, the specimen was cycled in T/C mode with a stress amplitude of 300 MPa. The specimen failed at 11,654 cycles. For comparison with T/T and C/C data, the number of cycles has been doubled, as explained in a previous report1, and was plotted accordingly as shown in Fig. 3. Acoustic emission data were recorded during T/C loading. Audible signals were detected near the end of life only, indicating that lower-energy AE signals may have escaped from detection. The current value of the threshold set point may need to be lowered in order to capture more information, but it must be determined experimentally. The specimen ruptured at the mid-length which coincides with the

249 location that the AE data predicted to occur before actual failure. AE data are currently being analyzed to determined the optimum signal threshold value for GS-44 Si3N4.
Creep testing of NT-154 SJ3N] Creep curves of two long-term creep tests on NT-154 specimens
have been updated. The status of both tests is as follow. Specimen 20-56 (Fig. 4): This specimen has completed 37,000 h
(4.22 years) of testing. The test has been interrupted twice during this reporting period due to weather-caused power failures. Although pronounce transient creep was discerned following each time the specimen was reloaded, showing a sharp rise in creep rate due to consecutive reloading within a short period of time, the creep rate has decelerated to about the same as that prior to the occurrence of test disruptions.
Specimen 20-32 (Fig. 5): This specimen always showed transient creep of various intensities following each restarting of the test due to power outage. Examination indicates that fast transient creep was usually followed by a strain recovery, whereas moderate transient creep crossed over directly into steady-state creep with no visible strain recovery. The specimen has completed -30,000 h (3.42 years) of testing, and shows no unusual creep behavior since the system was down at t = -26,000 h. The current plan is to discontinue both tests for microstructural examinations of the tested samples.
Creep testing of GN-10 Si3N̂ Two creep tests on GN-10 Si3N4 being tested at the low-stress end of the creep-rupture range (long-term tests) are still in progress.
The status of both tests is as follows. Specimen 89367-1-2 (Fig. 6): Shortly before the end of the last
report period, the specimen showed steady-state negative creep. The problem was found to have resulted from steady drift of the electronic zero at a rate of 0.3 mV/h in the electronic conditioner for the mechanical extensometer. The creep curve reported in the last report1 has been revised accordingly and updated with new data.
Specimen 89367-1-3 (Fig. 7): The specimen had been undergoing steady-state creep at a rate of -1.7 X 10"10 s"1 for about 3500 h before the test was disrupted recently. Following the latest restarting, the specimen is currently showing strain recovery as occurred in previous situations.
Creep testing of furnace-annealed GS-44 SigN,

250 To examine whether conventional furnace annealing can also
effectively enhance the creep resistance of GS-44 Si3N4 as microwave annealing did or not, a virgin tile in the as-fabricated condition was annealed in a resistance-heating furnace at 1200°C for 100 h in air. Five specimens were machined from the tile and designated with a prefix of "FA". The specimens were tested in the as-machined condition with no post-machining surface finishing.
Specimen FA-3: This specimen was tested at 1200°C with an applied stress of 120 MPa. Test results are shown in Fig. 8 and compared with data reported previously for specimens tested in the as-sintered (specimen AS-8) and microwave-annealed (specimen MA12-2) conditions. The prefix of "MA12" indicates microwave annealing at 1200°C for 10 h with preannealing at 1100°C for 10 h. Although a direct comparison with the data for MA12-2 specimen is not valid due to the intermittent changes in applied stress, the trend portrayed by the first segment of the creep curve obtained at 120 MPa indicates that microwave annealing was clearly beneficial to the creep resistance of the material. Furnace annealing was also shown to be beneficial compared to the unannealed condition by an order of magnitude in creep rupture life.
Specimen FA-4: This specimen was tested at 1200°C with an applied stress of 140 MPa. Test results are shown in Fig. 9 and compared with previously reported creep data for specimens MA12-3 and -4 tested under the same condition. The creep curve of MA12-4 and that of FA-4 are shown to be about the same; however, specimen MA12-3 showed that the creep rate will remain relatively low and the creep rupture life will be long. No creep data for as-sintered specimens tested at 140 MPa are available, but its creep rupture life will be less than 30 h, inferring from the rupture life of specimen AS-8 indicated in Fig. 8. It is evident that furnace annealing is also beneficial to the enhancement of creep resistance but not as effective as annealing by microwave heating, which apparently needs further improvement to attain the desired consistency in creep behavior.
Creep testing of microwave-annealed GS-44 Si3Nd Low-temperature microwave annealing (M/A) at 1200°c was found
to be much more effective than high-temperature annealing above 1400°C in enhancing the creep resistance of GS-44 Si3N4. However, it is important that the material behavior must be consistently reproducible. To this end, two additional tiles were microwave annealed in the same furnace using the low-temperature heating schedule designated as "MA12". To facilitate discussions, locations of specimens are marked in each common tile shown in Fig. 10.
Specimen MA12-6 was tested with an applied stress of 140 MPa. Test results are plotted in Fig. 9 and compared with previously reported creep data1 generated from specimens, which were machined

251
from another tile marked as tile A in Fig. 10. Specimen MA12-6 was clearly the weakest in terms of creep life among the three MA12 specimens. The differences in creep behavior exhibited by the three specimens were not totally unexpected because specimens, such as MA12-3 and -4 although made from the same tile, still behaved quite differently. However, it was disturbing to find that specimen MA12-6 underperformed severely compared to a furnace annealed specimen FA-4, which was tested on the same machine, identical heating environment, and the same test condition.
Creep tests were performed on specimens MA12-7, -9, -10 at 1200°C with an applied stress of 100 MPa. To ensure that material, heat treatment, and test method are consistent, each of the specimens, all made from tile B, were tested in the same machine using the same equipment and test method. Test results shown in Fig. 11 confirm that data are reproducible under the controlled test environment. To facilitate comparison, the same data were replotted in Fig. 12. The severity of difference in creep behavior was again exhibited even though specimens were tested in the same creep testing machine. Creep resistance of specimen FA-1 was found to be better, although marginally, in comparison to that exhibited by the M/A specimens made from tile B.
In summary, the information gleaned from data shown in Figs. 9 and 12 suggests that inconsistent creep behavior exhibited by tiles A and B is due to either inconsistency in current techniques of microwave annealing or the difference in the base material or combination of both.
Compressive creep testing of ceramic materials at elevated temperatures
An exploratory compressive creep test was initiated on GN-10 Si3N4 at 1300°C with an applied stress of -125 MPa, using a dumbbell shaped specimen shown in Fig. 2c. Compressive creep virtually ceased after 100 h of testing, as shown in Fig. 13. Therefore, the applied stress was increased to -150 MPa after the specimen completed 210 h of testing at -125 MPa with a total creep strain of -0.084%. In contrast, a specimen tested in tension with the same magnitude of stress exhibited creep at a very high creep rate; hence, the specimen had a short rupture life. Subsequently, the applied stress was increased intermittently in steps of -25 MPa when the specimen showed no significant progress in creep deformation. Results obtained to date are summarized in Fig. 14. The specimen has just completed a period of -1500 h of testing at --250 MPa with a creep rate of —1.07 x 10"1 s"1. A review of overall data indicates that the creep rate increases approximately proportional to applied stress, suggesting that creep of Si3N4 under compression may be promoted by a shearing mechanism. No indication of imminent failure has been observed to date and the load-train remains stable.

252 The second compressive creep machine is now in operation. The
final checkout tests indicate the machine is capable of uniform compressive loading with a minimal bending below 2%. The optical extensometer was calibrated at elevated temperatures in the range from 900°C to 1400°C Interferences by convective air in the furnace tended to have reduced the resolution of signal output due to the temperature induced noise; however, its overall performance will still meet the minimum accuracy needed in creep strain measurement.
A GS-44 Si3N4 specimen was initially tested at 1200°C with an applied stress of -100 MPa, as shown in Fig. 14. Due to the failure of load control, the test was interrupted at t = 233 h. Subsequently, the specimen was reheated and reloaded to the original test condition. However, a change in creep behavior was clearly discernible showing transient creep immediately following the reloading. Although the creep curve is somewhat wavy, a reasonably steady-state creep rate can be inferred from the creep data obtained during the last 300 h of testing. Creep rate in tension for GS-44 at the same temperature and stress is also orders of magnitude higher than that in compression as is the case for GN-10. This asymmetric creep behavior in tension versus that in compression suggests that there is a serious flaw in current practice of analyzing and reporting bending creep data that are based on the elastic beam theory. Therefore, a revision is needed for current format of reporting such data so that bend data can be rationally correlated with uniaxial creep data.
The above work resulted in a draft paper entitled "A Multiaxial Viscoplastic Model for Advanced Si3N4 Ceramics." The paper has been submitted and accepted for oral presentation at the 20th Annual Cocoa Beach Conference, Cocoa Beach FL, January 7-11, 1996. The following is the abstract.
A MULTIAXIAL VISCOPLASTIC MODEL FOR ADVANCED Si3N4 CERAMICS, J. L. Ding, Washington State University, Pullman, WA 99164; K. C Liu* and C R. Brinkman, Oak Ridge National Laboratory, Oak Ridge, TN 37831 This is a refinement of a creep/creep rupture model developed
previously based on results obtained from uniaxial tensile creep tests of an advanced Si3N4 ceramic. The exploratory model in scalar form is limited for general applications due to the lack of generality. Severity of asymmetric creep behavior in tension compared to that in compression observed in recent experimental results necessitates this revision. The tensorial formulation follows the plasticity theories developed for soils. Material sensitivity to pressure, dilatancy and compaction, asymmetry between tension and compression, changes of material structure due to hardening of grain boundary phase, and deformation induced hardening and softening have all been considered. Provisions of such features in the proposed multiaxial model are shown to have elevated modeling flexibility, which permits that

253 a particular model form can be tailored to reflect some desired features of material behavior. The following abstract has been submitted to the 41st ASME Gas
Turbine and Aeroengine Conference, Birmingham, UK, June 10-13, 1996.
A TECHNIQUE TO ACHIEVE UNIFORM STRESS DISTRIBUTION IN COMPRESSIVE CREEP TESTING OF ADVANCED CERAMICS AT HIGH TEMPERATURES K. C. Liu, N. E. Holshauser (North Carolina A&T State University, Greensboro, NC), C. 0. Stevens, and C. R. Brinkman Previously, uniaxial testing of brittle materials in tension
was considered to be more difficult than that in compression due to the lack of appropriate equipment to achieve good load column alignment and, hence, low bending stress. To circumvent the experimental difficulty, a short cylindrical specimen was often tested in compression as an indirect method of generating desired information. However, result of neither test can substitute for the others due to the peculiar nature of ceramic materials. With the use of the self-aligning coupler in the load-column, robust tensile testing of brittle materials can now be accomplished routinely. Contrastingly, little or no innovative techniques have been presented for compressive testing in recent years. A cursory conclusion might lead an investigator to believe
that compressive testing of brittle materials is simple to perform. However, careful examination can easily show otherwise because bending stress due to initial eccentric loading is increasingly accentuated under compression loading if no self-aligning feature is built in the load-column system. The paper describes an innovative load-column assembly with such special features. Key elements and techniques to achieve uniform stress distribution in compressive loading are discussed. Strain-gaged specimens have been used to verify that low bending stress below 2% is routinely achievable with the use of the self-aligning coupler. Results of a compression creep test are presented for a dumb-bell shaped silicon nitride specimens tested at 1300°C over a period in excess of 1000 h.
A simulation study on creep of Si3N̂ under four-point bending based on the ORNL viscoplastic model - J. L. Ding (Washington State University) and K. C. Liu
Correlation of creep data obtained by uniaxial tensile creep testing and those by four-point bending has been difficult because the intrinsic stress distribution of the ceramic beam specimen under constant load creep is time dependent and can not be measured directly. The major difficulty stems from: (1) the use of the elastic beam theory which assumes the initial elastic stress distribution in the bend specimen remains unchanged during the

254 course of creep under constant load and (2) the assumption that creep rate under tension is the same as that under compression. As the test data illustrated in preceding sections, the latter assumption is not valid and this, in turn, invalidates the former.
Several studies on the topics have been reported using various postulates in order to simplify their analyses. In our simulation study, no simplifications are used in the fundamental equations. While reviewing previous papers for comparative studies, we found that a paper frequently referenced in the studies of four-point bending creep was seriously flawed. The authors of the paper were informed of the error. Preliminary results of our study show that the asymmetry in stress distribution along the depth of the bend bar is severe based on the new information generated in earlier discussions. A draft paper describing the above work is being prepared for publication.
Tensile stress-rupture testing of NT-154 Sigfy in support of the Ceramic Turbine Engine Demonstration Project (CTEDP)
The objective of this Project is to understand the effect of proof testing on the reliability of turbine engine components such as blades and stators. ORNL has agreed to conduct thirty tests on NT-154 tensile specimens in support of the program. Fifteen specimens are to be tested at 1204°C with a stress of 310 MPa and remaining at 1315°C and 276 MPa.
A total of six specimens, two specimens at 1204°C and four at 1315°C, were tested. Results are summarized in the following table.
Table 1 - Summary of results for tensile stress-rupture tests on NT-154 Si3N4 specimens.
Specimen No. 35293 35308 35277 35298 35300 35355
Temperature °C
1204 it
1315 II
II
II
Stress MPa 310 ti
276 it
II
256*
Creep Strain at Rupture, %
0.298 0.388 0.214 0.004 0.136
Life h 428.7 363.1 3.85 0.1 1.9
Note: a = Failed on loading at the stress indicated. The above information and test data have been transmitted to
AlliedSignal for review and analysis.

255
Important Findings and Observations Results of cyclic fatigue tests on GS-44 Si3N4 indicate that C/C
cyclic fatigue loading is the least damaging mode compared to other loading modes used in T/T and T/C tests. A total lack of AE signals detected during C/C fatigue testing appears to reinforce the above finding. Status of Milestones
Completed technical report covering results of the fully reversed tension/compression cyclic fatigue tests on Si3N4 ceramics - Milestone 321422, due on April 30, 1995 Publications 1. The abstract entitled "A Multiaxial Viscoplastic Model for
Advanced Si3N4 Ceramics" by J. L. Ding, K. C. Liu, and C. R. Brinkman, has been accepted for the 20th Annual Cocoa Beach Conference, Cocoa Beach FL, January 7-11, 1996.
2. The abstract entitled " The Influence of Heat Treatment on Creep Behavior of a Sintered Si3N4 Ceramic" by K. C. Liu, C. O. Stevens, C. R. Brinkman, K. L. More, J. O. Kiggans, and T. N. Tiegs has been accepted for the Cocoa Beach Conference.
3. The abstract entitled "A Technique to Achieve Uniform Stress Distribution in Compressive Creep Testing of Advanced Ceramics at High Temperatures" by K. C. Liu, N. E. Holshauser, C. O. Stevens, and C. R. Brinkman has been accepted by the 41st ASME Gas Turbine and Aeroengine Conference, Birmingham, UK, June 10-13, 1996
4. K. C. Liu, C. O. Stevens, C. R. Brinkman, K. L. More, J. D. Kiggans, Jr., and T. N. Tiegs, "Enhancement of creep resistance of a sintered Si3N4 by microwave annealing," pp. 27-31 in the proceedings of the Science and Technology Alliance Materials Conference '93, North Carolina A & T State University, Greensboro, N.C., October 27-29, 1993, Technomic Publishing Co., 1995
References 1. K. C. Liu, C. 0. Stevens, and C. R. Brinkman, "Cyclic Fatigue of Toughened Ceramics," pp. 286-306, in Ceramic Technology Project Semiannual Progress Report for April 1994 through September 1994. 0RNL/TM-12924, Lockheed Martin Energy Systems, Inc., Oak Ridge National Laboratory, June 1995.

256 LIST OF FIGURES Fig. 1 - Triangular waveforms used in fatigue tests: (a) for fully reversed tension-compression (T/C), (b) tension-tension (T/T), and (c) compression-compression (C/C) fatigue testing. Fig. 2 - (a) An hourglass shaped specimen, (b) a buttonhead tensile specimen, and (c) a dumb-bell shaped specimen for compressive testing. Fig. 3. Cyclic fatigue behavior of GS-44 Si3N4 tested at 1200°C. Test results hint that cyclic fatigue damage under C/C mode may require a much greater stress amplitude than 600 MPa. Fig. 4. Creep curve of NT-154 Si3N4 (specimen 20-56) tested at 1250°C and 175 MPa. The specimen has accumulated a total of 37,000 h (or 4.22 years) of testing. Despite the recent test disruptions by power outages, the creep behavior did not appear to have been altered. Fig. 5. Creep curve of NT-154 Si3N4 (specimen 20-32) tested at 1250°C and 150 MPa. The current creep rate shows to be about the same as that observed prior to the most recent test disruption by a power outage. The specimen has accumulated a total of 30,000 h (or 3.42 years) of testing. Fig. 6. Creep curve of GN-10 Si3N4 (specimen 89367-1-2) tested at 1200°C and 125 MPa. The creep curve has been revised according to the signal drift rate of 0.3 mV/h measured in the recent extensometer calibration. Fig. 7. Creep curve of GN-10 Si3N4 (specimen 89367-1-3) being tested at 1150°C and 200 MPa. The test has been interrupted recently due to a power outage, and the specimen is currently undergoing the strain recovery phase. Fig. 8. Comparison of creep curves of GS-44 Si3N4 specimens tested at 1200°C with applied stresses as indicated. Specimen numbers with a prefix of "AS" indicated the specimen was tested in as-sintered condition, "FA" indicates furnace annealing at 1200°C for 100 h in air, and "MA12" microwave annealing at 1200°C for 10 h with preannealing at 1100°C for 10 h. Fig. 9. Comparison of creep curve of GS-44 Si3N4 specimens tested at 1200°C with an applied stress of 140 MPa. Fig. 10. Layout diagrams showing the locations of specimens in two tiles which were microwave annealed at 1200°C for 10 h with preannealing at 1100°C for 10 h. Fig. 11. Creep curves of three GS-44 Si3N4 specimens which were fabricated from the same tile and tested under the same condition. Test results illustrate that data are reproducible under the

257
controlled test environment. Fig. 12. Comparison of creep curve of GS-44 Si3N4 specimens tested at 1200°C with an applied stress of 100 MPa. Fig. 13. Creep curve of GN-10 Si3N4 currently being tested at 1300°C in compression. Fig. 14. Creep curve of GS-44 Si3N4 currently being tested at 1200°C with an applied stress of 100 MPa in compression.

258
(a) R = -1
(b) R = 0.1 TIME, t
TIME, t
(c) R * 0
Stressing Rate = 21,000 MPa/min. R = Minimum/Maximum Stress
Fig. 1. Triangular wave forms used in fatigue tests: (a) for fully reversed tension-compression (T/C), (b) tension-tension (T/T), and (c) compression-compression (C/C) fatigue testing.
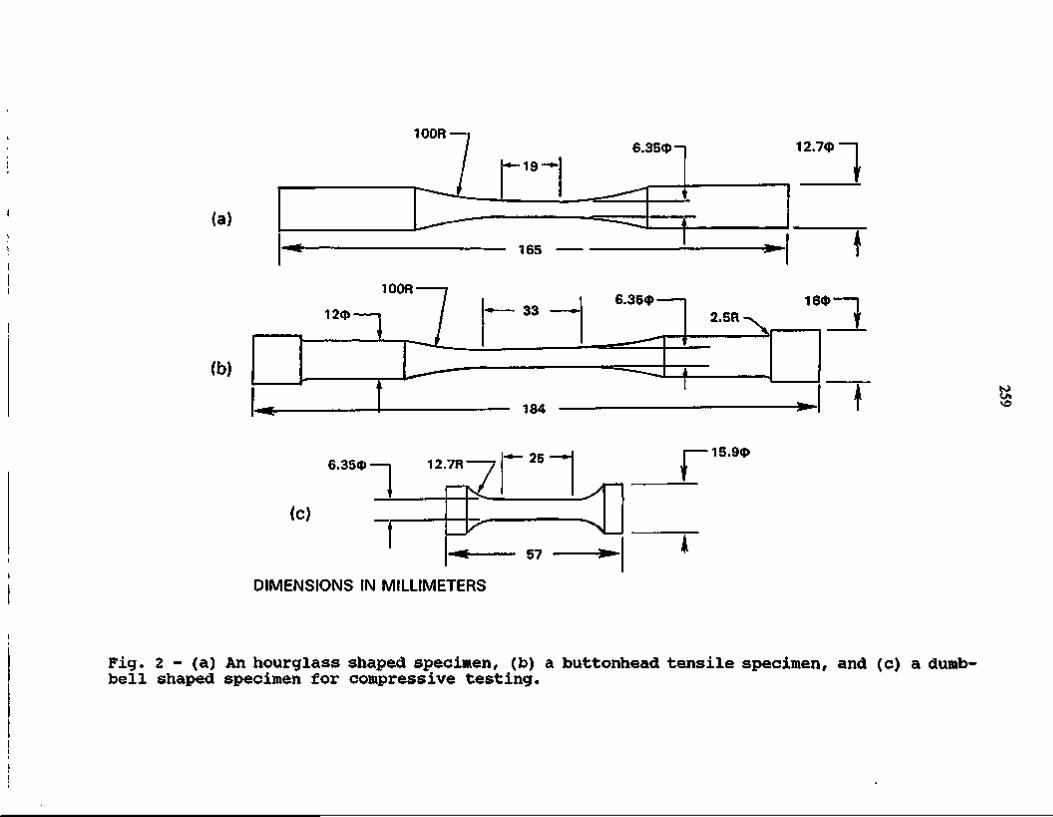
100R
-—19 —► 6.35(J)i 12.7<P
1 (a)
165 ^
100R
(b)
33
184
6.35(J> 16<t> 2.5R
►
1 to
6 .35cp—| 12.7R
1 (C)
7 — 25
^ \ L 57
DIMENSIONS IN MILLIMETERS
r 15.9(J)
Fig. 2 (a) An hourglass shaped specimen, (b) a buttonhead tensile specimen, and (c) a dumbbell shaped specimen for compressive testing.

ORNL-DWG 94-8031R1
700
(0 GL
UJ Q
CO
UJ
I llllllll I llllllll 11 GS-44 Si3N4, TEMP.
TT = 1200°C
ON O
CYCLES TO FAILURE
Fig. 3. Cyclic fatigue behavior of GS-44 Si3N4 tested at 1200°C. Test results hint that cyclic fatigue damage under C/C mode may require a much greater stress amplitude than 600 MPa.

ORNL-DWG 91-116014R6
E
< cc (f)
12000
10000
8000
6000
4000
2000
Specimen 20-56 NT-154, 1250°C, 175 MPa
to
10000 20000 30000 40000
TIME (h)
Fig. 4. Creep curve of NT-154 Si3N4 (specimen 20-56) tested at 1250°C and 175 MPa. The specimen has accumulated a total of 37,000 h (or 4.22 years) of testing. Despite the recent test disruptions by power outages, the creep behavior did not appear to have been altered.

ORNL-DWG 92-14551R4
E
< CC H
12000
10000
8000
6000
4000
2000
NT-154 Specimen 20-32, 1250°C
o
t
pward open arrows indicate reloading after power outage
3 yrs
t
150 MPa'
\
to to
5000 10000 15000 20000 25000 30000
TIME (h) Fig. 5. Creep curve of NT-154 Si3N4 (specimen 20-32) tested at 1250°C and 150 MPa. The current creep rate shows to be about the same as that observed prior to the most recent test disruption by a power outage. The specimen has accumulated a total of 30,000 h (or 3.42 years) of testing.

ORNL-DWG 93-8286R4 8000
E
< CC H (/>
CL UJ UJ CC o
6000
4000
2000
1 1 1 1 GN-10, Spec. No. 89367-1-2 TEMP. = 1200°C | STRESS = 125 MPa
Each open arrowhead indicates a disruption by power outage.
1 yr s. 2 yrs \l to
5000 10000
TIME(h)
15000 20000
Fig. 6. Creep curve of GN-10 Si3N4 (specimen 89367-1-2) tested at 1200°C and 125 MPa. The creep curve has been revised according to the signal drift rate of 0.3 mV/h measured in the recent extensometer calibration.

ORNL-DWG 93-10151R5
4000
E
< CC H CO
Q. UJ UJ uu o
3000
2000
1000
GN-10, 89367-1-3, 1150°C
to ■fc.
5000 10000 15000 20000
TIME (h)
Fig. 7. Creep curve of GN-10 Si3N4 (specimen 89367-1-3) being tested at 1150°C and 200 MPa. The test has been interrupted recently due to a power outage, and the specimen is currently undergoing the strain recovery phase.

ORNL-DWG 94-8033R1
10000
8000 AS-8 (120 MPa)
GS-44, 1200°C
E
< CC H </)
Q. UJ UJ CC O
6000
4000
2000
to
500
TIME (h) Fig. 8. Comparison of creep curves of GS-44 Si3N4 specimens tested at 1200°C with applied stresses as indicated. Specimen numbers with a prefix of "AS" indicated the specimen was tested in as-sintered condition, "FA" indicates furnace annealing at 1200°C for 100 h in air, and "MA12" microwave annealing at 1200°C for 10 h with preannealing at 1100°C for 10 h.
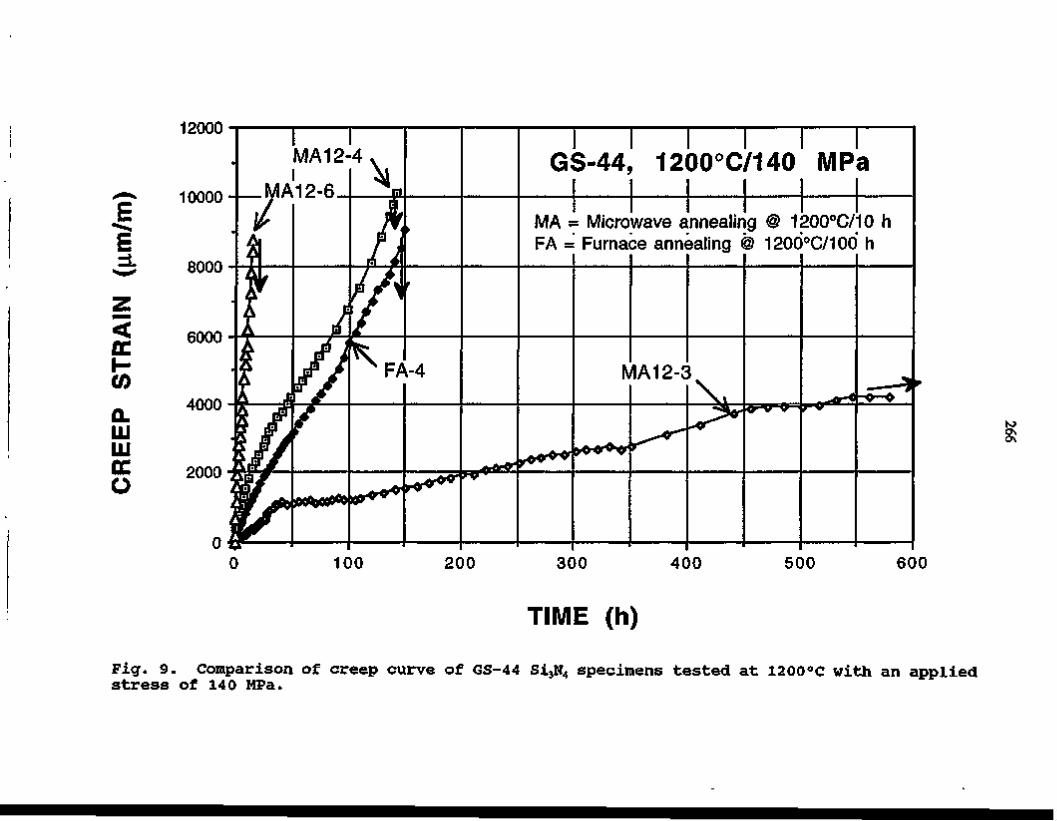
12000
*-> 10000
E =1
< DC h-(0 Q-UJ UJ CC O
8000
6000
4000-
2000
GS-44, 1200°C/140 MPa
MA = Microwave annealing @ 1200°C/10 h FA = Furnace annealing @ 1200°C/100 h
to
600
TIME (h)
Fig. 9. Comparison of creep curve of GS-44 Si3N4 specimens tested at 1200°C with an applied stress of 140 MPa.

Specimen MA12-MA12-MA12-MA12-MA12-
-1 -2 -3 -4 -5
Tile A
Specimen MA12-6 MA12-7 MA12-8 (reserved) MA12-9 MA12-10
Tile B
Fig. 10. Layout diagrams showing the locations of specimens in two tiles which were microwave annealed at 1200°C for 10 h with preannealing at 1100°C for 10 h.

ORNL-DWG 95-9790
E
< CC co Q. UJ UJ CC O
14000
12000
10000
8000
6000
4000
2000
0
GS-44 1200
■
•
•
■jf
(Micro) °C, 100 I
mf
wave \liPa
Ar mealed)^
_s^*i
—B—
A —
. 1
'vv 'i
MA12-7 MA12-9 —
IVIrt 1 £.- 1 U
1 —
to Os oo
0 10 20 30 40 50 60
TIME (h)
Fig. 11. Creep curves of three GS-44 Si3N4 specimens which were fabricated from the same tile and tested under the same condition. Test results illustrate that data are reproducible under the controlled test environment.

ORNL-DWG 95-9793
< CC h-co a. UJ ui cc o
12000
10000
E =1 O 8000
6000
4000
2000-
MA12-7,-9,-10
to
TIME (h)
Fig. 12. Comparison of creep curve of GS-44 Si3N4 specimens tested at 1200°C with an applied stress of 100 MPa.

270
£
ORNL-DWG 94-14047
10000
8000
6000
GN-10 Si3N4, 1300°C
-Tensile Creep @ 125 MPa (t'r = 15.15 h)"
-4000 200 400 600 800 1000
-2000
-4000
-6000
-8000 1000 1500 2000 2500 3000 3500
TIME (h)
1200
•
^ ^ B ^ P I ,
•
_-225 MPa
nWU&bur&a:
^ ^
S^nntnrnnt tttoa&%Rfi
"-250 MPa
^Sooiengje
^ ^
"""^iiBinatt
4000
Fig. 13. Creep curve of GN-10 Si3N4 currently being tested at 1300°C in compression.

1000
^ 500
E
z < cc h-co CL UJ UJ CC o
-500
-1000
-1500
-2000
I 1 Compression Creep GS-44 Si3N4, 1200°C/100 MPa
Test interrupted for test system service
200 400 600 800 1000
TIME (h)
Fig. 14. Creep curve of GS-44 Si3N4 currently being tested at 1200°C with an applied stress of 100 MPa in compression.

272
3.2.1. Life Prediction Verification A. A. Wereszczak, H. Cai, M. K. Ferber, and T. P. Kirkland (ORNL)
Objective/Scope
There are three central goals of the proposed research program: the generation of engineering data from high temperature mechanical testing; microstructural characterization of failure phenomena; and the implementation and verification of life prediction methods involving structural ceramics. Ultimately the prediction of the high temperature mechanical performance and service life, is information that is critical for the progress towards implementation of structural ceramics as components in internal combustion and automotive gas turbine engines.
The systematic study of the high temperature mechanical performance of silicon nitride and SiAION is undertaken as a function of temperature and time. A different temperature regime will serve as an independent parameter for each material. Studies on both SiAION and silicon nitride will be conducted at temperatures ~ <1000°C, while studies with only silicon nitride will be at temperatures =>1000°C; these are desired operating temperature ranges for internal combustion and automotive gas turbine engines, respectively. For the lower temperature regime, properties such as strength and fatigue life will be measured in the SiAION and silicon nitride material as a function of temperature. For the higher temperature regime, tensile stress-rupture data will be generated on silicon nitride by measuring fatigue life at a constant or cyclic stress. The time-dependent deformation will also be monitored so that high-temperature creep and its effects may be studied.
The second goal of the program is to characterize the evolution and role of damage mechanisms associated with high temperature deformation. The damage will be examined using established ceramographic, SEM, TEM, and non-destructive acoustic techniques. Several microstructural aspects of high-temperature failure will be examined:
(1) the extent of slow crack growth; (2) the evolution of cavitation-induced damage and fracture; (3) the transition between brittle crack extension and cavitation-induced growth; (4) crack blunting; and (5) the evolution and role of oxidation assisted damage.
Lastly, available analytical and numerical models will be utilized to predict the life of complex-shaped components and prototype engine parts (e.g.,. valves). The applicability of analytical models such as the Monkman-Grant (represents a relationship of creep rate to time-to-failure) and the Sherby-Dorn models (represents a temperature compensated
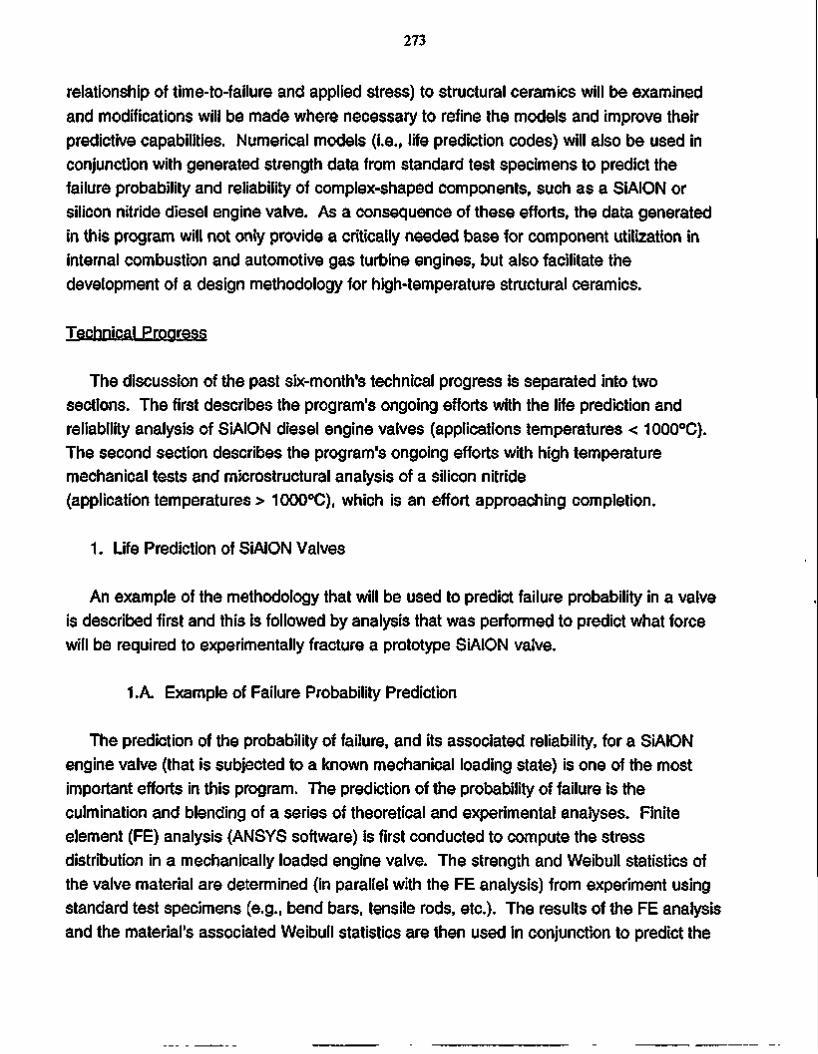
273
relationship of time-to-failure and applied stress) to structural ceramics will be examined and modifications will be made where necessary to refine the models and improve their predictive capabilities. Numerical models (i.e., life prediction codes) will also be used in conjunction with generated strength data from standard test specimens to predict the failure probability and reliability of complex-shaped components, such as a SiAION or silicon nitride diesel engine valve. As a consequence of these efforts, the data generated in this program will not only provide a critically needed base for component utilization in internal combustion and automotive gas turbine engines, but also facilitate the development of a design methodology for high-temperature structural ceramics.
Technical Progress
The discussion of the past six-month's technical progress is separated into two sections. The first describes the program's ongoing efforts with the life prediction and reliability analysis of SiAION diesel engine valves (applications temperatures < 1000°C). The second section describes the program's ongoing efforts with high temperature mechanical tests and microstructural analysis of a silicon nitride (application temperatures > 1000°C), which is an effort approaching completion.
1. Life Prediction of SiAION Valves
An example of the methodology that will be used to predict failure probability in a valve is described first and this is followed by analysis that was performed to predict what force will be required to experimentally fracture a prototype SiAION valve.
1 .A. Example of Failure Probability Prediction
The prediction of the probability of failure, and its associated reliability, for a SiAION engine valve (that is subjected to a known mechanical loading state) is one of the most important efforts in this program. The prediction of the probability of failure is the culmination and blending of a series of theoretical and experimental analyses. Finite element (FE) analysis (ANSYS software) is first conducted to compute the stress distribution in a mechanically loaded engine valve. The strength and Weibull statistics of the valve material are determined (in parallel with the FE analysis) from experiment using standard test specimens (e.g., bend bars, tensile rods, etc.). The results of the FE analysis and the material's associated Weibull statistics are then used in conjunction to predict the

274
component reliability as a function of the severity of the applied mechanical loading. For this program's effort, life prediction codes ERICA and CERAMIC (developed at AlliedSignal under the sponsorship of the Ceramic Technology Project) will lastly be applied for the reliability analyses. An example of this method follows.
Two different ceramic materials are considered in this example, one with a relatively high Weibull Modulus (m = 20, designated as material "M20") and one with a relatively low Weibull Modulus (m = 10, designated as material "M10"). Both materials have a characteristic flexure strength of 800 MPa, as determined from four-point flexure tests using MIL-B size bend bars. The corresponding Weibull analyses are represented in Fig. 1. All failures were a consequence of crack growth from surface flaws.
The sample test data were analyzed to extract material design data which were characteristically independent of the test specimen size and geometry. The design data analyzed for an effective unit surface area (1 mm2) with corresponding 95% confidence bounds are shown in Fig. 2.
The valve was analyzed with axisymmetric boundary conditions and a valve-face combustion pressure of 16 MPa (2.3 ksi). The valve was in frictional contact with the seat; other sources of stresses (e.g., thermal) were neglected in this analysis. The FE mesh and the representative maximum principal stress distribution are shown in Figure 3. The greatest tensile stress was identified to be 147 MPa and existed along the contour between the valve head and valve stem. Risk integration was then performed using a combination of the flexure strength test results and the surface definition from the FE analysis (ERICA). Lastly, the component reliability was then computed from the risk factor and material design data (CERAMIC). The results of the predicted reliability as a function of the combustion pressure are shown in Figure 4.
Under a combustion pressure of 16 MPa, the valve reliability for material M10 was approximately 99.999% at the 95% confidence lower bound, signifying that there is a slight chance of component failure. However, the probability of failure could significantly increase with over-pressurization. In addition, the reliability would decrease with increasing service time as a result of time-dependent crack growth. As a consequence of this reliability analysis, material M10 may not be an acceptable candidate material for a component for this application.
In comparison, the component made from material M20 has a higher reliability (>99.999%) than material M10 at equivalent combustion pressures. There is a greater margin of safety for over-pressurization and for time-dependent crack growth too. Therefore, material M20 would be preferred as a candidate material for a component in
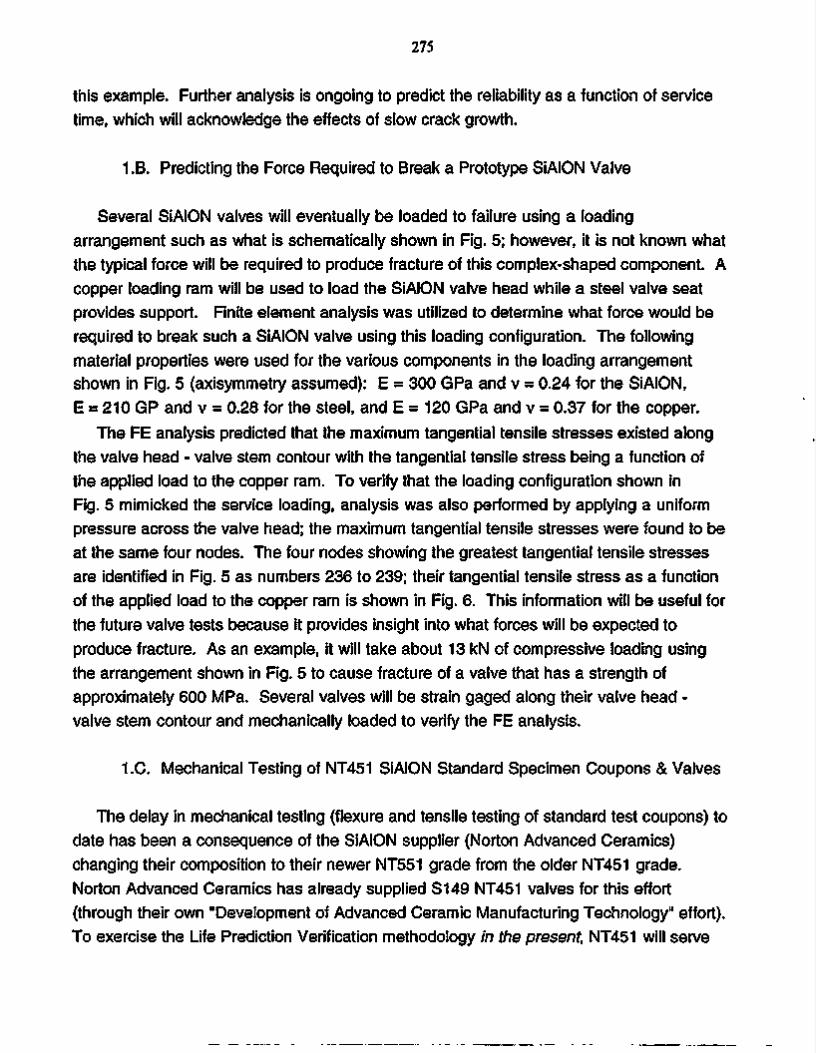
275
this example. Further analysis is ongoing to predict the reliability as a function of service time, which will acknowledge the effects of slow crack growth.
1.B. Predicting the Force Required to Break a Prototype SiAION Valve
Several SiAION valves will eventually be loaded to failure using a loading arrangement such as what is schematically shown in Fig. 5; however, it is not known what the typical force will be required to produce fracture of this complex-shaped component. A copper loading ram will be used to load the SiAION valve head while a steel valve seat provides support. Finite element analysis was utilized to determine what force would be required to break such a SiAION valve using this loading configuration. The following material properties were used for the various components in the loading arrangement shown in Fig. 5 (axisymmetry assumed): E = 300 GPa and v = 0.24 for the SiAION, E = 210 GP and v = 0.28 for the steel, and E = 120 GPa and v = 0.37 for the copper.
The FE analysis predicted that the maximum tangential tensile stresses existed along the valve head - valve stem contour with the tangential tensile stress being a function of the applied load to the copper ram. To verify that the loading configuration shown in Fig. 5 mimicked the service loading, analysis was also performed by applying a uniform pressure across the valve head; the maximum tangential tensile stresses were found to be at the same four nodes. The four nodes showing the greatest tangential tensile stresses are identified in Fig. 5 as numbers 236 to 239; their tangential tensile stress as a function of the applied load to the copper ram is shown in Fig. 6. This information will be useful for the future valve tests because it provides insight into what forces will be expected to produce fracture. As an example, it will take about 13 kN of compressive loading using the arrangement shown in Fig. 5 to cause fracture of a valve that has a strength of approximately 600 MPa. Several valves will be strain gaged along their valve head -valve stem contour and mechanically loaded to verify the FE analysis.
1.C. Mechanical Testing of NT451 SiAION Standard Specimen Coupons & Valves
The delay in mechanical testing (flexure and tensile testing of standard test coupons) to date has been a consequence of the SiAION supplier (Norton Advanced Ceramics) changing their composition to their newer NT551 grade from the older NT451 grade. Norton Advanced Ceramics has already supplied S149 NT451 valves for this effort (through their own "Development of Advanced Ceramic Manufacturing Technology" effort). To exercise the Life Prediction Verification methodology in the present, NT451 will serve

276
as the vehicle material because it is already available. Norton Advanced Ceramics has provided supply of data that was generated on flexure bars at their facility, and also a supply of NT451 stock material; this will enable mechanical tests to be conducted here as well. Even though the supply of data and stock material of NT451 will not be enough to satisfy the entire test matrix for this Life Prediction Verification effort, which was described in an earlier bimonthly report,1 it will provide a foundation of engineering data that can be used in the life prediction of the S149 NT451 valves using the codes ERICA and CERAMIC. NT551 SiAION test coupons and valves should be available in late FY95 or early FY96. Once a material supply of NT551 is available to the Life Prediction Verification effort, the entire test matrix described in Ref. [1] will be examined and a more thorough life prediction of NT551 valves will be made using data that results from the completed test matrix.
As mentioned, valve blank material of NT451 SiAION was sent by Eric Bright of Norton Advanced Ceramics, East Granby, CT, and received during the present reporting period. The NT451 SiAION composition is no longer fabricated, so this material was acquired with the intent of: (1) fabricating standard test coupons (flexure bars, biaxial flexure disks, tensile rods, and rotary bend fatigue specimens [see Figs. 7 and 8]) out of it, (2) generating engineering data from them, and (3) using the engineering creep with finite element analysis to predict the mechanical performance of the NT451 SiAION S149 valves. To ultimately verify the capabilities of the life prediction codes, the predicted performance of the valves will be compared to data generated when the actual valves are mechanically characterized.
Useful information was generated from a strain-gaged, rotary bend fatigue specimen that was loaded to failure using the rotary bend fatigue tester belonging to our Mechanical Characterization and Analysis Group. After the strain-gaged specimen was mounted in the tester, the applied bending moment was linearly increased until fracture occurred. The outer fiber tensile stress (S) was calculated using the expression,
° ~ 0.0982 D3
where M is the applied moment (in in«lbs) and D is the specimen's minimum diameter (in inches); the equation is derived from elastic beam bending theory. The stress-strain response that was measured in shown in Fig. 9. The calculated Young's Modulus was consistent with what the manufacturer has reported for NT451 SiAION.2 Due to the small volume of material that was subjected to this high tensile stress, and the statistical nature

277
of strength in ceramics, it is believed that higher strengths will be typical of these rotary bend fatigue specimens as compared to bend bars and tensile rods of the same material.
Pre-mechanical testing efforts have been initiated on the S149 NT451 valves. These assessment efforts will generate (and serve as) an integral database that will be referred to after the S149 NT451 valves are mechanically loaded to failure; it is hoped that any anomalous or unexpected results obtained during the mechanical tests will be explained by information generated from the pre-testing dimensional and material-integrity characterization. The description of the test plan effort for these valves is divided into two sections: "Dimension and Material Integrity" which describes the pre-testing characterization of the S149 NT451 valves, and "Mechanical Analysis" which describes the proof-testing tests that the S149 NT451 valves will be subjected to, along with the load to failure tests. The description of each of these sections is further subdivided into more detailed task descriptions.
1.C.I. Dimensional and Material Integrity
Four efforts will be at the core of the characterization efforts to assess the dimensional and material-integrity of the as-received S149 NT451 valves.
1 .C.La. Non-Destructive Evaluation (NDE)
Computed Tomography (CT) scans are being acquired on all the supplied S149 valves through a collaboration with W.B.S. Element 3.5 "Nondestructive Evaluation Development." The areas of the valves that will be subjected to the highest stress concentrations will be examined and the presence of defects or flaws will be sought; the whole volume of the valve is not being inspected because the testing time per valve would be extremely excessive. The two regions of the valves that are subjected to the highest stress concentrations during service are the valve head/stem contour and the valve-spring keeper groove; these volumes in each valve under investigation are shown in Fig. 10. All the valves will be documented by the CT scans and later referenced after they are mechanically tested.
1 .C.Lb. Dimensional Verification
Dimensional verification of the supplied NT451 valves will be conducted with staff of the Ceramic Machining Users Center (CMUC) in the High Temperature Materials

278
Laboratory. A new Starrett Criterion coordinate measurement machine (CMM) will be used to measure the longitudinal-axis profiles of all the S149 NT451 valves at four 90° orientations about the valve's axis of symmetry. The measured profiles will be compared with the valves original schematic drawing using the system's software.
An examination of the as-received dimensions of the S149 valves has yielded some interesting results to date. The CCM showed that the faces of the as-received valves indeed may not be planar. Figure 11 shows that a slightly concave contour of one valve existed. Analysis such as this is being documented and will later be accessed after mechanical testing to examine if the measured dimensional state of the valve may explain how it mechanically performed.
1 .C.I.c. Optical Inspection
Low-powered (~ 10 - 30x) optical microscopy is being conducted on all the S149 NT451 valves. All surface imperfections (spots, regions of discoloration, other apparent flaws) are being marked on the specimen with permanent pen and appropriately identified in a logbook. The positions of the imperfections on the valve are also being logged using a cylindrical-based coordinate system. All the valves will be documented by optical inspection and the results will later be referenced after they are mechanically tested.
1 .C.I.d. Machining Inspection
The surface machining of all the valves will be examined by staff in the CMUC who will be using a Rodenstock Laser Surface Profilometer. Like the areas of high stress concentration that will be examined by CT scans, the surface finish of these same regions, and additional surfaces if necessary, will be measured to ensure that the machine shop responsible for the machining of these S149 NT451 valves satisfied the machining specifications. All the valves will be documented by laser profilometry and the results will later be referenced after they are mechanically tested.
1.C.II. Mechanical Analysis
Prior to their shipment to the HTML, the S149 NT451 valves were subjected to a testing procedure performed by Norton Advanced Ceramics. To some extent, these tests will likely be repeated as part of this effort for verification purposes, and perhaps others too will be conducted. Lastly, the S149 NT451 valves will be mechanically loaded to failure. Any

279
anomalous mechanical behavior will be examined in reference to the dimensional and material-integrity analysis that was performed. Most importantly though, the results from the strength tests will be compared to the life predicted values from S149 NT451 test data.
I.C.ILa. Valve Proof Tests
Stem-bend and axial-pull proof tests were performed on the S149 NT451 valves at Norton Advanced Ceramics prior to their shipment to the HTML. With the servohydraulic and rotary bend testers purchased on the CT Project, these tests can either be readily repeated or mimicked in some form. The proof tests would verify the as-received mechanical integrity of the material prior to its mechanical loading to failure, which is described next.
1.C.H.b. Valve Strength Tests
Fixturing has been designed to facilitate the mechanical loading to failure of the S149 NT451 valves; the FE analysis of its usage was described in Section 1.B. The fixturing will be mounted on the servohydraulic testing machine purchased on the CT Project, and the testing will be performed on the same machine. To ensure that the fixturing was appropriately designed, a 30° and a 45° seat-angled S149 NT451 valve are being commercially strain-gaged along their valve head - valve stem contours. A schematic drawing of the arrangement of the strain-gages on the S149 NT451 valves is shown in Fig. 12. This strain gaging will serve two purposes: (1) it will experimentally measure the surface strains that result from mechanical loading which can be compared to what was predicted from finite element analysis, and (2) it will yield information regarding the alignment of the valve in the fixture as it is being mechanically loaded.
2. High Temperature Mechanical Testing of Silicon Nitride
A manuscript detailing the recently completed reverse cyclic loading performance of NCX-5102 silicon nitride at 1370°C was submitted to The Journal of Materials Science. There were three primary conclusions that stemmed from this study, and they were:
• NCX-5102 silicon nitride will not fail under reverse cyclic fatigue at 1370°C if the stress amplitude is < 280 MPa and if a sinusoidal waveform is applied at 1 Hz. This threshold stress amplitude is ~ 60% of the manufacturer's reported average tensile strength for this material at 1370°C. Slow crack growth will eventually

280
occur at stress amplitudes > 280 MPa and the event of fracture will occur during the tensile stroke of the waveform.
• Multi-grain junction cavities resulted as a consequence of the reverse cyclic loading at 1370°C. Even though the failed, cyclic fatigued specimens endured half their life under tensile stress and the other half of their life under compressive stress, there was a net gain of cavitation due to tensile creep strain. The presence of cavitation due to tensile creep strain supports the fact that the stress exponent of tensile creep strain is greater than the stress exponent of compressive creep strain in HIPed silicon nitrides.
• The static creep resistance of NCX-5102 at 1370°C will improve if it is first subjected to reverse cyclic loading at 1370°C for at least 106 cycles at 1 Hz (even though some cavitation was present prior to static creep testing). This improvement in creep resistance was likely due to grain coarsening and the activity of extensive grain-grain interlocking; which was ultimately due to the completion of the a to p silicon nitride solution/reprecipitation process that occurred during the history of reverse cyclic loading. It is not discernible from this study whether the reverse cyclic loading history, or the time at temperature, or a combination of both were responsible for the completion of the a to p phase transformation. Even though the NCX-5102 specimens had been subjected to reverse cyclic loading at 1370°C for ~ 106 cycles, creep damage was still the dominant failure mechanism (and not slow crack growth) during static creep rupture tests.
Studies are ongoing and nearing completion on the effect of testing environment on the tensile static creep and dynamic fatigue performance of NCX-5102 at 1370°C. To date, the test matrix has been completed for ambient air and argon tests and only those tests in nitrogen require completion. Preliminary data for the minimum creep rate as a function applied tensile stress for tests in the three environments are shown in Fig. 13. Microstructural studies are ongoing in an effort to explain the observed discrepancies. Tests in argon at 1370°C subject the silicon nitride specimen to both low partial pressures of oxygen and nitrogen, while those tests in nitrogen only subject the silicon nitride to low partial pressures of oxygen. Tests in ambient air are the only tests were oxygen from the ambient environment can play a roll in the development of damage in this silicon nitride material at 1370°C. These various combinations are serving as useful independent parameters during the microstructural analysis of the tested material. It is hoped that these environmental studies will provide insight into how damage evolves in these materials at elevated temperatures.

281
Status of Milestones
A problem with waveform fidelity was found to exist in the servohydraulic testing system that was purchased from MTS, Eden Prairie, MN [Milestone 3.2.1.6]. The problem was identified by a MTS representative and the system will be replaced during Nov. 1995.
An article entitled "Reverse Cyclic Fatigue of a HIPed Silicon Nitride at 1370°C, by A. A. Wereszczak, T. P. Kirkland, and M. K. Ferber, was submitted to The Journal of Materials Science [Milestone 3.2.1.8].
An letter report entitled "Preliminary Mechanical Performance of SiAION Valve Material" was issued to the Ceramic Technology Program Manager [Milestone 3.2.1.6.11].
Communications / Visitors / Travel
Eric Bright of Norton Advanced Ceramics furnished a supply of NT451 stock material. This supplied NT451 material will be machined into flexure bars and tensile rods for strength and fatigue characterization. In addition, Eric Bright and Yuri Kalish of the Detroit Diesel Corporation, Detroit, Ml, supplied an extensive flexure database that was generated on NT451 SiAION through their collaboration. X-ray diffraction data, fractography information, and batch identification information was also included. The data will serve as a supplement to the data that will be generated in-house on NT451, and will be used in the life prediction verification effort on NT451 S149 diesel engine valves.
Problems Encountered
None.
Publications
An article entitled "Effect of Cyclic Loading on the Creep Performance of Silicon Nitride," by A. A. Wereszczak, M K. Ferber, T. P. Kirkland, and C. -K. J. Lin, was

282
accepted for publication in the ASME Turbo Expo 95 Proceedings, Houston, TX, June 1995.
An article entitled "Reverse Cyclic Fatigue of a HIPed Silicon Nitride at 1370°C, by A. A. Wereszczak, T. P. Kirkland, and M. K. Ferber, was submitted to The Journal of Materials Science.
An abstract entitled "Mechanical Performance and Life Prediction of SiAION Diesel Engine Valves," by A. A. Wereszczak, H. Cai, M. K. Ferber, and T. P. Kirkland, was submitted for inclusion in the 20th Annual Cocoa Beach Conference and Exposition on Composites, Advanced Ceramics, Materials and Structures, to be held Jan. 7-11, 1996, Cocoa Beach, FL.
A presentation entitled "Verification of Life Prediction Methodology as Applied to a Ceramic Valve," by A. A. Wereszczak, H. Cai, and M. K. Ferber, was submitted and will be given at the Annual Automotive Technology Development Contractors' Coordination Meeting, Dearborn, Ml, Oct 23-27, 1995.
References
[1]. A. A. Wereszczak, H. Cai, M. K. Ferber, and T. P. Kirkland, "Life Prediction Verification," pp 61-69 in the Ceramic Technology Project Bimonthly Technical Progress Report to DOE Office of Transportation Technologies, December - January 1995.
[2]. Personal communication with Eric Bright, Norton Advanced Ceramics, East Granby, CT.

283
•a ■s 2 rm
1
99.99 9 9 -
9 0 -
5 0 -
1 0 -
1 "
0.1
Four-Point Bend, MIL-B □ m=10, cro=800 MPa O m=20, ao=800 MPa
1000
Stress (MPa) Fig. 1. Failure probability as a function of applied flexure stress for two arbitrary ceramic
materials. Four-point flexure MIL-B test specimens were used for the data generation.
*
1
99.99 99 9 0 -
5 0 -
1 0 -
0 . 1 -
0.01
*—T+
Analyzed for unit surface area (mm). Lines represent 95% confidence bounds.
■^T
D m=10 O m=20
1000
Stress (MPa) Fig. 2. Material designed data for an effective unit surface area of 1 mm.
2
Confidence bounds are shown.

284
Largest Tensile Stress
Fig. 3. Finite element mesh of the valve component and the principal stress distribution. Shown units of stress: MPa. The maximum principle tensile stress (147 MPa) occurs along the contour between the valve head and valve stem.

285
(
f Pi
J.99999 -
0.9999 -
0.999 -
0.99-
0.9-
0.5-
0 .1 -0.01-
* ' H V— x * \
v v \ \ o \
\ \ \ \
\ □ Lines Represent \
95% Confidence Bounds \
Normal Combustion
Pressure
1 2 I 4
>-T ■
\ 0
\ \ \ \ \ \
□ * >
\
4 £
o
\ \ \ " \
D N
\
-1 u-
\ \ \
s°V \ \
\
•f I
— t -
n o
-I r
m=10 -• m=20
--
--
--
--
l 10 100
Combustion Pressure (MPa)
Fig. 4. Reliability of the valve component as a function of the applied combustion pressure. The normal combustion pressure of 16 MPa yields a maximum principle tensile stress of 147 MPa (see Fig. 3). Two structural ceramics are compared in this example, each with a different Weibull Modulus.

286
SiAION Valve
Copper - ^ Loading Ram
Steel Valve Head Seat
Fig. 5. Schematic of the loading arrangement that will be used to examine the strength of SiAION valves. Using the shown mesh, finite element analysis showed that the greatest tangential tensile stresses exist at the four nodes shown.

287
Q.
CO CO LU CC I -
co LU - J CO z LU I -s < t -z LU (3 z
1000
800
6 0 0
400 -
200 -
■ i i i I i i i i i I i i i
Nodes 237 & 238 ■ Node 236
Node 239
5000 10000 15000 APPLIED LOAD (N)
20000
Fig. 6. The tangential tensile stress as a function of applied load for the four nodes shown in Fig. 5. Nodes 237 and 238 possess equivalent stresses for any given applied load to the copper ram, while nodes 236 and 238 are subjected to slightly less tensile stresses. Due to the statistical nature of strength in ceramics, failure may occur at any location where a tensile stress exists in the valve; such a valve will not necessarily fail along the regions bounded by nodes 236 through 239, but the likelihood is greater for failure in their bounded region because the tensile stresses have the largest magnitudes here.
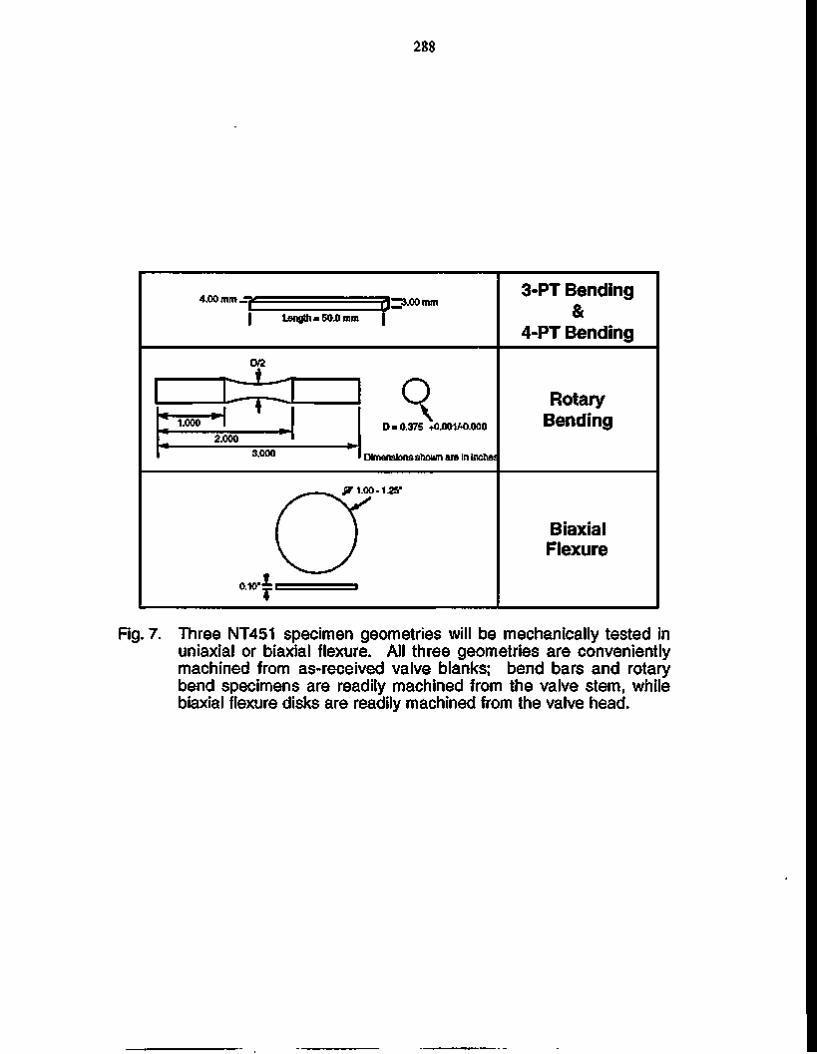
288
4.00 mm -T^
Length = 50.0 mm 3 = » J .00 mm
3-PT Bending &
4-PT Bending D/2
_ __ 1.000 *
UpJ 2.000
3.000
R D = 0.375 +0.001/-0.000
Dimensions shown are in Inches
Rotary Bending
0.10'
P 1.00-1.25"
Biaxial Flexure
Fig. 7. Three NT451 specimen geometries will be mechanically tested in uniaxial or biaxial flexure. All three geometries are conveniently machined from as-received valve blanks; bend bars and rotary bend specimens are readily machined from the valve stem, while biaxial flexure disks are readily machined from the valve head.
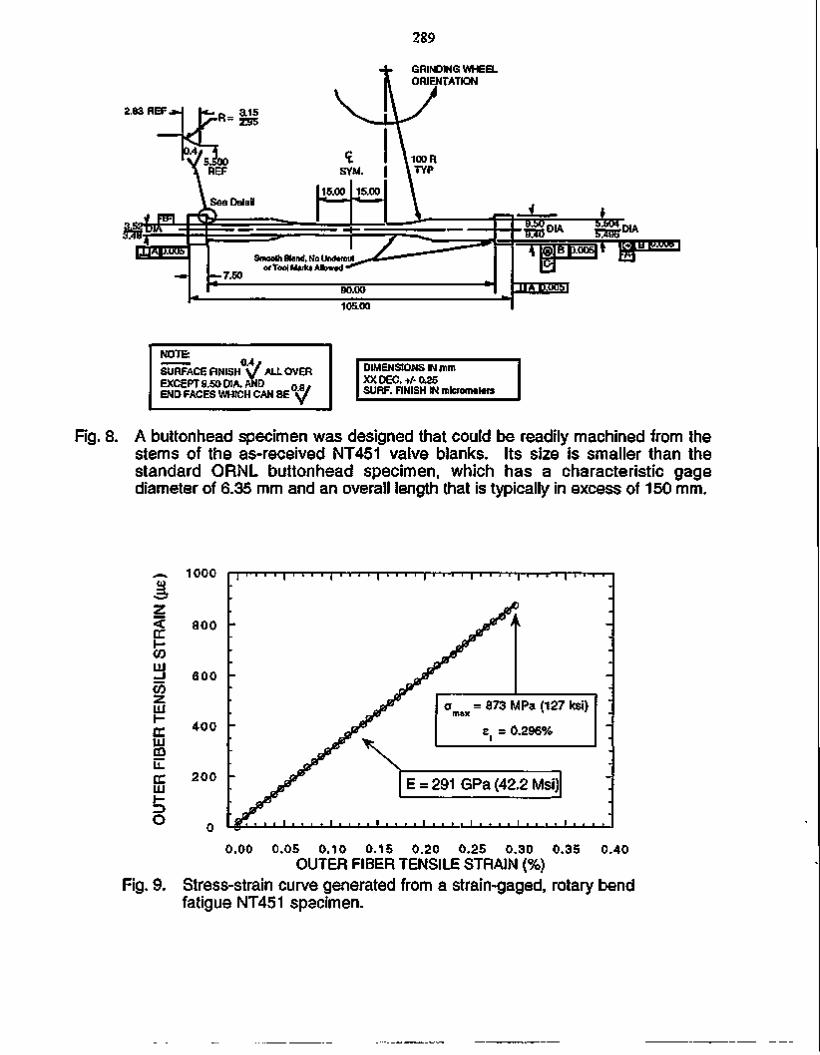
289
GRINDING WHEEL ORIENTATION
2.S3 REF j 1
5M-^TDTI
3
105.00
NOTE:
SURFACE FINISH EXCEPT 9.50 DIA.™. 0 8 . END FACES WHICH CAN BE \ 7
0.4/ H Y V.AND
ALL OVER
0.8y
DIMENSIONS IN mm XX DEC. +/ 0.25 SURF. FINISH IN micrometers
Fig. 8. A buttonhead specimen was designed that could be readily machined from the stems of the asreceived NT451 valve blanks. Its size is smaller than the standard ORNL buttonhead specimen, which has a characteristic gage diameter of 6.35 mm and an overall length that is typically in excess of 150 mm.
< en HCO LU _J CO 2 LU I
DC UJ m u. DC LU H ID
o
1000 I | i i i i | i i i i | i i i i | i i i i | i i i i | i i i i | i i i i | i
800 "
6 0 0
400
200
CT = 873 MPa (127 ksi)
ef = 0.296%
E = 291 GPa (42.2 Msi)
i i t i t i i i i i i 1 ' ' ' ■ I i t t i I t i i t I i i t i
Fig. 9.
0.00 0.05 0.10 0.15 0.20 0.25 0.30 0.35 0.40 OUTER FIBER TENSILE STRAIN (%)
Stressstrain curve generated from a straingaged, rotary bend fatigue NT451 specimen.

290
,16 mm
12.7 mm
6 mm
-*ir-4 mm
CT SCANNED REGIONS
Fig. 10. Prior to mechanical testing, the material integrity within two regions of every S149 NT451 valve will be examined using computed tomography. The mechanical performance of the valve will later be correlated to this.
-21.20 mm
29.eik 22.3 • '
14.9
7.5
(xO.OOOIT
■ f 1 I I ■ I 1 1 I I I' I +21.20 mm
In this example, the valve face was found
to be non-planar
Fig. 11. The face of this particular S149 NT451 valve was found to be slightly concave in nature (as represented by cross-sectional profile shown), as identified by a coordinate measuring machine.

291
4 strain gages around the stem circumference at 90°Intervals
\
3.75"
10-element strip gage (2 places)
Fig. 12. Two S149 NT451 valves are being strain-gaged with orientations shown. Information yielded by the strain-gages during mechanical loading will be used to verify finite element analysis and to maximize fixturing alignment.
1 0' ,-7
v2-LU
CC Q. UJ UJ ! CC n
o
1 o-
AIR (n=3.6) ARGON (n=5.9) NITROGEN (n=6.9)
100 120 130 TENSILE STRESS (MPa)
140
Fig. 13. Minimum creep rate as a function applied static tensile stress for NCX-5102 silicon nitride at 1370°C in air, argon, and nitrogen environments.

292
TOUGHENED CERAMICS LIFE PREDICTION Sung R. Choi, Jonathan A. Salem and John P. Gyekenyesi (NASA Lewis Research Center)
Oblective/ScoDe
The purpose of this research is to understand the room temperature and high temperature [< 1370°C (2500°F)] behavior of toughened ceramics as the basis for developing a life prediction methodology. A major objective is to understand the relationship between microstructure and mechanical behavior within the bounds of a limited number of materials. A second major objective is to determine the behavior as a function of time and temperature. Specifically, the room temperature and elevated strength and reliability, the fracture toughness, slow crack growth and the creep behavior will be determined for the as-manufactured material. The same properties will also be evaluated after long-time exposure to various high temperature isothermal and cyclic environments. These results will provide input for parallel materials development and design methodology programs. Resultant design codes will be verified.
Technical Highlights
Dynamic fatigue testing has been used for several decades to characterize slow crack growth behavior of glass and ceramics materials at both ambient and elevated temperatures.1'' The advantage of dynamic fatigue testing over other methods lies in its simplicity: Strengths are measured in a routine manner at three to four stressing rates by applying a constant crosshead speed or constant loading rate. The slow crack growth (fatigue) parameters required for design are simply calculated from a relationship between fatigue strength and stressing rate.2 These merits have prompted an effort to establish an ASTM testing standard for dynamic fatigue.8
With a proper use of preloading in dynamic fatigue testing (see Fig. 1), a dramatic saving of testing time can be achieved with no change in fatigue strength. In the previous papers,9,10 the present authors developed the analytical solution of dynamic fatigue strength as a function of preloading for the Griffith (natural) flaw system. The solution was verified by dynamic fatigue experiments conducted with soda-lime glass and alumina at room temperature9 and with alumina and silicon nitride at elevated temperatures.10
In this paper the preloading technique was extended to an indentation-induced flaw system. A numerical solution of dynamic fatigue strength as a function of preloading was developed. To verify the solution, dynamic fatigue testing as well as preloading experiments were carried out in room temperature distilled water using soda-lime glass and alumina specimens with as-indented flaws.
ANALYSIS
In many cases slow crack growth of glass and ceramics under Mode I loading condition above fatigue limit is described by the following empirical power-law relation11
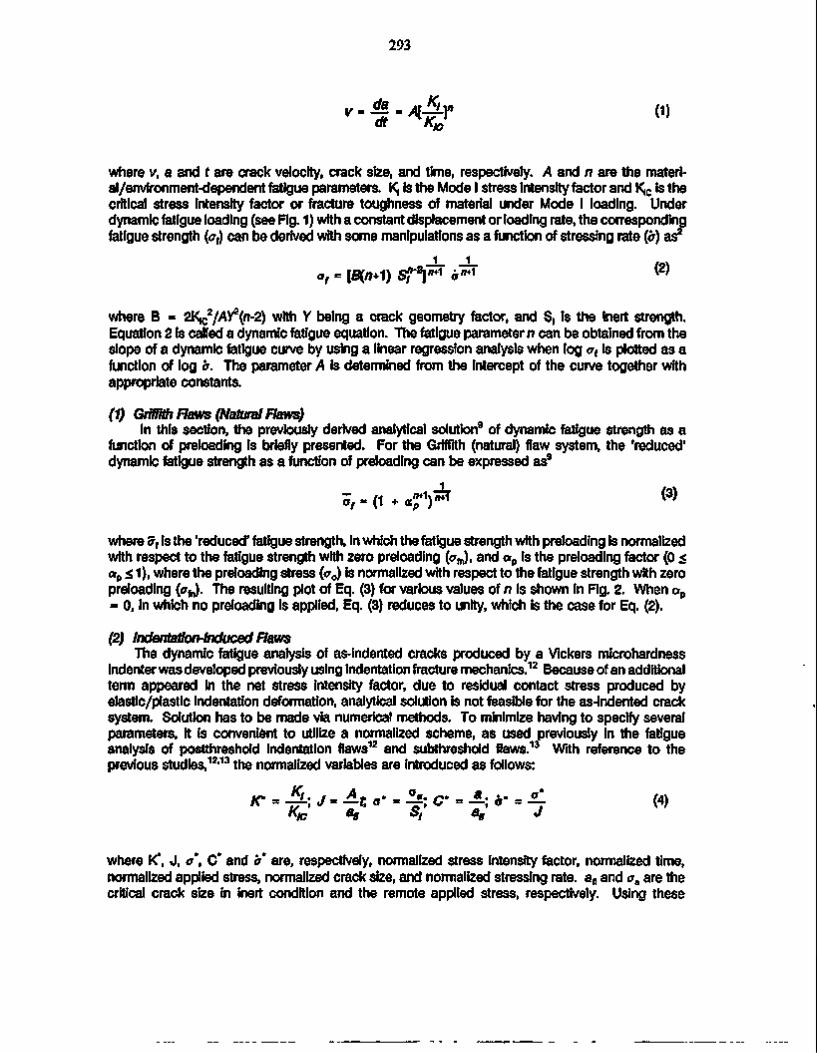
293
% ■ *£? (1)
dt K/c
where v, a and t are crack velocity, crack size, and time, respectively. A and n are the material/environmentdependent fatigue parameters. K, is the Mode I stress intensity factor and K,c is the critical stress intensity factor or fracture toughness of material under Mode I loading. Under dynamic fatigue loading (see Fig. 1) with a constant displacement or loading rate, the corresponding fatigue strength (af) can be derived with some manipulations as a function of stressing rate (a) as
2
1 1 . .
o, = [B(/7+1) ST2]n+1 °
f f+1 (}
where B = 2KiC2/AY
2(n-2) with Y being a crack geometry factor, and S, is the inert strength.
Equation 2 is called a dynamic fatigue equation. The fatigue parameter n can be obtained from the slope of a dynamic fatigue curve by using a linear regression analysis when log of is plotted as a function of log b. The parameter A is determined from the intercept of the curve together with appropriate constants.
(1) Griffith Flaws (Natural Flaws) In this section, the previously derived analytical solution
9 of dynamic fatigue strength as a function of preloading is briefly presented. For the Griffith (natural) flaw system, the 'reduced' dynamic fatigue strength as a function of preloading can be expressed as
9
* = o + «r>^ (3)
where 5f is the 'reduced' fatigue strength, in which the fatigue strength with preloading is normalized with respect to the fatigue strength with zero preloading (am), and ap is the preloading factor (0 < atp < 1), where the preloading stress (CT0) is normalized with respect to the fatigue strength with zero preloading (a^). The resulting plot of Eq. (3) for various values of n is shown In Fig. 2. When ap = 0, in which no preloading is applied, Eq. (3) reduces to unity, which is the case for Eq. (2).
(2) Indentation-Induced Flaws The dynamic fatigue analysis of asindented cracks produced by a Vickers microhardness
indenter was developed previously using indentation fracture mechanics.12 Because of an additional
term appeared in the net stress intensity factor, due to residual contact stress produced by elastic/plastic indentation deformation, analytical solution is not feasible for the asindented crack system. Solution has to be made via numerical methods. To minimize having to specify several parameters, It is convenient to utilize a normalized scheme, as used previously in the fatigue analysis of postthreshold indentation flaws
12 and subthreshold flaws.13 With reference to the
previous studies,12,13 the normalized variables are introduced as follows:
*• # ; •/ «<>' = 4* c- = A *• 4 (4) Kic */!
&/ 3r
J
where K*, J, a, C* and a are, respectively, normalized stress Intensity factor, normalized time, normalized applied stress, normalized crack size, and normalized stressing rate. afi and aa are the critical crack size in inert condition and the remote applied stress, respectively. Using these

294
variables, the power-law crack velocity of Eq. (1) yields as
4jL = [Kr
4 4
a* = 6 V + Og
where a0* is the normalized preloading stress, which has the following relation
« , = - ^ = - ^ (6)
with a,,,* being a normalized fatigue strength with zero preloading. Note that the normalized net stress intensity factor (K*) consists of two terms: the first by remote applied stress and the second by residual contact stress.12 The solution of the differential equation of Eq. (5) In term of the normalized variables such as failure time, fatigue strength and critical crack size was obtained by using a fourth-order Runge-Kutta method. The initial condition12 was C* = 0.3967 at J = 0 and the instability conditions were K* = 1 and dK*/dC* > 0.
The solution procedure was first initiated to determine the normalized fatigue strength with zero preloading (a^') as a function of normalized stressing rate (a*) for the selected values of n = 5 -160. A range of a* = 1.0 x 10"2 to 1.0 x 10"7 was used. The normalized fatigue strength with preloading (a^') was then determined for a given n as a function of normalized preloading stress (cr0*), ranging from ap = 0.3 to 0.9. This procedure was continued to complete for n = 5 -160. The input variable a0* was calculated using Eq. (6) with the known ap and o^.
A summary of the 'reduced' fatigue strength af as a function of preloading for as-indented cracks is shown in Fig. 3. The figure shows that the effect of preloadng on the reduced fatigue strength (or fatigue strength) becomes dominant with decreasing fatigue parameter n. For example, at a preloading of 90 % (ap = 0.9), a, = 1.1091 and 1.0457, respectively, for n = 5 and 10; whereas, af = 1.0124,1.0014,1.0000 and 1.0000, respectively, forn = 20,40, 80 and 160. Hence, It is very important to note that for most of glass and ceramic materials that exhibit usually n > 20, the use of preloading up to 90 % gives rise to a maximum inaccuracy of 1.2 % in dynamic fatigue strength. Of course, the less preloading the higher accuracy. The result shown in Fig. 3 is very similar to that of the Griffith flaw system (Fig. 2). However, the effect of preloading on dynamic fatigue strength is more predominant for as-indented cracks than for Griffith flaws, as can be seen by comparing Figs. 2 and 3. The existence of residual contact stress around indent is believed to result in more enhanced slow crack growth for the as-indented crack system. The simple analytical solution of Eq. (2) (or Fig. 2) for Griffith flaws and the numerical solution of Fig. 3 for as-indented cracks can thus provide an excellent tool of dynamic fatigue test methodologies with which a considerable amount of testing time can be saved through an appropriate choice of preloading.
EXPERIMENTAL PROCEDURE
Dynamic fatigue experiments were conducted to verify the above numerical solution using soda-lime glass and alumina in room-temperature distilled water. Microslides of soda-lime glass (Product # 2954-F, Erie Scientific Co., Portmouth, NH) measuring 75 mm (length) x 25 mm (width) x 1.2 mm (thickness) were annealed at 520°C in air for 20 h to remove any spurious residual stress.

295
NO PRELOADING (CONVENTIONAL)
TIME
«V
PRELOADING
Preloadini
TIME
Figure 1. Mode of loading applied In dynamic fatigue testing: (a) without preloading (regular, conventional testing); (b) with preloading.
lb
S5 O Z W « E -OT W D
Q W O a «
1.10 1.09 1.08 1.07 1.06 1.05 1.04 1.03 1.02 1.01 1.00 0.99 0.98
GRIFFITH FLAWS
ANALYTICAL SOLUTION • NUMERICAL SOLUTION
c J _
0 10 20 30 40 50 60 70 80 90 100 PRELOADING, a [%] p
Rgure 2. Analytical solution (Eq. 3) of 'reduced' fatigue strength (5>) as a function of preloading for different n's for Griffith flaws.9
1.12 lb
a t-o z m OS
OT w
I Q Ed O D a CO
AS- INDENTED CRACKS 1.10 I- NUMERICAL SOLUTION
0.96
8 0 -160
20 40 60 80 100 PRELOADING, a [%1
p ". J
Rgure 3. Numerical solution of 'reduced' fatigue strength (a,) as a function of preloading for different n's for as-indented cracks.

296
After annealing, the center of each specimen was indented In air with a Vickers mlcrohardness indenter (Model 3212, Zwick, Germany) for about 15 s with one of indentation diagonals being aligned along the direction of the prospective tensile stress of the specimen. One indentation load of 19.6 N was used. Dynamic fatigue testing for the Indented specimens was conducted using a four-point flexure fixture with 20 mm- Inner and 40 mm- outer s|Dans. Six different actuator speeds from 5 mm/min to 0.00005 mm/min were applied using an electromechanical testing machine (Model 8562, instron, Canton). A total of six specimens was used at each actuator speed. The dynamic fatigue testing Is required to determine fatigue parameter (n) as well as fatigue strength without preloading. After this dynamic fatigue testing with zero preloading, additional dynamic fatigue testing were also conducted to determine the effect of preloading on fatigue strength. Four different actuator speeds of 0.5, 0.005, 0.0005, 0.00005 mm/min were used. Typically, four preloadings from 50 to 90 % were employed at each actuator speed. Six specimens were used at each preloading. The required preloading was achieved within a few seconds by using the specially designed load-controlled mode of the testing machine
96 wt % alumina flexure beam specimens (ALSIMAG 614, G.E. Ceramics, Laurens, SC) measuring 3 mm by 4 mm by 30 mm, respectively, in height, width and length, were Indented using an indentation load of P = 49 N. Dynamic fatigue testing of the indented alumina specimens was carried out using a servohydraulic testing machine (Model 8501, Instron, Canton) with a four-point flexure fixture with 6.35/19.05 mm spans. Four different actuator speeds from 0.005 mm/min to 5 mm/min were utilized. A total of five specimens was used at each actuator speed. Dynamic fatigue testing with preloading were conducted at an actuator speed of 0.005 mm/min using five different preloadings from 50 to 90 %. Five specimens at each preloading were utilized. Since the coefficient of variation in strengths was usually less than 5 % for both materials with well-defined crack configurations, the number of test specimens ranging from five to six that were used per actuator speed or preloading in this series of testing was considered to be sufficient for reliable statistical data.
RESULTS AND DISCUSSION
(1) Experimental Results
Glass Specimens The dynamic fatigue results for the as-indented soda-lime glass specimens are presented in Fig. 4, where fatigue strength (log af) was plotted as a function of applied actuator speed (log x) based on Eq. (2). (Note that a is a linear function of x so that fatigue parameter n remains unchanged, using either b or x.). A decrease in fatigue strength with decreasing stressing rate, which represents fatigue susceptibility, was evident in a range of actuator speeds from 5 to 0.00005 mm/min. For indentation cracks, the fatigue parameter n obtained from data in Fig. 4 in conjunction with Eq. (2) is not the one that is truly representath/e of n, attributed to the additional driving force by residual contact stress.11,12 The true fatigue parameter n is calculated from the following formulation that takes into account the additional driving force11
3 3
where n' is the 'apparent' fatigue parameter that is simply evaluated from the slope of Fig. 4 together with Eq. (2). The apparent parameter n' was thus found to be n' = 17.4 ± 0.4. Therefore, using Eq. (7) a value of n = 22.5 was obtained. Note that the coefficient of correlation of curve fit was > 0.999, showing an excellent data fit to the dynamic fatigue relation. The effect of preloading on dynamic fatigue strength is shown in Fig. 5, where fatigue strength was plotted as a function of preloading from 0 to 90 % for four different actuator speeds utilized. The solid line represents the

297
2
70
60
1 50
s z w OS E -r/i
r"*
40
30
20
DYNAMIC FATIGUE SODA-LIME GLASS AS-INDENTED (P=19.6N) RT WATER
Inert
n'=17.4
10"510"*10~3 10~2 10""1 10° 101 102 103
ACTUATOR SPEED, x [mm/min]
Rgure 4. Dynamic fatigue results of as-indented soda-lime glass specimens in room-temperature distilled water with zero preloading (indentation load = 19.6 N). The solid line indicates the best-fit line based on Eq. (2). Error bar represents one standard deviation.
50
PL,
E -O :s w OS E -f/) CO
O <
40
3 0 -
DYNAMic FATIGUE SODA-LIME GLASS AS-INDENTED (P=19.6N) RT WATER
50//m/min
5/^m/min t 1
0.5/zm/min I -
-S—a-• - , 0.05^m/min
20
4-i-j ._
20 40 60 80 100 PRELOADING, a [%]
P l J
Figure 5. Dynamic fatigue strength of as-indented soda-lime glass specimens as a function of preloading for different actuator speeds In room-temperature distilled water (indentation load = 19.6 N). Error bar indicates one standard deviation. The solid line represents the fatigue strength with zero preloading at each actuator speed.

298
fatigue strength with zero preloading determined at each actuator speed. No appreciable change In fatigue strength with preloading is observed.
Alumina Specimens The results of dynamic fatigue for the as-indented alumina specimens are shown in Fig. 6. The apparent fatigue parameter of n'= 40.2 ± 4.9 was obtained, which gives a true fatigue parameter of n = 52.9 ± 5.9 from Eq. (7). Dynamic fatigue strength as a function of preloading is shown In Fig. 7, where the solid line represents the fatigue strength with zero preloading. The effect of preloading on fatigue strength is negligible.
(2) Comparison between Solution and Experimental Data A comparison between the solution and the experimental data was made for the two materials
investigated. The dynamic fatigue strength with preloading was normalized with respect to the dynamic fatigue strength with zero preloading at each actuator speed, thereby to obtain af in accordance with the scheme shown in Fig. 3. This was done for all of the actuator speeds used. The result is shown in Fig. 8. Included in each figure was the theoretical prediction of a, obtained numerically for each material. For the as-indented soda-lime glass, the prediction with n = 22.5 gives ox = 1.000, 1.000, 1.000, 1.002 and 1.010, respectively, for ap = 30, 50, 70, 80 and 90 %, indicating that a preloading of 90 % gives rise to the highest fatigue strength only 1.0 % higher than the fatigue strength with zero preloading. The average 'reduced' fatigue strength for glass (Fig. 8 (a)) was a, = 0.9913 ± 0.001. Because of low fatigue susceptibility for alumina (n = 52.9), the theoretical prediction, a, = 1.000, remains unchanged up to a preloading of 90 %, indicative of independence of dynamic fatigue strength on preloading. The average experimental value of af (Fig. 8 (b)) was found to be a, =0.9882 ± 0.011. All of these results indicate that the theory agrees very well with the experimental data obtained from the two material systems.
(3) Crack Growth Behavior Figure 9 shows the normalized crack size (C*) as a function of normalized time (J) for the as-
indented crack system subjected to dynamic fatigue with zero preloading. The figure is for b" = 1.0 x 10s with n = 5 to 80. Due to increased fatigue susceptibility, crack growth is dominant with decreasing n, resulting in shorter failure time and consequently lower fatigue strength. The crack growth for as-indented cracks was found to be much greater than that of Griffith flaws because of the additional driving force due to residual tensile contact stress. This additional driving force results in not only stable crack growth but slow crack growth during loading.12 However, as seen in the figure, most of crack growth still occurs close to and/or at failure time at which a dynamic fatigue strength is defined. The nature of this long 'Incubation' time of an initial crack is a key aspect that makes preloading technique feasible in dynamic fatigue testing.
IMPLICATIONS
The most direct, powerful effect of preloading technique is the saving of testing time. For example, if it takes about 9 h at a certain low stressing rate (say, 0.005 mm/min) to test one optical glass fiber with a strength o f« 5 GPa and with n « 20, and If a minimum of twenty specimens is required to obtain reliable statistical data, then total testing time at that stressing rate would be 180 h. But if a preloading of 90 % is applied, the total testing time would be reduced to only 18 h so that 90 % of the total testing time can be saved. And 80 % saving for a preloading of 80 %, and so on. Since most of testing time is consumed at the lowest stressing rate to be used, the contribution of preloading can be maximized when preloading is applied at the lowest stressing rate.9
With a proper use of preloading in conjunction with Eq. (3) (or Fig. 2) for Griffith flaws and with Fig. 3 for as-indented cracks, a considerable saving of testing time can be achieved, which gives

299
OH
3
E-O
OS E-00
ID O
fc
300 DYNAMIC FATIGUE
96 WT % ALUMINA AS-INDENTED (P=49N) RT WATER
K- 200
100 I-90
n'=40.2
80 10
Inert
- 3 10 - 2
10 - 1 10L
10' 10" 10' ACTUATORE SPEED, x [ m m / m i n ]
Figure 6. Dynamic fatigue results of as-indented 96 wt % alumina flexure specimens in room-temperature distilled water with zero preloading (indentation load = 49 N). The solid line indicates the best-fit line based on Eq. (2). Error bar represents one standard deviation.
CL, i i
b
EC E-<
a w a E-1
E d D O H < fc
20U
180
160
140 J
120'
100
80
60 0
- DYNAMIC FATIGUE 96 WT 55 ALUMINA
~ AS-INDENTED (P=49N) . RT WATER
-
• 5 / im/min
i
20
T ▲ 1
i
40 PRELOADING
i
T A. 1
60
• a ?
i
T A ±
i
80 [%]
T A 1
-
-
-
-
10
Figure 7. Dynamic fatigue strength of as-indented 96 wt % alumina flexure specimens as a function of preloading in room-temperature distilled water (indentation load = 49 N). Error bar Indicates one standard deviation. The solid line represents the fatigue strength with zero preloading.

300
lb X E-O 2 :
OS E-CO
ia O o <: fc Q w o Q fc
1
OS
lb X E-O 2 a OS E-< CO
w D O IP < fc Q W CJ D Q Cd OS
1.20
1.15
1.10
1.05 -
DYNAMIC FATIGUE r
SODA-LIME GLASS - AS-INDENTED (P=19.6N)
RT WATER
1.001
0.95
0.90
0.85
Theory
O 50^£m/min r 5/Lim/min D 0.5jtzm/min
V °8 9 T a
o 8
0.80 0.05/rni/min
20 40 60 80 100 PRELOADING, a [%]
P
(a)
1.20 ■ DYNAMIC FATIGUE
1 15 _ 96 WT % ALUMINA AS-INDENTED (P=49N)
' RT WATER 1.10 -
1.05
1.00
0.95
0.90
0.85 (-
0.80
5/mi/min
\ -A x -
Theory
0 20 40 60 80 100 PRELOADING, a p [%]
(b)
Figure 8. 'Reduced' fatigue strength fa) as a function of preloading: (a) as-indented soda-lime glass specimens; (b) as-indented 96 wt % alumina specimens. Each solid line in the figures represents the theoretical solution.

301
o fcf rsi CO
<: DS o Q fcl 13 2 DS o
70
60
50
40 |-
30
20
10
0 s
_
n=5
10
' DYNAMIC FATIGUE AS-INDENTED 5 . a =0: f>*=1.0X10
20 40 80
0 20000 40000 60000 80000 100000
NORMALIZED TIME. J
Figure 9. Numerical solution of normalized crack size (C*) as a function of normalized time (J) for different n's (b' = 1.0 x 10'5).
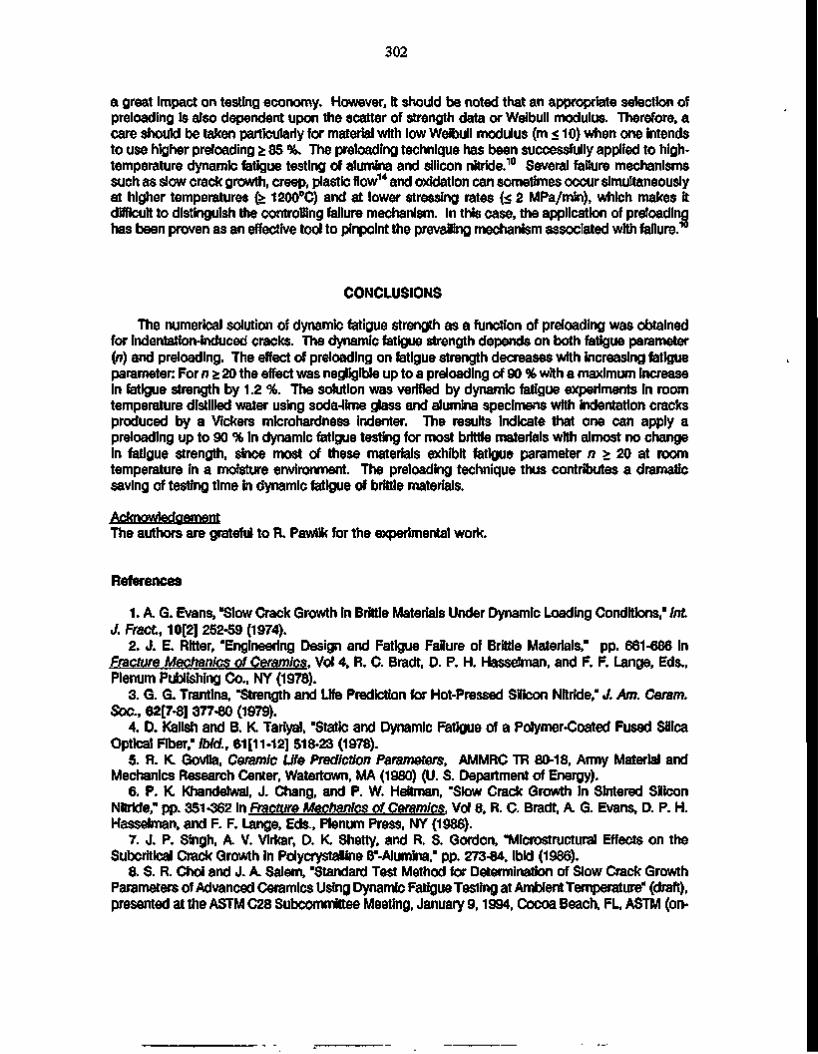
302
a great Impact on testing economy. However, it should be noted that an appropriate selection of preloading is also dependent upon the scatter of strength data or Weibull modulus. Therefore, a care should be taken particularly for material with low Weibull modulus (m < 10) when one intends to use higher preloading > 85 %. The preloading technique has been successfully applied to high-temperature dynamic fatigue testing of alumina and silicon nitride.10 Several failure mechanisms such as slow crack growth, creep, plastic flow14 and oxidation can sometimes occur simultaneously at higher temperatures (> 1200°C) and at lower stressing rates (< 2 MPa/min), which makes it difficult to distinguish the controlling failure mechanism. In this case, the application of preloading has been proven as an effective tool to pinpoint the prevailing mechanism associated with failure.
CONCLUSIONS
The numerical solution of dynamic fatigue strength as a function of preloading was obtained for indentation-induced cracks. The dynamic fatigue strength depends on both fatigue parameter (n) and preloading. The effect of preloading on fatigue strength decreases with increasing fatigue parameter: For n > 20 the effect was negligible up to a preloading of 90 % with a maximum Increase In fatigue strength by 1.2 %. The solution was verified by dynamic fatigue experiments in room temperature distilled water using soda-lime glass and alumina specimens with indentation cracks produced by a Vickers microhardness indenter. The results indicate that one can apply a preloading up to 90 % in dynamic fatigue testing for most brittle materials with almost no change in fatigue strength, since most of these materials exhibit fatigue parameter n > 20 at room temperature in a moisture environment. The preloading technique thus contributes a dramatic saving of testing time in dynamic fatigue of brittle materials.
Acknowledgement The authors are grateful to R. Pawllk for the experimental work.
References
1. A. G. Evans, "Slow Crack Growth in Brittle Materials Under Dynamic Loading Conditions," Int. J. Fract, 10[2] 252-59 (1974).
2. J. E. Ritter, "Engineering Design and Fatigue Failure of Brittle Materials," pp. 661-686 in Fracture Mechanics of Ceramics. Vol 4, R. C. Bradt, D. P. H. Hasselman, and F. F. Lange, Eds., Plenum Publishing Co., NY (1978).
3. G. G. Trantina, "Strength and Life Prediction for Hot-Pressed Silicon Nitride," J. Am. Ceram. SOC, 62[7-8] 377-80 (1979).
4. D. Kalish and B. K. Tariyal, "Static and Dynamic Fatigue of a Polymer-Coated Fused Silica Optical Fiber," ibid., 61[11-12] 518-23 (1978).
5. R. K. Govila, Ceramic Life Prediction Parameters, AMMRC TR 80-18, Army Material and Mechanics Research Center, Watertown, MA (1980) (U. S. De|3artment of Energy).
6. P. K. Khandelwal, J. Chang, and P. W. Heitman, "Slow Crack Growth in Sintered Silicon Nitride," pp. 351-362 in Fracture Mechanics of Ceramics. Vol 8, R. C. Bradt, A. G. Evans, D. P. H. Hasselman, and F. F. Lange, Eds., Plenum Press, NY (1986).
7. J. P. Singh, A. V. Virkar, D. K. Shetty, and R. S. Gordon, "Microstructural Effects on the Subcritical Crack Growth in Polycrystalline B"-Alumina," pp. 273-84, ibid (1986).
8. S. R. Choi and J. A. Salem, "Standard Test Method for Determination of Slow Crack Growth Parameters of Advanced Ceramics Using Dynamic Fatigue Testing at Ambient Temperature" (draft), presented at the ASTM C28 Subcommittee Meeting, January 9,1994, Cocoa Beach, FL, ASTM (on-

303
going). 9. S. R. Choi, J. A. Salem and J. P. Gyekenyesi, "Fatigue Strength as a Function of Preloading
in Dynamic Fatigue Testing of Glass and Ceramics," submitted for the 4lstASME Gas Turbine and Aeroengine Congress. Exposition, and Users Svmposium. June 10-13,1996, Birmingham, UK.
10. S. R. Choi and J. A. Salem, "Effect of Preloading on Fatigue Strength in Dynamic Fatigue Testing of Ceramic Materials at Elevated Temperatures," Ceram. Sci. Eng. Proc, 16[4] 87-94 (1995).
11. E. R. Fuller, B. R. Lawn, and R. F. Cook, "Theory of Fatigue for Brittle Raws Originating from Residual Stress Concentrations," J. Am. Ceram. Soc, 66[5] 314-21 (1983).
12. B. R. Lawn, D. B. Marshall, G. R. Anstis, and T. P. Dabbs, "Fatigue Analysis of Brittle Materials Using Indentation Raws, Part 1. General Theory," J. Mater. Sci., 16[10] 2846-2854 (1981).
13. S. R. Choi, J. E. Ritter, and K. Jakus, "Failure of Glass with Subthreshold Raws," J. Am. Ceram. Soc, 73[2] 268-74 (1990).
14. R. W. Davldge and G. Tappln, "The Effects of Temperature and Environment on the Strength of Two Polycrystalline Aluminas," Proc. Br. Ceram. Soc, 1970 [15] 47-60.
Status of Milestones
Milestones are on time
Communication/Visits/Travel
None
Problems Encountered
None
Publications
1. S. R. Choi and J. A. Salem, "Dynamic, Static and Cyclic Fatigue of Alumina with Indentation-Induced Flaws," J. Mater. Sci. Lett., 141286-1288 (1995). 2. S. R. Choi and J. A. Salem, "Effect of Preloading on Fatigue Strength in Dynamic Fatigue Testing of Ceramic Materials at Elevated Temperatures," Ceram. Sci. Eng. Proc, 16[4] 87-94 (1995). 3. S. R. Choi, N. N. Nemeth, J. A. Salem, L M. Powers, and J. P. Gyekenyesi, "High-Temperature Slow Crack Growth of Si3N4 Specimens Subjected to Uniaxial and Biaxial Dynamic Fatigue Loading Conditions," Ibid, 16[4] 509-517 (1995).

IliedSignal ' A E R O S P A C E 3Q4
W.B.S. Element 3.2.2.3
LIFE PREDICTION METHODOLOGY FOR CERAMIC COMPONENTS OF ADVANCED HEAT ENGINES ~ PHASE H
FOURTH SEMIANNUAL PROGRESS REPORT APRIL - SEPTEMBER 1995
PRINCIPAL INVESTIGATORS: D. Wu, A. Peralta, N. Menon, A. Kinney, P. Brehm,
R. Morey, J. Cuccio, and J. Wade
AlliedSignal Engines 111 S. 34th Street
MS 57-72/1303-203 P.O. Box 52181
Phoenix, Arizona 85072-52181
Objectives/Scope
AlliedSignal Engines (AE) has defined a program that builds on the progress made in Phase I of the Life Prediction Methodology for Ceramic Components of Advanced Vehicular Heat Engines program. This Phase II program will develop the methodology required to adequately predict the useful life of ceramic components used in advanced heat engines. Phase II will concentrate on predictive methodology for time- and cycle-dependent failure modes, as well as proof testing and nondestructive evaluation (NDE) methodology to enhance component reliability through screening out of low-strength components.
The life prediction methodologies developed will be generic and hence will be applicable to ceramic components that operate under known temperature and stress conditions.
The technical effort has been organized into six tasks, as follows:
1) Material Baseline 2) Compressive Creep Methodology 3) Flaw Growth Methodology 4) Cyclic Fatigue Methodology 5) Proof Test Methodology 6) NDE Reliability Methodology.
Integration of the methodologies will be undertaken through continued development of the statistical and risk integration computer codes previously developed during the Phase I program. Progress made under these objectives during the April through September 1995 semiannual reporting period is described in the following sections.

^AlliedSignal "—^ A E R O S P A C E 305
Technical Highlights
1.0 Material Baseline
1.1 Phase I Closure
In order to resolve the discrepancy between the surface strength predictions and the actual test results from the spin disk fast fracture tests performed during Phase I of this program, 108 MIL-A test bars were excised as shown in Figure 1 from six available NT 154 silicon nitride spin disks, numbered A through F. The objective was to capture in the MIL-A test bar specimens as much of the region as possible from the spin disks in which a majority of the surface failures occurred in the Phase I spin disk testing. The test bars were inspected with profilometry to determine the surface roughness, and then tested at room temperature.
MIL-A Type Flexure Bars
R1 = 0.125 Inch R2 = 2.5 Inches R3 = 50 Inches
G5870-1
Figure 1. MBL-A Test Bar Specimens Were Excised From Indicated Locations On Six NT154 Spin Disks.

^AlliedSignal A E R O S P A C E
306
1.1.1 Profilometrv Results And MOR Values
The mechanical profilometer (Giddings & Lewis, Universal Linear Profile System) used for measuring the surface roughness of the MIL-A test bars had a stylus radius of 0.0004 inch. Table 1 shows the MOR values (characteristic strength from Weibull plots) calculated from the profilometry results and the various roughness (R) values. Definitions of terms are given at the bottom of the Table. Figures 2 and 3 show plots of the strength with various R values. When all the data is taken into account, there seems to be no major correlation between the strength values and the roughness.
TABLE 1. PROFILOMETRY MEASUREMENTS AND MOR VALUES.
Spin Disk No. A B C D E F
Total No. of
Specimens 19 20 19 10 20 20
MOR 126.3 81.6 75.0 62.4 80.5 85.0
Weibull Modulus,
m 16.6 8.1 7.3 10.2 4.6 10.8
Rt 95 66 89 150-
144 134
Rz 61 45 54 62 74 61
Rv 51 33 45 76 74 69
Rtm 74 51 63 103 101 90
Rzm 64 44 52 61 73 62
Rvm 40 27 33 56 53 45
Rt = Maximum peak-to-valley height over one assessment length Rtm = Arithmetic average of the maximum peak-to-valley heights in eadi of five consecutive sampling lengths Rv = Minimum valley height (most negative value) over one assessment length Rvm = Arithmetic average of the minimum valley heights of each of five consecutive sampling lengths Rz = Arithmetic average of the five greatest peak-to-valley heights within one sampling length Rzm = Arithmetic average of the five greatest peak-to-valley heights in each of five consecutive sampling lengths Sampling Length = 0.03 inch Assessment Length = 0.15 inch
160-1
140
g. 120-1
I = 100-
2 a. o 80 H
5 60 H > E
40
2 0 -
O
■ Rz £.Rv
O
o
D CE F
Spin Disk Identification
O
■
— I — 20
— I — 40 60 80 100
Flexure Strength, ksi 120 140
Figure 2. Flexure Strength Of MBL-A Test Specimens From Spin Disks Vs. Profilometry R Values. (Rt, Rz, And Rv Values).

IliedSignal A E R O S P A C E
307
120
100
E o
s Q. E
80
60
« 40
20
o
<>Rt ■ Rz £ R v
o o
o ' ■ * >
r
20 ~r—
40
0 C E F
Spin Disk r 60
O
80 100 120 Characteristic Flexure Strength, ksi (MOR)
140
Figure 3. Flexure Strength Of MDL.A Test Specimens From Spin Disks Vs. Profilometry R Values. (Rtm, Rzm, And Rvm Values).
1.1.2 Weibull Data Analysis
Following fourpoint bend testing to failure of the excised MLLA type specimens, fractographic evaluation was conducted, and a Weibull analysis of the data was performed. The data is shown in Figure 4, and the Weibull parameters of the individual data sets are summarized in Table 2. As shown in the Figure and Table, the specimen strengths are not consistent at all. Given that these specimens were excised from seemingly identical components, it is somewhat puzzling to see this poor agreement in the strength values. In an attempt to understand what this means, several analyses were performed to predict the strength of the spin disks from the excised specimens using various techniques. First, the spin disk failure data from Phase I was analyzed and plotted, as shown in Figure 5. This analysis assumed that the disk effective area was that delineated by the locations from which the MILA type specimens were excised, as shown schematically in Figure 1. Second, the spin disk strength was predicted from an analysis of all the MLLA specimen data pooled into one database. The results of this prediction procedure were so poor that the spin disk failure data did not appear within the scale of the plot. Hence, we then proceeded to make a third set of spin disk predictions using one specimen data set at a time. The predicted strength values for specimens from Spin Disk F matched the measured strength data very well; for specimens from Disk A the procedure overpredicted the strength of the Phase I spin disks; and for the remaining spin disk specimens the procedure underpredicted the strength, compared to the actual Phase I spin disk strength values. The predicted strength values for Disk F specimens are shown in Figures 6 and 7. The overprediction results for specimens from Disk A are shown in Figures 8 and 9.
The fact that the predicted values from the third procedure matched the measured values well for the spin disk specimens that have strength values intermediate between the highest and lowest range of values is at least a comforting event. One may therefore assume that the spin disk specimens tested to failure captured the average strength of the total population.

^ I l iedSigna l A E R O S P A C E
308
.a CS
. O o a o 3 "3 LL C 0) o » a.
99.999 99.95
99.5 98.0
90.0
70.0
50.0 40.0 30.0
20.0
10.0
5.0
2.0
1.0
0.5
0.2
0.1
0.05
0.01
0.005
'
( ■*
• x
X
•:
"»*
X
' 1 ♦*. <?
V # +
:
t
t *
j . *
r
>
: .
t
Test Group
Disk A DiskB DiskC DiskD DiskE DiskF
»• no
* a o 0 • 0 e 6
e 0
e o e e
e
o
Symbol Size
O 0.620E01 A 0.620E01 + 0.620E01 X 0.620E01 O 0.620E01 * 0.620E01
3 5 7
G5B7(M
10 30 50 70 100
Failure Stress, ksi
200 300
Figure 4. Weibull Plot Showing The Strength Values For All The Excised MTLA Specimens.

^AlliedSignal ^ ^ A E R O S P A C E
309
TABLE 2. WED3ULL PARAMETER SUMMARY FOR THE EXCISED MTL-A TYPE SPECIMENS.
Data Origin
Disk A DiskB DiskC DiskD DiskE DiskF
Combined (All) Combined B, C, E, and F Phase I Spin Disk Tests
Specimen Quantity
19 20 19 10 20 20 108 79 13
Weibull Modulus,
m
16.6 8.1 7.32 10.2 4.61 10.8 3.82 6.47 7.93
Second Weibull
Parameter,
96.0 46.6 40.5 40.1 30.6 55.8 28.5 40.5 62.5
99.999 99.95 99.5 98.0
90.0
70.0
50.0 40.0 30.0 20.0
K 10.0
I 5.0 >
j 2.0
; 0.5
0.2
0.1
0.05
0.01
0.005
I
/
/
Test Group Spin Disk
/ /
J / r
J r
i
/ /
Symbol Size O 0.514E+O1
/ /
10
OM70-5
20 30 40 50
Failure Stress, ksi
60 70 80 90 100
Figure 5. Weibull Analysis Results From The Spin Disks.

^AlliedSignal A E R O S P A C E
310
99.999 99.95 99.5 98.0
90.0 -
70.0
50.0 40.0 30.0
20.0 -
10.0
5.0
2.0
1.0
0.5
0.2
0.1
0.05
0.01
0.005
Test Group
Spin Disk
Symbol Size
O 5.14
10 20
G58706
I I 30 40
Failure Stress, ksi
I 50 70 100
Figure 6. Predicted Strength Values For Specimens Excised From Disk F.

^AlliedSignal A E R O S P A C E 311
99.999 ~ 99.95 -
99.5 ~ 98.0 -
90.0 -
70.0 ~
50.0 -40.0 -30.0 -
20.0 -
10.0 -
5.0 ~
2.0 -
1.0 -
0.5 ~
0.2 ~
0.1 -
0.05 -
0.01 -
0.005 -
o
Test Group
Mil-A Bars Spin Disk
I I I I
*
. * + + +o o
°* o o
Symbol Size
* 0.620E-01
O 5.14
I I 10 20 30 40 50 70 100
G5870-7 Failure Stress, ksi
Figure 7. Comparison Of Phase I Spin Disk Test And Disk F Specimens Strength Values.

^IliedSignal A E R O S P A C E 312
-
-
_
Test Group Spin Disk
Symbol Size O 0.514
40 G5870-8
50 60 70 80 90 100 Failure Stress, ksi
200 300
Figure 8. Predicted Strength Values For Specimens Excised From Disk A.

IliedSignal A E R O S P A C E
313
J3 a .a o a. 2 3
C 0)
a cu a.
99.999 99.95
99.5 98.0
90.0
70.0
50.0 40.0 30.0
20.0
10.0
5.0
2.0
1.0
0.5
0.2
0.1
0.05
0.01
0.005
-
-
* f •r f i
+ A T
+
Test Group
Mil-A Bars Spin Disk
Symbol Size + 0.620E-01 O 5.14
40
G5870-9A
50 60 70 80 90 100 Failure Stress, ksi
200 300
Figure 9. Comparison Of Phase I Spin Disk Test And Disk A Specimens Strength Values.

AlliedSignal 314 A E R O S P A C E
1.2 Tensile And Flexure Testing of CLP NT154
During April through June 1995, material qualification testing of the closed-loop processed (CLP) NT154 silicon nitride specimens continued, in anticipation of the use of this material in the planned Phase Et testing. The qualification testing involved tensile creep rupture and flexure fast fracture specimens.
A summary of the creep tests completed at the Oak Ridge National Laboratories High Temperature Materials Laboratory (ORNL-HTML) is given in Table 3 (courtesy of Dr. A.A. Wereszczak, ORNL-HTML). The test results indicated that the CLP NT154 material had superior rupture life properties, compared to the earlier Phase I NT154 material. Under the same test conditions, 16 Phase I specimens had life values ranging from 57 to 443 hours.
TABLE 3. CLP NT154 STRESS RUPTURE SPECIMEN TEST RESULTS SUMMARY.
Batch No.
1
1
1
1
2
2
2
3
3
3
Specimen ID
XX18
XX25
XX19
XX27
YY15
YY08
YY10
ZZ14
ZZ15
ZZ33
Life, Hours
811
288
1270
1775
709
398
33
351
1125
1028
Comments
Terminated At Failure
Terminated At Failure
Failure Due To Power Outage
Terminated At Failure
Terminated At Failure
Failure Due To Power Outage
Failure Due To Broken Thermocouple
Terminated At Failure
Terminated At Failure
Terminated At Failure
A summary of the flexure fast fracture test results for the CLP NT154 specimens is listed in Table 4. The CLP NT154 specimens in Batch Nos. 1 and 2 showed excellent strength and Weibull modulus values for both the longitudinally-machined and transverse-machined orientations. However, the specimens in Batch No. 3 showed lower values overall, primarily because of the presence of amorphous defects on the surfaces of the flexure test bars. This was suspected to be due to insufficient removal of the encapsulating material used during the hot isostatic pressing (HIPping) process.
From the point of view of the agreed-upon qualification criteria, all three batches of CLP NT154 specimens would have passed the acceptance criteria. Additionally, scanning electron micrographic (SEM) analysis of the flexure test bars showed that the closed-loop process was able to eliminate all failures due to iron inclusions. The only volumetric failures noted in these CLP NT154 flexure test bars occurred from small carbon inclusions.
The ceramic material supplier, Norton Advanced Ceramics (NAC), Worcestor, MA had agreed to take steps to reduce the incidence of discrepancies found in the Batch No. 3 specimens. In view of their assurance and considering the above-mentioned qualification test results, AlliedSignal Engines was prepared to place orders for CLP NT154 specimens for the planned Phase II testing.

IliedSignal A E R O S P A C E
TABLE 4. CLP NT154 TEST SPECIMENS FLEXURE FAST FRACTURE TEST RESULTS.
Test Temperature,
F
Specimen Description
Specimen Quantity
<*> Characteristic Strength, ksi
Weibull Modulus,
m
Volume Flaws, Inclusions
BATCH NO. 1 RT
2100
2500
RT
RT
Longitudinal Machined
Longitudinal Machined
Longitudinal Machined Transverse Machined
As-Processed
20
19
10
10
10
168.7
110.7
98.5
131.8
82.9
18.8
20.9
12.0
28.6
16.8
3, Carbon
1, No Detection
3, No Detection
1, Carbon
None BATCH NO. 2
RT
2100
2500
RT
RT
Longitudinal Machined
Longitudinal Machined
Longitudinal Machined Transverse Machined
As-Processed
20
20
10
10
10
176.5
114.8
101.6
134.7
83.7
16.5
16.5
29.6
12.7
6.7
2, No Inclusions
None
3, No Detection
None
None
BATCH NO. 3 RT
2100
2500
RT
RT
Longitudinal Machined
Longitudinal Machined
Longitudinal Machined Transverse Machined
As-Processed
20
19
10
10
10
153.1
113.6
99.4
112.2
70.0
9.7
15.46
27.49
24.1
6.98
7, Carbon
0
1, No Detection
0
0
RT = Room Temperature.
However, in late June, 1995 NAC advised AlliedSignal Engines that they will no longer pursue business in the ceramic gas turbine components market, resulting in the discontinuation of production of ceramic components manufactured from NT154 and NT164 silicon nitride. NAC indicated their willingness to continue to support the present program, but given that the original selected material, NT154, will no longer be available for the manufacture of gas turbine components, alternatives for the present program were examined by AlliedSignal Engines.
Alternate silicon nitride materials from the two remaining domestic U.S. suppliers were considered for use in this program. These included SN-252 and SN-253 from Kyocera Industrial Ceramics Corp. (KICC), Vancouver, WA, and AS-800 produced by AlliedSignal Ceramic Components (ACC), Torrance, CA. KICC indicated that,

^AlliedSignal A E R O S P A C E 316
following the announcement by NAC and in view of the resulting increased business, they did not have the resources to support additional programs at this time, especially a "specimen-oriented" program. AlliedSignal Ceramic Components indicated their willingness to supply AS-800 specimens for the program. However, they cautioned that the maturity of the AS-800 material is less than that of NT 154. The pros and cons of using AS-800 versus CLP NT154, were discussed at length by AlliedSignal Engines. With the concurrence of ORNL, AS-800 was selected as the go-forward material for this program, primarily based upon its future potential.
1.3 Change of Material For Part of Phase II
Specimens of AS-800 silicon nitride, produced by ACC, will be used in the planned Cyclic Fatigue Testing and Proof Testing Methodology Development tasks in the present program. In addition, AS-800 will also be used in the generation of a significant amount of Material Baseline data. However, NT154 silicon nitride specimens from Phase I are being used for the planned Compressive Creep and Flaw Growth Methodology Development tasks. NAC has also supplied the required ceramic stators and square plate specimens made from slip-cast NT 154 silicon nitride for die planned Nondestructive Evaluation Probability Of Detection (NDE-POD) study
All creep testing in anticipation of the use of closed-loop processed (CLP) NT 154 which was underway at the Oak Ridge National Laboratory High Temperature Materials Laboratory (ORNL-HTML) has been terminated, since NT154 will not be used for any future mechanical property testing directed towards methods development.
1.4 AS-800 Test Matrix
As a result of the change in material to AS-800 silicon nitride, a new test matrix was developed, incorporating all of the basic testing planned for NT154. A temperature limit of 2200F (1204C) has been placed on the test matrices, since the high-temperature properties of the current AS-800 material are not completely understood. An additional important change was the decision to test most of the specimens with the machined surfaces in a transverse direction to the loading, since during service most components will be subjected to stresses oriented transverse to the machining direction.
Table 5 lists the AS-800 test matrix. All the required specimens have been ordered, and delivery is expected by February, 1996.
Table 6 lists the test efforts continuing on NT 154 specimens, which were initiated in 1994.
2.0 Compressive Creep Methodology
Compressive creep testing of NT 154 specimens was initiated at ORNL-HTML by Dr. A.A. Wereszczak in 1994. The test specimens were machined form remnants of the Phase I NT154 material, in the form of right circular cylinders, 5 mm in diameter and 10 mm long. Tests have been completed at stresses of 100, 300, and 500 MPa at 1371C (2500F). The test results (Figure 10) show that the minimum creep rates measured in compression are at least two orders of magnitude lower than the values predicted for creep rates in tension at the same stress levels from the Phase I test data.[Ref. 1, Cuccio, et. al. 1994] In addition, the dependence of the compressive creep rate on the stress level is considerably lower than that measured in tension. The next series of tests will be conducted at 1315C (2400F). Planned testing will be continued at other stress levels as well as at other temperatures.

^AlliedSignal A E R O S P A C E
317
TABLE 5. PHASE II AS-800 SPECIMEN TEST MATRLX.
Test Objective
Baseline
Cyclic Fatigue
Proof Testing
Specimen Type
MIL-B Flexure MIL-B Flexure MIL-B Flexure Tensile Tensile MIL-E Notched Flexure Tensile/Compression Tension MIL-B Flexure MIL-B Flexure MIL-B Flexure MIL-E Notched Flexure
MIL-B Flexure
MDL-B
MDL-B
MDL-B, Proof Tested (Rate No. 1) MIL-B, Proof Tested (Rate No. 2) MIL-B, Non Proof Tested (Rate No. 1) MIL-B, Non Proof Tested (Rate No. 2) Round Plate Round Plate
Test Description
FF FF FF FF SR FF
R= -1.0 R= 0.05 R= 0.05 R= 0.05 R= 0.05 R= 0.05
Machining Anisotropy
Residual Strength 3Pt/4Pt
Residual Strength, RT/HT
Dynamic Fatigue
Non-Proportional Loading
Machining Orientation
TM LM AP TM TM TM
TM TM LM TM AP TM
Machined at 60,65,70 Degrees
TM
TM
TM
TM
TM
TM
Machined AP
Test Temperature, F 75 1300 2200
No. of Specimens
30 30 30 20 ... 20
... — ... ... ... —
90
30
...
—
—
"
_
60 30
30 30 — 20 ... 20
15 15 25 25 25 20
—
—
15
15
15
15
— —
30 ... 30 20 20 .. .
15 15 — 25 25 —
—
30
15
15
15
15
— ...
3Pt/4Pt = 3-Point Proof Test, FoUowed By 4-Point Loading AP = As-Processed FF = Fast Fracture LM = Longitudinally Machined RT/HT = Room Temperature Proof Test/ High Temperature Loading SR = Stress Rupture TM = Transverse Machined

tlliedSignal A E R O S P A C E 318
TABLE 6. PHASE II NT154 TEST MATRIX (ONGOING TESTS).
Test Objective
Compressive Creep
Spin Disks
Flaw Growth NDE-POD
Specimen Type
Cylinders, 5 mm Diameter by 10 mm Length MIL-A Flexure From Spin Disks Static And Cyclic Flexure, MEL-B Machined Square Plate Machined GTCP85 APU Stators As-Processed Square Plates As-Processed GTCP85 APU Stators
Test Temperature, F
2300 to 2500
—
1300 to 2400 — — . . . —
Total No. of Specimens
15
110
42 4 55 4
55
3000
= 1.3x 10⁻⁹/sec
= 1.1x10"9/sec
100 150 Time, Hours
250
G5999-20
Figure 10. Compressive Creep Test Results For NT154 Specimens At 1371C (2500F).

^AlliedSignal A E R O S P A C E 329
3.0 Flaw Growth Methodology
Experimental flaw growth methodology efforts have continued under subcontract at Stanford University, Palo Alto, CA under the direction of Professor R. Dauskardt and Dr. F. Haubensak. These efforts included defining methods for introducing small, controlled cracks into specimens on the order of inherent material flaws. The techniques which were studied are listed in Table 7. Methods to monitor these flaws under loading were defined, as listed in Table 8.
Preliminary data was generated from indentation-induced cracks under static and cyclic loading, as shown in Figures 11 and 12. The minimum crack dimensions achieved so far for indentation cracks are in the neighborhood of 50 micrometers (urn).
Of the three major techniques of introducing artificial flaws, the indentation technique was found to be the most successful and repeatable. For crack monitoring, in-situ optical examination and the replication techniques were most successful.
TABLE 7. FLAW INITIATION TECHNIQUES STUDBED.
No.
1
2
3
4
5
6
Method
Indentation
Micromachining With Laser Drilling
Micromachining With Chemical Etching
Indentation And Removal By Grinding Surface Layer
Repetitive Indentation
Indentation And Applied Loading
Minimum Size, um
50
10
10
<10
<10
<10
Residual Stresses
Kr = %p/c3/2
Minimal
Minimal
Minimal
0<Kr = xP/c3/2
0<Kr = xP/c3/2
Status
Demonstrated
Good Results
Acceptable Results
Acceptable Results
Undetermined
Experimental

tlliedSignal A E R O S P A C E 320
TABLE 8. CRACK LENGTH MEASUREMENT TECHNIQUES STUDIED.
No.
1
2
3
4
5
6
7
8
Method
Surface Replication
Crack Gage
Miniature Crack Gage
Direct Optical Observations
Elevated Temperature Crack Gage
Elevated Temperature Direct Optical
Compliance
Compliance
Temperature Range
Low
Low
Low
Low
Elevated
Elevated
Low, Elevated
Low, Elevated
Crack Size Regime
Short
Long
Short
Long, Short
Long, Short
Long, Short
Long
Short
Status
Demonstrated
Demonstrated
High Likelihood of Success
High Likelihood of Success
Experimental
Experimental
Demonstrated
Low Resolution
1E-6
£ . 1E-7 L_
I I JZ
2 1E
-8
-a co C3
-
-
i r 1 1 1—i—
Small Crack Static Fatigue
NT154, Ambient Air '8204C
From Indentations A AM.
A
▲
Long Crack Upper Bounds Room Temperature I
i i • t i t
i i
i in
. .
|.
-
i jiir
ri
i i
"i ■■
1E-9 1 2 3 4 5 6 7 8 9 10
aiSM Maxinrum Stress intensity, K(MPa-vm]
Figure 11. Preliminary Subcritical Crack Growth Rate From Indentation-Induced Cracks; Small Crack 1204C Static Fatigue Data.

IliedSignal A E R O S P A C E
321
1E-6
CD
I
<5
o
1E-7
5 £ 1E-8 co
CC JZ
1E-9
1E-10
Small Crack Cyclic Fatigue
Room Temperature
NT154, Ambient Air, R=0.1 From Indentations
i — i — i — r
Long Crack [Salmon etaL]
-jgc^r J L 2 3 4 5 6 7 8 9 10
Maximum Stress Intensity, K[MPa ^m] orau
Figure 12. Preliminary Subcritical Crack Growth Rate Data From Indentation-Induced Cracks; Small Crack Room Temperature Cyclic Fatigue Data [Ref. 2, Salmon 1992].
4.0 Cyclic Fatigue Testing
The efforts reported above under flaw growth methodology are to be closely coordinated with planned cyclic fatigue testing of unflawed flexure and tensile specimens. Specimen testing will begin after delivery of the test specimens, scheduled in February, 1996. Consultation has taken place between AlliedSignal Engines and Dr. A.A. Wereszczak of the ORNL High Temperature Materials Laboratory (ORNL-HTML) on the planned experimental efforts. The test plans include testing a portion of the specimens at ORNL-HTML and a portion in-house.
5.0 Proof Testing Methodology
Efforts during this period have concentrated on the development of statistical methods for incorporation of proof test data into evaluation of the Weibull parameters, and methods for improving the efficiency of Weibull parameter calculations for multitemperature data.
5.1 Censored and Proof Tested Data Analysis Weibull Parameter Estimation
As part of the proof testing methodology development, specimen testing will be performed for correlation of the developed methodology. The resulting data will first be obtained for proof tests at stress levels selected to fail approximately one third of the specimens; then test data will be obtained for specimen failure under different loading conditions. Data analysis will be performed after the proof testing to calculate the Weibull parameters by performing a censored data analysis using the data from the unfailed specimens as the censored data at the proof

^AlliedSignal A E R O S P A C E 322
stress level. But, since the analysis capabilities are required to incorporate the specimens that have been proof tested and subsequently tested to failure, the analysis capabilities should be capable of analyzing the data from these specimens by themselves and also pooled with other non-proof tested data. The derivation of the analysis equations is presented in the following sections. The derivation is carried out for specimens that are proof tested and have failed at the same temperature. The derivation for proof testing and failure at different temperatures is more complicated and will be derived later.
One may start by defining the likelihood function: r n
L(m,a0)=Y[f(ahm,c0)» f j / 35 ( a y , m , t j 0 )
j=l j=r+\
Where the probability and cumulative density functions are defined, respectively, as: , / ^ dS{<5) f(dl,m,C0) = f - t
d<5
5(a )=exp- IV ( \ m
\°oj -IPV
fa_p}m
for: IV a
\?oj -IPV
v ° o , >0
Where: / and Ip are the multiaxial factors for failure and proof, respectively; G and G p are the maximum effective stress for failure and proof, respectively; m and G 0 are the first and second Weibull parameters, V is the physical size of the failure mode in question, i is the index for failed specimens, j is the index for specimens that survived, k is the index for all specimens, n is the total number of specimens, and r is the total number of failures.
[1]
[2]
[3]
Notice that Equation [3] becomes the regular Weibull distribution for ceramic materials if G P is set to zero. The log likelihood function can be constructed from the above equations:
/ = 2ln(/0+Iln(K)+rln(m)+S(m-l)ln(G1.)-/7n-ln(Go)-X/iM i=l i=l i=l i=l \9.J
' < j=r+l
- I f f i f +XV, v°0y J k = l [4]
Such function is then used to calculate the Weibull parameters. The Weibull parameters are given by the values of m and G 0 that maximize the log likelihood function. The log likelihood function is maximized when its derivatives with respect to m and G 0 equal zero, as defined by the following equations:
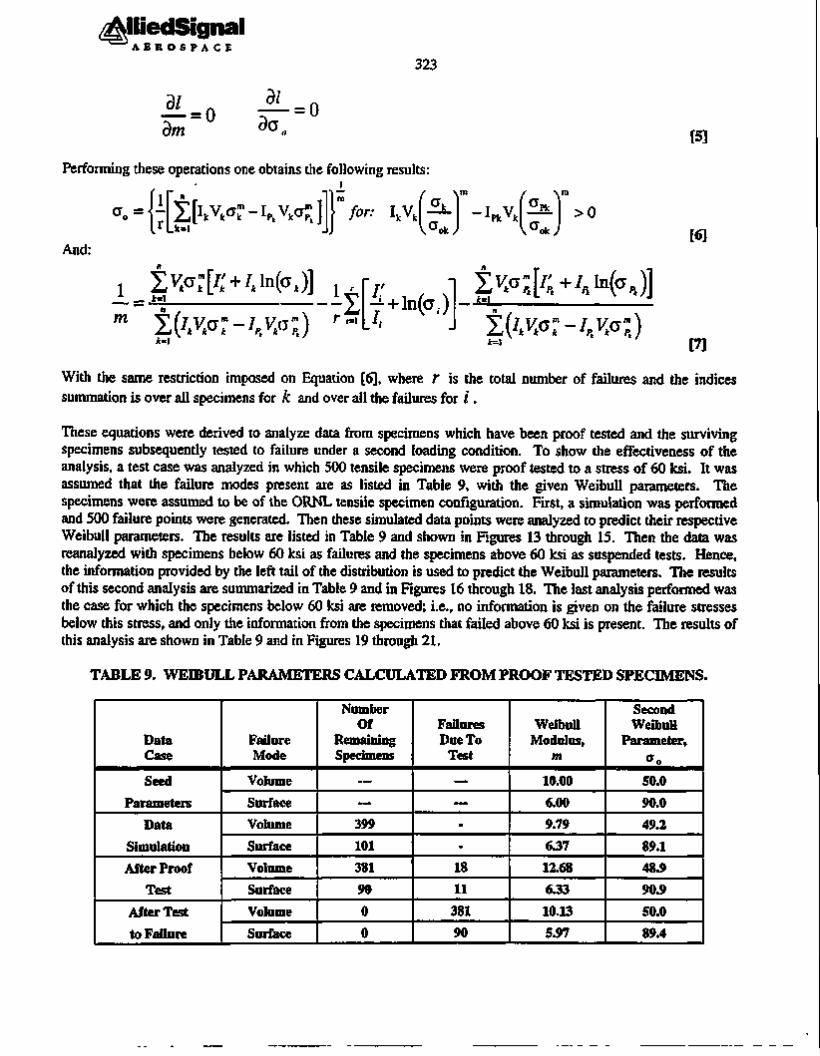
IliedSignal A E R O S P A C E
323
dm = 0 _a/_ 9G„
= 0 [5]
Performing these operations one obtains the following results:
X[lkVkar-IPlVka£] .k= l
for: IkV, — I V xPk v k
(<5 ^ Pk
\°*J > 0
And: [6]
i xw[/;+'4in(°*)] i , -1- _ i=I -1 V
m X(«a:-/^4aj) r ,=i |+ln(o f)
_ i
|y tG;[/;+/ f tin(G,)]
X(«°:-w;) i= l [7]
With the same restriction imposed on Equation [6], where r is the total number of failures and the indices summation is over all specimens for k and over all the failures for / .
These equations were derived to analyze data from specimens which have been proof tested and the surviving specimens subsequently tested to failure under a second loading condition. To show the effectiveness of the analysis, a test case was analyzed in which 500 tensile specimens were proof tested to a stress of 60 ksi. It was assumed that the failure modes present are as listed in Table 9, with the given Weibull parameters. The specimens were assumed to be of the ORNL tensile specimen configuration. First, a simulation was performed and 500 failure points were generated. Then these simulated data points were analyzed to predict their respective Weibull parameters. The results are listed in Table 9 and shown in Figures 13 through 15. Then the data was reanalyzed with specimens below 60 ksi as failures and the specimens above 60 ksi as suspended tests. Hence, the information provided by the left tail of the distribution is used to predict the Weibull parameters. The results of this second analysis are summarized in Table 9 and in Figures 16 through 18. The last analysis performed was the case for which the specimens below 60 ksi are removed; i.e., no information is given on the failure stresses below this stress, and only the information from the specimens that failed above 60 ksi is present. The results of this analysis are shown in Table 9 and in Figures 19 through 21.
TABLE 9. WEIBULL PARAMETERS CALCULATED FROM PROOF TESTED SPECIMENS.
Data Case
Seed Parameters
Data Simulation After Proof
Test After Test to Failure
Failure Mode
Volume Surface Volume Surface Volume Surface Volume Surface
Number Of
Remaining Specimens
— — 399 101 381 90 0 0
Failures Due To
Test
. „
--
18 11
381 90
Weibull Modulus,
m 10.00 6.00 9.79 6.37 12.68 6.33 10.13 5.97
Second Weibull
Parameter,
50.0 90.0 49.2 89.1 48.9 90.9 50.0 89.4

^AlliedSignal A E R O S P A C E 324
/
/
/
A /
/
i *
A / .
*
/ /
/
/ / *
Failure Mode Symbol
Surface C Volume J !
—
10
G5870-10
20 30 40 50 60 70 80 90 100
Failure Stress, ksi
Figure 13. Simulated Data Used In The Proof Test Study. Combined Failure Mode Plot.

^AlliedSignal ^—>
A E R O S P A C E
325
a O
a <u
1 c 0) o cu
Q.
9.999
99.95 99.5 98.0
90.0
70.0
50.0 40.0 30.0
20.0
10.0
5.0
2.0
1.0
0.5
0 2
0 1
0.05
0.01
0.005
/ o
it
i°
In
40 G5870-11
40 40 50 60 70 80 90 100
Failure Stress, ksi
200
Figure 14. Simulated Data, Plot Of The VOLUME Failure Mode.

^IliedSignal A E R O S P A C E
326
/
/
7
J
/
/
/
Q
0 /
/ o
y / y
/ /
/
/
e,Z
—3" ?-
40 G5870-12
40 40 50 60 70 80 90 100 Failure Stress, ksi
200
Figure 15. Simulated Data Plot Of The SURFACE Failure Mode.
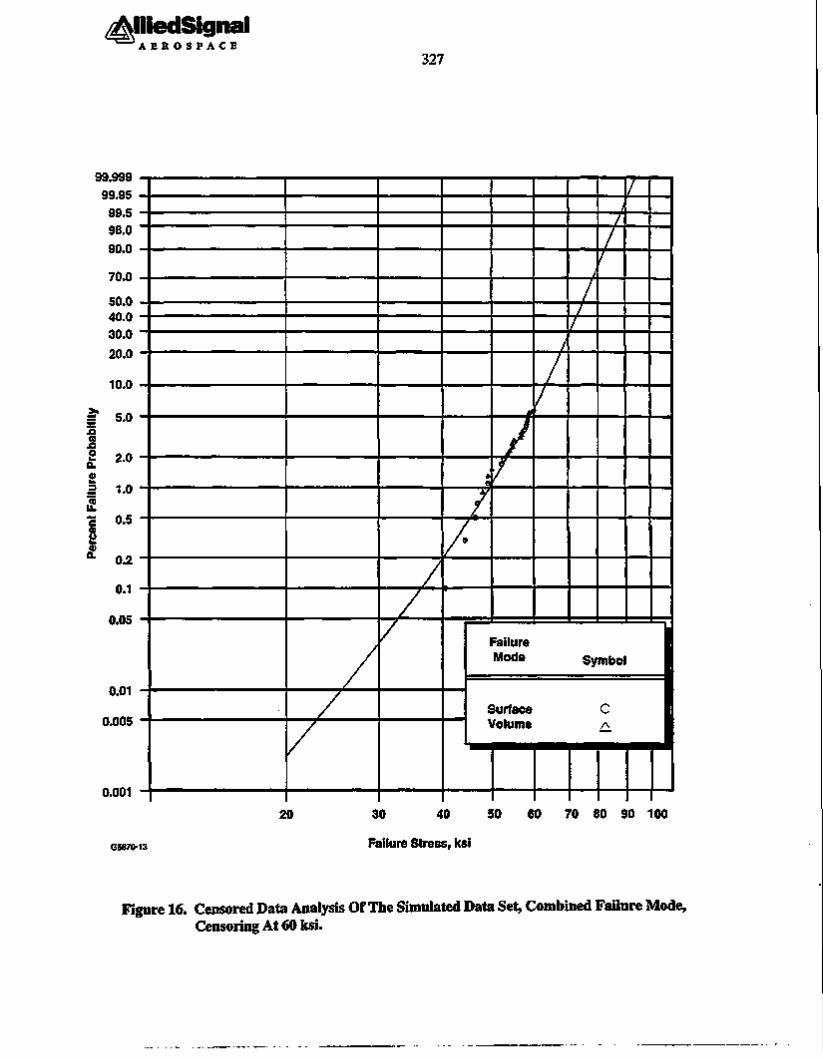
IliedSignal A E R O S P A C E
327
99.999 99.95
99.5 98.0 90.0
70.0
50.0 40.0 30.0 20.0
10.0
>> a 5.0 .o eo x> o a OJ 3
*5 u . c a) o o a.
2.0
1.0
0.5
0.2
0.1
0.05
0.01
0.005
0.001
G5870-13
/
/
/
/
/ /
*
/
/
/
A J (
J
/ i
i
Failure Mode Symbol
Surface C Volume A.
20 30 40 50 60 70 80 90 100
Failure Stress, ksi
Figure 16. Censored Data Analysis Of The Simulated Data Set, Combined Failure Mode, Censoring At 60 ksi.
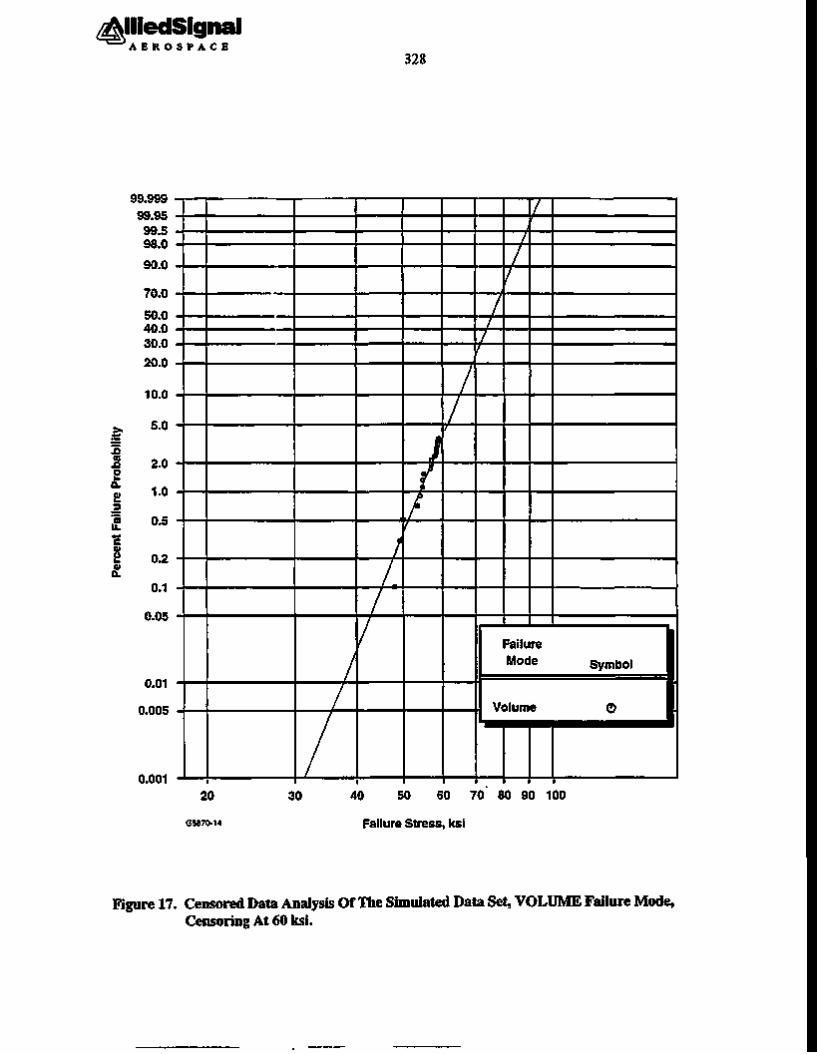
^IliedSignal A E R O S P A C E
328
99.999 99.95
99.5 98.0
90.0
70.0
50.0 40.0 30.0
20.0
10.0
5.0
2.0
1.0
0.5
0.2
0.1
0.05
0.01
0.005
0.001
/
/ (
/
1
1 / r
j
f
i
Y
1 *
Failure Mode symbol
Volume ©
i
20
G5870-14
30 40 50 60 70 80 90 100
Failure Stress, ksi
Figure 17. Censored Data Analysis Of The Simulated Data Set, VOLUME Failure Mode, Censoring At 60 ksi.

tlliedSignal A E R O S P A C E
329
/
/
/
/
/
7
0
A o / 0/
A
/
/
A /
/ >
/ A
/
/
/
/ /
Failure Mode Symbol
Surface O
20 30 40 50 60 70 80 90 100
G587CM5 Failure Stress, ksi
200
Figure 18. Censored Data Analysis Of The Simulated Data Set, SURFACE Failure Mode, Censoring At 60 ksi.

JliedSignal A E R O S P A C E
330
9.999 99.95
99 5 98.0
90.0
70.0
40.0 30.0
20.0 -
5 0
0.5
0.2
0.1
0.05 —
0.01 —
0.005
/
/ r
>
/
/
A
I
/
/ /
/ /
/ r
20
G5870-16
30 40 50 60 70 80 90 100
Failure Stress, ksi
Figure 19. Proof Tested Data Analysis Of The Simulated Data Set, Combined Failure Mode. Only Data Above 60 ksi Is Present

tlliedSignal A E R O S P A C E
331
/
/
/
/
/
/
/ /
/ ' / }
I / !
1 /o
20 30 40 50 60 70 80 90 100
G5B70-17 Failure Stress, ksi
200
Figure 20. Proof Tested Data Analysis Of The Simulated Data Set, VOLUME Failure Mode. Only Data Above 60 ksi Is Present
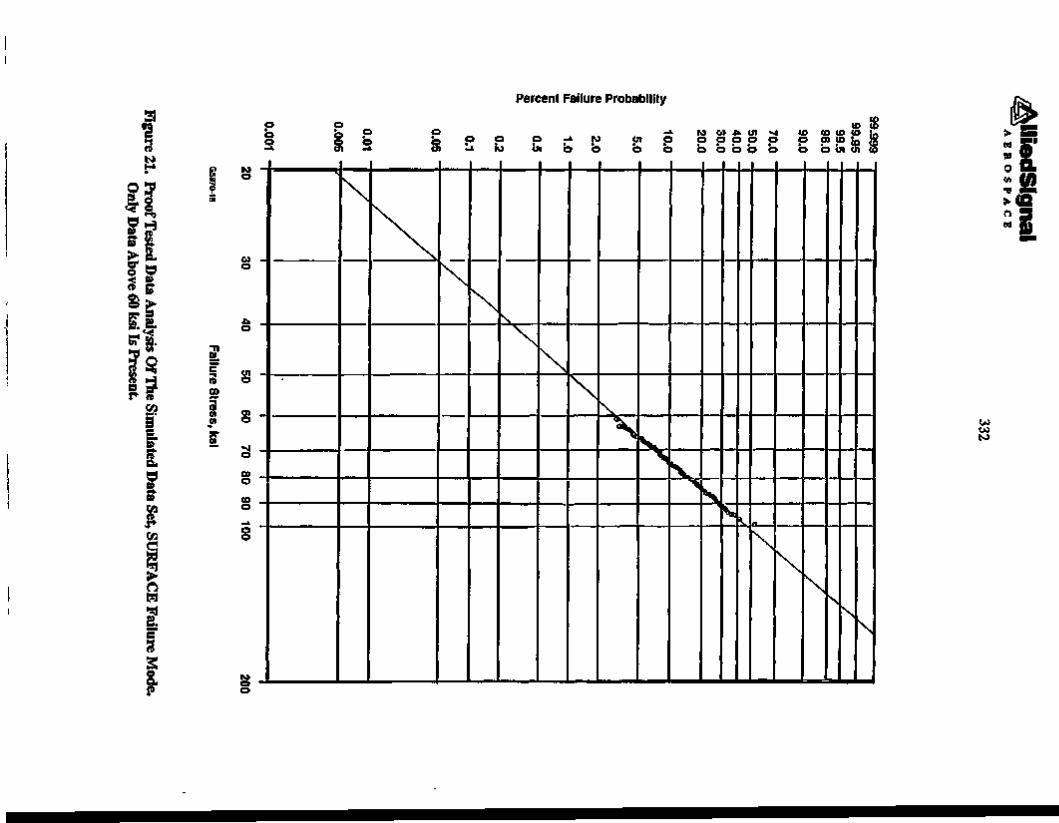
Percent Failure Probability
a ■a n
o SL *<
«
*> cr o < a
5
H 8
O 63
EEL 6? a.
n a
P b o
o o en
p b
o o en o
* o to o
en o to o en
o _l
o o
to o o
co 4* en o o o o o o
w o o
CO o o
CO CO CO CO P P b o en en
CD CO
b CO CO
to o
CO
o
■n to c CD <n m in in *CO
u o
en o
en o >j o CD o CO o _l
o o
to o o
,
\
\ \
\
V \ V
> \
> s \ "
\ \
\
I > w so o « < / > >a ■■■ > ( f l n w 3

JliedSignal A E R O S P A C E „ „ „
333
It is important to note that a new data ranking technique developed under this program has been employed to plot the proof tested data. This new ranking approach makes use of Weibull parameter calculated by the maximum likelihood approach. The method consists of adjusting the specimen count used in the ranking, in the following way:
1) Calculate the probability of failure and success for the specimen type for the given proof test stress level. Use the calculated Weibull parameters obtained from the likelihood analysis.
2) Calculate a pseudo number of total specimens tested; this number may not be an integer number:
N N N. = N =
^ P r K ) S P s ( °p ) [ 8 ]
ps ( 0 = exP- rv
'<0 \°«j [9]
3) Calculate the number of specimens that were removed by the proof test:
nr = P f ( a p ) N s [ 1 Q ]
4) Calculate the new ranks by replacing i by nr + i, i.e.:
n + i - 0.5 Rank =
N- mi 5) For censored data, adjust the increment in the following way:
N +1 -PMON Inc = —* [12]
1 + NIBPSS For the very first failure after a suspended item, use nr for PMON; from there on, use the standard definition for PMON, as described in the Phase I Final Report, p. 5-80 [Ref. 1, Cuccio, et. al. 1994].
5.2 Multitemperature Data Weibull Parameter Calculation
During Phase I of this program, AlliedSignal Engines [Ref. 1, Cuccio, et. al. 1994] developed a data analysis approach which assumed that the first Weibull parameter is invariant with temperature, and that the second Weibull parameter was a function of temperature. This approach allows the pooling of multitemperature data into one single analysis for calculation of the Weibull parameters, yielding more accurate estimates of these parameters because of the increased number of specimens used in the calculations. The effort presented here outlines an approach which will increase the numerical efficiency of the calculation for censored data.
We start by defining a likelihood function. In this case it is defined as the product of the likelihood at each temperature:

IliedSignal A E R O S P A C E
334
L(m,GoiyY[ r, rt,
i=\ j=r,+l [13]
and the log likelihood function:
' M J = Si£ln(m)+£ln(^ / L/=i 1=1 /=1 1=1 /=!
J=l h,Va <^A + 1
j=r,+l Vi
f<5 , V"
v a . /y [14]
Where the different parameters are defined as in 5.1 above and the index / ranges over all the temperatures. This analysis assumes that the (7 o/ 's are independent from each other. Maximization of the likelihood function yields uncoupled equations for the <J o/ 's as outlined below:
dl_ dm
= 0 dl
8G = 0
ol
Performing these operations yields: dl(m,Gol)_ r,m m A r ,
Vol Vol *=' Which reduces to:
< * ■ = -l[*uVua:] il/m
Lr, w And:
h = Z + l 7 L + Ito(°;/)'7to(c0/) dm / Im /=i/ j7 l=1
I it=i
ruvu r*..\
u \9oij
s i»vu ^ kl
K°oU In ki
\GolJ
Substituting Equation [17] into Equation [18] and simplifying gives:
m I*!1" i=i
i=l
i: r+M?«)
*=i
[15]
[16]
[17]
[18]
[19]
These equations can then be solved by normal optimization methods.

JliedSignal A E R O S P A C E „ „ „
335
Note that the CT ol 's are dependent only on the Weibull modulus and the existing data at each temperature and that the Weibull modulus is a function of all of the available data at all of the temperatures.
Efforts have continued in development of statistical methods for analysis of pooled multitemperature data. Approaches for confidence bounds predictions for the Weibull parameters of multitemperature data have been outlined, as described in 5.3. A description of the Bootstrap approach for calculation of the confidence bounds is presented in 5.4, below; the Likelihood Ratio approach is still under development.
5.3 Derivation Of Weibull Parameters For Multitemperature Data Assuming A Functional Relationship For The Second Weibull Parameter
The analysis of multitemperature data is important, because ceramic components used in turbine engine applications experience operating conditions at a variety of temperatures and significant temperature gradients, that impose severe thermal stresses on the components. In order to determine the strength of a component at elevated temperatures, specimen testing is usually performed at a variety of temperatures. But it is usually cost-prohibitive to test enough specimens to completely span the envelope of operating temperatures, hence the need to develop methodologies to extract the most information possible out of a few data points at each temperature condition. The question remains, what must be done to determine the material strength for temperatures other than those for which test data exist? Hence, interpolation and extrapolation schemes must be defined for such purposes.
The approach selected for this program assumes that there is a continuous variation of the fast fracture strength of ceramic materials with temperature, and that such variation can be represented by a function of the form given in Equation [20]. The challenge, then, is to determine the coefficients for this equation. Previously adopted classical approaches have assumed that a curve can be fitted through the data by assuming a normal distribution of the error about a best-fit line. The approach we have taken goes further, in that we assume that the data follows a Weibull distribution: not the errors about the best fit, but the actual data. This approach enables the use of a consistent methodology, with the second Weibull parameter as a function of temperature, represented by the best-fit line. This methodology will eventually enable the prediction of reliability confidence bounds for components with temperature gradients.
on = A0+A,Tan-(1 - K, N
K, + AjTan " 'T-jO
V K 4 J [20]
This form of Equation [20] is chosen because it has been observed that the inverse tangent relationship fits very well the sharp drop observed in material strength at elevated temperatures. The approach consists of substituting Equation [20] into the likelihood function for the second Weibull parameter. Calculation of these constants and of the first Weibull parameter is performed as usual, then differentiating the likelihood function with respect to the unknowns and setting to zero.
Substitution of Equation [20] into the likelihood function results in Equation [21]:

IliedSignal A E R O S P A C E 336
l (m,o o )= r ln(m)+ £ ln(I,)+ £ ln(V,)+ £ (m - l)ln(o,) i . i 1=1
( [21] - £ m l n ( o o l ( A J , A , , A , K 1 , K 2 , K 3 , K 4 ) ) - X l k V k
.=i k=l ^ o (A 0 ,A ,A 2 ,K 1 ,K 2 ,K3 ,K 4 ) J
Differentiating with respect to the unknowns, one obtains Equations [22] through [24]. The differentiation of the likelihood function with respect to the constants is more easily accomplished using the chain rale of differentiation; hence:
31 31 do 3A, da 3A.
dl(m,c 0) J . m m ^ , m i
3o 0 1=i a 0 a 0 k.i
[22]
[23]
_31_ 3l(m,ooi)3CToi m 3ooi ' r m , m 3oo i ^ A = a 7T= " Z — T T " 1 " Z Ukivki^ u J — ^ - r r -
3A 3ora 3A ..i o a 3A k.i o01 9A [24]
Differentiating the second Weibull parameter function with respect of each one of the constants:
3°. dAi
3CT„
9A0
3 o n
3A
3A
3o„ 3K
dA ; A0 + A,Tan"
T - K , K,
+ A2Tan - i
2 J
' T - K ^ V K 4 J
= 1
= Tan"1
= Tan"
3 ~ 3K,
T - K, N
V K 2 J
' T - K 3 ^
\ K 4 J
I " -""I
ATan'
3o„ 3Kj
3o„ 3K,
_3 3Kj _
ATan'
3K 3 L
ATan
T - K ,
I K2
T - K , K,
T - K ,
V K4
3K, •= A' i +
3c , 3K
*=v
7 V T - K ,
V K2 J 1
"7"
K,
T - K, -1
1 + T - K ,
, \
V K, j
ICj K2
3a„ 1 - 1 3K,
1 + Y T - K
V K 4 J
K4
[25]
[26]
[27]
[28]
[29]
[30]
[31]

IliedSignal A E R O S P A C E 337
3K4 "3K 4 | _ ATan - i T - K ,
K, =* = A,-
3K4
T - K, -1
1 + T - K , V
V K 4 j
K, K. [32]
These equations can now be substituted into Equation [24] to form seven equations for the seven unknowns in the interpolation function. But one still needs the equation for the first Weibull parameter, or the Weibull slope. Hence, one must differentiate the likelihood function with respect to the first Weibull parameter and obtain:
3l(m,CT„) r ' I ' ' ' , , NN
3m m I . I i I . I
( i . i
- 1 i*vk k . l c o k (A,K) k . l ° o k (A ,K)
Y ( In
o o k (A ,K) [33]
Equation [33] along with the seven equations from the seven unknowns in the interpolation function are used to calculate the value of the unknowns. As can be seen in the above equations, a closed-form solution for the unknowns is not possible. This is a nonlinear system of equations which must be solved using appropriate nonlinear solution methods.
In an effort to test the effectiveness of this approach, the data presented in Figures 22 and 23 has been reanalyzed. The results are shown in Figures 24 and 25, respectively. Asterisks represent the second Weibull parameters calculated using Equations [17] and [19], and the solid lines represent the result using the interpolation function approach given in Equation [20]. As can be seen, for a well-behaved set of data, the approach is successful, allowing for calculation of the second Weibull parameters at any temperature in the interpolation range and over a carefully considered extrapolation range. The fit used for the data in the above figures consisted of only the constants AQ, A\, K\, K%, assuming the others to be zero.

IliedSignal A E R O S P A C E 338
48 n
40
32-
l>24 c o CO
16
9 @ °
§ 9 g ° O o
0 400 800 1200 1600 2000 2400 2800 G5870-19 Temperature, F
Figure 22. ORNL Tensile Specimen Multitemperature Data, Volume Failure Mode.
120-1
100-
8 0 -(0
ra 60 0)
CO
40
2 0 -
- ~ o S
8 °. 1 " : » <s : e
© = Surface - = Suspended
G5870-20
400 800 1200 1600 2000 2400 Temperature, F
2800
Figure 23. Combined ORNL Tensile Specimen and MTL-B Specimen Multitemperature Data, Machined Surface Failure Mode.

^AlliedSignal *—' A E R O S P A C E
339
48
40
32-
(A
Ss 24 c
CO
16-
8-
Interpolation Function
CO = Ao + A T Atan-1 (T-K1) K2
— i 1 1 1 1 1 1 400 800 1200 1600 2000 2400 2800
Temperature, F G5870-21A
Figure 24. Analysis of ORNL Tensile Specimen Multitemperature Data, Surface Failures (From Figure 22).
120
100
80
CO it
g> 6 0 -cu
CO
40-
20
• Second Weibull Parameter
1 1 1 1 1 1 1 0 400 800 1200 1600 2000 2400 2800
G5870-22 Temperature, F Figure 25. Analysis of Combmed ORNL TensUe Specimen and MTL-B Specimen
Multitemperature Data, Machined Surfaces Failures (From Figure 23).

^AlliedSignal A E R O S P A C E 340
5.4 Bootstrap Approach For Calculation Of Confidence Bounds For Weibull Parameters Of Multitemperature Data
Given that the Bootstrap method relies heavily on evaluation of the process to calculate the confidence intervals, the approach is better described on a step-by-step basis. The confidence limits of the Weibull parameters can be calculated simultaneously; both calculations are presented in this section.
a) The first step consists of estimating the Weibull parameters using the Maximum Likelihood method. The estimates are computed from Equations [34] and [35]:
< * o , = riM-aS] -|l/m
r,k=1 [34]
_1_ m x-EZv-"*—
Sr,"" k='S[luVk,a»] [i;,V„a-; + IllV1„aXaw)]--£ f+K«.)
L u [35]
b) Second, a random number between zero and one is chosen; this number is the selected reliability value, R. Do the same for each different temperature. The calculations for the different temperatures may be done at the same time, or for one temperature at a time. This is basically the only difference in the procedures between the multitemperature data and the regular pooled data approach developed during Phase I.
c) Next, select a specimen type from the original data set, with its corresponding V, and I , . Using the above m and tj,,,, compute the fracture strength of this pseudo specimen using Equation [36], given that it has the reliability equivalent to the value of the random number chosen in step (b):
<*i = < * -ln(R„) y/m
[36]
d) Repeat steps(b) and (c) for each specimen type and size a number of times equal to the number of specimens in the individual data set.
e) Calculate the Weibull parameters for this newly-generated data set using Equations [37] and [38] and save these values:
< * i = L r i [37]

IliedSignal A E R O S P A C E 341
1 1 s
m X«* I=I
1=1 X-k=l I[luvuoS]
k=l
f) Repeat steps (b) through (e) 1000 times.
[i:,Vkla:+IklVk,^^n(akI)]-i i=l
ir. L + H°,) [38]
g) Sort the m and G0l pair(s) in ascending order for 111 without losing the pair(s), and also for G0l without losing the pair(s).
h) To calculate the xth confidence interval, pick the (100-x)(1000/2)(l/100) points from the upper and lower ends of the sorted values in step (g); these define the limits. For example: if the 95-percent confidence interval is required, substitute the number 95 for x to obtain 5, then multiply by the adjoining factor to get 25. Hence, the 95-percent confidence interval is given by the 25th point from the lowest and the 25th point from the highest of the sorted values m and <J0l in step (g).
5.5 Confidence Limits For The Design Stress Level
a) The design stress level can be obtained from the Weibull parameters calculated in Equations [37] and [38] by using Equation [39], where "p" is the desired probability of failure, V is the component volume and I is the component multiaxial and stress gradient factor:
Gp =3^ 1 , f l
T=—In IV
A
1-p
1/&
[39]
b) Given that we have a set of m and G0l from the steps in Section 5.4, compute G from Equation [39] for each one of these values and save them.
c) Sort the G values and obtain the xth confidence interval by picking the (100-x)(10/2) points from the upper and lower ends, using the same approach as in step 5.4(h).
5.6 Confidence Limits for the Reliability Prediction
a) Similarly to G , the reliability, R, has a functional relationship to G0, given by Equation [40], where Z is the
maximum stress level of the component, and I and V are the component multiaxial and stress gradient factor and volume, respectively:
R(Z) = exp-f r j \
IV v°w [40]

^AlliedSignal A E R O S P A C E 342
b) Given the m and G0l values from the steps in 5.1, substitute these values into Equation [7] to find a list of R's.
c) Sort the R's and obtain the xth confidence interval by picking the (100-x)(10/2) points from the upper and lower ends, using the same approach as in step 5.4(h).
6.0 NDE Reliability
Samples of artificial defects, recommended to supplement the naturally-occurring discontinuity population, that were produced earlier under the Phase I program by Resonetics, Inc. (Nashua, NH) were evaluated by the AlliedSignal Engines Materials Laboratory. These simulated pits produced by excimer laser ablation were found to be satisfactory. The simulated pits measured a maximum material depth of 0.0787 inch and a minimum surface dimension of 0.0063 inch. However, the simulated cracks or linear indications were found to be too shallow in depth and too wide at the surface. For example, a nominal 0.020 inch long artificial flaw measured only 0.0041 inch deep and 0.0018 inch wide.
Destructive evaluation was conducted by AlliedSignal Engines on five additional specimens with laser-produced notches that were supplied by Resonetics, Inc. as a follow-on to the Task I destructive testing planned as part of the nondestructive evaluation probability of detection (NDE-POD) study. Resonetics was able to produce narrower notches than in the previous specimens, to serve as supplementary linear discontinuities in the POD specimens. The minimum surface width achieved appeared to be approximately 10 urn (0.0004 inch). The intent of the destructive evaluation of these additional laser-notched specimens was to verify the minimum specified notch width of 10 um. Due to the narrowness of the notches, the depths were estimated by Resonetics by counting the laser pulses used to create the notches, with an expected width of 0.08 to 0.10 |im per pulse. The destructive evaluation results obtained are listed in Table 10.
TABLE 10. DESTRUCTIVE EVALUATION RESULTS OF LASER-NOTCHED SPECIMENS.
Note that the actual depths are much less than the estimated depths, with the exception of Specimen No. 4, which was greater than estimated. In discussions with Dr. A. Berens of the University of Dayton Research Institute (UDRI), only surface dimensions will be used for the NDE-POD study. Therefore, a defect is usable for the study so long as it contains penetrant for bleed-back during the inspection development process, i.e., not emulsified and washed out. From penetrant testing results on the Task I defects, the minimum depth should be 51 urn (0.002 inch). In Task II then, the goal will be to consistently produce indications of this minimum depth while maintaining a 10 or 25 |im width.
The estimated depths did not correspond to measurements from the destructive evaluations (sections). The narrow notch size is desirable for the POD study, due to the greater difficulty in detection visually, and also for reduced FPI penetrant volume. Work is continuing with Resonetics to produce narrow notches of reliable depth.

IliedSignal A E R O S P A C E 343
As a potential worst-case situation, it may be necessary to destructively evaluate the notch dimensions at the conclusion of the POD study.
The set of 55 machined surface Probability of Detection (POD) specimens have undergone fluorescent penetrant inspection (FPI) with Level 4 sensitivity, post-emulsified penetrant. The indications were documented as to location, maximum surface dimensions, and flaw type per ASTM Specification F109. Documentation has been completed of the FPI indications on all the specimens planned for the NDE-POD test objective. Dr. Berens of UDRI has entered this data into a computer spreadsheet to facilitate making recommendations for supplementing the naturally-occurring discontinuity population in the specimens. In general, the data shows that there is a shortage of linear discontinuities in the specimens.
Publications
1. D.C. Wu, A.D. Peralta, M.N. Menon, and J.C. Cuccio, "Subcritical Crack Growth Life Prediction for Ceramic Components of Advanced Heat Engines," ASME paper 95-GT-236, American Society of Mechanical Engineers, 1995.
2. A.D. Peralta, D.C. Wu, P.J. Brehm, J.C. Cuccio, and M.N. Menon, " Strength Prediction of Ceramic Components Under Complex Stress States," ASME paper 95-GT-394, American Society of Mechanical Engineers, 1995.
Acknowledgments
We would like to extend our appreciation to Dr. A.A. Wereszczak of the Oak Ridge National Laboratories High Temperature Materials Laboratory (ORNL-HTML) Mechanical Property User Center for the help he has extended to AlliedSignal Engines in the tensile testing of CLP NT154 specimens, and commend his success in establishing an excellent compressive creep testing facility at HTML, where the specimen tests for the compressive creep tasks of this program are being performed.
References
(1) J.C. Cuccio, et. al., "Life Prediction Methodology For Ceramic Components Of Advanced Heat Engines Phase I Final Report, Contract No. 86X-SC674C," DOE/ORNL Report No. ORNL/Sub/89-SC674/l/Vl&V2, 1995; (AlliedSignal Report No. 31-11591 (Two Volumes), AlliedSignal Engines, Phoenix, AZ March 1, 1994).
(2) D.C. Salmon, Ph.D. Thesis, Dept. of Mechanical Engineering, U. of Utah, Salt Lake City, UT 1992.

344
3 . 3 ENVIRONMENTAL EFFECTS
3.3 ENVIRONMENTAL EFFECTS
Environmental Effects in Toughened Ceramics* N. L. Hecht (University of Dayton)
Objective/scope Since December 1984, the University of Dayton has been involved in a
project to investigate the effects of environment on the mechanical behavior of ceramics being considered for heat engine applications. In the first phase of this project, the effects of environment on the mechanical behavior of transformation-toughened Zr02 ceramics were investigated. In subsequent phases, Si3N4 and SiC ceramic were evaluated. Tensile, flexural, and fatigue strength of the SiC and Si3N4 ceramics were evaluated at temperatures ranging from 20 to 1400°C. Microstructure, chemistry, and physical properties were also investigated. In the current phase, newly developed or enhanced SiC and Si3N4 ceramics are being investigated. In addition, the effects of different machining processes on the mechanical behavior of selected SiC/Si3N4 ceramics are being studied.
Technical progress
During the past six months of the project, the mechanical behavior of Carborundum's Hexoloy SA, Allied Signal's AS-800, and Ceradyne's Ceralloy 147-3 were investigated. Flexural, tensile, and fatigue properties from 20 to 1350°C were measured. The flexural strength was measured using B-type test bars following ASTM C-1161 in an Instron Model 5500R123. All of the tensile property measurements were made using buttonhead specimens in an Instron 8561 with supergrips and a high-temperature short furnace. Elastic modulus was measured using a Grindo-sonic (Model MR35T) Transient Impulse Elastic Modulus Apparatus. In addition, the effects of machining methods on the mechanical behavior of Hexoloy SA and Kyocera SN-252 were investigated. The status of the workscope tasks are outlined below:
1. Investigation of the 1994/95 vintage AS-800 has been completed.
2. Investigation of the new generation Hexoloy SA will be completed with the measurement of fracture toughness at 20°C, 1150°C, and 1350°C.
3. Investigation of Ceralloy 147-3 is in progress and will be continued.
4. Investigation of Golden Technologies' RBSN tubes and MgO PSZ rods will be initiated shortly.

345
5. Investigation of the effects of machining on the flexural strength of Hexoloy SA and SN-252 will be continued. Ultrasonic machined specimens will be investigated, and the effects of oxidation treatment on the SN-252 flexural specimens will be studied. Raman microprobe and SEM evaluations of the machined specimens will also be continued.
6. As part of a project renewal, the thermal mechanical behavior of new vintage (1996) AS-800 Si3N4 and Norton NT-551 SiAION will be initiated this winter (1996).
AS-800
The results of the flexural and tensile strength measurements are summarized in Figure 1, and the tensile stress rupture behavior is summarized in Figure 2. The step stress and step temperature ITSR are summarized in Table 1.
Hexoloy SA (new vintage)
The results of the flexural and tensile strength measurements are summarized in Figure 3. The interrupted tensile stress rupture results are compiled in Table 2 and the tension-tension cyclic fatigue behavior are compiled in Table 3. The Young's modulus measured versus temperature is plotted in Figure 4.
1000
900
800
"ro" 700 Q.
§. 6°° ■£ 500
CD 4)0
200
100
0
- • — Flexure A- Tensile
-200 200 100 600 800 1000 1200 1400
Temperature (°C)
Figure 1. Comparison of Flexural and Tensile Strength forAS-600.

346
P3 D .
a>
U3
— ♦ — 1204'C —A— 1260"C . _ H — 1317C
$.. 1370°C
y=255.39.461"lnx o
A 1
y=ie9.2175e"lnx
y=139+7.98E.017"lnx
«. *...4»...
1 C ? I ■ ■ m . . . I . . . ■ ■ . ■ . . . I . . . I . . . I l l l l l l . . . I . . . I . . . I l l l l l l . , . 1
S 10"1 z 3 * 5 |0
n 2 3 t S 101 Z 3 * S 10
2 z
Lifetime (hrs)
Figure 2. Tensile Stress Rupture for AS800
Table 1. Step Stress and Step Temperature ITSR of AS800
Specimen Number
S9405203 #3
S9405142#5
S9405141 #4
S9403541 #17
S9405191 #15
Temperature (°F)
2000 2000 2000 2300 2300 2300 2300 2400 2300 2300 2400 2300 2300
Stress Level (MPa)
146 219 291 146 219 100 146 146 100 146 146 146 219
Time (hours)
100 24 24
100 24 72 24 40.5 72 24
9.2 100
0.7
Residual Tensile Strength (MPa)
530
458
Fracture Origin
?
Volume
?
?
?
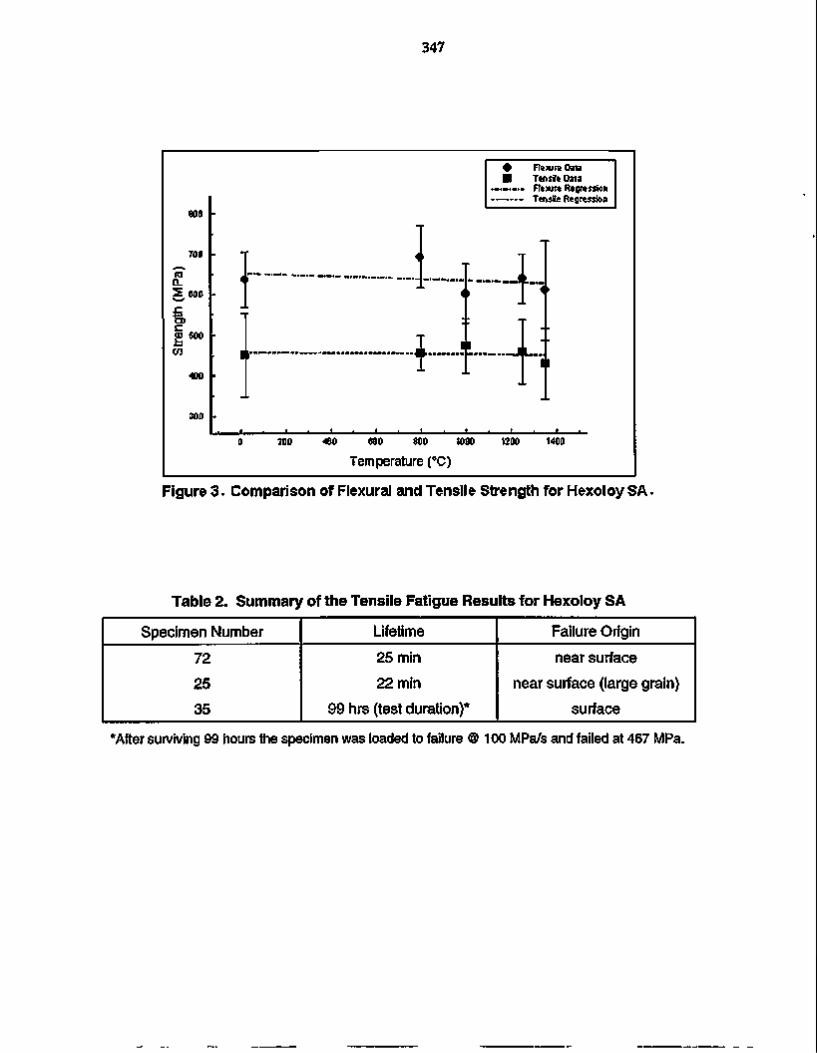
347
800
700
CO Q_ 2 600
. c
en c CO 500
m 400
300
<
1
0
i*
<>
I I 1 * —
T
200 400 600 800 1000
Temperature (°C)
♦ Flexure Data ■ Tensile Data
Tensile Regression
i>
I I
1200 1400
Figure 3. Comparison of Flexural and Tensile Strength for Hexoloy SA
Table 2. Summary of the Tensile Fatigue Results for Hexoloy SA
Specimen Number
72
25
35
Lifetime
25 min
22 min
99 hrs (test duration)*
Failure Origin
near surface
near surface (large grain)
surface
*After surviving 99 hours the specimen was loaded to failure @ 100 MPa/s and failed at 467 MPa.

348
Table 3. Tension-Tension Cycl ic Fatigue Test Results Carborundum Hexoloy SA
3(A): Test Conditions Temperature: Atmosphere: Stress Level: Mean Level: R: Frequency:
1000°C Air ±106 MPa 130 MPa 0.1 1.25 Hz
Specimen Number
15 40 44 53 30
Cycles Completed
450,000
450,000
450,000
450,000
450,000
Diameter (in)
0.2503
0.2505
0.2531
0.2501
0.2529
Load (lbs)
3,499
3,069
2,646
3,222
3,139
Avg.
Residual Tensile Strength (ksi)
71.1
62.3
52.6
65.6
62.5
62.8
(MPa)
490 429 363 452 431 434
Fracture Origin
?
Volume
Volume
Volume
Volume
Note: No fracture origin could be identified for specimen #15
3(B): Test Conditions Temperature: Atmosphere: Stress Level: Mean Level: R: Frequency:
1350°C Air ±96 MPa 118 MPa 0.1 1.25 Hz
Specimen Number
32 49 45 62 102
Cycles Completed
450,000
450,000
429 450,000
450,000
Diameter (in)
0.2502
0.2504
0.2780
0.2505
0.2499
Load (lbs)
3,367
2,810 ...
3,807
2,912
Avg.
Residual Tensile Strength (ksi)
68.5
57.1 ...
77.4
59.4
65.6
(MPa)
472 393 ...
534 409 467
Fracture Origin
?
Surface ...
?
Surface
Notes: Fracture origins for specimens 32 and 62 could not be determined. Specimen 45 failed prematurely.

349
430
428
£ 4 2 8
2.424 J5 422 •a 420 o 2 418 CO a , 418 c 3 414 o >" 412
410
408
-
Three Tests per Condition
0 200 400 • i i i . i .
600 800 1000 1200 1400
Temperature (°C)
Figure 4. Young's Modulus vs Temperature for Hexoloy SA.
Ceralloy 147-3
The flexural and tensile strength measurements of Ceralloy 147-3 have been initiated. Room temperature flexural strength measurements at 500 and 0.1 MPa/s have been made and tensile strength measurements at 20°C, 1150°C, and 1250°C have also been made. The results of these strength measurements are summarized in Figures 5 and 6, respectively.
A comparison of the flexural and tensile strengths obtained for the different ceramics evaluated in this phase of our project are presented in Figures 7 and 8.
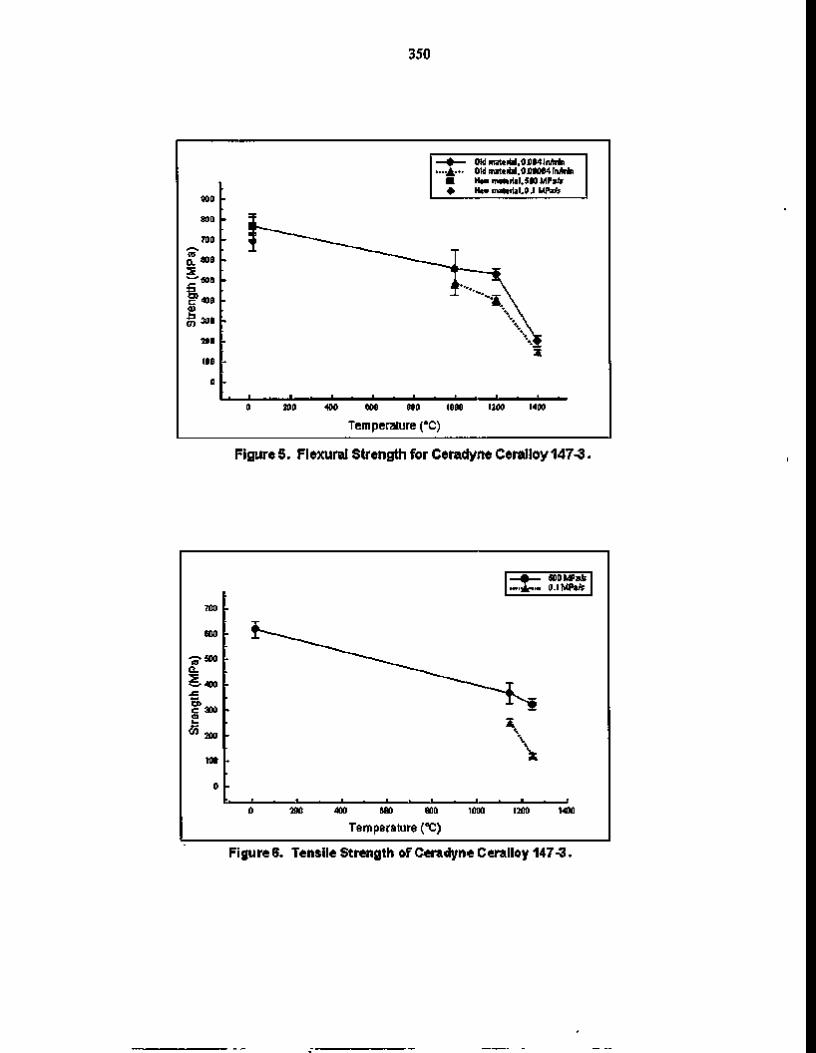
350
800
800
700
£ 600
^500 |
H 400 OJ
CO 300 h
200
100
0
♦ Old material,0£04in/min ..J^... Old material,0D0004in/min ■ Meui material. 500 MPa/s <*► Meui material, 0.1 MPa/s
_l i I i I i I_ I i I i_ 200 400 600 800 1000 1200 1400
Temperature (°C)
Figure 5. Flexural Strength for Ceradyne Ceralloy 1473.
700
600
(MP
a)
i 1
Str
en
gth
100
0
■ 0
■ 200 400 600 800
Temperature (°C)
■ 1000
— • — 500 MPa* . . J j . . . 0.1 MPa/s
3^
k
? i
1200 1400
Figure 6. Tensile Strength of Ceradyne Ceralloy 1473.

351
000
eoo
To a. S 7D0
S eoo h U3
soo
430
8^>.
..vv..:
—♦— Q —
o
AS800 GN10 New Hexoloy SA Old Hexoloy SA Ceradyne 1473 SN253
" " ■ . I ■a
200 200 400 600 800 1000 1200 1400
Temperature (°C)
Figure 7. Comparison of Flexural Strength
TOO r
CO CL SOO
£ C?430
CO
300
200
8=
—Br— Old Hexoloy SA ••■•Jf" SN253 • > ■ . . New Hexoloy SA . . + . . . ASSOO — O — GN10
O Ceradyne 1473
~q *"
A"«rto \ ■—^»nV
_i i i i
o
_i i i i_ 200 400 eoo 800 1000 1200 1400
Temperature (°C)
Figure 8 . Comparison of Tensile Strength,

352 Machining Studies
An investigation of machining effects on the mechanical behavior of Hexoloy SA SiC , and SN-252 Si3N4 was initiated. The effect of transverse grinding, grinding the tensile surface at a 15° bias, 24 hour surface heat treatment, creep feed grinding at 88.8 and 25.4 mm/min feed rates, and exposure of the machined specimens to 500 hours oxidation at 1400°C on the flexural strength of Hexoloy SA was investigated. The baseline flexural specimens were final ground in the longitudinal (parallel) direction using a 320 grit abrasive wheel following ASTM C1161. The average flexural strengths measured for the different machining treatments are presented in Table 4. From the results shown in Table 4, it would appear that neither the 15° bias grinding nor the creep feed grinding had much effect on the flexural strength compared to the baseline treatment. Specimens ground in the transverse direction had a strength reduction of -30%. The heat treated and oxidized specimens showed -10% strength improvement.
Table4. Flexural Strength of Hexoloy SA as a Function of Different Machining Methods
Machining Methods/ Treatments
Baseline grind (320 grit)* Baseline grind (320 grit)* Perpendicular grind (320 grit) Bias Grind 15° Bias Grind 15° Heat Treated Baseline Grind* Heat Treated Baseline Grind* Oxidized Baseline Grind" Oxidized Bias Grind 15°" Creep feed grind 88.9 mm/min Creep feed grind 88.9 mm/min Perpendicular creep grind 88.9 mm/min Oxidized creep feed grind 88.9 mm/minx
Creep feed grind 25.4 mm/min Creep feed grind 25.4 mm/min Perpendicular creep feed grind 25.4 mm/min Oxidized creep feed grind 25.4 mm/minx
Loading Rate (MPa/s)
100 0.1
100 100
0.1 100
0.1 100 100 100
0.1 100 100 100
0.1 100 100
Specimens Tested
13 10 16 11 10 20 9 8 8 13 10 16 8 12 10 15 8
Average Flexural
Strength (MPa) 377 372 261 387 372 418 410 405 410 369 367 269 403 371 392 268 392
Std. Deviation
(MPa) ±50 ±36 ±25 ±18 ±39 ±25 ±31 ±28 ±57 ±42 ±45 ±59 ±24 ±41 ±24 ±66 ±21
Weibull Modulus
10 13 14 27 15 17 14 20 9 12 16 6 18 11 19 5 21
5Almost all specimens failed from surface-initiated flaws. *Baseline grinding followed ASTM C1161. 'Heat treatment @ 1250°C for 24 hours. 'Oxidation exposure 500 hrs @ 1400°C.

353
Two specimens baseline ground, two ground at a 15° bias, two creep feed ground at 88.8 mm/min, and two ground at 25.4 mm/min were studied with the Raman microprobe. The Raman microprobe procedures used to measure primary peak shifts and peak broadening have been described previously. Peak broadening is attributed to an increase in microsurface strain. Peak shifting is a measure of the macrosurface strain in the tensile or compressive mode. The Raman microprobe results for the machined Hexoloy SA flexural specimens are presented in Table 5.
These interim results indicate greater compressive residual surface strain in the baseline machined specimens than for the 15° bias grind or the two creep feed ground specimens. In subsequent efforts, the Raman microprobe will be used to investigate an assintered specimen and a very highly polished Hexoloy SA specimen. It is anticipated that the spectra from these two Hexoloy SA specimens should provide a better basis for evaluating residual strain in the machined specimens.
Table 5. Raman Microprobe Results for the Change in Line Position and Line Width for the Three Primary Hexoloy SA Peaks
A. Hexoloy SA SiC 767.55 Raman Line Specimen
Baseline #1 Baseline #2 15° Bias #1 15° Bias #2 Creep Feed 88.9 mm/min Creep Feed 88.9 mm/min Creep Feed 24.5 mm/min Creep Feed 24.5 mm//min
Change in Position 767.55 ±0.03 767.44 ±0.02 767.47 ±0.02 767.34 ±0.02 767.12 ±0.01 767.19 ±0.02 767.16 ±0.02 767.14 ±0.02
Width 5.72 ±0.09 5.27 ±0.08 5.20 ±0.08 5.32 ±0.08 4.44 ±0.05 4.59 ±0.06 4.57 ±0.06 4.43 ±0.06
B. Hexoloy SA SiC 788.334 Raman Line
Specimen Baseline #1 Baseline #2 15° Bias #1 15° Bias #2 Creep Feed 88.9 mm/min Creep Feed 88.9 mm/min Creep Feed 24.5 mm/min Creep Feed 24.5 mm//min
Change in Position 788.334 ±0.004 788.367 ±0.004 788.364 ±0.004 788.260 ±0.004 788.141 ±0.002 788.144 ±0.003 788.239 ±0.003 788.086 ±0.003
Width 5.27 ±0.01 5.27 ±0.01 5.20 ±0.01 5.31 ± 0.01
4.597 ±0.008 4.78 ±0.01 4.68 ±0.01 4.64 ±0.01
I T I H W . V I I V V ^ ^ M ^ I w w r I I M V M V V i T v w r n M i v i w M I I V i »»«»*^%^w^r%^^* •%*■** t r r v ■*.*■ «■**

354
Table 5. Raman Microprobe Results for the Change in Line Position and Line Width for the Three Primary Hexoloy SA Peaks (concluded)
C. Hexoloy SA SiC 797.67 Raman Line Specimen
Baseline #1 Baseline #2 15° Bias #1 15° Bias #2 Creep Feed 88.9 mm/min Creep Feed 88.9 mm/min Creep Feed 24.5 mm/min Creep Feed 24.5 mm/min
Change in Position 797.67 ±0.01 797.68 ±0.01 797.67 ±0.01 797.61 ± 0.01
797.431 ± 0.007 797.396 ± 0.009 7973424 ±0.008 797.370 ±0.008
Width 4.74 ±0.04 4.64 ±0.04 4.54 ±0.04 4.52 ± 0.04 3.88 ± 0.02 4.07 ±0.03 4.00 ±0.03 3.91 ± 0.03
The effects of transverse grinding, grinding at a 15° bias, and creep feed grinding at 88.9 mm/min feed rate were also investigated on the flexural strength of specimens from a Kyocera SN-252 spin disc. The average flexural strength measured for the different machining methods are presented in Table 6.
Table 6. Flexural Strength Measured for SN-252 Specimens Machined by Different Methods
Machining Methods/ Treatments
Baseline grind (320 grit)*
Baseline grind (320 grit)*
Perpendicular grind (320 grit)
Bias Grind 15°
Bias Grind 15°
Creep feed grind 88.9 mm/min
Creep feed grind 88.9 mm/min
Loading Rate (MPa/s) 100
0.1 100 100
0.1 100
0.1
Specimens Tested
14 10 15 4 4 5 5
Average Flexural
Strength (MPa) 750 698 753 816 683 773 742
Standard Deviation
(MPa) ±48 ±83 ±58 ±39 ±44 ±57 ±81
Weibull Modulus
17 9 14 27 19 14 10
356
3 . 4 FRACTURE MECHANICS
TESTING AND EVALUATION OF ADVANCED CERAMICS AT HIGH TEMPERATURE
J. Sankar, A. D. Kelkar, V. Vijayrao, and S. Sudarshan (Department of Mechanical Engineering, North Carolina A & T State University, Greensboro, NC 27406).

357
Technical Highlights
During this reporting period, creep tests were performed on GS-44 silicon nitride material. The testing temperatures were 1100 °C and 1200 °C. The test was also performed for different loading conditions, namely 80mpa, 100MPa and 120MPa. Creep curves were generated from the tests for this material system (creep strain vs time for the given load). The creep curves are shown in Figure 1. Further, some tests were stopped during the secondary creep stage and were tested for tensile residual strength. All the residual strength tests were carried out at room temperature.
During this reporting period, some samples were thermaly soaked at 1200°C. The samples were soaked for the same time as the creep tests. After the completion of the thermal soaking, the samples were tested for tensile residual strength at room temperature. The above process allows us to study the effect of creep at high temperature on the residual tensile strength of the material. The soaking time was varied between 32hrs and 217hrs. Stress vs Strain plots were generated from the data obtained. The test conditions and the residual strengths at room temperature are shown in Table 1. The stress vs strain tensile reesidual strength plots of both, thermaly soaked and creep tested samples are shown in Figure 2.
Comparison Of Residual Strengths For GS-44(Si3N4) Under Different Conditions
Room Temp Strength Strength @ 1200C
Condition
1
2
3
4
Creep: 1100C, lOOMPa -217hrs
Creep : 1200C, lOOMPa - 32hrs
Thermal Soaking: 1200C -32hrs
Thermal Soaking: 1200C -108hrs
= 631MPa = 450MPa
Residual Strength @ Room Temp(MPa)
472.121
525.781
487.488
531.372

358
Microstructural Characterization
The microstructure of the tensile tested, creep tested, and thermally soaked tensile tested specimens were studied using field emission scanning electron microscopy (SEM) and optical microscopy. The sections of tested material were polished and then etched in a molten Sodium Hydroxide (NaOH) bath at 673K for 15-25 seconds. This etching procedure removes the grain boundries, so that the grains can be seen clearly in the SEM. For SEM analysis the specimens were cut and polished in a Buheler Minimet Polisher using 3,1, and 0.5 urn diamond paste. The micrograph of a polished and etched surface of a creep tested specimen at 1200 °C and 100 MPa is shown in Figure 3a . The TEM analysis of the samples are due to be performed.
RESULTS AND DISCUSSION
Creep tests were performed at different loads. Figure 1 shows the creep strain vs time at 1200 °C and 120 Mpa, 100 MPa, and 80 MPa of GS44. As can be seen from the graph one of the specimen which was tested at 1200 °C and 100 MPa broke in 5hrs. This clearly shows that the properties of GS44 varies from specimen to specimen. The fracture surface of the creep tested sample at 100 Mpa and 1200 °C is shown in Figure 3b . As can be seen from figure 3b, due to a slower strain rate the fracture surface is smooth and even. The fracture iniation site of GS44 which was tested at 1200 oC and 100 MPa can be clearly seen from Figure 3c . The GS-44 sample which was exposed to a constant load of 120 MPa at 1200 °C exhibited a much higher strain rate than the one at 10OMPa. Thermal soaking of the samples at the same temperature and time allows us to study the effect of creep on the room temperature residual strength. Based on the few tests performed, it was observed that the sample that had undergone creep (1200 °C, 32hrs, 100MPa) had a higher room temperature residual strength than the thermaly soaked sample (1200 °C, 32hrs). More tests need to be performed to verify the above.
Status of Milestones
On schedule
Communications/Visitors/Travel
None

359
Publications
Accepted for publication:
J.Sankar, A.D.Kelkar, J.Neogi. "Fatigue, Creep and Fracture Behavior of Silicon Nitride Ceramics." ASME Winter Annual Meeting, San Francisco, Nov. 1995.
Problems Encountered
1. Some difficulties were encountered in accessing the data (time vs elongation) generated by the existing creep test program. This problem was however modified to provide easy access to the data.
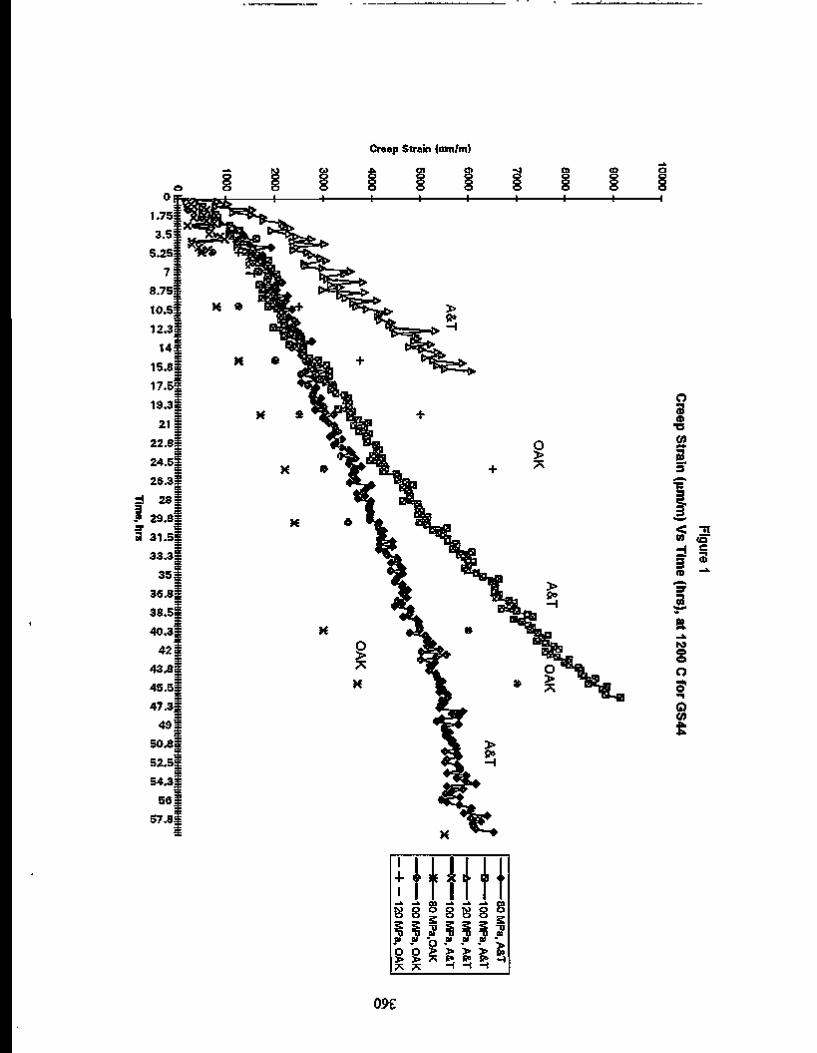
Creep Strain (um/m)
6 en o 8
en o o o
^ j o o o
oo o o o
CO o o o
o o o o
o 3 CD
•o CO
? 3
3
< n « c5*
to *•
^2.
ro o © O
O 0)
ill 1 1 _» _. c O 5
IHH o _. _. _^ c 3 Q tO O C , S O O
►
> 3
2 2 T5 2 2 2 =5 "n "0 ni "0 "0 "0 n> n> ni j. ni _n) _D)
O O > > > > Co > > 7s Co Co so H 7N 7N H 1 H
09£

600 1
Figure 2 Residual Strength ffiS-441 After Subjecting to Creep and Thermal Soakii
Tensile Strenqth @ Room Temperature
500
400 Thermaly soaked-1200C, 32hrs
CO
a. in in «
300
reep- 1200C, 32hrs as
200
oi ' «d ' J ' 4 I r4 1 qi I rJ ' ui ' ui ' oi ' r4 ' «j I J ' «J ' ui ' 4 ' oj ' ^ ' ^ ' irl ^ • - ' t c o c n i n o i n u j c n i o ' t ^ t ' i - i n t - c o c o c o i n r » » - " t < D o > t - c o i D i n T - o o o c o < D ( o c o c n c o M c n M o o ( o c > o r ^ o < o i o c o « - c n o o o o o i - t - o °. °. *~. °? "*. °. d d d N «t «fr co to r-.' o* oi >* •* to C \ ! e M C M M C O 0 0 r - « - r - » - « - r - « - » - r - e > I C M e M C > I C M
Strain (um/m)

362
* * * * * * * . » ■ » '
Figure 3 a. Micrograph (400X) of a polished and etched crosssection of a creep tested specimen at 1200 °C and 100 Mpa.
Figure 3b. Fracture surface of a creep tested specimen at 1200 °C and 100 Mpa

363
Figure 3 c. Fracture initiation site of a creep tested specimen at 1200 °C and 100 MPa
364
Standard Tensile Test Development S. M. Wiederhorn, R. F. Krause, Jr., W.E. Luecke and J.D. French (National Institute of Standards and Technology)
Objective/Scope:
This project is concerned with the development of test equipment and procedures to determine the tensile strength and creep resistance of ceramic materials at elevated temperatures. Inexpensive techniques for measuring the creep behavior and strength of structural ceramics have been developed and are being used to characterize the mechanical behavior of these materials. The ultimate goal of the project is to help develop a data base and a test methodology for the structural design of heat engines for vehicular applications.
Technical Highlights:
Small Specimen Development - As structural ceramics enter the marketplace for components in heat engines, it will be necessary to test their high-temperature mechanical properties to assure quality control and ascertain remaining lifetime. This work introduces three different flat, single-reduction tensile specimens suitable for high-temperature creep-testing of material from ceramic components. The overall lengths of these specimens are 30 mm, 50.8 mm and 76.2 mm, which we designate as SR30, SR51 and SR76, SR signifying the single-reduction, or uniform thickness, design. The two smaller specimens are improvements in design over earlier geometries used in our laboratory [1, 2, 3, 4]. The SR51 is designed for creep and static fatigue tests of experimental grades of material and larger ceramic components. The SR30 specimen is small enough to be cut from very small batches of material, or from complex ceramic components, such as turbine blades and stator vanes. The SR76 specimen is a modification of a specimen developed earlier at Norton Company [5] for creep and strength measurements of silicon nitride. We have used the SR76 for strength, static fatigue and creep behavior studies [6]. Specimen validation was carried out on a single lot of a commercial grade of silicon nitride, SN88 (NGK Insulator, Japan), that, in our experience, gives very reproducible creep results on an individual specimen type. This grade of Si3N4 also is relatively unaffected by long exposures in air at high temperatures.
Experimental Details - The three specimen geometries, illustrated in Figure 1, are compromises between the longest possible gauge length, which decreases the gauge length measurement uncertainty [7], and the shortest possible specimen length, which maximizes the number of specimens. The SR76 specimen has a 19 mm gauge length and can be used for tensile strength, static fatigue and creep measurements. Frequently, however, experimental batches of material are not large enough to accommodate the SR76 specimen. The SR51 is a compromise between a long gauge length, 12 mm versus 19 mm, and a large number of specimens. We designed a small

365
specimen, the SR30, with which to measure creep and static fatigue of materials from ceramic components and very small batches of experimental materials.
3.57D
Y
12.f ■ < —
5 2.5 *\ ""*
■•VFoJ : V "
A
12 Y
4.76D-
- > ■> ̂2
A . >o
"*-
n
J _!1
JL 8.26
15.9 2.54
-o \
50.8 19
/ 4.76D--KD
■2.54
yi9R
76.2
Ui_ SR30 SR51
dimensions are in millimeters Figure 1 The three single-reduction, flat tensile specimens.
Table I. Characteristics of the three tensile specimen geometries.
SR76
Specimen Gauge length (mm)
Gauge area (mm2)
Gauge volume (mm3)
Specimen length (mm)
Neck stress concentration
SR30
SR51
SR76
8.0
12.0
19.0
3.0
5.0
6.5
24
60
123
30
50.8
76.2
8.2
6.1
3.7 sNeck stress concentration = [(maximum stress in neck)/(stress in gauge)] -1
Two-dimensional finite element modelling (FEM) was used to optimize the designs for the SR51 and SR30 specimens, using a PC-based, commercial software package (Strand6, G+D Computing, Ultimo NSW, Australia). A database already existed on the SR76 specimen, so we made no modifications to that design. Simply scaling the SR76 specimen smaller to arrive at the SR51 and SR30 specimens made the gauge cross-
section prohibitively small from both machining and handling standpoints. We fixed gauge width of the SR51 at 2.0 mm the SR30 specimen at 1.5 mm in the 2-D FEM simulations and used the following constraints for the optimization: maximum gauge length, fixed specimen length, and minimum stress concentrations at the ends of the

366
gauge length and at the loading holes. The specimen thickness was also increased, from a square cross-section, to increase the load-bearing capacity of the heads. The gauge dimensions and stress concentration at the ends of the gauge (the "neck") are shown in Table I. The results of the FEM calculations were verified by successively refining the mesh size. A convergence test on the mesh resulted in <1 % change in the calculated stress in the neck.
Creep Tests - Two experimental conditions were chosen for the specimen comparison: 1400 °C and 150 MPa; 1300 °C and 250 MPa. Each test condition was replicated five times with each specimen geometry. Single experiments were also performed at higher stresses to test the limits of the specimen geometries. Each specimen was equilibrated in the testing furnace for 20 hours prior to the application of the load to attain thermal stability in the testing furnace. For each experiment, the minimum creep rate was determined graphically from the strain versus time data.
Table II. Creep parameters and their standard deviations generated from the five tests at each condition with each of the three tensile specimen geometries.
Condition, Specimen
1400 °C 150 MPa
SR30
SR51
SR76
1300 °C 250 MPa
SR30
SR51
SR76
Tnin
(1/s)
(7.12 ± 0.42) xlO"8
(7.85 ± 0.52) xlO"8
(7.29 ± 0.32) xlO"8
(4.15 ± 0.37) xlO'8
(3.67 ± 0.38) xlO'8
(3.47 ± 0.50) xlO"8
(ef) (%)
2.73 ± 0.36
2.59 ± 0.26
2.60 ± 0.28
1.78 ±0.15
1.68 ±0.10
1.56 ±0.23
tr (hr)
84.3 ±10.1
76.8 ±10.1
83.6 ± 8.4
89.8 ± 6.2
98.6 ±11.5
95.2 ± 6.4
ti% (hr)
29.7 ±3.2
26.1 ±1.3
28.3 ±1.9
53.5 ±2.8
59.0 ± 6.0
61.7 ±7.3
Creep tests were performed using test procedures described earlier [2, 7]. The specimen is gripped in the hot zone using a pin-and-clevis arrangement. The 3.5 mm diameter pins for the SR30 specimens were made from silicon nitride, either NCX-5102 (Saint Gobain/Norton Industrial Ceramics Corp., Northboro, MA) or SN88. The 4.7 mm diameter pins for the SR51 and SR76 specimens were Hexoloy-SA SiC (Carborundum Co., Niagara Falls, NY) for the 1400 °C tests and NCX-5102 silicon nitride for the 1300 °C tests. At 1400 °C the Si3N4 pins deformed during the test, which prevented their reuse.

367
0.035
0.030
0.025
g 0.020
w 0.015 (
0.010
0.005
0.000 0
1400C
^ £
&^
150MPa
i . 1_
.4? •■y^y1
y^0
SR30 a
0S
SR51 .
D ^ ^
SR76
20 40 60 80 100 Time, hours
Figure 2 Creep curves generated at 1400 EC, 150 MPa with the three specimens, five replicated tests with each specimen geometry.
0.025
0.020
4»
00
0.015
0.010
0.005
0.000 0
1300C 250MPa
^ ^ ^ ^ ^
A/%y ••° y(v%ry4/ J>''"
^SR303SR51^SR76 _i 1 1 — _ i _ . i
20 40 60 80 Time, hours
100 120
Figure 3 Creep curves generated at 1300 EC, 250 MPa with the three specimens, five replicated tests with each specimen geometry.

368
Results & Discussion - The results of the two test conditions are presented graphically in Figures 2 and 3. The creep curves are plotted together to illustrate the consistency of the data. Important creep parameters, minimum creep rate (£„,,„), failure strain (ef), failure time (t,), time to 1% strain (t1%), and their respective standard deviations are given in Table II. An analysis of variance (ANOVA) for a 95% confidence level using a commercially available software package (QUATTRO Pro 5.0, Borland International, Inc, Scotts Valley, CA) shows that the creep parameters do not depend on the specimen geometry, see Table III. Unreplicated tests at higher stresses, such as 300 MPa or 350 MPa, indicated that the agreement between the three specimens at the higher stresses was similar to that of the replicate tests at 250 MPa and 150 MPa.
This study and other studies in our laboratory have shown that the stress limits of these specimens at any temperature were determined by the strength or slow crack growth resistance of the loading pins, and not by the failure at the loading holes. The 250 MPa experiments on the SR30 specimens had to be done with SN88 pins, because the NCX-5102 was too susceptible to slow crack growth, which lead to failure of the pin during the creep test. We conducted successful creep tests at 350 MPa on the SR30 with SN88 pins and 400 MPa on the SR51 and SR76 with NCX-5102 pins. We conducted successful strength tests as high as 710 MPa at room temperature using the SR76 specimen with steel pins, and static fatigue tests at 525 MPa at 800 °C with MAR-M246 Superalloy pins and pullrods without failure of the loading holes. For creep and static fatigue test at higher temperatures (>800 °C) where the Superalloy pins deform, it is necessary to enlarge the loading hole and the pin diameter to 6.35 mm (1/4 inch), to decrease the stress in the loading pins, and use silicon nitride or silicon carbide pins. Because we have conducted successful strength, static fatigue and creep tests at the full range of temperatures and stresses, we have adopted the 6.35 mm diameter loading holes for all tensile testing with the SR76 specimen.
Table III. ANOVA results for the creep parameters generated from the three different specimen geometries for a 95% confidence interval.
Creep Parameter
* *
ef
tf
ti%
1400 °C,
P-valuef
0.060
0.746
0.414
0.076
150 MPa
F statistic*
3.594
0.300
0.950
3.221
1300 °C, 250 MPa
P-value
0.067
0.147
0.288
0.109
F statistic
3.411
2.263
1.382
2.687
F-critical
3.885
3.885
3.885
3.885 TP-value is the observed significance level of the F statistic. If the P-value is greater than the 0.05 set for the significance test (95% confidence), the data sets are statistically indistinguishable.
*F statistic is the ratio of the between-samples variation to the within-sample variation. If the F-statistic is less than F-critical, the data sets are statistically indistinguishable.

369
Summary - The SR30, SR51 and SR76 tensile specimens have been validated using a well-behaved grade of silicon nitride. We have shown that useful creep and creep rupture data can be generated with small tensile specimens. Such tests are useful for characterizing small batches of experimental materials or for quality control and life assessment of ceramic components.
References:
1. D.F. Carroll and S.M. Wiederhorn, "High Temperature Creep Testing of Ceramics," Int. J. High Technology Ceramics, 4, 227-241 (1988).
2. D.F. Carroll, S.M. Wiederhorn and D.E. Roberts, "Technique for Tensile Creep Testing of Ceramics," J. Am. Ceram. Soc, 72, 1610-14 (1989).
3. S.M. Wiederhorn, R.J. Gettings, D.E. Roberts, C. Ostertag and J.J. Petrovic, "Tensile Creep of Silicide Composites," Mat. Sci. Engr., A155, 209-215 (1992).
4. J.D. French, S.M. Wiederhorn and J.J. Petrovic, "Creep Rupture of MoSij/SiCp Composites," Mat. Res. Soc. Sywp. Proc, 322, 203-208 (1994).
5. J.A. Wade, CS. White and F.J. Wu, "Predicting Creep Behavior of Silicon Nitride Components Using Finite Element Techniques," pp. 360 - 373 in Life Prediction Methodologies and Data for Ceramic Materials, ASTM STP 1201, Eds. C.R. Brinkman and S.F. Duffy, ASTM, Philadelphia, 1994
6. J.D. French, R.F. Krause, W.E. Luecke and S.M. Wiederhorn, unpublished work.
7. W.E. Luecke and J.D. French, "Sources of Strain Measurement Uncertainty in Flag-Based Extensometry," J. Am. Ceram. Soc, Submitted, 1995.
Lectures Presented and Meetings Attended:
W.E. Luecke, "Creep and Cavitation of Structural Ceramics," presented at General Electric Central Research and Development Laboratory, Schenectady, NY, April 10, 1995.
Sheldon M. Wiederhorn, William E. Luecke, B.A. Fields and J.D. French, National Institute of Standards and Technology, Gaithersburg, MD 20899, "Damage Generation in Ceramics at High Temperature," Presented at the Institute for Mechanics and Materials Workshop on Rational Design and Processing of Advanced Ceramics, June 21-23, 1995, University of California San Diego, La Jolla, CA
S.M. Wiederhorn and W.E. Luecke, National Institute of Standards and Technology, Gaithersburg, MD 20899, "Dilational Creep Silicon Nitride and Silicon Carbide,"

370
presented at the 97th Annual Meeting of the American Ceramic Society, April 30-May 3, 1995.
Visits:
Solar Turbines - June 20, 1995, to discuss their ceramic turbine program. I presented a discussion of the work for the Department of Energy.
Publications:
S.M. Wiederhorn and W.E. Luecke, "The importance of cavitation to the creep of structural ceramics," to be published in the proceedings of the symposium on Plastic Deformation of Ceramics, Sponsored by the Engineering Foundation, Snowbird, Utah, August 7-12, 1994.
Sheldon M. Wiederhorn, Jonathan D. French and William E. Luecke, "High-Temperature Reliability of Structural Ceramics," pp. 145-155 in 5th International Symposium on Ceramic Materials and Components for Engines, D.S. Yan, X.R. Fu and S.X. Shi eds., World Scientific Publishing Co., Singapore (1995).
S.M. Wiederhorn, J.D. French and W.E. Luecke, "A Comparison of Fracture Mechanism Maps with the Larson-Miller Method of Predicting Lifetime," Ceram. Eng. and Sci. Proc. 16[5] 691-8 (1995).
W.E. Luecke, S.M. Wiederhorn, B.J. Hockey, R. Krause, Jr. and G.G. Long, "Cavitation Contributes Substantially to Tensile Creep in Silicon Nitride," J. Am Ceram. Soc. 78[8] 2085-96(1995).
B.A. Fields and S.M. Wiederhorn, "Creep Cavitation in a Siliconized Silicon Carbide Tested in Tension and Flexure," J. Am. Ceramic Soc, Submitted.
W.E. Luecke and J.D. French, "Sources of Strain Measurement Uncertainty in Flag-Based Extensometry," J. Am. Ceramic Soc, Submitted.
J.D. French and S.M. Wiederhorn, "Tensile Specimens from Ceramic Components," J. Am. Ceram. Soc, Submitted.
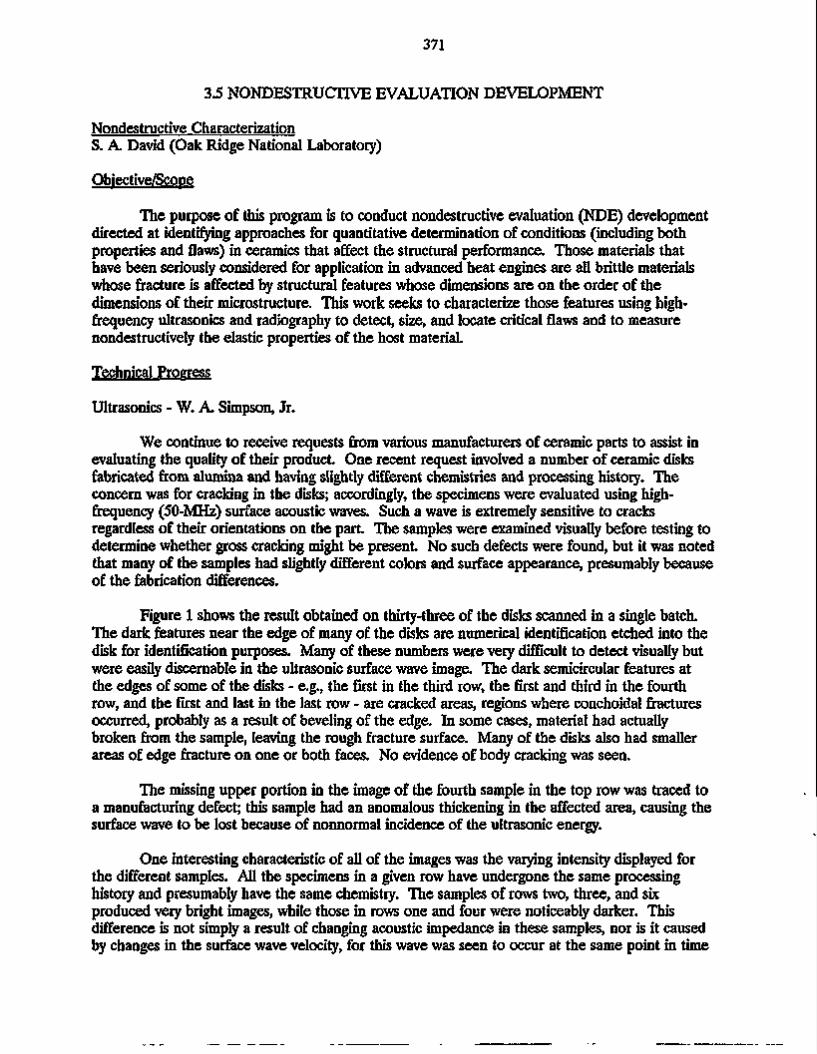
371
3.5 NONDESTRUCTIVE EVALUATION DEVELOPMENT
Nondestructive Characterization S. A. David (Oak Ridge National Laboratory)
Objective/Scope
The purpose of this program is to conduct nondestructive evaluation (NDE) development directed at identifying approaches for quantitative determination of conditions (including both properties and flaws) in ceramics that affect the structural performance. Those materials that have been seriously considered for application in advanced heat engines are all brittle materials whose fracture is affected by structural features whose dimensions are on the order of the dimensions of their microstructure. This work seeks to characterize those features using high-frequency ultrasonics and radiography to detect, size, and locate critical flaws and to measure nondestructively the elastic properties of the host material.
Technical Progress
Ultrasonics - W. A. Simpson, Jr.
We continue to receive requests from various manufacturers of ceramic parts to assist in evaluating the quality of their product. One recent request involved a number of ceramic disks fabricated from alumina and having slightly different chemistries and processing history. The concern was for cracking in the disks; accordingly, the specimens were evaluated using high-frequency (50-MHz) surface acoustic waves. Such a wave is extremely sensitive to cracks regardless of their orientations on the part. The samples were examined visually before testing to determine whether gross cracking might be present. No such defects were found, but it was noted that many of the samples had slightly different colors and surface appearance, presumably because of the fabrication differences.
Figure 1 shows the result obtained on thirty-three of the disks scanned in a single batch. The dark features near the edge of many of the disks are numerical identification etched into the disk for identification purposes. Many of these numbers were very difficult to detect visually but were easily discernable in the ultrasonic surface wave image. The dark semicircular features at the edges of some of the disks - e.g., the first in the third row, the first and third in the fourth row, and the first and last in the last row - are cracked areas, regions where conchoidal fractures occurred, probably as a result of beveling of the edge. In some cases, material had actually broken from the sample, leaving the rough fracture surface. Many of the disks also had smaller areas of edge fracture on one or both faces. No evidence of body cracking was seen.
The missing upper portion in the image of the fourth sample in the top row was traced to a manufacturing defect; this sample had an anomalous thickening in the affected area, causing the surface wave to be lost because of nonnormal incidence of the ultrasonic energy.
One interesting characteristic of all of the images was the varying intensity displayed for the different samples. All the specimens in a given row have undergone the same processing history and presumably have the same chemistry. The samples of rows two, three, and six produced very bright images, while those in rows one and four were noticeably darker. This difference is not simply a result of changing acoustic impedance in these samples, nor is it caused by changes in the surface wave velocity, for this wave was seen to occur at the same point in time

372
for all samples. The surface wave amplitude was simply smaller for these samples. This behavior is consistent for differing surface roughnesses, but no such difference could be detected visually. It may also be attributable to grain size or microvoid density, but we have no data to support this conjecture. At this point, we do not know the cause of differing sample brightness.
Figure 2 shows an enlargement of one of the samples (last on the right in the second row) and shows more detail. The dark pointlike indication, which can just be seen in figure 1, is a subsurface void. The other indications appear to be surface grinding marks, though we could not see these marks visually.
These disks appear to be of very high quality, having very few detectable voids and no discernable cracking. Other than the average image brightness produced by a given disk, which in this case cannot be correlated with detectable flaws, there were no observable differences in sample quality.
We continue to press the development of nonlinear elastic wave techniques for the characterization of damage in structural ceramics. Although extremely promising, nonlinear techniques are difficult to implement because of the high power levels involved. This makes it necessary to couple as much of the available power as possible into the transducer. At or near resonance, piezoelectric devices have complex impedances which are poorly matched to the output circuitry of the high-power exciter and therefore require matching networks for maximum transfer of power. Operation at greatly reduced power is therefore necessary to prevent damage to the exciter when the load is improperly matched. In order to construct an efficient system for excitation of elastic wave harmonic energy, considerable additional hardware had to be ordered. This equipment included, among other items, two matching networks (one for the fundamental driving transducer and another for the harmonic receiving transducer) capable of handling the full output power of the exciter.
As the nonlinear response of materials increases quadratically with driving power,1 the use of as high a power as possible is indicated. When we first received our high-power (3.6 kW) exciter, the output power had to be limited to approximately 250 watts when driving an ultrasonic transducer. However, we have measured a maximum output power of over 5000 watts when operating into a 50 ohm resistive load. This means that the second-harmonic content is more than 400 times smaller than could be obtained if the transducer were properly matched to the driving source. Nevertheless, we have observed measurable levels of second-harmonic energy in several materials, including alumina, when excited at this low level. Furthermore, the harmonic content decreased approximately in the predicted manner (quadratically) when the power was reduced to 100 watts.
In addition to the rapid increase of harmonic generation with driving power, the nonlinear response also increases quadratically with operating frequency and linearly with specimen thickness.1 In many applications the ceramic thickness will be fixed at a value of a few millimeters, which is a very thin specimen for nonlinear studies. Consequently, there is strong incentive to use as high a frequency and driving power as possible. The high-power exciter consists of a broadband amplifier and frequency-selectable plugins. The original plugin operates over the range 1-30 MHz, which is adequate but well below the maximum useable frequency for structural ceramics. Therefore, a 20- to 120-MHz plugin was also ordered. At the highest operating frequency, this unit should produce 16 times the harmonic content of the 30-MHz plugin. Also ordered was a high-power stepped attenuator. This hardware is desirable for accurate measurement of the sample response to power changes.

373
The additional hardware has now been received for high-power excitation of elastic wave harmonic energy in structural ceramics. Two high-power impedance matching networks, a high-power stepped attenuator (0-47 dB in 1-dB steps), and a 20-120-MHz exciter were obtained. The matching networks were tested using undamped (tuned) quartz transducers, which exhibit high impedance, even at resonance. The networks performed very well, properly matching the transducers to provide dramatically improved signal levels and revealing the high Q of the quartz units. We have been using damped PZT transducers - primarily because of availability - which are inherently broadband (low Q) devices having good response at half the marked center frequency, a poor attribute for a receiving transducer used in the measurement of second-harmonic generation.
During these tests, we noted that the quartz transducers tended to arc at power levels in excess of 1800 watts. This corresponds to a potential of only about 425 volts peak, well below the breakdown voltage in quartz for the specified thickness at the operating frequency. These are commercial units with integral grounding pins, however, and the source of the problem may reside in this design, or in poor routing of the contact conductors. Accordingly, we have contacted two manufacturers of special-order transducers and are negotiating a design for new units.
We are also examining different transducer materials in an attempt to determine which might be optimum for nonlinear measurements. Quartz has traditionally been the material of choice because of its very high Q, but the sensitivity of quartz is considerably below that of most modern materials. Lithium niobate also appears to be a good choice, but the mechanical strength of elements in the 5-10 MHz range and higher is rather poor. We have also obtained several PZT-5A transducer elements, but even unbacked the Q of this material is low. Best results to date have been obtained with quartz and lithium niobate, in that order.
We continue to seek new applications for the 2-GHz acoustic microscope. Several gelcast silicon nitride samples have been examined for near-surface carbide precipitates. Because these precipitates have significantly different acoustic properties than the silicon nitride matrix, they are easily detected by the surface-wave component of the microscope. Consequently, we could easily image the precipitate distribution in the samples studied. Several of the precipitate regions produced a much stronger indication than normal, and these areas were found to be associated with porosity. Comparison of the acoustic results with visual examination revealed that those precipitate regions which could be detected visually (i.e., they were surface-breaking) were very often accompanied by pores or pitting. Additional studies will be conducted using the low-frequency (100-MHz) acoustic system.
We also continue to employ the high-frequency acoustic microscope for characterization of ceramic surface and near-surface machining damage. Currently the greatest interest in this technology appears to be coming from research groups responsible for developing thin (<10 u.m) ceramic coatings. We have previously demonstrated2 the ability to detect extremely small cracks not found by either visible or electron microscopy in such coatings.
Computed Tomography (CT) - D. J. McGuire and W. A. Simpson, Jr
Last fall, in collaboration with Professor Dale Wittmer of Southern Illinois University, we made a series of CT scans of two experimental silicon nitride engine valves. The valves were in a bisque-fired pre-sintered state, and the object of the experiments was to try to determine distribution of density and porosity that might lead to causes for previously observed warping in the finished valves. The valves were carefully marked at each CT slice location for later

374
comparative scanning after final processing.
During this reporting period we received the finished valves which had warped during the firing process. We rescanned them at the previously identified locations. CT scans and X-ray density plots have been made for comparison of the pre-sintering and post-sintering material conditions. It is interesting to note that the post-sintering density increase, whose values have been obtained by forcing the CT reconstruction algorithms to a constant scale, compares favorably with the measured decrease in linear dimensions of the valves. The display programs of the CT system are capable of computing density values for either numerical or graphical output over a given region of interest, and a cross-sectional slice of one of the valves along with a displayed profile of its X-ray density is shown in Figure 3. Analysis of the CT scan information relative to observed warping of the valves and other process variables will be done by Dr. Wittmer.
Semi-annual maintenance procedures for the CT system were performed during May by a factory engineer. We addressed several minor problems and preventive maintenance, but the system continues to perform to design capabilities. Recent additions such as the Sun workstation, area detector and video printer are valuable assets and continue to perform well.
We are making a series of CT scans of ceramic engine exhaust valves submitted by A. A. Wereszczak of ORNL. The valves are being scanned in 1 mm thick slices over two identified regions of interest. After experimenting with X-ray and machine scanning parameters including some purely rotational scans, we finalized on use of translate-rotate scans with an X-ray peak voltage of 420KV and 125 detectors in a linear array with 1 mm vertical by 0.25 mm horizontal apertures. Rayspacing was at 0.1 mm with 0.015 second exposure times. The resulting images are being analyzed for density inhomogeneity, porosity, agglomeration and cracking. To date the valves have shown uniformly good quality with evidence only of some distributed 100 micrometer porosity. In a few images we noted some serial porosity that might possibly be a precursor to inservice cracking. Figure 4 shows a CT image of a cross-section of a ceramic engine exhaust valve.
We have now made several hundred 1mm wide cross-sectional scans in the exhaust valves and have found very few flaw indications other than some distributed porosity. In the shaft area of one of the valves we did image a crack-like indication about 0.5 mm long. This indication can be seen near the center of the cross-section shown in figure 5. Note also several large pore-like indications in this image.
References
1. W. A. Simpson, Jr., "Nondestructive Evaluation Development," Ceramic Technology Project Bimonthly Progress Report, June-July, 1993, p. 69.
2. W. A. Simpson, Jr., "Nondestructive Evaluation Development," Ceramic Technology Project Bimonthly Progress Report, February-March, 1995, p. 73.
Milestones
On schedule.

375
Publications
P. J. Blau and W. A. Simpson, Jr., "Applications of Scanning Acoustic Microscopy in Analyzing Wear and Single-Point Abrasion Damage," to be published in Wear.
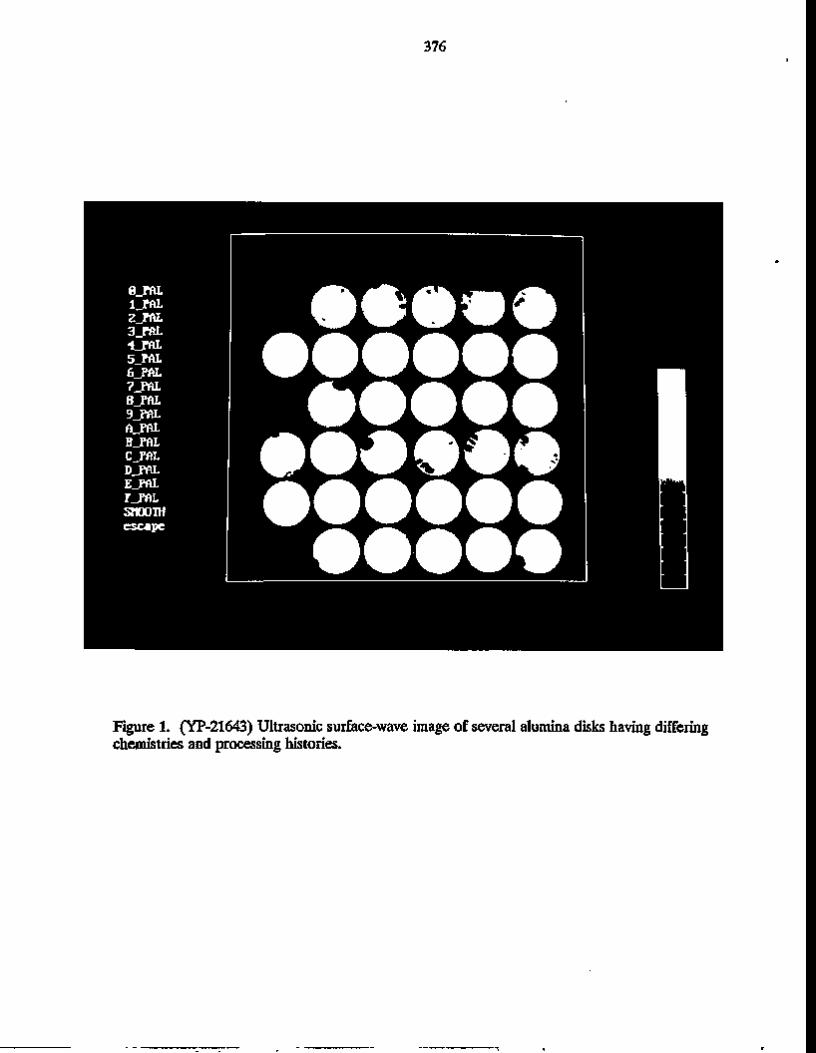
376
Figure 1. (YP-21643) Ultrasonic surface-wave image of several alumina disks having differing chemistries and processing histories.
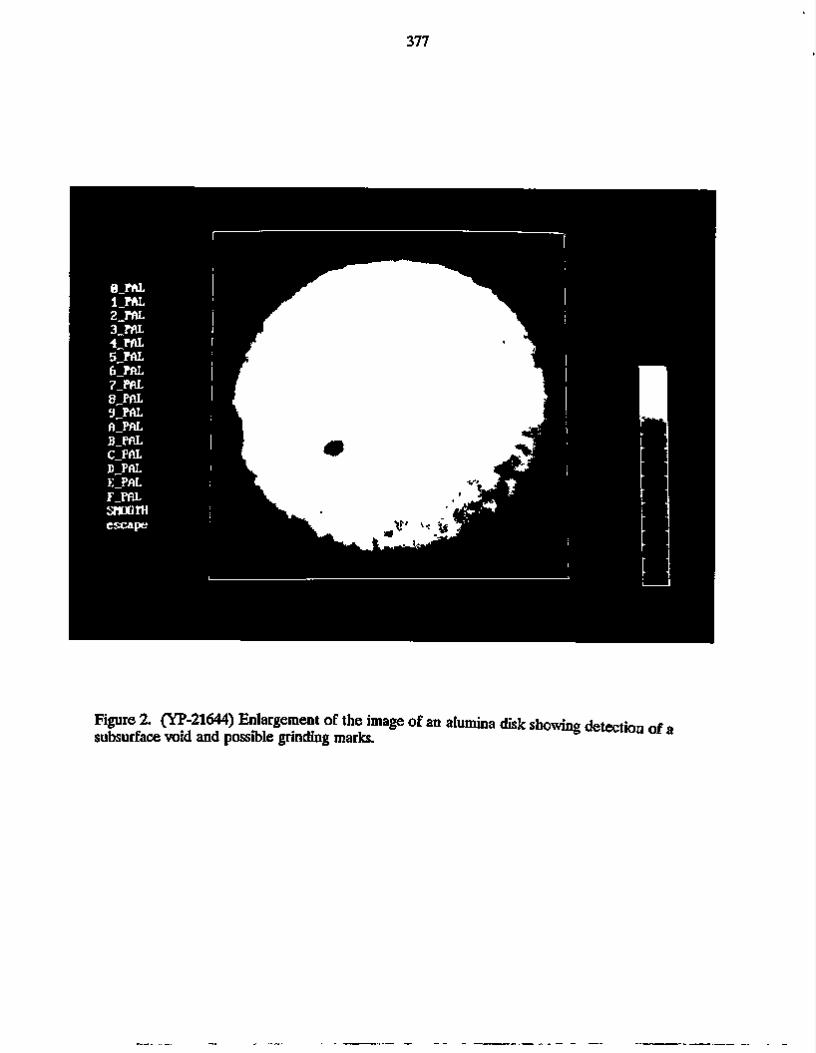
377
Figure 2. (YP-21644) Enlargement of the image of an alumina disk showing detection of • subsurface void and possible grinding marks.

378
Figure 3. CT cross-section of the shaft of a silicon nitride engine valve. Series of dots at the top of the figure shows a computed X-ray density profile of the material.

- J
Figure 4. A CT image of a cross-section of a ceramic exhaust valve.

00 o
Figure 5. A CT image of a cross-section of the shaft of a ceramic exhaust valve. Note the dark crack-like indication near the center.

381 NDE STANDARDS FOR ADVANCED CERAMICS
R. W. McClung (Oak Ridge National Laboratory)
The development of standards is important for the establishment of reliability and acceptance of advanced structural materials. Committee C-28 on Advanced Ceramics is organized in the American Society for Testing and Materials (ASTM) to address this issue. One of the activities of the C-28 committee is nondestructive examination (NDE). The Section on NDE (SNDE) is reviewing existing standards on NDE (primarily developed for metals) to determine potential applicability for ceramics as well as preparing original standards. Use of existing or modified standards is more efficient than generation of new documents and will assure the input of a large body of NDE expertise. Close liaison is established with ASTM Committee E-7 on Nondestructive Testing and documents are in various stages of review, recommendations for modification, and balloting. R. W. McClung is a member of both committees and the official liaison.
Liaison and technical support have been continued between ASTM Committees C-28 and E-7. To date, thirty-six E-7 NDE standards have been reviewed in detail with recommendations made to E-7 for modifications to identified documents. Successful action is complete on thirty-one documents; the others require action by C-28.
A draft standard on "Ceramics Reference Specimens Containing Seeded Inclusions," was revised to accommodate comments received during a concurrent ballot of subcommittee and committee levels and was approved for another concurrent ballot. A draft standard for making precise measurements of ultrasonic velocity in advanced ceramics (one application is determination of porosity in ceramics) has been significantly revised in response to comments received from concurrent subcommittee and committee ballots. The revised draft standard has been balloted at the C28.02 subcommittee level with a concurrent advisory ballot in Subcommittee E-7.06 on Ultrasonic Examination Methods. A new revision has been prepared to accommodate comments received and it was approved at the June 1995 meeting for concurrent subcommittee/committee ballot. C-1175, the standard guide for existing NDE standards, was revised to enter five additional E-7 standards and successfully balloted at subcommittee/committee levels. It is now ready for Society ballot. A new draft standard on measurement of ultrasonic attenuation in advanced ceramics was balloted at the subcommittee level. A revision has been prepared to accommodate comments received and it was approved at the June meeting for concurrent subcommittee/committee ballot. McClung served on an E-7 Task Group (TG) to revise E-1324, Standard Guide for Measuring Some Electronic Characteristics of Ultrasonic Examination Instruments, to accommodate higher frequencies (e.g., to 100 MHz) needed for advanced ceramics. The technical changes were successfully balloted through E-7 and a Society ballot will complete the approval. Further action is planned on requesting data for "radiographic equivalence factors" from members of the section and other potential sources of data. Other work in progress includes an amplified outline for a draft standard for reference specimens containing laser-drilled holes and a possible standard on determination of porosity in ceramics using ultrasonic velocity. The latter standard will be delayed until the standard on ultrasonic velocity is completed. Preparation of a list of facilities and expertise for NDE of advanced ceramics at government laboratories is planned.

382 During meetings of Committee E-7, also in June, participation by McClung as C-28 liaison included meetings of the subcommittees on radiology and ultrasonics. Significant activity is ongoing in both subcommittees that will result in standards of interest and value for advanced ceramics. Among the work items in the subcommittee on radiology are draft standards on image quality indicators, image-quality response of film at low X-ray energy, index of performance of film, determining contrast sensitivity in radioscopy, and performance of computed tomography systems (several standards).
The E-7 subcommittee on ultrasonics has several action items on standards on both contact and immersion methods of examination, as well as methods for evaluation of ultrasonic search units and instrumentation (including the item noted earlier on standard E-1324. Several E-7 standards on computed tomography and ultrasonics with potential application to ceramics were reviewed and comments prepared as part of the E-7 ballot process.

383
X-Ray Computed Tomographic Imaging W. A. Ellingson, E. R. Koehl, E. A. Sivers, J. B. Stuckey (Argonne National Laboratory), J. P. Pollinger, and H. C. Yeh (AlliedSignal Inc.)
Objec t ive /Scope
The original objectives of the Phase III work of this project were to: (1) study the utilizization of high-spatical-resolution 3-D X-ray micro computed tomography techniques to study density distributions in composite green-state (as cast) pressure slip-cast ATTAP rotors; and (2) correlate destructive density analysis (to be conducted by Allied-Signal Ceramic Components) of the as-cast ATTAP rotors with the 3-D microtomography density data. Because the large ATTAP rotors are no longer of technical interest, a change is being made to refocus the work to the AS-800 Si3Ny Series 85 nozzles being produced by Allied-Signal Ceramic Components.
Technical Highlights
ATTAP Rotor Density Studies
The original objective of this project was to explore 3D Xray CT as a nondestructive method to map density variations within pressure slip-cast ATTAP rotors to assist Allied Signal Ceramic Components (ASCC) in maintaining quality control. We have been trying to push the limits of microfocus X-ray CT to examine these rotors and we have experienced several difficulties. However, the large ATTAP rotors are no longer of technical interest and we started, this period, to change this work to focus on AS-800 Si3Ny "Series 85" nozzles being developed by ASCC. We will report here on the last of our ATTAP efforts.
The first of two specially made ATTAP rotors has been analyzed, via multi-scan X-ray CT. The most recent X-ray CT data of the first ATTAP rotor have been taken in the L/5 and 2L/5 planes as shown in Fig. 1. The 3D X-ray CT system used to obtain these data still consists of a microfocus X-ray source (155 kVp) with an image intensifier (II) coupled to a 14 bit CCD camera as the detector. Because of the pronounced taper of the body and blades of the rotor, the L/5 plane was imaged with a slice width of 0.02 cm and the 2L/5 plane was imaged with a slice-width of 0.01 cm. Figure 2 shows the 2-dimensional (2D) in-plane image data of the L/5 plane and Fig. 3 shows the 2D in-plane image data of the 2175 plane. In both images, the pixel width is 0.025 cm.
384
ATTAP ROTOR DIAGRAM
5 Z . 8 M M
6 6 . D M M
Figure I. Diagram of the ATTAP Rotor illustrating the location of the L/5 and 2L/5 planes.
April - September, 1995

385
Figure 2. A 3-D X-ray CT reconstruction of the L/5 slice of the first ATTAP rotor.
April - September, 1995

■%
386
3 ¥
* b .
12
w-11
10 8
3>
Figure 3 A 3D X-ray CT reconstruction of the 2L/5 slice of the first ATTAP rotor.
April - September, 1995

387
Qualitatively, these images are very informative. They are of sufficient quality to perform dimensional analysis and allow visualization detection of any voids or inclusions of a size on the order of the pixel width , i.e. 250 um. In contrast to earlier images made with thicker slice widths, the edges of the body and blades of the rotor are sharp and there are no "windmill" artifacts around the blades. These image data also permit a general determination of the density of the rotor. Line plots in Fig. 4 and Fig. 5 show superimposed, radial line profiles from both L/5 and 2L/5 slices through blades 1 and 7 and through the body of the rotor between blades 1 and 23. Experimental evidence thus far leads us to expect that both of these profiles should resemble "top-hat" functions. The fact that they do not resemble this function suggests that there is residual error in the data. The effect of this error can be assessed by noting that the CT data have been normalized to a monochromatic energy of 78 KeV so that density is determined by dividing the reconstructed CT number (in units of 1/cm) by the mass attenuation coefficient of Si3N4 at 78 KeV (0.186 cm2/g). Simple calculation shows that the density of the rotor varies between 3.4 g/cm3 and 2 g/cm3. This determination is adequate to obtain a general estimate of the rotor density, but may not be good enough to differentiate density variations on the order of 5%.
0.80
0.60 -
0.40
0.20
0.00
SOLID LINE -LINE PROFILE THROUGH BLADES 1 & 7 1L/5 SLICE
STARRED LINE - LINE PROFILE THROUGH BLADES 1 & 7. 2L /5 SLICE
r\ 111111111 t i r i ' i 11111111111111111 rj 111111 100 200 300 400
ABSCISSA IN PIXELS r i I I 111 600
Figure 4 Superimposed line profiles through blades 1 and 7 from reconstucted images of the L/5 and 2L/5 slices of the ATTAP rotor.
April - September, 1995

388
0.80 -i
0.60
0.40 -
0.20 -
0.00
SOLID LINE -LINE PROFILE BETWEEM BLADES 1 & 12, 1L/5 SLICE
STARRED LINE - LINE PROFILE BETWEEN BLADES 1 & 12, 2L /5 SLICE
i Yi i "i'i"i i i i t i i I I | I 1 I 1 I 1 I 1 I | I 1 I ITi i I I | i 1 I 1 I I I I I VXd^fl 1 I I I | 100 200 300 400 5 0 0 ^ 600
ABSCISSA IN PIXELS Figure 5 Superimposed line profiles between blades 1 and 12 from reconstructed
images of the L/5 and 2L/5 slices of the ATTAP rotor.
The conclusion we have reached is that the beam attenuation of the large ATTAP rotor exceeds the design parameters of the present Argonne 3D CT system. That does not mean that the microfocus/ll/CCD system cannot be used to obtain accurate density determinations of less attenuating objects or that the ATTAP rotor cannot be imaged using 3D X-ray CT.
Difficulties in this case are due to a combination of the poor(low) penetration of the highest-energy X-rays available (155KeV) and the scatter/veiling glare offset in the II detector. The longest path length through both blades and body in the slices in this
case is about 10.3 cm. Thus, the attenuation of the mean X-ray intensity through the longest path is about exp (0.186*3.4*10.3) = 0.0015. Figure 6 illustrates the degree to which X-ray scatter and veiling glare corrupt the X-ray attenuation readings of one row of one exposure through the center section of the rotor. The solid line in Fig. 6 is the raw projection recorded by the detector. The dashed line is the raw projection when
April - September, 1995

389
thick lead strips are interposed between the X-ray source and the rotor during a duplicate scan. The solid curve connecting the square dips in the "lead" scan is a low-order polynomial fit used to estimate the combination of the X-ray scatter that enters the detector plus the light scattered in the exit phosphor of the II (veiling glare). A scaled version of this fit is subtracted from the raw projection to produce the corrected, raw data, which is shown as the bold curve. Comparison of the bold curve and the raw curve shows that, for the lowest reading, the scatter plus veiling glare contribution to the signal is more than 10 times higher than the signal itself.
10000.00 -
8000.00
6000.00 z_
4000.00
2000.00
O-00 l""""JAo 400"""606 800 ilk) ABSCISSA IN PIXELS
Figure 6 Superimposed row plots from identical raw exposures of the center section of the rotor with and without lead The polynominal
fit to the lead dips and the corrected data are also shown
The use of duplicate "lead" scans to remove scatter/veiling glare in an II detector is very successful when the offset is only a few percent of the true signal. However, when the offset is more than 10 times the value of the signal, the correction can be approximate only. A very small change in the offset subtracted can cause a large change in the reconstructed density. Figures 7 and 8 show the effect on the L/5 slice when the magnitude of the offset subtracted from the raw data is reduced by 5%. In both radial line profiles, the reconstructed linear attenuation in the center of the rotor is correspondingly reduced by about 17%.
ROW 3. VIEW 1 R5CI. R5CPBI. R5CPBS, R5CN
April - September, 1995

390
300.00
200.00
100.00 -
DASHED LINE - LINE PROFILE THROUGH BLADES 1 AND 7. 1 L/5 SLICE 95SS EST S A G SUBTRACTED FROM CENTER SCAN
STARRED LINE - LINE PROFILE THROUGH BLADES 1 AND 7, 1L/5 SLICE 100s EST S/VG SUBTRACTED FROM CENTER SCAN
0.00 I I I i I I I I I I 1 I I I I I 1 I I I | I M I I I I I I 1 I I I I I I I I I | M I i N I I i 1 M H I I i i I | 0 100 200 300 400 500 600
Figure 7 Superimposed line profiles through blades 1 arid 7 from reconstructed images of the L/5 slice of the ATTAP rotor. Dashed line is profile with 95% of scatter/veiling
glare fit subtracted Bold line is profile with 100% of scatter/veiling glare fit subtracted. 300.00
200.00 -
100.00 -
DASHED LINE - LINE PROFILE BETWEEN BLADES 1 AND 12. 1L/5 SLICE 95* EST S/VG SUBTRACTED FROM CENTER SCAN
STARRED LINE - UNE PROFILE BETWEEN BLADES 1 AND 12. 1L/5 SUCE 100S5 EST S/VG SUBTRACTED FROM CENTER SCAN
K*v
U.vJU ~PTTTTI 1111111111 i i rcmTrrrri 'Ci i i i i i n i 1111111111111111111 \ \ 0 100 200 300 400 500 600
ABSCISSA IN PIXELS
Figure 8 Superimposed line profiles between blades 1 and 12 from reconstructed images of the L/5 slice of the ATTAP rotor. Dashed line is profile with 95% of scatter/veiling
glare fit subtracted Bold line is profile with 100% of scatter/veiling glare fit subtracted
April - September, 1995

391
Additional problems are caused by a characteristic of the Csl crystal in the II known as "afterglow", which is a kind of hysteresis. Not all excited states in Csl decay and emit light "immediately" after absorbing X-rays. For instance, "ghosts" of the lead strips can still be seen in exposures of the II taken more than an hour after they have been removed. Thus, regions of the II exposed to high flux in a previous scan will produce a higher signal than regions obscured by the rotor in that previous scan. Figures 9 and 10 illustrate the anomalies that afterglow can introduce into "lead" scan readings. Since each curve is recorded in the duration of a few microseconds, the intensity of the X-ray source is effectively constant during acquisition. The solid curve in Fig. 9 is the raw data from the right-of-center scan of the 2L/5 section of the rotor. The dashed line is the corresponding lead scan taken somewhat later. Regions of the plot that are not blocked by lead should receive the same flux, possibly scaled by a constant.
12000.00 -i
8000.00 -
4000.00
0.00
ROW 3. VIEW 1 R5RI. R5RPBI. R5RPBS, & R5RN
1000
Figure 9 Superimposed row plots from identical raw exposures of the right-of-center section of the rotor with and without lead The polynomial fit to the lead dips and
the correct data are also shown
April - September, 1995

392
However, the less attenuating region of the lead scan between the first and second lead pieces is higher than the corresponding region in the unblocked scan, but the highly attenuating region between the third and fourth pieces is lower than its corresponding region. This discrepancy is not the result of a change in the spatial distribution of the x-ray intensity profile between scans because examination of the left-left-of-center scan shown in Figure 10 shows the same effect spatially reversed. Thus, "lead" scan correction profiles will not be exact and the "wagon-wheel" streaks in the images of Figs. 2 and 3 are almost certainly due to residual offset.
16000.00 -I
12000.00 -
8000.00
4000.00
ROW 8. VIEW 1 R5LLH R5LLPBH WHY IS LL HIGHER THAN LLPB AT LEFT & LOWER AT RIGHT?
" W
0.00 I m m i i i i n I I i i n i l 1111 m u i m i i i i m u i i MM m m n " M 200 400 600 800 1000 1200
ABSCISSA IN PIXELS
Fig. 10 Superimposed row plots from identical raw exposures of the left-of-center section of the rotor with and without lead. The polynomial fit to the lead dips
and corrected data are also shown.
It thus has been concluded that we will not be able to further improve the images of these ATTAP rotors with data taken on the Argonne 3D X-ray CT system because of signal-to-noise limitations. However, it is still highly likely that accurate densitometry can be performed on the ATTAP rotors using 3D X-ray CT. For such rotors, if of interest in the future.it is recommended that both a higher-energy X-ray source (e.g., a new 225 or 320 KVp system) and a different X-ray detector be used (e.g., new fiber optic scintillator). A higher-energy source will permit better penetration of the rotor so that higher signal is available. In addition however, a more attenuating detector that does not suffer from afterglow and veiling glare is needed to obtain "clean" readings. Data will still be corrupted by X-ray scatter and "beam hardening" due to the polychromatic energy spectrum of the X-ray source, but duplicate lead scans can be used to estimate X- ray scatter alone fairly accurately and the one-material polychromaticity can be used to remove beam hardening.
April - September, 1995

393
Because of these limitation, we again decided, this period, to study potential use of new "spiral scan" medical X-ray CT systems for the large ATTAP rotors. A Siemens Somatom was used at Mallinckrodt Institute of Radiology in St. Louis, Missouri. Both ATTAP rotors were shipped. Rotor 0170 with a drilled hole in the upstream shaft, and rotor 0482 with no upstream drilled hole in the shaft.
Figures 11 and 12 show respectively the topogram of rotor 0170 and the topogram with locators of the CT scans.
Figure 11. Topogram (digitalprojection radiograph) of rotor 0170. Data taken on Siemens medical CT scanner
Figures 13,14 and 15 show, respectively, the CT scans obtained at locations 3,4 and 5. The wagon wheel artifacts are present in locations 3 and 4 just as in the microfocus CT scans. An internal low-density" flaw" is detected at the eleven o'clock position of the CT data from locations 4 and 5. We will compare the data from the two scanners and report on the observations in future reports.
. .a /7
Figure 12. Topogram of rotor 0170 showing location of CT scans.
April - September, 1995

394
0170 Rotor Slice 3
Figure 13. lmm thick CT cross section of rotor 0170 taken at location 3. CT image obtained on medical scanner
April - September, 1995
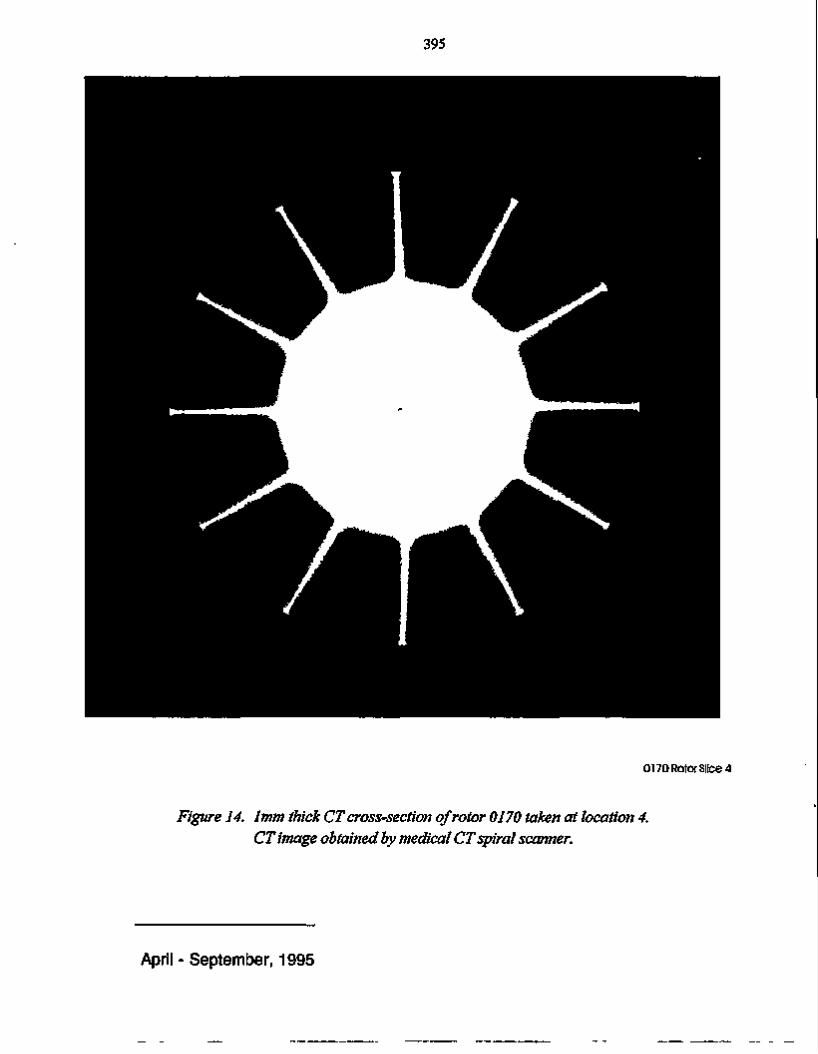
395
0170 Rotor Slice 4
Figure 14. lmm thick CT cross-section of rotor 0170 taken at location 4. CT image obtained by medical CT spiral scanner.
April - September, 1995

396
0170 Rotor Slice 5
Figure 15. lmm thick CT cross-section of rotor 0170 taken at location 5. CT image obtained by medical CT spiral scanner.
April - September, 1995

397
As noted earlier, in discussions with Allied-Signal Ceramic Components, the ATTAP rotors being currently studied are no longer of industrial interest and we have made initial steps to change to a smaller turbine component which is of interest. This is discussed below.
A so-called "Series 85" nozzle is being developed by ASCC. This is shown in Figures 16 and 17 below. &*
Figure 16. Photograph of "Series 85" nozzle planned for use in future X-ray CT densitometry work.
Figure 17. Photograph of "Series 85" nozzle planned for use in future X-ray CT densitometry work.
April - September, 1995

398
The ceramic processing methods are still under development and the ability to map density variation by each process is planned to be established by X-ray CT. We will discuss this in more detail in subsequent reports. A new work statement is being prepared by ASCC and Argonne jointly.
April - September, 1995

399
MILESTONE SCHEDULE 3.5.1.5
DATE DUE
351510 Obtain region-of-interest image of 12/15/92 large Si3N4 rotors as-cast
351511 Complete fabrication of 2/28/94 calibration wedges
351512 Complete 3-D X-ray CT images of 5/30/94 calibration wedges
351513 Complete fabrication of first rotor 3/31/94
351514 Complete 3-D X-ray CT study of 12/30/94 first rotor with destructive analysis
351515 Complete fabrication of second 10/31/94 rotor
351516 Complete 3-D X-ray CT study of 4/30/96 second rotor with destructive analysis
351517 Submit report on correlation 6/30/96 between X-ray CT data and destructive analysis
351518 Complete fabrication of initial gel- 5/30/96 cast cylindrical specimens
351519 Complete initial nondestructive 8/34/96 analysis of first gel-cast components
STATUS
Completed
Completed
Completed
Completed
Revised date
Completed
Revised date
Revised date
New
New
Task Identification: WBS 3.5.1.61
April - September, 1995
400 Nuclear Magnetic Resonance Imaging S. L. Dieckman, S. Ahuja, 0. 0. Omatete*, A. C. Raptis, and W. A. Ellingson (Argonne National Laboratory; "'Metals and Ceramics Division, Oak Ridge National Laboratory)
Objective/Scope
The purpose of this work is to evaluate the potential of NMR imaging to impact the development and process control of near-net-shape gel-cast ceramic composites. The specific objectives of this work are to determine the utility of NMR imaging for: (1) 3D mapping of polymerization homogeneity; (2) real-time imaging of the polymerization process; (3) nondestructive evaluation of voids and flaws in the resultant components; and (4) measurement of physical properties such as degree of polymerization, viscosity, and specimen strength via correlation of these properties with measurable NMR parameters (T-j, T-| r, and T2). This work will be performed in conjunction with Dr. Ogbemi O. Omatete from the Materials and Ceramics Division at Oak Ridge National Laboratory.
Technical Highlights
In previous reporting periods experimental NMR studies have been conducted on the methacrylamide-N,N'-methylene bisacrylamide (MAM-MBAM) copolymer system. These studies have included both spectroscopic and imaging experiments. The results have shown that NMR relaxation times are directly indicative of polymerization extent, and can therefore be used as an imaging modality showing polymerization rate and homogeneity. Experiments to date were performed on the spectrometer system in chemistry. This system however had distinct geometric and experimental operating constraints that has limited the utility of this system for applications to small specimens.
During this and several recent reporting periods, the Energy Technology Division at ANL has installed a commercial NMR spectrometer and imaging system, see Figure 1. This system is capable of imaging large ceramic gelcast specimens with high resolution and speed. During this period several custom circuits have been designed to permit the operation of this system with ANL's custom amplifier and probe accessories. This system is thus nearly complete and should be performing imaging in the up coming reporting period. Experimental studies to be performed with Dr. Omatete are planned for the November/December time-frame.

401
Fig. 1: NMR Imaging and spectroscopy system facilities recently installed at ANL.
April - September, 1995


403
4.0 TECHNOLOGY TRANSFER 4.1 TECHNOLOGY TRANSFER
4.1.1 Technology Transfer
Technology Transfer D. R. Johnson (Oak Ridge National Laboratory)
Technology transfer in the Propulsion System Materials Program is accomplished by a number of mechanisms including the following:
Trade Shows - A portable display describing the program has been built and has been used at numerous national and international trade shows and technical meetings.
Newsletter - A Ceramic Technology Newsletter is published regularly and sent to a large distribution.
Reports - Semiannual technical reports, which include contributions by all participants in the program, are published and sent to a large distribution. Informal bimonthly management and technical reports are distributed to the participants in the program. Open-literature reports are required of all research and development participants.
Direct Assistance - Direct assistance is provided to subcontractors in the program via access to unique characterization and testing facilities at the Oak Ridge National Laboratory.
Workshops - Topical workshops are held on subjects of vital concern to the ceramics community.
International Cooperation - This program is actively involved in and supportive of the cooperative work being done by researchers in West Germany, Sweden, the United States, Japan, and, most recently, Belgium under an agreement with the International Energy Agency. This effort is ultimately aimed at development of international standards and includes physical, morphological, and micro-structural characterization of ceramic powders and dense ceramic bodies, and mechanical characterization of dense ceramics.

404
Semi-Annual - April 1, 1995-September 30,1995
IEA ANNEX II Management M. K. Ferber and K. Breder (Oak Ridge National Laboratory)
Objective/scope
The purpose of this task is to organize, assist, and facilitate international research cooperation on the characterization of advanced structural ceramic materials. A major objective of this research is the evolution of measurement standards. This task, which is managed in the United States by ORNL, now includes a formal IEA Annex agreement identified as Annex II between the United States, Germany, Sweden, Japan, and Belgium. Annex II has been extended until June 30, 1997. The original annex included four subtasks: (1) information exchange, (2) ceramic powder characterization, (3) ceramic chemical and physical characterization, and (4) ceramic mechanical property measurements. In the United States, a total of 13 industrial and government laboratories have participated and contributed their resources to this research. The research in Subtasks 2, 3, and 4 is now complete. In 1990, research in two new subtasks was initiated. These included, Subtask 5, Tensile and Flexural Properties of Ceramics, and Subtask 6, Advanced Ceramic Powder Characterization and were completed in 1993. Two new tasks, Subtask 7, on Ceramic Machining and, Subtask 8, on Ceramic Powder Characterization were proposed in late FY 1993, and the research is ongoing. Subtask 7 in the United States includes ten companies and two federal laboratories. Subtask 8 includes six companies.
Recent Developments
A Subtask 7 Working Group Meeting with the International Participants was held at Alfred University, Alfred, New York, on July 9, 1995, in conjunction with the "Fractography of Glasses and Ceramics III," conference. The minutes have been compiled and sent to the participants. A summary of the major points which were discussed and decided upon is given below. A representative from each of the participating countries made two presentations. The first discussion session was on the fractography round robin exercise; this was followed by a report from each country on the status of their machining work. Future research was also discussed.
1. Fractography Round Robin Discussions
Dr. Mizuno presented the status of the fractography work in Japan. He remarked that this was a challenging project and he hoped that the results could be unified. There were two phases of the work in Japan: (1) the work at JFCC on fractography on material from Japan, Sweden, and the United States; and (2) six Japanese laboratories evaluating the fractography pictures generated at the JFCC. The Japanese work clearly demonstrated that the locations of the fracture origins were easy to identify, while the exact nature of the flaw was more difficult. Large discrepancies between the countries were seen at that point. Better agreement was seen in the work performed and then shown in the domestic

405
Japanese pictures. However, it was clear that the person looking at pictures, rather than a specimen, is biased by the opinion of the person who took the picture.
Dr. Carlsson presented a summary of the fractography work in Sweden. He noted that only Sweden and Germany used EDX while evaluating the fracture origins. There was some confusion on how different researchers identify the flaw.
Dr. Hollstein stated that the German work was in agreement with Dr. Carlsson's findings.
Dr. Erauw said that the Belgian work was in good agreement with Carlsson's comments. He also remarked on the problems related to identifying the flaw size especially for machining damage.
Dr. Breder briefly summarized the U.S. results from the fractography round robin by saying that the findings in the United States are the same as already presented. Flaw location and fracture mirror are well identified, flaw types of volume origin such as porous regions were well agreed upon, while the surface-located machining flaws were difficult to identify and measure.
In summarizing this portion of the meeting, several points were agreed upon: On the issue of looking at need for fractography, there was discussion of looking at mirrors as alternative and the need to tilt specimens for best examination. Dr. Hollstein remarked that in some materials the failure origins were hard to determine, and too much time could be spent to no use. This differs from material to material and would also differ with the intent of the research. Dr. Breder discussed the importance of knowing the origin of failure. Is it due to machining, or some other factor? How detailed should we be in fractography work? The purpose of the fractography is to explain the differences seen in samples due to machining.
Dr. Breder agreed to take individual fractography reports from each country and to compile them into one comprehensive report.
2. Status Of Machining Work
Each speaker gave an account of the time schedule for the machining work in their country, which is given here with comments from the general discussion which followed their presentations.
Japan: Has sent to all participants the conditions for grinding; should finish grinding by end of August 1995.
Sweden: Will not be able to start until beginning of August 1995.
Germany: Can start with machining when they get specimens from Belgium.

406
Belgium: Billets will be sent out by August 15,1995. They are now doing correlation of work; but would like to do more and analyze results before sending procedures. Belgium should be able to send procedures in mid-August 1995. Dr. Erauw indicated that he had compared the instructions received so far from other countries on the machining procedures and found several omissions.
United Dr. Breder's presented the status of the U.S. work. They are about half way States: through the U.S. participant work of grinding specimens; and should finish by
end of August. All specimens have been distributed.
In the discussion on the machining procedures, several of the participants indicated that clarification is needed in these instructions. It was then agreed that Drs. Ferber and Breder will distribute to each participant a table comparing all machining instructions for comment.
Dr. Ferber suggested that maybe the five highest and five lowest strength specimens should be looked at more closely. After some discussion in which it was brought out that the lower end was of more importance, the group agreed to perform SEM on ten specimens, taking seven from the lower end of the Weibull distribution and three from the higher end as a minimum requirement. It was also agreed that if the flaw can be identified, try to measure it.
Dr. Ferber suggested that after breaking the specimens, each country would return them to the originating country for fractography. This was well received and agreed to after some discussion on how to avoid contamination of specimens during transit. Dr. Ferber agreed to supply packaging instructions which would minimize the contamination problem.
Although the ideal schedule for finishing the machining work would be by the time of the Executive Committee Meeting in October, problems with obtaining grinding wheels may prohibit this. The group did agree that all machining will be done by the end of December 1995, and all specimens returned to the originating country for fractography.
Each country will do their own report on machining.
3. Future Research
Plans for future work, identified as Subtask 9, were discussed. Sweden proposed to perform oxidation studies. Germany and Japan each presented proposals with a strong endorsement for thermal shock research. Japan included their current standard practice for oxidation testing which they felt was sufficiently detailed to address their needs in this area. Belgium and the United States agree with the need for the thermal shock research. The Fractography Reports from Belgium, Germany, and Sweden were sent to the International Participants and the U.S. participants (July 28, 1995) as part of the information exchange.
407
Technical Highlights
Subtask 7, Machining Effects on Strength of Structural Ceramics
United States
The replication run of 150 specimens was fractured in a randomized set. About half of this set was strain gaged. The results have been analyzed in terms of Weibull statistics, and statistical analysis of the experimental design has been performed. The replication run gave indications as to the reproducibility of the machining conditions as well as to the reproducibility of the grinding forces. The factor analysis showed that the grit size is the single strongest factor influencing the strength. Within each grit size the wheel speed had some effect on strength, i.e., higher surface wheel speed resulted in higher strengths. Expressing the experimental conditions in terms of grit depth of cut it was seen that the strength decreased with increasing grit depth of cut. The grinding forces have been analyzed and no direct correlation between the measured grinding forces and the resulting strength was found. However, re-analyzing the grinding forces in terms of force per cutting grit, a correlation between increased force per grit and decreasing strength was seen. Further analysis of the entire data set as well as fractography is ongoing.
All but one of the U.S. participants has now completed the work in the HTML. Each participant has machined and fracture tested thirty specimens. Valuable information has been obtained on some of the machining and wheel dressing procedures. Also, further insights into possible uses of the force data gathered during the machining has been acquired. The participation of all these experienced researchers has resulted in valuable information regarding interpretation of machining data, surface finish, and quality results.
The grinding data produced by the U.S. participants have been analyzed at ORNL. The grinding forces have been analyzed and compared to the two previous runs performed in the HTML, and for the most part good reproducibility was obtained. Weibull analyses of the strength data have been completed, and surface roughness data have been collected on all the participants' specimens. Some fractography have been completed. The strength results from the participants' runs lie well within the range observed for the two HTML runs. Due to the size of the billets being ground, each participant ground one and a half billet in order to obtain 30 specimens. The strength distribution within each billet was very tight, i.e., the Weibull modulus was high, but in most cases there was significant difference in the average strength for the two billets prepared under the exact same conditions. The fractography did not indicate any obvious differences in the specimen sets, and also, since the machined billets in many cases originally came from the same larger hot-pressed billet, material differences seem to be an unlikely reason for the strength differences. Although the wheel truing and dressing schedules were kept constant throughout the experiments, it is likely that some of the variability is due to the conditions of the grinding wheels. One participant had considerable experience in wheel characterization, and was very meticulous in the truing and dressing, and as a result, this participant's results did not exhibit such a billet to billet variation. Similar experience was reported from the Belgian laboratory, and it clearly indicates that the understanding of the wheel conditions is very important. A report containing the machining characteristics, the

408
strength and Weibull data, roughness values, and preliminary fractography will be sent to each participant for comments and feedback. The results for the participants will also be compared to the work performed previously in the HTML, and an evaluation of the overall data to this point will be assembled.
The international round robin fractography results have been summarized in a draft report which has been distributed to the international partners for feed-back and comments.
The grinding instructions from the international partners have been received at ORNL, and a summary sheet containing all the grinding variables has been prepared. This sheet was faxed to all the participating countries, and comments, questions, and clarifications have been received and sent back out. All questions regarding the international grinding conditions have been coordinated through ORNL to ensure that all participants receive the same information. All international billets and grinding instructions have been exchanged at this point.
Subtask 8, Ceramic Powder Characterization
Major responsibility for this subtask in the United States is at NIST, and a detailed report of progress on this subtask is provided in the section of this report submitted by NIST.
Status of Milestones - Milestone 411517 - Complete flexure strength measurements -completed April 30, 1995.
Additional change made to Milestone 411518 - completion date changed from August 31, 1995, to November 30,1995, due to one U.S. participant (NIST) coming in November to complete the machining measurements.
Other Milestones are on schedule.
CommunicationsA/isits/Travel - Dr. Mineo Mizuno (Japanese Technical Leader of Subtask 7), Japan Fine Ceramics Center, and Mr. H. Ogiyama (Japanese Alternate Executive Committee Member), New Energy and Industrial Technology Development Organization, visited (July 5, 1995) and presented a seminar on the "Research and Development of the CGT Programs Ongoing in Japan."
Matt Ferber, Kristin Breder, and Felicia Foust attended IEA Subtask 7 Working Group Meeting, Alfred University, Alfred, New York (July 9, 1995).
Publications and Presentations - Carlsson, Lennart, "A Round Robin 1994 on Fractography of Silicon Nitride, Swedish Specimens," Swedish National Testing and Research Institute, Materials Technology, Technical Note 1995:21, 1995. (Sweden)
DrCisedau, K. A. and Hollstein, T., "A Round Robin on Fractography of Silicon Nitride, German Results," IWM-Report V 26/95, April 1995. (Germany)

409
Hendrix, W. and Erauw, J. P., "Round Robin on Fractography of Silicon Nitride, Belgian Results," VITO - Materials Division, MAT/95/R.108, June 1995. (Belgium)
Breder, Kristin and Ferber, Matt K., "IEA Annex II, Subtask 7 - Status of U.S. Machining Work," presented at Subtask 7 Working Group Meeting, Alfred, University, July 9, 1995.
Breder, Kristin and Ferber, Mattison K., "Effect of Different Machining Parameters on the Strength of a Silicon Nitride. An International Collaboration Under IEA," presented at Cost-Effective Ceramic Machining Workshop, Oak Ridge, Tennessee, September 20, 1995.

410
Characterization of Ceramic Powders S. G. Malghan and L.-S. Lum (National Institute of Standards and Technology) Obiective/Scope
Ceramics have been successfully employed in engines on a demonstration basis. The successful manufacture and use of ceramics in advanced engines depends on the development of reliable materials that will withstand high, rapidly varying thermal stress loads. Improvement in the characterization of ceramic starting powders is a critical factor in achieving reliable ceramic materials for engine applications. The production and utilization of such powders require characterization methods and property standards for quality assurance.
The objectives of the NIST program are: (1) to assist with the division and distribution of ceramic starting powders for an international round-robin on powder characterization; (2) to provide reliable data on physical (dimensional), chemical and phase characteristics of powders; and (3) to conduct statistical assessment, analysis and modeling of round-robin data. This program is directed toward a critical assessment of powder characterization methodology and toward establishment of a basis for the evaluation of fine powder precursors for ceramic processing. This work will examine and compare by a variety of statistical means the various measurement methodologies employed in the round-robin and the correlations among the various parameters and characteristics evaluated. The results of the round-robin are expected to provide the basis for identifying measurements for which Standard Reference Materials are needed and to provide property and statistical data which will serve the development of internationally accepted standards.
Technical Progress
During this period, the primary activities in progress were on analysis of powders, development of data entry formats, entry and analysis of data, and communications with the technical leaders.
We completed testing of the two primary powders—silicon nitride and silicon carbide—on selected procedures. In addition, occasionally, we have experimented with the alumina powder. Data on particle size distribution by x-ray sedimentation and interface chemistry by electroacoustic techniques have been obtained. In addition, settling rate of as-received powders and flow rate of spray dried powders have also been obtained. Preliminary analysis of these data show no surprises.
During July-August period, we completed the analysis of silicon nitride, silicon carbide and alumina powders for all secondary properties of interest. In addition, aluminum nitride powder has been tested for several selected secondary properties. The flowability of the spray dried form of this powder was excellent. Thanks to Dow Chemical Company for providing this powder to the round robin activity.
411
Data from over 75% of the participants has arrived. Both Japan and Germany decided that their technical leaders will collect data from all participants and send it to NIST in July-August as a single package. The participants in these countries have started sending the data to their respective technical leaders. They plan to hold a meeting of the participants to discuss data before sending the data to NIST. We are experiencing some delay in the overall project due to extra time involved in completing the analysis at all participating laboratories. This is primarily due to more than anticipated analysis time, and delay experienced in the participating laboratories due to lack of technical staff availability. We are expecting to receive most of the data before the end of October. Our goal was to compile all data and develop tables for statistical analysis. At the executive meeting in Italy on October 2, 1995, the technical leaders plan to meet and develop preliminary conclusions based on the Subtask 8 data. Formats for entry of data from secondary properties of powders have been developed for most properties.
We have been in contact with the technical leaders in Japan, Germany, and Sweden to monitor progress and resolve any issues with respect to procedures. During August, we completed entry of most of the data from Japan. Dr. Naito, Technical Leader, visited NIST to describe the data. Prior to his visit, he had organized a meeting of the Japanese participants to discuss the data. Therefore, the primary purpose of his visit was to convey the discussions of their meeting. In addition, we discussed the technical areas for the continuation project to be proposed at the upcoming executive committee meeting in Italy. The Japanese participants are very eager to continue this program. However, they suggest, the primary thrust should be on reduced number of powders and on selected number of secondary properties. In addition, as agreed by all other participants, more emphasis should be placed on ruggedness testing of the procedures before the final round robin. This will ensure better quality of the powder. Most likely, the next subtask will be the last to be conducted under the IEA umbrella. Therefore, we need to take sufficient measures to ensure that the quality of the data will be high enough to pass these procedures to standards setting bodies.
Complete data from Belgium has been received. Also, Sweden and Norway have sent most of their data. We are continuing to input these data as we receive it.
In the ASTM activities, final revisions on the procedure for particle size distribution by gravity sedimentation were completed, and the final draft has been returned for concurrent subcommittee and society ballot. In the ASTM-related activities, at the Denver meeting, Dr. R. Newman, Dow Chemical Company, presented the revised versions of procedures for C, N, and O analysis. The data from IEA Subtask 6 were used in these procedures for establishing repeatability and reproducibility.
Status of Milestones On target

412
Publications/Presentations None
Communications/Visits None

413
Ceramic Mechanical Property Test Method Development George D. Quinn (National Institute of Standards and Technology) Objective/Scope
This task is to develop mechanical test method standards in support of the Ceramic Technology Project and Advanced Turbine Technology Applications Programs. Test method development should meet the needs of the DOE engine community but should also consider the general USA structural ceramics community as well as foreign laboratories and companies. Emphasis will be placed on the needs of the DOE community.
Draft recommendations for practices or procedures shall be developed based upon the needs identified above and circulated within the DOE ceramics heat engine community for review and modification. Round robins will be conducted as necessary, but shall be well-focussed, limited in scope, and not interfere with ongoing IEA round-robins. Procedures developed in this program will be advanced for final standardization by ASTM.
Technical Highlights and Results
Earlier work in this project has contributed to the following completed standards:
1. ASTM C-1198-91 "Dynamic Young's Modulus, Shear Modulus, and Poisson's Ratio for Advanced Ceramics by Sonic Resonance," by S. Gonczy, Allied-Signal; G. Quinn, NIST; and J. Helfinstine, Corning.
2. ASTM C-1161-90 "Standard Test Method for Flexural Strength of Advanced Ceramics at Ambient Temperature," G. Quinn, NIST.
3. ASTM C-1211-92 "Standard Test Method for Flexural Strength of Advanced Ceramic at Elevated Temperature," by G. Quinn in cooperation with Mr. M. Foley, Norton; Mr. T. Richerson, AlliedSignal; and Dr. M. Ferber, ORNL.
4. MIL HDBK 790 "Fractography and Characterization of Fracture Origins in Advanced Structural Ceramics," with J. Swab and M. Slavin, U. S. Army, ARL.
5. ASTM C-1239-93 "Standard Practice for Reporting Strength Data and Estimating Weibull Distribution Parameters," by S. Duffy, NASA-Lewis; G. Quinn, NIST; and C. Johnson, G.E.
In addition, work on this task has contributed to the following draft standards which are now being balloted in ASTM Committee C-28:
1. ASTM C-xxxx "Standard Test Methods for the Determination of Fracture Toughness of Advanced Ceramics," in cooperation with Prof. Isa Var-on, WPI: and M. Jenkins and J. Salem of University of Washington."
2. ASTM C-xxxx "Standard Test Method for Knoop Indentation Hardness of Advanced Ceramics."
3. ASTM C-xxxx "Standard Test Method for Vickers Indentation Hardness of Advanced Ceramics."

414
4. ASTM C-xxxx "Standard Practice for Fractography and Characterization of Fracture Origins in Advanced Ceramics," in cooperation with Mr. J. Swab, U.S. ARL.
Fracture Toughness
A draft fracture toughness standard was balloted twice ASTM committees C-28, Advanced Ceramics and E-08, Fracture and Fatigue in April, 1995. The document was balloted simultaneously by the appropriate subcommittees in the two ASTM committees. Negative ballots and constructive comments were received in the first ballot and the document was withdrawn for remedial actions. The revisions that are necessary are refinements. The general framework and the three specific procedures in it (SEPB, CN, SCF) were accepted by the voters. At the time this semiannual report was prepared, ballot results from the second ballot were being received suggesting that a few additional rveisons may be needed. Professor Isa Bar-on of Worcester Polytechnic Institute is the overall coordinator of this activity as well as the C-28/E-8 committee liaison.
Work in this task has focussed on refining the surface crack in flexure (SCF) method which is one of the three in the draft standard. We have also contributed to elements of the main body of the draft standard, particularly the error and uncertainty statements, and the specimen orientation scheme. The uncertainty statements for the SCF and SEPB procedures were prepared on the basis of two VAMAS round robin projects and the numerical analysis of ASTM standard E 691, "Practice for Conducting an Interlaboratory Study to Determine the Precision of a Test Method." Numbers were adjusted in April when outlier results were deleted and the new numbers have been used in the latest version of the draft standard.
In this semiannual period, two papers were written on the SCF method. The first, presented at the fracture mechanics of ceramics conference in Karlsruhe, Germany in July 1995, discussed the numerical results in some detail, particularly the remarkable consistency in results obtained on NC 132 hot-pressed silicon nitride. This material, a staple of mechanical test studies in the 1970's-1980's, has a fracture toughness of 4.6 MPa/m as measured by any one of several reputable methods over the course of twenty years by many different laboratories. It is gratifying that the three methods in the ASTM draft standard all yield the same outcome for this material. The consistency is due in large part to the consistency in manufacture of this material, and the fact that it has little or no R-curve behavior. The second paper prepared was for the conference on fractography of glasses and ceramics at Alfred University in July. This paper emphasized the fractographic techniques that can be used to find and measure the precracks.
The data base of fracture toughness values by the SCF method has been expanded to 26 advanced ceramics. We are accumulating and acquiring new ceramics for additional studies, particularly ceramics with fracture toughnesses >8. and <3. MPa/m. Studies are underway regarding the apparent results obtained by this method for materials with suspected R-curve behavior. We welcome inquiries from other Ceramic Technology Project participants who have materials for NIST to measure fracture toughness by this method.

415
A round robin on the SCF method may be starting in Europe.
Hardness Work continued at NIST on developing hardness standards for advanced
ceramics. This is a two pronged program which has an effort performed under this task to prepare ASTM Knoop and Vickers standard test methods as well as a separate NIST program to develop two standard reference materials (SRM's). Figure 1 illustrates the two SRM's.
SRM 2830, Knoop Indentation Hardness was fabricated in the Spring and Summer of 1995. At the time this semiannual report was prepared, all artifact preparation work had been completed, and the final, exhaustive statistical analysis of the data was underway. We project that the NIST Knoop blocks will have hardnesses certified to within 1% at a 95% confidence level. This is extraordinary and the SRM's will be eminently suitable to support the ASTM standard which requires users to verify their hardness test equipment within ±5%. The blocks should be available for sale in December, 1995.
SRM 2830, Vickers Indentation Hardness has been delayed since the vender of the material has delivered two unacceptable batches. The material is a tungsten carbide, and was chosen since it had a hardness of 1500 kg/mm2, had clean, crisp indentations, and was very uniform. A new batch is in preparation.
The draft Knoop and Vickers hardness standards were balloted in ASTM in the Spring of 1995 at the C28.01 subcommittee level. They received one negative ballot apiece as well as a few constructive suggestions on affirmative-with-comment ballots. The negative ballot pertained to a single word in the drafts: "should". The word was used in the context of whether a polished surface was mandatory or not. "Should" was used in one clause, and "shall" in another. The latter is mandatory, the former recommended. Unfortunately, ASTM is strict about wording changes such as this, and it was not possible to make a simple editorial revision. The drafts have been corrected and the opportunity was taken to make a few additional "polishing-up" revisions to the drafts. A new figure showing acceptable and unacceptable Knoop indents has been added to the Knoop standard.
Mr. Quinn continued to exchange detailed correspondence with Mr. Sakaguchi of NIRIN, Nagoya on questions pertaining to a proposed ISO standard for Vickers and Knoop hardness. Mr. Sakaguchi proposes to clone a rudimentary ISO standard for the Vickers hardness of metals. We feel that this is a mistake. The ASTM ceramic standards, when properly used, will have hardness precision and bias of less than 5%. Such levels of precision will not be achievable by cloning the metal ISO standard. The ISO ceramic draft standard also includes both 1 kg and 10 kg as loads for Vickers indentation. It is our experience that the higher load is unreasonable for many ceramics, since the indents will be badly cracked or chipped. Extensive communications were relayed to NIRIN about this, but ultimately it was decided that NIST will make a series of 10 kg and 1 kg indents into a range of 10 or more ceramics. We will assess the quality of the indentations and formulate a recommendation for a USA stance (to be determined at the next C-28 meeting) on the ISO draft standard.
Several inquiries have been received regarding the applicability of the new NIST SRM's for instrumented hardness or nanoindentation testing.

416
Figure 1 The two NIST hardness standard reference materials. #2830 is a silicon nitride which will have Knoop indents. #2831 is a tungsten carbide with Vickers indents.
M " i j i n i i i i ! i | M H i i i i i m t i i i i i , n i i j i i
0 mm 10 20 30 40 i n i it1111 1111j11IIp i i i >i i |i 11
50 60 70 80 90 100 110
S R M 2830 Knoop Hardness Silicon Nitride
S R M 2831 Vickers Hardness Tungsten Carbide

417
A prototype SRM silicon nitride specimen was sent to Germany where Dr. Christian Ullner of BAM studied it with "recording hardness" testing. The disk was suitable and now a new VAMAS round robin is being set up which will study this method. Prototype Knoop-silicon nitride and Vickers-tungsten carbide disks were also sent to Dr. Stephen Webb of Wilson-Instron in Massachusetts for similar evaluation. The NIST SRM's were not prepared for these purposes, but they may be found to be satisfactory.
Fractography This work is focussing on creating a standard practice for
fractographic characterization of fracture origins in advanced structural ceramics. Military Handbook (MIL HBK) 790, which was completed in June 1992, is in widespread use in the United States and Europe, and serves as the basis of this work. This work is a collaboration between G. Quinn of NIST and J. Swab of U. S. Army Research Laboratory (ARL).
The draft ASTM standard "Standard Practice for Fractography and Characterization of Fracture Origins in Advanced Ceramics," which is an improvement on MIL HDBK 790, was balloted by subcommittee C-28.05, in November, 1994. Mr. Quinn and Mr. Swab made a number of changes to the document and it was resubmitted to ASTM in August for a Fall, 1995 ballot.
Papers on the results of the recently completed VAMAS round robin were presented by Mr. Swab at the conference on Fractography at Alfred University in July, 1995. This conference was a marvelous forum for the key participants in the IEA and VAMAS projects to come together and discuss the draft standards and the round robins.
Diametral Compression Information has been accumulated on the diametral compression test,
illustrated in Figure 2, and approval to form a task group in C28.01 for this method was obtained. Mr. Quinn and Mr. Swab of the U. S. ARL will collaborate on a project to evaluate this method and prepare a draft standard. Materials are being accumulated and specimens are being prepared. Emphasis will be on applying sound fractographic techniques to the fractured disks. This may help clear up the question of why diametral compression strength often does not agree with results from other methods.
Other Activities Al Segal of the Center of Advanced Materials at Pennsylvania State
University requested help in revising his C-ring strength standard. G. Quinn helped Chuck Brinkman of ORNL write a paper about the
activities of ASTM Committee C-28 for the Annual Meeting of the American Ceramic Society in April, 1995. We collaborated again in writing a chapter on mechanical test method standards for a new book on Mechanical Testing of Ceramics which David Cranmer of NIST is editing for Marcel Dekker.
As a result of new work on machining of several silicon nitrides, Dr. S. Jahanmir of NIST requested clarification on the specifications for machining bend bars in the ASTM and MIL STD flexure standards. The specifications call for rather low removal rates per pass (.0002 mm) in

418
Figure 2 Diametral Compression Strength Testing

419
the final longitudinal grinding stages. The rationale for this rate was reviewed and a survey made of current world standards. Bomas and Chand Kare were contacted for further information. The rates of removal were intentionally chosen in 1982 to be conservative, and were intended for a wide range of materials, not merely silicon nitrides. No changes to the machining specifications are planned at this time, but this topic may come up when the new ISO draft flexure standard is proposed.
Status of Milestones 412125 Prepare a draft of "Standard Practice for Size Scaling of
Uniaxial Strengths Using Weibull Statistics for Advanced Ceramics"
Ongoing, (Task group led by S. Duffy, NASA-Lewis) The following are all on schedule: 412126 Prepare a draft ISO flexure strength standard 412127 Review fracture mirror literature, and plan a program for
mirror constant evaluation 412128 Write a comprehensive paper on hardness testing of ceramics 412129 Fabricate and Test diametral compression specimens 41230 Evaluate the fracture toughness of ceramics with high or low
low fracture toughnesses by SCF
Publications/Presentations
1. R. Gettings and G. Quinn, "Surface Crack in Flexure (SCF) Measurements of the Fracture Toughness of Advanced Ceramics," Ceram. Eng. and Sci. Proc, Vol. 16, No.4 (1995) pp. 539-547.
2. J. Swab and G. Quinn, "Fractography of Advanced Structural Ceramics: Results from Topic #2 of the VAMAS Round Robin Exercise," Ceram. Eng. and Sci. Proc, Vol. 16, No. 5, (1995) pp. 929-938.
3. J. Swab and G. Quinn, "Fractography of Advanced Structural Ceramics: Results from the VAMAS Round Robin Exercise," U.S. ARL Technical Report TR 656, Dec. 1994.
4. J. J. Swab and G. D. Quinn, "Fractography of Advanced Structural Ceramics, Results from the VAMAS Round Robin Exercise," VAMAS Report #19, June 1995.)
5. C. R. Brinkman, G. D. Quinn, and R. W. McClung, "Overview of ASTM Standard Activities in Support of Advanced Structural Ceramics Development," to be publ. Ceram. Eng. and Sci. Proc, 1995.
6. R. J. Gettings, G. D. Quinn, A. W. Ruff, and L. K. Ives "Hardness Standard Reference Materials (SRM's) for Advanced Ceramics," submitted to the 9th International Symposium on Hardness Testing in Theory and Practice," Dusseldorf, Nov. 1995.
7. G. D. Quinn, R. J. Gettings, and J. J. Kiibler, "Fracture Toughness of Ceramics by the Surface Crack in Flexure (SCF) Method," submitted to the 6th International Symposium on Fracture Mechanics of Ceramics, Karlsruhe, July, 1995.
8. G. D. Quinn and R. J. Gettings, "Fractography and the Surface Crack in Flexure (SCF) Method for Evaluating Fracture Toughness of Ceramics," submitted to the Third Alfred Conference on Fractography of Glasses and Ceramics," July, 1995.
9. J. J. Swab and G. D. Quinn, "Findings of the VAMAS Fractography Round Robin Exercise," ibid.

420
Communications/Visits
1. G. Quinn attended the ASTM Committee C-28 meeting in Denver in June, 1995.
2. T. Ohji of NIRIN Nagoya met G. Quinn at karlsruhe in July to talk about fracture toughness and tension standards for ISO.
3. M. Sakaguchi of NIRIN, Nagoya repeatedly contacted NIST regarding hardness standards. Sakaguchi met Quinn at the Karlsruhe meeting.
4. J. Swab of the U.S. ARL came to work at NIST as an exchange scientist.
5. An instrumented hardness program was set up for VAMAS in cooperation with the German Lab, BAM. Christian Ullner of BAM will organize this project.
6. G. Quinn had extensive contact and communications with I. Bar-on, WPI regarding the preparation of the draft fracture toughness standard.
7. G. Quinn contacted Dr. Herman Vetters, the German leader of CEN TC 184, Working Group #2, to learn more about CEN standards for ceramic coatings.
8. Jurgen Rodel of the Technical Hochschule Darmstadt visited NIST and discussed details of SCF fracture toughness testing. He uses this method routinely now. A new round robin is being organized in Europe on the method, and G. Quinn will inquire further about this.
9. Golden Ceramics inquired about methods to test for edge chip sensitivity. Details about a test method and a dedicated machine to measure this were sent to Golden.
10. Michael Gardos of Hughes sent extensive information about fracture toughness and hardness test data on silicon nitride bearing ball materials to G. Quinn. One set of results was on NC 132. Fracture toughness results by the so called "indentation fracture" method (indent and measure the surface traces) could be made to agree with other data only if a correction factor was applied. Discrepancies in hardness data generated at Hughes were noted.
11. G. Quinn contacted C. Breder and M. Ferber of ORNL in order to coordinate VAMAS and IEA programs. IEA and VAMAS meetings at Alfred University in July helped coordinate the fractography work in each program.

421
INTERNAL DISTRIBUTION
ORM/IM-13219
Central Research Library (2) Document Reference Section Laboratory Records Department (2) Laboratory Records, ORNL RC ORNL Patent Section M&C Records Office (3) L. F. Allard, Jr. L. D. Armstrong P. F. Becher R. F. Bernal T. M. Besmann P. J. Blau R. A. Bradley K. Breder C. R. Brinkman V. R. Bullington G. M. Caton S. J. Chang A. Choudhury D. D. Conger R. H. Cooper, Jr. S. A. David J. L. Ding M. K. Ferber R. L. Graves D. L. Greene H. W. Hayden, Jr. C. R. Hubbard
M. A. Janney D. R. Johnson (5) D. Joslin R. R. Judkins M. A. Karnitz B. L. Keyes H. D. Kimrey, Jr. R. J. Lauf W.Y.Lee K. C. Liu E. L. Long, Jr. W. D. Manly R. W. McClung D. J. McGuire T. A. Nolan A. E. Pasto K P. Plucknett M. H. Rawlins M. L. Santella A. C. Schaffhauser E. J. Soderstrom D. P. Stinton R. W. Swindeman T. N. Tiegs B. H. West S. G. Winslow J. M. Wyrick R. E. Ziegler

422
EXTERNAL
Pioneering Research Info. Ctr. E.I. Dupont de Nemours & Co. Experimental Station P.O. Box 80302 Wilmington DE 19880-0302
Jeffrey Abboud U.S. Advanced Ceramics Assoc. 1600 Wilson Blvd., Suite 1008 Arlington VA 22209
James H. Adair University of Florida Materials Science & Engineering 317 MAE Bldg. Gainesville FL 32611-2066
Donald F. Adams University of Wyoming Mechanical Engineering Dept. P.O. Box 3295 Laramie WY 82071
Andrzej Aeamski Materials Conversion Group 236-B Egidi Drive Wheeling JL 60090
Jalees Ahmad AdTech Systems Research Inc. Solid Mechanics 1342 N. Fairfield Road Dayton OH 45432-2698
Yoshio Akimune NISSAN Motor Co., Ltd. Materials Research Laboratory 1 Natsushima-Cho Yokosuka 237 JAPAN
Mufit Akinc Iowa State University 322 Spedding Hall Ames IA 50011
Hhan A Aksay Princeton University A313 Engineering Quadrangle Princeton NJ 08544-5263
Charles Aldridge Heany Industries, Inc. 249 Briarwood Lane Scottsville NY 14546
Joseph E. Amaral Instron Corporation Corporate Engineering Office 100 Royale Street Canton MA 02021
Edward M. Anderson Aluminum Company of America N. American Industrial Chemical P.O. Box 300 Bauxite AR 72011
Norman C. Anderson Ceradyne, Inc. Ceramic-to-Metal Division 3169 Redhill Avenue Costa Mesa CA 92626
Don Anson BCL Thermal Power Systems 505 King Avenue Columbus OH 43201-2693
Thomas Arbanas G.B.C. Materials Corporation 580 Monastery Drive Latrobe PA 15650-2698
Frank Armatis 3M Company Building 60-1N-01 St. Paul MN 55144-1000

423
Everett B. Arnold Detroit Diesel Corporation Mechanical Systems Technology 13400 Outer Drive West Detroit MI 48239-4001
Bertil Aronsson Sandvik AB S-12680 Stockholm Lerkrogsvagen 19 SWEDEN
Dennis Assanis University of Michigan Dept. of Mechanical Engineering 321 W.E. Lay, N.C. Ann Arbor MI 48109
V. S. Awa North Carolina A&T State Univ. Dept. of Mechanical Engineering Greensboro NC 27411
Patrick Badgley Sky Technologies, Inc. 2815 Franklin Drive Columbus IN 47201
Sunggi Baik Pohang Institute Sci. & Tech. P.O. Box 125 Pohang 790-600 KOREA
Bob Baker Ceradyne, Inc. 3169 Redhill Avenue Costa Mesa CA 92626
Frank Baker Aluminum Company of America Alcoa Technical Center Alcoa Center PA 15069
Clifford P. Ballard AlliedSignal Aerospace Company Ceramics Program P.O. Box 1021 Morristown NJ 07962-1021
B. P. Bandyopadhyay University of North Dakota Box 8359 University Station Grand Forks, ND 58202-8359
P. M. Barnard Ruston Gas Turbines Limited P.O. Box 1 Lincoln LN2 5DJ ENGLAND
Harold N. Barr Hittman Corporation 9190 Red Branch Road Columbia MD 21045
Renald D. Bartoe Vesuvius McDanel 510 Ninth Avenue Box 560 Beaver Falls PA 15010-0560
David L. Baty Babcock & Wilcox - LRC P.O. Box 11165 Lynchburg VA 24506-1165
Donald F. Baxter, Jr. ASM International Advanced Materials & Processes Materials Park OH 44073-0002
M. Brad Beardsley Caterpillar Inc. Technical Center Bldg. E P.O. Box 1875 Peoria IL 61656-1875
424
John C. Bell Shell Research Limited Thornton Research Centre P.O. Box 1 Chester CHI 3SH ENGLAND
Larry D. Bentsen BFGoodrich Company R&D Center 9921 Brecksville Road Brecksville OH 44141
Tom Bernecki Northwestern University 1801 Maple Avenue Evanston IL 60201-3135
Charles F. Bersch Institute for Defense Analyses 1801 N. Beauregard Street Alexandria VA 22311
Ram Bhatt NASA Lewis Research Center 21000 Brookpark Road Cleveland OH 44135
William D. Bjorndahl TRW, Inc. One Space Park, MS:R6-2188 Building 01, Room 2040 Redondo Beach CA 90278
Keith A. Blakely Advanced Refractory Technologies, Inc. 699 Hertel Avenue Buffalo NY 14207
Edward G. Blanchard Netzsch Inc. 119 Pickering Way Exton PA 19341
Bruce Boardman Deere & Company Technical Ctr. 3300 River Drive Moline IL 61265
Lawrence P. Boesch EER Systems Corp. 1593 Spring Hill Road Vienna VA 22182-2239
Donald H. Boone Boone & Associates 2412 Cascade Drive Walnut Creek CA 94598-4313
Tom Booth AlliedSignal, Inc. AiResearch Los Angeles Division 2525 West 190th Street Torrance CA 90509-2960
Raj Bordia University of Washington Roberts Hall Box 35212 Seattle WA 98195-2120
Tibor Bornemisza Energy Technologies Applications, Inc. 5064 Caminito Vista Lujo San Diego CA 92130-2846
J.A.M. Boulet University of Tennessee Engineering Science & Mechanics Knoxville TN 37996-2030
Leslie J. Bowen Materials Systems 53 Hillcrest Road Concord MA 01742
Steven C. Boyce Air Force Office of Scientific
Research AFOSR/NA Bldg. 410 Boiling AFB DC 20332-6448

425
Steve Bradley UOP Research Center 50 E. Algonquin Road Des Plaines IL 60017-6187
Michael C. Brands Cummins Engine Company, Inc. P.O. Box 3005, Mail Code 50179 Columbus IN 47201
Raymond J. Bratton Westinghouse Science & Technology 1310 Beulah Road Pittsburgh PA 15235
John J. Brennan United Technologies Corporation Silver Lane, MS:24 East Hartford CT 06108
Gunnar Broman 317 Fairlane Drive Spartanburg SC 29302
Alan Brown P.O. Box 882 Dayton NJ 08810
Jesse J. Brown VPI&SU Ctr. for Adv. Ceram. Mater. Blacksburg VA 24061-0256
Sherman D. Brown University of Illinois Materials Science & Engineering 105 South Goodwin Avenue Urbana IL 61801
S. L. Bruner Ceramatec, Inc. 2425 South 900 West Salt Lake City UT 84119
Walter Bryzik U.S. Army Tank Automotive
Command R&D Center, Propulsion Systems Wanen MI 48397-5000
Curt V. Burkland AMERCOM, Inc. 8928 Fullbright Avenue Chatsworth CA 91311
Bill Bustamante AMERCOM, Inc. 8928 Fullbright Avenue Chatsworth CA 91311
Oral Buyukozturk Massachusetts Institute of Technology 77 Massachusetts Ave., Rm 1-280 Cambridge MA 02139
David A. Caillet Ethyl Corporation 451 Florida Street Baton Rouge La 70801
Roger Cannon Rutgers University P.O. Box 909 Piscataway NJ 08855-0909
Scott Cannon P.O. Box 567254 Atlanta GA 30356
Harry W. Carpenter 1844 Fuerte Street Fallbrook CA 92028
David Carruthers Kyocera Industrial Ceramics P.O. Box 2279 Vancouver WA 98668-2279

426
Calvin H. Carter, Jr. Cree Research, Inc. 2810 Meridian Parkway Durham NC 27713
J. David Casey 35 Atlantis Street West Roxbury MA 02132
Jere G. Castor J. C. Enterprise 5078 N. 83rd Street Scottsdale AZ 85250
James D. Cawley Case Western Reserve University Materials Science & Engineering Cleveland OH 44106
Thomas C. Chadwick Den-Mat Corporation P.O. Box 1729 Santa Maria CA 93456
Ronald H. Chand Chand Kare Technical Ceramics 2 Coppage Drive Worcester MA 01603-1252
William Chapman Williams International Corp. 2280 W. Maple Road Walled Lake MI 48390-0200
Ching-Fong Chen LECO Corporation 3000 Lakeview Avenue St. Joseph MI 49085
William J. Chmura Torrington Company 59 Field Street Torrington CT 06790-4942
Tsu-Wei Chou University of Delaware 201 Spencer Laboratory Newark DE 19716
R. J. Christopher Ricardo Consulting Engineers Bridge Works Shoreham-By-Sea W. Sussex BN435FG ENGLAND
Joel P. Clark Massachusetts Institute of Technology Room 8-409 Cambridge MA 02139
Giorgio Clarotti Commission of the European Comm DGXH.-C3, M075, 1-53; 200 Rue de la Loi B-1049 Brussels BELGIUM
W. J. Clegg ICI Advanced Materials P.O. Box 11, The Heath Runcorn Cheshire WA7 4QE ENGLAND
William S. Coblenz Adv. Research Projects Agency 3701 N. Fairfax Drive Arlington VA 22203
Gloria M. Collins ASTM 1916 Race Street Philadelphia PA 19103
William C. Connors Sundstrand Aviation Operations Materials Science & Engineering 4747 Harrison Avenue Rockford IL 61125-7002

427
Shawn Cooper FEV Engine Technology 2285 Opdyke Road, Suite F Auburn Hills, MI 48326
John A. Coppola Carborundum Company Niagara Falls R&D Center P.O. Box 832 Niagara Falls NY 14302
Normand D. Corbin Norton Company SGNICC/NRDC Goddard Road Northboro MA 01532-1545
Douglas Corey AlliedSignal, Inc. 2525 West 190th Street, MS:T52 Torrance CA 90504-6099
Keith P. Costello Chand/Kare Technical Ceramics 2 Coppage Drive Worcester MA 01603-1252
Ed L. Courtright Pacific Northwest Laboratory MS:K3-59 Richland WA 99352
Anna Cox Mitchell Market Reports 20 St. James Street Monmouth Gwent NP5 3DL UNITED KINGDOM
J. Wesley Cox BIRL 1801 Maple Avenue Evanston IL 60201-3135
Art Cozens Instron Corporation 3414 Snowden Avenue Long Beach CA 90808
Mark Crawford New Technology Week 4604 Monterey Drive Annandale VA 22003
Richard A. Cree Markets & Products, Inc. P.O. Box 14328 Columbus OH 43214-0328
Les Crittenden Vesuvius McDanel Box 560 Beaver Fails PA 15010
M. J. Cronin Mechanical Technology, Inc. 968 Albany-Shaker Road Latham NY 12110
Gary M. Crosbie Ford Motor Company 20000 Rotunda Drive MD-3182, SRL Building Dearborn MI 48121-2053
Floyd W. Crouse, Jr. U.S. Department of Energy Morgantown Energy Tech. Ctr. P.O. Box 880 Morgantown WV 26505
John Cuccio AlliedSignal Engines P.O. Box 52180, MS:1302-2Q Phoenix AZ 85072-2180
Raymond A. Cutler Ceramatec, Inc. 2425 South 900 West Salt Lake City UT 84119
Stephen C. Danforth Rutgers University P.O. Box 909 Piscataway NJ 08855-0909

428
Sankar Das Gupta Electrofiiel Manufacturing Co. 9 Hanna Avenue Toronto Ontario MGK-1W8 CANADA
Frank Davis AlliedSignal Aerospace Company 7550 Lucerne Drive, #203 Middleburg Heights OH 44130
Robert F. Davis North Carolina State University Materials Engineering Department P.O. Box 7907 Raleigh NC 27695
George C. DeBell Ford Motor Company Scientific Research Lab P.O. Box 2053, Room S2023 Dearborn MI 48121-2053
Michael DeLuca RSA Research Group 1534 Claas Ave. Holbrook NY 11741
Gerald L. DePoorter Colorado School of Mines Metallurgical & Materials Engr Golden CO 80401
J. F. DeRidder Omni Electro Motive, Inc. 12 Seely Hill Road Newfield NY 14867
Nick C. Dellow Materials Technology Publications 40 Sotheron Road Watford Herts WD1 2QA UNITED KINGDOM
L. R. Dharani University of Missouri-Rolla 224 M.E. Rolla MO 65401
Douglas A. Dickerson Union Carbide Specialty Powders 1555 Main Street Indianapolis IN 46224
John Dodsworth Vesuvius Research & Development Technical Ceramics Group Box 560 Beaver Falls PA 15010
B. Dogan Institut fur Werkstofforschung GKSS-Forschungszentrum Geesthacht Max-Planck-Strasse D-2054 Geesthacht GERMANY
Alan Dragoo U.S. Department of Energy ER-131, MS:F-240 Washington DC 20817
Jean-Marie Drapier FN Moteurs S. A Material and Processing B-4041 Milmort (Herstal) BELGIUM
Kenneth C. Dreitlein United Technologies Res. Ctr. Silver Lane East Hartford CT 06108
Robin AL. Drew McGill University 3450 University Street Montreal Quebec H3A 2A7 CANADA

429
Winston H. Duckworth BCL Columbus Division 505 King Avenue Columbus OH 43201-2693
Ernest J. Duwell 3M Abrasive Systems Division 3M Center St. Paul MN 55144-1000
Robert J. Eagan Sandia National Laboratories Engineered Mater. & Proc. P.O. Box 5800 Albuquerque NM 87185-5800
Harry E. Eaton United Technologies Corporation Silver Lane East Hartford CT 06108
Harvill C. Eaton Louisiana State University 240 Thomas Boyd Hall Baton Rouge LA 70803
J. J. Eberhardt U.S. Department of Energy Office of Transportation Technologies EE-33, Forrestal Building Washington DC 20585
Jim Edler Eaton Corporation 26201 Northwestern Highway P.O. Box 766 Southfield MI 48037
G. A Eisman Dow Chemical Company Ceramics and Advanced Materials 52 Building Midland MI 48667
William A Ellingson Argonne National Laboratory Energy Technology Division 9700 S. Cass Avenue Argonne IL 60439
Anita Kaye M. Ellis Machined Ceramics 629 N. Graham Street Bowling Green KY 42101
Glen B. Engle Nuclear & Aerospace Materials 16716 Martincoit Road Poway CA 92064
Art Erdemir Argonne National Laboratory 9700 S. Cass Avenue Argonne H, 60439
E. M. Erwin Lubrizol Corporation 17710 Riverside Drive Lakewood OH 44107
W. L. Everitt Kyocera International, Inc. 8611 Balboa Avenue San Diego CA 92123
Gordon Q. Evison 332 S. Michigan Avenue Suite 1730 Chicago IL 60604
John W. Fairbanks U.S. Department of Energy Office of Transportation Technologies EE-33, Forrestal Building Washington DC 20585
Tim Fawcett Dow Chemical Company Advanced Ceramics Laboratory 1776 Building Midland MI 48674

430
Robert W. Fawley Sundstrand Power Systems Div. of Sundstrand Corporation P.O. Box 85757 San Diego CA 92186-5757
Jeff T. Fenton Vista Chemical Company 900 Threadneedle Houston TX 77079
Raymond R. Fessler BBRL 1801 Maple Avenue Evanston IL 60201
Ross F. Firestone Ross Firestone Company 188 Mary Street Winnetka IL 60093-1520
Sharon L. Fletcher Arthur D. Little, Inc. 15 Acorn Park Cambridge MA 02140-2390
Michael Foley Norton Company Goddard Road Northboro MA 01532-2527
Thomas F. Foltz Textron Specialty Materials 2 Industrial Avenue Lowell MA 01851
Renee G. Ford Materials and Processing Report P.O. Box 72 Harrison NY 10528
Edwin Frame Southwest Research Institute P.O. Drawer 28510 San Antonio TX 78284
Armanet Francois French Scientific Mission 4101 Reservoir Road, N.W. Washington DC 20007-2176
R. G. Frank Technology Assessment Group 10793 Bentley Pass Lane Loveland OH 45140
David J. Franus Forecast International 22 Commerce Road Newtown CT 06470
Marc R. Freedman NASA Lewis Research Center 21000 Brookpark Road, MS:49-3 Cleveland OH 44135
Douglas Freitag Bayside Materials Technology 17 Rocky Glen Court Brookeville MD 20833
Brian R.T. Frost Argonne National Laboratory 9700 S. Cass Avenue, Bldg. 900 Argonne IL 60439
Lawrence R. Frost Instron Corporation 100 Royall Street Canton MA 02021
Xiren Fu Shanghai Institute of Ceramics 1295 Ding-xi Road Shanghai 200050 CHINA
J. P. Gallagher University of Dayton Research Institute 300 College Park, JPC-250 Dayton OH 45469-0120

431
Richard Gates NIST Materials Bldg., A-256 Gaithersburg MD 20899
L. J. Gauckler ETH-Zurich Sonneggstrasse 5 CH-8092 Zurich 8092 SWITZERLAND
D. Gerster CEA-DCOM 33 Rue De La Federation Paris 75015 FRANCE
John Ghinazzi Coors Technical Ceramics Co. 1100 Commerce Park Drive Oak Ridge TN 37830
Robert Giddings General Electric Company P.O. Box 8 Schenectady NY 12301
A M. Glaeser University of California Lawrence Berkeley Laboratory Hearst Mining Building Berkeley CA 94720
Joseph W. Glatz 510 Rocksville Road Holland PA 18966
W. M. Goldberger Superior Graphite Company R&D 2175 E. Broad Street Columbus OH 43209
Alan E. Goldman U.S. Graphite, Inc. 907 W. Outer Drive Oak Ridge TN 37830
Stephen T. Gonczy Allied Signal Research P.O. Box 5016 Des Plaines IL 60017
Robert J. Gottschall U.S. Department of Energy ER-131, MS-.G-236 Washington DC 20585
Earl Graham Cleveland State University Dept. of Chemical Engineering Euclid Avenue at East 24th St. Cleveland OH 44115
John W. Graham Astro Met, Inc. 9974 Springfield Pike Cincinnati OH 45215
G. A Graves U. of Dayton Research Institute 300 College Park Dayton OH 45469-0001
Robert E. Green, Jr. Johns Hopkins University Mater. Sci. and Engineering Baltimore MD 21218
Alex A Greiner Plint & Partners Oaklands Park Wokingham Berkshire RGll 2FD UNITED KINGDOM
Lance Groseclose Allison Engine Company P.O. Box 420, MS:W-5 Indianapolis IN 46206
Thomas J. Gross U.S. Department of Energy Office of Transportation Technologies EE-30, Fonestal Building Washington DC 20585

432
Mark F. Gruninger Union Carbide Corporation Specialty Powder Business 1555 Main Street Indianapolis IN 46224
Ernst Gugel Cremer Forschungsinstitut GmbH&Co.KG Oeslauer Strasse 35 D-96472 Roedenta GERMANY
John P. Gyekenyesi NASA Lewis Research Center 21000 Brookpark Road, MS:6-1 Cleveland OH 44135
Nabil S. Hakim Detroit Diesel Corporation 13400 Outer Drive West Detroit MI 48239
Philip J. Haley Allison Engine Company P.O. Box 420, MS:T12A Indianapolis IN 46206-0420
Judith Hall Fiber Materials, Inc. Biddeford Industrial Park 5 Morin Street Biddeford ME 04005
Y. Hamano Kyocera Industrial Ceramics 5713 E. Fourth Plain Blvd. Vancouver WA 98661-6857
Y. Harada JIT Research Institute 10 West 35th Street Chicago IL 60616
Norman H. Harris Hughes Arcraft Company P.O. Box 800520 Saugus CA 91380-0520
Aan M. Hart Dow Chemical Company 1776 Building Midland MI 48674
Pat E. Hart Battelle Pacific Northwest Labs Ceramics and Polymers Development P.O. Box 999 Richland WA 99352
Michael H. Haselkorn Caterpillar Inc. Technical Center, Building E P.O. Box 1875 Peoria IL 61656-1875
Deborah A Haught U.S. Department of Energy Off. of Transportation Technologies EE-32, Fonestal Bldg. Washington DC 20585
N. B. Havewala Corning Inc. SP-PR-11 Corning NY 14831
John Haygarth Teledyne WAA Chang Abany P.O. Box 460 Abany OR 97321
Norman L. Hecht U. of Dayton Research Institute 300 College Park Dayton OH 45469-0172
Peter W. Heitman Allison Engine Company P.O. Box 420, MS:W-5 Indianapolis IN 46206-0420

433
Robert W. Hendricks VPI&SU 210 Holden Hall Blacksburg VA 24061-0237
Thomas P. Herbell NASA Lewis Research Center 21000 Brookpark Road, MS:49-3 Cleveland OH 44135
Robert L. Hershey Science Management Corporation 1255 New Hampshire Ave., N.W. Suite 1033 Washington DC 20036
Hendrik Heystek Bureau of Mines Tuscaloosa Research Center P.O. Box L University AL 35486
Robert V. Hillery GE Arcraft Engines One Neumann Way, M.D. H85 Cincinnati OH 45215
Athur Hindman Instron Corporation 100 Royall Street Canton MA 02021
Shinichi Hirano Mazda R&D of North America 1203 Woodridge Avenue Ann Abor MI 48105
Tommy Hiraoka NGK Locke, Inc. 1000 Town Center Southfield MI 48075
Fu H. Ho 5645 Soledad Mtn. Road San Diego, CA 92037-7256
John M. Hobday U.S. Department of Energy Morgantown Energy Tech. Ctr. P.O. Box 880 Morgantown WV 26507
Thomas Hollstein Fraunhofer-Institut fur Werkstoffmechanik Wohlerstrasse 11 D-79108 Freiburg GERMANY
Richard Holt Natl. Research Council Canada Structures and Materials Lab Ottawa Ontario K1A OR6 CANADA
Woodie Howe Coors Technical Ceramics 1100 Commerce Park Drive Oak Ridge TN 37830
Stephen M. Hsu NIST Quince Orchard & Clopper Road Bldg. 223, Rm A256 Gaithersburg MD 20899
Hann S. Huang Agonne National Laboratory 9700 S. Cass Avenue Agonne IL 60439-4815
Gene Huber Precision Ferrites & Ceramics 5576 Corporate Drive Cypress CA 90630
Fred R. Huettic Advanced Magnetics Inc. 45 Corey Lane Mendham NJ 07945
434
Brian K. Humphrey Lubrizol Petroleum Chemicals 3000 Town Center, Suite 1340 Southfield MI 48075-1201
Robert M. Humrick Dylon Ceramic Technologies 3100 Edgehill Road Cleveland Heights OH 44118
Michael S. Inoue Kyocera International, Inc. 8611 Balboa Avenue San Diego CA 92123-1580
Joseph C. Jackson U.S. Advanced Ceramics Assoc. 1600 Wilson Blvd., Suite 1008 Alington VA 22209
Osama Jadaan U. of Wisconsin-Platteville 1 University Plaza Platteville WI 53818
Said Jahanmir NIST Materials Bldg., Room A-237 Gaithersburg MD 20899
Curtis A Johnson General Electric Company P.O. Box 8 Schenectady NY 12301
Sylvia Johnson SRI International 333 Ravenswood Avenue Menlo Park CA 94025
Thomas A Johnson Lanxide Corporation P.O. Box 6077 Newark DE 19714-6077
Walter F. Jones AFOSR/NA 110 Duncan Ave., Ste. B115 Washington DC 20332-0001
Jill E. Jonkouski U.S. Department of Energy 9800 S. Cass Avenue Agonne IL 60439-4899
L. A Joo Great Lakes Research Corporation 208 Chickasaw Street Johnson City TN 37604-1409
Adam Jostsons Australian Nuclear Science & Technology New Dlawarra Road Lucas Heightss New South Wales AUSTRALIA
Lyle R. Kallenbach Phillips Petroleum Mail Drop:123AL Bartlesville OK 74004
Nick Kamiya Kyocera Industrial Ceramics Corp. 25 NW Point Blvd., #450 Elk Grove Village IL 60007
Roy Kamo Adiabatics, Inc. 3385 Commerce Park Drive Columbus IN 47201
Chih-Chun Kao Industrial Technology Research Institute 195 Chung-Hsing Road, Sec. 4 Chutung Hsinchu 31015 R.O.C. TAIWAN

435
Keith R. Karasek AliedSignal Aerospace Company 50 E. Agonquin Road Des Plaines IL 60017-5016
Robert E. Kassel Ceradyne, Inc. 3169 Redhill Avenue Costa Mesa CA 92626
Alan Katz Wright Laboratory Metals and Ceramics Division Wright-Patterson AFB OH 45433
R. Nathan Katz Worcester Polytechnic Institute 100 Institute Road Worcester MA 01609
Tony Kaushal GE Transportation Systems 2902 East Lake Road Building 14-0008 Erie, PA 16531
Ted Kawaguchi Tokai Carbon America, Inc. 375 Park Avenue, Suite 3802 New York NY 10152
Noritsugu Kawashima TOSHIBA Corporation 4-1 Ukishima-Cho Kawasaki-Ku Kawasaki, 210 JAPAN
Lisa Kempfer Penton Publishing 1100 Superior Avenue Cleveland OH 44114-2543
Frederick L. Kennard, HI Delphi Energy & Engine Mgmt. S Division of General Motors 1300 N. Dort Highway Hint MI 48556
David O. Kennedy Lester B. Knight Cast Metals 549 W. Randolph Street Chicago IL 60661
George Keros Photon Physics 3175 Penobscot Building Detroit MI 48226
Thomas Ketcham Corning, Inc. SP-DV-1-9 Corning NY 14831
Pramod K Khandelwal Allison Engine Company P.O. Box 420, MS:T10B Indianapolis IN 46206
Jim R. Kidwell AlliedSignal Engines P.O. Box 52180 Phoenix AZ 85072-2180
Shin Kim The E-Land Group 19-8 ChangJeon-dong Mapo-gu, Seoul 121-190 KOREA
W. C. King Mack Truck, Z-41 1999 Pennsylvania Avneue Hagerstown MD 21740
Carol Kirkpatrick MSE, Inc. P.O. Box 3767 Butte MT 59702
Tony Kirn Caterpillar Inc. Defense Products Dept., JB7 Peoria IL 61629
436
James D. Kiser NASA Lewis Research Center 21000 Brookpark Road, MS:49-3 Cleveland OH 44135
Max Klein 900 24th Street, N.W., Unit G Washington DC 20037
Stanley J. Klima NASA Lewis Research Center 21000 Brookpark Road, MS:6-1 Cleveland OH 44135
Abert S. Kobayashi University of Washington Mechanical Engineering Dept. Mail Stop:FU10 Seattle WA 98195
Shigeki Kobayashi Toyota Central Research Labs Nagakute Achi, 480-11 JAPAN
Richard A Kole Z-Tech Corporation 8 Dow Road Bow NH 03304
Joseph A Kovach Eaton Corporation 32500 Chardon Road Willoughby Hills OH 44094
Kenneth A Kovaly Technical Insights Inc. P.O. Box 1304 Fort Lee NJ 07024-9967
Edwin H. Kraft Kyocera Industrial Ceramics 5713 E. Fourth Plain Boulevard Vancouver WA 98661
Arthur Kranish Trends Publishing Inc. 1079 National Press Building Washington DC 20045
A S. Krieger Radiation Science, Inc. P.O. Box 293 Belmont MA 02178
Pieter Krijgsman Ceramic Design International Holding B.V. P.O. Box 68 Hattem 8050-AB THE NETHERLANDS
Waltraud M. Kriven University of Illinois 105 S. Goodwin Avenue Urbana IL 61801
Edward J. Kubel, Jr. ASM International Advanced Materials & Processes Materials Park OH 44073
Dave Kupperman Agonne National Laboratory 9700 S. Cass Avenue Agonne IL 60439
Oh-Hun Kwon North Company SGNICC/IvfRDC Goddard Road Northboro MA 01532-1545
W. J. Lackey GTRI Materials Science and Tech. Lab Atlanta GA 30332

437
Jai Lala Tenmat Ltd. 40 Somers Road Rugby Warwickshire CV22 7DH ENGLAND
Hari S. Lamba General Motors Corporation 9301 West 55th Street LaGrange IL 60525
Richard L. Landingham Lawrence Livermore National Lab P.O. Box 808, L-369 Livermore CA 94550
James Lankford Southwest Research Institute 6220 Culebra Road San Antonio TX 78228-0510
Stanley B. Lasday Business News Publishing Co. 1910 Cochran Road, Suite 630 Pittsburgh PA 15220
S. K. Lau Carborundum Company Technology Division P.O. Box 832, B-100 Niagara Falls NY 14302
J. Lawrence Lauderdale Babcock & Wilcox 1525 Wilson Blvd., #100 Alington VA 22209-2411
Jean F. LeCostaouec Textron Specialty Materials 2 Industrial Avenue Lowell MA 01851
Benson P. Lee Technology Management, Inc. 4440 Warrensville Rd., Suite A Cleveland OH 44128
Burtrand I. Lee Clemson University OlinHall Clemson SC 29634-0907
June-Gunn Lee KIST P.O. Box 131, Cheong-Ryang Seoul 130-650 KOREA
Stan Levine NASA Lewis Research Center 21000 Brookpark Road, MS:49-3 Cleveland OH 44135
David Lewis, HI Naval Research Laboratory Code 6370 Washington DC 20375-5343
A-Kang Li Materials Research Labs., 1'IKI 195-5 Chung-Hsing Road, Sec. 4 Chutung Hsinchu 31015 R.O.C. TAIWAN
Robert H. Licht Norton Company SGNICC/NRDC Goddard Road Northboro MA 01532-1545
E. Lilley Norton Company SGNICC/NRDC Goddard Road Northboro MA 01532-1545
Chih-Kuang Lin National Central University Dept. of Mechanical Engineering Chung-Li 32054 TAIWAN

438
Laura J. Lindberg AlliedSignal Aerospace Company Garrett Fluid Systems Division P.O. Box 22200 Tempe AZ 85284-2200
Hans A Lindner Cremer Forschungsinstitut GmbH&Co.KG Oeslauer Strasse 35 D-8633 Rodental 8866 GERMANY
Ronald E. Loehman Sandia National Laboratories Chemistry & Ceramics Dept. 1840 P.O. Box 5800 Abuquerque NM 87185
Bill Long Babcock & Wilcox P.O. Box 11165 Lynchburg VA 24506
L. A Lott EG&G Idaho, Inc. Idaho National Engineering Lab P.O. Box 1625 Idaho Falls ID 83415-2209
Raouf O. Loutfy MER Corporation 7960 S. Kolb Road Tucson AZ 85706
Lydia Luckevich Ortech International 2395 Speakman Drive Mississauga Ontario L5K 1B3 CANADA
James W. MacBeth Carborundum Company Structural Ceramics Division P.O. Box 1054 Niagara Falls NY 14302
George Maczura Auminum Company of America 3450 Park Lane Drive Pittsburgh PA 15275-1119
David Maginnis Tinker AFB OC-ALC/LURE Tinker AFB OK 73145-5989
Frank Maginnis Aspen Research, Inc. 220 Industrial Boulevard Moore OK 73160
Tai-il Mah Universal Energy Systems, Inc. 4401 Dayton-Xenia Road Dayton OH 45432
L. E. Mains Deco-Grande 4850 Coolidge Highway Royal Oak MI 48073-1023
Kenneth M. Maillar Barbour Stockwell Company 83 Linskey Way Cambridge MA 02142
S. G. Malghan NIST 1-270 & Clopper Road Gaithersburg MD 20899
Lars Malmrup United Turbine AB Box 13027 Malmo S-200 44 SWEDEN
John Mangels Ceradyne, Inc. 3169 Redhill Avenue Costa Mesa CA 92626

439
Murli Manghnani University of Hawaii 2525 Correa Road Honolulu HI 96822
Russell V. Mann Matec Applied Sciences, Inc. 75 South Street Hopkinton MA 01748
William R. Manning Champion Aviation Products Div P.O. Box 686 Liberty SC 29657
Ken Marnoch Amercom, Inc. 8928 Fullbright Avenue Chatsworth CA 91311
Robert A Marra Auminum Company of America Acoa Technical Center Acoa Center PA 15069
Steve C. Martin Advanced Refractory Technologies 699 Hertel Avenue Buffalo NY 14207
Kelly J. Mather William International Corp. 2280 W. Maple Road Walled Lake MI 48088
James P. Mathers 3M Company 3M Center, Bldg. 201-3N-06 St. Paul MN 55144
Ron Mayville Athur D. Little, Inc. 15-163 Acorn Park Cambridge MA 02140
F. N. Mazadarany General Electric Company Bldg. K-l, Room MB-159 P.O. Box 8 Schenectady NY 12301
James W. McCauley Afred University Binns-Merrill Hall Afred NY 14802
Colin F. McDonald McDonald Thermal Engineering 1730 Castellana Road La Jolla CA 92037
B. J. McEntire Norton Company 10 Arport Park Road East Granby CT 06026
Thomas D. McGee Iowa State University 110 Engineering Annex Ames IA 50011
James McLaughlin Sundstrand Power Systems 4400 Ruffin Road P.O. Box 85757 San Diego CA 92186-5757
Matt McMonigle U.S. Department of Energy Office of Industrial Technologies EE-234, Forrestal Building Washington DC 20585
J. C. McVickers AlliedSignal Engines P.O. Box 52180, MS:9317-2 Phoenix AZ 85072-2180

440
D. B. Meadowcroft "Jura," The Ridgeway Oxshott Leatherhead Suney KT22 OLG UNITED KINGDOM
Joseph J. Meindl Reynolds International, Inc. 6603 W. Broad Street P.O. Box 27002 Richmond VA 23261-7003
Michael D. Meiser AlliedSignal, Inc. Ceramic Components P.O. Box 2960, MS:T21 Torrance CA 90509-2960
George Messenger National Research Council of Canada Building M-7 Ottawa Ontario K1A OR6 CANADA
Arthur G. Metcalfe Arthur G. Metcalfe & Assoc. 2108 East 24th Street National City CA 91950
R. Metselaar Eindhoven University P.O. Box 513 Endhoven 5600 MB THE NETHERLANDS
David J. Michael Harbison-Walker Refractories P.O. Box 98037 Pittsburgh PA 15227
Ken Michaels Chrysler Motors Corporation P.O. Box 1118, CIMS:418-17-09 Detroit MI 48288
D. E. Miles Commission of the European
Community rue de la Loi 200 B-1049 Brussels BELGIUM
Carl E. Miller AC Rochester 1300 N. Dort Highway, MS:32-31 Flint MI 48556
Charles W. Miller, Jr. Harper International West Drullard Avenue Lancaster NY 14086-1698
R. Minimrni Enichem America 2000 Cornwall Road Monmouth Junction NJ 08852
Michele V. Mitchell AlliedSignal, Inc. Ceramic Components P.O. Box 2960, MS:T21 Tonance CA 90509-2960
Howard Mizuhara WESGO 477 Harbor Boulevard Belmont CA 94002
Helen Moeller Babcock & Wilcox P.O. Box 11165 Lynchburg VA 24506-1165
Francois R. Mollard Concurrent Technologies Corp. 1450 Scalp Avenue Johnstown PA 15904-3374
Phil Mooney Panametrics 221 Crescent Street Waltham MA 02254

441
Geoffrey P. Morris 3M Company 3M Traffic Control Materials Bldg. 209-BW-10, 3M Center St. Paul MN 55144-1000
Joel P. Moskowitz Ceradyne, Inc. 3169 Redhill Avenue Costa Mesa CA 92626
Brij Moudgil University of Florida Material Science & Engineering Gainesville FL 32611
Christoph J. Mueller Sprechsaal Publishing Group P.O. Box 2962, Mauer 2 D-8630 Coburg GERMANY
Thomas W. Mullan Vapor Technologies Inc. 345 Route 17 South Upper Saddle River NJ 07458
Theresa A Mursick-Meyer Norton Company SGNICC/NRDC Goddard Road Northboro MA 01532-1545
M. K. Murthy MkM Consultants International 10 Avoca Avenue, Unit 1906 Toronto Ontario M4T 2B7 CANADA
David L. Mustoe Custom Technical Ceramics 8041 W1-70 Service Rd. Unit 6 Arvada CO 80002
Curtis V. Nakaishi U.S. Department of Energy Morgantown Energy Tech. Ctr. P.O. Box 880 Morgantown WV 26507-0880
Yoshio Nakamura Faicera Research Institute 3-11-12 Misono Sagamihara, Tokyo JAPAN
K. S. Narasimhan Hoeganaes Corporation River Road Riverton NJ 08077
Robert Naum Applied Resources, Inc. P.O. Box 241 Pittsford NY 14534
Malcolm Naylor Cummins Engine Company, Inc. P.O. Box 3005, Mail Code 50183 Columbus IN 47202-3005
Dale E. Niesz Rutgers University Center for Ceramic Research P.O. Box 909 Piscataway NJ 08855-0909
Paul W. Niskanen Lanxide Corporation P.O. Box 6077 Newark DE 19714-6077.
David M. Nissley United Technologies Corporation Pratt & Whitney Aircraft 400 Main Street, MS:163-10 East Hartford CT 06108
Daniel Oblas 50 Meadowbrook Drive Bedford MA 01730

442
Don Ohanehi Magnetic Bearings, Inc. 1908 Sussex Road Blacksburg VA 24060
Hitoshi Ohmori ELID Team Itabashi Branch 1-7 13 Kaga Itabashi Tokyo 173 JAPAN
Vijay M. Parthasarathy Caterpillar/Solar Turbines 2200 Pacific Highway P.O. Box 85376 San Diego CA 92186-5376
Harmut Paschke Schott Glaswerke Christoph-Dorner-Strasse 29 D-8300 Landshut GERMANY
Robert Orenstein General Electric Company 55-112, River Road Schenectady NY 12345
Richard Palicka Cercom, Inc. 1960 Watson Way Vista CA 92083
Joseph N. Panzarino 379 Howard Street P. O. Box 652 Northboro MA 01532-1545
Pellegrino Papa Corning Inc. MP-WX-02-1 Corning NY 14831
Terry Paquet Boride Products Inc. 2879 Aero Park Drive Traverse City MI 49684
E. Beth Pardue MPC 8297 Williams Ferry Road Lenior City TN 37771
Soon C. Park 3M Corporate Research 3M Center, Bldg. 251-3B-13 St. Paul MN 55144-1000
Pandit G. Patil Department of Energy Ofc. of Transportation Technologies EE-32, Fonestal Bldg. Washington, DC 20585
James W. Patten Cummins Engine Company, Inc. P.O. Box 3005, Mail Code 50183 Columbus IN 47202-3005
Robert A Penty Penty & Associates 38 Oakdale Drive Rocester NY 14618
Robert W. Pepper Textron Specialty Materials 2 Industrial Avenue Lowell MA 01851
John J. Petrovic Los Aamos National Laboratory Group MST-4, MS:G771 Los Aamos NM 87545
Frederick S. Pettit University of Pittsburgh Pittsburgh PA 15261
Richard C. Phoenix Ohmtek, Inc. 2160 Liberty Drive Niagara Falls NY 14302
443
Bruce J. Pletka Michigan Technological Univ. Metallurgical & Materials Engr. Houghton MI 49931
John P. Pollinger AliedSignal, Inc. Ceramic Components P.O. Box 2960, MS:T21 Torrance CA 90509-2960
P. Popper High Tech Ceramics Int. Journal 22 Pembroke Drive - Westlands Newcastle-under-Lyme Staffs ST5 2JN ENGLAND
F. Porz Universitat Karlsruhe Institut fur Keramik Im Maschinendau Postfach 6980 D-76128 Karlsruhe GERMANY
Harry L. Potma Royal Netherlands Embassy Science and Technology 4200 Linnean Avenue, N.W. Washington DC 20008
Bob R. Powell General Motors Corporation Metallurgy Department Box 9055 Warren MI 48090-9055
Stephen C. Pred Biesterfeld U.S., Inc. 500 Fifth Avenue New York NY 10110
Karl M. Prewo United Technologies Res. Ctr. 411 Silver Lane, MS:24 East Hartford CT 06108
Vimal K. Pujari Norton Company SGNICC/NRDC Goddard Road Northboro MA 01532-1545
Fred Quan Corning Inc. Sullivan Park, FR-02-08 Corning NY 14831
George Quinn NIST Quince Orchard & Clopper Road Ceramics Division, Bldg. 223 Gaithersburg MD 20899
Ramas V. Raman Ceracon, Inc. 1101 N. Market Blvd., Suite 9 Sacramento CA 95834
Charles F. Rapp Owens Corning Fiberglass 2790 Columbus Road Granville OH 43023-1200
Dennis W. Readey Colorado School of Mines Metallurgy and Materials Engr. Golden CO 80401
Wilfred J. Rebello PAR Enterprises, Inc. 12601 Clifton Hunt Lane Clifton VA 22024
Harold Rechter Chicago Fire Brick Company 7531 S. Ashland Avenue Chicago EL 60620
Robert R. Reeber U.S. Army Research Office P.O. Box 12211 Research Triangle Park NC
27709-2211

444
K. L. Reifsnider VPI&SU Engineering Science and Mechanics Blacksburg VA 24061
Paul E. Rempes McDonnell Douglass Aircraft Co. P.O. Box 516, Mail Code:0642263 St. Louis MO 63166-0516
Gopal S. Revankar John Deere Company 3300 River Drive Moline IL 61265
K Y . R h e e Rutgers University P.O. Box 909 Piscataway NJ 08854
Roy W. Rice W. R. Grace and Company 7379 Route 32 Columbia MD 21044
David W. Richerson 2093 E. Delmont Drive Salt Lake City UT 84117
Tomas Richter J. H. France Refractories 1944 Clarence Road Snow Shoe PA 16874
Michel Rigaud Ecole Polytechnique Campus Universite De Montreal P.O. Box 6079, Station A Montreal, P.Q. Quebec H3C 3A7 CANADA
John E. Ritter University of Massachusetts Mechanical Engineering Department Amherst MA 01003
W. Eric Roberts Advanced Ceramic Technology 990 "F Enterprise Street Orange CA 92667
Y. G. Roman TNO TPD Keramick P.O. Box 595 Einhoven 5600 AN HOLLAND
Michael Rossetti Arthur D. Little, Inc. 15 Acorn Park Cambridge MA 01240
Barry Rossing Lanxide Corporation P.O. Box 6077 Newark DE 19714-6077
Steven L. Rotz Lubrizol Corporation 29400 Lakeland Boulevard Wickliffe OH 44092
Robert Ruh Wright Laboratory WL/MLLM Wright-Patterson AFB OH 45433
Robert J. Russell Riverdale Consulting, Inc. 24 Micah Hamlin Road Centerville MA 02632-2107
Jon A Salem NASA Lewis Research Center 21000 Brookpark Road Cleveland OH 44135
J. Sankar North Carolina A&T State Univ. Dept. of Mechanical Engineering Greensboro NC 27406

Yasushi Sato NGK Spark Plugs (U.S.A), Inc. 1200 Business Center Dr., #300 Mt. Prospect IL 60056
Maxine L. Savitz AliedSignal, Inc. Ceramic Components P.O. Box 2960, MS:T21 Torrance CA 90509-2960
Ashok Saxena GTRI Materials Engineering Atlanta GA 30332-0245
David W. Scanlon Instron Corporation 100 Royall Street Canton MA 02021
Charles A Schacht Schacht Consulting Services 12 Holland Road Pittsburgh PA 15235
Robert E. Schafrik Natl Materials Advisory Board 2101 Constitution Ave., N.W. Washington DC 20418
James Schienle AliedSignal Engines P.O. Box 52180, MS:1302-2P Phoenix AZ 85072-2180
Gary Schnittgrund PyroPacific Processes 16401 Knollwood Drive Granada Hills, CA 91344
Mark Schomp Lonza, Inc. 17-17 Route 208 Fair Lann NJ 07410
Joop Schoonman Delft University of Technology P.O. Box 5045 2600 GA Delft THE NETHERLANDS
Robert B. Schulz U.S. Department of Energy Office of Transportation Technologies EE-33, Fonestal Building Washington DC 20585
Murray A Schwartz Materials Technology Consulting 30 Orchard Way, North Potomac MD 20854
Peter Schwarzkopf SRI International 333 Ravenswood Avenue Menlo Park CA 94025
William T. Schwessinger Multi-Ac Scientific Coatings 1064 Chicago Road Troy MI 48083-4297
W. D. Scott University of Washington Materials Science Department Mail Stop:FB10 Seattle WA 98195
Nancy Scoville Thermo Electron Technologies P.O. Box 9046 Waltham MA 02254-9046
Thomas M. Sebestyen U.S. Department of Energy Office of Transportation Technologies EE-32, Forrestal Building Washington DC 20585

446
T. B. Selover AICRE/DIPPR 3575 Traver Road Shaker Heights OH 44122
Charles E. Semler Semler Materials Services 4160 Mumford Court Columbus OH 43220
Thomas Service Service Engineering Laboratory 324 Wells Street Greenfield MA 01301
Kish Seth Ethyl Corporation P.O. Box 341 Baton Rouge LA 70821
William J. Shack Agonne National Laboratory 9700 S. Cass Avenue, Bldg. 212 Agonne IL 60439
Richard K. Shaltens NASA Lewis Research Center 21000 Brookpark Road, MS:302-2 Cleveland OH 44135
Robert S. Shane 1904 NW 22nd Street Stuart FL 34994-9270
Ravi Shankar Chromalloy Research and Technology Blaisdell Road Orangeburg NY 10962
Terence Sheehan Apex Wheel Company 727 Berkley Street New Milford NJ 07646
Dinesh K. Shetty University of Utah Materials Science and Engineering Salt Lake City UT 84112
Masahide Shimizu New Ceramics Association Shirasagi 2-13-1-208, Nakano-ku Tokyo, 165 JAPAN
Thomas Shreves American Ceramic Society, Inc. 735 Ceramic Place Westerville OH 43081-8720
Johann Siebels Volkswagen AG Werkstofftechnologie Postfach 3180 Wolfsburg 1 GERMANY
George H. Siegel Point North Asociates, Inc. P.O. Box 907 Madison NJ 07940
Richard Silberglitt FM Technologies, Inc. 10529-B Braddock Road Fairfax VA 22032
Mary Silverberg Norton Company SGNICC/NRDC Goddard Road Northboro MA 01532-1545
Gurpreet Singh U.S. Department of Energy Office of Transportation Technologies EE-33, Fonestal Building Washington DC 28505

447
Maurice J. Sinnott University of Michigan 51061ST Building Ann Abor MI 48109-2099
John Skildum 3M Company 3M Center Building 224-2S-25 St. Paul MN 55144
Richard H. Smoak Smoak & Associates 3554 Hollyslope Road Atadena CA 91001-3923
Jay R. Smyth AliedSignal Engines 111 S. 34th Street, MS:503-412 Phoenix AZ 85034
Rafal A Sobotowski British Petroleum Company Technical Center, Broadway 3092 Broadway Avenue Cleveland OH 44115
S. Somiya Nishi Tokyo University 3-7-19 Seijo, Setagaya Tokyo, 157 JAPAN
Boyd W. Sorenson DuPont Lanxide Composites 1300 Marrows Road Newark DE 19711
Charles A Sorrell U.S. Department of Energy Office of Industrial Technologies EE-232, Forrestal Building Washington DC 20585
C. Spencer EA Technology Capenhurst Chester CHI 6ES UNITED KINGDOM
Alen Spizzo Hercules Inc. Hercules Plaza Wilmington DE 19894
Richard M. Spriggs Alfred University Ctr. for Advanced Ceramic Tech. Alfred NY 14802
Charles Spuckler NASA Lewis Research Center 21000 Brookpark Road, MS:5-11 Cleveland OH 44135-3191
Gordon L. Starr Curnrnins Engine Company, Inc. P.O. Box 3005, Mail Code:50182 Columbus IN 47202-3005
Tom Stillwagon AlliedSignal, Inc. Ceramic Components P.O. Box 2960, MS:T21 Torrance CA 90509-2960
H. M. Stoller TPLInc. 3754 Hawkins, N.E. Abuquerque NM 87109
Paul D. Stone Dow Chemical USA 1776 "Eye" Street, N.W., #575 Washington DC 20006
F. W. Stringer Aero & Industrial Technology P.O. Box 46, Wood Top Burnley Lancashire BB11 4BX UNITED KINGDOM

448
Thomas N. Strom NASA Lewis Research Center 21000 Brookpark Road, MS:86-6 Cleveland OH 44135
M. F. Stroosnijder Institute for Advanced Materials Joint Research Centre 21020 Ispra (VA) ITALY
Karsten Styhr 30604 Ganado Drive Rancho Palos Verdes CA 90274
T. S. Sudarshan Materials Modification, Inc. 2929-P1 Eskridge Center Fairfax VA 22031
M. J. Sundaresan University of Miami P.O. Box 248294 Coral Gables FL 33124
Patrick L. Sutton U.S. Department of Energy Office of Transportation Technologies EE-32, Forrestal Building Washington DC 20585
Willard H. Sutton United Technologies Cbrporation Silver Lane, MS:24 East Hartford CT 06108
Robert E. Swanson Metalworking Technology, Inc. 1450 Scalp Avenue Johnstown PA 15904
Yo Tajima NGK Spark Plug Company 2808 Iwasaki Komaki-shi Achi-ken, 485 JAPAN
Fred Teeter 5 Tralee Terrace East Amherst NY 14051
Victor J. Tennery 113 Newell Lane Oak Ridge TN 37830
David F. Thompson Corning Glass Works SP-DV-02-1 Corning NY 14831
T. Y. Tien University of Michigan Materials Science & Engineering Dow Building Ann Abor MI 48103
D. M. Tracey Norton Company SGNICC/NRDC Goddard Road Northboro MA 01532-1545
Marc Tricard Norton Company, WGTC 1 New Bond Street, MS-413-201 Worcester MA 01615-0008
L. J. Trostel, Jr. Box 199 Princeton MA 01541
W. T. Tucker General Electric Company P.O. Box 8, Bldg. K1-4C35 Schenectady NY 12301
Masanori Ueki Nippon Steel Corporation 1618 Ida Nakahara-Ku Kawasaki, 211 JAPAN
449
Filippo M. Ugolini ATA Studio Via Degli Scipioni, 268A ROMA 00192 ITALY
Donald L. Vaccari Alison Gas Turbines P.O. Box 420, Speed Code S49 Indianapolis IN 46206-0420
Carl F. Van Conant Boride Products, Inc. 2879 Aero Park Drive Traverse City MI 49684
John F. Vander Louw 3M Company 3M Center, Bldg. 60-1N-01 Saint Paul MN 55144
Marcel H. Van De Voorde Commission of the European Community P.O. Box 2 1755 ZG Petten THE NETHERLANDS
O. Van Der Biest Katholieke Universiteit Leuven Dept. Metaalkunde en Toegepaste de Croylaan 2 B-3030 Leuven BELGIUM
Michael Vannier Washington University,
St. Louis 510 S. Kings Highway St. Louis MO 63110
Stan Venkatesan Southern Coke & Coal Corp. P.O. Box 52383 Knoxville TN 37950
V. Venkateswaran Carborundum Company Niagara Falls R&D Center P.O. Box 832 Niagara Falls NY 14302
Theodore Vojnovich U.S. Department of Energy Laboratory Technology Applications ER-32, Forrestal Bldg. Washington DC 20585
John B. Wachtman Rutgers University P.O. Box 909 Piscataway NJ 08855
Shigetaka Wada Toyota Central Research Labs Nagakute Achi, 480-11 JAPAN
Janet Wade AliedSignal Engines P.O. Box 52180, MS:1303-2 Phoenix AZ 85072-2180
Richard L. Wagner Ceramic Technologies, Inc. 537 Turtle Creek South Dr. Indianapolis IN 46227
J. Bruce Wagner, Jr. Arizona State University Center for Solid State Science Tempe AZ 85287-1704
Daniel J. Wahlen Kohler, Co. 444 Highland Drive Kohler WI 53044
Ingrid Wahlgren Royal Institute of Technology Studsvik Library S-611 82 Nykoping SWEDEN

450
Ronald H. Walecki AliedSignal, Inc. Ceramic Components P.O. Box 2960, MS:T21 Tonance CA 90509-2960
Michael S. Walsh Vapor Technologies Inc. 6300 Gunpark Drive Boulder CO 80301
Chien-Min Wang Industrial Technology Research Institute 195 Chung-Hsing Road, Sec. 4 Chutung Hsinchu 31015 R.O.C. TAIWAN
Robert M. Washburn ASMT 11203 Colima Road Whittier CA 90604
Kevin Webber Toyota Technical Center, U.S.A 1410 Woodridge, RR7 Ann Abor MI 48105
James K. Weddell Du Pont Lanxide Composites Inc. P.O. Box 6100 Newark DE 19714-6100
R. W. Weeks Agonne National Laboratory MCT-212 9700 S. Cass Avenue Agonne IL 60439
Ludwig Weiler ASEA Brown Boveri AG Eppelheimer Str. 82 D-6900 Heidelberg GERMANY
James Wessel 127 Westview Lane Oak Ridge TN 37830
Robert D. West Therm Advanced Ceramics P.O. Box 220 Ithaca NY 14851
Thomas J. Whalen 1845 Cypress Pointe Court Ann Abor MI 48108
Ian A White Hoeganaes Corporation River Road Riverton NJ 08077
Sheldon M. Wiederhorn NIST Building 223, Room A329 Gaithersburg MD 20899
John F. Wight Afred University McMahon Building Afred NY 14802
D. S. Wilkinson McMaster University 1280 Main Street, West Hamilton Ontario L8S 4L7 CANADA
James C. Williams General Electric Company Engineering Materials Tech. One Neumann Way, Mail Drop:H85 Cincinnati OH 45215-6301
Steve J. Williams RCG Hagler Bailly, Inc. 1530 Wilson Blvd., Suite 900 Alington VA 22209-2406

451
Thomas A Williams National Renewable Energy Lab 1617 Cole Boulevard Golden CO 80401
Craig A Willkens Norton Company SGNICC/NRDC Goddard Road Northboro MA 01532-1545
Roger R. Wills Ohio Aerospace Institute (OAI) 22800 Cedar Point Road Brook Park OH 44142
David Gordon Wilson Massachusetts Institute of Technology 77 Massachusetts Ave., Rm 3-455 Cambridge MA 02139
J. M. Wimmer AliedSignal Ceramic Components Department 27000, MS:T21 2525 W. 190th Street Torrance CA 90509
Matthew F. Winkler Seaworthy Systems, Inc. P.O. Box 965 Essex CT 06426
Gerhard Winter Hermann C. Starck Berlin GmbH P.O. Box 25 40 D-3380 Goslar 3380 GERMANY
Thomas J. Wissing Eaton Corporation Engineering and Research Center P.O. Box 766 Southfield MI 48037
James C. Withers MER Corporation 7960 S. Kolb Road Building F Tucson AZ 85706
Dale E. Wittmer Southern Illinois University Mechanical Engineering Dept. Carbondale EL 62901
Warren W. Wolf Owens Corning Fiberglass 2790 Columbus Road, Route 16 Granville OH 43023
Egon E. Wolff Caterpillar Inc. Technical Center P.O. Box 1875 Peoria IL 61656-1875
George W. Wolter Howmet Turbine Components Corp. Technical Center 699 Benston Road Whitehall MI 49461
Wayne L. Worrell University of Pennsylvania 3231 Walnut Street Philadelphia PA 19104
John F. Wosinski Corning Inc. ME-2 E-5 H8 Corning NY 14830
Ruth Wroe ERDC Capenhurst Chester CHI 6ES ENGLAND
Bernard J. Wrona Advanced Composite Materials 1525 S. Buncombe Road Greer SC 29651

452
Carl C. M. Wu Naval Research Laboratory Ceramic Branch, Code 6373 Washington DC 20375
David C. Wu AlliedSignal Engines P.O. Box 52181, MS:301-227 Phoenix AZ 85072-2181
John C. Wurst U. of Dayton Research Institute 300 College Park Dayton OH 45469-0101
Neil Wyant ARCH Development Corp. 9700 S. Cass Avenue, Bldg. 202 Agonne EL 60439
Roy Yamamoto Texaco Inc. P.O. Box 509 Beacon NY 12508-0509
John Yamanis AliedSignal Aerospace Company P.O. Box 1021 Morristown NJ 07962-1021
Harry C. Yeh AlliedSignal, Inc. Ceramic Components P.O. Box 2960, MS:T21 Tonance CA 90509-2960
Hiroshi Yokoyama Hitachi Research Lab 4026 Kuji-Cho Hitachi-shi Ibaraki 319-12 JAPAN
Thomas M. Yonushonis Cummins Engine Company, Inc. P.O. Box 3005, Mail Code 50183 Columbus IN 47202-3005
Jong Yung Sundstrand Aviation Operations 4747 Harrison Avenue Rockford EL 61125
A L. Zadoks Caterpillar Inc. Technical Center, Building L P.O. Box 1875 Peoria EL 61656-1875
Avi Zangvil University of Illinois 104 S. Goodwin Avenue Urbana IL 61801
Charles H. Zenuk Transtech 6662 E. Paseo San Andres Tucson AZ 85710-2106
Zhenqi Zhu University of Connecticut Precision Manufacturing Center Storrs, CT 06269-5119
Carl Zweben General Electric Company P. O Box 8555, VFSC/V4019 Philadelphia PA 19101
Department of Energy Oak Ridge Operations Office Assistant Manager for Energy
Research and Development P. O. Box 2001 Oak Ridge TN 37831-8600
Department of Energy (2) Office of Scientific and Technical
Information Office of Information Services P. O. Box 62 Oak Ridge TN 37831

453
For distribution by microfiche as shown in DOE/OSTI-4500, Distribution Category UC-332 (Ceramics/Advanced Materials).