37cI - UNT Digital Library
131
37cI N9/ No, G6/3 A CONCURRENT VALIDATION STUDY OF A PAPER AND PENCIL TEST BATTERY FOR A SALES POSITION THESIS Presented to the Graduate Council of the University of North Texas in Partial Fulfillment of the Requirements For the Degree of MASTER OF SCIENCE By Deedra Kim Irons, B.S. Denton, Texas May, 1990
-
Upload
khangminh22 -
Category
Documents
-
view
0 -
download
0
Transcript of 37cI - UNT Digital Library

37cIN9/
No, G6/3
A CONCURRENT VALIDATION STUDY OF A PAPER AND PENCIL
TEST BATTERY FOR A SALES POSITION
THESIS
Presented to the Graduate Council of the
University of North Texas in Partial
Fulfillment of the Requirements
For the Degree of
MASTER OF SCIENCE
By
Deedra Kim Irons, B.S.
Denton, Texas
May, 1990

Irons, Deedra Kim, A Concurrent Validation Study of a
Paper and Pencil Test Battery for a Sales Position. Master
of Science (Industrial/Organizational Psychology), May,
1990, 126 pp., 15 tables, 10 figures, bibliography, 71
titles.
Participating in this study were 251 decorator
consultants. The decorator consultant position is a direct
sales position. The primary objective of this study was to
demonstrate that a relationship existed between decorators'
selection test scores and their job performance. The SRA
Verbal Form, the EAS Numerical Ability Test, the EAS Space
Visualization Test, and the Sales Attitude Checklist were
evaluated as potential selection tests. Behavioral criteria
and managerial ratings were used to assess job performance.
Correlational analyses revealed that all the tests but the
SRA Verbal Form were significantly correlated with two or
more criteria.

TABLE OF CONTENTS
PageList of Tables . . . . . . . . . . . . . . . . . . . . iv
List of Figures . . . . . . . . . . . . . . . . . . . v
Chapter
I. INTRODUCTION . . . . . . . . . . . . . . . . . . . . 1
Test ClassificationsPersonality TestsTests of Intellectual AbilitiesTests of Spatial and Mechanical AbilitiesTests of Perceptual AccuracyTests of Motor Abilities
Alternative MethodsBiographical InformationInterviewsPeer EvaluationsSelf-AssessmentsProjective TechniquesGraphologyAssessment Centers
Statement of Hypotheses
II. METHOD . . . . . . . . . . . . . . . . . . . . . . 41
SubjectsIncumbent PopulationJob Analysis SampleField Testing SampleExperimental Design
Predictor and Criterion DevelopmentPredictorsCriteriaProcedure
III. RESULTS . . . . . . . . . . . . . . . . . . . . . 58
IV. DISCUSSION . . . . . . . . . . . . . . . . . . . . 68
APPENDICES . . . . . . . . . . . . . . . . . . . . . . 77
REFERENCES . . . . . . . . . . . . . . . . . . . . . . 118
iii

LIST OF TABLES
Table Page
1. Ghiselli's (1966) Validity Coefficients forSales Occupations . . . . . . . . . . . . . . . . 5
2. Ghiselli's (1973) Validity Coefficients forSales Clerks versus Salesmen . . . . . . . . . . 14
3. Hunter & Hunter (1984) Mean Validities ofVarious Predictors for Entry-level Positions . . 15
4. Descriptive Statistics for the Predictorsand the Criteria . . . . . . . . . . . . . . . . 59
5. Pearson Product-Moment Correlations between theTest Battery and Job Performance Measures . . . 60
6. Intercorrelations of the Experimental Tests . . 62
7. Correlation Matrix of the Criterion Measures . . 63
8. Descriptive Statistics for Each Test by Age . . 64
9. Mean Score Differences in Z-Score Unitsbetween Decorators Under 40 Years of Ageand Those Over 40 Years of Age . . . . . . . . . 65
10. Correlation of Job Tenure with Test Scores . . . 66
C-il. Numerical Ability Table . . . . . . . . . . . . 88
C-12. Space Visualization Table . . . . . . . . . . . 90
E-13. Task Statements with Incumbent Ratings . . . . . 96
G-14. Task-Dimension Matrix . . . . . . . . . . . . . 115
H-15. Descriptive Statistics for Similar Populations . 117
iv

LIST OF FIGURES
Figure Page
1. Relationship between Sales Attitude Test Scoresand Average Sales Volume . . . . . . . . . . . . . 101
2. Relationship between Sales Attitude Test Scoresand Managers' Ratings of Sales Ability . . . . . . 102
3. Relationship between Sales Attitude Test Scoresand Managers' Ratings of Customer Service . . . . 103
4. Relationship between Sales Attitude Test Scoresand Managers' Ratings of Administrative Duties . . 104
5. Relationship between Sales Attitude Test Scoresand Overall Ratings . . . . . . . . . . . . . . . 105
6. Relationship between Numerical Ability andManagers' Ratings of Administrative Duties . . . . 106
7. Relationship between Numerical Ability andOverall Ratings . . . . . . . . . . . . . . . . . 107
8. Relationship between Spatial Ability and Managers'Ratings of Ability to Design & Price Treatments . 108
9. Relationship between Spatial Ability andManagers' Ratings of Administrative Duties . . . . 109
10. Relationship between Spatial Ability andOverall Ratings .................... ........ 110
v

CHAPTER I
INTRODUCTION
The selection of sales personnel has a rich history.
In the first validation studies reported, salespeople were
used as subjects. In 1916, Munsterberg administered a paper
and pencil test battery, which included cognitive and
perceptual tests, to 450 subjects, 95 of which were in sales
positions. He attempted to correlate test scores to
vocational aptitude. His results demonstrated that a paper
and pencil test, the arrangement of letters, consistently
differentiated salesmanship ability (Burtt, 1917). Another
historical study using salespeople was conducted by Oschrin
in 1918. In this study, a paper and pencil test battery was
given to 18 saleswomen in a large department store.
Oschrin's (1918) results led her to the conclusion that "the
type of sales ability called for in a retail department
store is a fairly measurable function in terms of mental
tests, with which it shows a definite tendency to correlate
positively" (p. 154) .
Sales oriented selection research continued throughout
the 1920's and 1930's, mainly using stock and insurance
salesmen as subjects. Freyd (1926) tested 31 stock salesmen
1
2
using 21 tests in an attempt to differentiate successful
from unsuccessful salesmen. Many different types of
instruments were used in this study; a job knowledge test, a
personality test, a general intelligence test, handwriting
analysis, and biographical information. Sales records were
used to measure success. Only eight of the 21 tests were
able to significantly differentiate successful from
unsuccessful salesmen. Instruments that proved to be
invalid included matching sentences with facial expressions
and a comparison of the length of two statements, one
written right-handed and one written left-handed. Valid
instruments included; an objections to purchasing test (r =
.41), the Will-Temperament test (r = .49), a business
information test (r = .46), the number of impulsive lines in
an applicant's signature, and five biographical questions.
In the insurance industry, Bills (1941) used the Strong
Vocational Interest Blank (SVIB), the Bernreuter Personality
Inventory, and a personal history blank in an attempt to
differentiate successful agents from unsuccessful agents.
The use of the SVIB resulted in a "fair prediction of
whether the man would remain in the business and some
differentiation in production, while combined with the
personal history blank it gives a much more definite
prediction of production if the person remains with the
company" (Bills, 1941, p. 10).
3
Selection research concerning sales has continued using
a number of the instruments employed in these early studies
as well as others, in an attempt to identify valid
predictors of sales performance. The identification of
valid predictors of sales performance has not been an easy
task as demonstrated by recent meta-analyses. Schmitt,
Gooding, Noe and Kirsch (1984) conducted a meta-analysis of
validation studies published between 1964 and 1982 in both
the Journal of Applied Psychology and Personnel Psychology.
The mean correlation of 50 validities, of various predictors
with job performance in a sales position, was found to be
.17. Similar results were generated in a more extensive
review and meta-analysis by Churchill, Ford, Harley, and
Walker (1985). Their study incorporated both published and
unpublished studies for the years 1918 to 1982. A mean
correlation across 1653 validities of various predictors
with sales performance was found to be .19. These
correlations are discouraging, yet they resulted from a
combination of studies which employed numerous different
types of predictors and criteria. Average validities
obtained from using numerous predictors within a single
occupational category do not reveal the real practical
value, the predictive power, of each individual predictor.
Thus, if the results of using a specific type of predictor
were reviewed, the correlations may be somewhat more
encouraging as well as more insightful.

4
Ghiselli (1966) attempted to do just this, he reviewed
extensively the validity of occupational aptitude tests in
numerous occupational categories as classified by the
Dictionary of Occupational Titles (DOT). He reviewed
several sources of information; published literature between
1919 to 1964, test manuals and technical reports, and
unpublished literature from business and governmental
organizations. Ghiselli classified tests into five types;
(a) intellectual ability, (b) spatial and mechanical
ability, (c) perceptual accuracy, (d) motor ability, and (e)
personality tests. Ghiselli was only able to obtain
information concerning the validity of tests for six out of
the fifteen DOT sales classifications. The six
classifications were as follows: (a) salesmen, insurance
(1-57); (b) salesmen, stock & bond (1-65); (c) salesclerks
(1-70); (d) salespersons (1-75); (e) salesmen to consumers
(1-80); (f) salesmen & sales agents except to consumers
(1-85 to -87). The correlations which were found between
the different types of tests and measures of job proficiency
are given in Table 1.
Ghiselli was unable to find any information on the
validity of tests of motor abilities for sales occupations,
thus tests of motor abilities are not included in Table 1.
However, a great deal of information concerning the validity
of personality tests for sales occupations was found. From
5
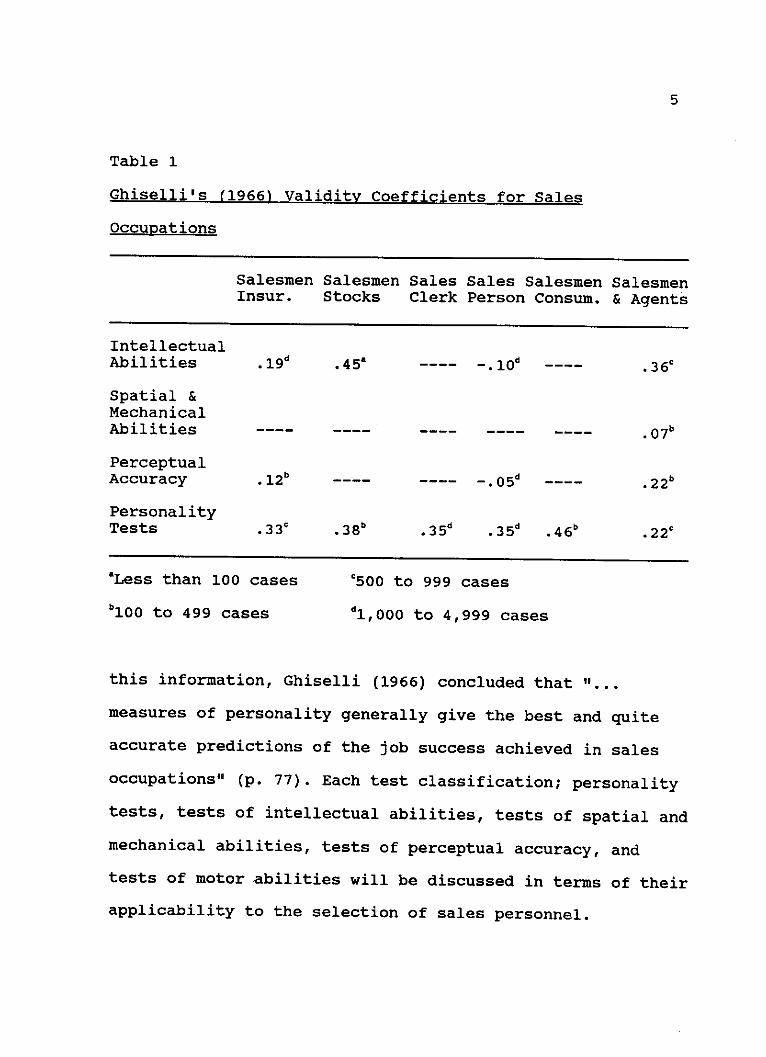
Table 1
Ghiselli's (1966) Validity Coefficients for Sales
Occupations
SalesmenInsur.
IntellectualAbilities
Spatial &MechanicalAbilities
PerceptualAccuracy
PersonalityTests
.12b
.33
Salesmen Sales Sales Salesmen SalesmenStocks Clerk Person Consum. & Agents
.45a
.35d .46b
. 36
.22
aLess than 100 cases
b 1 00 to 499 cases
500 to 999 cases
d1,000 to 4,999 cases
this information, Ghiselli (1966) concluded that ".. .
measures of personality generally give the best and quite
accurate predictions of the job success achieved in sales
occupations" (p. 77). Each test classification; personality
tests, tests of intellectual abilities, tests of spatial and
mechanical abilities, tests of perceptual accuracy, and
tests of motor abilities will be discussed in terms of their
applicability to the selection of sales personnel.
I I I MIIlls
6
Test Classifications
Personality tests. Personality tests have been widely
used to predict sales success. A number of studies that
employed personality tests will be reviewed. The Minnesota
Multiphasic Personality Inventory (MMPI) was given to 182
sales representatives in an attempt to demonstrate its
validity as a predictor of sales performance (Ruch & Ruch,
1967). Ruch and Ruch proposed that the MMPI had predictive
power because it could be faked. They hypothesized that
good salesmen know what the job demands personality-wise and
thus can "put their best foot forward" when completing the
inventory. However, they proposed that the MMPI as well as
other personality instruments have correction factors that
act as suppressor variables when attempting to predict sales
success. Five scales without the K correction significantly
differentiated between good and poor salesmen. The
significant scales were as follows: (a) hypochondriasis, (b)
psychopathic deviate, (c) psychasthenia, (d) schizophrenia,
and (e) hypomania. When the K correction was applied the
validity for all five scales decreased. This decrease in
validity was statistically significant for three of the
scales and approached significance for one scale. The
decrease in validity for the fifth scale was not
statistically significant.
7
Personality tests were also used as a predictor of
sales performance by Lamont and Lundstrom (1977). They
conducted a concurrent validation study using multiple
predictors and criterion. The predictors included measures
of the personality traits: dominance, endurance, social
recognition, empathy, and ego strength; and the personal
characteristics: age, height, weight, formal education,
outside activities, and civic/professional organizations.
The personality traits were assessed using scales from
Jackson's Personality Research Form (PRF), Cattell's 16
Personality Factors (16PF), and Hogan's Personality
Inventory. The criteria employed were managerial ratings,
measures of sales compensation including commissions and
incentive earnings, and measures of sales activity including
sales quota, new business conversion, and call frequency.
The personality variables of endurance, empathy, and ego
strength were effective in predicting managerial ratings,
whereas the personal characteristics were effective in
predicting sales compensation and sales activity.
Deb (1983) compared the scores of 50 successful
salespeople to 300 non-salespeople on the Bernreuter
Personality Inventory and the Strong Vocational Interest
Blank. The subjects were matched on age, education, and
service experience. This comparison revealed that
salespeople were more likely to be extraverted, dominant,
8
well-adjusted, sociable, self-confident, and cheerful than
non-salespeople.
Another study using measures of personality to predict
sales success was conducted using 355 life insurance agents
(Matteson, Ivancevich, & Smith, 1984). A relationship
between type A behavior and sales performance was sought.
The performance measures used were policy amount, premium
income, and total policies. Type A behavior was not
significantly related to any of the performance measures
used (Matteson et al., 1984).
Merenda and Jacob (1987) did a study comparing 245
salespersons' self-concept profiles to a sales position job
profile. Each salesperson had completed the Activity Vector
Analysis (AVA) prior to being hired. Of the 245 subjects,
125 were still employed at the end of the calendar year and
their profile compatibility was compared to their sales
figures. The other 120 subjects had been terminated within
the calendar year, so their profile compatibility was
compared to their length of service. Higher compatibility
coefficients were associated with higher sales in the
employed group and with longer tenure in the terminated
group.
Frautschi (1987) also attempted to predict sales
success using a personality test, the California Personality
Inventory (CPI). The CPI scores of 20 home improvement
9
representatives were correlated with net and gross closing
ratios. None of the CPI scales differentiated between good
and poor representatives using gross closing ratio as the
measure of sales performance. But, when using net closing
ratio as the measure of sales performance, three scales;
responsibility, intellectual-efficiency, and psychological-
mindedness were able to differentiate successful from
unsuccessful home improvement representatives. However,
these results did not replicate the findings of an earlier
pilot study.
Hollenbeck, Brief, Whitener, and Pauli (1988) conducted
a study concerning the interaction of personality and
aptitude tests in selecting life insurance salespersons.
Self-esteem and locus of control were assessed using the
Janis-Field Feelings of Inadequacy Scale and the Rotter
Locus of Control Scale. Aptitude was measured with the
Aptitude Index Battery (AIB). The AIB measures an
individual's aptitude for life insurance sales. The self-
esteem/aptitude interaction was statistically significant
(R2 = .18, p < .05). The locus of control/aptitude
interaction was not significant. The results indicated that
self-esteem is a more efficient predictor of sales
performance when interactively combined with a measure of
aptitude.

10
In summary, as a predictor of sales success personality
tests have been and continue to be widely used, as is
evident by the number of studies present in the literature.
Ghiselli's (1966, 1973) reviews of the literature have
demonstrated that personality tests are a valid means of
predicting sales success. However, the applicability of
personality test results are called into to question because
follow-up studies often do not replicate earlier findings,
as was seen in the Frautschi (1987) study.
Another criticism of the use of personality tests for
selection is that test scores equate the absence of
psychopathology with the presence of competence. However,
this assertion has been weakened by the development of
personality measures designed specifically for
"nonpathological" individuals and selection purposes such as
the Guilford-Zimmerman Temperament Survey and the Sales
Attitude Checklist.
Tests of intellectual abilities. Tests of intellectual
abilities have also been employed to select salespeople.
Tests of intellectual abilities include tests of
intelligence, memory, substitution, and arithmetic. Schultz
(1935) tested 556 life insurance salesmen using tests of
intellectual abilities, personality tests, and biographical
information. If the agents had been hired based on their
personality and intelligence test scores, 70% of the agents
11
with the best production records would have been chosen, and
70% of the agents with the poorest production records would
not have been hired. The use of the intelligence tests in
addition to the personality tests helped eliminate more poor
agents such as those who would not succeed in training.
Using biographical information did not show any appreciable
effect.
Miner (1962) tested 65 salesmen of a petroleum company
using tests of intellectual abilities, tests of spatial and
mechanical abilities, and personality tests. Objective
criteria were developed using sales figures. After cross
validation, two tests were able to significantly
differentiate good salesmen from poor salesmen, the Wechsler
Adult Intelligence Scale (WAIS) arithmetic subtest and the
Tomkins-Horn Picture Arrangement Test (PAT). The WAIS
arithmetic subtest, a test of intellectual ability, yielded
uncorrected correlations between .23 and .35 with the
performance measures employed. The PAT, a personality test,
yielded uncorrected correlations between .31 and .51 with
the performance measures.
In Ghiselli's (1966) review of the literature, he found
divergent validity coefficients for various sales
occupations, ranging from -.10 for salespersons to .45 for
salesmen of stocks and bonds, when tests of intellectual
abilities were used to predict sales performance. When the
12
lower sales occupations (sales clerks) were grouped together
and the higher sales occupations (salesmen) were grouped
together, Ghiselli (1973) found tests of intellectual
abilities correlated -.03 for sales clerks and .33 for
salesmen. Each type of test of intellectual ability
correlated negatively for sales clerks, except for
arithmetic tests which correlated .10 (Ghiselli, 1973).
As a predictor of sales performance, tests of intellectual
abilities have demonstrated validity for the higher sales
occupations such as technical and industrial salespeople;
however, these tests have not demonstrated validity for the
lower sales occupations such as sales clerks.
Tests of spatial and mechanical abilities. Another
type of test used to select salespeople is tests of spatial
and mechanical abilities. Tests of spatial and mechanical
abilities include tests of spatial relations, location, and
mechanical principals. Miner (1962) tested 65 petroleum
salesmen using the Survey of Mechanical Insight. A
correlation less than .20 was obtained between this test and
each criterion, thus this test was not included in the cross
validation study. Ghiselli (1973) states that tests of
spatial and mechanical abilities are valid means of
selection of both sales clerks and salesmen. However,
Ghiselli (1966, 1973) did not find a study involving sales
clerks which utilized a test of mechanical ability. Thus,

13
it would be more precise to state that tests of spatial
abilities are a valid means of prediction for sales clerks
and tests of spatial and mechanical abilities are valid
means of prediction for salesmen.
Tests of perceptual accuracy. Tests of perceptual
accuracy have been used to select sales personnel. Tests of
number and name comparison, cancellations, and pursuit are
types of perceptual accuracy tests. Ghiselli (1973) reported
correlations of -.02 for sales clerks and .23 for salesmen
between tests of perceptual accuracy and job proficiency.
Tests of motor abilities. Tests of motor abilities
have not been widely employed in the selection of
salespeople. Ghiselli (1966) did not find a single study
that used tests of motor abilities in the selection of
salespeople. Ghiselli (1973) was able to find studies which
incorporated tests of motor abilities in the selection of
salespeople. The validity coefficient found between tests
of motor ability and measures of job proficiency for all
sales occupations was .12 (Ghiselli, 1973). Tests of motor
abilities include tests of finger, hand, and arm dexterity;
dotting; tapping; and tracing.
The validity of each type of test is different for
different sales occupations. Ghiselli's (1973) review
clarifies these differences (see Table 2).

14
Table 2
Ghiselli's (1973) Validity Coefficients for Sales Clerks
versus Salesmen
Sales Clerks Salesmen
PersonalityTests .36 d.29
IntellectualAbilities -. 03d .33d
Spatial & Mechanical b
Abilities .14b.20
PerceptualAccuracy -. 02d.23
MotorAbilities .09C .16b
aLess than 100 cases C500 to 999 cases
b1 0 0 to 499 cases d1 ,0 0 0 to 4,999 cases
From Ghiselli's (1973) review it is apparent that tests
of intellectual abilities, perceptual accuracy, and motor
abilities are not valid selection measures for sales clerks.
Tests of spatial and mechanical ability have some value for
the selection of sales clerks. But, personality tests have
the most value for the selection of sales clerks. Each type
of aptitude test has at least moderate validity for the
selection of salesmen. However, personality tests and tests

15
of intellectual abilities are the most valid means to select
salesmen.
Each type of test has its advantages as well as its
disadvantages as described above. But, the validity of
tests exceeds that of all other selection devices for entry-
level positions (see Table 3).
Table 3
Hunter & Hunter (1984) Mean Validities of Various Predictors
for Entry-level Positions
MeanPredictors Validity
Ability Composite (tests) .53
Job Tryout .44
Biographical Inventory .37
Reference Check .26
Experience .18
Interview .14
Training & Experience Ratings .13
Academic Achievement .11
Education .10
Interest .10
Age -.01

16
Hunter and Hunter's (1984) validity coefficients are based
on sample sizes of 1,089 to 32,124 and 3 to 425 validity
coefficients. The ability of tests to accurately predict
on-the-job performance has been established, but tests are
not as widely used as would be expected.
The use of tests is less than expected due to the
possibility of litigation. The use of some tests has
resulted in adverse impact, and when a test adversely
impacts a racial group, evidence has to be presented that a
significant relationship exists between the test scores and
job performance, usually in the form of a validation study.
Adverse impact results when a Title VII protected group is
not hired or hired at a lower rate due to lower test scores.
Some individuals hypothesize that a difference in
actual ability between racial groups does not exist, and
that the lower test scores obtained by a given racial group
are the result of unfair tests (test bias hypothesis). These
individuals assume that if the culturally biased content was
removed from tests, the tests would not result in adverse
impact. They also believe that tests have single-group
validity as well as differential validity. Single-group
validity is "validity for one group and not for others"
(Hunter & Hunter, 1984, p. 73). Differential validity is
"validity differences between subgroups" (Hunter & Hunter,
1984, p. 73). But,the empirical evidence gathered over the

17
past 15 years has not supported these assertions. It has
been demonstrated that single-group validity and
differential validity are artifacts of small sample sizes
(Boehm, 1977; Katzell & Dyer,1977; O'Connor, Wexley, &
Alexander, 1975; Schmidt, Berner, & Hunter, 1973; Bartlett,
Bobko, Mosier, & Hannan, 1978; Hunter, Schmidt, & Hunter,
1979). It has also been established that a difference in
mean test scores reflect a difference in mean ability
(Hunter & Hunter, 1984). Thus, aptitude tests are viable
means of selection, but evidence that a relationship exists
between the test scores and job performance must be
presented if use of the tests result in adverse impact.
Alternative Methods
The validity of aptitude tests has been demonstrated
for a wide variety of jobs and populations, including sales
occupations (Ghiselli, 1966; Pearlman, Schmidt, & Hunter,
1980; & Hunter & Hunter, 1984). However, the use of
alternative methods of selection which are equally valid,
but produce less adverse impact has been advocated by the
Federal Government via the judicial system and the Uniform
Guidelines of Employee Selection Procedures. In Section 3B
of the Uniform Guidelines it is stated that:
Whenever a validity study is called for by
these guidelines, the user should include, as
a part of the validity study, an investigation

18
of suitable alternative methods of using the
selection procedure which have as little
adverse impact as possible, to determine the
appropriateness of using or validating them
in accord with these guidelines. (Dreher & Sackett,
1983, p. 129)
Alternatives to aptitude tests will be discussed in terms of
their applicability to sales selection, these alternatives
include: biographical information, interviews, peer
evaluations, expert judgement, self-assessments, projective
techniques, graphology, and assessment centers.
Biographical information. Biographical information is
the most widely used alternative to aptitude testing for
sales selection. In the studies reviewed by Schmitt et al.
(1984) biographical information was used five times more
often than the next most widely used procedure in the
selection of sales personnel. Biographical information is
an empirical technique utilizing personal history to predict
job performance. Biographical items may vary on the
following dimensions: verifiable-unverifiable, historical-
futuristic, actual-hypothetical behavior, memory-conjecture,
factual--interpretive, specific-general, response-response
tendency, and external-internal (Asher, 1972). Items are
considered 'hard' or 'soft' depending on how they vary on
these dimensions.

19
The first study which employed biographical information
as a predictor of sales performance was conducted by Phoenix
Mutual Life Insurance (Holcombe, 1922). A relationship was
found between sales performance and three biographical
items; education, number of dependents, and selling
experience.
In 1938, biographical information was again used as a
predictor of sales performance in the insurance industry
with the development and use of the Life Insurance Salesman
Aptitude Index (Kurtz, 1938). The Aptitude Index contains
two independent parts the prediction scale, consisting of
personal history items and the personality characteristic
scale, consisting of four subtests of personality items.
The instrument has continued to be used throughout the years
in revised forms and today is referred to as the Aptitude
Index Battery.
The successful use of biographical information to
select salesmen has been demonstrated in numerous studies.
Harrell (1960) conducted a study using food company salesmen
and found that biographical items significantly
differentiated between resigned salesmen and two
classifications of employed salesmen, and between fired
salesmen and one classification of employed salesmen. In
yet another study, an objectively scored mail questionnaire
was developed that eliminated three-fourths of the salesmen

20
whose sales performance did not meet minimum standards
(Appel & Feinberg, 1969).
The biographical items of age, education, and marital
status were reviewed for 123 retail salesclerks to see if a
relationship existed between these variables and average
daily sales. Correlations of .90 between age and daily
sales, and .80 between education and daily sales were found
(Weaver, 1969). But, more education only correlated with
more sales up to a point, high school graduates generated
more sales than those individuals with some college. Sales
clerks who were married or divorced had higher daily sales
than those clerks who were separated.
Asher (1972) compared the predictive power of
biographical items to other selection instruments, and
biographical items were found to be more predictive. The
number of validity coefficients .50 or higher, .40 or
higher, and .30 or higher was found to be greater for
biographical items then for tests measuring intelligence,
mechanical aptitude, personality, finger dexterity, and
spatial relation ability (Asher, 1972).
Hinrichs, Haanpera, and Sonkin (1976) cross validated a
biographical inventory for the selection of office equipment
salespeople across nationalities. Validity coefficients
ranged from .24 to .72. Validity decreased as one moved
further away from the cultural and occupational groups used

21
to develop the key. Overall, the results indicated that
cross-national validity exists between personal history
items and success in office equipment sales.
In a review of the literature, Owens (1976) found an
average validity of .35 between biographical information and
sales success. In Reilly and Chao's (1982) review of the
literature, they found an average validity of .40 between
biographical information and supervisor ratings, and a
validity of .62 between biographical information and
measures of productivity in sales occupations.
In some of the most recent research, Childs and
Klimoski's (1986) attempted to predict general occupational
success using a biographical inventory. The biographical
inventory was administered to students within introductory
Real Estate Principles courses. Two years later, the
subjects were sent a questionnaire consisting of 12
occupational success questions. These 12 questions were
factor analyzed and three factors emerged; job success,
personal success, and career success. Multiple regression
of the biographical items and these three success factors
was conducted. Of the subjects employed in sales
occupation, correlations of .45 with job success, .33 with
personal success, and .58 with career success were found.
As a predictor of sales performance biographical
information has a long and successful history. Biographical

22
information is considered to have high utility as a
selection instrument because there are minimal costs
involved in collecting the information and it has
demonstrated relatively high validity (Reilly & Chao, 1982).
However, there are disadvantages associated with using
biographical information as a predictor of sales success. A
large sample size is needed to establish stable estimates of
key weights. England (1971) recommended a minimum sample
size of 150 when using biographical information. Hunter and
Hunter (1984) recommended that a sample size of 400 to 1,000
be used initially and larger sample sizes in follow-up
studies when using biographical information.
Another disadvantage to using biographical inventories
is that they require revalidation, because they tend to lose
validity over time. The loss of validity is due to the
capitalization on chance inherent in the developing of the
keys. Schuh (1967) reviewed a number of biodata studies and
found that the mean initial validity was .66 but the
validity dropped to .52 to .36 to .07 in successive follow-
up studies.
The use of biographical information also poses legal
questions such as, whether the question is an invasion of
privacy or an indirect indicator of race or sex. The
advantages of using biographical information in the
selection of sales personnel however have to be weighed
against the disadvantages.
23
Interviews. Interviews are also a widely used
alternative to aptitude tests. Even though numerous reviews
(Arvey, 1979; Schmitt, 1976; Mayfield, 1964; Wagner, 1949)
have consistently revealed that interviews have low
reliability and validity, they continue to be extensively
used. In 1982, Opren (cited in Opren, 1985) found that
individuals responsible for hiring generally refuse to stop
using the interview as their primary selection procedure,
even when informed that psychological tests are more valid
predictors of performance in that job. Attempts have been
made to improve interviews due to their widespread use such
as through structured interviewing techniques. Studies that
have utilized these techniques in a sales population will be
reviewed.
The Life Insurance Marketing and Research Association
(LIMRA) has been utilizing structured interviewing
techniques in the selection of life insurance salespeople
for the past two decades. The insurance industry first
started selecting life insurance salespeople using
structured interviewing techniques via the Agent Selection
Kit (ASK). The ASK fell into disuse because of the time
required to complete the selection process. The ASK
interview consisted of two separate session that took over 3
hours to conduct. LIMRA was convinced that a valid yet
applicable interview could be conducted, so they learned

24
from their experience with the ASK and developed the
Selection Interview Blueprint (SIB). The SIB takes
approximately one hour to administer. Mayfield, Brown, and
Hamstra (1980) did two studies utilizing the SIB. The first
study required 270 office and field managers to listen to an
SIB interview and rate the applicant. In the second study,
163 SIB rating forms which had actually been used in the
selection process were collected from managers. The rating
obtained in each study were factor analyzed. "The results
indicate that it is possible for managers to agree on their
evaluation ratings of an applicant, that there is a stable
factorial structure for the ratings, and that the ratings
are related to the selection decision although not all items
carry the same weight" (Mayfield et al., 1980, p. 725).
These results show that the SIB has potential to assess
applicants for the position of life insurance salesperson.
Presently, the validity of the SIB in the field is being
researched through the gathering of performance data.
Opren (1985) conducted a comparative validity study of
patterned behavior description interviews and unstructured
interviews. Patterned behavior description interviewing is
a structured interviewing technique based on the premise
that past behavior will predict future behavior. Applicants
for a life insurance sales position were the subjects of
this study. Each applicant was interviewed four times;

25
twice by interviewers trained in patterned behavior
description interviewing and twice by interviewers trained
in unstructured interviewing. The interviewers were
randomly assigned to the two techniques and received the
same amount of training. The interviewers were to gather
information in order to predict the future sales performance
of the applicant. They gave each applicant a rating from 1
(very unsuccessful) to 7 (very successful). The applicants
had not been screened by any instrument prior to the
interviews and all applicants were hired regardless of their
ratings.
In a comparison of all the behavior description
interview predictions (r = .48, p < .01) to all the
unstructured interview predictions (r = .08) with
supervisors rating of "overall effectiveness" as the
criterion, the behavior description predictions were
significantly higher (p < .05). Using dollar amount of sales
as the criterion, behavior description predictions (r = .61,
p < .01) were also significantly (p < .05) higher than
unstructured predictions (r = .05). The test-retest
reliability of the behavior description interviews (r = .72)
did not differ significantly from the test-retest
reliability of the unstructured interviews (r = .68).
Arvey, Miller, Gould, and Burch (1987) developed a
structured interview for seasonal retail sales clerks. A

26
job analysis was conducted which revealed that applicants
would be more successful sales clerks if they had prior
experience, good interpersonal skills, knowledge about the
products sold, and were readily available to work. A 15
item interview schedule was developed assessing these items.
A 16 item job performance rating form was also developed
that paralleled the interview schedule in content. In the
first year, a correlation of .42 (N = 312, p < .01) was
obtained between interview scores and performance ratings.
In the second year, a correlation of .61 (N = 205, p < .01)
was obtained. These correlations were corrected for
criterion attenuation and restriction of range.
Weekley and Gier (1987) developed a situational
interview for a sales position within a national jewelry
chain. Situational interviewing is a structured
interviewing technique based on the premise that expressed
behavioral intentions are predictive of subsequent behavior.
Four-hundred critical incidents were gathered and used to
develop thirty-six questions in a situational format. A
pilot study was conducted with store managers as the
interviewers and corporate employees as the interviewees.
The pilot study resulted in a 16 item interview form with an
interrater reliability of .84. A validation study was then
conducted with 24 hired applicants which resulted in a
correlation of .47 (p < .02) between their interview scores

27
and their sales-per-hour over a nine month period. The
correlation was corrected for criterion attenuation (r,=
.91).
Because individuals responsible for hiring are
committed to the use of interviews, and traditional
interviews have consistently demonstrated low reliability
and validity as well as racial and gender bias (Arvey, 1979;
Schmitt, 1976; Mayfield, 1964; Wagner, 1949) interviewing
has taken on new forms which are generating promising
results in sales selection.
Peer evaluations. Another alternative to aptitude tests
is peer evaluations. The rationale for using peer
evaluation for personnel selection is that peers have the
opportunity to observe each others' behavior across a wide
range of situations, thus peers are better able to ascertain
each other's typical level of performance. Peer evaluations
can be in the form of ratings, rankings, full nominations,
or high nominations. The military has extensively used peer
evaluations to successfully predict later performance (Lewin
& Zwany, 1976; Hollander, 1954). Studies utilizing peer
evaluation in the selection of sales personnel will now be
reviewed.
Waters and Waters (1970) conducted a study in which 53
salesmen nominated each other on six traits, sales
potential, and friendship. The traits were as follows:
28
assertive, agreeable, dependable, calm, polished, and
vigorous. Nominations on friendship were a part of the
experimental design in order to determine the effect of
friendship on the trait nominations. Three friendship
groups were identified for each salesman; those who
nominated him high on friendship, those who nominated him
low on friendship, and those who did not mention him as high
or low on friendship. The correlations between the traits
and the criterion were not significantly different for these
three friendship groups. Ratings on three traits and on
sales potential were significantly correlated with the
objective measures of sales performance; new business sales
and percentage of quota.
Mayfield (1970) used peer nominations in a study with
154 life insurance agents in three different companies. The
agents were asked to nominate three other agents in response
to work and social questions. The agents were told these
nominations would be used as part of the selection process
for assistant managers within their companies. Chi-square
analysis revealed a significant correlation between the
nominations and supervisory ratings in all three companies.
Mayfield (1972) conducted another study using peer
evaluation with insurance agents. Pearson product-moment
correlations of .29 with retention and .30 with productivity
(p < .01) were found.

29
Peer evaluations have demonstrated applicability for
sales selection. However, a number of disadvantages are
associated with the use of peer evaluations. Peer
evaluations are difficult to impossible to obtain for
applicants of entry-level positions. They also lack
standardization. Such variables as size of the peer group
and the average level of the trait being evaluated within
the peer group greatly influence the standardization of peer
evaluations.
Also, the method of peer evaluation used effects the
metric and distributional properties of the evaluations
(Reilly & Chao, 1982). If ratings are used, it is likely
that a highly skewed distribution will be obtained due to
leniency errors. If full nominations are employed, a
trimodal distribution will likely result because each group
member is required to choose a specific number of peers as
high, medium, and low on a given trait when using this
method. If rankings are used, a rectangular distribution
will likely be obtained. "Depending on the needs of a given
organization, one or more of these distributions may be ill-
suited for selection purposes" (Reilly & Chao, 1982, p.25).
Another problem when using peer evaluations is the
acceptance of the program. Often participants of peer
evaluation programs favor discontinuation of the program due
to perceived friendship bias and/or perceived lack of

30
validity. Racial bias is also a disadvantage encountered
when using peer evaluations. Lewin and Zwany (1976) state
that racial bias is generally to be expected in peer
evaluation programs. "Members of a given race tend to
evaluate their same race peers higher" (Reilly & Chao, 1982,
p. 24).
Expert judgements. Expert judgement is an alternative
method of selection used for sales personnel. Expert
judgement is a means by which to combine and summarize
objective data. Few studies utilizing expert judgement have
been reported recently due to research supporting
statistical prediction over judgmental prediction. Pearson
(cited in Reilly & Chao, 1982) used expert judgment via
psychological evaluations of 64 applicants for sales
positions. The psychological evaluation combined
information from a biodata questionnaire, personnel records,
Wonderlic scores, and two inventories developed by a private
consultant. Two psychologists made recommendations of the
64 applicants. The applicants were divided into two
subsamples of 21 and 42. A correlation of .37 (p < .10) for
the subsample of 21 and a correlation of .29 (p < .05) for
the subsample of 42 were obtained between the psychologists
recommendations and managerial performance ratings.
Roose and Dougherty (1976) conducted a study using
expert judgment in the selection of 360 life insurance
31
agents. The experts in this study were life insurance
agency managers, the individuals who usually hire the
agents. Roose and Dougherty prepared protocols for each
applicant. The protocols contained 66 cues from
biographical, test, and interview data. The managers had to
state, "yes" or "no", whether the applicant would be
successful at the end of one year. The average validity of
the judgments was .13. When combined with the objective
scoring, the judgements added .04 to the R2. This suggested
possible non-linear combination of the 66 cues by the
managers.
These two studies suggest applicability of expert
judgements for sales selection. However, no evidence was
given in regard to the comparability of the data combined
judgementally as to it combined statistically. Expert
judgement is also costly and time consuming.
Self-Assessments. Self-assessments have also been
employed in the selection of sales personnel. Self-
assessments are self-evaluations of knowledge, skills,
abilities, and other characteristics. The use of self-
assessments as predictors of job performance has been
minimally researched and used. Levine, Flory, and Ash
(1977) propose that the minimal use of self-assessments is
because it is assumed that self-assessments are inflated and
unreliable and thus have low validity.
32
Farley and Mayfield (1976) used self-assessments with
1,119 applicants for life insurance sales jobs. Each
applicant was to write down ten friends names and rate each
friend as higher or lower than oneself on need for
achievement and willingness to work hard. An applicant's
score on each variable was the number of friends lower than
the applicant on that variable. The criteria used were
survival of one year and commission credits over $6,000 in
one year. Neither score correlated with either criterion.
Self-assessments are quick and inexpensive to obtain,
but low reliability and validity have plagued the usefulness
of self-assessments as predictors of sales performance.
Self-assessments were reported to have a median test-retest
reliability of .32 by Ekpo-Ufot (1979).
Protective techniques. Another means by which to
select sales personnel is by using projective techniques. A
projective technique involves the presentation of new and/or
ambiguous stimuli. Subjects are observed to see how they
react and structure the situation, and from these
observations, inferences to the personality structures of
the subjects are made. The use of projectives is appealing
for two reasons; to measure characteristics not assessable
by more direct approaches and to overcome response bias.
Kinslinger (1966) reviewed a number of different
validity studies using projective techniques as predictors.
33
Nine studies in which he reviewed involved sales personnel.
These studies generated varied results. Cox (1948) found 19
items from a multiple-choice version of the Rorschach to
differentiate the most successful from the least successful
sales clerks. However, he did not report validity
coefficients or attempt to cross validate his results.
Botha and Koper (cited in Kinslinger, 1966) correlated TAT
scores with managerial ratings. They found better salesmen
scored significantly higher in need for achievement than
average salesmen. A significant difference between better
and average salesmen was not found for need for power.
Spencer and Worthington (1952) employed the Worthington
Personal History (P-H) to predict sales performance and
tenure. Biserial correlations of .31 with sales volume and
.34 with tenure were found. Worbois and Kanous (1954) also
used the Worthington P-H to predict sales performance;
however, no significant correlations were found.
Since Kinslinger's review few studies have used
projective techniques as predictors. One study using a
projective technique to select sales applicants was found.
Tullar and Barrett (1976) utilized an unusual projective
technique, a future autobiography, with 36 sales trainees.
The autobiographies were scored on three constructs which
were as follows: (a) agency, "the extent to which a person
sees himself as the prime agent in determining the course of

34
his future life," (b) demand, "the extent to which an
individual portrays his life as a long-term, continuing
effort on his part," and (c) differentiation, "the extent to
which an individual has created a complex detailed mapping
of his future." The scores obtained by each trainee on
these three constructs were correlated with ten performance
rating obtained from behaviorally anchored rating scales.
Of the thirty correlation coefficients, only five were
significant. All five of the significant correlation
coefficients were with the agency construct. With word
count partialed out, seven coefficients with the agency
construct and two. coefficients with the demand construct
were significant.
Disadvantages to using projective techniques include;
poor face validity, the need for psychological
interpretation, and the possibility of contrived responses.
Generally, projectives lack sufficient reliability and
validity to predict job performance (Reilly & Chao, 1982).
Graphology. Another alternative to aptitude tests
which has been employed in the selection of sales personnel
is graphology. Graphology is the analysis of character
through handwriting. Graphology is commonly referred to as
handwriting analysis.
Zdep and Weaver (1967) employed graphology as a means
to differentiate successful from unsuccessful life insurance

35
salesmen. Handwriting samples from 63 life insurance agents
were analyzed. No significant correlations and in many
instances negative correlations were obtained between 13
traits selected intuitively by the handwriting analysts and
policy commissions. The correlations obtained when using
the traits dominantly found in successful salesmen
handwriting and policy commissions were also not
significant. However, some success was achieved in
selecting unsuccessful salesmen if they lacked certain
traits in their handwriting. Of the salesmen that were
identified as "failures" due to lack of certain traits a
significant number were actual "failures".
Rafaeli and Klimoski (1983) also conducted a study
employing graphology. Neutral and autobiographical
handwriting samples of 70 real estate sales associates were
analyzed. The performance measures used in this study were
supervisory ratings, self-ratings, and productivity
measures. Very low nonsignificant validity coefficients
were obtained regardless of the type of handwriting sample
and the performance measure used. However, some evidence of
interrater reliability was seen in this study.
Graphology is quick, inexpensive, and technically
simple. But, graphology has failed to demonstrate validity
as a predictor of job performance in sales occupations.
36
Assessment centers. Another procedure used to select
sales personnel is assessment centers. An assessment center
is a means by which to evaluate candidates using multiple
assessment techniques. The methodology of assessment
centers is a primary asset. They are considered to be
objective, reliable, content valid, acceptable to the EEOC
(Thornton & Byham, 1982). The utilization of assessment
centers in selecting sales personnel will be reviewed.
American telephone and telegraph (AT&T) was a pioneer
in the development and use assessment centers and continues
to widely utilize assessment center methodology in the
selection of sales personnel (Thornton & Byham, 1982). Bray
and Campbell (1968) evaluated candidates for a sales
position using an assessment center consisting of four
cognitive paper and pencil tests, an interview, and
individual and group simulations which included; a
leaderless group discussion, an oral fact-finding exercise,
and a consulting case. The judgements of the assessment
center staff correlated .51 with field performance ratings
given by a special observational team. However, assessment
staff judgments were not significantly related to supervisor
or trainer ratings, but these ratings were also not
significantly related to field performance ratings.
Ritchie (cited in Thornton & Byham, 1982) conducted a
study using an assessment center to select commissioned

37
salespersons. He found a significant relationship between
the salespersons' overall assessment rating (OAR) and their
field performance and two training criteria. Also, he found
assessees rated as acceptable turned-over at one-half the
rate of assessees rated as less than acceptable.
Assessment center methodology has been utilized in the
selection of salespersons for a variety of organizations
including Sears, Allstate, Ethan Allen, Xerox, and Merrill
Lynch (Thornton & Byham, 1982). These organizations have
not published the results of using assessment center
methodology as a means of selection. Hollenbeck in personal
conversation (cited in Thornton & Byham, 1982) stated that
Merrill Lynch's use of assessment center methodology has
resulted in a 42% reduction in turnover among "recommended"
stockbrokers.
The use of assessment centers in the selection of sales
personnel has been limited, with very few studies being
published. The use of assessment centers in the selection
of sales personnel has its disadvantages such as, difficulty
in implementation and operation, cost of operation, and the
amount of time required to train assessors. Another
disadvantage of assessment centers is possible biased
ratings. In a recent study, an assessment center was used
to evaluate the job potential of 1035 applicants for a
professional sales position (Walsh, Weinberg, & Fairfield,

38
1987). Walsh et al. (1987) found a significant main effect
for applicants' sex (F = 7.54, p < .01) and a significant
interaction effect between the sex composition of the
assessor group and applicants' sex (F = 4.56, p < .05).
Female applicants (M = 7.56) received higher ratings than
male applicants (M = 6.93). The all-male assessor group
gave female applicants significantly higher ratings than
male applicants (t = -3.38, df = 423, p < .001).
In Reilly and Chao's (1982) extensive review of
alternatives to aptitude tests, two other alternatives were
reviewed; reference checks and academic performance.
However, no studies utilizing reference checks or academic
performance to predict sales performance were found, thus
they were not reviewed. Of the alternatives reviewed, most
were not viable means of selection for an entry-level sales
position. Biographical information is not a suitable
selection method, because of the large sample size required
and the loss of validity over time. Because peer
evaluations are nearly impossible to obtain for an entry-
level position, peer evaluations are not a viable selection
procedure. Due to the lack of evidence of the superiority
of expert judgments over statistical procedures when
combining and summarizing objective data, expert judgments
were not a suitable selection method. The low reliability
and validity of self-assessments and projective techniques

39
eliminated these alternatives from being considered as a
means of selection. Because graphology demonstrated no
validity it is not a viable option. Since assessment
centers are time consuming and costly, they are also not a
suitable selection procedure. Interviews in a structured
format demonstrated promising reliabilities and validities,
thus this technique was considered a viable selection method
along with aptitude tests.
Statement of Hypotheses
The selection of successful salespeople is a prevalent
issue within personnel. The review of possible means by
which to select salespeople pointed to two viable
procedures; tests and structured interviews. This study
will attempt to demonstrate the validity of tests for the
selection of individuals for an entry-level sales position.
Hypothesis one. Verbal ability as measured by the SRA
Verbal will be positively correlated with sales volume, and
managerial ratings of sales ability, customer service,
administrative duties, and the overall rating.
Hypothesis two. Numerical ability as measured by the
Employee Aptitude Survey (EAS) Numerical Ability Test will
be negatively related to average number of remakes and
service requests, and positively related to managerial
ratings of the ability to design and price treatments,
administrative duties, and the overall rating.

40
Hypothesis three. Spatial ability as measured by the
EAS Space Visualization Test will be negatively correlated
with average number of remakes and service requests, and
positively correlated with managerial ratings of the ability
to design and price treatments, administrative duties, and
the overall rating.
Hypothesis four. Sales attitudes as measured by the
Sales Attitude Checklist will be positively correlated with
sales volume, and managerial ratings of sales ability,
customer service, administrative duties, and the overall
rating.
CHAPTER II
METHOD
Subjects
Participating in this study were 251 decorator
consultants employed by a national retail chain. The
decorator consultant position is a direct sales position.
Typical duties include: (a) selling merchandise to
customers outside of the store, (b) measuring and
calculating window product sizes, (c) handling customer
complaints and questions, and (d) staffing in-store
decorating center.
Incumbent population. Employed by the retail chain are
1,504 decorator consultants. Decorator consultants are
predominantly caucasian females, 94% of the decorators are
caucasian and 96% are female. Of the decorators employed,
43% are under 40 years of age and 57% are over 40 years of
age. The average tenure of the decorators employed was 3
years and 6 months.
Job analysis sample. In the job analysis phase, 20
decorators were interviewed and 150 were sent task-list
questionnaires. A representative sample of decorators was
desired, so the job analysis interviews were conducted in
41

42
divergent geographical locations. Job analysis interviews
were conducted in California, Georgia, and Texas. Also to
obtain a representative sample, the task questionnaires were
sent to randomly selected decorators. Of the questionnaires
sent out, 144 (96%) were returned and used in the analysis.
Of the decorators who participated in job analysis
interviews, 100% were caucasian and 90% were female. In this
phase, 50% of the decorators who were interviewed were under
40 years of age, and 50% were over 40 years of age. The
average tenure of the decorators who participated in job
analysis interviews was 4 years and 2 months.
Field testing sample. In the field testing phase, 87
decorators participated. Criteria data were unavailable for
ten decorators, so the sample size in the final analysis of
this phase was 77. Field testing took place in California,
Ohio, and Texas. The geographical breakdown of the testing
sample was as follows: 40% were tested in California, 38% in
Ohio, and 22% in Texas. The number of decorators tested in
each location was dependent upon the number of decorators
who worked out of that particular location.
Of the decorators who participated in the field testing
phase of this study, 96% were caucasian and 95% were female.
In this phase, 30% of the decorators tested were under 40
years of age, and 70% were over 40 years of age. The
average tenure of the testing sample was 5 years and 5

43
months. The age and tenure of the testing sample are
somewhat inflated due to the elimination of ten decorators
who had not been employed with the company long enough to
generate criteria data. Of these ten decorators, 90% were
under 40 years of age and their average tenure was 2.5
months.
Experimental Design
The primary objective of this study was to develop a
selection process that was valid; valid, meaning a
relationship exists between predictors (instruments used to
assess the knowledge, skills, and abilities needed to
successfully perform in this position) and criteria
(measures of job performance). A concurrent criterion-
related validity study was determined to be the manner in
which to accomplish this objective. A concurrent criterion-
related validity study was also chosen due to the immediate
need for a new selection process because of financial loses
in terms of service requests, remakes, and turnover. A
concurrent study involves assessing incumbents' knowledge,
skills, and abilities via predictors and correlating these
results with criteria, measures of job performance. This
design allows predictor and criteria information to be
gathered simultaneously or within a short interval of each
other.

44
Criticisms of current designs include; "missing
persons," restriction of range, motivational and demographic
difference between incumbents and applicants, and
confounding by job experience. These criticisms have led
many to believe predictive designs are superior. However,
Barrett, Phillips, and Alexander (1981) found that these
criticisms had a minimal effect on the size of the validity
coefficient. Bemis (1968) empirically compared 71
predictive and 69 concurrent validities of the General
Aptitude Test Battery. This comparison indicated that the
two designs result in virtually identical validity
coefficients. The meta-analyses conducted by Schmitt et al.
(1984) revealed that "concurrent validation designs produce
validity coefficients roughly equivalent to those obtained
in predictive validation designs" (p. 407)
Predictor and Criterion Development
The primary objective of the job analysis was to obtain
information that will aid in the development of both
predictors and criteria. The job analysis interviews
resulted in the identification of 80 tasks. With the
assistance of custom decorating subject matter experts
(SMEs), these 80 tasks were sorted into activity areas. The
activity areas are as follows: (a) taking
measurements/designing and pricing treatments,
(b) consultation/selling to customers, (c) customer service,

45
(d) completing paperwork for orders, (e) prospecting
(obtaining leads/referrals), (f) updating/maintaining files
and records, (g) staffing the studio, (h) training-related
activities. The questionnaires were used to determine the
criticality of these 80 tasks. Eighteen personal
characteristics (knowledge, skills, abilities, and other
characteristics, hereafter, KSAs) were identified in the
interviews. The personal characteristics were reviewed with
the assistance of custom decorating SMEs and grouped
together to form job dimensions. Seven dimensions were
formed and the definition of these dimensions along with
their associated KSAs are listed in Appendix D. The
dimensions are as follows: sales ability, planning &
organizing, adaptability, attention to detail, verbal
ability, numerical ability, and spatial ability.
The decorators' ratings on the task questionnaires
indicated that they did not consider the 80 tasks as
difficult. Only six tasks out of eighty (7.5%) received an
average rating greater than three, which is defined as "more
difficult than half my tasks and easier than half". Not a
single task received a mean difficulty rating greater than
3.2. Since the eighty tasks received highly similar
difficulty ratings, this scale was not a central component
in determining the criticality of each task.
46
Frequency ratings and importance ratings were utilized
to determine the criticality of the tasks. All tasks
performed by less than 25% of the decorators surveyed were
to be eliminated, but not a single task was performed by
less than 25% of the decorators surveyed. A criticality
index for each task was formulated by multiplying the
frequency rating of the task by the importance rating of the
task. All tasks having a criticality index of six or less
(indicating moderate to low importance and moderate to low
frequency) were eliminated. Eight tasks were eliminated on
this basis. Tasks with a criticality index of twenty or
greater (indicating very high to high importance and very
high to high frequency) were viewed as critical. Sixteen
tasks had a criticality index of twenty or greater. The
task statements with the incumbent ratings are contained in
Appendix E.
Using the results of the task questionnaires and the
task-KSA matrix, the sixteen tasks which were deemed
critical according to the questionnaire ratings were
reviewed in terms of the KSA's required to successfully
perform these critical tasks. A matrix was generated that
shows the job dimensions relative to the sixteen critical
tasks (see Appendix G).
Based upon the information obtained in the job analysis
four tests were chosen to be used as predictors: the SRA
47
Verbal, the Employee Aptitude Survey (EAS) Numerical Ability
Test, the EAS Space Visualization Test, and the Sales
Attitude Checklist. Eight measures of job performance were
chosen to be used as criteria. Three behavioral criteria
were chosen sales volume, number of service requests, and
number of remakes. Managerial ratings of sales ability,
ability to design and price treatments, customer service,
administrative duties, and an overall rating were also
chosen to be used as criteria.
Predictors
Tests were determined though a review of the literature
to be the most appropriate means by which to assess the
knowledge, skills, and abilities needed to successfully
perform in this position. Four paper and pencil tests
composed the experimental test battery: SRA Verbal Form,
Employee Aptitude Survey (EAS) Numerical Ability, EAS Space
Visualization, and Sales Attitude Checklist. These
instruments were chosen to assess the knowledge, skills, and
abilities needed to perform the tasks deemed critical in the
job analysis. These instruments were also chosen based on
their technical adequacy in terms of reliability and
validity as well as the degree in which the tests met other
administrative requirements such as testing time and face
validity.

48
Testing time is an important concern because maximum
validity per unit of testing time is desired. In other
words, optimal utilization of testing time is desired.
Increasing validity by lengthening a test is possible, yet
uneconomical. Composing a battery of tests which each
measure a unique job-related factor is an efficient way in
which to increase validity of the test battery (Ruch & Ruch,
1980).
Face validity, the degree to which a test seems to be
relevant to the job, is also an important concern. An
applicant's motivation and reaction to the test battery are
effected by its face validity. If a particular test does
not seem related to the job, test performance may not
reflect actual abilities.
Since verbal ability was deemed critical, the SRA
Verbal was chosen to assess this ability. The SRA Verbal
form consists of linguistic and quantitative reasoning
items, 84 in all. The SRA Verbal Examiner's Manual (1984)
refers to the SRA as a "basic mental ability test" which
"measures primary mental abilities necessary to function
normally in almost any occupation in today's society" (p.1).
The SRA's test-retest reliability is .76 for the
linguistic score, .80 for the quantitative score, and .78
for the total score, each significant at the .01 level
(Thurstone & Thurstone, 1984). Another measure of

49
reliability is intercorrelations of subscores. Using an
occupationally mixed sample, the intercorrelations of the
SRA subscores were as follows: the quantitative score and
the linguistic score were correlated .75, the quantitative
score and the total score were correlated .92, and the
linguistic and the total score were correlated .95
(Thurstone & Thurstone, 1984). These intercorrelations
demonstrate the highly verbal nature of the quantitative
items.
In a study employing 27 chemical product salespersons,
the SRA linguistic score correlated .56 (p = .01) with sales
volume and the total SRA score correlated .43 (p = .05) with
sales volume (Thurstone & Thurstone, 1984). The SRA
quantitative score did not correlate at a significant level
with sales volume. In another study involving 150
department store floor salespersons, the SRA subscores
correlated from .24 to .26 at a significance level of .01
with supervisor ratings (Thurstone & Thurstone, 1984).
These studies demonstrated the applicability of the SRA to a
sales population.
An instrument which assesses numerical ability was
chosen because the following tasks: (a) calculate window
product sizes, (b) calculate drapery pricing, and (c)
calculate price breaks, along with the ability to add,
subtract, multiply, and divide whole numbers or fractions

50
and calculate percents were deemed to be critical. The EAS
Numerical Ability test was chosen since it contains
addition, subtraction, multiplication, and division problems
that employ whole numbers (Part I), decimals (Part II), and
fractions (Part III). It also contains problems that
require the calculation of percents (Part II).
The EAS Numerical Ability test has an alternate form
reliability of .87 (Ruch & Ruch, 1980). In a study
employing 30 dairy product salesmen, a correlation of .68
with supervisor rating was achieved (Ruch & Ruch, 1980).
However, in a study involving 19 dinnerware salesmen a
correlation with supervisory ratings of only .16 was found
(Ruch & Ruch, 1980). The sample size used in this study was
extremely small, thus the correlation may be arbitrarily
low. Two other factors led to the incorporation of the EAS
Numerical test into the experimental test battery; a testing
time of 10 minutes and the similarity of the test's content
to essential abilities and tasks identified in the job
analysis led to its selection.
Spatial relations ability was identified by decorators
as an essential ability needed to be a successful decorator.
The EAS Space Visualization was the instrument chosen to
assess this ability. The Space Visualization test uses the
block format which is a compromise between factorial purity
and predictive validity (Ruch & Ruch, 1980). The alternate
51
form reliability of the Space Visualization test was -found
to be .89 (Ruch & Ruch, 1980). In a study employing 19
dinnerware salesmen, the correlation was found to be .70
with supervisor rating (Ruch & Ruch, 1980). Since the test
is also face valid and has a testing time of 5 minutes, it
was chosen to be a part of the decorator consultant test
battery.
The decorators deemed critical a number of tasks and
abilities which were sales related. Thus, an instrument
that assessed sales ability was chosen, the Sales Attitude
Checklist. The Sales Attitude Checklist is a self-
descriptive questionnaire containing desirable and
undesirable behavioral attributes and attitudes of
salespeople (Taylor, 1985). The items are forced choice in
format.
No reliability information is available for the Sales
Attitude Checklist. The authors of the Sales Attitude
Checklist have not attempted to determine the reliability of
the test, because the existing methods by which to estimate
reliability are not adequate for an instrument such as this
(Taylor, 1985). However, validation evidence in sales
situations has demonstrated that a relationship exists
between Sales Attitude Checklist test scores and job
performance. In a study involving 197 new car salespeople,
a correlation of r = .31, significant at the p = .01, level

52
was obtained between test scores and average monthly
earnings (Taylor, 1985). In another study employing 166
railroad traffic salespeople, correlations ranged from .02
to .44. The wide range of correlations resulted from
groupings based on age and position (Taylor, 1985). In
addition to the validation evidence for a sales population,
the face validity of this instrument led to its selection.
Criteria
Behavioral criteria and managerial composite ratings
were employed in order to assess on-the-job performance.
The behavioral criteria used were average sales volume,
average number of.service requests, and average number of
remakes. These averages were taken over a six month period,
from March through August, 1989. Sales volume is the amount
of custom decorating merchandise the decorator sells. A
service request is a request by a customer to have the
decorator whom she or he purchased from solve one or more
problems she\he is having with products that were purchased.
Decorator errors include measurement errors in length and
width, as well as specification errors such as wrong fabric
specification. These errors result in the manufacturing of
products that do not meet the customers' needs and wishes
and thus have to be remade.
Of the participating decorators, 84% had sales volume
figures for the entire six month interval. Twelve of the

53
participating decorators, 16%, did not have sales volume
figures for the entire six months because they were on
vacation or sick leave, or they were hired within the six
month interval in which figures were collected. The number
of remakes attributable to each decorator for the entire six
month interval were obtained for only 28% of the
participating decorators. No figures were available for the
number of service requests attributable to each decorator
for the entire six months. The lack of figures for the
entire six month interval is due to the absence of a
standard method of recording keeping for these two
variables, did not exist until June 1989. In June, both
remakes and requests began to be tracked using a computer
program.
Managerial ratings were also used as criteria. Sales
managers rated decorators in four areas; sales ability,
ability to design and price treatments, customer service,
and administrative duties. They also gave each decorator an
overall rating. The sales managers were asked to review
each participating decorator's performance over a six month
period (from March through August, 1989) and rate their
performance on a scale of 0 to 5. The rating codes were as
follows: 0 = not applicable/unable to rate, 1 =
unsatisfactory, fails to meet job requirements, 2=
improvement needed to meet job requirements, 3 = meets job

54
requirements, 4 = exceeds job requirements, 5 = outstanding,
greatly exceeds job requirements (see Appendix A).
Managerial ratings were used as criteria by averaging
the ratings assigned to all the questions in a given area.
Ratings on single questions were not used as criterion. For
example, the area of sales ability had four questions and
the average of these four questions was the composite rating
for sales ability. Also, used as a criterion was an overall
rating which was obtained by averaging all eleven questions
on the rating form. The overall rating directly given by
the sales managers was not used as a criterion because the
rating was open to divergent interpretations. Five
managerial composite ratings were used as criteria.
Procedure
The primary objective of this study was to demonstrate
that a relationship exists between decorators' test scores
and their job performance. In order to accomplish this
objective several steps had to be carried out. These steps
are as follows: job analysis, test selection, incumbent
testing, and statistical validation.
A thorough investigation of the decorator consultant
position was first conducted. This job analysis had three
primary goals: (a) the identification of tasks performed by
decorator consultants, (b) the determination of tasks which
are critical to success as a decorator consultant, and (c)

55
the identification of knowledge, skills and abilities needed
to perform these critical tasks effectively. Interviews and
questionnaires were used to accomplish these goals, but
first existing job information was collected and studied to
become familiar with the position. This information
included the existing job description and relevant job
descriptions from the Dictionary of Occupational Titles.
Also, individuals from the American Society of Interior
Designers and the Foundation for Interior Design Education
and Research were contacted to familiarize the analysts with
the position.
Interviews were then conducted with decorators in the
field to identify the tasks which they perform and the
personal characteristics (e.g., knowledge, skills, and
abilities) needed to perform these tasks. Interviews were
also conducted with seven subject matter experts (SME); five
sales managers and two trainers.
In order to determine the criticality of the tasks
which were identified in the interviews, 150 questionnaires
were sent to randomly selected decorators. First, the
decorators were asked whether they performed the task, if
they never performed the task, they were asked to circle "0"
on the frequency scale and move on to the next task. If the
decorators did perform the task, they were asked to rate the
task on three scales: frequency, difficulty, and

56
importance. Each task was analyzed to determine the
frequency of each of the responses and the mean response for
each scale. Job experts were then asked to identify which
knowledge, skills, and abilities that were identified in the
interviews were required to perform each of the tasks
identified in the interviews. This resulted in a large task-
KSA matrix. Tests were then selected to assess the
knowledge, skills, and abilities needed to successfully
perform the tasks which were rated as critical. The
instruments which were chosen are described above.
Incumbent testing was the next step, testing took place
in the custom decorating service centers. The service
centers were chosen because they provided adequate space,
lighting, and ventilation. Groups of two to ten decorators
were tested at one time. With each group, standardized test
administration procedures were followed as specified by the
test publishers (see Appendix B). The test battery was
administered by individuals with advanced training in the
testing field. The decorators were ensured that their test
results would be kept confidential and would be used for
research purposes only. Testing time was approximately one
hour for each group.
The tests were scored by hand following standardized
scoring procedures (see Appendix C). The test results were
then statistically analyzed using Statistical Analysis

57
Systems (SAS) software. Basic descriptive statistics were
computed for each test. Frequency tables of the test scores
were run in order to provide the decorators with feedback.
Pearson product-moment correlations were obtained for the
predictors with the criterion. The predictors included the
total score of each test, four in all. The criterion
included the behavioral criteria and the managerial
composite ratings, eight in all. The bivariate
distributions that resulted were also examined (see Appendix
F). Also computed were intercorrelations of the predictors
and intercorrelations of the criterion. An analysis of
variance procedure was conducted using age as the
independent variable. Analysis of variance was also
employed using testing location as the independent variable
to ascertain if the decorators which were tested in
different locations obtained significantly different test
scores. In addition, the correlation between job tenure and
age, and the correlations between job tenure and the test
scores were computed.

CHAPTER III
RESULTS
The primary objective of this study was to demonstrate
that a relationship exists between decorators' test scores
and measures of their job performance. Such a relationship
was observed, three of the four tests within the test
battery were significantly correlated with two or more
criteria. The decorators' test results on the Sales
Attitude Checklist demonstrated the strongest relationship
with the measures of job performance used within this study.
The decorators' scores on this test correlated at a
significant level with six of the eight criteria. The
decorators test results on the SRA Verbal did not
significantly correlate with any one criterion. Overall, a
stronger relationship was seen between the test scores and
the managerial ratings, than between the test scores and the
behavioral criteria.
Descriptive statistics for the four tests and the eight
performance measures are given in Table 4. Descriptive
statistics published in the test manuals which were obtained
by similar subjects are given in Appendix H. The
correlational analyses conducted yielded the correlation
matrix in Table 5.
58

59
Table 4
Descriptive Statistics for the Predictors and Criteria
M S. D. Range N
Predictors
SRA Verbal
NumericalAbility
SpaceVisualization
Sales AttitudeChecklist
CriterionObi ective
Avg. SalesVolume
Avg. # ofRequests
Avg. # ofRemakes
Subjective
Sales Ability
Design & PriceTreatments
CustomerService
AdministrativeDuties
Overall Avg.Rating
44.4
26.0
18.6
31.7
10.9
10.8
8.6
5.4
$17,082
5.1
1.7
3.4
3.3
3.2
3.3
3.3
$6,057
3.5
1.6
.66
.51
.70
.58
.50
15 - 75
7 - 55
0 - 36
21 - 42
$808 - $28,593
0 - 22
0 - 13
1 - 5
2 - 4
2 - 5
2 - 5
2 - 5 77
77
77
77
67
77
76
76
77
77
77
77
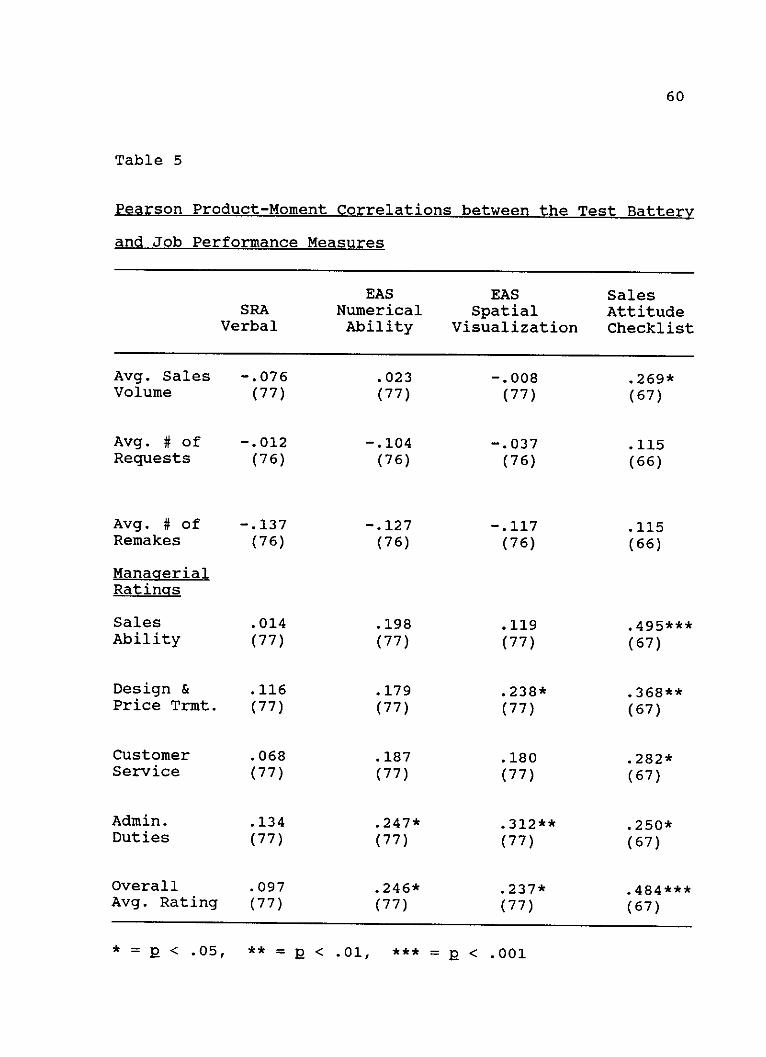
60
Table 5
Pearson Product-Moment Correlations between the Test Battery
and Job Performance Measures
EAS EAS SalesSRA Numerical Spatial Attitude
Verbal Ability Visualization Checklist
Avg. SalesVolume
Avg. # ofRequests
Avg. # ofRemakes
ManagerialRatings
SalesAbility
Design &Price Trmt.
CustomerService
Admin.Duties
OverallAvg. Rating
-. 076
(77)
-. 012(76)
-. 137(76)
.023
(77)
-. 104
(76)
-. 127
(76)
.014
(77)
.116(77)
.068(77)
.134
(77)
.097
(77)
.198(77)
.179
(77)
.187
(77)
.247*
(77)
.246*
(77)
.008
(77)
-.037(76)
-.117(76)
.269*
(67)
.115(66)
.115
(66)
.119
(77)
.238*
(77)
.180
(77)
.312**
(77)
.237*
(77)
.495***(67)
.368**(67)
.282*(67)
.250*(67)
.484***
(67)
** = p < .01, *** = p < .001* = p < .05,
61
The Sales Attitude Checklist scores of ten decorators
were not included in any statistical analyses, because the
checklist was not completed according to the given
instructions.
The data in Table 5 display the statistical support
found for hypotheses two, three, and four. The EAS
Numerical Ability test was positively correlated at a
significant level with managerial ratings of administrative
duties and overall ratings, however it was not correlated at
a significant level with managerial rating of the ability to
design and price treatments. The EAS Space Visualization
test was significantly correlated with each of the
managerial ratings that was hypothesized in hypothesis
three. Average number of service requests and average
number of remakes were not significantly correlated with the
EAS Numerical Ability test or the EAS Space Visualization
test as was hypothesized. The Sales Attitude Checklist
correlated significantly with each criterion that was
hypothesized, as well as with an additional criterion,
managers' ratings of ability to design and price treatments.
No statistical support was found for hypothesis one, the SRA
Verbal did not correlate at a significant level with any one
criterion.
The bivariate distributions of the predictors with the
criteria were examined for nonlinearity, a number of these
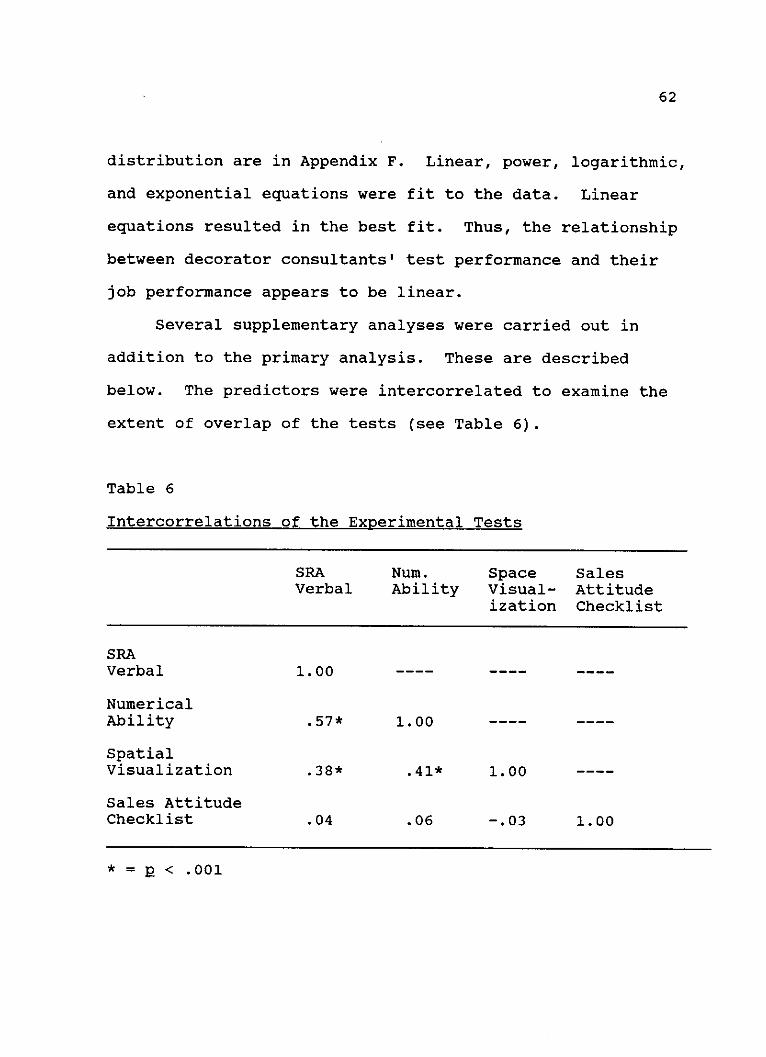
62
distribution are in Appendix F. Linear, power, logarithmic,
and exponential equations were fit to the data. Linear
equations resulted in the best fit. Thus, the relationship
between decorator consultants' test performance and their
job performance appears to be linear.
Several supplementary analyses were carried out in
addition to the primary analysis. These are described
below. The predictors were intercorrelated to examine the
extent of overlap of the tests (see Table 6).
Table 6
Intercorrelations of the Experimental Tests
SRA Num. Space SalesVerbal Ability Visual- Attitude
ization Checklist
SRAVerbal 1.00 ---- ---- ----
NumericalAbility .57* 1.00 ---- ----
SpatialVisualization .38* .41* 1.00 ----
Sales AttitudeChecklist .04 .06 -.03 1.00
* = p < .001

63
A number of the eight criteria were significantly
correlated with each other (see Table 7). Average sales
volume, a dollar-valued performance measure, correlated
significantly with four of five managerial ratings. A
significant relationship was also found between the
managerial ratings.
Table 7
Correlation Matrix of the Criterion Measures
Avg Avg Avg Sales Trmt. Cust. Admin. Oversales req remk Serv. Duties all
Avgsales 1.00
Avgreq .45** 1.00
Avgremk .30* .58** 1.00
Sales .67** .24 .15 1.00
Trmt. .18 -. 11 -.07 .43** 1.00
CustServ .42** .15 -.02 .63** .41** 1.00
Admin.Duties .34* .12 -.12 .49** .55** .73** 1.00
Overall .51** .14 -.01 .81** .70** .88** .85** 1.00
** = p < .001* = p < .01

64
The scores on the test battery of decorators under 40
years of age and those over 40 years of age were examined.
The descriptive statistics for each test by age are
presented in Table 8. These two age groups were chosen
because The Age Discrimination in Employment Act of 1967, as
amended in 1978, prohibits discrimination on the basis of
age between the ages of 40 and 70, unless age is a bona fide
occupational qualification.
Similar data by sex and race is not presented because
the testing sample contained only 4 male decorators (5%) and
only 3 non-caucasian decorators (4%). The percentage of
minority incumbents in this study reflects the percentage
that are in the incumbent population, therefore validity
analyses by racial group was precluded.
Table 8
Descriptive Statistics for Each Test by Age
TEST AGE GROUP N M S.D. F
SRA Verbal < 40 23 43.4 10.8 .57> 40 53 45.4 10.2
Numerical < 40 23 28.6 11.4 1.61Ability > 40 53 25.2 10.2
Space < 40 23 23.0 7.8 9.07*Visualization > 40 53 16.9 8.2
Sales Attitude < 40 20 33.1 5.1 1.99Checklist > 40 46 31.0 5.5
*= p < .01

65
An analysis of variance procedure was performed using
age as the independent variable. This analysis revealed
that a significant difference between decorators test scores
who were under 40 years of age and those who were over 40
years of age existed on the Space Visualization test (F =
9.07, p < .005). The other three instruments did not show
significant differences between the scores of the two age
groups. Mean score differences in z-score units between age
group were computed (see Table 9). The differences between
the groups' scores were less than one standard deviation on
each of the four tests.
Table 9
Mean Score Differences in Z-Score Units between Decorators
Under 40 Years of Age and Those Over 40 Years of Age
Test U-O
SRA Verbal -.18
Numerical Ability .32
Space Visualization .71
Sales Attitude Checklist .39
Note. The differences were computed using the following formula
Under 40 group mean - Over 40 group meanTotal sample standard deviation

66
An analysis of variance procedure was also carried out
using testing location as the independent variable. No
significant differences between decorators' test scores
tested in different locations were found.
Using correlational analysis the relationship between
job tenure and test scores was also examined. The
correlations (see Table 10) indicated that longer tenure
Table 10
Correlation of Job Tenure with Test Scores
Test r p
SRA Verbal -.13 .26
Numerical Ability -.18 .12
Space Visualization -.27 .02*
Sales Attitude Checklist .18 .15
does not necessarily result in higher test scores or vice
versa. However, scores on the Space Visualization test were
negatively correlated at a significant level with tenure.
This indicates that decorators with longer tenure obtain
lower scores on this test. This result is likely due to the
relationship between tenure and age, because longer tenure
is associated with greater age. Since it was found that
decorators over 40 years of age scored significantly lower

67
on the space test than decorators under 40 years of age,
those decorators with longer tenure are also likely to score
lower.

DISCUSSION
Overall, the results of this study were quite
favorable. Three of the four tests within the experimental
test battery demonstrated concurrent-related validity and
were recommended to be used in the selection process for the
decorator consultant position.
The Sales Attitude Checklist was significantly
correlated with the behavioral criterion, average sales
volume, as well as with each of the managerial ratings. Two
explanations for the validity of the Sales Attitude
Checklist are possible. As Ghiselli (1966, 1973) found in
his reviews of the literature, personality measures are a
valid means of predicting sales success and the Sales
Attitude Checklist is a personality measure. Hogan,
Carpenter, Briggs, & Hansson (1985) maintain that
personality measures can be valid predictors of job
performance when they are designed for the specific
population in question and the Sales Attitude Checklist was
developed specifically for sales selection.
The EAS Spatial Visualization test was significantly
correlated with several managerial ratings. Two
explanations for the correlations that were achieved are
68
69
given. Tests of spatial ability have demonstrated validity
in predicting job proficiency of sales clerks and salesmen
(Ghiselli, 1966, 1973), thus this type of test was
applicable in this study. Another possible explanation is
that the position of decorator consultant is a specialized
sales position with one of its job requirements, spatial
ability.
The EAS Numerical Ability Test was significantly
correlated with mangers' ratings of administrative duties
and the overall average rating. The validity of this test
may be due to the specific job requirements of this position
and/or due to the validity of arithmetic tests in predicting
job proficiency in sales clerks (Ghiselli, 1966, 1973)
The SRA Verbal did not correlate at a significant level
with any one criterion. Three explanations for the lack of
validity between the SRA Verbal test results and the
measures of job performance used are possible. First, the
SRA Verbal did not seem job-related to the decorators, as
expressed by a number of decorators during testing. If a
test does not appear face valid it can effect the motivation
as well as the performance of the examinees.
Second, the reliability of an instrument effects the
validity of that instrument. The test-retest reliability
coefficients of the subscores and total score of the SRA
Verbal were reported to range from .76 to .80 (Thurstone &

70
Thurstone, 1984). These reliabilities are somewhat lower
than desired for a selection instrument.
Third, a "basic mental abilities" test such as the SRA
Verbal may not have been appropriate for this position. The
selection of specialized salespeople may require the use of
more specialized tests to assess specific knowledge, skills,
and abilities that are needed to be successful in that
position rather than the assessment of basic mental
abilities.
The SRA Verbal was not included in the final
recommended test battery because of the lack of concurrent-
related validity and face validity. Also, the SRA Verbal
was not included due to low reliability, high
intercorrelations with other predictors, and a long testing
time, 15 minutes, in comparison to the other tests within
the experimental test battery.
A stronger relationship was seen between the test
scores and the managerial composite ratings than between the
test scores and the behavioral criteria. Two of the three
behavioral criteria, average number of service requests and
average number of remakes, were not significantly correlated
with any of the predictors. This may be due to the very
small percentage (28%) of decorators that had these figures
for the entire six month interval. Since computer tracking
of these two variables just began in June, 1989 it was not

71
possible to obtain these figures for the entire six month
interval. Three months of figures (June through August,
1989) were obtained for 53% of the decorators which were
tested and two months of figures (July and August, 1989)
were obtained for 99% of the decorators tested . However,
the correlations were in the hypothesized direction; high
scores on the numerical and space tests were associated with
fewer service requests and remakes.
Another possible reason for the stronger relationship
between the test scores and the managerial ratings is the
rating form itself. The selection battery and the rating
form were both developed from the information obtained in
the job analysis. The form also included definitions of
common rater errors to aid the sales managers in making
their ratings.
A multiple cutoff approach (establishing a minimum
passing score for each test) was recommended. The passing
score proposed for the EAS Numerical Ability test was a
total score of 17 or greater. A passing score of 12 or
greater was suggested for the EAS Space Visualization test.
The passing score suggested for Sales Attitude Checklist was
a total score of 28 or greater. Therefore, proficiency in
one area can not compensate for deficiency in another. The
applicant must demonstrate a minimum level of proficiency in
three areas (numerical, spatial, and sales) in order to
72
achieve favorable results in this first phase of the
selection process, and thus be able to proceed to the next
phase, the structured interview.
Passing scores were set considering two goals of the
selection process: upgrading the quality of the workforce
and managing applicant flow for an entry level position. To
upgrade the quality of the workforce, each passing score was
set at the level that excluded the bottom 20% of the
incumbents who took that test. Of the incumbents which were
tested, 47% received scores below the passing scores on one
or more of the tests. This indicates that if the incumbents
had been applicants, 47% would not have been hired. These
results indicate that the proposed level of the passing
scores would help accomplish the objective of a higher
quality workforce. The selection ratio (SR) for this
position varies from .05, hiring 1 in 20 applicants, to .20,
hiring 1 in 5 applicants. The selection ratio varies
depending on geographical location and time of year. These
passing scores would help the organization to be more
selective when they have an ample number of applicants (SR =
.05). These passing scores would also encourage improved
recruitment of applicants.
To manage applicant flow, the test battery was
recommended to be used as an initial screening device
eliminating those individuals that do not demonstrate the
73
necessary knowledge, skills, and abilities needed to be
successful in this position. Thus, those individuals do not
proceed any further in the selection process, saving their
time as well as the company's time.
Multiple regression was not suggested, because it is
not practical to expect individuals within the field to plug
raw scores into an equation. Field personnel would likely
be resistent due to the complexity of the process and the
time required. This resistance may result in numerous
errors or even abandonment of the selection process.
Ranking was not proposed for two reasons. The
organization has a goal of representativeness and if ranking
was used, achievement of this goal would be difficult due to
typical minority/majority differences in test performance.
Also, the test battery was proposed to be used as an initial
assessment device followed by a structured interview to
assess other job requirements. Thus, a pass/fail approach
seems to be more appropriate.
Three follow-up studies are recommended. The number of
remakes and requests attributable to each decorator for the
entire six month interval were only obtained for a small
percentage of decorators who were tested, this limits the
reliability of these two criteria. Thus, a follow-up study
should be conducted in order to obtain six months of data
concerning the number of service requests and remakes
74
attributable to the decorators which were tested. These
data could then be correlated with the numerical and space
test scores to ensure that a relationship exists as
hypothesized in hypothesis two and three.
Another follow-up study should be conducted to factor
analyze the data. The intercorrelations of the SRA Verbal,
EAS Numerical Ability, and EAS Spatial Visualization were
somewhat higher than expected. This indicates the
possibility of a common second order factor. Thus, if the
data were factor analyzed and a second order factor was
found, then a more advantageous means of selection could
possibly result from using multiple regression with the
Sales Attitude Checklist.
Another follow-up which should be conducted is an
empirical validation study of the structured interview
and/or the entire selection process. The development and
validity of the second phase of the selection process, the
structured interview, is not thoroughly discussed in this
document. However, the basic features of the structured
interview are as follows: (a) each applicant is asked the
same questions, (b) each question is directly related to a
dimension, (c) each question focuses on obtaining examples
of past behavior, and (d) rating anchors are given to guide
consistency of rating.

75
The use of a structured interview was proposed for
numerous reasons. A review of the literature indicated that
two selection procedures were viable means of selection for
the purposes of this study: tests and a structured
interview. The job analysis revealed a variety of
knowledge, skills, and abilities were needed to successfully
perform in this position. By using a structured interview
knowledge, skills, and abilities which would be difficult or
even impossible to assess with paper and pencil tests may be
assessed. The use of a structured interview was also
proposed because as Opren (1985) found, individuals
responsible for hiring generally refuse to stop using the
interview as their primary selection technique even when
informed that tests are more valid predictors of performance
in that job. An interview is the primary selection
procedure that is being utilized to hire decorator
consultants at this time. Thus, by having a selection
process which attempts to measure each KSA in the most
appropriate manner as well as takes into account the
individuals who will administer the process, a valid process
is more likely to be developed as well as sustained.
This study demonstrates the utility of the entire
validation process. If a through review of the literature,
job analysis, and selection of assessment instruments are
first conducted, followed by standardized administration of

76
the selection instruments and comprehensive statistical
analyses, then the objective of demonstrating that a
relationship exists between predictors, selection
instruments, and criteria, measures of job performance, is
achievable. This relationship was observed in this study
due to adherence to the above statement. All that remains
to be done is the cross validation of the present findings.
This study illustrates that the selection of successful
sales personnel was possible by using a personality measure
that was developed specifically for sales selection.
Successful sales selection was also achieved using tests
that measured specific abilities needed to perform
successfully. However, the differentiation of successful
from unsuccessful salespeople was not achieved using a
general mental abilities test. Further research should be
conducted concerning the development of personality tests
for specific populations. If personality tests developed
for a specific populations are valid predictors of
performance within those populations, this would have impact
on test development, test usage, and validation results.
This study also indicates that the measurement of specific
abilities rather than the measurement of "general mental
abilities" may result in a more valid selection process,
further research should be conducted concerning this issue.

APPENDIX A
DECORATOR CONSULTANT SELECTION PROGRAM
PERFORMANCE REVIEW
77
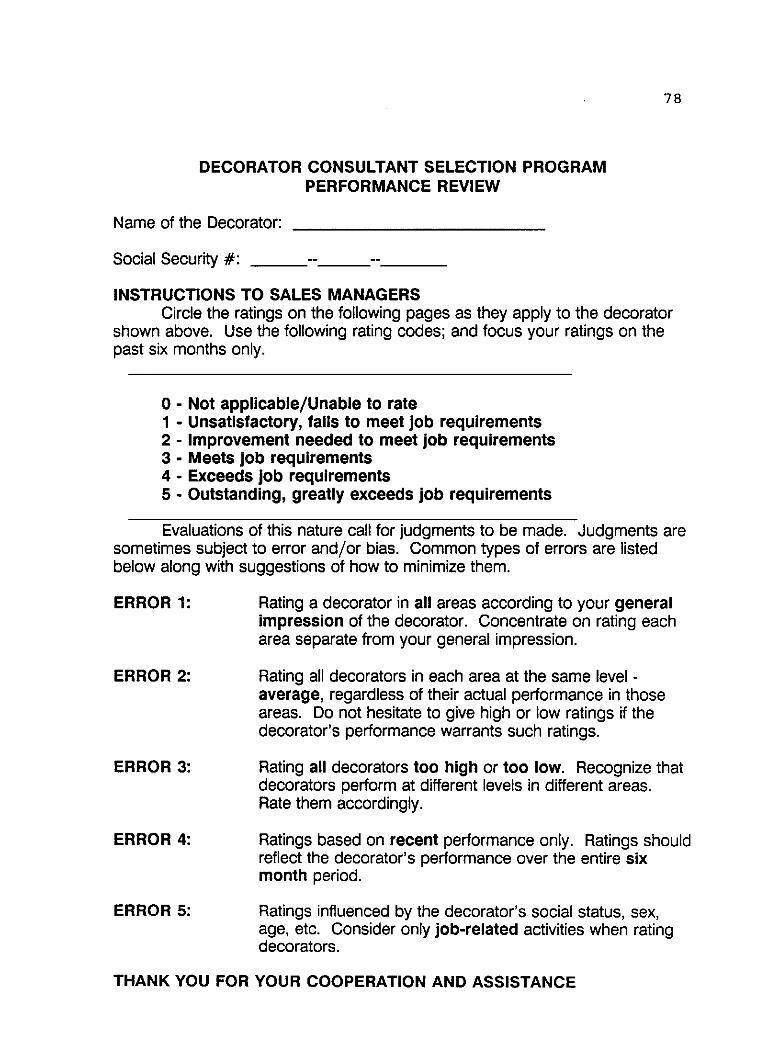
78
DECORATOR CONSULTANT SELECTION PROGRAMPERFORMANCE REVIEW
Name of the Decorator:
Social Security #: -- --
INSTRUCTIONS TO SALES MANAGERSCircle the ratings on the following pages as they apply to the decorator
shown above. Use the following rating codes; and focus your ratings on thepast six months only.
0 - Not applicable/Unable to rate1 - Unsatisfactory, fails to meet job requirements2 - Improvement needed to meet job requirements3 - Meets job requirements4 - Exceeds job requirements5 - Outstanding, greatly exceeds job requirements
Evaluations of this nature call for judgments to be made. Judgments aresometimes subject to error and/or bias. Common types of errors are listedbelow along with suggestions of how to minimize them.
ERROR 1:
ERROR 2:
ERROR 3:
ERROR 4:
ERROR 5:
Rating a decorator in all areas according to your generalimpression of the decorator. Concentrate on rating eacharea separate from your general impression.
Rating all decorators in each area at the same level -average, regardless of their actual performance in thoseareas. Do not hesitate to give high or low ratings if thedecorator's performance warrants such ratings.
Rating all decorators too high or too low. Recognize thatdecorators perform at different levels in different areas.Rate them accordingly.
Ratings based on recent performance only. Ratings shouldreflect the decorator's performance over the entire sixmonth period.
Ratings influenced by the decorator's social status, sex,age, etc. Consider only job-related activities when ratingdecorators.
THANK YOU FOR YOUR COOPERATION AND ASSISTANCE

Appendix A -- Continued
0 - Not applicable/Unable to rate1 - Unsatisfactory, fails to meet job requirements2 - Improvement needed to meet job requirements3 - Meets job requirements4 - Exceeds job requirements5 - Outstanding, greatly exceeds job requirements
SALES ABILITIES
1. CUSTOMER INTERACTION:arrives promptly, greets customer,maintains conversation, listens well,answers questions
2. PERSUASIVE COMMUNICATION:determines what the customer wants(intended uses & preferences ofproducts), advises customers, handlesobjections, & follows through with sale
3. SALES PRESENTATIONS:presents appropriate product samples& pictures of completed treatments,knowledgeable of all products
4. SALES VOLUME:volume as compared to other decorators
DESIGN & PRICE TREATMENTS
1. ACCURATELY MEASURES FORPRODUCT MANUFACTURING &INSTALLATION:measures inside & outside windowdimensions, drapery length & width,carpet yardage
2. EFFECTIVELY DESIGNSTREATMENTS:requires few remakes
CIRCLE RATINGS
0 1 2 3 4 5
0 1 2 3 4 5
0 1 2 3 4 5
0 1 2 3 4 5
0 1 2 3 4 5
0 1 2 3 4 5
79

Appendix A -- Continued
0 - Not applicable/Unable to rate1 - Unsatisfactory, fails to meet job requirements2 - Improvement needed to meet job requirements3 - Meets job requirements4 - Exceeds job requirements5 - Outstanding, greatly exceeds job requirements
3. ACCURATELY CALCULATES PRODUCTSIZES, AMOUNTS, & PRICES:calculates drapery & drapery trim yardage,fabric for accessory items, labor charges,& price breaks
CIRCLE RATINGS
0 1 2 3 4 5
CUSTOMER SERVICE
1. SPECIAL FUNCTIONS: 0 1 2 3 4 5informs customer of payment options,& delivery date. Also, handles customercomplaints & processes remakes
2. MAINTAINS CUSTOMER CONTACT: 0 1 2 3 4 5gives customers status reports on theirorders, inquires about customer satisfaction,conducts mailouts, attains referrals
ADMINISTRATIVE DUTIES
1. ACCURATELY COMPLETESPAPERWORK:fills-out work orders, purchase orders,sales slips, & right to cancel slips
2. EFFECTIVE INTERNALCOMMUNICATION:communicates effectively with; servicecenter, the credit department,& the studio coordinator
OVERALL RATING AS ADECORATOR CONSULTANT
0 1 2 3 4 5
0 1 2 3 4 5
0 1 2 3 4 5
80

APPENDIX B
ADMINISTRATION PROCEDURES
81
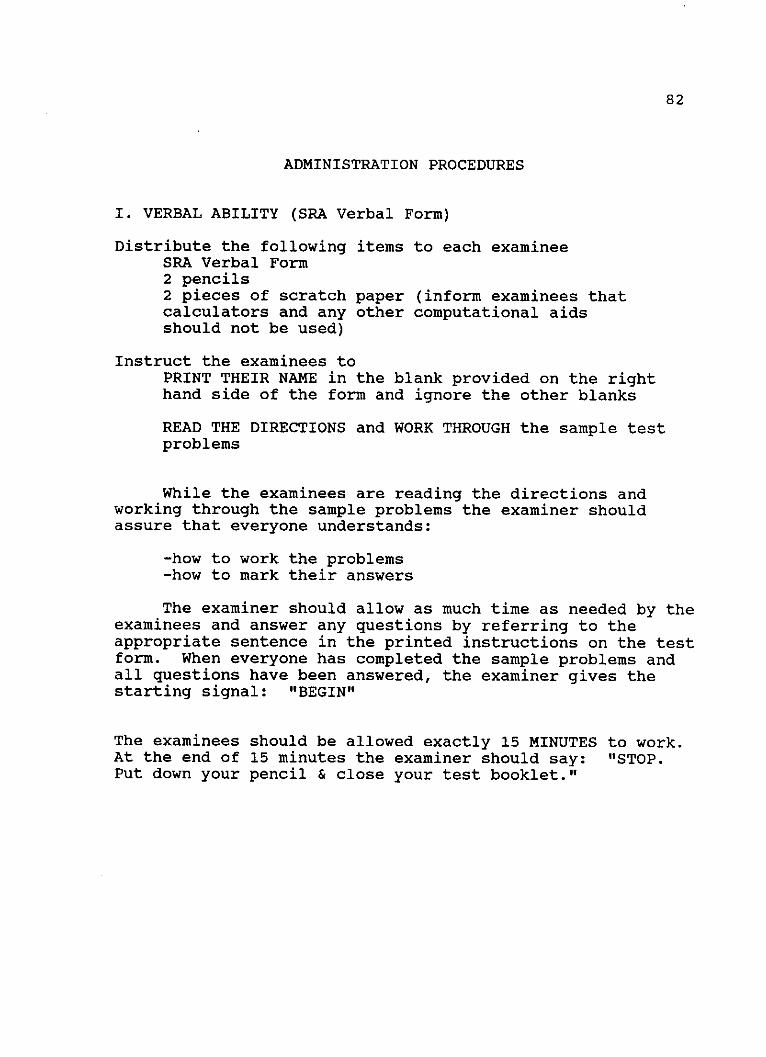
82
ADMINISTRATION PROCEDURES
I. VERBAL ABILITY (SRA Verbal Form)
Distribute the following items to each examineeSRA Verbal Form2 pencils2 pieces of scratch paper (inform examinees thatcalculators and any other computational aidsshould not be used)
Instruct the examinees toPRINT THEIR NAME in the blank provided on the righthand side of the form and ignore the other blanks
READ THE DIRECTIONS and WORK THROUGH the sample testproblems
While the examinees are reading the directions andworking through the sample problems the examiner shouldassure that everyone understands:
-how to work the problems-how to mark their answers
The examiner should allow as much time as needed by theexaminees and answer any questions by referring to theappropriate sentence in the printed instructions on the testform. When everyone has completed the sample problems andall questions have been answered, the examiner gives thestarting signal: "BEGIN"
The examinees should be allowed exactly 15 MINUTES to work.At the end of 15 minutes the examiner should say: "STOP.Put down your pencil & close your test booklet."

Appendix B -- Continued
II. NUMERICAL ABILITY
Distributea test form (directions side up)2 pencils with erasers2 pieces of scratch paper (inform examinees calculatorsand any other computational aids should not be used)
Instruct examinees-NOT to turn the sheet over until the signal is given-PRINT THEIR NAME in the blank provided on the lefthand side of the test form and ignore the other blanks
THEN SAY:I am going to read the directions with you. Follow
them carefully. Look at the sample problems below. Eachproblem is followed by four possible answers and an "X."You are to work each problem and put a heavy black markbetween the little dotted lines below the correct answer.If the correct answer is not given, make a heavy black markbetween the dotted lines below the X. Now work the sampleproblems below. The first one has been answered correctly.
Allow time for the examinees to answer the sample problems.Then say: Beginning with sample problem number 2, youshould have marked 6, 25, X, 13. Are there any questions?Clarify any questions. Then say:
On the back of this sheet are 75 problems. They aredivided into 3 parts. When the signal is given you are toturn this sheet and work as many of these problems as youcan beginning with Part I. At the end of 2 minutes I willsay "Stop on Part I, go to Part II." After 4 minutes I willsay "Stop on Part II, go to Part III." You will have 4minutes for Part III. If you finish a Part early, checkyour work on that part while waiting for the signal to go tothe next part. Are there any questions?Clarify any questions. Then go on:
Work as fast and accurately as possible. Remember thatthe correct answer is not always given. When the correctanswer is not given, mark the space below "X." Make nomarks except your answers on the reverse side of the sheet.If you want to change an answer, erase completely.
READY. . .GO!
At the end of exactly 2 minutes say:STOP on Part I. GO on to Part II.
At the end of exactly 4 more minutes say:STOP on Part II. GO on to Part III.
At the end of exactly 4 more minutes say:STOP (and collect the papers)
8-3
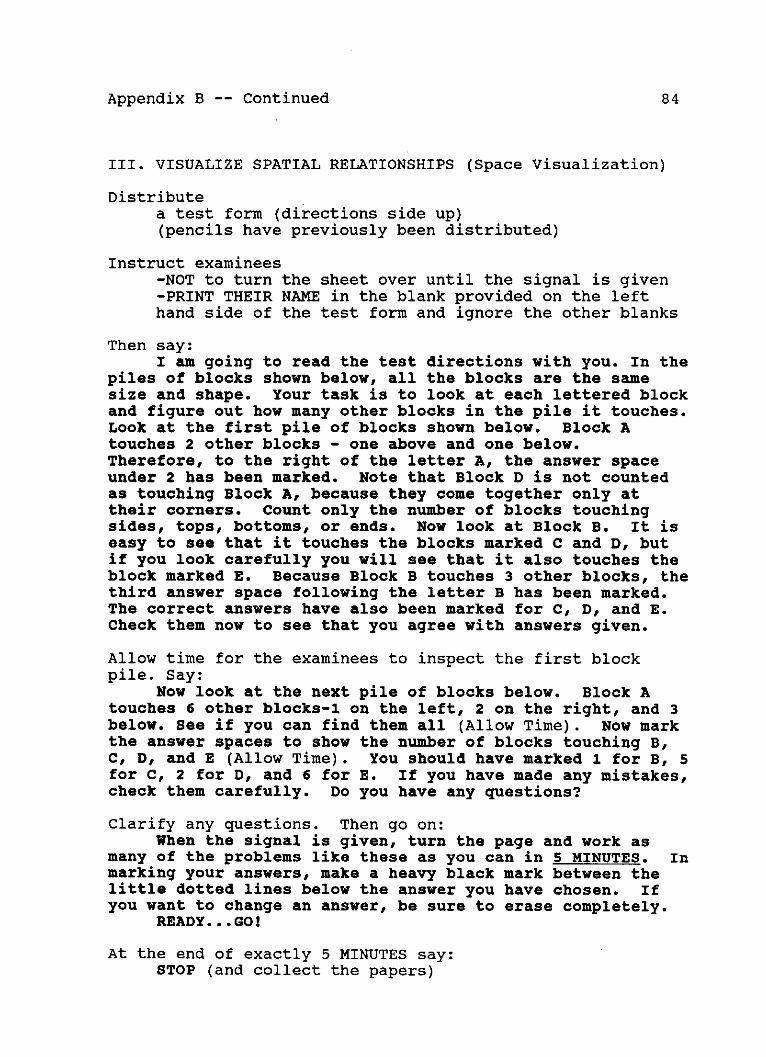
Appendix B -- Continued
III. VISUALIZE SPATIAL RELATIONSHIPS (Space Visualization)
Distributea test form (directions side up)(pencils have previously been distributed)
Instruct examinees-NOT to turn the sheet over until the signal is given-PRINT THEIR NAME in the blank provided on the lefthand side of the test form and ignore the other blanks
Then say:I am going to read the test directions with you. In the
piles of blocks shown below, all the blocks are the samesize and shape. Your task is to look at each lettered blockand figure out how many other blocks in the pile it touches.Look at the first pile of blocks shown below. Block Atouches 2 other blocks - one above and one below.Therefore, to the right of the letter A, the answer spaceunder 2 has been marked. Note that Block D is not countedas touching Block A, because they come together only attheir corners. Count only the number of blocks touchingsides, tops, bottoms, or ends. Now look at Block B. It iseasy to see that it touches the blocks marked C and D, butif you look carefully you will see that it also touches theblock marked E. Because Block B touches 3 other blocks, thethird answer space following the letter B has been marked.The correct answers have also been marked for C, D, and E.Check them now to see that you agree with answers given.
Allow time for the examinees to inspect the first blockpile. Say:
Now look at the next pile of blocks below. Block Atouches 6 other blocks-1 on the left, 2 on the right, and 3below. See if you can find them all (Allow Time). Now markthe answer spaces to show the number of blocks touching B,C, D, and E (Allow Time). You should have marked 1 for B, 5for C, 2 for D, and 6 for E. If you have made any mistakes,check them carefully. Do you have any questions?
Clarify any questions. Then go on:When the signal is given, turn the page and work as
many of the problems like these as you can in 5 MINUTES. Inmarking your answers, make a heavy black mark between thelittle dotted lines below the answer you have chosen. Ifyou want to change an answer, be sure to erase completely.
READY...GO!
At the end of exactly 5 MINUTES say:STOP (and collect the papers)
84
Appendix B -- Continued
IV. SALES ATTITUDES (Sales Attitude Check List)Distribute
A test form (directions side up)(pencils have previously been distributed)
Instruct examinees-PRINT THEIR NAME in the blank provided on the left
hand side of the test form and ignore the other blanks
Then say:This is a measure of your sales attitudes and habits.
Now read the printed instructions silently while I read themaloud. This booklet contains statements that are commonlyused by salespeople to describe their attitudes andbehaviors. These statements are grouped into sets of four.Read over the four statements in a set and think of yourperformance as a salesperson. Select the one statement inthe set that is most like you. Put an X in the box besidethat statement in the column headed M (for most). Thenconsider the remaining three statements in the set. Decidewhich one of these three is least like you and put an X inthe box beside that statement in the column headed L (forleast). Leave the boxes besides the other two statements inthe set blank.
Look at the completed example below. Note that one(and only one) box has been marked in the M column and one(and only one) box in the L column.
At times you may find that it is difficult to decidewhich statements to mark because you feel that none of thestatements in a set describes you very well. Make the bestchoice you can. Do not skip any sets, because the bookletcan not be scored properly if you do not work through everyset. Be sure that in each set you always mark one statementas most like you and one statement as least like you, andthat you leave the remaining two statements unmarked.
If you wish to change an answer, draw a circle aroundthe choice you have marked. Then put a new X in the boxbeside the statement that you feel is a better choice.There is no time limit for this checklist.
Answer any questions. Then say:Even though some choices will be difficult to make, do
not spend too much time on any one item. If the choicesseem about equal to you, make the first one that comes toyour mind, but DO NOT omit any items or your Checklistcannot be scored. Be sure to mark one 'M' and one 'L' ineach set. If you want to change an answer, draw a circlearound your first 'X' and then mark your new answer.
When the applicants are finished collect all materials.Make sure the applicant's name is on each part of the test.
85

APPENDIX C
SCORING PROCEDURES
86
87
SCORING PROCEDURES
I. NUMERICAL ABILITY
*Place the Numerical Ability RIGHTS key, printed sideup, over the test form so that all edges line up.The key must be positioned so that only answer spacesare visible through the holes.
*Count the number of answer marks showing through theholes (in parts I-III), this is the total rightsscore. Record this score on the applicant's ScoreRecord in the appropriate blank
*In the same manner, place the WRONGS key over theanswer sheet & count the number of marks showing
through the holes (in parts I-III), this is the totalwrongs score. Record this score on the applicant'sScore Record.
*Use the enclosed Numerical Ability Table (p. 8) toobtain the Total Score
- Go down the Wrong Score column until you findthe row in which the applicant's wrongs scorefalls
- Trace this row across to the column whichcorresponds to the applicant's Rights Score
- The number in the body of the table at thisintersection of the wrongs score row & therights score column is the Total Score
- Record this score on the applicant's ScoreRecord
*For example, if an applicant obtains a rights scoreof 21, and a wrongs score of 20, then the applicant'stotal score would be 16. Similarly, a rights scoreof 55 and a wrongs score of 4 would result in a totalscore of 54. See the table for these answers.

Appendix C -- Continued
Table C-l
Numerical Ability Table
0.N
ti
F,N
F,S
F,6
#4
.4F,
0
F,
0.N
N
N
p.N
3%4
O
#4
6
f6#4
4
60#4
N
.4
N
8 4
'4
#4
.4
.4
.40
'4
0.
0.
3%
N
N
6
F,
N4
0
nI n
nh nnn
nnn
fin "
r n anf F
nm@nnnne n
N.10
nnnj
n n N
n9 n
00.0n Na.0 h
N N N
a h %0
h O
NNNr n NN N N4
O a aN r4 4
r4 V4 rd
9%
r4 r4 r4
66l
,4 f 4
f6 F,4 O
10 n N
r,.400
a00.
a0 h ,4
n
0.03%
0006
'.44.
3%66
'.4.4.
IA m.
IVjnM N
ri4 O
0040
aNN
nN N
nejej00.0nlj@j
0oI.0
Inq*n
vNN NCNNNnN NNri0
A 4ONNf9eO1
.j~j4j
03%'0
.jr43%66b
In e e4r4 r4 r1rA h
r4 r4 r4Ajn N
r!4 Ae4
t, r 4 0At r4 O4
r4 rlO A cr4
A co '
14 1% j
N0 60.N 1060
1 4 .4,44 jff.F
W 4 V4 V 4 49I a;:La 400161
88
O oN N N01oN N
nN N
.- %to
rm N
.400.
N N N
n~j"00.0
n N
NNN0.0ON('4
03%'@
"4""
3%'06""#4
6646
.j 0 a
.4.4,
('4.404
"4""
.400.
"#4.41
to qv1A Ae4
fN(00.0
4.404
000%4040
0006.4.4.4
0006e 6 -#
.400
.4.4
.4e4
0.03%
03%'
3%66
6OO6
661'S
6(5(4
nrl,4
#4,40
O400
a
N
.NNN
a0 t
N NN*4 N
NNIO A ANC'.
#4 #4
O4A
#44
n#4.4#- .j #4
.j,40
%a 0 -AAA
.400.'
'4 ,4,ee
.4.A H/ %6
O it
r O O
.4.4.
3%66
.4.404
0046
04.4.
0005
.4.4.4
0 04
.000
.4,4
00.0
.4O
0.03%
.OO 6
3%66
666
O6(5
6fl#4
n#4.4
('4.4
O400
N#4 #0.
.4 00.
NNr4
i O"4ri.40.03%
.4i4.
.4.,4.
3%66
4944
.4.4.4
66b9
'en
.4,4.-4
0 A-m
06400.4091-0e
.4.04
000
goo
.4
000
000
.3%
.000
000
000
000
000seg
000 -G
000 O
000 O
000 O
000
000
000
000
000
a3%6
'4
0t
0.
a
a
A
3%
a
aa
a66A.4
a
a
0
60.
a
aa0.a
a
3%
"
a
6a6
"
66
F,
"
#4
6
'4
6
0
6
A.
6
0.
6
3%6
6s6
6
#46
.4
6In6
Nt1
NM
r4 03%3%
O0A co
06%'
I6nq
v4 0 0
666
le40
6 n1j040
03 6
I6nN lO In
Sa a n
40 r e
6 6.400
00.0
In r rGba Nia
666 O
co N.0
666
03% 6666
qw 40w
N%66
O666
666666
F, ('.
00.0
Gb ca
6 nej
0.03%n9j F
66'O
6
66
n
.40
O A"en1
inn
nnn
@m mine
nnj66.j
nRj n
'0
O
A
h
N 'OIn
"m
6101
na 04o a 1A
r1 0 A601090
(h6
a"
mCIO .-
66"
66r66"
m..
669
66'0
61'S
6ee
n#4In"
666
(1'.4666
.400.666
00.0666
0.03%666
03%6w
6na
666
N.j:j
Q
V
E4milH
nN.4
#4.0
r400
000
000
000
000
a"0 "0. v0. .N. O'.1 4 0 , 4 606 0n ""t 060I WAI 4 1 '1,1. 1 1 1 1 1 1
1" I 0.+ a %, USoot h ,4 a__,__1NNj ____ ____I w
x
Appendix C -- Continued
II. SPACE VISUALIZATION
- Place the Space Visualization RIGHTS key, printedside up, over the test form so that all edges lineup. The key must be positioned so that only answerspaces are visible through the holes.
*Count the number of answer marks showing through theholes, this is the rights score. Record this scoreon the applicant's Score Record in the appropriateblank
*In the same manner, place the WRONGS key over theanswer sheet & count the number of marks showingthrough the holes, this is the wrongs score. Recordthis score on the applicant's Score Record.
*Use the enclosed Space Visualization Table (p. 10) toobtain the Total Score
- Go down the Wrong Score column until you findthe row in which the applicant's wrongs scorefalls
- Trace this row across to the column whichcorresponds to the applicant's Rights Score
- The number in the body of the table at thisintersection of the wrongs score row & therights score column is the Total Score
- Record this score on the applicant's ScoreRecord
*For example, a rights score of 34 and a wrongs scoreof 25 would result in a total score of 29.
89

Appendix C -- Continued
Table C-12
Space Visualization Table
N0
a"N
.90
N
N.9
N
NO
#4
U,.4
0
0N
N"
#4
.9
#4
N#-
.9
#40
#4
M#
#4
.4
a#4
.9
.4
N
.4
I,
.4N9.4N.4N9
.4
0.4
#4.4
.4
"
N9
0
N9
N
0
* r '@
ynna
eann
09nfnne
1'1 N
O A 0
fnn
fnn
A1.40finn
A 0 P
N n N00r
gin n
tl'@0
ow
gin"
N nN
""n
ANr
0(1.4
Nin n
gin n
ra,,
" V4
000
".4.4
.44.
* r% %aA.44
r4 4 t.44.
44.4
0010.4.4.4
"
n40
0004.
nnnfr innonfn fi
finn
fnnfin L
m0f%fin
gin
N N N
N N
in"N N.N
(1""
0.90
gin N N.N
.40-"".4
0.9*"4.4
to n
4 .4
Ar
o A a
-"''0
M44.
e"'@00.0
000.
0 i
.44.
NIOfnn
non i
0010finn
rhi A
nhe
gin n.f N
""Li
"gne.40 .
"".40.9@
".4.4
N N N
to v
.4.4.
N N N
AN"
MC.4.
N A 0
.4.4.4
r+0.9
.4.4.4
0.90
c44w
Nri
A 0(A.4.4.4
10(1.4. 4.
te.4.44.4
A.40V4.4.40.90
.4 N1
A N 1"
'I"'.r
N "'@O
A r4.r
40q0
+000
0000
000
NI N lNA rl N noN A
ocoim m ioo"
NPb t
N(10hr
gin
gin.90
h ON"1
".4N1
.40an
eco4hAA a
A A
.4 .4
ea
.1
.-. 4
.4 .4
.4.4
0.9.4.4
.0
.4A.4
.40
to
4.4
r.4
.40
00"
"0
'0
0.9
.0
00
00
00
h
.9
0N'
#4
Vr
I
N9.9
VIv9
a9v9.9
.4
0VI
aIa
.90VIa.9Nr0
14000VI.9"
.9
v%
.9
.9
0
.9Ai
0h"
.9
N1"h4
Nooih h
.-1
h h'
O A@
(1.140
i0t9
000
* 80%N
0 O t
000
101.4h 000(1.41000~14001
a r"141414
(' NN.9.9.
N'N0.9
.9.9.
0.9fi.9.9.
.9 fi (1
.9.9.
fio.4.9.9.9
.9 in 0108%finn
'O
0
00
00
0r
00
00
n h.4
10010
0108%
100 t.9.9.9
'@0.9
.90 gi.9.9.94fir..9.9.9
.9.9.9
r4O0 Q.9.9fi
0010
(4(01%
nfl fi
!'f
fiO
Oa
(44e
.9.9
mm0.9.9
01r
("@
In .rn
.9 i Li.C nnCn
fi$.4
nnn
1 4 4 ##U
~~ MMO.900 .90Mm
90
V1

Appendix C -- Continued
IV. SALES ATTITUDE CHECKLIST
*Tear off the perforated edge on the right of the testbooklet & discard the carbon insert. Turn to the lastpage in the test booklet.
*Begin where it signifies to begin (lower left-handcorner) and follow the arrows up & down the columnscounting the boxes marked with an X. DO NOT COUNT abox if a circle has been draw around the X in thatbox.
*Record this number in the scoring table in the celllabeled "X" boxes.
*Next, count the number of blank circles following thesame path. DO COUNT an X circled by the applicant
within a circle as a blank circle.
*Record this number in the scoring table in the celllabeled blank circles
-Add the two numbers within the scoring table toobtain the Total Score
*Record the Total Score in the corresponding blank onthe applicant's Score Record
91

APPENDIX D
JOB DIMENSIONS
92
93
JOB DIMENSIONS
1. Sales Ability
Persuasive self-expression when presenting ideas orproducts to an individual. Includes gathering andconveying information as well as adjusting one'scommunication style to that of others. Decorators mustpresent various ideas and products in a persuasivemanner. They must also attempt to understand customers'needs, and be able to meet these needs in a way which isprofitable for the company.
KSAO's: Ability to effectively communicate verballyAbility to persuasively communicateAbility to make sales presentations
2. Planning & Organizing
Establishing a course of action for meeting specifiedwork objectives. Includes setting priorities & followingthrough with results. Decorators must plan/organize theirschedules. Decorators must also determine appointmenttimes and lengths, schedule time for paperworkcompletion, and ensure adequate studio time.
KSAO's: Ability to organize & manage one's timeAbility to attend to detail
3. Adaptability
Maintaining effectiveness in varying environments andwith numerous types of individuals. Decorators need toadjust their sales presentations in accordance withcustomers' tastes & wishes.
KSAO's: Ability to adapt one's behavior to changingsales encountersAbility to handle sales objectionsAbility to persist
Appendix D -- Continued
4. Attention to Detail
Focusing on component parts or aspects of a situation.Decorators must accurately complete sales slips & workorders with minimal errors. Decorators must alsomaintain price lists, lists of discontinued items, &lists of policy changes which are all particular parts ofa quality and up-to-date sales presentation.
KSAO's: Ability to attend to detailAbility to communicate effectively throughwriting
5. Verbal Ability
Effective self-expression. Includes the ability togather and convey information accurately. Decoratorsmust greet and establish a rapport with customers. Theymust also answer and ask questions.
KSAO's: Ability to effectively communicate verballyAbility to persuasively communicate
6. Numerical Ability
Manipulating numbers with accuracy and reasonable speed.Decorators must calculate window product sizes andprices. They must also calculate price breaks anddiscounts.
KSAO's: Ability to add, subtract, multiply, and dividewhole numbers and/or fractions (including thecalculation of percents)
7. Spatial Relation Ability
Visualizing relationships between objects, and betweenobjects and their environment. Decorators must visualizethe existence of window products in order to determine ifthey will fit appropriately and fulfill the purpose theywere intended to fulfill.
KSAO's: Spatial Relations Ability
94

APPENDIX E
TASK STATEMENTS WITH INCUMBENT RATINGS
95
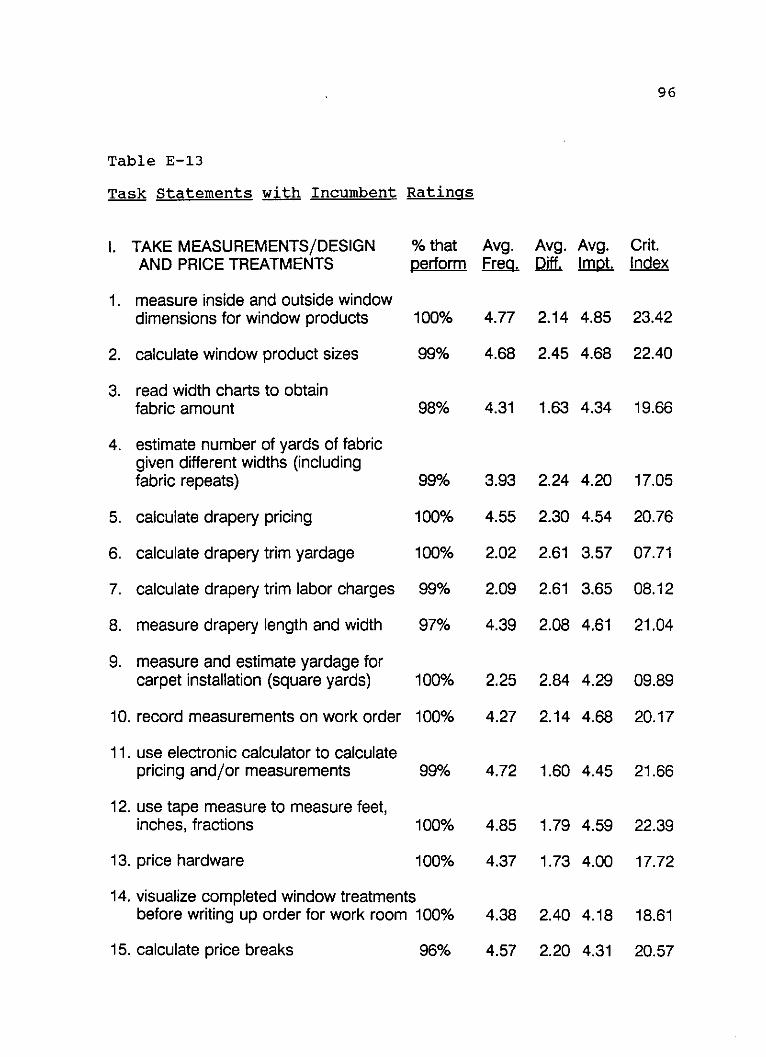
Table E-13
Task Statements with Incumbent
I. TAKE MEASUREMENTS/DESIGNAND PRICE TREATMENTS
1. measure inside and outside windowdimensions for window products
2. calculate window product sizes
3. read width charts to obtainfabric amount
4. estimate number of yards of fabricgiven different widths (includingfabric repeats)
5. calculate drapery pricing
6. calculate drapery trim yardage
7. calculate drapery trim labor charges
8. measure drapery length and width
9. measure and estimate yardage forcarpet installation (square yards)
10. record measurements on work order
11. use electronic calculator to calculatepricing and/or measurements
12. use tape measure to measure feet,inches, fractions
Ratings
% thatperform
100%
99%
Avg.Freq.
4.77
4.68
Avg.Duff.
2.14
2.45
Avg.Impt.
4.85
4.68
98% 4.31 1.63 4.34
99%
100%
100%
99%
97%
100%
100%
3.93
4.55
2.02
2.09
4.39
2.25
4.27
2.24
2.30
2.61
2.61
2.08
2.84
2.14
4.20
4.54
3.57
3.65
4.61
4.29
4.68
99% 4.72 1.60 4.45
100%
13. price hardware 100%
14. visualize completed window treatmentsbefore writing up order for work room 100%
15. calculate price breaks 96%
4.85
4.37
4.38
4.57
1.79
1.73
2.40
2.20
4.59
4.00
4.18
4.31
96
Crit.Index
23.42
22.40
19.66
17.05
20.76
07.71
08.12
21.04
09.89
20.17
21.66
22.39
17.72
18.61
20.57
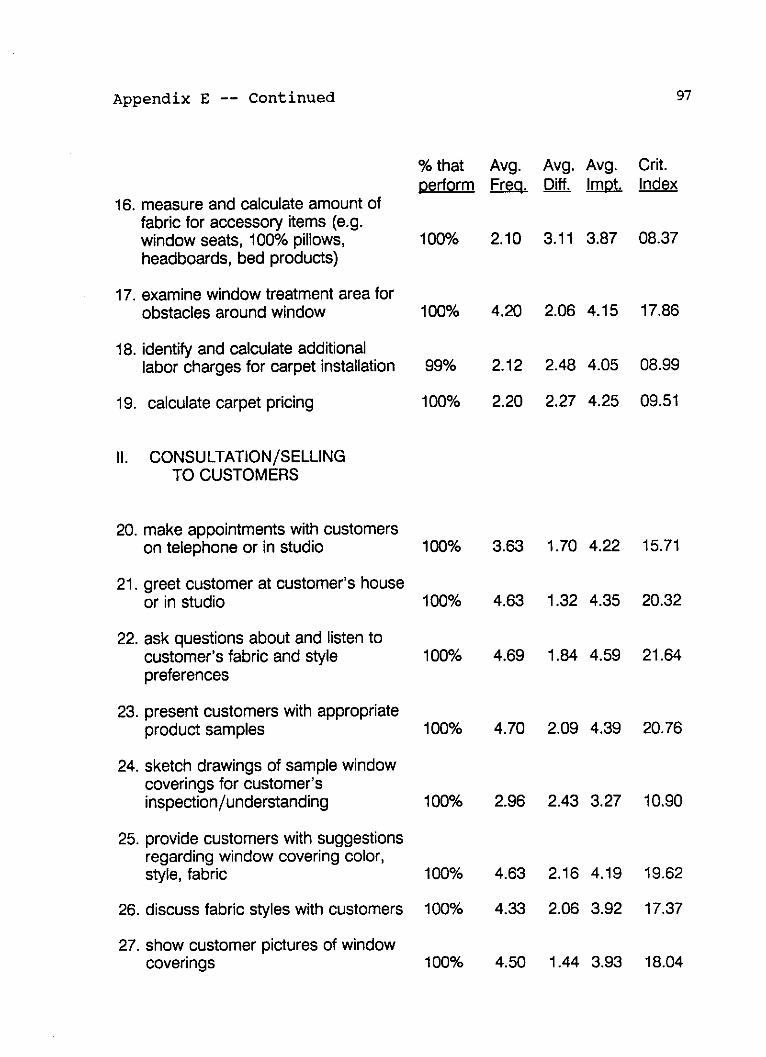
Appendix E -- Continued
% thatperform
16. measure and calculate amount offabric for accessory items (e.g.window seats, 100% pillows,headboards, bed products)
17. examine window treatment area forobstacles around window
18. identify and calculate additionallabor charges for carpet installation
19. calculate carpet pricing
II. CONSULTATION/SELLINGTO CUSTOMERS
20. make appointments with customerson telephone or in studio
21. greet customer at customer's houseor in studio
22. ask questions about and listen tocustomer's fabric and stylepreferences
23. present customers with appropriateproduct samples
24. sketch drawings of sample windowcoverings for customer'sinspection/understanding
25. provide customers with suggestionsregarding window covering color,style, fabric
26. discuss fabric styles with customers
27. show customer pictures of windowcoverings
Avg.Freg.
Avg.Diff.
Avg.Impt.
100% 2.10 3.11 3.87
100% 4.20 2.06 4.15
99% 2.12 2.48 4.05
100% 2.20 2.27 4.25
100% 3.63 1.70 4.22
100% 4.63 1.32 4.35
100% 4.69 1.84 4.59
100% 4.70 2.09 4.39
100% 2.96 2.43 3.27
100% 4.63 2.16 4.19
100% 4.33 2.06 3.92
100% 4.50 1.44 3.93 18.04
Crit.Index
08.37
17.86
08.99
09.51
15.71
20.32
21.64
20.76
10.90
19.62
17.37
97
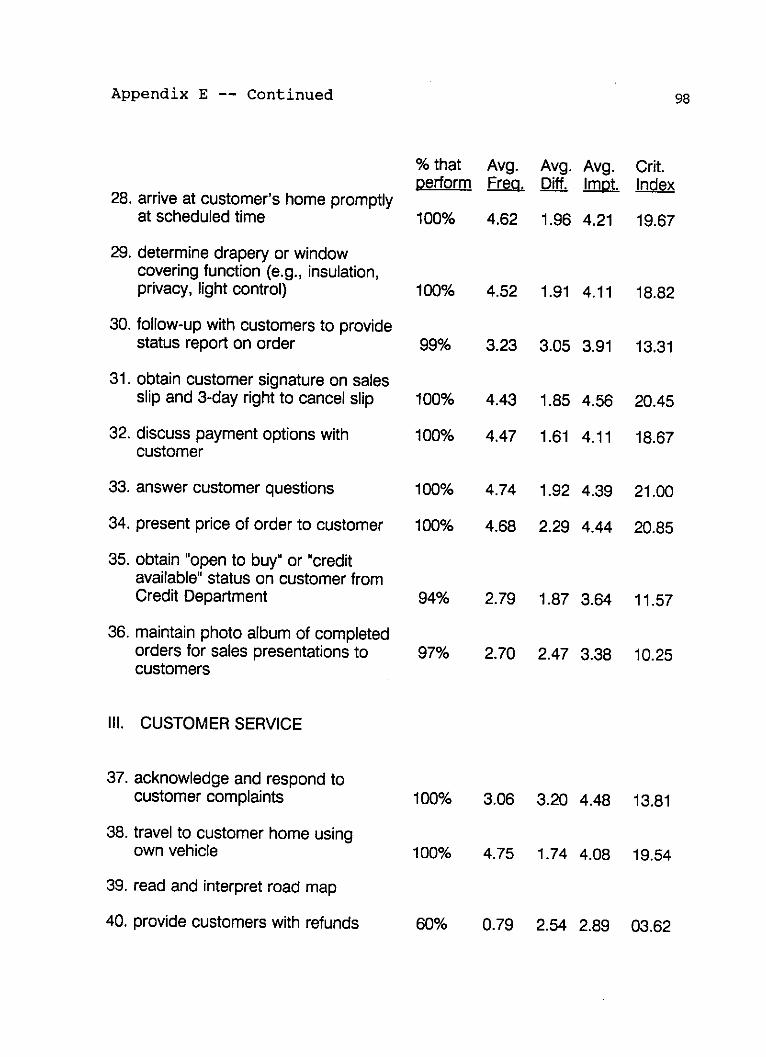
Appendix E -- Continued
28. arrive at customer's home promptlyat scheduled time
29. determine drapery or windowcovering function (e.g., insulation,privacy, light control)
30. follow-up with customers to providestatus report on order
31. obtain customer signature on salesslip and 3-day right to cancel slip
32. discuss payment options withcustomer
33. answer customer questions
34. present price of order to customer
35. obtain "open to buy" or "creditavailable" status on customer fromCredit Department
36. maintain photo album of completedorders for sales presentations tocustomers
% thatperform
100%
Avg.Freg.
4.62
Avg.Diff.
1.96
Avg.Impt.
4.21
100% 4.52 1.91 4.11
99% 3.23 3.05 3.91
100%
100%
100%
100%
4.43
4.47
4.74
4.68
1.85
1.61
1.92
2.29
4.56
4.11
4.39
4.44
94% 2.79 1.87 3.64
97% 2.70 2.47 3.38
III. CUSTOMER SERVICE
37. acknowledge and respond tocustomer complaints
38. travel to customer home usingown vehicle
39. read and interpret road map
40. provide customers with refunds
100% 3.06 3.20 4.48
100% 4.75 1.74 4.08
60% 0.79 2.54 2.89
Crit.Index
19.67
18.82
13.31
20.45
18.67
21.00
20.85
11.57
10.25
13.81
19.54
98
03.62

Appendix E -- Continued
% thatperform
41. process customer remakes or 100%reworks
42. communicate appropriate deliverydate to customer 100%
43. establish rapport with customers 100%
44. follow-up with customers regardingtheir satisfaction with completed order 100%
45. communicate order status to customerswhile order is being fabricated 94%
46. communicate with Service Centeron phone or in person regardingany customer service issue/problem 100%
Avg.Freg.
1.76
4.33
4.76
Avg.Diff.
2.68
2.11
1.65
Avg.Impt.
3.96
4.14
4.65
3.21 2.40 3.96
2.40 3.04 3.48
3.01 3.13 4.23
IV. COMPLETE PAPERWORKFOR ORDERS
47. draw-up drapery sketches/picturesto be used by work room
48. draw-up alternate window productsketches/plans to be used bywork room
49. fill-out and complete work orders
50. fill-out and complete purchase orders
51. fill-out and complete sales slips
52. fill-out and complete "right to cancel"sheet
53. compile sales order pricing (totalsale) components for inclusion onsales slips
100% 2.94 2.42 3.85
94%
100%
53%
100%
1.85
4.31
2.07
4.39
2.15
2.63
2.34
1.84
3.17
4.74
4.40
4.53
100% 4.30 1.52 3.98
11.93
07.03
20.66
18.20
20.06
17.77
100% 4.28 2.15 4.24
Crit.Index
07.09
18.41
22.36
13.26
09.29
13.16
99
18.51
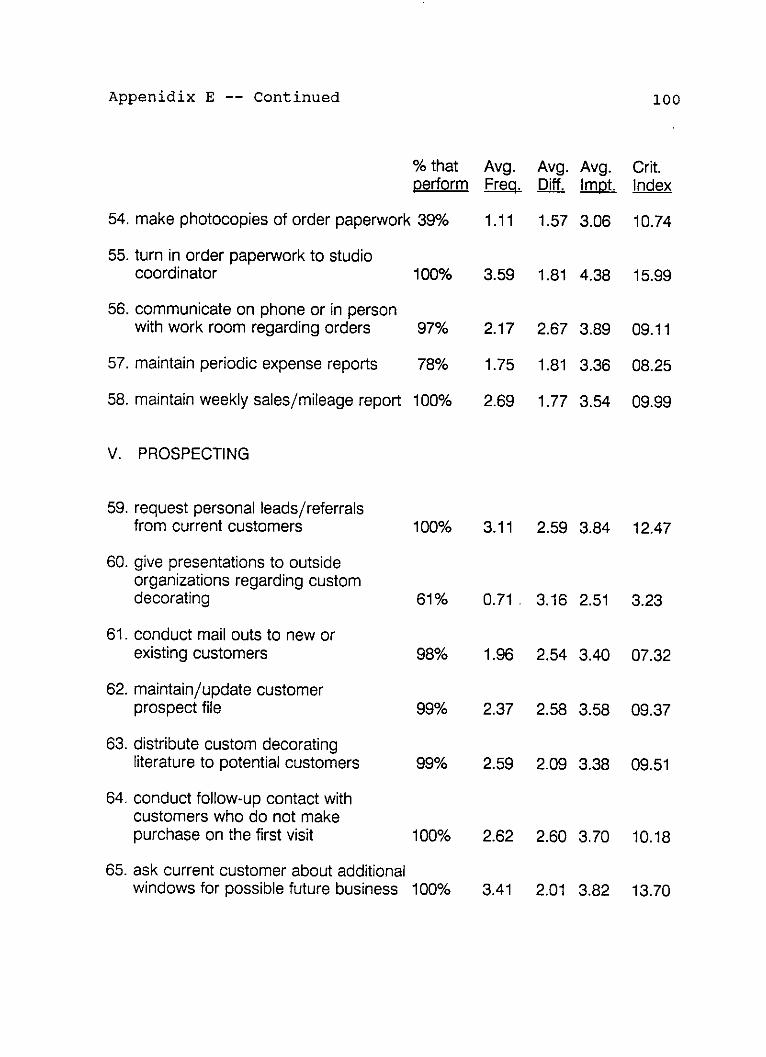
Appenidix E -- Continued
% thatperform
54. make photocopies of order paperwork 39%
55. turn in order paperwork to studiocoordinator 100%
56. communicate on phone or in personwith work room regarding orders 97%
57. maintain periodic expense reports 78%
58. maintain weekly sales/mileage report 100%
Avg.Freg.
Avg.Diff.
Avg.Impt.
1.11 1.57 3.06
3.59 1.81 4.38
2.17 2.67 3.89
1.75 1.81 3.36
2.69 1.77 3.54
V. PROSPECTING
59. request personal leads/referralsfrom current customers 100%
60. give presentations to outsideorganizations regarding customdecorating 61%
61. conduct mail outs to new orexisting customers 98%
62. maintain/update customerprospect file 99%
63. distribute custom decoratingliterature to potential customers 99%
64. conduct follow-up contact withcustomers who do not makepurchase on the first visit 100%
65. ask current customer about additionalwindows for possible future business 100%
3.11 2.59 3.84
0.71. 3.16 2.51 3.23
1.96 2.54 3.40
2.37 2.58 3.58
2.59 2.09 3.38
2.62 2.60 3.70
3.41 2.01 3.82 13.70
Crit.Index
10.74
15.99
09.11
08.25
09.99
12.47
07.32
09.37
09.51
10.18
100

Appenidix E -- Continued
VI. UPDATE/MAINTAIN FILES % that& RECORDS perform
66. read and use computer printoutsregarding back orders 97%
67. read and use computer printoutsregarding discontinued items 100%
68. read and implement computerprintouts regarding Custom Decoratingprocedural changes 100%
69. maintain accurate and up-to-dateprice lists 100%
70. maintain accurate and up-to-dateproduct samples 100%
Avg.Freg.
Avg.Diff.
Avg.Impt.
2.45 2.45 3.42
2.67 2.50 3.87
2.54 2.41 3.73
2.41 2.42 4.34
2.24 2.65 4.19
VII. STAFF STUDIO
71. answer phone calls in studio
72. staff in-store studio as scheduled
73. assist new decorators (answerquestions, allow ride-along)
74. shop the competition
75. use computer terminal in studio tocheck on status of orders
76. design studio displays
77. make entries in and update orderfollow-up log
100%
96%
92%
94%
49%
76%
4.01
2.70
1.55
1.40
1.13
0.90
1.66
1.80
1.88
2.36
2.57
2.27
3.82
3.82
2.87
2.88
3.54
2.81
15.68
11.32
05.34
04.86
10.34
03.34
70% 1.66 2.42 3.43 09.37
Crit.Index
09.22
10.81
10.24
10.90
10.01
101

Appenidix E -- Continued
VIII. TRAINING-RELATED ACTIVITIES
78. attend outside seminars on anytopic related to custom decorating
79. attend and participate incompany meetings
80. attend company sponsoredfollow-up/advanced training
% that Avg. Avg. Avg. Crit.perform Fre. _Duff. Impt. Index
86% 1.11 2.10 2.87 03.93
100% 1.46 1.73 3.66 05.67
91% 1.12 1.80 3.67 04.58
102

APPENDIX F
BIVARIATE DISTRIBUTIONS
103

Appendix F -- Continued 104
00
000
e," "0
"0
"
*"0*- 0
N
"
"
S 0 * . S o
*0 . .
.* 00o
_ " ." o
* 0 * E *
06
0 SD
*
* -
0 0*" 6
a,
"
0)0
0o 0Cl) " 0
G) U)
CO 0a) LO0
c@1 c) C) N N
Cl)
Figure 1. Relationship between Sales Attitude Test Scores
and Average Sales Volume.
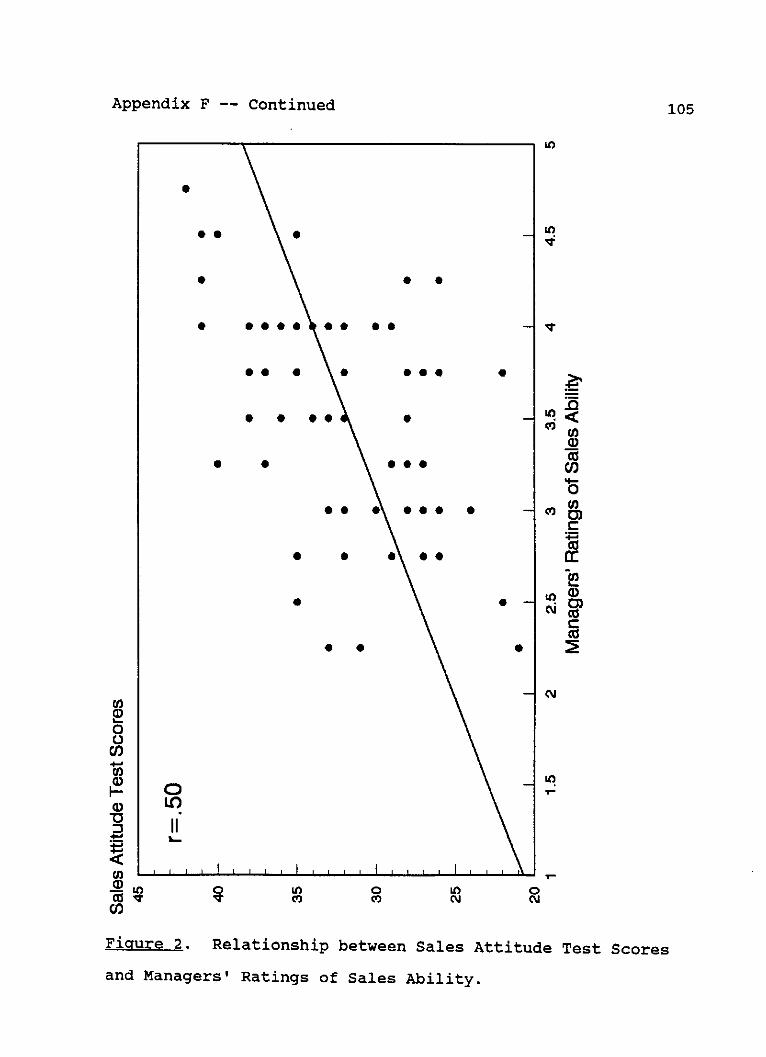
Appendix F -- Continued 105
U)
"
" " " " " " - ".
)
O ~CO
0)
a)
C
N
0)U
0) LC
SII
FU 2bs
QS p Cc( ) coN 0
Figure 2. Relationship between Sales Attitude Test Scores
and Managers' Ratings of Sales Ability.

Appendix F -- Continued
U)
0
U)
a)
a)as0
U).
c'JII
106
U,(1)
0CV)
L0N
U
U,)'4
S " \ \ \\ , , , , ! , , , , , ., ..
"I
a)U
ai)
E0U)
(10coU)0,CU
~U)N~h.
0)coCCa
cm
0N
Figure 3. Relationship between Sales Attitude Test Scores
and Managers' Ratings of Customer Service.
w
A v
--. 1 1 I 1 I 1 1 1 1 1 1 1 1 ! i L 1 1 1 1
, , ,I
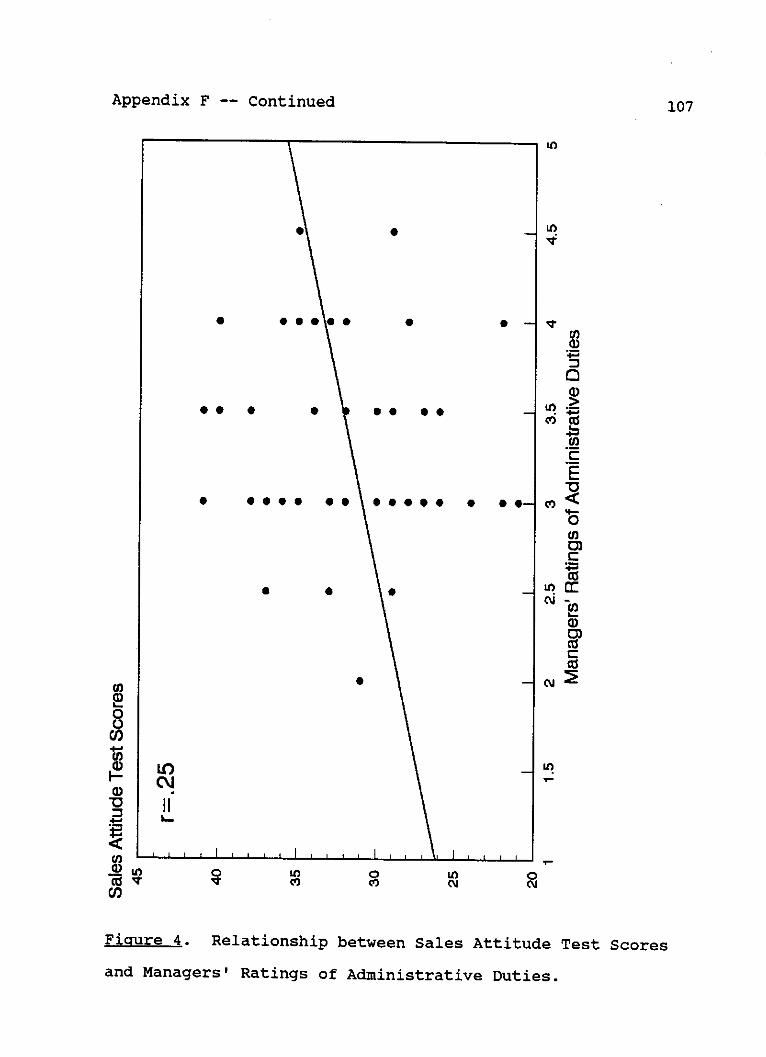
Appendix F -- Continued
0)U)
a,)U)
coco
S
". 0
" f
107
LC)N~
11
I l I
0 U, 0 UNu
LO
LO'4.
" "
S.. @5 .05 0 e
* 0 " 0 "
" 0
2T~
T~
0Cuj
Figure 4. Relationship between Sales Attitude Test Scores
and Managers' Ratings of Administrative Duties.
I.
0
a0
cN)cw
I
I--
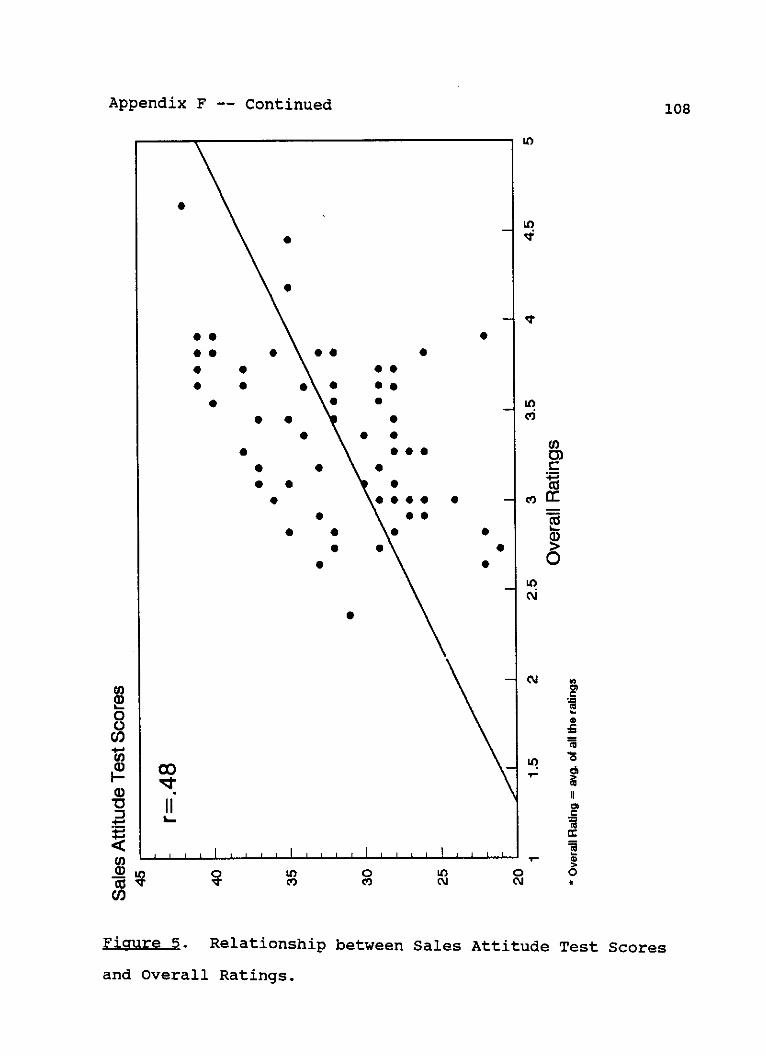
Appendix F -- Continued 108
U,
"
L
""" " ""*
" 4
" """" " e)
"* 0 0
0U)U
0
. 0*e .9
UU
CD)
F.ure 5.
o 0
oiue5 eainhpbtenSlsAttd etSoe
and Overall Ratings.
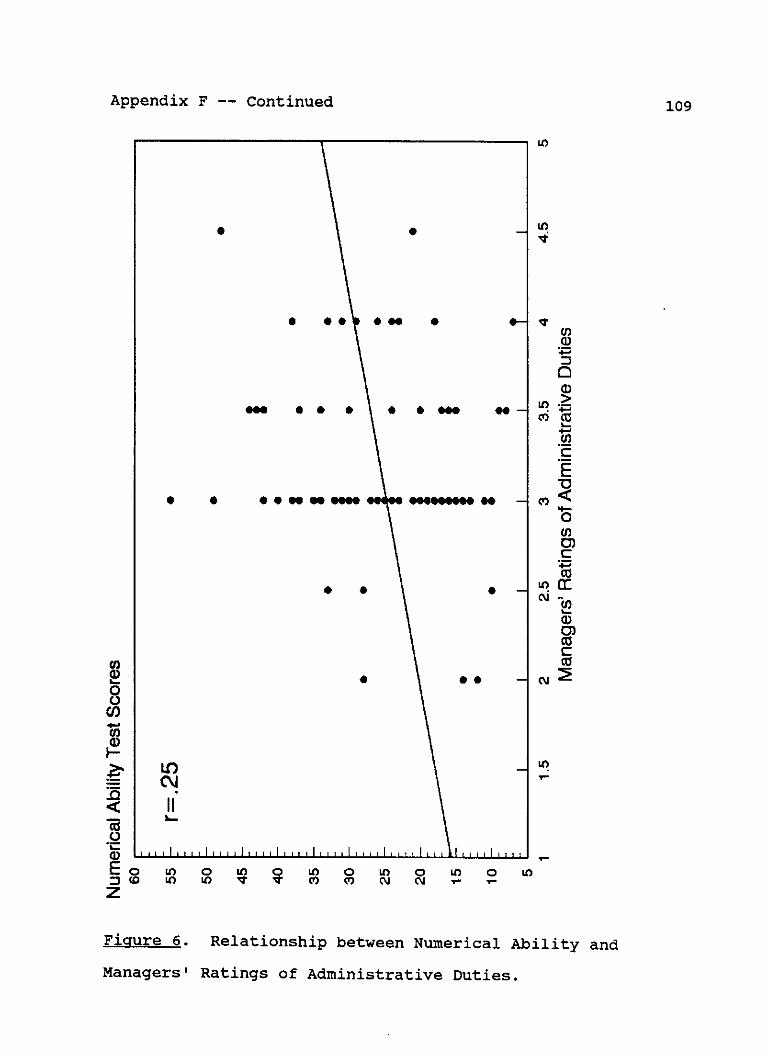
Appendix F -- Continued 109
" 0
* "
C'4J
II
I .. .I
. ,I IIL,1,
L0
0ee -- )
U)
0)
C
0
l
0)
N'
2Ui
o u,T
Figure 6. Relationship between Numerical Ability and
Managers' Ratings of Administrative Duties.
0CO
.0
coU)a)
Ez
0co
U) 0U) t)0o ) U)
cu0Cu
U,1
I
N
(V
I

Appendix F -- Continued 110
U)
"
U)
0
"*" " " U)
N "
* " 0
0t)
0*
e"
7j e cc
CU ,ees e - m
a a)
E* o o U) 0 N 0 T 0 ) 0
* S
* 9
-) C'toJtz
Figure 7. Relationship between Numerical Ability and
Overall Ratings.

Appendix F -- Continued111
""""" " e e"""
** * e *i
" "
S.5
S5 S "See S""
9 9
S.
S "e"
U
U'4.
E
0)
cLO
0
cmI-
0C)
- Cu)
0
o o t o o t
0C1
C\J
LO 0 U) 0 U) 0 U) 0
Co
Figure 8. Relationship between Spatial Ability and
Managers' Ratings of Ability to Design & Price Treatments.
oe
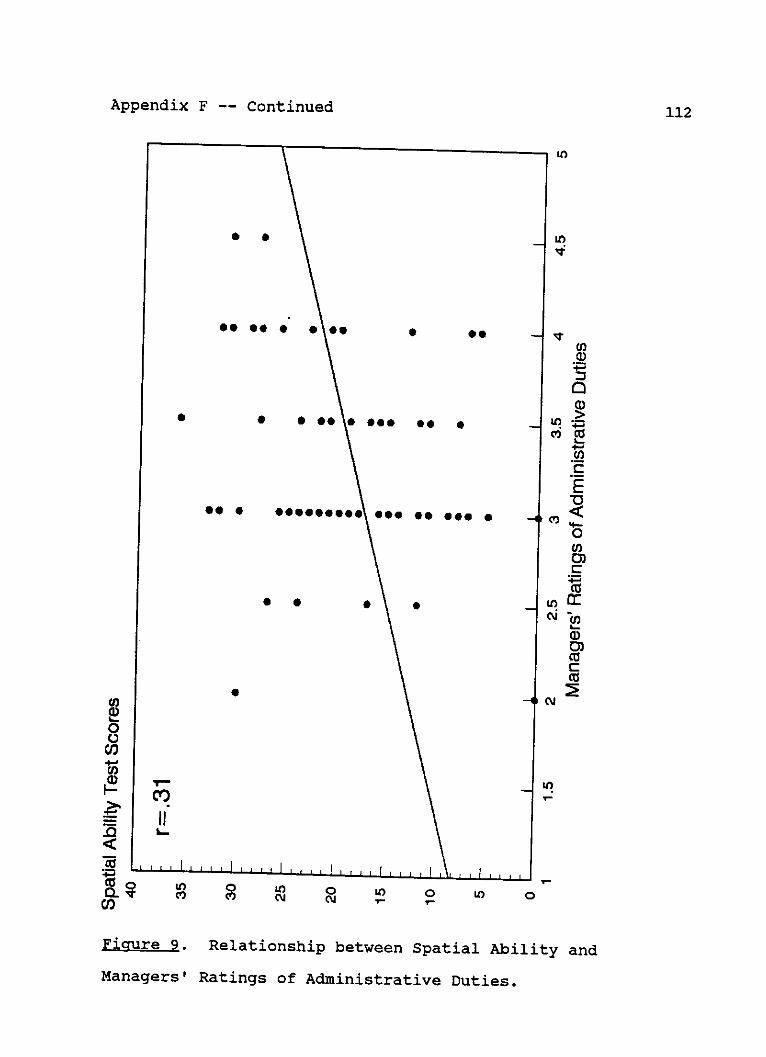
Appendix F -- Continued
LO
" f LO
a)
.C
U)
E"" " """""""". """ 00 ""0 0 0 a
0
0)
lcu
C
*aaer'Raig 0fAmiitr0v Duties
a)000C
U)0
"
+,,
CL CF) ) N O O to
Figure 9. Relationship between Spatial Ability and
Managers' Ratings of Administrative Duties.
112

Appendix F -- Continued
C
I~L
U)cv)
0 U) 0 UC') N N r
113
11)
'
IU
"
"
0
0 " "" ""S"0" "
9. 99 5e
. * 9. 9
0 0s
9 9
* 5
0
, , , ",
T d
0)
T 0
0 0
Figure 10. Relationship between Spatial Ability and
Overall Ratings.
W)a)
0
0
U
mumummumm-mm
c~*
U)
0,)
0)
U)CN
N"
. . . . . . . . . . .
I

APPENDIX G
TASK-DIMENSION MATRIX
114

115
Table G-14
Task-Dimension Matrix
Tasks Dimensions
Num. Spatial Verbal Sales Plan Adapt Detail
1 X X2 X X X5 X X8 X X10 X X11 X X12 X15 X X21 X X22 X X2331 X33 X X X X34 X X43 X X51 X
Note. Appendix E contains the task statements

APPENDIX H
DESCRIPTIVE STATISTICS FOR SIMILAR POPULATIONS
116
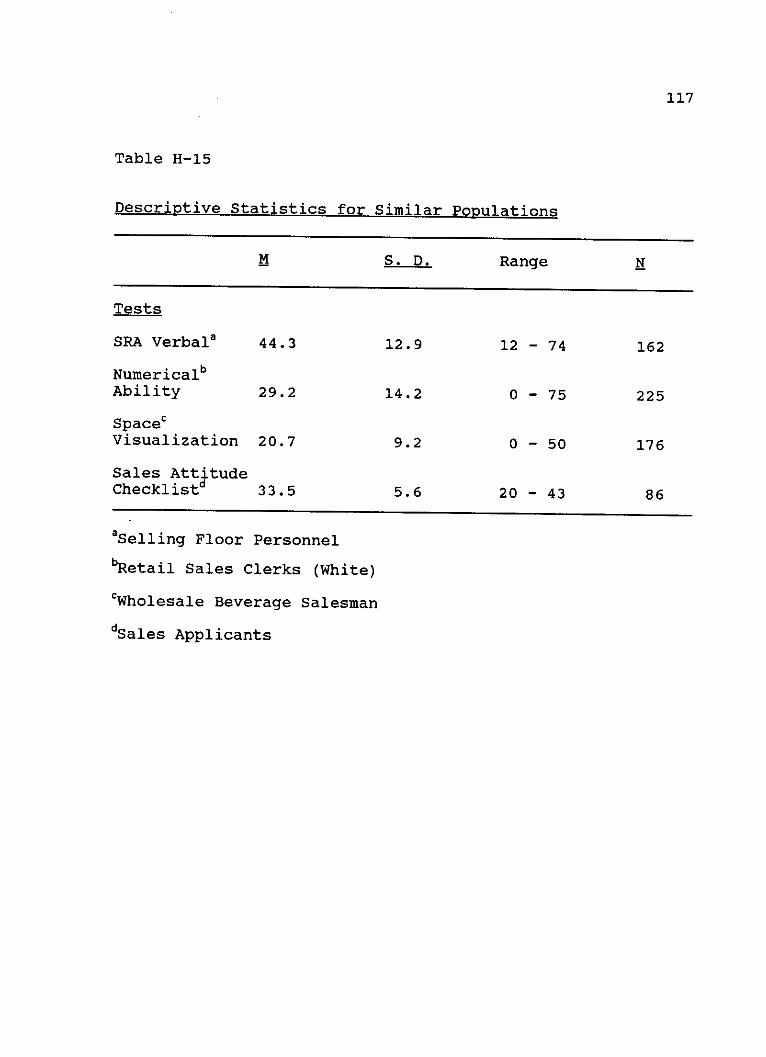
117
Table H-15
Descriptive Statistics for Similar Populations
M S . D. Range N
Tests
SRA Verbala 44.3 12.9 12 - 74 162
NumericalbAbility 29.2 14.2 0 - 75 225
SpaceCVisualization 20.7 9.2 0 - 50 176
Sales AttitudeChecklistd 33.5 5.6 20 - 43 86
aSelling Floor Personnel
bRetail Sales Clerks (White)
CWholesale Beverage Salesman
dSales Applicants

REFERENCES
Appel, V., & Feinberg, M. R. (1969). Recruiting door-to-
door salesmen by mail. Journal of Applied Psychology,
53, 362-366.
Arvey, R. D. (1979). Unfair discrimination in the
employment interview: Legal and psychological aspects.
Psychological Bulletin, 86, 736-765.
Arvey, R. D., Miller, H. E., Gould, R., & Burch, P. (1987).
Interview validity for selecting sales clerks. Personnel
Psychology, 40, 1-12.
Asher, J. J. (1972). The biographical item: Can it be
improved? Personnel Psychology, 25, 251-269.
Barrett, G. V., Phillips, J. S., & Alexander, R. A. (1981).
Concurrent and predictive validity designs: A critical
reanalysis. Journal of Applied Psychology, 6i, 1-6.
Bartlett, C. J., Bobko, P., Mosier, S. B., & Hannan, R.
(1978). Testing for fairness with a moderated multiple
regression strategy: An alternative to differential
analysis. Personnel Psychology, 31, 223-241.
Bemis, S. E. (1968). Occupational validity of the General
Aptitude Test Battery. Journal of Applied Psychology,
52, 240-249.
Bills, M. A. (1941). Selection of casualty and life
insurance agents. Journal of Applied Psychology, 25,
6-10.
118

119'
Boehm, V. R. (1977). Differential prediction: A
methodological artifact? Journal of Applied Psychology,
62. 146-154.
Bray, D. W., & Campbell, R. J. (1968). Selection of
salesmen by means of an assessment center. Journal of
Applied Psychology, 52, 36-41.
Burtt, H. E. (1917). Professor Munsterberg's vocational
tests. Journal of Applied Psychology, 1, 201-213.
Childs, A., & Klimoski, R. (1986). Successfully predicting
career success: An application of the biographical
inventory. Journal of Applied Psychology, 71, 3-8.
Churchill, G. A., Ford, N. M., Hartley, S. W., & Walker, 0.
C. (1985). The determinants of salesperson performance: A
meta-analysis. Journal of Marketing Research, 22,
103-118.
Cox, K. (1948). Can the Rorschach pick sales clerks?: An
exploratory study. Personnel Psychology, 1, 357-363.
Deb, M. (1983). Sales effectiveness and personality
characteristics. Psychological Research Journal, 7,
59-67.
Dreher, G. F., & Sackett, P. R. (1983). Perspectives on
employee staffing and selection. Homewood, IL: Richard
D. Irwin.

120
Ekpo-Ufot, A. (1979). Self-perceived task relevant
abilities, rated job performance, and complaining behavior
of junior employees in a government ministry. Journal of
Applied Psychology, 64, 429-434.
England, G. W. (1971). Development and use of weighted
application blanks. Minneapolis: University of Minnesota,
Industrial Relations Center.
Farley, J. A., & Mayfield, E. C. (1976). Peer nominations
without peers? Journal of Applied Psychology, 61,
109-111.
Frautschi, P. (1987). Validity of the California
Psychological Inventory as a tool for sales selection.
Unpublished master's thesis, University of North
Texas, Denton.
Freyd, M. (1926). Selection of promotion salesmen. The
Journal of Personnel Research, 5, 142-156.
Ghiselli, E. E. (1973). The validity of aptitude tests in
personnel selection. Personnel Psychology, 26, 461-477.
Ghiselli, E. E. (1966). The validity of occupational
aptitude tests. New York: Wiley.
Harrell, T. W. (1960). The validity of biographical data
items for food company salesmen. Journal of Applied
Psychology, 44, 31-33.
121
Hinrichs, J. R., Haanpera, S., & Sonkin, L. (1976).
Validity of a biographical information blank across
national boundries. Personnel Psychology, 29,
417-421.
Hogan, R., Carpenter, B. N., Briggs, S. R., & Hansson, R.
0., (1985). Personality assessment and personnel
selection. In H. J. Bernardin & D. A. Bownas (eds.)
Personality assessment in organizations. New York:
Praeger.
Holcombe, J. (1922). A case of sales research: Report on
first steps in a study of selection of life insurance
salesmen. Bulletin of The Taylor Society, 2, 112-121.
Hollander, E. P. (1954). Buddy ratings: Military research
and industrial implications. Personnel Psychology, 7,
385-393.
Hollenbeck, J. R., Brief, A. P., Whitener, E. M., & Pauli,
K. E. (1988). An empirical note on the interaction of
personality and aptitude in personnel selection. Journal
of Management, 14, 441-451.
Hunter, J. E., & Hunter, R. F. (1984). Validity and utility
of alternative predictors of job performance.
Psychological Bulletin, 96, 72-98.
Hunter, J. E., Schmidt, F. L., & Hunter, R. (1979).
Differential validity of employment tests by race: A
comprehensive review and analysis. Psychological
Bulletin, 8_6, 721-735.
122
Katzell, R. A., & Dyer, F. J. (1977). Differential validity
revived. Journal of Applied Psychology, 62, 137-145.
Kinslinger, H. J. (1966). Application of projective
techniques in personnel psychology since 1940.
Psychological Bulletin, 66, 134-150.
Kurtz, A. (1938). Selection-the aptitude index. Life
Insurance Sales Research Bureau, Annual Meeting
Proceedings, 170-180.
Lamont. L. M., & Lundstrom, W. J. (1977). Identifying
successful industrial salesmen by personality and personal
characteristics. Journal of Marketing Research, 14,
517-529.
Levine, E. L., Flory, A., & Ash, R. A. (1977). Self-
assessment in personnel selection. Journal of Applied
Psychology, 62, 428-435.
Lewin, A. Y., & Zwany, A. (1976). Peer nominations: A
model, literature critique and a paradigm for research.
Personnel Psychology, 29, 423-447.
Matteson, M. T., Ivancevich, J. M., & Smith, S. V. (1984).
Relation of type A behavior to performance and
satisfaction among sales personnel. Journal of Vocational
Behavior, 35, 203-214.
Mayfield, E. C. (1964). The selection interview: A re-
evaluation of published research. Personnel Psychology,
17, 239-260.

123
Mayfield, E. C. (1970). Management selection: Buddy
nominations revisited. Personnel Psychology, 23,
377-391.
Mayfield, E. C. (1972). Value of peer nominations in
predicting life insurance sales performance. Journal of
Applied Psychology, 56, 319-323.
Mayfield, E. C., Brown, S. H., & Hamstra, B. W. (1980).
Selection interviewing in the life insurance industry: An
update of research and practice. Personnel Psychology,
33, 725-739.
Merenda, P. F., & Jacob, S. (1987). Validity of Self-
concept measures for selection of sales personnel.
Psychological Reports, 60, 508.
Miner, J. B. (1962). Personality and ability factors in
sales performance. Journal of Applied Psychology, 46,
6-13.
O'Connor, E. J., Wexley, K. N., & Alexander, R. A. (1975).
Single-group validity: Fact or fallacy? Journal of
Applied Psychology, 60, 352-355.
Opren, C. (1985). Patterned behavior description interviews
versus unstructured interviews: A comparative validity
study. Journal of Applied Psychology, 7, 774-776.
Oschrin, E. (1918). Vocational tests for retail saleswomen.
Journal of Applied Psychology, 2, 148-154.
124
Owens, W. A. (1976). Background data. In M. D. Dunnette
(Ed.), Handbook of Industrial and Organizational
Psychology. Chicago: Rand McNally.
Pearlman, K., Scmidt, F. L., & Hunter, J. E. (1980).
Validity generalization results for tests used to predict
job proficiency and training success in clerical
occupations. Journal of Applied Psychology, 65, 373-406.
Rafaeli, A., & Klimoski, R. J. (1983). Predicting sales
success through handwriting analysis: An evaluation of
the effects of training and handwriting sample content.
Journal of Applied Psychology, 8, 212-217.
Reilly, R. R., & Chao, G. T. (1982). Validity and fairness
of some alternative employee selection procedures.
Personnel Psychology, 35, 1-62.
Roose, J. E., & Dougherty, M. E. (1976). Judgement theory
applied to the selection of life insurance salesmen.
Organizational Behavior and Human Performance, 16,
231-249.
Ruch, F. L., & Ruch, W. W. (1967). The K factor as a
(validity) suppressor variable in predicting success in
selling. Journal of Applied Psychology, 51, 201-204.
Ruch, F. L., & Ruch W. W. (1980). Employee Aptitude Survey
technical report. Los Angeles: Psychological Services.
125
Schmidt, F. L., Berner, J. G., & Hunter, J. E. (1973).
Racial differences in validity of employment tests:
Reality or illusion? Journal of Applied Psychology, 58,
5-9.
Schmitt, N. (1976). Social and situational determinants of
interview decisions: Implications for the employment
interview. Personnel Psychology, 29, 79-101.
Schmitt, N., Gooding, R. Z., Noe, R. A., & Kirsch, M.
(1984). Metaanlysis of validity studies published between
1964 and 1982 and the investigation of study
characteristics. Personnel Psychology, 37, 407-422.
Schuh, A. J. (1967). The predictability of employee tenure:
A review of the literature. Personnel Psychology, 20,
133-152.
Schultz, R. S. (1935). Test selected salesmen are
successful. Personnel Journal, 14, 139-142.
Spencer, G. J., & Worthington, R. (1952). Validity of a
projective technique in predicting sales effectiveness.
Personnel Psychology, 5, 125-144.
Taylor, E. K. (1985). Sales Attitude Checklist examiner's
manual. USA: Science Research Associates.
Thornton, G. C., & Byham, W. C. (1982). Assessment centers
and managerial performance. Orlando: Academic Press.
Thurstone, L. L., & Thurstone, T. G. (1984). SRA verbal
examiner's manual. USA: Science Research Associates.

126
Tullar, W. L., & Barrett, G. V. (1976). The future
autobiography as a predictor of sales success. Journal of
Applied Psychology, 61, 371-373.
Wagner, R. (1949). The employment interview: A critical
review. Personnel Psychology, 27, 397-407.
Walsh, J. P., Weinberg, R. M., & Fairfield, M. L. (1987).
The effects of gender on assessment centre evaluations.
Journal of Occupational Psychology, 60, 305-309.
Waters, L. K., & Waters, C. S. (1970). Peer nominations as
predictors of short-term sales performance. Journal of
Applied Psychology, 54, 42-44.
Weaver, C. N. (1969). An empirical study to aid in the
selection of retail sales clerks. Journal of Retailing,
45, 22-26.
Weekley, J. A., & Gier, J. A. (1987). Reliability and
validity of the situational interview for a sales
position. Journal of Applied Psychology, 72,
484-487.
Worbois, G., & Kanous, L. (1954). The validity of the
Worthington Personal History for a sales job. Personnel
Psychology, 7, 209-217.
Zdep, S. M., & Weaver, H. B. (1967). The graphoanalytic
approach to selecting life insurance salesmen. Journal of
Applied Psychology, 51, 295-299.