RESEARCH MEMORANDUM - UNT Digital Library
36
Twf No. L7DO8 RESEARCH MEMORANDUM a. PRESSURE-DISTMBUTION MEASUREMENTS ON A FULL-SCALE HORIZONTAL TAIL SURFACE FOR A MACH NUMBER RANGE OF 0.20 TO 0.70 Langley Memorial Aeronautical Laboratory Langley Field, Va. .- 'NATIONAL ADVISORY COMMITTEE FOR AERONAUTICS WASHINGTON June 25,1947
-
Upload
khangminh22 -
Category
Documents
-
view
2 -
download
0
Transcript of RESEARCH MEMORANDUM - UNT Digital Library

Twf No. L7DO8
RESEARCH MEMORANDUM
a.
PRESSURE-DISTMBUTION MEASUREMENTS ON A FULL-SCALE
HORIZONTAL TAIL SURFACE FOR A MACH NUMBER RANGE
OF 0.20 TO 0.70
Langley Memorial Aeronautical Laboratory Langley Field, Va.
. - 'NATIONAL ADVISORY COMMITTEE FOR AERONAUTICS
WASHINGTON June 25,1947

c
Surface i r regular i t ies were found t o cause appreciable di~l to- t i o n of the pressure dist r ibut ion. The highest c r f t i c a l speed of the tail surface was 0.77. By eliminatlon of the surface irreguhlt i t ies , it is estimated that t h i s c,ould be increased to 0.80.
The r a t e of charge of pmssure coeff ic ient with angle of a t taok over the leading 60 percer-t o f ' t h e chord increased. with incm~~~ing Mach number due to compressibiUty effeots while no systematio va~L& t i o n was agparent a f t of the h m e line. The rate of chaage of pressure c oeff iciept with elevatoP angle decreased over the leaafng 15 percent of the tail surface as a resu l t of model twist and increased at the 7&percent a n d ' 77-percent chord s ta t ions wit21
1 increasing - W h number.
Reasonable agrement between t h g aalculated a,nd esrperimental root-bendingament coeff ic ient was obtafned up to a Mach number of 0.68.
A full-scale, sBmi6p&;z1, horizontal *il surface of a Jet- .
p q e l h d . f i g h t e > t y p a airplane was tested t o determfne its aemdynamic chazaaterist ics at Mmh numbers i n 'the range of 0.20 and 0.70. The results of force tes ta and hingeammnt measurements were presented in reference 1. !This report presents the resu l t s of chordwise and spanwise pressure-dfetribution measuremente.
!
I
2 NACA RBI No. LpO8
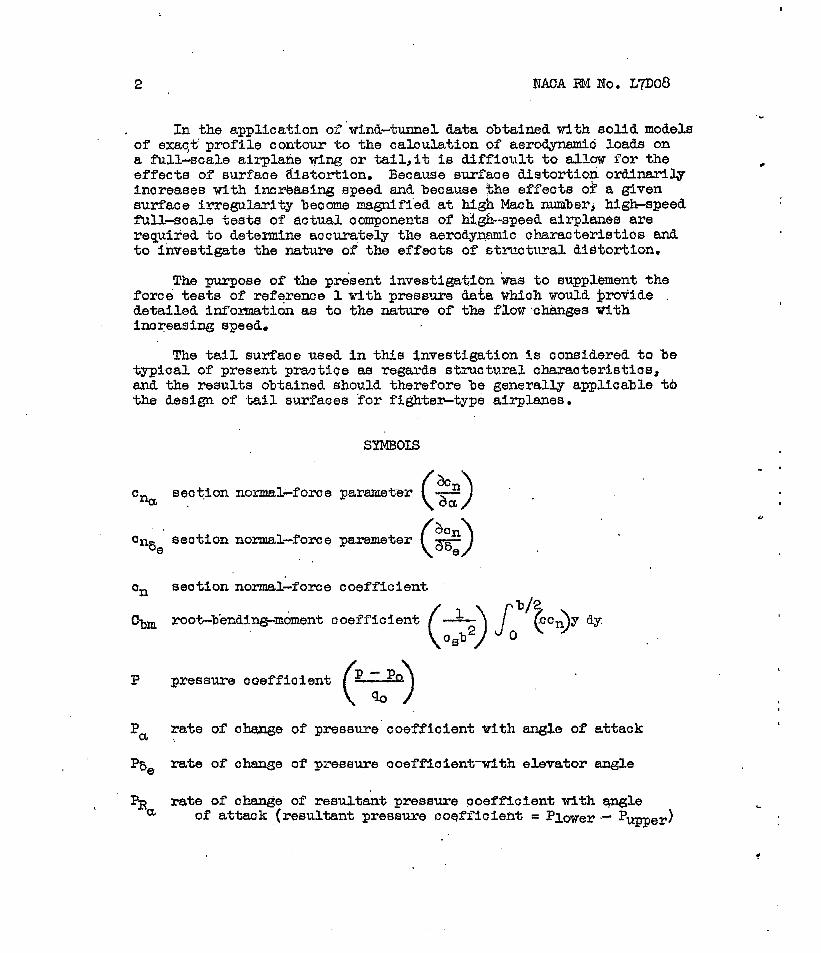
I n the application of 'wind-tunnel. data obtained with so l id modela of exaqt' profile contour t o the calculation of aerodynamid loads on a f'ull-scale airplane wing o r tai1,it i e d i f f i o u l t t o allaw for the e f fec ts of surr"aue tilatortion. Because surfaoe dis tor t ion o r d i n a r i l y inoreases with incrb&sing speed and becawe the effects of a given surface irregularity b e c o w mgnif'i'ed a t high Mach number, h i m p e e d f 'ull-scale tests of ac tua l ocxnponents of h$&-syeed airplanea are required t o deternine accurately the ae rodymic ohamctePistios and t o investigate the nature of' the effects oi' stnrctwal didtortion.
The purpose of the pm'sent investigatibn was t o supplement the force tests of reference 1 with pressure data trhfch would brovide . detailed information a8 t o the na tu re of the flow ~2hangea with increasing speed.
The t a i l suvrface used in this investigation is comidsred to be typ ica l of present practice aa regards s t ruc turn1 charaoterist ios, and the results obtained should therefore be generally applicable €b the design of .tail surfaces Tor fightes-type airplanes.
SYMBOLS
P pressure coeffioient (p iPo) Pa rate of ohsage of preseure coeff ic ient wlth angle of a t tack
Ptj, rake of c-e of' pressure ooeffioient-with elevator angle
c
Y
os - ‘ r o o t ohokd (50 in.)
e . elevator
o free stream
t trim tab .\
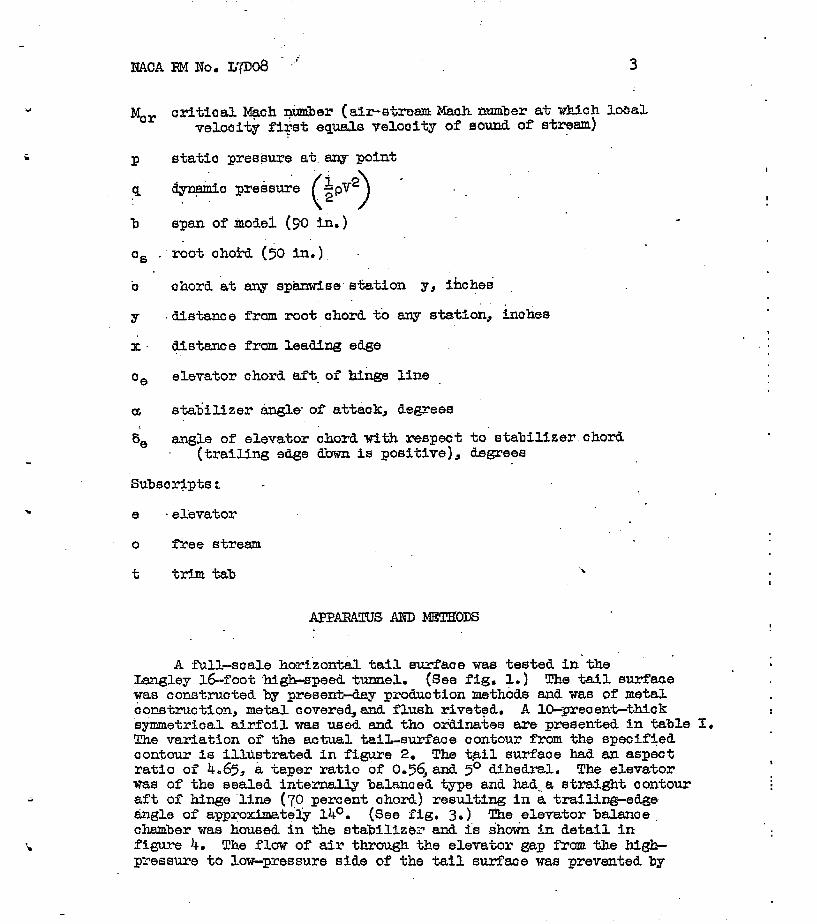
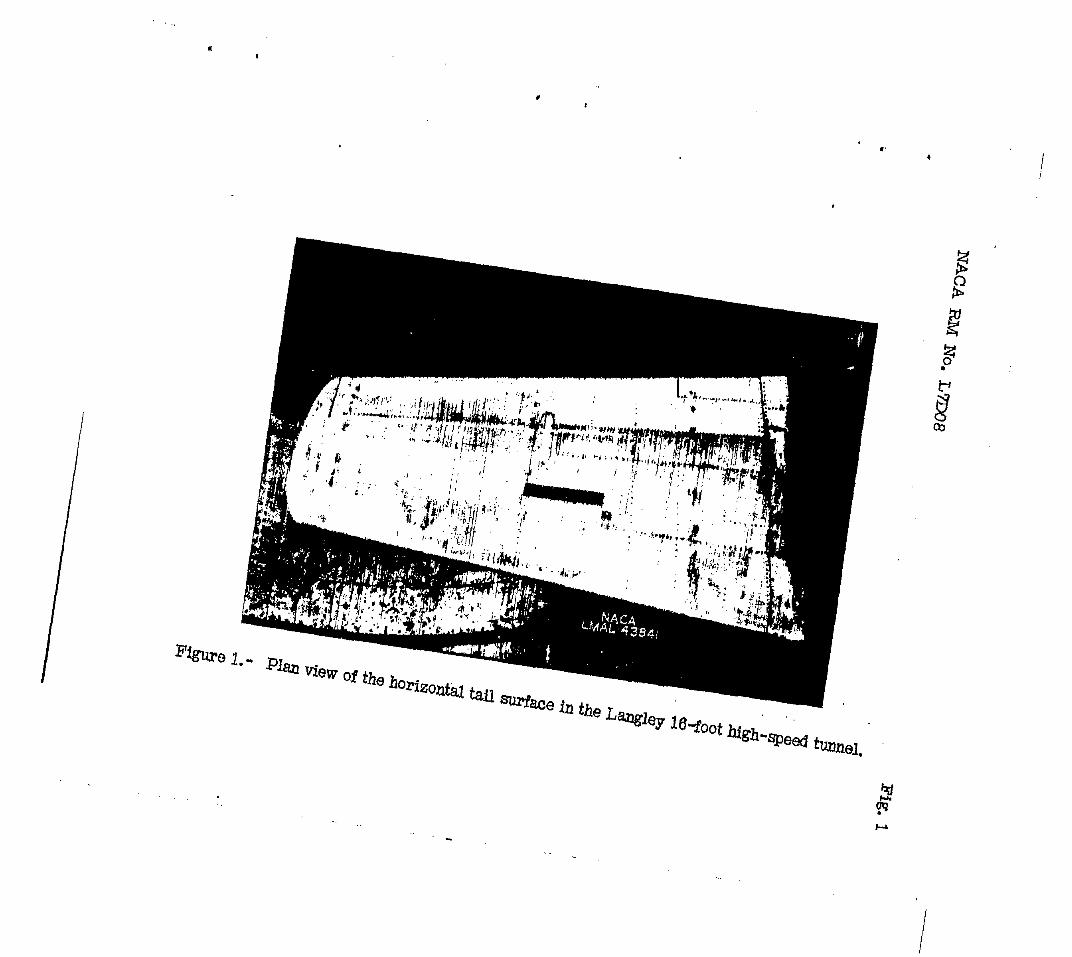
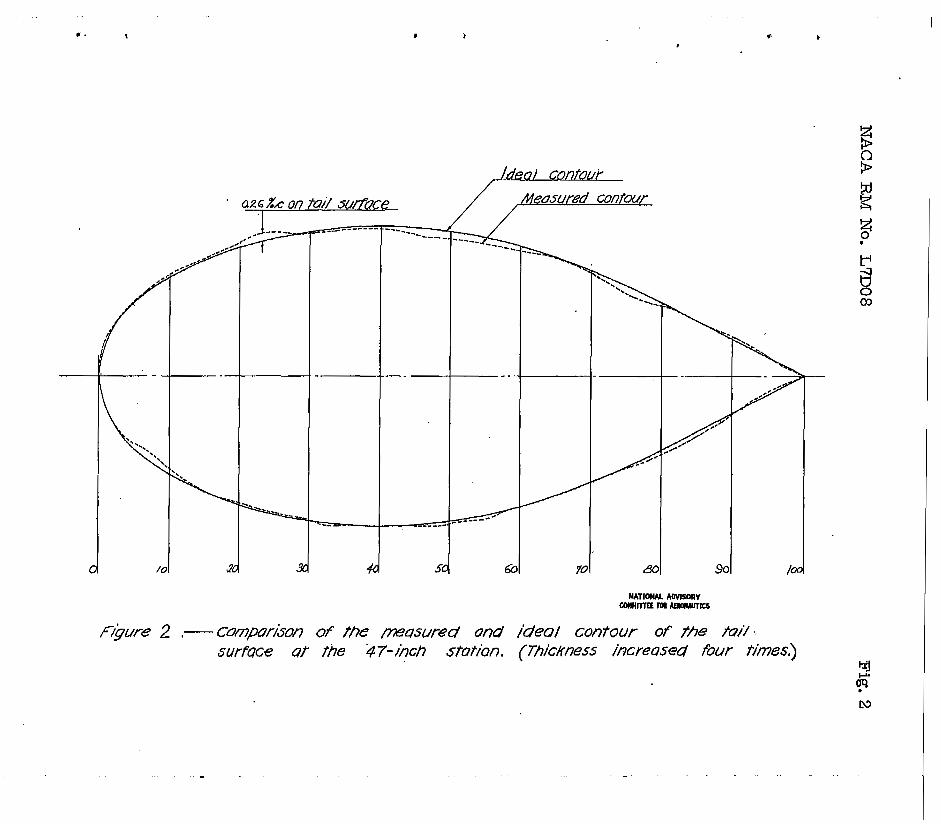
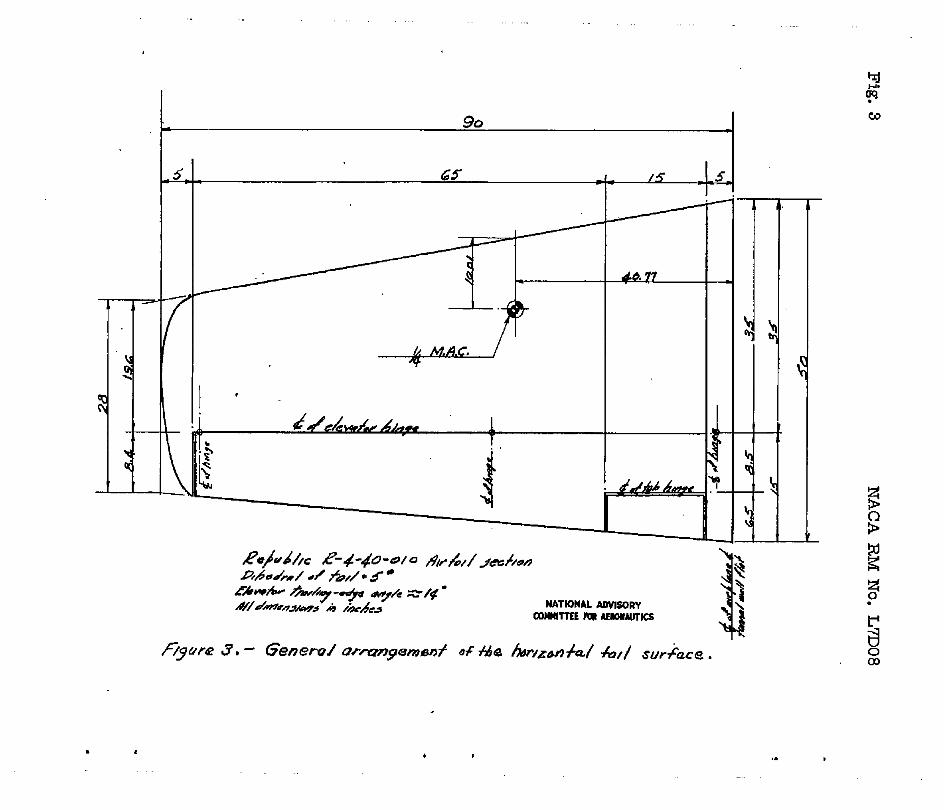
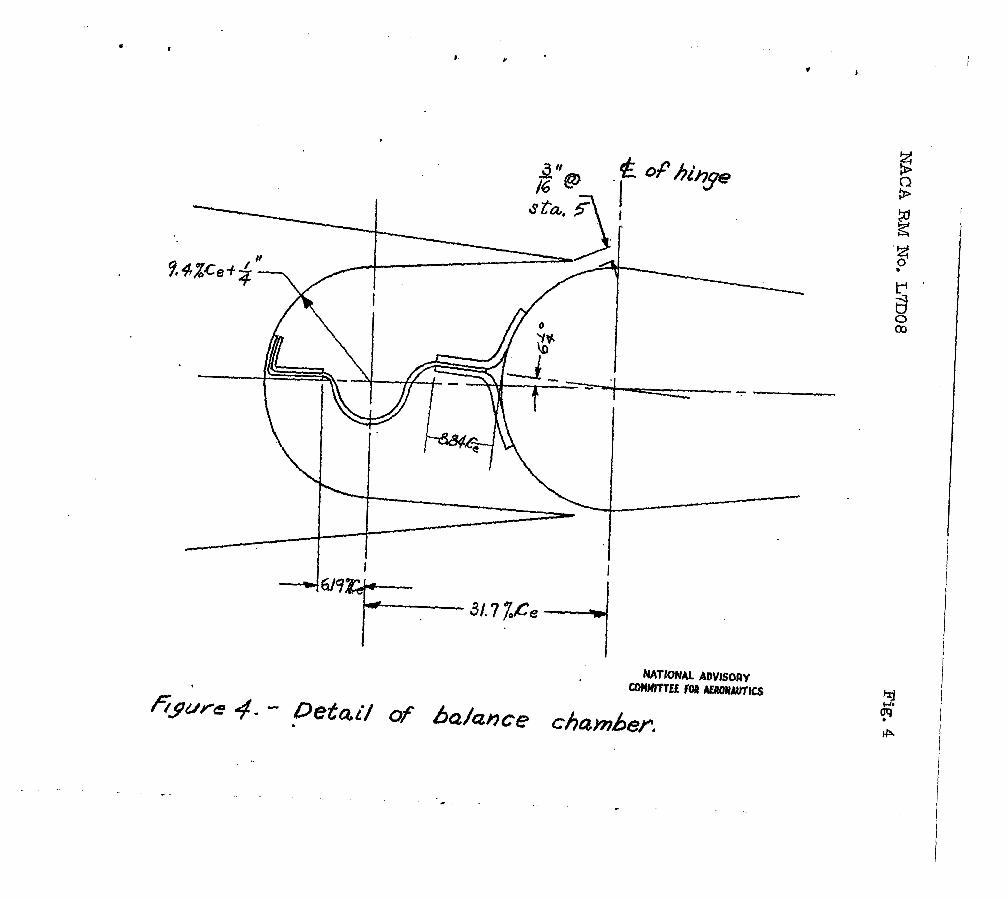
A f’ull-soale horizontal tat1 surPaae was tested in‘the Langley l6”foot ‘higkepeed tunnel. (See fig. 1. ) The tail SUrfacl0 wa3 konatruoted by presen-tiaay production method8 and was of metal corstruction, metal aovered,arnd flush riveted. A l&precent+thick symmetrical airfoil was used and tho ordinates are presented In €-able I. The variat ion 05 the actual tail-surface contour fram the specified contour l a i l l u t r a t e d in figure 2. The tail surfaoe had an aspect r a t i o of 4.65, a taper r a t i o of 0.56, and 5O dihedral. The elevator Was of the sealed internally balanced type and had. a 8 traight contour af t of hinge .line ( 70 percent ohord) resulting in a traillng-edge angle of appxy&mtelg 14O. (See fig. 3. ) !Qm elevator balanae ,
chamber vas housed i n the a t a b i l i z w and is ahoh i n detail i n figure 4. The flow of air through tke elevator gag from the hie p-ceasure to low-pressure side of the tail surface was prevented by
. . . .
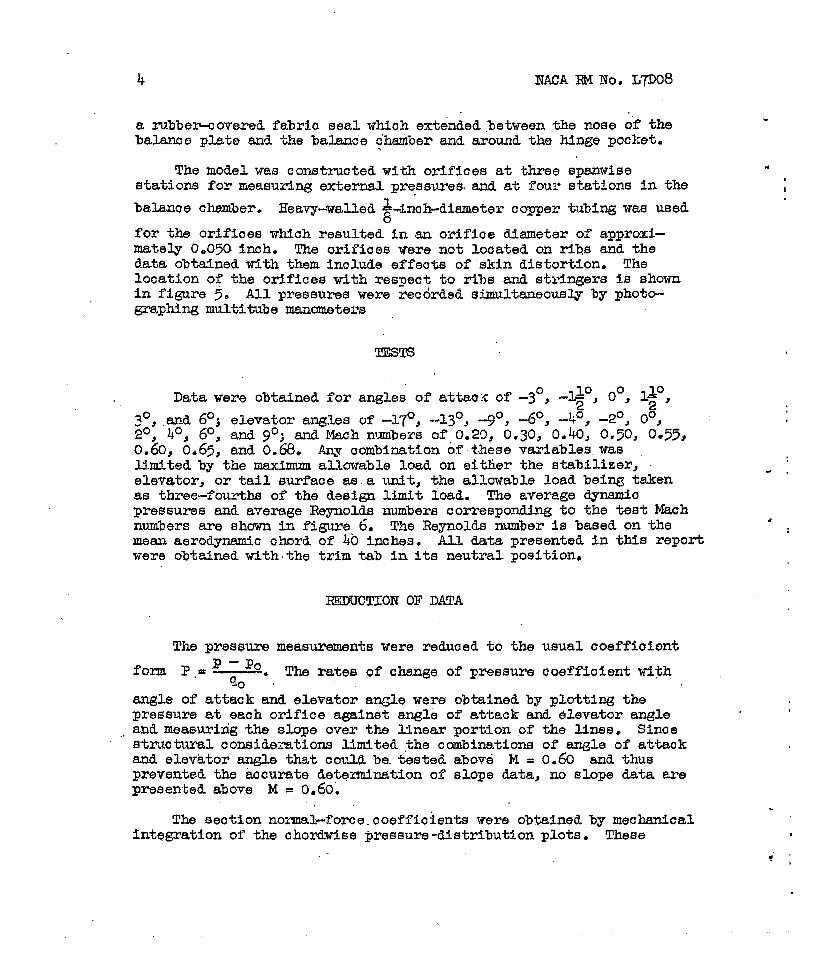
8 rubbewovered fabric seal whioh extended Jetween the nom of the balance plat0 and "he balance chamber asla around the hinge pocket.
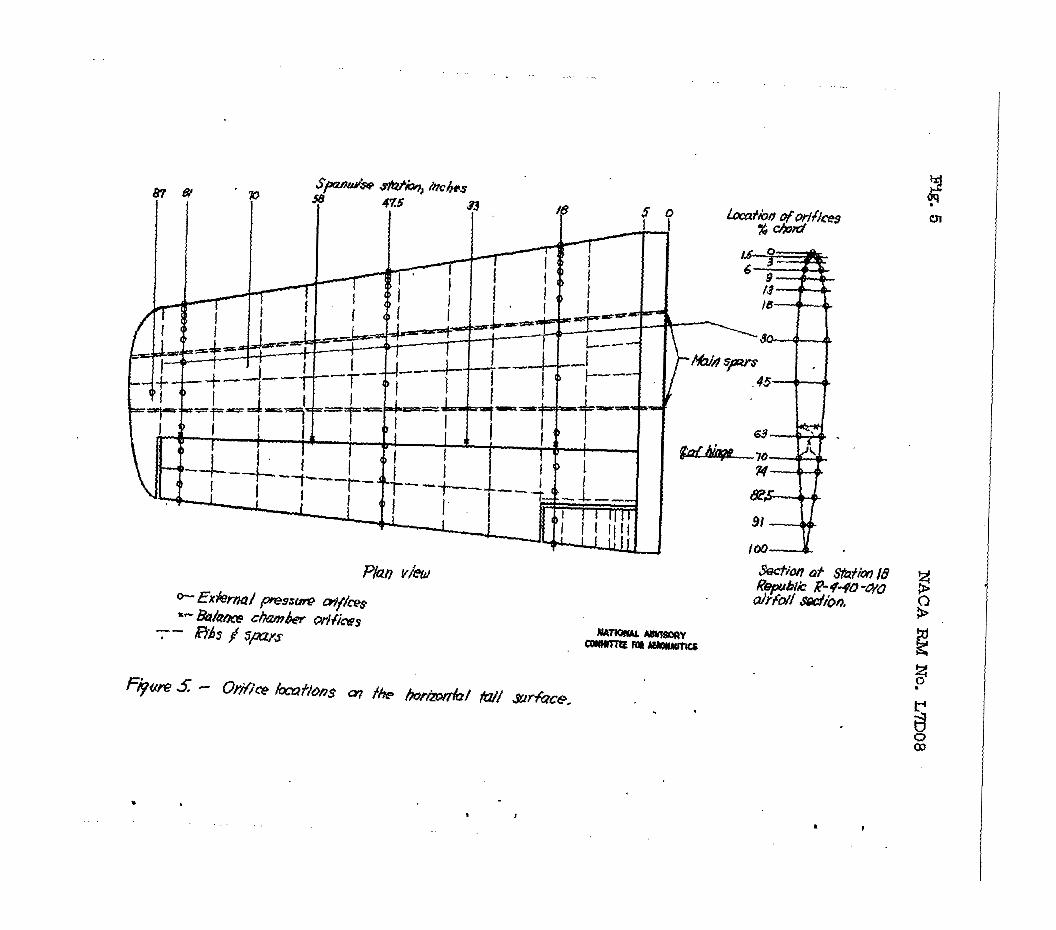
The model was constructed with oriflces at three spanwise stations for.measuring e x t e r n pressures.and at T o w stat ions i n the balanue chamber. Eeavy-walled h m k d i a m e t e r oopper tubing W R ~ used
for the orif ioes whlch resul ted in an or l f i ce diameter of app0Xi- mately 0,050 inch. The or i f ices were not looated on r ia8 and the data obtained with them include effeota o f . s k i n distortion. The location of the or l f icee with r e s p c t t o film and s t r d w e r s f a shown in f f w e 5. All pressures were recdrded sj3nultaneouElly by phot- mphim mu1titu.e "tei*s
6
TESTS
Data were obtained for angles of attmx of -3', -lF, Oo, ly, 3O, .and 6O; elevator angles of .-17O, --13O, "go, -Go, -ko, -2O, Oo, 2O, bo, 6O, and go; and Mach nlmbers of 0.23, 0.30, 0.40, 0.50, 0.55, 0.60, 0.65, and 0.68. combination .of- these variables. wa.8 l.3.mtted by the maximum allowable load on eit l ier the atabilfzer, elevator, or tail surface as a unit, the allowable load being taken a6 three-fourths of the design limit load. The average dynamio pressuree and avemge Reynold8 ambers comeeponding to the test Mach numbers are shown i n figure. 6. The Repol& number ia based on the mean aerodynamic cr%rd of 40 inches. A U data. presented i n this report were obtaAned with. the t r i m tab i n its neutral posit ion,
HEMTCTIOE OF DATA
The presaure measurewnta were reduced to t he usual coeffiaiont form I?, = - The rates of change of pressure coeff ic ient R i i t h
90 '
angle of a t tack and elevator &%le were obtained by plott ing the pressure at each orifice agafnflt angle of attack and Blevstor angle
,. and measuring the slope over the Unem por t ion ,of the l l n e a . Since S t r u C t U r a l comidezations l imited the cmbinationa of angle of attaok and elevator angle that c0v.U be. tested above M = 0.60 and thug prevented the accurate deterrninettion of elope data, no elope data are presented above M = 0.60.
The seotion nozmal-force. coeff ic ients were obtained by mechanical inte$ration of the chordwlse pre~sure-dietribution plots. These
I
NACA RM No. Lp08 5
w
values of section norm&I"force coefficiente were then plotted -
aga imt angle of attack and also e levator angle and the slop of the curves measured. cng could also be obtained with fair accuracy by mechanical integration of the ohordwiee plots of P,
c n ,
ma P6e,
The angle of attack' of. the tail surface haq been corrected Tor wind-tunnel wall interfereme by the method of reference 2. Applica- cat ion of t he method of reference 3 f o r blockage oorrections indioated that the m a x ~ u m correctton to m c preseure waa less than 1 per- blockage co r reo t ions are included.
= cent for the range of tes t of the subject model and,thereI"ore no
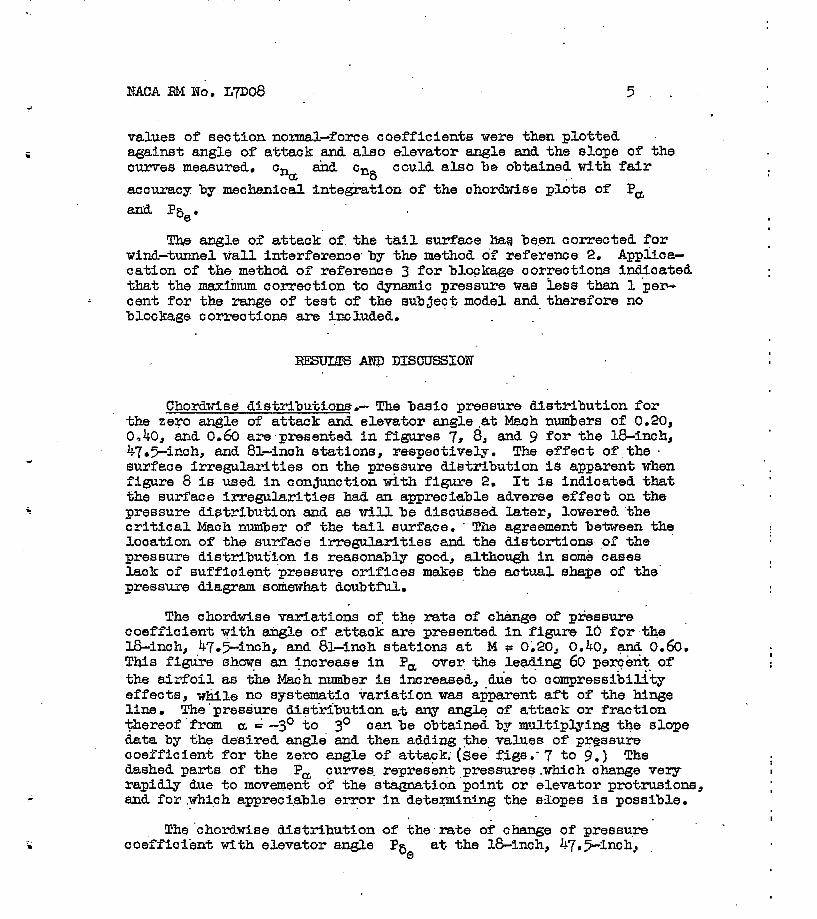
Chordwisd distrihtLon6.- The b a s i o pressure dietl-ibution for the zero angle of at tack and elevator aagle ,at Mmh numbers of 0.20, 0,40, and 0.60 aze presented i n figure6 7, 8, and 9 for the l&inch, 47.>inch, and 81-inch stations, respeativeu. The e f f ec t of .the - surface i r r egu la r i t i e s on the pressure dis t r ibu t ion is apsarent when figure 8 is used i n conjunction with figure 2. It fs indicated that tihe surfaae irregularities had an qpreo iab le adverse effect on the pressure distribution and a8 T ~ U . be diecdesed later, lowered %he c r i t i c a l Maoh number of the t a i l surface. ' The agreement between the loaat ion of the surface irregularities and the die tor t iom- of the pressure distribut'ion i e reaeonabu good, althou@ in some cases l a o k or" suf f io ien t &xmsure o r i f i c e s makes the aa tua l s h q e of the' pressure diagram m~i~mhat doubtful..
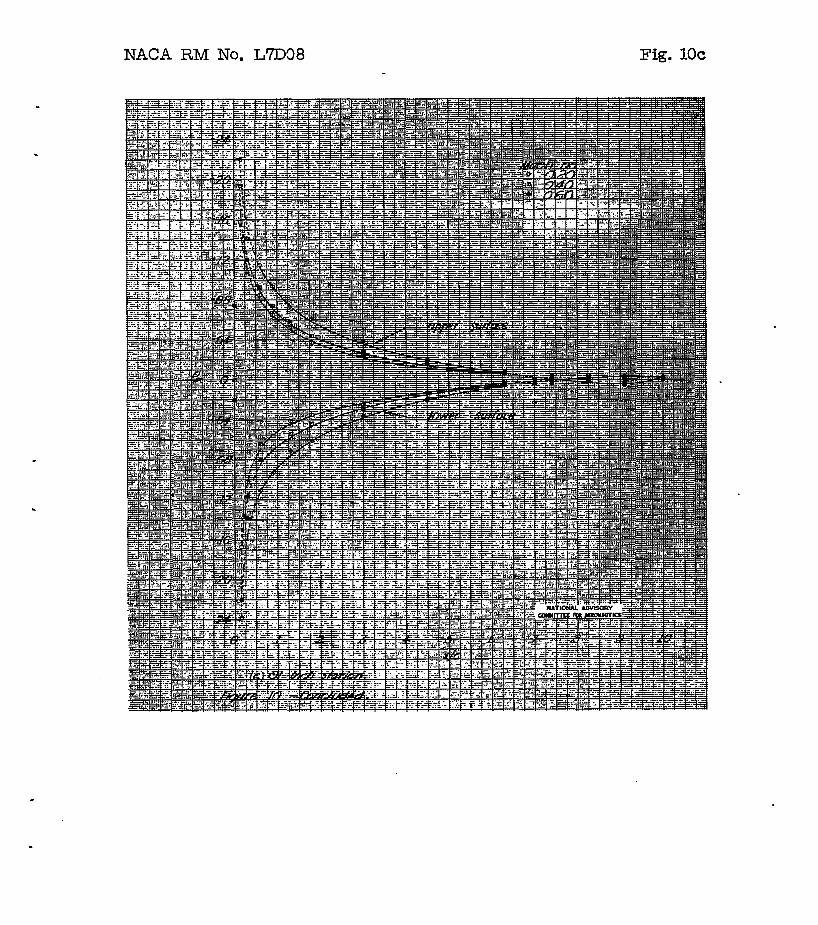
The chordwise mr ia t fons o f the rate of change of pressure coefficient with angle of at taok are presented i n figure IO f o r -the &inch, 47,5-inch, and 81-inch s ta t tons a t M = 0.20, 0.40, and 0.60. This fiw'm ahowe &TL Increase i n P, over the leading 60 p e v b r i t of t h e a i r f o i l rm the Mach lurmber is fncreaeed, due t d compressibil&y ef feo ts, v u l e no aysteslatio variation w a s apparent aft of the hinge line. The'pressure distkibut ion at any angle of a t t ack o r f rac t ion mereof 'Iran a = -3O t o 3O can be obtained br multiplying the slope data by the desfred angle and then adding the values of pressure ooeif ic ient for the zero tmgle of attack; (See' Pigs.- 7 to 9,) The dashed parte of the Pa curves. represeqt pressures .which ohange verg rapia_ls due t o movemnt 02 the stagnation'point o r elevator protrusions, and for .which appreci.able error in detel-mining the slopes is possible.
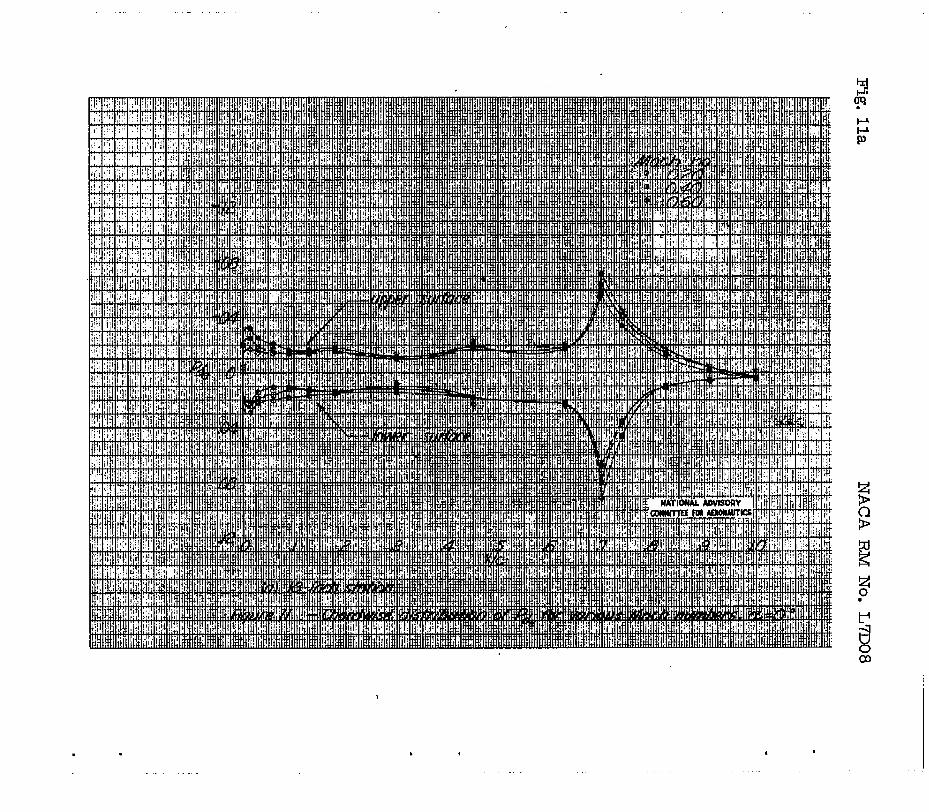
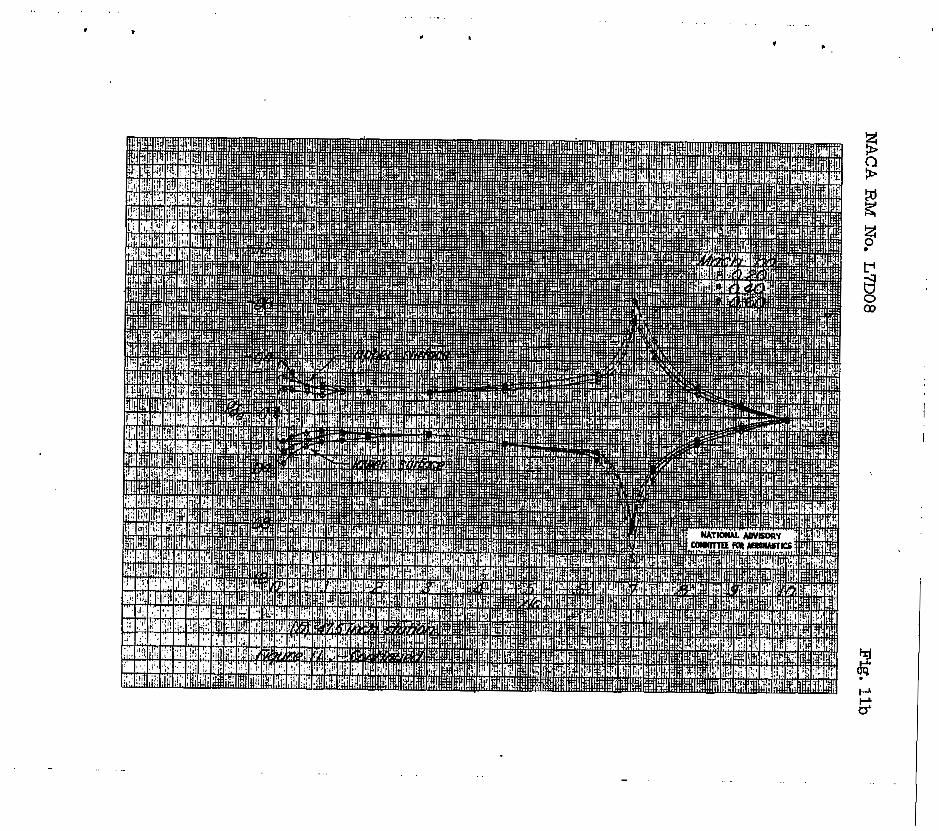
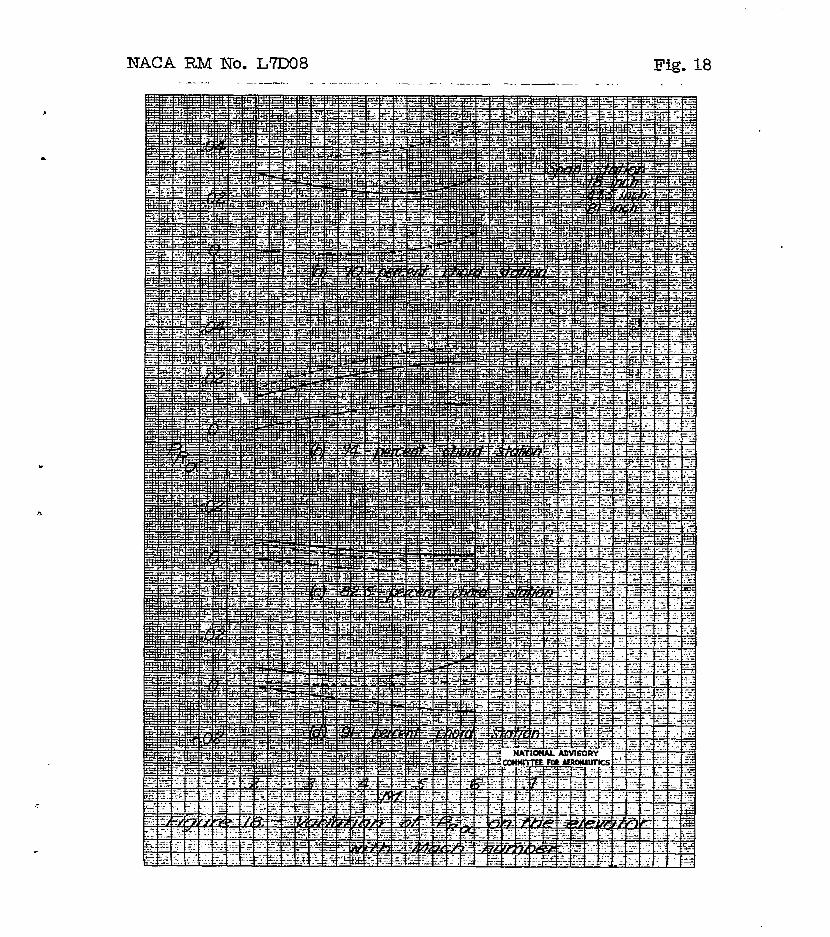
The 'chordvise dlstrLhution of the -rate of change of pressure. coe.ffici'ent with elevator a n g l e at the LbTnch, 47, -%inch, , *Be

6 EACA Rp4 no. ~ 7 ~ 0 8
and 81-mh s t a t ions fo r Maoh numbers of 0.20, O.hU, and 0.60 is shown i n figure ll. This f igare shows a decrease i n Ps with increasing Mach number over the leading 15 3ercen-k of t a i l surface and an inorease a t 70 and 77 peroent of t he chord, The decrease of Pg at the leading cdge with increasing Mach number i B c o n t r a q t o data obtained from so l ld models of high torsional rigidity and appears t o be caused by twist-- or" the stabi l izer i n a d i rec t ion t o decrease the lift due to the cen ter of pressure moving resward as the elevator angle is incsea8ed.i' It is ,estimated tkat a decrease of approximately 0.10 of a & e r n e In angle of at tack would account f o r the reduction i n P8, betmen M = 0.2 and M = or6 shown I n figure 11.
e
e
The ef fea t of Mach number on tBe chckdwfse pressure dist r ibut ion f o r oonstant cn was 'investigated. However, no data are ahown because the effect was negligible and. no appreoiable shiSt in the oenter of hressure wa8 indicated betwebri a h c h number of 0.20 and 0.60.
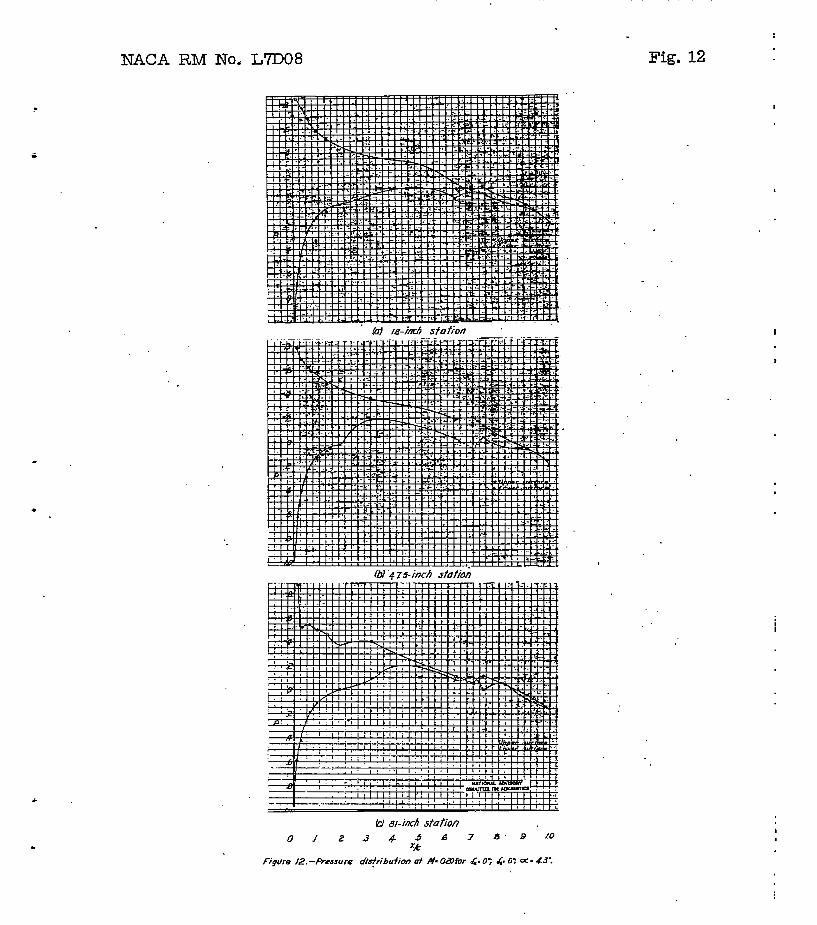
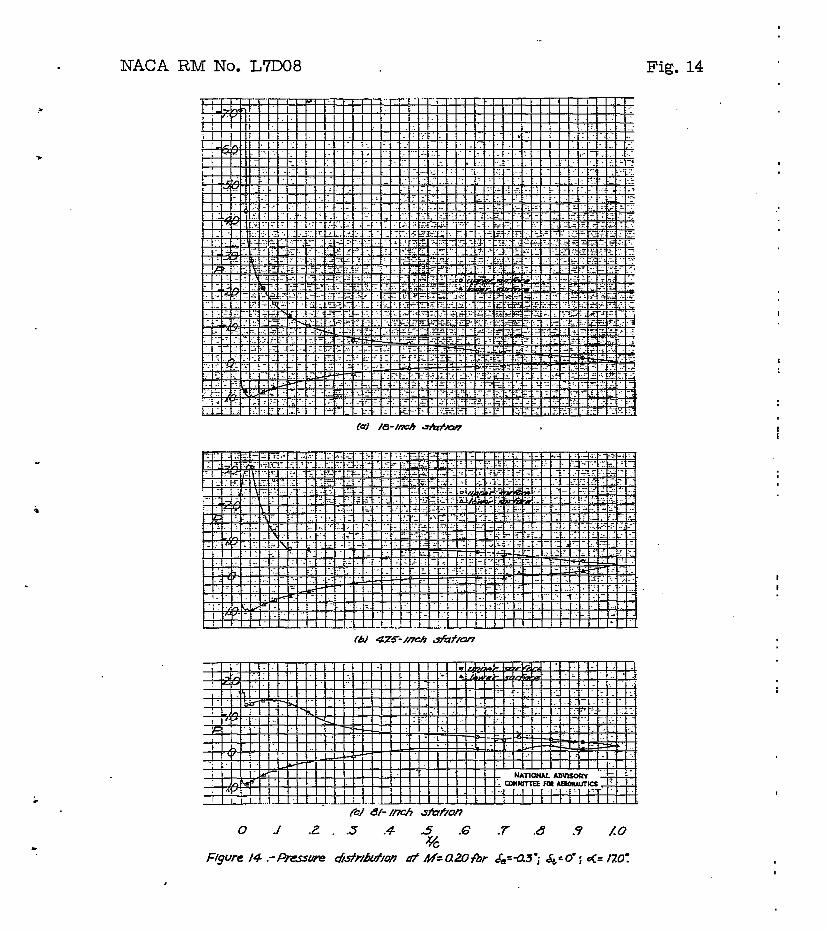
*Since &he data for the rate of c h m g e of pressure coeffioient with angle o f attack o r e.levator angle are applicable onJy f o r a limited range 02 =le8 (a, = &3O, 6, &eo)> the ch0rdwis.e pressure . distributions f o r a few larger angles of attack and e l e m t o r a e f h - t i o n are presented i n figures 12 t o 16 f o r the l&inob, h7.5-1nch, and 81-inch s ta t ions at M 7 0 .20.
Figure 17 gresentea the percent change with Mach number i n hin@;e+noinent coeff ic ient and elevatol.--balesce pressure coefficient far several combinations of angle of, a t tack and elevator -le. An increase i n the absolu$e value of either coeff ic ient between M = 0.20 and any other Mack n a e r has been coneidered positive and a decrea8e3 negative: This figure ehows.that the hinge-moment ooeffioient
. increases more than the balance4mnber pressyre coefficient decrea~les &8 the speed is inoreased,. Thus only a part of the increase in hinge-moment coeff ic ient wTth increasing speed can be a t t r i b u t e d t o a lusa of. balance chamber pres&&. Figures ll and 18 show that i n general the elevator pressures increase with increasing Maoh number par t icular ly beW8en 0.7 and 0;8 chord,. These increases a l s o conkribute to the r i s e i n hfnge-moment, coeff ic ients with Mach number. The combined effects of the pressure ohanges shown i n fighres 17 &d 18 indloa-to changes ih. hirig+mment coefficients which a re i n
. approximate agreement 'with the force-tea t resu l t s e
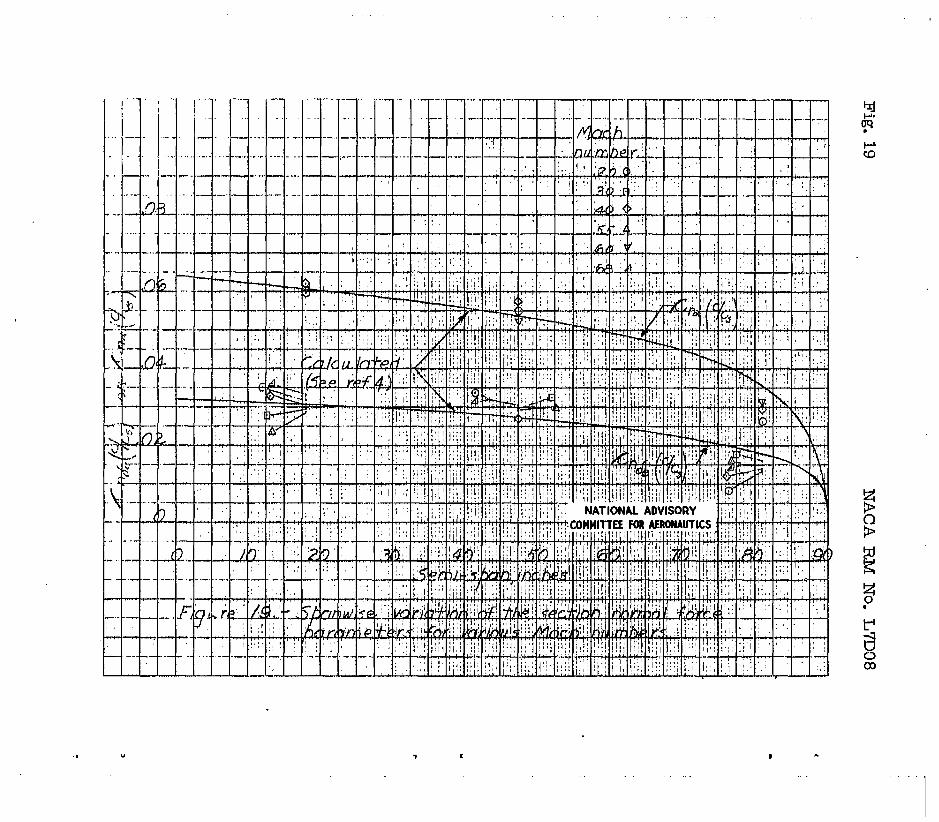
SpElllwfse distribution.- The var ia t ion of sparrwise dis t r ibu t ion : of the section normal-force coeff ic ient as obWned from the t e s t s and as calculated accordfng to'reference 4 is shown in figure 19.
7
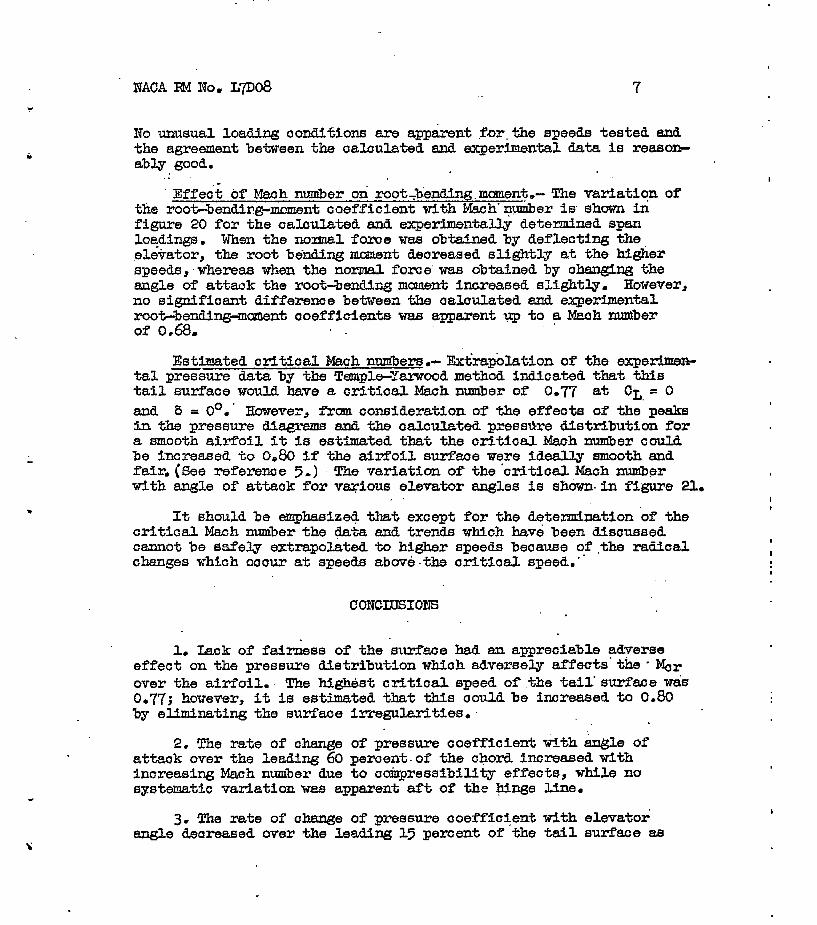
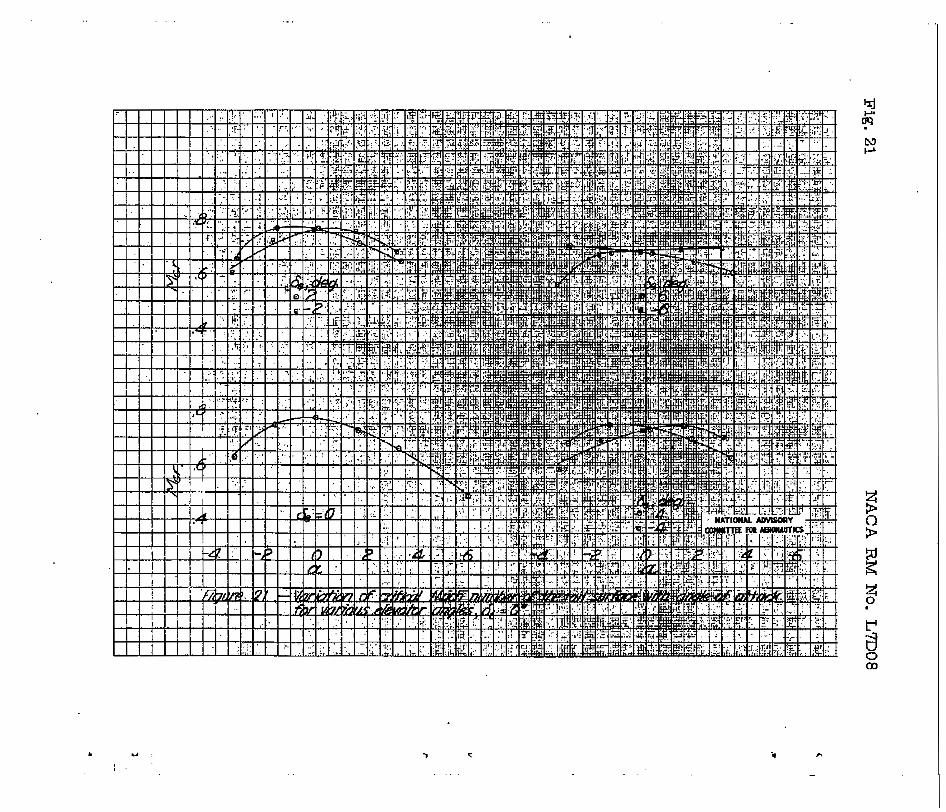
Estimated cr i t fcaJ . %ch numbers.- Extraphation of t h e exprimerr- t a l p s s u r e data by the Tenpld%m?ood method indicated that t h i s ta i l surface would have a c ; r i t l o a l Mach nusnber of 0,n a t CL = 0 and 6 = 0'. I HmeveI", f r o m oonsideration of the effeots of the pealre in the pressure ~a,ge.ms m& the aalcuk&td p,w3ss&re dis t r ibu t ion fo r a m o t h a i d o i l it is estfmELted that the crftioal Mach m e r could be increased t o 0,m i f the a i r f o i l surfme were fdeal lg m o t h and fair. (See reference 5.) . The variation of the ' c r i t i o d . Mach number with -le of a t taak for vwious elevator angles is sbownin figure 21,
. .
It should be eaqhaeized that except f o r the detenntnation .of the c r i t i c a l Mach Ilumber the data. and trends which have been di8UWSed cannot be ssfely extrapolated to higher apeeds beoause of ,the radicd changes vhich ooour at speeite abave-the c r i t i o a l speed."
1. Lmk of fai&ss of the 'surface had a z ~ appreciable adverse ef fec t on the preasure distribution whioh adverse3y a f f e c t s ' the - %r over the airfoil.. The highest c r f t i o a l speed. of ,the tail' eurface wds 0.77; however, it is estimated that t h i s oould be increased t o 0.80 by eliminating the eurface imgukrities,
2. The rate of change of pressure coefficient with -le of attmk over the leading 60 percent .of the chord increased wtth inoreasing Mach number due to oompreesibility effects, w h i l e no s y s t a t i c vazdation w&8 apparent aft of the hinge line.
3* The rate of 0-e of pressure aoefflcient with elevator angle deareaeed over the leadlng 15 percent of the tall flurfme aa
I t

8 NACA RM No.. L p o 8
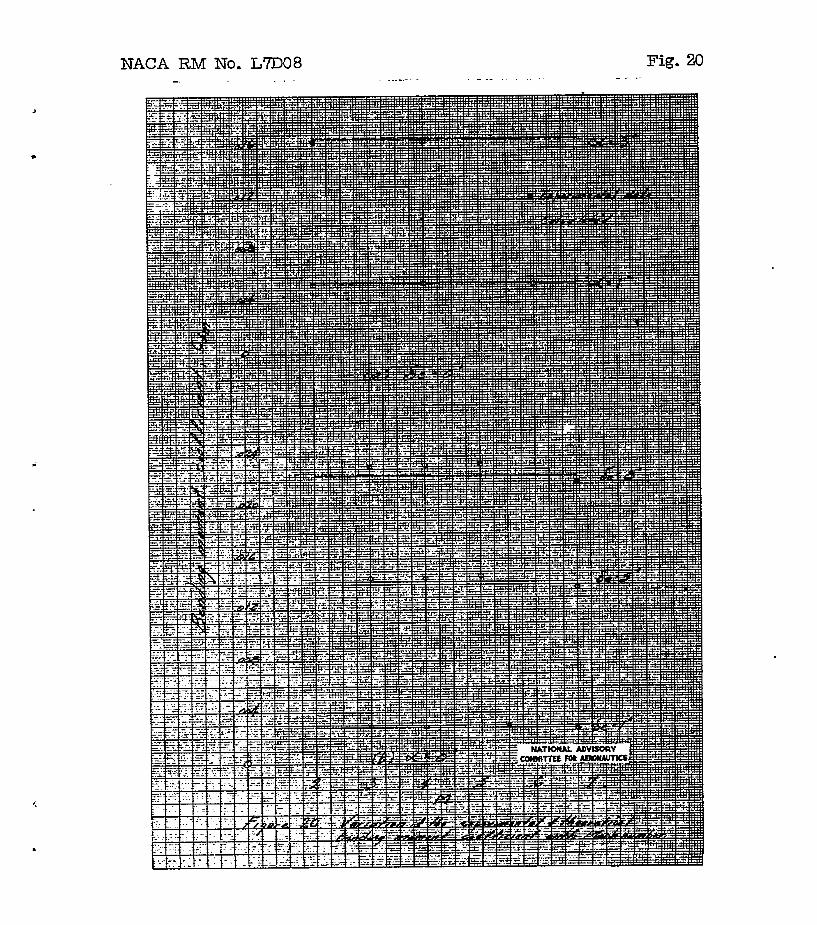
4. The inorease i n hinge-moment coeff ic ient with increasing speed was found to r e su l t from a loas of pressure in the elevator balance ohamber and an increase I n 'the external elev&or pressures et of the h h g e line.
Langley Memorial Aermautiml Laboratory Igational Advisory Catumittee f o r Aeronautice
Lang;ley Field, ?a,
.
. . EWERENCES
1. Sahueller, Carl F., Hieser, Gerald, a i Cooper, Xorto&: Aeroaynam€c Force Charaoteristica at H i g h Speed8 of a 3W.l- Scale Horizontal Tail Surface Teated i n the Langley l&Foot High-Spaed Tunnel. EACA BM No. LP08a , 1947. , .
2. Swanson, Robe& S. ; and Toll, Th0mP.s A.: ' Jet"B0Undary Corrections f o r Reflec t iopFlane Model8 ia Rectangular Wind Tunnele EXCA ARR No. 322, 1943.
. . 3. Thorn, A. : Blookage Corrections in a ClaBed Iligh-Speed Turnel.
R. & M. No. 2033, BrriCish A.R.C., 19?.3.
I
4

..
.
NACA RM No. ~ 1 ~ 0 8 9
45 50
' 55 60 65 70 75 80 85 90 95 100
Percent 9 1
0 ,788 ,964
124
5 4.9603 4,8387
' 4.6341 4.347
I
L
I
I
.'
C . t
f \ "-
/C
" .
.-
a
""""
" .- 4
"" """ -
" -
_"".
4
cc
"
c=
3
‘ R I ‘
w
I
. . .. . . . . . . . .
. . .
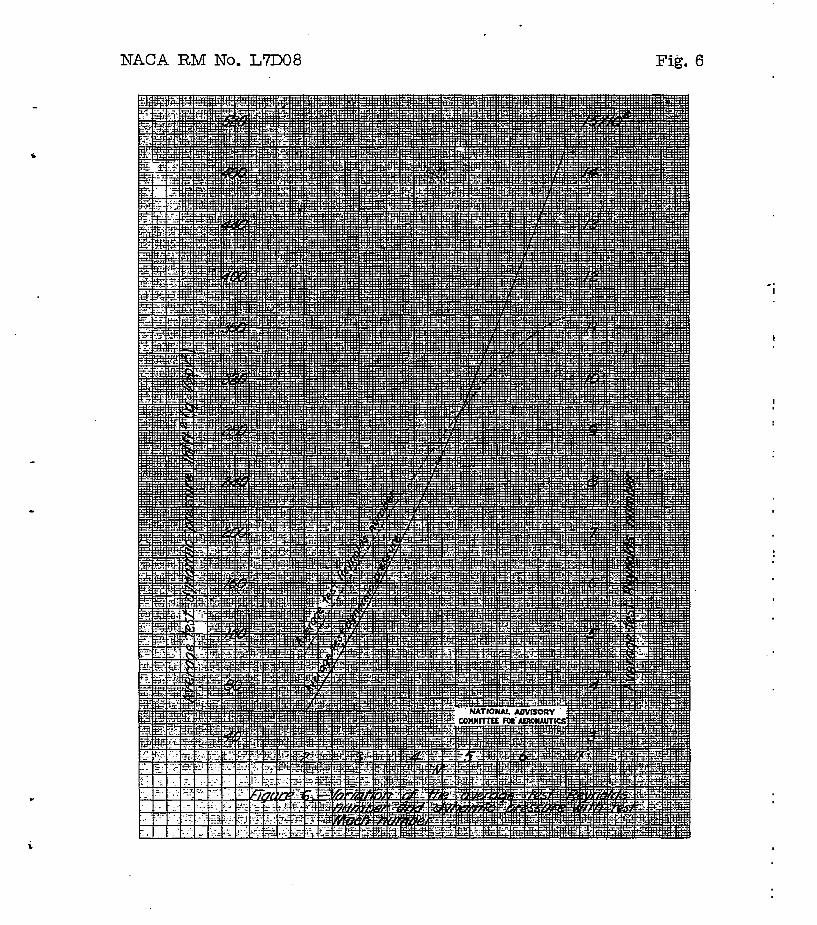
NACA RM No. L7DO8 Fig. 6
I
I

Fig. 7 NACA RM No. L7DO8
I
I

NACA RM NO. L7DO8
..
i
Fig. 8 I
I
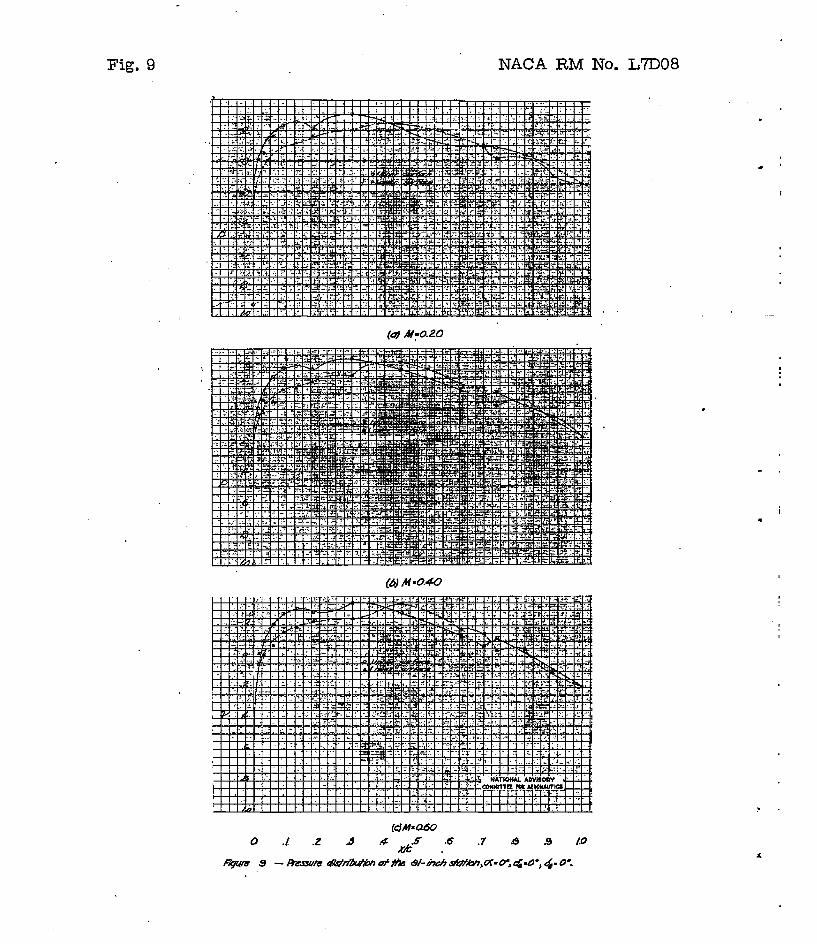
Fig. 9 NACA RM No. L7D08
i .
. .
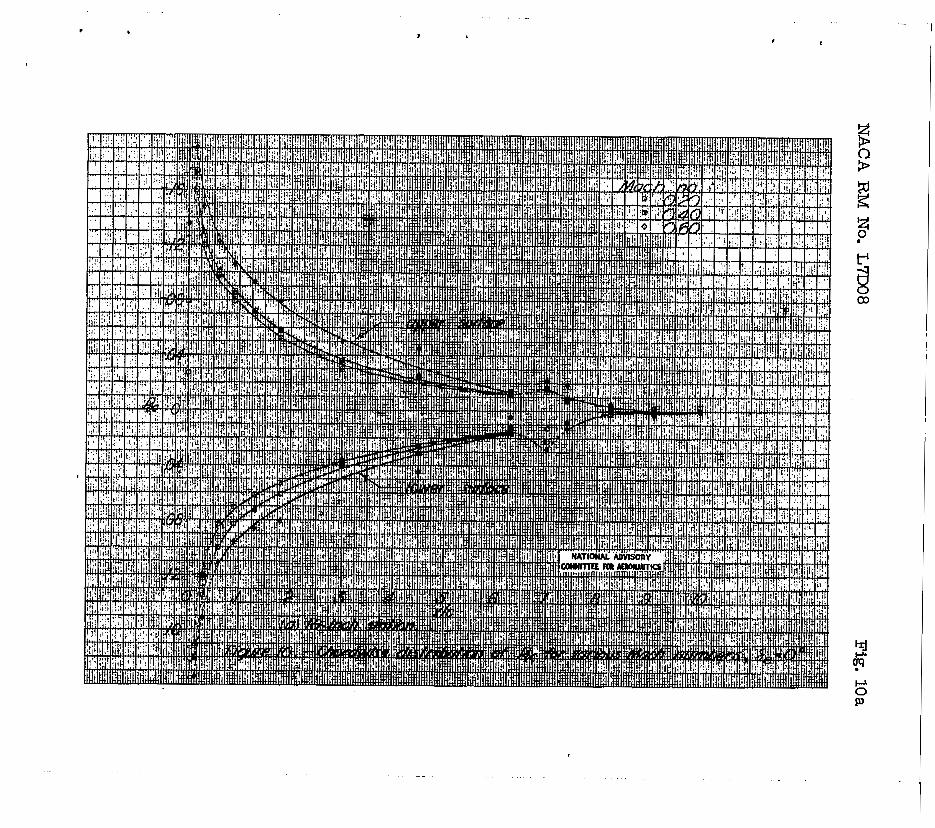
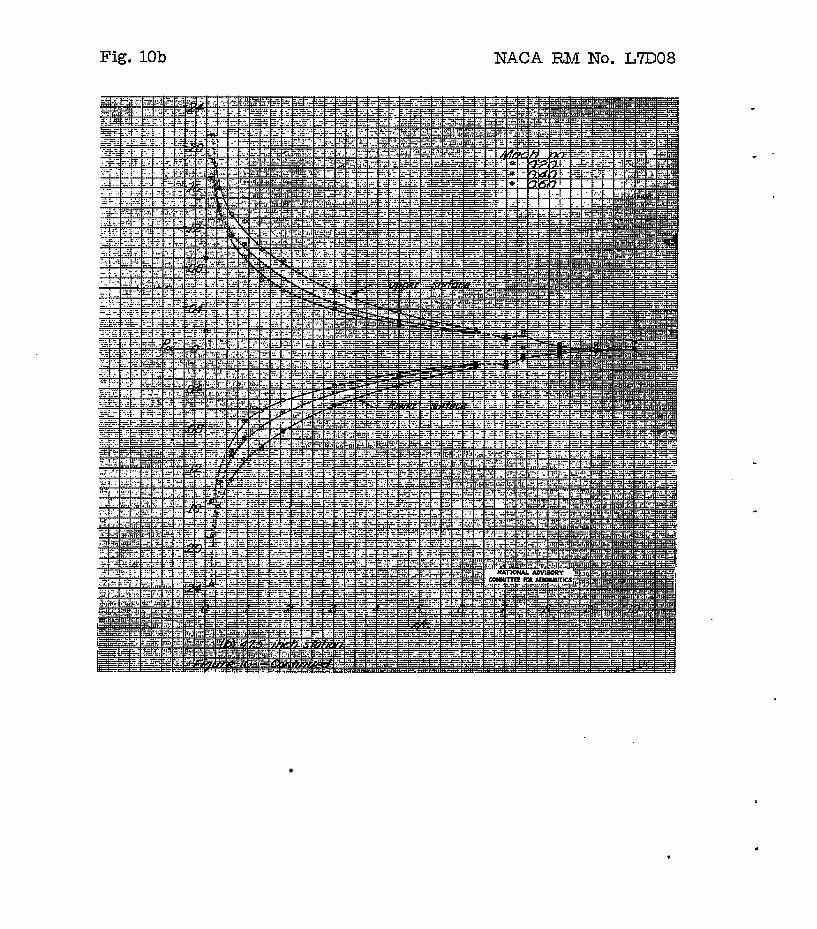
Fig. 10b NACA R,M No. L7D08
NACA RM No. L7D38 Fig. 10c
. .. , . .. . ... ..
. ..
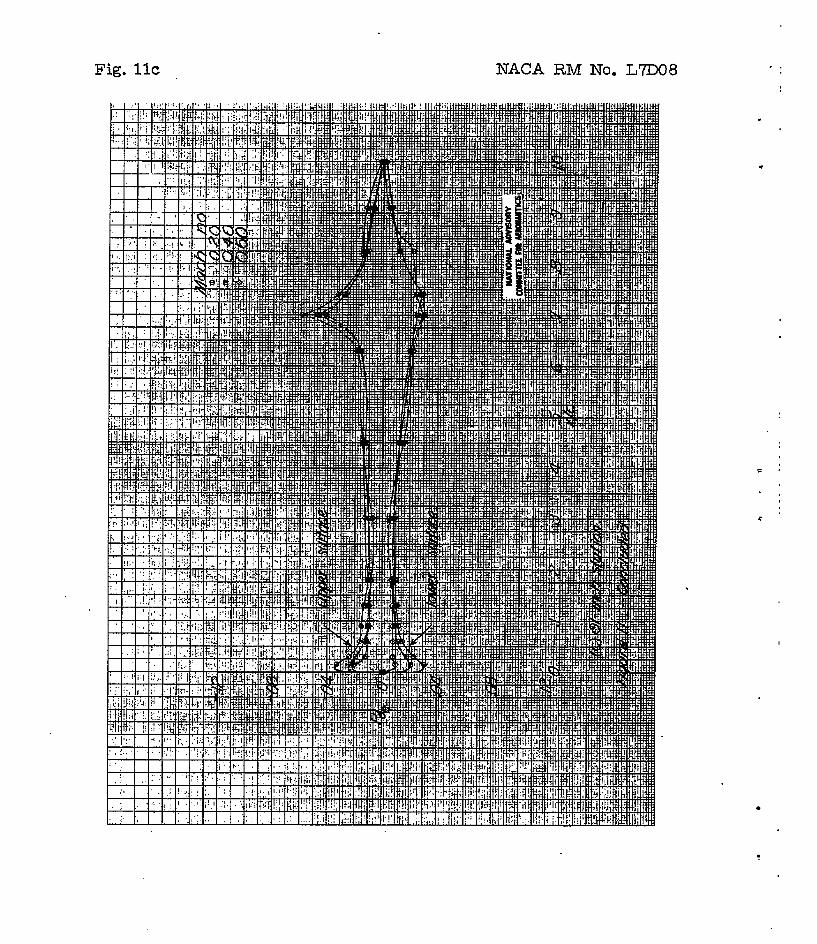
Fig. llc NACA RM No. L7DO8
.
NACA RM No, L7DO8
c
.
Fig. 12
I
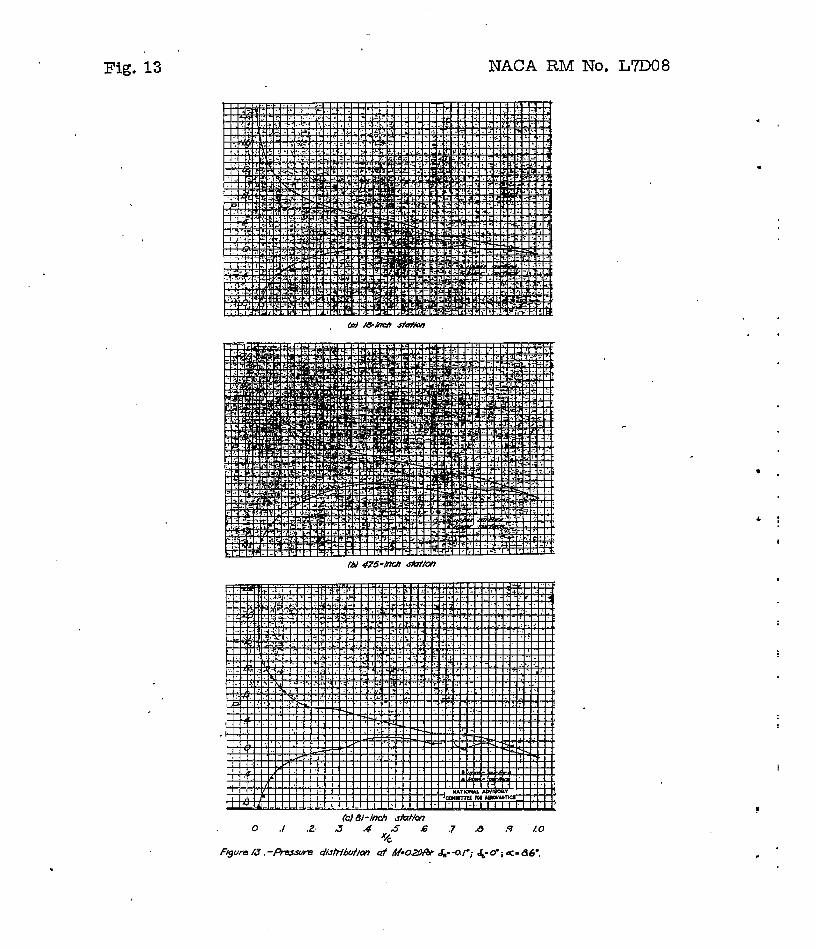
Fig. 13 NACA RM No. L7DO8
t
.
NACA RM No. L7DO8 Fig. 14
I
t
I I
I I
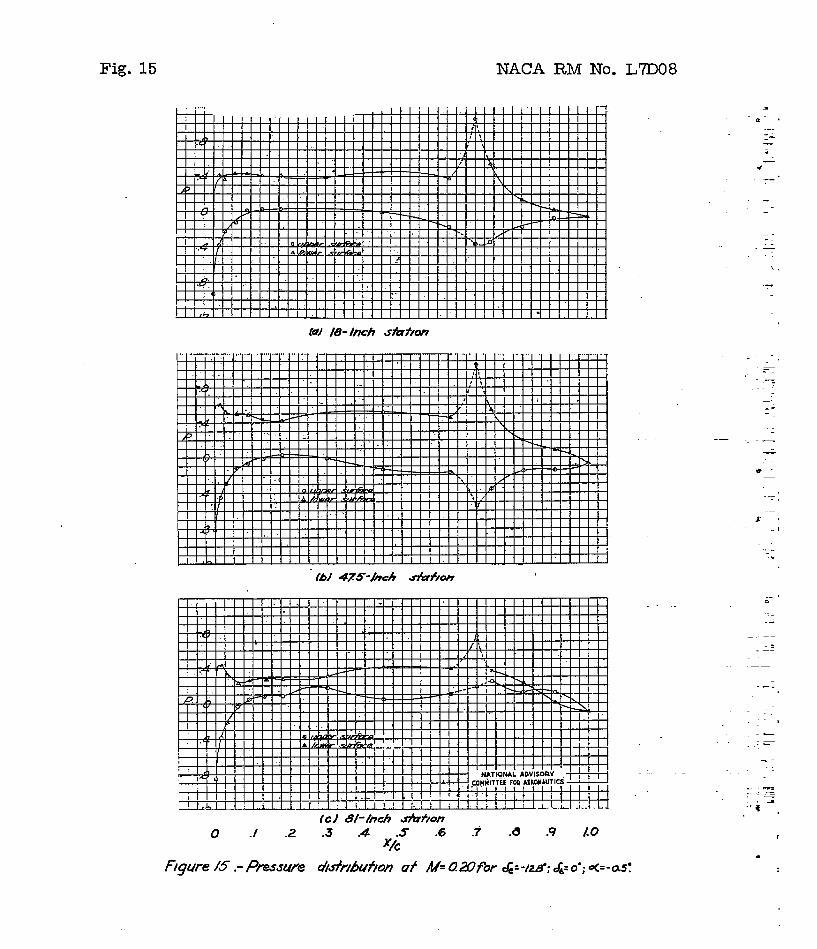
Fig. 15 NACA RM No. L7DO8
tcJ 8/-/nch A f t o n 0 .f .2 .3 .4 .5 .6 .7 .8 .9 LO */,
E '

NACA RM No. L7D08 Fig. 16
.
I
I
I I
I
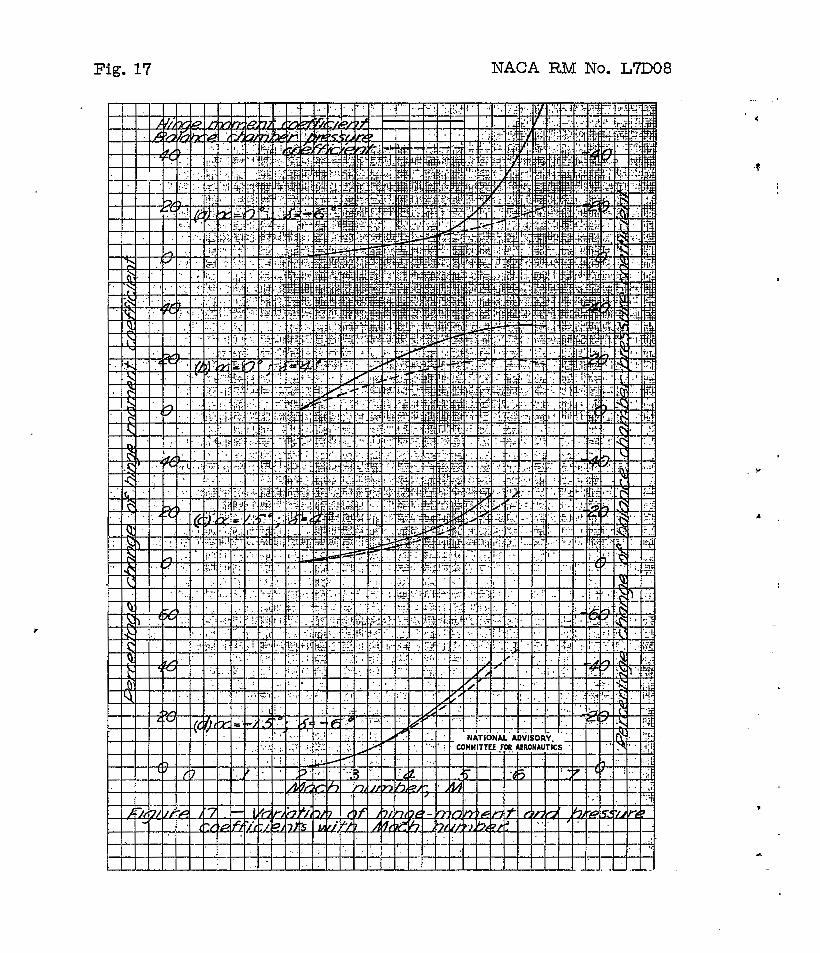
Fig. 17 NACA RM No. L7DO8
. .
NACA RM No. L7DO8 Fig. 18 . " - . -. . " . .. . .. . . . _. " ". " . . . . .
NACA RM No. L7DO8 Fig. 20 -, . . - . - - .. .. . . - .- .-
. . . . ..
> c . n
. . . . -
I .
!
I
8